A distributed feedback-based online process optimization ...

Volume 5 • Issue 4 • 1000197J Chem Eng Process Technol ISSN: 2157-7048 JCEPT, an open access journal
Research Article Open Access
Selatnia et al., J Chem Eng Process Technol 2014, 5:4 DOI: 10.4172/2157-7048.1000197
Research Article Open Access
Modeling and Output Feedback Distributed Control for an Absorption Packed ColumnSelatnia M*, Illoul R and Boucherit MSLaboratoire de commande des processus Ecole Nationale Polytechnique d’Alger, BP 182 Avenue Hassen Badi, El Harrach, Algeria
*Corresponding author: Selatnia M, Laboratoire de commande des processusEcole Nationale Polytechnique d’Alger, BP 182 Avenue Hassen Badi, ElHarrach, Algeria, Tel: 2130795526376; E-mail: [email protected]
Received May 16, 2014; Accepted May 28, 2014; Published June 02, 2014
Citation: Selatnia M, Illoul R, Boucherit MS (2014) Modeling and Output Feedback Distributed Control for an Absorption Packed Column. J Chem Eng Process Technol 5: 197. doi: 10.4172/2157-7048.1000197
Copyright: © 2014 Selatnia M, et al. This is an open-access article distributed under the terms of the Creative Commons Attribution License, which permits unrestricted use, distribution, and reproduction in any medium, provided the original author and source are credited.
AbstractThis work consists of modeling, simulating and finally multiple models control of an industrial absorption packed
column designated to remove CO2, from natural gas. The multiple models approach is an elegant way of turning nonlinear problems into linear ones. We used in this paper the output feedback distributed control (ODC) coupled with local linearization of the model of the absorption packed column. We compared the results with those obtained with the traditional PID control and the results are satisfactory.
Keywords: Multiple models; PDC control; Methyldiethanolamine(MDEA) Absorption packed column; LMI; Lyapunov function.
IntroductionThe absorption packed column is a physicochemical separation
unit largely used in the chemistry industry. It consists of a tube where we send gas mixtures in order to separate one or more compounds from the principal mixture. It is largely used for the separation of acid gases (CO2, H2S) from natural gas.
The model presented in this paper is a dynamic model of the ab-sorption packed column and consists of a set of nonlinear partial dif-ferential equations; it is elaborated starting from considerations on CO2 and MDEA mass balance in gas and liquid phases and considers also the energy balance [1,2]. We finally obtain a nonlinear distributed pa-rameters system.
Few studies were carried out on modelling and controlling the ab-sorption column. Crosby and Durbin [3] studied the performance of a state controller. Roffel [4] developed a sub-optimal output controller with state inequality constraint. Darwish and Fantin [5] used a decen-tralized command with pole placement. Petrovsky [6] developed a mul-tivariable PI regulator. Najim [7] developed a self-adjusting regulator in the case of CO2 absorption by a diethanolamine solution and also
multilevel learning control [8]. It took again the problem later on with predictive control [9].
Few studies have also been published concerning the modelling and simulation of CO2 absorption by aqueous solutions of MEA or MDEA on pilot and industrial columns [10-12].
For the model developed in our study, it seemed interesting for us to use the multiple models approach for the command of the absorp-tion packed column because it enables us to obtain good performances for complex dynamics processes. We develop in first stage the PID reg-ulation to compare the performances of the classical techniques with the performances of the Takagi-Sugeno multiple model approach.
Modeling and Open Loop Simulation of the Industrial Absorption Packed Column
The absorption packed column presented here is located at Khrech-ba and is part of the In Salah Gaz project, it removes CO2 from natural gas by using an aqueous solution of methyldiethanolamine (MDEA) as a washing liquid, It is a packed type column measuring 8 meter height and 4 meter in diameter with Pall rings to improve the surface of con-tact between phases. For a better elimination of CO2 from the natural gas, the liquid flow (water+MDEA) is counter-current with gas flow. The working pressure and temperature is respectively 71.5 bar at 55°C [2].
At contact between liquid and gas phase occurs on the surface of the Pall rings, CO2 passes from the gas phase to the liquid phase; this diffusion is accelerated by chemical reaction of CO2 with the MDEA in the liquid phase. The liquid flow (water+MDEA) and the CO2 concen-tration in the gas mixture are respectively selected as control variable and output variable (Figure 1).
Figure 1: The absorption packed column of In Salah Gas (ISG).
Journal of Chemical Engineering & Process TechnologyJournal
of C
hem
ical E
ngineering & Process Technology
ISSN: 2157-7048

Page 2 of 8
Citation: Selatnia M, Illoul R, Boucherit MS (2014) Modeling and Output Feedback Distributed Control for an Absorption Packed Column. J Chem Eng Process Technol 5: 197. doi: 10.4172/2157-7048.1000197
Volume 5 • Issue 4 • 1000197J Chem Eng Process Technol ISSN: 2157-7048 JCEPT, an open access journal
Model equations
In order to simplify the model, the following assumptions are done [2,13]:
• There is no resistance in gas phase
• The reaction between CO2 and MDEA is fast (Ha>5)
• Axial dispersion is negligible in the gas phase and the liquid phase
• The MDEA does not pass in gas phase
The mass balance on an elementary section dz of the column for CO2 in the gas phase is written [2,13,14]:
Quantity of aqueous solution at input Z=quantity of aqueous so-lution at the output (z+dz)+quantity of aqueous solution transferred from the liquid phase to the gas phase+accumulation.
This gives:
(GCAg)z=(GCAg)z+dz +φS dz+S AgdCdz
dt (1)
Where G (m3/s) is the volumic gas flow, ϕ the CO2 flow transferred from the gas phase to the liquid phase, S the section of the column and CAg (mol/m3) the CO2 concentration in the gas phase. Given UG=G/S (m/s) the gas flow velocity, we obtain then:
Ag Agg
dC dCU
dz dt+ϕ = − (2)
The chemical reaction between CO2 and the MDEA is [10-12]:
CO2 +R1R2NCH3+H2O → R1R2NCH4++HCO3
- (3)
The reaction rate rA has the following form [14,15]:
rA=kCAL CBL (4)
Where k is the constant for reaction rate [14,15]:
k=2,96105 exp(- 5332 8.T
) (5)
CAL is the CO2 concentration in the liquid phase and CBL the MEA concentration in the liquid phase. The mass balance for CO2 in the liq-uid phase gives finally:
φ=[kCAL CBL] (6)
Which means that the totality of CO2 transferred to the liquid phase reacts with the MDEA.
The mass balance for the MDEA in the liquid phase gives:
(LCBl)z=(LCBl)z+dz−[k CAl CBl] S dz−S BldC dzdt
(7)
Where L is the volume liquid flow. By taking account of (5) and not-ing by UL=L/S (m/s) the mean liquid flow velocity, we obtain:
Bl Bll
dC dCUdz dt
−ϕ = − (8)
Our absorption packed column is finally described by the following set of partial derivative equations:
Ag Agg
BL BLL
dC dCU
dz dtdC dCU
dz dt
+ ϕ = −
−ϕ = −
(9)
The procedure to compute flow ϕ is given in [2] according to [14-16].
We have finally to consider the boundary conditions which for gas phase are the CO2 concentration at the column bottom or input con-centration CAGe and for liquid phase the MEA concentration at the col-umn top or input concentration CBLe.
0Ag z Age
BL z h BLe
C C
C C=
=
=
=
(10)
Chemical reactions within the industrial column induces a strong heat emission and the appearance of a temperature gradient throughout the column; the temperature variation is approximately 5°C between the input and the output of the column, which leads us to establish an energy balance in order to describe the temperature changes which af-fects the various concentrations along the column [16]:
1
l gg lg gg
g gi i
i
l lL r A l gg ll l
i ii
a.h (T T )T TU
z tcp C
T TU H r a.h (T T )z cp C t
− ∂ ∂+ =
∂ ∂
∂ ∂ − + ∆ − − = ∂ ∂
∑
∑
(11)
With:
Cig: concentration in gas phase at the interface (mol/m3)
Cil: concentration in liquid phase at the interface (mol/m3)
cpig: Specific heat in the gas phase at the interface (J/mol.K)
hg/l: coefficient of heat transfer (convection) (J/m2.K.s)
Tl: Liquid temperature (K)
Tg: Gas temperature (K)
∆Hr: enthalpy of the reaction (J/mol)
cpil: specific heat in the liquid phase at the interface (J/mol.K)
We finally takes into account the boundary conditions for the tem-perature which are the temperatures for gas and the liquid at the col-umn input.
0 0 0
0
lg z ge z
gl z h le z h
TT T ,z
TT T ,
z
= =
= =
∂= = ∂
∂ = = ∂
(12)
Model validation
A test was carried out on our industrial absorption column to com-pare the output CO2 concentration given by the model with the real one and this for a step input variation of 10 t/h. the data were collected on a horizon of 6800 seconds. The results are grouped in Figure 2 where we represent respectively, the flows of MDEA and gas at the output and then the concentrations of CO2 at the column output either experimen-tal or given by the model [2]. We note that the model dynamics of the CO2 concentration at the column output agree with the experimental results.
Open loop Simulation of the industrial column
By considering the equations (2) and (8), the dynamic model of the absorption column is that of a nonlinear, distributed parameters system. The results from open loop simulations are presented in Figures 3 and 4.
Simulations show that the system is stable. It presents a dead time

Page 3 of 8
Citation: Selatnia M, Illoul R, Boucherit MS (2014) Modeling and Output Feedback Distributed Control for an Absorption Packed Column. J Chem Eng Process Technol 5: 197. doi: 10.4172/2157-7048.1000197
Volume 5 • Issue 4 • 1000197J Chem Eng Process Technol ISSN: 2157-7048 JCEPT, an open access journal
PID Regulation of the Industrial Absorption Packed Column
We apply a PID regulation to the dynamic model of our absorption packed column. We chose a sampled control with a sampling period of 10 seconds. The reference for the input CO2 concentration is s 0.25 mole%, which corresponds to a concentration of 7.05 mole CO2/m
3. The parameters of the PID regulator were optimized using trial and er-ror.
The simulation results are satisfactory; the PID regulator cancels the permanent error and ensures a quick response due to the derivative action. The regulation shows a net asymmetrical behaviour between responses to positive and negative step input disturbances due to the strong non linearity of the relationship between the input and the out-put.
Multiple Models Control of the Industrial Absorption Packed Column
Introduction
The multiple models are a nonlinear modeling technique which al-lows achieving a good compromise between precision and model com-plexity. In the light of the numerous work related to it in recent years [17-20], it arises a great interest, especially in applications dealing with simulation and control. It can also be seen as a particular fuzzy model-ing technique [21,22], corresponding to a Takagi Sugeno (TS) approach [23]. A TS model is a composed of a finite number of linear models
in response to a step input disturbance on the CO2 concentration due to the gas propagation along the absorption column.
0 1000 2000 3000 4000 5000 6000 70001000
1020
1040
temps[sec]
debit
MDE
A [to
n/h]
0 1000 2000 3000 4000 5000 6000 7000410
415
420
temps[sec]
debit
Gaz
[ton
/h]
0 1000 2000 3000 4000 5000 6000 70000.15
0.2
temps[sec]
Cgs
[mol%
]
0 1000 2000 3000 4000 5000 6000 70000.16
0.18
0.2
0.22
Cgs
[mol%
]
sortie systeme bruitéesortie modele
0 1000 2000 3000 4000 5000 6000 7000-0.01
-0.005
0
0.005
0.01erreur de prediction
temps [sec]
erre
ur [m
ol%]
Figure 2: Output CO2 Concentrations from the system and the model.
0 100 200 300 400 500 600 700 800 9000.234
0.236
0.238
0.24
0.242
0.244
0.246
0.248
0.25
0.252
temps (secondes)
Conc
entra
tion
du C
O2 e
n so
rtie
(mole
%)
0 100 200 300 400 500 600 700 800 9000.25
0.252
0.254
0.256
0.258
0.26
0.262
0.264
0.266
0.268
0.27
temps (secondes)
Conc
entra
tion
du C
O2
en s
ortie
(mole
%)
Figure 3: Output CO2 Concentration for an input step disturbance of ± 5% on gas concentration.
0 100 200 300 400 500 600 700 800 9000.2
0.21
0.22
0.23
0.24
0.25
0.26
temps (secondes)
Conc
entra
tion
du C
O2
en s
ortie
(mole
%)
0 100 200 300 400 500 600 700 800 9000.25
0.26
0.27
0.28
0.29
0.3
0.31
temps (secondes)
Conc
entra
tion
du C
O2
en s
ortie
(mole
%)
Figure 4: Output CO2 Concentration for an input step disturbance of ± 10% on gas flow.
Page 4 of 8
Citation: Selatnia M, Illoul R, Boucherit MS (2014) Modeling and Output Feedback Distributed Control for an Absorption Packed Column. J Chem Eng Process Technol 5: 197. doi: 10.4172/2157-7048.1000197
Volume 5 • Issue 4 • 1000197J Chem Eng Process Technol ISSN: 2157-7048 JCEPT, an open access journal
connected with nonlinear functions called membership functions and verifying the convex mapping property (i.e. they are non-negative and their sum is equal to 1). It allows us to solve various problems of control, observation and diagnosis for nonlinear systems with linear techniques.
The approach associated with multiple models in control is known as the Parallel Distributed Compensation (PDC) [24]. This method is based on a set of linear controllers designed for each linear model, and stability of the overall closed loop is guaranteed via a Lyapunov func-tion common to all the linear models.
In this paper, we identify the absorption packed column as a multi-ple model of the TS type and proposes a control based on State feedback Distributed Control (PDC) (Figures 5 and 6).
Problem formulation
The Multiple model approach: The multiple models have three basic structures: Coupled states (TS), uncoupled states [25] and hierar-chical structure. The coupled states Structure (TS) is the most popular in the analysis and synthesis of the multiple models. it is written in the following form:
1
1
Mi i ii
Mi ii
x(t) ( z(t))(A x(t) B u(t))
y(t) ( z(t))C x(t)=
=
= µ +
= µ
∑∑
(13)
x(t) ∈ Rn being the state vector, u(t) ∈ Rm the input vector, y(t) ∈ Rp the output vector z(t)∈ R is the decision variable or premises and the matrices Ai ∈ Rn×n, Bi ∈ Rn×m et Ci ∈ Rp×n, ∀ i=1,2…….., M are constant and supposed to be known.
The activation function or membership function µi (z (t)) deter-mines the degree of activation of the ith local model. It allows a pro-gressive passage from this model to the other close local models. These functions can depend of the measurable variables of the system (the input and output signals) or of the non-measurable variables of the sys-tem (the states). They can be of triangular or Gaussian form and satisfy the properties of convex mapping:
11
0 1 1
Mii
i
( z(t)) , t
( z(t)) , i ,......,M , t=
µ = ∀
≤ µ ≤ ∀ = ∀
∑ (14)
The multiple models can be viewed as universal approximations since any nonlinear system can be approximated by a multiple models representation with sufficient accuracy and this simply by increasing the number of sub-models. In practice, a reduced number of sub-mod-els can be sufficient to obtain a satisfactory approximation, and we can use the tools of linear systems analysis to achieve this goal.
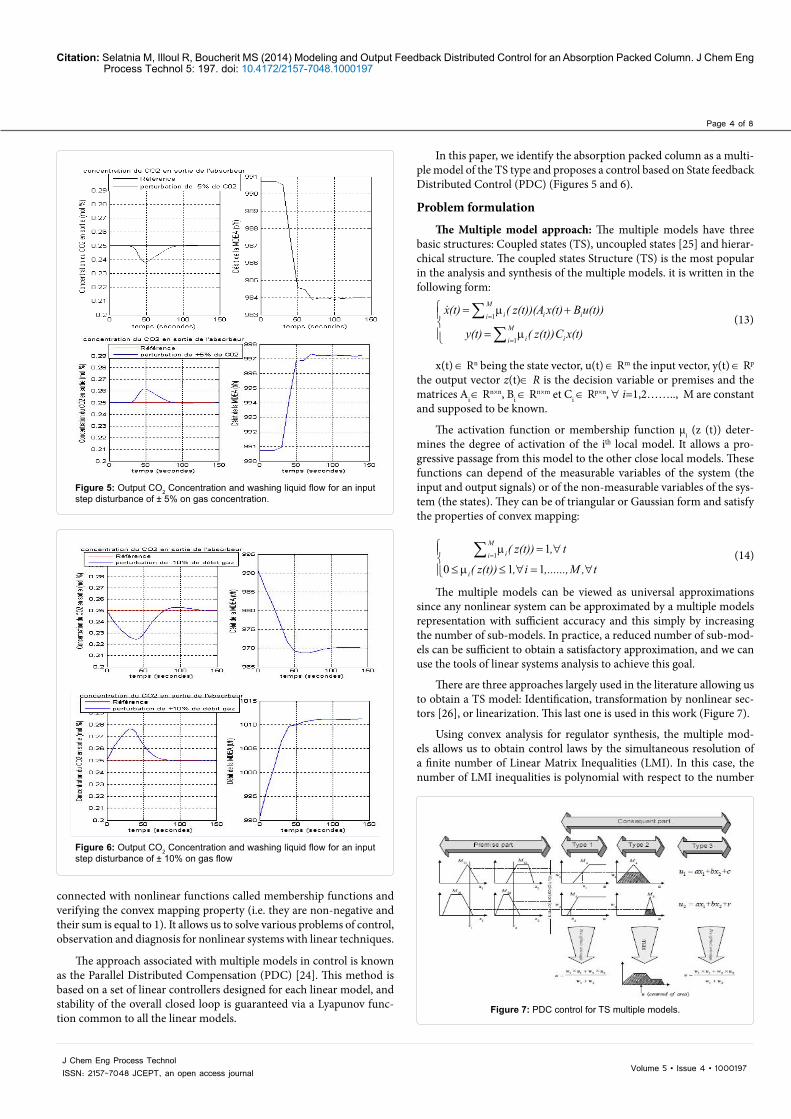
There are three approaches largely used in the literature allowing us to obtain a TS model: Identification, transformation by nonlinear sec-tors [26], or linearization. This last one is used in this work (Figure 7).
Using convex analysis for regulator synthesis, the multiple mod-els allows us to obtain control laws by the simultaneous resolution of a finite number of Linear Matrix Inequalities (LMI). In this case, the number of LMI inequalities is polynomial with respect to the number
Figure 5: Output CO2 Concentration and washing liquid flow for an input step disturbance of ± 5% on gas concentration.
Figure 6: Output CO2 Concentration and washing liquid flow for an input step disturbance of ± 10% on gas flow
Figure 7: PDC control for TS multiple models.

Page 5 of 8
Citation: Selatnia M, Illoul R, Boucherit MS (2014) Modeling and Output Feedback Distributed Control for an Absorption Packed Column. J Chem Eng Process Technol 5: 197. doi: 10.4172/2157-7048.1000197
Volume 5 • Issue 4 • 1000197J Chem Eng Process Technol ISSN: 2157-7048 JCEPT, an open access journal
of local models. Thus, it is advisable to minimize the number of local models to limit the conservatism of the method.
In the case of TS multiple models, this technique of regulator syn-thesis corresponds to the PDC method, It supposes that all the linear sub-models are at least stabilizable. Subsequently, they will also be sup-posed commendable.
Given the TS model given by equation (13), a control law resulting from PDC synthesis will thus be the combination of linear control laws for each sub-model, given by:
1
Mi ii
u(t) ( z(t))F x(t)=
= − µ∑ (15)
Applying this control law to the TS multiple model, we obtain in closed loop:
z z z
z
x(t) (A B F ) x(t)y(t) C x(t)= −
=
(16)
Or, in a more explicit way:
{ 1 1
M Mi j i i ji j
x(t) ( z(t)) (z(t))(A B F ) x(t)= =
= µ µ −∑ ∑ (17)
The stability conditions for the closed loop system amounts to find a control gain Fj such that the derivative of the candidate Lyapunov function associated with the system is negative. Stabilizing the system thus amounts to solve the following problem:
Find a positive definite matrix P and Fi matrices, i=1. , M such that:
(Az - BzFz)TP+P(Az - BzFz) < 0 (18)
We notice that this inequality is nonlinear with respect to P and Fi. By using the congruence of the symmetrical full row matrix:
X=P-1 (19)
We get:
XATz+AzX–XFz
TBTz–BzFzX < 0 (20)
By using the bijective variable change
Mi=FiX, i=1,…..,M, (21)
The problem becomes LMI in variables X and Mi.
γij=XATi–MT
jBT
i+AiX–BiMj < 0 (22)
We finally get:
1 1
M Mi j iji j( z(t)) (z(t))
= =µ µ γ∑ ∑ (23)
And we can express the following result:
Theorem 4.1 [24] Given a continuous TS model, the PDC control law (14) and the γij, if it exists a positive definite matrix X and Mi ma-trices, such that (21) is satisfied for all i,j=1,…, M, then the closed loop is overall asymptotically stable. Moreover, if the problem has a solution, the gains of the PDC control are given by:
Fi=MiX-1
(24)
And the PDC control is:
1
Mi ii
u(t) ( z(t))F x(t)=
= − µ∑ (25)
If Fi=F, ∀i=1 ,….,M, then we define a linear control law. In prac-tice, to determine the matrix P and the control gain Fi, we have to solve (21) for all i,j=1,…, M. In the particular case where the multiple models verify the positive co linearity of the input matrices, that is:
Bi=B, ∀i ∈ In (26)
The closed loop multiple models system of (16) is rewritten without the crossing terms BiFj:
1
Mi i i ii
x(t) ( z(t))(A B F ) x(t)=
= µ −∑ (27)
The stability conditions of theorem 4.1 reduce then to the stability of the dominant models: P > 0,
(Ai - BiKi)P+P(Ai - BiKi) < 0, ∀i=1,….,M (28)
Substituting Bi by B, the control law leads to similar conditions.
Multiple models identification
The structural identification of a multiple models representation consists in the determination of the local models structures and the operation zones (or validity zones) for each local model [25]. The local models can be of various structures but in general we use simple struc-tures, such as linear models.
The identification leads to a family of functions parameterized by the parameters vector iθ defining the structure of the ith local model, and the parameters vector
iβ characterizing the zone of validity of this
local model. The parametric estimate consists in determining for each local model i the parameters vector:
TT Ti i i
θ β Θ =
The parametric estimation (also called training) is done on the basis of minimization of a functional binding the inputs and outputs system to the characteristics parameters of the model.
22
1 1 1
1 12 2
N N MG s s i i i ik k i
ˆJ (y (t) y(t)) y (t) ( (t), ) f ( (t), )= = =
= − = − ω ζ β ϕ θ ∑ ∑ ∑ (29)
In order to simplify the model, we chose linear sub-models of ARX type (auto regressive with exogenous inputs) with 3 inputs (system MISO):
• Liquid Flow Ul [ton/h]
• Gaz flow Ug [ton/h]
• Input CO2 concentration Cge [mol%]
The chosen local models are second order ones, they are written in the following form:
Cgsi (t+1)=Ai1 Cgs(t)+Ai2 Cgs (t-1)+Bi Ul (t)+Ci Ug (t)+Di Cge (t)+Pi+ei (t+1) (30)
With:
i=1,…. ,M : local model indices
Cgsi(t+1) :output (concentration of CO2) of local model i
ei (t+1) : Gaussian white noise
Ai1 , Ai2 , Bi, Ci, Di, Pi : parameters of local model i
We chose Gaussian membership functions with the decision vari-able ( ) ( )gst C tξ =
being the system output at time t.
The expression of the membership function is:
[ ]( )
2
2
2
21
2
2
gs i
i gs iM gs ii
(C (t) c )exp
C (t), c ,(C (t) c )
exp=
−− σ ω σ = −− σ
∑ (31)
Where ci is the mean. And σ the standard deviation for the Gaussian membership function
The global identification diagram is shown in Figure 8.
Training data (Figure 9)

Page 6 of 8
Citation: Selatnia M, Illoul R, Boucherit MS (2014) Modeling and Output Feedback Distributed Control for an Absorption Packed Column. J Chem Eng Process Technol 5: 197. doi: 10.4172/2157-7048.1000197
Volume 5 • Issue 4 • 1000197J Chem Eng Process Technol ISSN: 2157-7048 JCEPT, an open access journal
Validating data (Figure 10)
Implementation of the method and simulation results
The decision variable z(t) is in our case the state vector x(t) output gas concentration of the industrial column Cgs,
x(t)=[Cgs(t) Cgs(t-1)]T. A multiple models with four sub-models can easily be obtained in the form:
4
1 iix(t) (x(t))
== µ∑ (Ai - BiFi) x(t) (31)
With the memberships functions µi(x(t)) either triangular or Gauss-ian. The parameter of the four models is:
( ) ( ) ( ) ( )
1 2 3 4
1 2 3 4
1 2 3 4
0 4436 0 4772 1 8937 0 53390 5744 0 2732 0 3093 0 2304
0 0006 0 0006 0 0006 0 0006
10
. . . .A A A A
. . . .B . B . B . B .
C C C C
− − − = = = = − − = − = − = − = −
= = = =
(32)
And the State Feedback Distributed Control (PDC) is:
UL(t)=-4
1 ii=µ∑ (Cgs(t)) Fi x(t)+ULin (33)
UL is the liquid flow velocity, and ULin the mean flow velocity cor-responding to the chosen operating point of the column.
The Fi feedback gains are determined by resolution of LMI in order to ensure good regulation performances, less than a 0.25% variation of CO2 around the operating points.
The selected gain is finally Fi=[980 985 995 1002]t/h
Closed loop simulation:
Case (a): triangular membership functions
The column simulation shows us the output CO2 concentration for step input disturbances on either the gas flow or the CO2 concentration. The evolutions of the output CO2 concentration and the corresponding control are on Figures 11-13
Case (b): Gaussian membership functions
The evolutions of the output CO2 concentration and the corre-sponding control are on Figures 14-16
DiscussionsThe oscillations of the output CO2 concentration for the industrial
column are mainly due to fuzzy control, but the operating point of is quickly reached in less than 50 seconds . We note on all the curves (5, 6 and 11-16) that disturbance is always rejected with both PID and PDC regulation. But comparison of the peak values as well as the oscillations show us that PDC control acts more quickly than PID control.
ConclusionIn this paper, a TS multiple models obtained by linearization was
Figure 8: Structure of the multiple models identification.
0 500 1000 1500 2000 2500 30000.1
0.2
0.3
0.4
0.5
Cgs
[mol
%]
sortie systeme bruitéesortie modele
0 500 1000 1500 2000 2500 3000-0.1
-0.05
0
0.05
0.1erreur de prediction
temps [sec]
erre
ur [m
ol%]
Figure 9: Training with the ARX structure.
0 100 200 300 400 500 600 700 800 900 10000
0.1
0.2
0.3
0.4
Cgs
[mol%
]
sortie systemesortie modele
0 100 200 300 400 500 600 700 800 900 1000-0.05
0
0.05
0.1
0.15
erre
ur de
pre
dictio
n [m
ol%]
temps [sec]
Figure 10: Validating with the ARX structure.

Page 7 of 8
Citation: Selatnia M, Illoul R, Boucherit MS (2014) Modeling and Output Feedback Distributed Control for an Absorption Packed Column. J Chem Eng Process Technol 5: 197. doi: 10.4172/2157-7048.1000197
Volume 5 • Issue 4 • 1000197J Chem Eng Process Technol ISSN: 2157-7048 JCEPT, an open access journal
0 50 100 150 200 250 300 350 400 450 5000.2
0.22
0.24
0.26
0.28
time (secondes)
Out
put c
once
ntra
tion
of C
O2
mol
%)
ReferenceCont floutriangTS
0 50 100 150 200 250 300 350 400 450 500990
991
992
993
994
995
time (secondes)
Flow
of M
DE
A (t
/h)
0 50 100 150 200 250 300 350 400 450 5000.2
0.22
0.24
0.26
0.28
time (secondes)
Out
put
conc
entr
atio
n of
CO
2 m
ol %
)
ReferenceCont floutriangTS
0 50 100 150 200 250 300 350 400 450 500975
980
985
990
995
time (secondes)
Flo
w o
f M
DE
A (
t/h)
Figure 11: Output CO2 Concentration and washing liquid flow for a step input disturbance of ± 5% on gas concentration.
0 50 100 150 200 250 300 350 400 450 5000.2
0.22
0.24
0.26
0.28
time (secondes)
Out
put c
once
ntra
tion
of C
O2
mol
%)
ReferenceCont floutriangTS
0 50 100 150 200 250 300 350 400 450 500990
995
1000
1005
1010
time (secondes)
Flow
of M
DEA
(t/h)
0 50 100 150 200 250 300 350 400 450 5000.2
0.22
0.24
0.26
0.28
time (secondes)
Out
put c
once
ntra
tion
of C
O2
mol
%)
ReferenceCont floutriangTS
0 50 100 150 200 250 300 350 400 450 500960
970
980
990
1000
time (secondes)
Flow
of M
DEA
(t/h)
Figure 12: Output CO2 Concentration and washing liquid flow for a step input disturbance of ± 10% on gas flow.
0 50 100 150 200 250 300 350 400 450 5000.2
0.22
0.24
0.26
0.28
time (secondes)
Out
put c
once
ntra
tion
of C
O2
mol
%)
0 50 100 150 200 250 300 350 400 450 500990
995
1000
1005
1010
1015
1020
time (secondes)
Flow
of M
DE
A (t
/h)
ReferenceCont floutriangTS
0 50 100 150 200 250 300 350 400 450 5000.2
0.22
0.24
0.26
0.28
time (secondes)
Out
put c
once
ntra
tion
of C
O2
mol
%)
ReferenceCont floutriangTS
0 50 100 150 200 250 300 350 400 450 500950
960
970
980
990
1000
time (secondes)
Flow
of M
DE
A (t
/h)
Figure 13: Output CO2 Concentration and washing liquid flow for a step input disturbance of ± 5% on gas concentration and ± 10% on gas flow.
0 50 100 150 200 250 300 350 400 450 5000.2
0.22
0.24
0.26
0.28
time (secondes)
Outp
ut c
once
ntra
tion
of C
O2 (m
ol %
)
ReferenceCont flougaussTS
0 50 100 150 200 250 300 350 400 450 500985
990
995
1000
1005
1010
1015
time (secondes)
Flow
of M
DEA
(t/h)
0 50 100 150 200 250 300 350 400 450 5000.2
0.22
0.24
0.26
0.28
time (secondes)
Outp
ut c
once
ntra
tion
of C
O2 (m
ol %
)
ReferenceCont flougaussTS
0 50 100 150 200 250 300 350 400 450 500970
980
990
1000
1010
1020
time (secondes)
Flow
of M
DEA
(t/h)
Figure 14: Output CO2 Concentration and washing liquid flow for a step input disturbance of ± 5% on gas concentration.
used for the regulation of an industrial absorption packed column used for gas washing .We take a reduced number of sub models, four, to ease identification. The results obtained with state distributed feedback (PDC) are better than those by classical PID regulation, for a method which is not significantly complicated. Further investigations will be undertaken in the use of multiple models in control, multiple observers and multiple models in systems diagnosis.
References
1. Selatnia A, Seddari S (2006) Simulation of CO2 absorption in aqueous solu-tion of monoethanolamine (MEA) on a pilot absorption column. Distillation and absorption conference, IChemE, London, England.
2. Zidane I, Zebiri H (2010) Identification multimodèle et commande par logique floue d’une colonne d’absorption industrielle. Projet de fin d’études, ENP, Alger.
3. Crosby JE, Durbin LD (1976), “Design and application of state variable feed-

Page 8 of 8
Citation: Selatnia M, Illoul R, Boucherit MS (2014) Modeling and Output Feedback Distributed Control for an Absorption Packed Column. J Chem Eng Process Technol 5: 197. doi: 10.4172/2157-7048.1000197
Volume 5 • Issue 4 • 1000197J Chem Eng Process Technol ISSN: 2157-7048 JCEPT, an open access journal
0 50 100 150 200 250 300 350 400 450 5000.2
0.22
0.24
0.26
0.28
time (secondes)
Out
put c
once
ntra
tion
of C
O2
(mol
%)
ReferenceCont flougaussTS
0 50 100 150 200 250 300 350 400 450 5001005
1010
1015
time (secondes)
Flow
of M
DE
A (t
/h)
0 50 100 150 200 250 300 350 400 450 5000.2
0.22
0.24
0.26
0.28
time (secondes)
Out
put c
once
ntra
tion
of C
O2
(mol
%)
ReferenceCont flougaussTS
0 50 100 150 200 250 300 350 400 450 500940
960
980
1000
1020
time (secondes)
Flow
of M
DE
A (t
/h)
Figure 15: Output CO2 Concentration and washing liquid flow for a step input disturbance of ± 10% on gas flow.
0 50 100 150 200 250 300 350 400 450 5000.2
0.22
0.24
0.26
0.28
time (secondes)
Outpu
t con
centr
ation
of C
O2 (m
ol %)
ReferenceCont flougaussTS
0 50 100 150 200 250 300 350 400 450 5001008
1010
1012
1014
1016
time (secondes)
Flow
of MD
EA (t/
h)
0 50 100 150 200 250 300 350 400 450 5000.2
0.22
0.24
0.26
0.28
time (secondes)
Outpu
t con
centr
ation
of C
O2 (m
ol %)
ReferenceCont flougaussTS
0 50 100 150 200 250 300 350 400 450 500940
960
980
1000
1020
time (secondes)
Flow
of MD
EA (t/
h)
Figure 16: Output CO2 Concentration and washing liquid flow for a step input disturbance of ± 5% on gas concentration and ± 10% on gas flow.
back controller for a packed trickle bed column with carbon dioxide absorption”, in Joint Automatic Control Conference,USA.
4. Roffel B (1976) Control of processes with a state variable inequality constraint. Automatica 17: 19-28.
5. Darwish M, Fantin J (1980) Stabilization and control of absorber tower chemical process. Third IFAC/IFIP/IFORS Conference on System Approach for Develop-ment, Rabat.
6. Petrovski D (1980) A design scheme for multivariable output constrained PI regulators with applications to absorption column. Automatic Control Theory Applications 8: 61-69.
7. Najim K (1991) “Modelling and self-adjusting control of an absorption column”, International Newspaper of Adaptive Control and Processing Signal, 5: 335-345.
8. Najim K, Chtourou M (1991) “Multilevel learning control of an absorption col-umn”, Optimal control applications & Methods, 12: 189-195.
9. Najim K, Ruiz V (1995) “Long range predictive control of an absorption packed column”, Applied Mathematical Modelling Journal, 19: 39-45.
10. Idem R, Wilson M, Tontiwachwuthikul P, Chakma A, Veawab A, et al. (2006) Pilot Plant Studies of the CO2 Capture Performances of Aqueous MEA and Mixed MEA/MDEA Solvents at the University of Regina CO2 Capture Technol-ogy Development Plant and the Boundary Dam CO2 Capture Demonstration Plant. Ind Eng Chem Res 45: 241-242.
11. Tontiwatchwuthikul P, Meisen A, Lim CJ (1992) “CO2 Absorption by NaOH, monoethanolamine and 2-amino-2-methyl-1-propanol solutions in a packed column”, Chemical Engineering Science, 47: 381-391.
12. Pintola T, Tontiwatchwuthikul P, Meisen A (1993) Simulation of pilot plant and industrial CO2 -MEA absorbers. Gas separation and purification 7: 47-52.
13. Seddari S (2004) “Simulation d’une colonne à garnissage d’absorption du CO2 par une solution aqueuse de monoéthanolamine à 25°C et 40°C”, Thèse de Magister, ENP, Alger.
14. Leye LD, Froment GF (1986) “Rigorous simulation and design of columns for gas absorption and chemical reactions packed columns”, Comp. Chem. Eng, 10: 493-504.
15. Trambouze P, Landegheim HV, Wauquier JP (1984) Les réacteurs chimiques, conception/calcul/mise en œuvre, Paris, Technip.
16. Bedelbayev A, Greer T, Lie B (2008) “Model based control of absorption tower for CO2 capturing”, Telemark University College, Porsgrunn, Norvège.
17. CO2 absorber CO2 control. Data Sheet ISG. Ain Salah Gas.
18. Murray-Smith R, Johansen TA (1997) Multiple model Approaches to modelling and control ,Taylor & Francis,London.
19. Orjuela R, Marx B, Ragot J, Maquin D (2008) Conception d’observateurs robustes pour des systèmes non linéaires incertains : une stratégie multimodèle,Conférence Internationale Francophone d’Automatique,CIFA.
20. Ichallal D, Marx B, Ragot J, Maquin D (2008) Diagnostic des systems non liné-aires par une approche multimodèle,Workshop Surveillance, Sûreté et sécurité des grands systèmes,3 SGS 08,Troyes,France.
21. Takagi T, Sugeno M (1985) Fuzzy identification of systems and its application to modelling and control,IEEE Trans. On systems Man and Cybernetic, 15: 116-132.
22. Wang HO, Tanaka K, Griffin MF (1996) An approach to fuzzy control of non-linear systems: stability & design issues,IEEE Trans. On Fuzzy Systems, 4: 14-23.
23. Guerra TM, Vermeiren L (2004) LMI- based relaxed nonquadratic stabilization conditiond for nonlinear systems in the Takagi-Sugeno’s form, Automatica, 40: 823-829.
24. Wang HO, Tanaka K, Griffin MF (1995) Parellel Distributed Compensation of nonlinear systems by Takagi-Sugeno fuzzy model. Proc of the Fuzzy-IEEE/IFES.
25. Orjuela R, Maquin D, Ragot J (2006) Identification des systèmes non linéaire par une approche multimodèle à états decouples. Journées Identification et Modélisation Expérimentale JIME, Poitiers, France.
26. Ichalal D (2009) Estimation et diagnostic des systèmes nonlinéaire décrits par des modèles de Takagi-Sugeno. Centre de recherche en automatique de Nancy, INPL, France.
Citation: Selatnia M, Illoul R, Boucherit MS (2014) Modeling and Output Feedback Distributed Control for an Absorption Packed Column. J Chem Eng Process Technol 5: 197. doi: 10.4172/2157-7048.1000197