
Model to predict overheating risk based on an electrical capacitor analogy
6
Model to predict overheating risk based on an electrical capacitor analogy Darren Robinson * , Fre ´de ´ric Haldi Solar Energy and Building Physics Laboratory (LESO-PB), Ecole Polytechnique Fe ´de ´rale de Lausanne (EPFL), CH-1015 Lausanne, Switzerland Received 5 June 2007; accepted 11 November 2007 Abstract It is important for building designers to be able to judge if a space is likely to overheat, whether to determine if HVAC plant is required or to design this out by passive means. To this end several overheating risk criteria have recently been published. These tend to be based on some limiting number of occasions that an indoor temperature may be exceeded. Somewhat disconcertingly, these criteria are not based on a systematic analysis of the causes of overheating, such that the thresholds used are essentially arbitrary. Based on analogy between the charging and discharging of humans’ tolerance to overheating stimuli and that of charge in an electrical capacitor, this paper proposes a simple mathematical model for predicting overheating risk given a set of measured/simulated environmental conditions. The model is analytically based, but uses coefficients (a, b) to empirically tune its charging/discharging time constants to a given population and situation. Comparisons with results from a dedicated field survey conceived to help develop and test the model are very encouraging, but scope for further improvement is discussed. # 2007 Elsevier B.V. All rights reserved. Keywords: Thermal comfort; Overheating risk; Electrical capacitance analogy; Empirical model 1. Introduction With the desire to minimise energy consumption and associated harmful atmospheric emissions, designers of European buildings increasingly strive to avoid the use of mechanical cooling by passive means. This typically involves minimising excess casual and solar heat gains as well as heat conduction from outside and discharging the heat that has accumulated within exposed fabric during the daytime by nocturnal ventilation (night cooling). During this process, it is important that designers have some basis for judging whether or not the need for air conditioning has been successfully eliminated, so that the (passive) design can be further improved or so that the necessary mechanical system can be designed. Such decisions have conventionally been made on the basis of comparing predictions of instantaneous thermal satisfaction, for example based on the steady state model of Fanger [1], with a static thermal comfort envelope. Such envelopes have evolved from the narrowly defined ASHRAE 55-1966 comfort envelope, which spans a temperature interval of just 2 8C and a relative humidity interval of 20–80%, to one which is seasonally dependant, broader and accounts for limiting wet bulb temperatures: ASHRAE 55a-1996; see Fiala et al. [2] for further discussion. The seasonal dependence of ASHRAE 55a:1996 reflects the growing acceptance of adaptive algorithms, such as those of Humphreys [3], Humphreys and Nicol [4], Nicol and Humphreys [5], de Dear and Brager [6], etc. Indeed, this has prompted a new generation of standards that define comfort envelopes for free-running buildings based on indoor tempera- tures which vary as a function of different time periods of outdoor temperature. Examples include the Dutch standard ISSO 74:2005 [7], the US standard ASHRAE 55:2004 [8] and the proposed European standard prEN 15251:2005 [9]. Only the proposed International standard prEN ISO 7730:2005 [10] continues to ignore adaptation of occupants’ comfort tempera- ture as a function of outside conditions (except in that clothing level is assumed to be seasonally dependent). Pfafferott [17] provides a synopsis of these as well as standards that relate more to buildings with HVAC. www.elsevier.com/locate/enbuild Available online at www.sciencedirect.com Energy and Buildings 40 (2008) 1240–1245 * Corresponding author. Tel.: +41 216934543. E-mail address: darren.robinson@epfl.ch (D. Robinson). 0378-7788/$ – see front matter # 2007 Elsevier B.V. All rights reserved. doi:10.1016/j.enbuild.2007.11.003
-
Upload
darren-robinson -
Category
Documents
-
view
213 -
download
0
Transcript of Model to predict overheating risk based on an electrical capacitor analogy

www.elsevier.com/locate/enbuild
Available online at www.sciencedirect.com
08) 1240–1245
Energy and Buildings 40 (20Model to predict overheating risk based on an electrical
capacitor analogy
Darren Robinson *, Frederic Haldi
Solar Energy and Building Physics Laboratory (LESO-PB), Ecole Polytechnique Federale de Lausanne (EPFL),
CH-1015 Lausanne, Switzerland
Received 5 June 2007; accepted 11 November 2007
Abstract
It is important for building designers to be able to judge if a space is likely to overheat, whether to determine if HVAC plant is required or to
design this out by passive means. To this end several overheating risk criteria have recently been published. These tend to be based on some limiting
number of occasions that an indoor temperature may be exceeded. Somewhat disconcertingly, these criteria are not based on a systematic analysis
of the causes of overheating, such that the thresholds used are essentially arbitrary.
Based on analogy between the charging and discharging of humans’ tolerance to overheating stimuli and that of charge in an electrical
capacitor, this paper proposes a simple mathematical model for predicting overheating risk given a set of measured/simulated environmental
conditions. The model is analytically based, but uses coefficients (a, b) to empirically tune its charging/discharging time constants to a given
population and situation. Comparisons with results from a dedicated field survey conceived to help develop and test the model are very
encouraging, but scope for further improvement is discussed.
# 2007 Elsevier B.V. All rights reserved.
Keywords: Thermal comfort; Overheating risk; Electrical capacitance analogy; Empirical model
1. Introduction
With the desire to minimise energy consumption and
associated harmful atmospheric emissions, designers of
European buildings increasingly strive to avoid the use of
mechanical cooling by passive means. This typically involves
minimising excess casual and solar heat gains as well as heat
conduction from outside and discharging the heat that has
accumulated within exposed fabric during the daytime by
nocturnal ventilation (night cooling). During this process, it is
important that designers have some basis for judging whether or
not the need for air conditioning has been successfully
eliminated, so that the (passive) design can be further improved
or so that the necessary mechanical system can be designed.
Such decisions have conventionally been made on the basis
of comparing predictions of instantaneous thermal satisfaction,
for example based on the steady state model of Fanger [1], with
a static thermal comfort envelope. Such envelopes have evolved
* Corresponding author. Tel.: +41 216934543.
E-mail address: [email protected] (D. Robinson).
0378-7788/$ – see front matter # 2007 Elsevier B.V. All rights reserved.
doi:10.1016/j.enbuild.2007.11.003
from the narrowly defined ASHRAE 55-1966 comfort
envelope, which spans a temperature interval of just �2 8Cand a relative humidity interval of 20–80%, to one which is
seasonally dependant, broader and accounts for limiting wet
bulb temperatures: ASHRAE 55a-1996; see Fiala et al. [2] for
further discussion.
The seasonal dependence of ASHRAE 55a:1996 reflects the
growing acceptance of adaptive algorithms, such as those of
Humphreys [3], Humphreys and Nicol [4], Nicol and
Humphreys [5], de Dear and Brager [6], etc. Indeed, this has
prompted a new generation of standards that define comfort
envelopes for free-running buildings based on indoor tempera-
tures which vary as a function of different time periods of
outdoor temperature. Examples include the Dutch standard
ISSO 74:2005 [7], the US standard ASHRAE 55:2004 [8] and
the proposed European standard prEN 15251:2005 [9]. Only
the proposed International standard prEN ISO 7730:2005 [10]
continues to ignore adaptation of occupants’ comfort tempera-
ture as a function of outside conditions (except in that clothing
level is assumed to be seasonally dependent). Pfafferott [17]
provides a synopsis of these as well as standards that relate
more to buildings with HVAC.
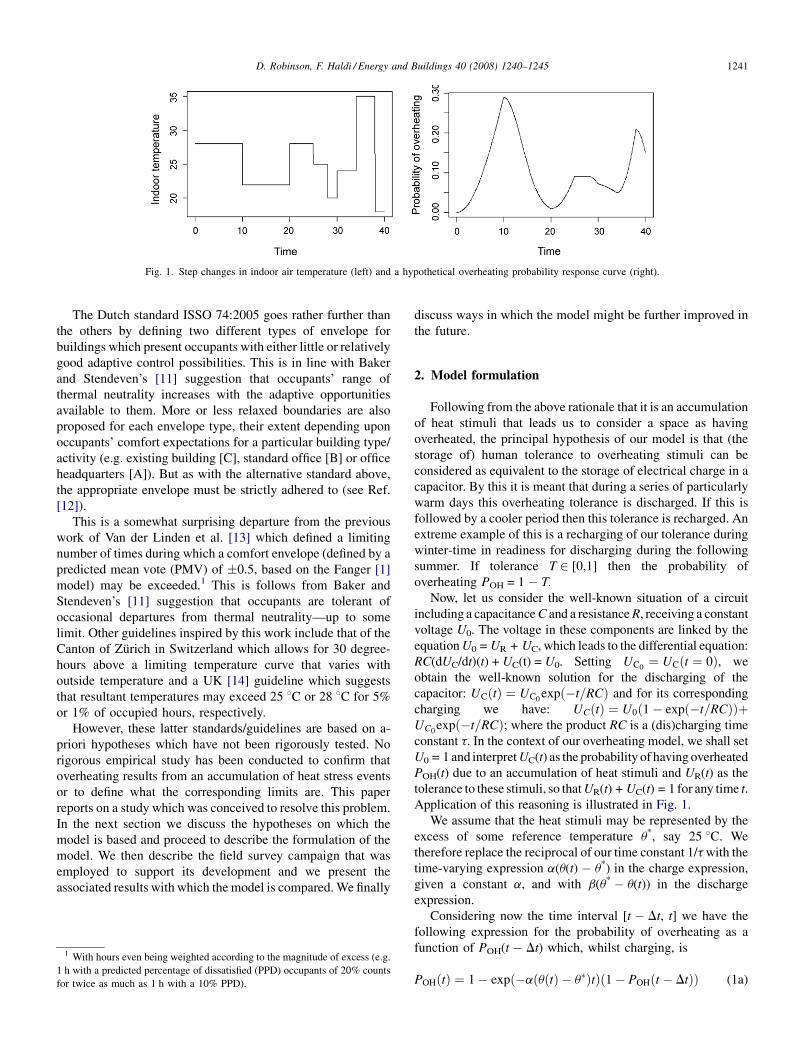
Fig. 1. Step changes in indoor air temperature (left) and a hypothetical overheating probability response curve (right).
D. Robinson, F. Haldi / Energy and Buildings 40 (2008) 1240–1245 1241
The Dutch standard ISSO 74:2005 goes rather further than
the others by defining two different types of envelope for
buildings which present occupants with either little or relatively
good adaptive control possibilities. This is in line with Baker
and Stendeven’s [11] suggestion that occupants’ range of
thermal neutrality increases with the adaptive opportunities
available to them. More or less relaxed boundaries are also
proposed for each envelope type, their extent depending upon
occupants’ comfort expectations for a particular building type/
activity (e.g. existing building [C], standard office [B] or office
headquarters [A]). But as with the alternative standard above,
the appropriate envelope must be strictly adhered to (see Ref.
[12]).
This is a somewhat surprising departure from the previous
work of Van der Linden et al. [13] which defined a limiting
number of times during which a comfort envelope (defined by a
predicted mean vote (PMV) of �0.5, based on the Fanger [1]
model) may be exceeded.1 This is follows from Baker and
Stendeven’s [11] suggestion that occupants are tolerant of
occasional departures from thermal neutrality—up to some
limit. Other guidelines inspired by this work include that of the
Canton of Zurich in Switzerland which allows for 30 degree-
hours above a limiting temperature curve that varies with
outside temperature and a UK [14] guideline which suggests
that resultant temperatures may exceed 25 8C or 28 8C for 5%
or 1% of occupied hours, respectively.
However, these latter standards/guidelines are based on a-
priori hypotheses which have not been rigorously tested. No
rigorous empirical study has been conducted to confirm that
overheating results from an accumulation of heat stress events
or to define what the corresponding limits are. This paper
reports on a study which was conceived to resolve this problem.
In the next section we discuss the hypotheses on which the
model is based and proceed to describe the formulation of the
model. We then describe the field survey campaign that was
employed to support its development and we present the
associated results with which the model is compared. We finally
1 With hours even being weighted according to the magnitude of excess (e.g.
1 h with a predicted percentage of dissatisfied (PPD) occupants of 20% counts
for twice as much as 1 h with a 10% PPD).
discuss ways in which the model might be further improved in
the future.
2. Model formulation
Following from the above rationale that it is an accumulation
of heat stimuli that leads us to consider a space as having
overheated, the principal hypothesis of our model is that (the
storage of) human tolerance to overheating stimuli can be
considered as equivalent to the storage of electrical charge in a
capacitor. By this it is meant that during a series of particularly
warm days this overheating tolerance is discharged. If this is
followed by a cooler period then this tolerance is recharged. An
extreme example of this is a recharging of our tolerance during
winter-time in readiness for discharging during the following
summer. If tolerance T 2 [0,1] then the probability of
overheating POH = 1 � T.
Now, let us consider the well-known situation of a circuit
including a capacitance C and a resistance R, receiving a constant
voltage U0. The voltage in these components are linked by the
equation U0 = UR + UC, which leads to the differential equation:
RC(dUC/dt)(t) + UC(t) = U0. Setting UC0¼ UCðt ¼ 0Þ, we
obtain the well-known solution for the discharging of the
capacitor: UCðtÞ ¼ UC0expð�t=RCÞ and for its corresponding
charging we have: UCðtÞ ¼ U0ð1� expð�t=RCÞÞþUC0
expð�t=RCÞ; where the product RC is a (dis)charging time
constant t. In the context of our overheating model, we shall set
U0 = 1 and interpret UC(t) as the probability of having overheated
POH(t) due to an accumulation of heat stimuli and UR(t) as the
tolerance to these stimuli, so that UR(t) + UC(t) = 1 for any time t.
Application of this reasoning is illustrated in Fig. 1.
We assume that the heat stimuli may be represented by the
excess of some reference temperature u*, say 25 8C. We
therefore replace the reciprocal of our time constant 1/t with the
time-varying expression a(u(t) � u*) in the charge expression,
given a constant a, and with b(u* � u(t)) in the discharge
expression.
Considering now the time interval [t � Dt, t] we have the
following expression for the probability of overheating as a
function of POH(t � Dt) which, whilst charging, is
POHðtÞ ¼ 1� expð�aðuðtÞ � u�ÞtÞð1� POHðt � DtÞÞ (1a)

D. Robinson, F. Haldi / Energy and Buildings 40 (2008) 1240–12451242
and during discharging is
POHðtÞ ¼ expð�bðu� � uðtÞÞtÞðPOHðt � DtÞÞ (1b)
with a, b being parameters to determine empirically.
Let us now consider n consecutive periods of charge [t0,
t0 + Dt]. . .tn � Dt, tn during the period [t0, tn]. Using Eq. (1a),
inserting a similar expression for POH(t � Dt) and solving
recurrently until t0, we have for charging, that:
POHðtnÞ ¼ 1� exp
�� a
Xn�1
i¼0
½ðuðt � iDtÞ � u�Þðt � iDtÞ��
�ð1� POHðt0ÞÞ(2)
Now, if we define degree-hours (DH) of heat stimuli above
our reference temperature during the period [ti, tj] as
DH = (u(ti) � u*)(tj �ti) and furthermore reason that
POH(t0) = 0 then we obtain the following for charging:
POHðtnÞ ¼ 1� exp
�� a
Xn
i¼1
DHt0;ti
�ð1� POHðt0ÞÞ (3a)
And for discharging during n consecutive periods [t0,
t0 + Dt], . . ., [tn � Dt, tn], we have:
POHðtnÞ ¼ exp
�� bXn
i¼1
DH�t0;ti
�POHðt0Þ (3b)
where in this case POH(t0) refers to the probability of over-
heating at the time of transition from charging to discharging of
our human capacitor and DH�t0;ti ¼ ðu� � uðt0ÞÞðti � t0Þ. Thus
we are able to model a temporal evolution of the probability of
overheating within the limits [0,1] during an arbitrary time
period.
Fig. 2. Longitudinal e-questionnaire (a: left) and dialogue box f
3. Comparisons
To support development and testing of the overheating
model described above, a thermal comfort/overheating field
survey campaign was conducted during the summer of 2006. In
the following section we present briefly the methodology upon
which this campaign was based. This is followed by a synopsis
of some of the results from this campaign. Then we present a
simplification of the above model, the derivation of the
associated empirical coefficients and compare measurements
with corresponding predictions.
3.1. Field survey methodology
A total of eight non-air-conditioned office buildings, each
located in Switzerland, were selected based on a desire to have
a reasonable diversity in terms of their design concept and the
adaptive opportunities available to occupants. For reasons of
practicality, these were all located within a 50 km radius of
Lausanne (latitude 46.58N, longitude 6.78E). For each building,
a three-stage field survey methodology was employed:
� I
or
nitial transverse questionnaire: administered to a large
proportion of building occupants during the same day to
gauge general satisfaction with the thermal environment and
the availability and effectiveness of means to control the
environment. A total of 257 responses were obtained from the
eight buildings under investigation.
� L
ongitudinal questionnaire: electronic questionnaire admi-nistered at regular intervals on a daily basis to a sub-set of
volunteer occupants of each building, to produce time-series
data regarding participants’ thermal satisfaction, personal
characteristics (clothing and activity level) and interactions
with their environment; with simultaneous recording of
environmental conditions (Fig. 2a). Most crucially partici-
pants were asked to press an ‘overheated’ button once they
explanation of cause of overheating (b: right): in French.

Fig. 3. Temporal profile of average daily minimum/mean maximum tempera-
ture for the three sites.
ha
D. Robinson, F. Haldi / Energy and Buildings 40 (2008) 1240–1245 1243
felt that their thermal tolerance had been surpassed. To ensure
that we would obtain unambiguous information participants
were asked to select this option one time only. After
confirming their choice, this prompted a further dialogue box
(Fig. 2b) which requested participants to describe the
circumstances that led to this transition in tolerance (i.e.
from the space having been thermally acceptable to now
having overheated). More specifically whether this was
caused by an excessive temperature during the moment in
question or whether the temperature was excessively high
throughout the day in question or throughout several prior
days. Participants were also asked to remark whether this
overheating was influenced by excess solar gain, a lack of
control options or to offer alternative explanations. In total
there were 60 participants in this study, who produced a total
of 5908 responses (i.e. each participant completed the
questionnaire an average 98 times).
� F
inal transverse questionnaire: At the end of the longitudinalstudy a short second transverse questionnaire was adminis-
tered to ascertain whether the population at large perceived
their building to have overheated and if so to explain why. A
total of 206 responses were obtained.
3.2. Field survey results summary
The longitudinal study lasted from June 13th until
September 27th 2006. From mid June until the end of July
2006, most of Europe experienced a heat wave (Fig. 3). It was
during this period that all occurrences took place of the button
being pressed indicating that participants’ tolerance had been
exceeded (their environment has now become overheated).
Of the 60 participants only 22 pressed this button.2 Of these
only 18% indicated that this was caused by excess temperature
at the moment in question, whereas 27% and 55% indicated that
this was due to excess temperature during the day in question
and during the past several days, respectively.
This result tends to confirm the hypothesis that occupants are
tolerant of occasional departures from comfort; or more
specifically that overheating is due to an accumulation of heat
stress events rather than a single event (which we may regard as
2 And amongst these, five did so almost immediately, suggesting that this may
ve been a mistake.
a special case of an accumulation of tolerance discharge over a
very short period of time (e.g. large a)).
Recipients of this questionnaire were also asked whether
they were generally satisfied with their thermal environment
and also whether they felt that their office environment had
overheated during the summer of 2006. For the eight buildings
studied, on average 45% of occupants were thermally satisfied
with their environment, but some 74% perceived their buildings
to have overheated—considerably higher than those that
participated in the longitudinal study, perhaps suggesting that
occupants are less tolerant on reflection than at the time of the
event.
3.3. Model application and verification
During the warmest period of our field survey campaign in
which all overheating events were logged, no internal air
temperature below 25 8C was recorded during working hours.
The period was thus a continuously charging period of
overheating probability (or inversely a discharging of
tolerance). Under such (continuously charging) circumstances
we are able to simplify Eq. (3a) somewhat, so that
POHðtÞ ¼ 1� expð�a0DHt0;tÞ (4)
where a0 = aDt. Determining a0 is then performed by the fitting
of data using the regression equation logð1� POHðtÞÞ ¼�a0DHt0;t, where POH is the observed cumulative probability
of overheating. The corresponding regression on our data
(Fig. 4) gives a value of a0 = 4.75 � 10�4 [K�1 h�1] with good
agreement (r2 = 0.98), albeit perhaps based on a limited range
of 0 < (DH > 25 8C) < 1200.
The corresponding predicted probability of overheating
using this simplified form of the model (i.e. for continuous
charging) is compared with the measurement results in Fig. 5.
Note that this new model predicts the probability that a
population will perceive a given space to have overheated, but
we may also interpret this as the proportion of a given
population that will perceive a space to have overheated.
Now, to test our model thoroughly we would ideally have
data spanning the entire range POH 2 [0,1], but unfortunately
Fig. 4. Linear regression for derivation of a0.

Fig. 5. Predicted (solid line) and measured (solid diamonds) overheating probability as a function of DH > 25 8C in the probability range [0,1] (left) and focussing on
the range [0,0.4] (right).
D. Robinson, F. Haldi / Energy and Buildings 40 (2008) 1240–12451244
the summer of 2006 was not sufficiently warm to provide us
with these data. Nevertheless we know that building designers
seek to satisfy the comfort expectations of the majority of a
building population, so that current thermal comfort standards
target a PPD of 20%. We may therefore suggest that our
model is valid within the range of practical application [i.e. it
compares well with measurements in the range 0 POH 0.2
that is of interest to building designers].
For an example of the temporal evolution of overheating
probability using this model given a corresponding thermal
stimulus, the reader is referred back to Fig. 1 above,3 for which
a reference temperature of 25 8C was used to calculate the
degree-hours of overheating stimuli.
4. Discussion
In expressing overheating probability as the inverse of
tolerance to overheating stimuli which discharges with
temperatures above a certain limit and (re)charges below
another limit, based on analogy with an electrical capacitor, we
have a coherent basis for integrating overheating stimuli (rather
than the current practice of simply counting the number of
occasions that a certain comfort limit is surpassed) and the way
in which human tolerance to such influences is diminished and
replenished during and between periods of warm weather. But
this model could be criticised for not considering other physical
(e.g. radiant temperature, air speed and relative humidity) or
personal (clothing and activity level) parameters or indeed the
impact of occupants’ ability to control their environment on
their tolerance to overheating stimuli and thereby on the
probability of overheating.
3 Note that to produce this diagram we use our empirically derived value for
a0 = 4.75 � 10�4 and an estimate for b0. For this latter we hypothesise that b » a
because we suppose that occupants are psychologically more sensitive to the
thermal relief to overheating stimuli that they feel during a cool period which
follows a warm period in which their tolerance is gradually discharged. In the
absence of measured results we assume, purely for illustrative purposes, that
b0 10a0.
But in a well-designed indoor environment the radiant
temperature should be relatively close to air temperature and
the air speed should be restricted to within reasonable bounds.4
Furthermore, in summer time it is reasonable to assume that
occupants are similarly lightly clothed (a certain minimum
clothing level must be maintained) and that they restrict their
metabolic activity to a sensible minimum (office occupants tend
in any case to have a somewhat invariant sedentary activity
level).
The issue of adaptation is perhaps most pertinent. As Baker
and Stendeven eloquently suggested in 1996, ‘‘if a change
occurs such as to produce discomfort, people react in ways
which tend to restore their comfort’’. Furthermore, when
available adaptive opportunities are exercised, these tend both
to reduce discomforting stimuli (e.g. shading to reduce
radiation absorption; window openings to increase convective
cooling, etc.) and to affect ‘‘cognitive tolerance’’ to these
stimuli: so that when the cause of discomfort is understood (and
indeed partially the occupant’s responsibility) then tolerance is
increased. These physiological and psychological adaptive
processes are suggested to increase occupants’ summertime
neutral temperature (the temperature at which they feel neither
warm nor cool), with consequent implications for overheating
risk.
This notion of adaptability is implicit in our model, in the
sense that it has been tuned to a set of buildings within which
occupants have some degree of control over their environment.
To take this into account in an explicit way, and thereby produce
a more general form of model, we have two options. One option
would be to define different sets of coefficients a, b for
buildings with different degrees of adaptability. An alternative
(and more useful approach) would be to provide a means for
adjusting a, b so that the effects of adaptive processes
(elevation of neutral temperature due to adaptive processes) in
our sample of buildings are removed [so that DHt0;t in the
regression a0 ¼ �logð1� POHðtÞÞ=DHt0;t is adjusted] together
4 The absence of consideration of humidity however may lead to a real
geographical limitation of the model.

D. Robinson, F. Haldi / Energy and Buildings 40 (2008) 1240–1245 1245
with a means of calculating degree-hours of overheating for
use in the equation POHðtÞ ¼ 1� expða0DHt0;tÞ which then
accounts for building-specific adaptive processes in an explicit
way. One approach to achieve this would be to adjust the
temperature used to calculate DHt0;t by using the empirical
adaptive increments of Haldi and Robinson [15].
On a related note, our field survey design raises some
interesting questions, such as: does the process of observation
influence participants’ perceptions? Is it sufficient to ask
participants to vote for overheating just once during the study?
Concerning the latter point, participants may be inclined to
delay their vote until they are unequivocally sure that their
tolerance has been surpassed (since they are unable to predict
which conditions are likely to follow). This was considered to
be an acceptable risk, since our key concern was to have a
single clear and decisive vote that ‘‘yes, I perceive this space to
have now overheated’’, accompanied by the thermal history
that led to this vote, rather than to have multiple votes and
associated histories and not to know upon what to base our
analysis.
The former issue is also a potential flaw in our experimental
design—it is possible that the more we ask a person to reflect
upon a particular environmental situation, the more sensitive
that person becomes to any associated discomforting influ-
ences. However, this effect may tend to cancel the other noted
above.
5. Conclusions
In this paper we have attempted to define and verify a new
model to predict overheating risk given a set of measured/
simulated environmental conditions. This model is based on
analogy between the (dis)charging of human tolerance to
overheating stimuli and of charge in an electrical capacitor.
In this the model is analytically based, but uses coefficients
a, b to empirically tune the model’s charging/discharging time
constants to a given population and situation. The results from a
first application of this model are very encouraging. However,
there is scope for further improvement:
� T
he current form of the model considers only a singleparameter: indoor air temperature. A more elaborate model
might consider some more holistic physical measure such as
(degree-hours of) operative temperature.
� T
he model has been developed for a temperate climate inwhich the range of temperature and humidity is moderate, so
that the model’s applicability to warm–humid climates may
be questionable. It might be that empirical coefficients should
depend on the climate type.
� T
he model does not presently consider, in an explicit way, theinfluence of adaptive processes on (dis)charging time
constants, but a mechanism for resolving this has been
identified.
Furthermore, all of our overheating events took place during
a period of constant discharging of tolerance to elevated
temperatures, so that it has not yet been possible for us to
calibrate our empirical coefficient b. For this we would need
data which contains at least one instance of a cool period
between two periods which were warm enough to cause people
to vote that an overheating event had taken place.
The authors would be pleased to collaborate with other
research groups to enlarge the field survey database to facilitate
model improvements addressing the above to be tested.
Acknowledgements
The financial support for this work from the Swiss National
Science Foundation, through National Research Programme 54
‘Sustainable Development of the Built Environment’, is
gratefully acknowledged. Many thanks also to Liz Azzi for
help with longitudinal surveys, to David Lindelof for advice on
statistical analysis and to Claude-Alain Roulet for his boundless
enthusiasm and helpful advice. Particular thanks also to Pascal
Gerber and Chantal Piot-Ziegler (from the Institute of
Psychology, University of Lausanne) for their contribution to
the design, data collection and analysis of the initial transverse
questionnaire.
References
[1] P.O. Fanger, Thermal Comfort, McGraw-Hill, New York, 1972.
[2] D. Fiala, K.J. Lomas, D. Martinez, M.J. Cook, Dynamic thermal sensation
in PDEC buildings, in: Proc. PLEA 99, V1, Brisbane, Australia, Septem-
ber 1999, (1999), pp. 243–248.
[3] M.A. Humphreys, Outdoor temperatures and comfort indoors, Building
Research and Practice 6 (2) (1978) 92–105.
[4] M.A. Humphreys, J.F. Nicol, Outdoor temperature and indoor thermal
comfort: raising the precision of the relationship for the 1998 ASHRAE
database of field studies, ASHRAE Transactions 206 (2) (2000) 485–492.
[5] J.F. Nicol, M.A. Humphreys, Adaptive thermal comfort and sustainable
thermal standards for buildings, Energy and Buildings 34 (2002) 563–572.
[6] R.J. de Dear, G.S. Brager, Brager, Thermal comfort in naturally ventilated
buildings: revisions to ASHRAE Standard 55, Energy and Buildings 34
(2002) 549–561.
[7] A.C. Boestra, L.P. Hulsman, A.M. van Weele, ISSO 74 Kleintje
binnenklimaat, Stichting ISSO, Rotterdam, 2005.
[8] ASHRAE, Thermal Environmental Conditions for Human Occupancy,
Standard 55-2004, 2004.
[9] CEN, Criteria for the Indoor Environment prEN 15251:2005, Beuth
Verlag, 2005.
[10] ISO, Ergonomics of the Thermal Environment, prEN ISO 7730, Beuth
Verlag, 2005.
[11] N. Baker, M. Stendeven, Thermal comfort for free-running buildings,
Energy and Buildings 23 (3) (1996) 175–182.
[12] A.C. Van der Linden, A.C. Boerstra, A.K. Raue, S.R. Kurvers, R.J. de
Dear, Adaptive temperature limits: a new guidelines in The Netherlands. A
new approach for the assessment of building performance with respect to
thermal indoor climate, Energy and Buildings 38 (2006) 8–17.
[13] A.C. Van der Linden, A.C. Boerstra, A.K. Raue, S.R. Kurvers, Thermal
indoor climate building performance characterised by human comfort
response, Energy and Buildings 34 (2002) 737–744.
[14] Anon, A performance specification for the energy efficient office of the
future, BRECSU Report 30, CRC Publications, UK, 1995.
[15] F. Haldi, D. Robinson, On the behaviour and adaptation of office occu-
pants, Building and Environment, submitted.
[17] J.U. Pfafferott, S. Herkel, D.E. Kalz, A. Zeuschner, Comparison of low
energy office buildings in summer using different comfort criteria, Energy
and Buildings 39 (7) (2007) 750–757.


![Lecture Two: The Analogy Theory [‘AT’] · Lecture Two: The Analogy Theory ... 2. [AT] claims: OM-judgments justified by an argument from analogy ... iPaul Bartha, “Analogy and](https://static.fdocuments.in/doc/165x107/5b1ae5387f8b9a28258e143b/lecture-two-the-analogy-theory-at-lecture-two-the-analogy-theory-.jpg)
