Model studies report_25-3-15_opt.pdf
96
Design Consultant EPC Contractor NTPC HYDRO LIMITED Lata Tapovan Hydroelectric Project, Uttrakhand A Report on Model Studies of Lata Tapovan HEP Document no (As per L&T): O1201-DD-BAR-3052 Document no (As per NTPC): 5601-002 (R)-PVC-U-352 March 2015
Transcript of Model studies report_25-3-15_opt.pdf

Design Consultant EPC Contractor
NTPC HYDRO LIMITED
Lata Tapovan Hydroelectric Project, Uttrakhand
A Report on Model Studies of Lata Tapovan HEP
Document no (As per L&T): O1201-DD-BAR-3052Document no (As per NTPC): 5601-002 (R)-PVC-U-352
March 2015
Lata Tapovan HEP
A Report Model Studies of Lata Tapovan HEP 2/9
March 2015 July 2010
A Report on Model Studies of Lata Tapovan
HEP
Document no (As per L&T): O1201-DD-BAR-3052
Document no (As per NTPC): 5601-002 (R)-PVC-U-352
R0 21-03-2015 Om Jangid Amar Pal Singh
Revision
Date of
submission to
NTPC
Prepared Checked and
approved Remark
Design Consultant EPC Contractor
Lata Tapovan HEP
A Report Model Studies of Lata Tapovan HEP 3/9
March 2015 July 2010
Table of Contents Page
1 Introduction ....................................................................................................................... 4
2 The Model ......................................................................................................................... 5
3 Observation ....................................................................................................................... 6
3.1 Barrage .............................................................................................................................. 6
3.1.1 Adequacy of Waterway ..................................................................................................... 6
3.1.2 Hydrostatic Pressures ........................................................................................................ 7
3.1.3 Approach flow conditions ................................................................................................. 7
3.1.4 Adequacy of u/s and d/s approach length: ......................................................................... 8
3.1.5 Water surface profile at u/s and d/s of barrage. ................................................................. 8
3.1.6 Energy dissipation arrangement. ....................................................................................... 8
3.2 Intake ................................................................................................................................. 8
3.2.1 Intake capacity ................................................................................................................... 9
Annexure:1: T.M. No.84 RR (H3-05) dated Oct-2013
Annexure-2: RR No. 85 RR (H3-06) dated March 2015
Annexure-3: A note on hydraulic studies of Intake
Lata Tapovan HEP
A Report Model Studies of Lata Tapovan HEP 4/9
March 2015 July 2010
1 Introduction
As reviewed under technical specifications of the contract between client NTPC & L&T
(Contractor) hydro model studies were referred by L&T to IRI Roorkee in 12th
Sept
2012. The design including layout, Plans & section of river, barrage, intake and
desilting arrangement were prepared by L&T and supplied to the research organisation
for carrying out model studies.
Initially the TOR submitted to NTPC was based on scope of model studies as per scope
of tender documents. Some additional scope of work is introduced in the TOR as
requested by NTPC and it was conveyed to NTPC that financial and time implication
and increase in scope shall be dealt as per provisions of contact.
The following parameters of different structure were desired by NTPC to be studied by
IRI as below.
a) Barrage:
Model of barrage with under sluice shall be run for the flood discharge of
300,500, 1000 & 2000 cumec with water level at FRL (EL 2103m) & under free
flow condition and observation of afflux.
Variation of velocity profile, water level profile, coefficient of discharge of flow
under all discharges given above.
Sediment deposition pattern upstream of barrage & flushing capacity.
Sequence of gate operation and its effect on flow & silt flushing pattern.
Suitable measures for even distribution of flow among all bays of barrage shall
be suggested. Model shall be re-run by incorporating such measures.
Suggestions for improvement in energy dissipation at downstream of barrage.

Lata Tapovan HEP
A Report Model Studies of Lata Tapovan HEP 5/9
March 2015 July 2010
b) Intake
Hydraulic profile of intake shall be finalized.
Check for adequacy of water seal at HRT Intake & formation of vortex.
2 The Model
A geometrically similar comprehensive model of river Dhauliganga was constructed to
a scale of 1:30 (discharge scale 1:4929.5). A river reach from 900 m upstream to 450 m
downstream of proposed barrage axis was represented in the model in cement concrete.
The discharge fed into the model was measured over a sharp crested weir provided in
the upstream of the model with the help of pointer gauge having least count of 0.01 cm.
A v-notch arrangement was made in the downstream of power intake to measure the
discharge passing through it. The velocities were observed using well calibrated mini-
current meter and the water levels were observed with the model scale. The layout plan
of the comprehensive model is shown in Drawing - 2. The view of the model is shown
in Photograph-1 & 2 of Annexure-1.
Observations in the model are converted in to prototype with the following ratio.
Sr No Model Prototype
1 Length Dimensions like depth, scour levels Model value x 30
2 Discharge Model value x 30 2.5
3 Velocity Model value x √30
4 Pressure Model value x 30
The performance of the structures were tested under the following two conditions.
1. Layout plans and section of barrage complex as shown in plates1&2 (a) & (b).
Lata Tapovan HEP
A Report Model Studies of Lata Tapovan HEP 6/9
March 2015 July 2010
2. The above with the following modifications.
a) Smoothening of protruding rock ledge 180 m upstream of the barrage axis on left
bank.
b) Provision of a small bucket downstream of the floor of the barrage which add no
conventional system of energy dissipaters.
3 Observation
3.1 Barrage
3.1.1 Adequacy of Waterway
To examine the adequacy of waterway of barrage, the control structure having 10
barrage bays & 2 under sluice bays of 11.0 m each with its crest at El. 2090.0 m &
2088.0 m respectively, separated by 3.5 m thick pier and two intakes with its crest at El.
2095.0 m along with power intake, two chambers of desilting basin and 133.0 m long
HRT was incorporated in the model as per Drawing - 6 and as shown in Photograph -3
& 4. The model was run under free flow (i.e. gate operation) and steady state condition
at different discharges varying from 200 cumec to the maximum discharge of 2000
cumec with maintaining their corresponding tail water levels at 360 m downstream of
barrage axis as per tail rating curve
It is seen that the design discharge of 2000 cumec passed through the spillway at
average water level of El. 2093.83 m against the supplied FRL as El. 2103.0 m
indicated that the discharging capacity of barrage is more than its design discharge of
2000 cumec. The model was also run with closing of gates of barrage from left side
These observations indicate that after closing 9 gates of barrage, the reservoir level was
recorded at about FRL (El. 2103.0 m). Thus, the 4 barrage bays from left side are
surplus as per model observations.
These observations can be seen in table 1, 2&3 of T.M.No. 84 (Annexure-1).

Lata Tapovan HEP
A Report Model Studies of Lata Tapovan HEP 7/9
March 2015 July 2010
3.1.2 Hydrostatic Pressures
Hydrostatic pressures under free flow condition without energy dissipation arrangement
were observed along the left & right abutment, pier and divide wall of the floor at 2000
cumec, 1000 cumec, 500 cumec and 300 cumec river discharges. Observed pressures
were found mostly positive but at 25.0 m d/s in left of divide wall the negative pressure
was 0.45m. Hydrostatic pressures were also observed under gated condition maintaining
FRL at El. 2103.00m at different equally gate openings of 0.3m, 0.5m, 1.0m, 2.0m.
Observed pressures were found mostly positive but at some locations they were
negative within 10% of the corresponding heads. Reference of Table 4 & 5 of
Annexure-1 may be made to study of theses pressures.
3.1.3 Approach flow conditions
The approach flow conditions to the barrage were also observed by observing the
velocity distribution across each bay at the axis at 50% & 100% of SPF in free flow and
twelve bays operative conditions keeping the intake desander closed. It is seen from
these observations that approaching flow conditions to the barrage are quite non
uniform at various discharges. It is also seen from these observations that flow was
oblique from bay no. 5 to 1 and it was attacking at pier no. 4 to 1. A variation of 2.8m in
water levels at pier no. 4 (El.2094.8 m) and bay no. 4 (El.2092.0 m) was observed at
2000 cumec discharge under free flow condition. These observations indicate that the
concentration of flow in river upstream of barrage was along right bank while a back
flow zone still persisted from barrage to about 120 m upstream along left bank at all the
discharges under consideration.
The observations of IRI can be seen in Table VI & photograph no. 5 & 8 of their
T.M.No. 84 report (Annexure-1).

Lata Tapovan HEP
A Report Model Studies of Lata Tapovan HEP 8/9
March 2015 July 2010
3.1.4 Adequacy of upstream and downstream approach length:
Velocity observations indicate that the concentration of flow in river upstream of
barrage was along right bank while a back flow zone still persisted from barrage to
about 120 m upstream along left abutment at all discharges in gated conditions also at
FRL. IRI observation can be seen in drawing 10 to 14 of T.M.No. 84 report (Annexure-
1).
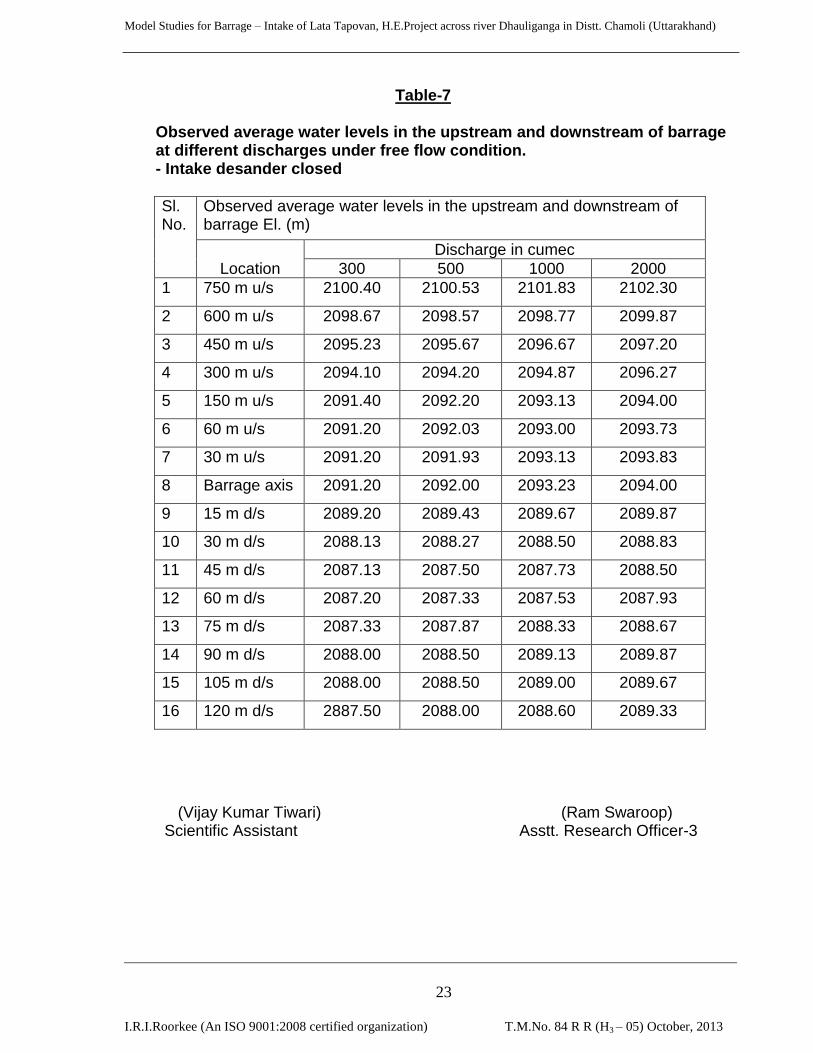
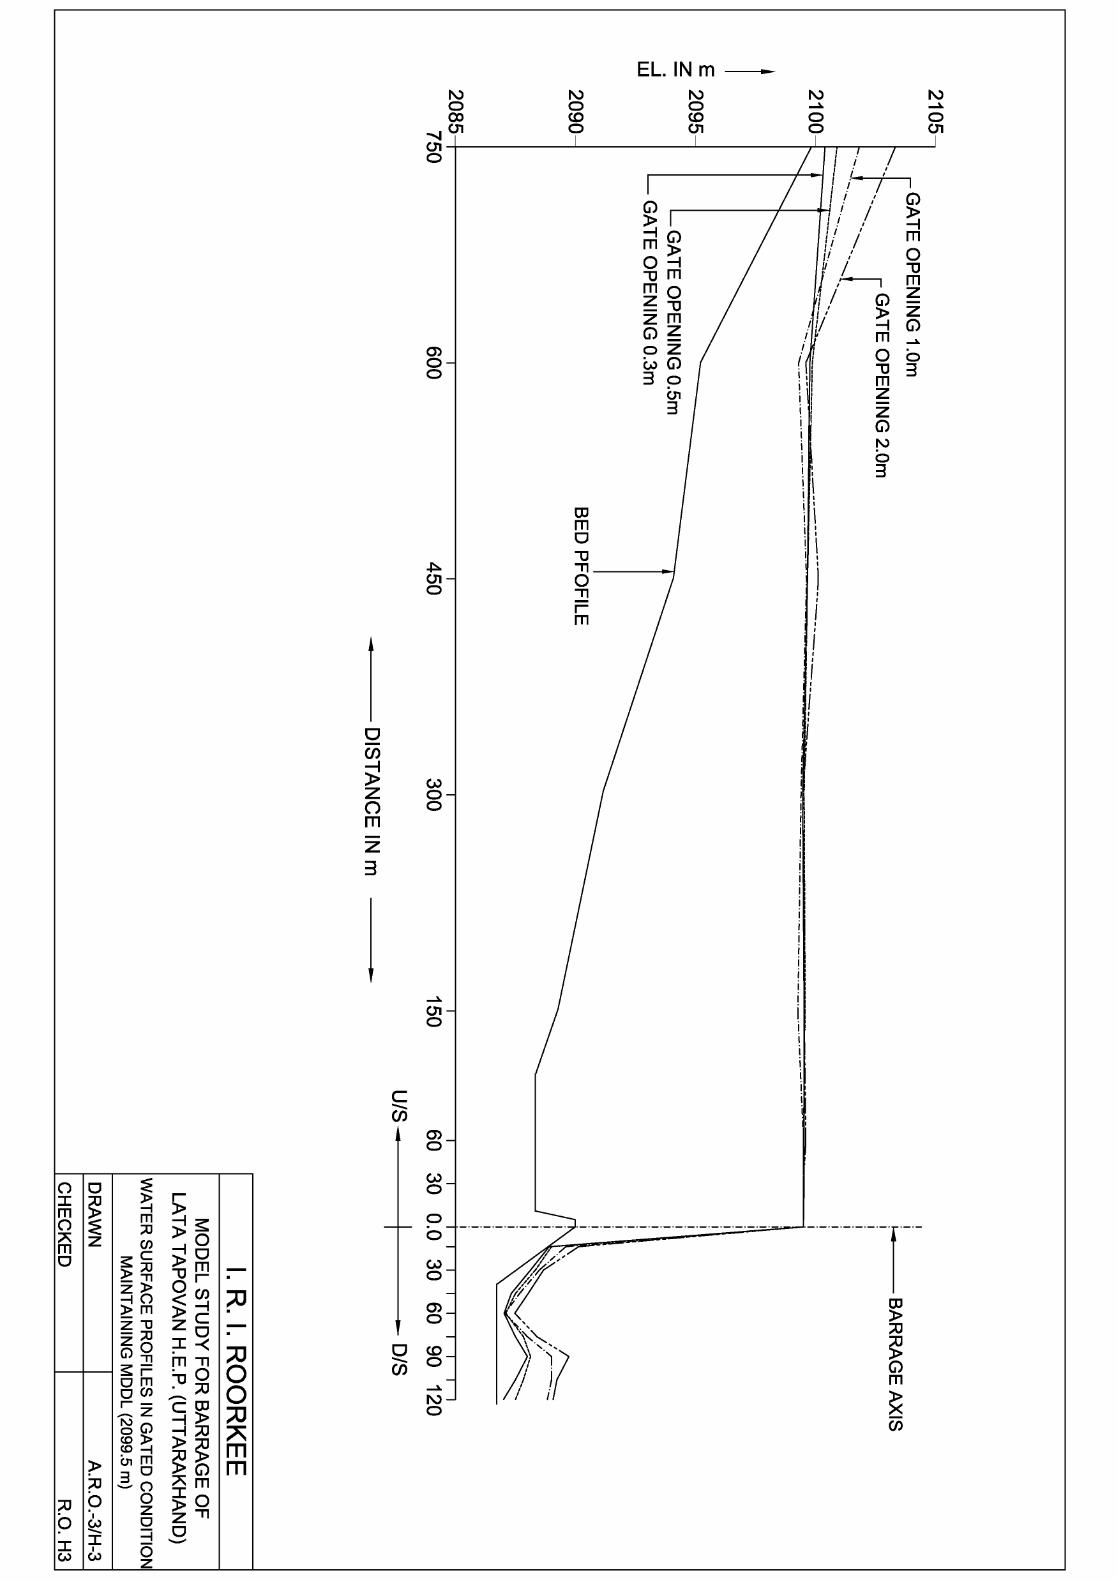
3.1.5 Water surface profile at upstream and downstream of barrage.
The observed water surface profile were normal as shown in table 7, 8 & 9 and plotted
in Fig 15 to 18 and photo 9 to 12 (Annexure-1).
3.1.6 Energy dissipation arrangement.
Since the barrage is in mountainous reach and would have supercritical flow, therefore
no conventional energy dissipation arrangement were provided by EDRC. However
scour observations are only qualitative & is not expected at site.
To ameliorate the flow and scour condition, L&T provided an alternate Layout of
barrage (with smoothening of protruding rockledge on left bank). L&T also provided
improvement in energy dissipation arrangement by including a bucket structure after
downstream of apron. These modifications are shown in plates 3 (a) and 3 (b).
The observations of flow conditions etc are shown in March 2015 report (Annexure-2)
of IRI in Table 1 to 7 of IRI has given information.
3.2 Intake
The following studies were required to be conducted by IRI.
Hydraulic profile of intake shall be finalized.
Check for adequacy of water seal at HRT Intake & formation of vortex.
Lata Tapovan HEP
A Report Model Studies of Lata Tapovan HEP 9/9
March 2015 July 2010
The studies carried out by IRI are contains in these report T.M.No. 84 (Annexure-1).
3.2.1 Intake capacity
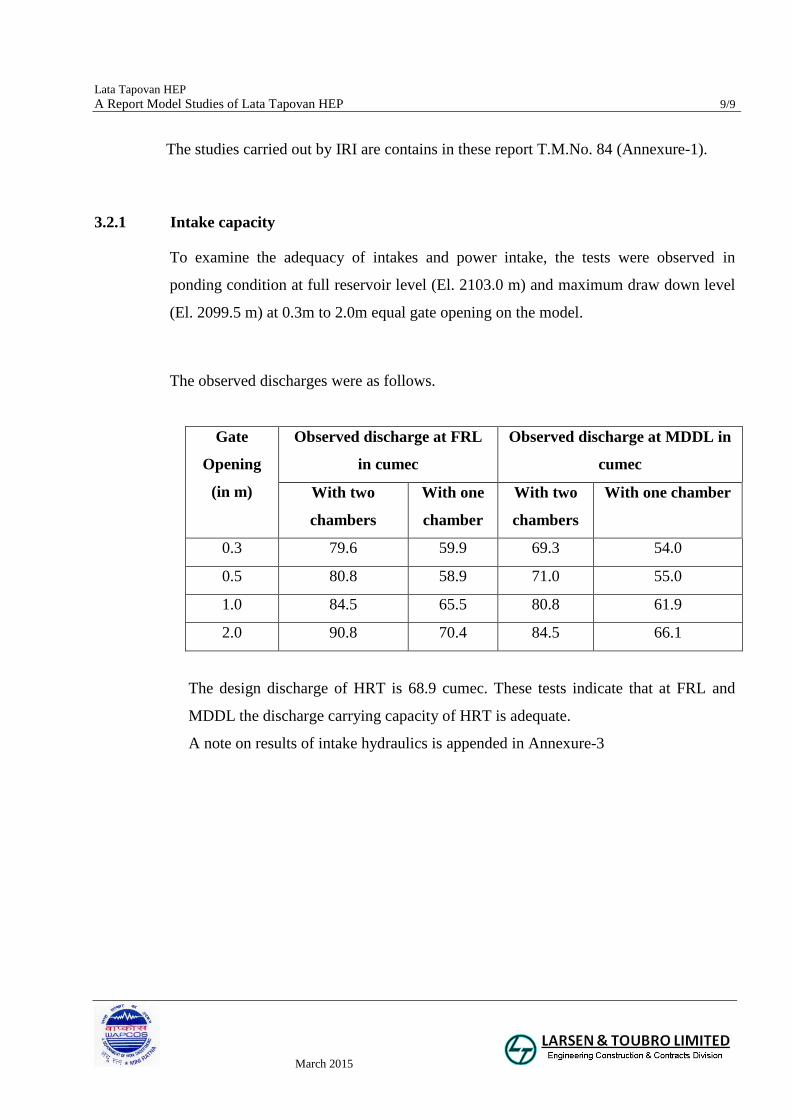
To examine the adequacy of intakes and power intake, the tests were observed in
ponding condition at full reservoir level (El. 2103.0 m) and maximum draw down level
(El. 2099.5 m) at 0.3m to 2.0m equal gate opening on the model.
The observed discharges were as follows.
Gate
Opening
(in m)
Observed discharge at FRL
in cumec
Observed discharge at MDDL in
cumec
With two
chambers
With one
chamber
With two
chambers
With one chamber
0.3 79.6 59.9 69.3 54.0
0.5 80.8 58.9 71.0 55.0
1.0 84.5 65.5 80.8 61.9
2.0 90.8 70.4 84.5 66.1
The design discharge of HRT is 68.9 cumec. These tests indicate that at FRL and
MDDL the discharge carrying capacity of HRT is adequate.
A note on results of intake hydraulics is appended in Annexure-3

Annexure-1:
T.M. No. 84 RR (H3-05)
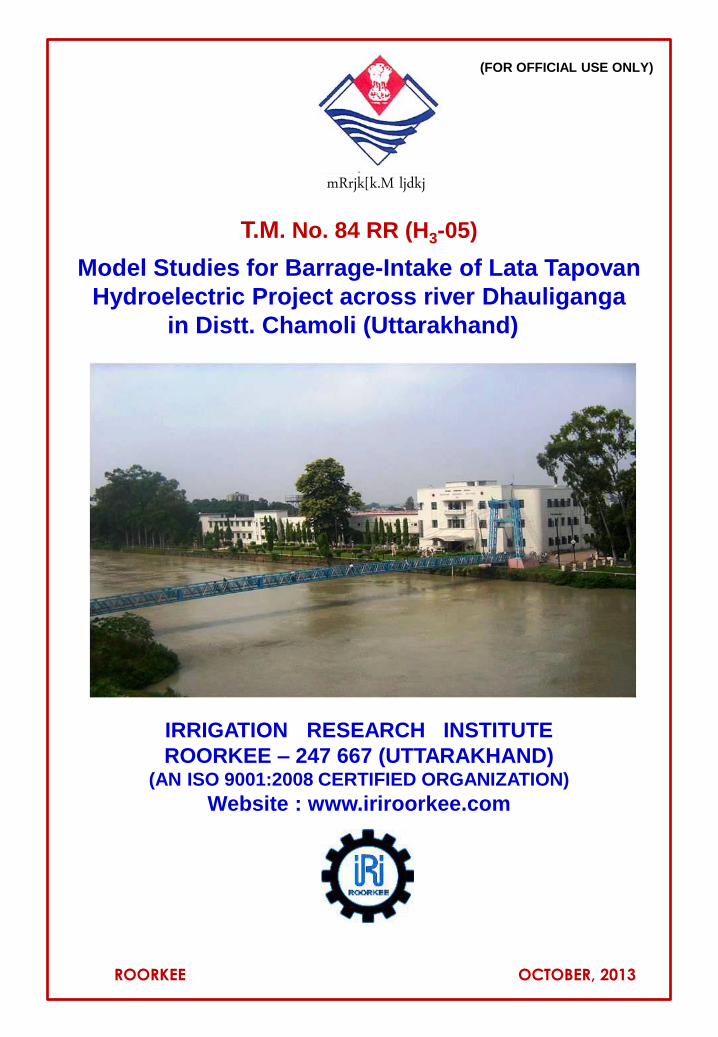
IRRIGATION RESEARCH INSTITUTE
ROORKEE – 247 667 (UTTARAKHAND) (AN ISO 9001:2008 CERTIFIED ORGANIZATION)
Website : www.iriroorkee.com
(FOR OFFICIAL USE ONLY)
ROORKEE OCTOBER, 2013
Model Studies for Barrage-Intake of Lata Tapovan
Hydroelectric Project across river Dhauliganga
in Distt. Chamoli (Uttarakhand)
mRrjk[k.M ljdkj
IRRIGATION RESEARCH INSTITUTEROORKEE-247 667 (UTTARAKHAND)
(AN ISO 9001:2008 CERTIFIED ORGANIZATION)
Technical Memorandum
No. 84-RR (H3-05)
CHIEF ENGINEER & DIRECTOR : A.K.DINKAR PH : 01332-257501
FAX : 01332-262487
SUPERINTENDING ENGINEER : N.K.SHARMA PH : 01332-257505
FAX : 01332-262487
TITLE OF THE REPORT : Month of issue :10/2013
Model Studies for Barrage-Intake of Lata No. of Pages : 55
Tapovan Hydroelectric Project across river No. of Tables : 11
Dhauliganga in Distt. Chamoli (Uttarakhand) No. of Photographs : 16
No. of Drawings : 19
PROJECT SPONSORING AUTHORITY :Sponsor’s Reference:
DGM –Hydro Design, L&T Ltd,Faridabad vide his letter no. L& T/ FBD-EDRC/Lata, dated 18.02.2012
DGM- Hydro Design,
Larsen & Toubro Ltd.
Faridabad (Haryana) CODE : 3342
RESEARCH PERSONNEL :
N.K.Sharma Research Officer
Ram Swaroop Asstt. Research Officer
Vijay Kumar Tiwari Scientific Assistant
Pushkar Singh Rawat Scientific Assistant
Prem Ballave Bhatt Model Assistant
SYNOPSIS:
The Model studies were conducted for barrage-intake of Lata Tapovan hydroelectric project
proposed to be constructed across river Dhauliganga in Distt. Chamoli (Uttarakhand) on a
geometrically similar model built to the scale 1:30. Observations of the hydraulic test results
indicated that the proposed clear water way of 132.0 m with barrage crest at El. 2090.0 m &
undersluice crest at El. 2088.0 m was found to be adequate to pass the design discharge of 2000
cumec at El. 2093.83 m with all bays fully opened, while only eight bays are sufficient to pass the
2000 cumec discharge at El. 2096.5 m. The design discharge of HRT is 68.9 cumec. At FRL and
MDDL the discharge carrying capacity of HRT is adequate. But the discharge carrying capacity of
intakes at FRL is adequate, while at MDDL it is 87 % and 90 % of design discharge 79.25 cumec
with two chambers at 0.3m and 0.5m gate opening respectively.
KEY WORD : Water way, Discharging Capacity, Velocity, Rating Curve etc.
SUBJECT : Barrage-Intake
PROJECT : Barrage of Lata Tapovan Hydroelectric Project, Distt. Chamoli (U.K.)
Approved by Recommended by Submitted by
(N.K.Sharma) ( N.K.Sharma) (Ram Swaroop)
Superintending Engineer Research Officer Asstt. Res. Officer
Model Studies for Barrage – Intake of Lata Tapovan, H.E.Project across river Dhauliganga in Distt. Chamoli (Uttarakhand)
I.R.I.Roorkee (An ISO 9001:2008 certified organization) T.M.No. 84 R R (H3 – 05) October, 2013
1
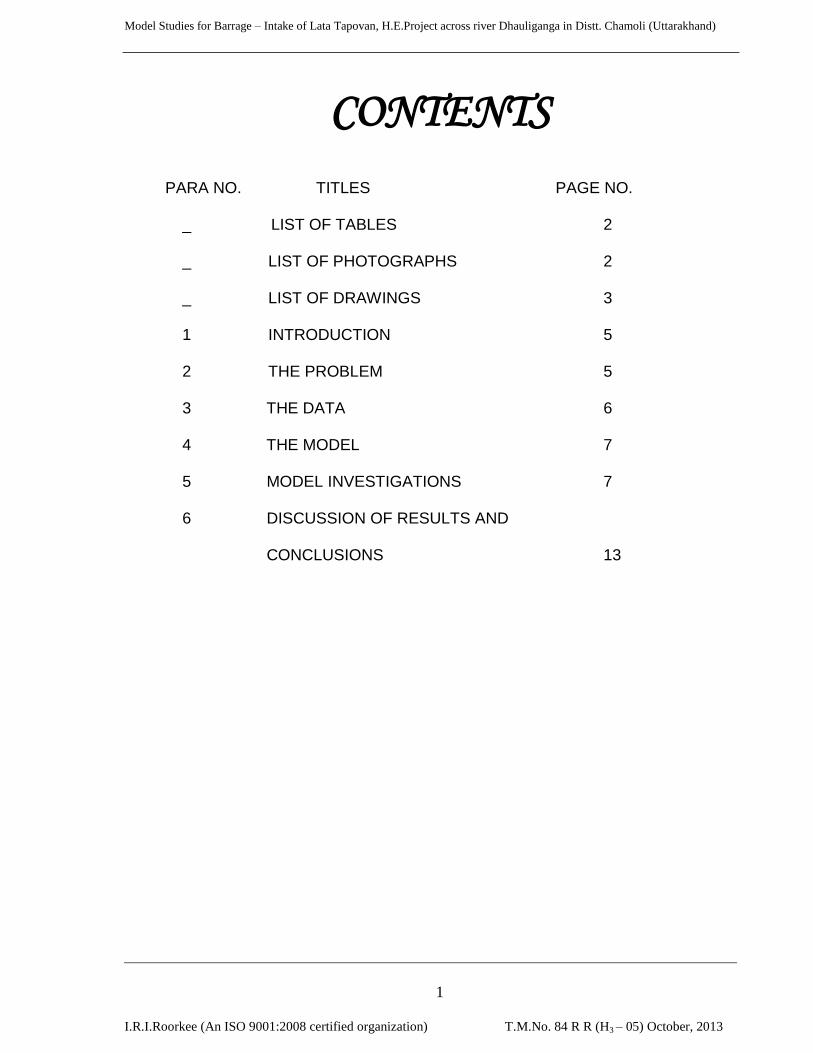
CONTENTS
PARA NO. TITLES PAGE NO.
_ LIST OF TABLES 2
_ LIST OF PHOTOGRAPHS 2
_ LIST OF DRAWINGS 3
1 INTRODUCTION 5
2 THE PROBLEM 5
3 THE DATA 6
4 THE MODEL 7
5 MODEL INVESTIGATIONS 7
6 DISCUSSION OF RESULTS AND
CONCLUSIONS 13
Model Studies for Barrage – Intake of Lata Tapovan, H.E.Project across river Dhauliganga in Distt. Chamoli (Uttarakhand)
I.R.I.Roorkee (An ISO 9001:2008 certified organization) T.M.No. 84 R R (H3 – 05) October, 2013
2
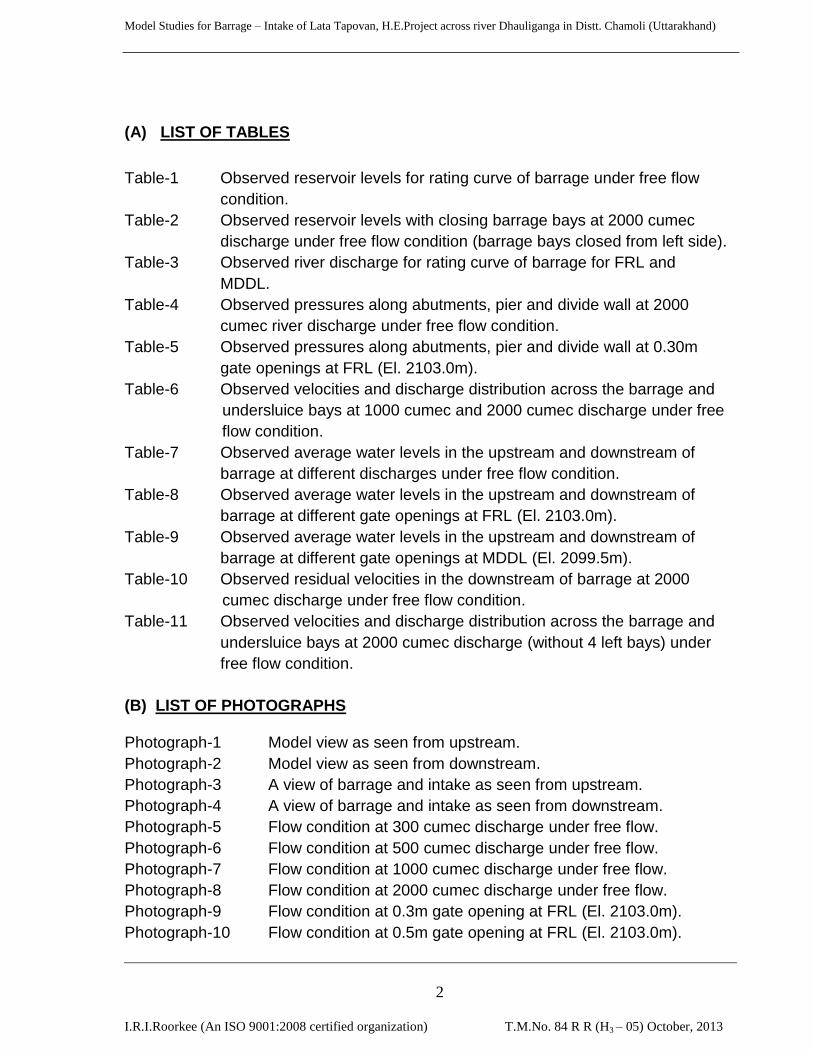
(A) LIST OF TABLES
Table-1 Observed reservoir levels for rating curve of barrage under free flow
condition.
Table-2 Observed reservoir levels with closing barrage bays at 2000 cumec
discharge under free flow condition (barrage bays closed from left side).
Table-3 Observed river discharge for rating curve of barrage for FRL and
MDDL.
Table-4 Observed pressures along abutments, pier and divide wall at 2000
cumec river discharge under free flow condition.
Table-5 Observed pressures along abutments, pier and divide wall at 0.30m
gate openings at FRL (El. 2103.0m).
Table-6 Observed velocities and discharge distribution across the barrage and
undersluice bays at 1000 cumec and 2000 cumec discharge under free
flow condition.
Table-7 Observed average water levels in the upstream and downstream of
barrage at different discharges under free flow condition.
Table-8 Observed average water levels in the upstream and downstream of
barrage at different gate openings at FRL (El. 2103.0m).
Table-9 Observed average water levels in the upstream and downstream of
barrage at different gate openings at MDDL (El. 2099.5m).
Table-10 Observed residual velocities in the downstream of barrage at 2000
cumec discharge under free flow condition.
Table-11 Observed velocities and discharge distribution across the barrage and
undersluice bays at 2000 cumec discharge (without 4 left bays) under
free flow condition.
(B) LIST OF PHOTOGRAPHS Photograph-1 Model view as seen from upstream.
Photograph-2 Model view as seen from downstream.
Photograph-3 A view of barrage and intake as seen from upstream.
Photograph-4 A view of barrage and intake as seen from downstream.
Photograph-5 Flow condition at 300 cumec discharge under free flow.
Photograph-6 Flow condition at 500 cumec discharge under free flow.
Photograph-7 Flow condition at 1000 cumec discharge under free flow.
Photograph-8 Flow condition at 2000 cumec discharge under free flow.
Photograph-9 Flow condition at 0.3m gate opening at FRL (El. 2103.0m).
Photograph-10 Flow condition at 0.5m gate opening at FRL (El. 2103.0m).

Model Studies for Barrage – Intake of Lata Tapovan, H.E.Project across river Dhauliganga in Distt. Chamoli (Uttarakhand)
I.R.I.Roorkee (An ISO 9001:2008 certified organization) T.M.No. 84 R R (H3 – 05) October, 2013
3
Photograph-11 Flow condition at 1.0m gate opening at FRL (El. 2103.0m).
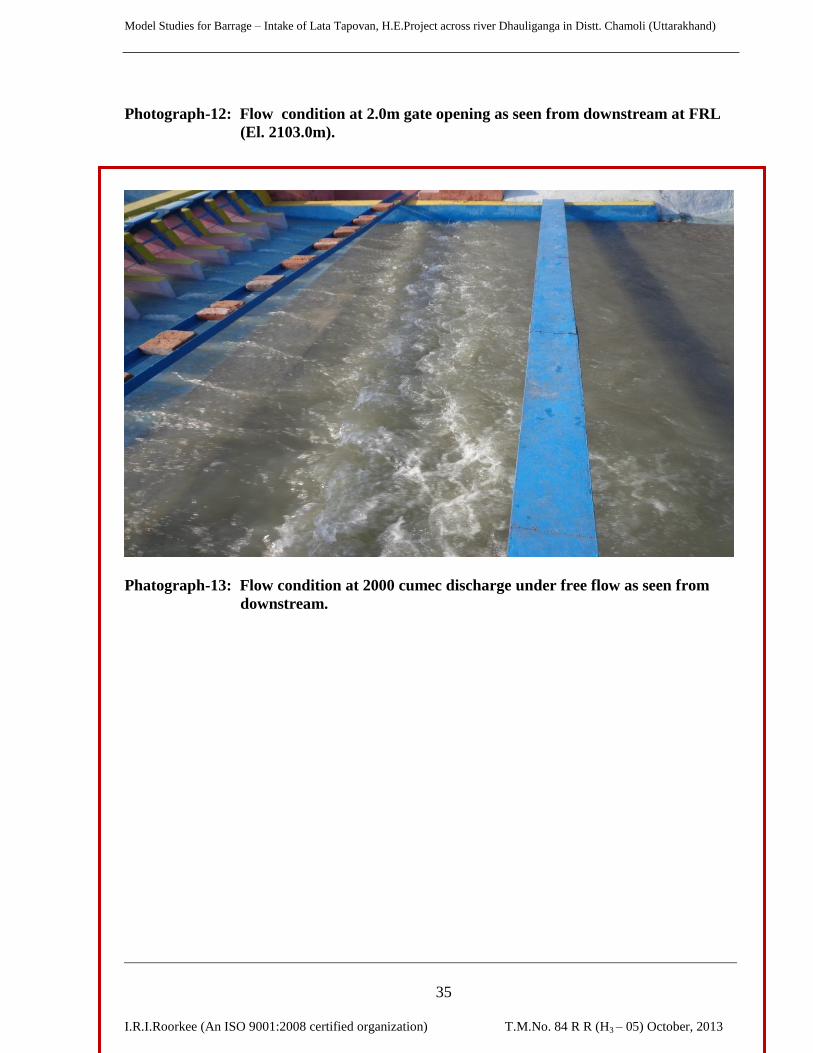
Photograph-12 Flow condition at 2.0m gate opening at FRL (El. 2103.0m).
Photograph-13 Flow condition at 2000 cumec discharge under free flow as
seen from downstream.
Photograph-14 A view of scoured bed profile in downstream of barrage after
running 2000 cumec discharge under free flow condition.
Photograph-15 Flow condition at 2000 cumec discharge (without 4 left bays)
under free flow as seen from upstream.
Photograph-16 Flow condition at 2000 cumec discharge (without 4 left bays)
under free flow as seen from downstream.
(C) LIST OF DRAWINGS Drg. -1 Index map of Lata Tapovan H.E.Project.
Drg. -2 Layout details of the comprehensive model.
Drg. -3 Theoretical and observed Gauge – Discharge (G-Q) curve for
proving of model.
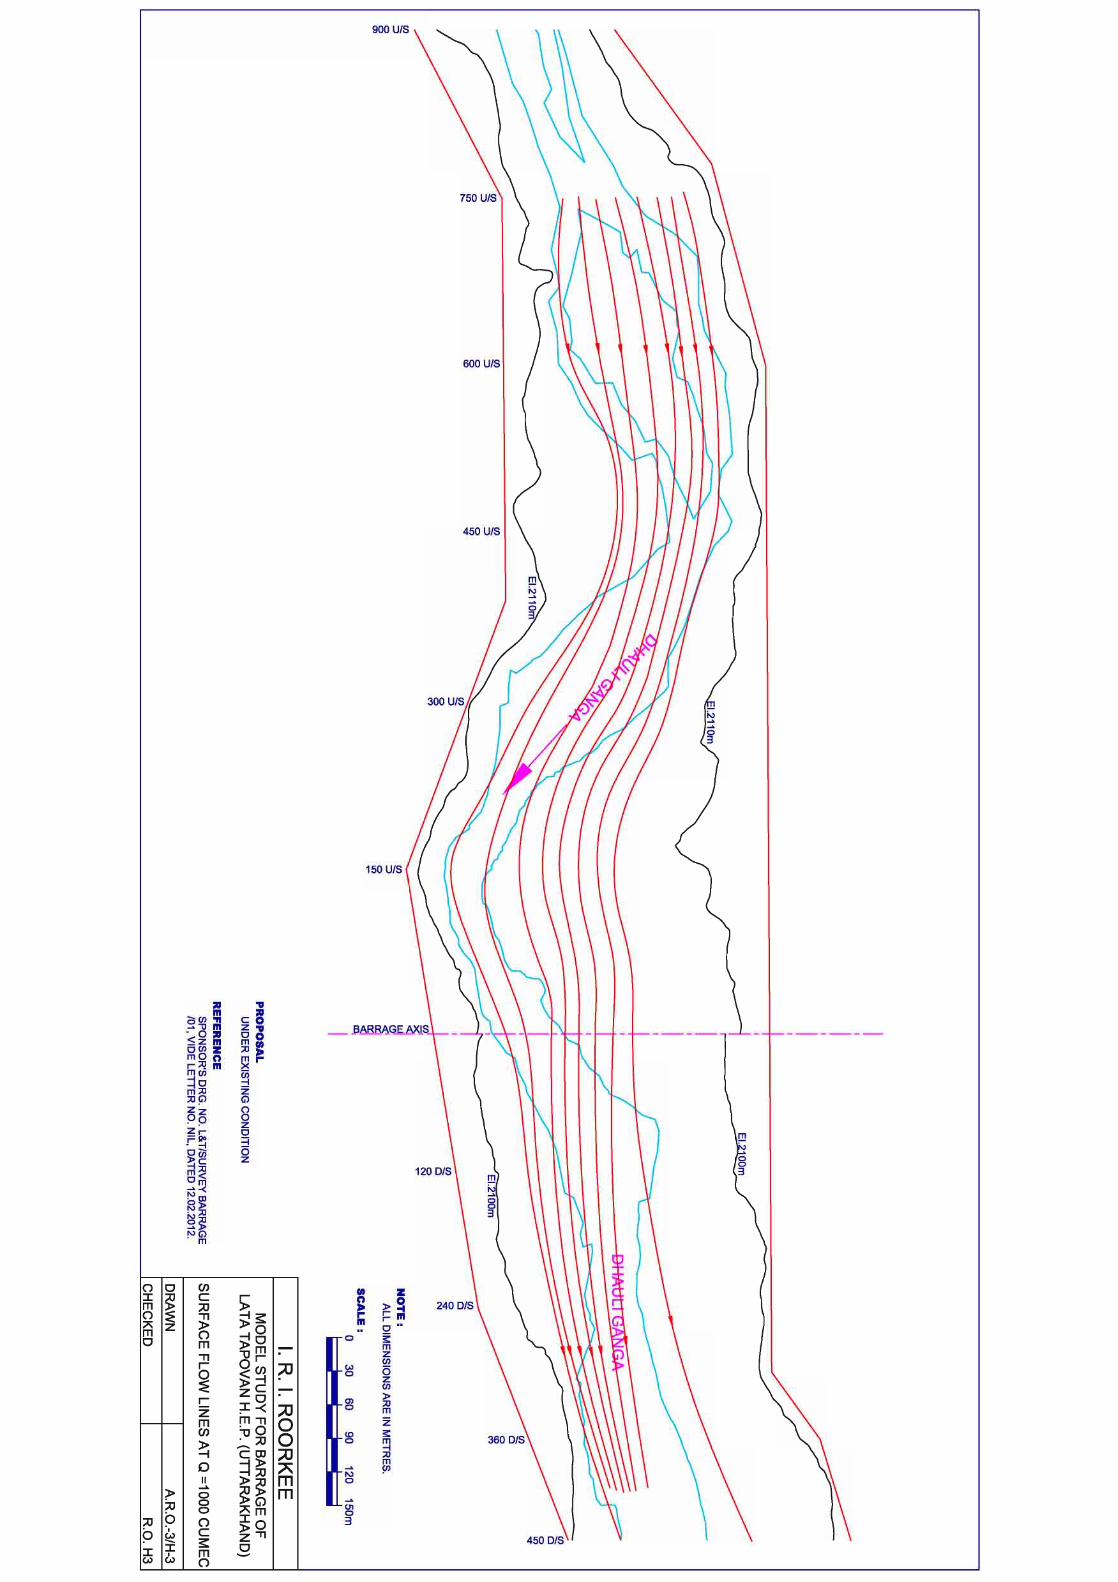
Drg. -4 Surface flow lines observed at 1000 cumec river discharge under
existing condition.
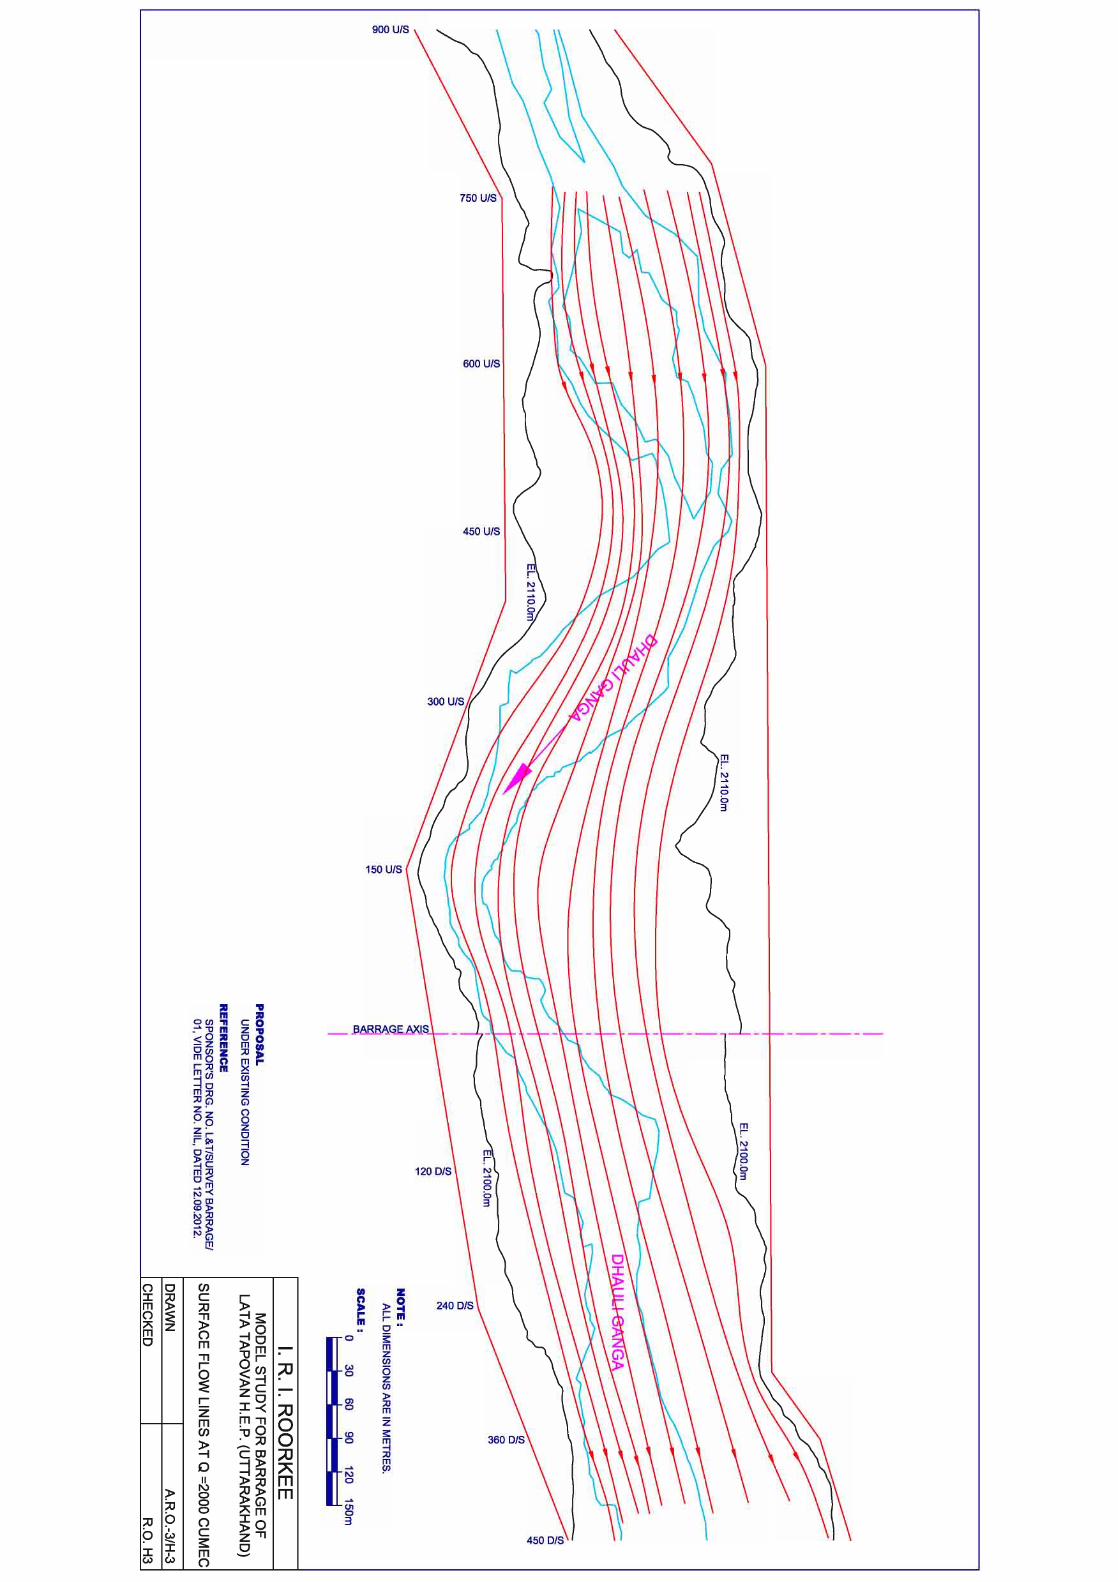
Drg. -5 Surface flow lines observed at 2000 cumec river discharge under
existing condition.
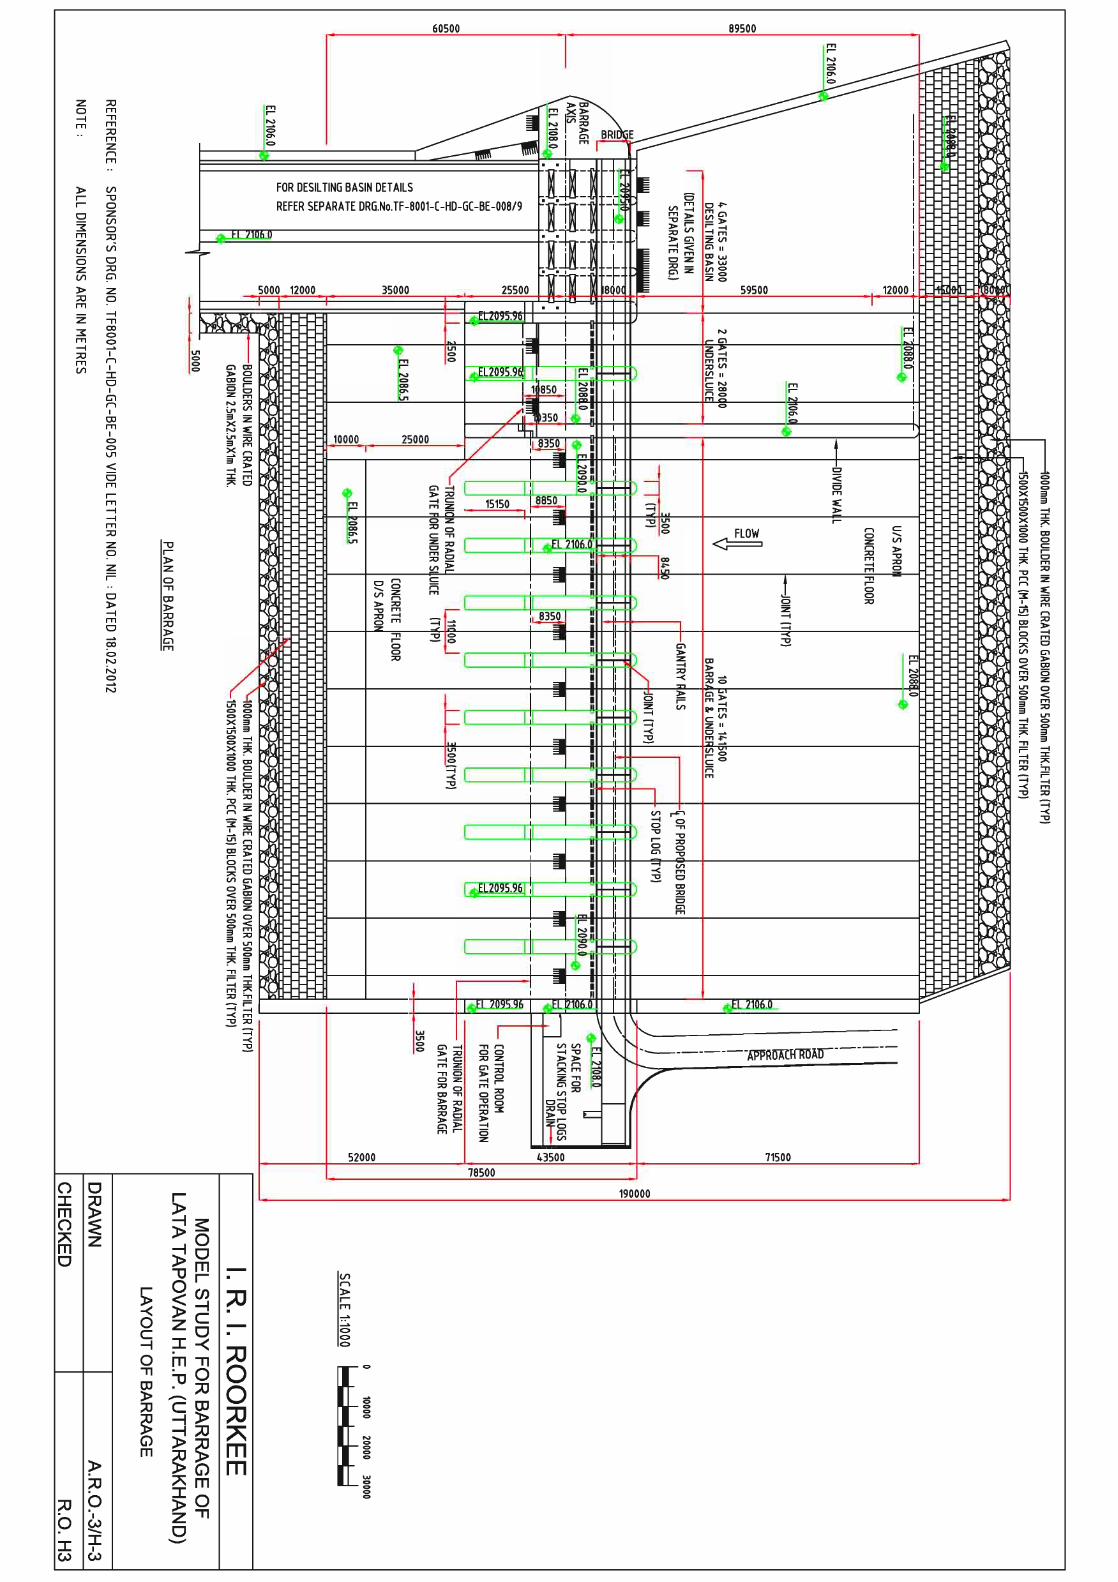
Drg. -6 Layout plan of barrage.
Drg. -7 Discharge rating curve of the barrage under free flow condition.
Drg. -8 Discharge rating curve of the barrage under gated condition.
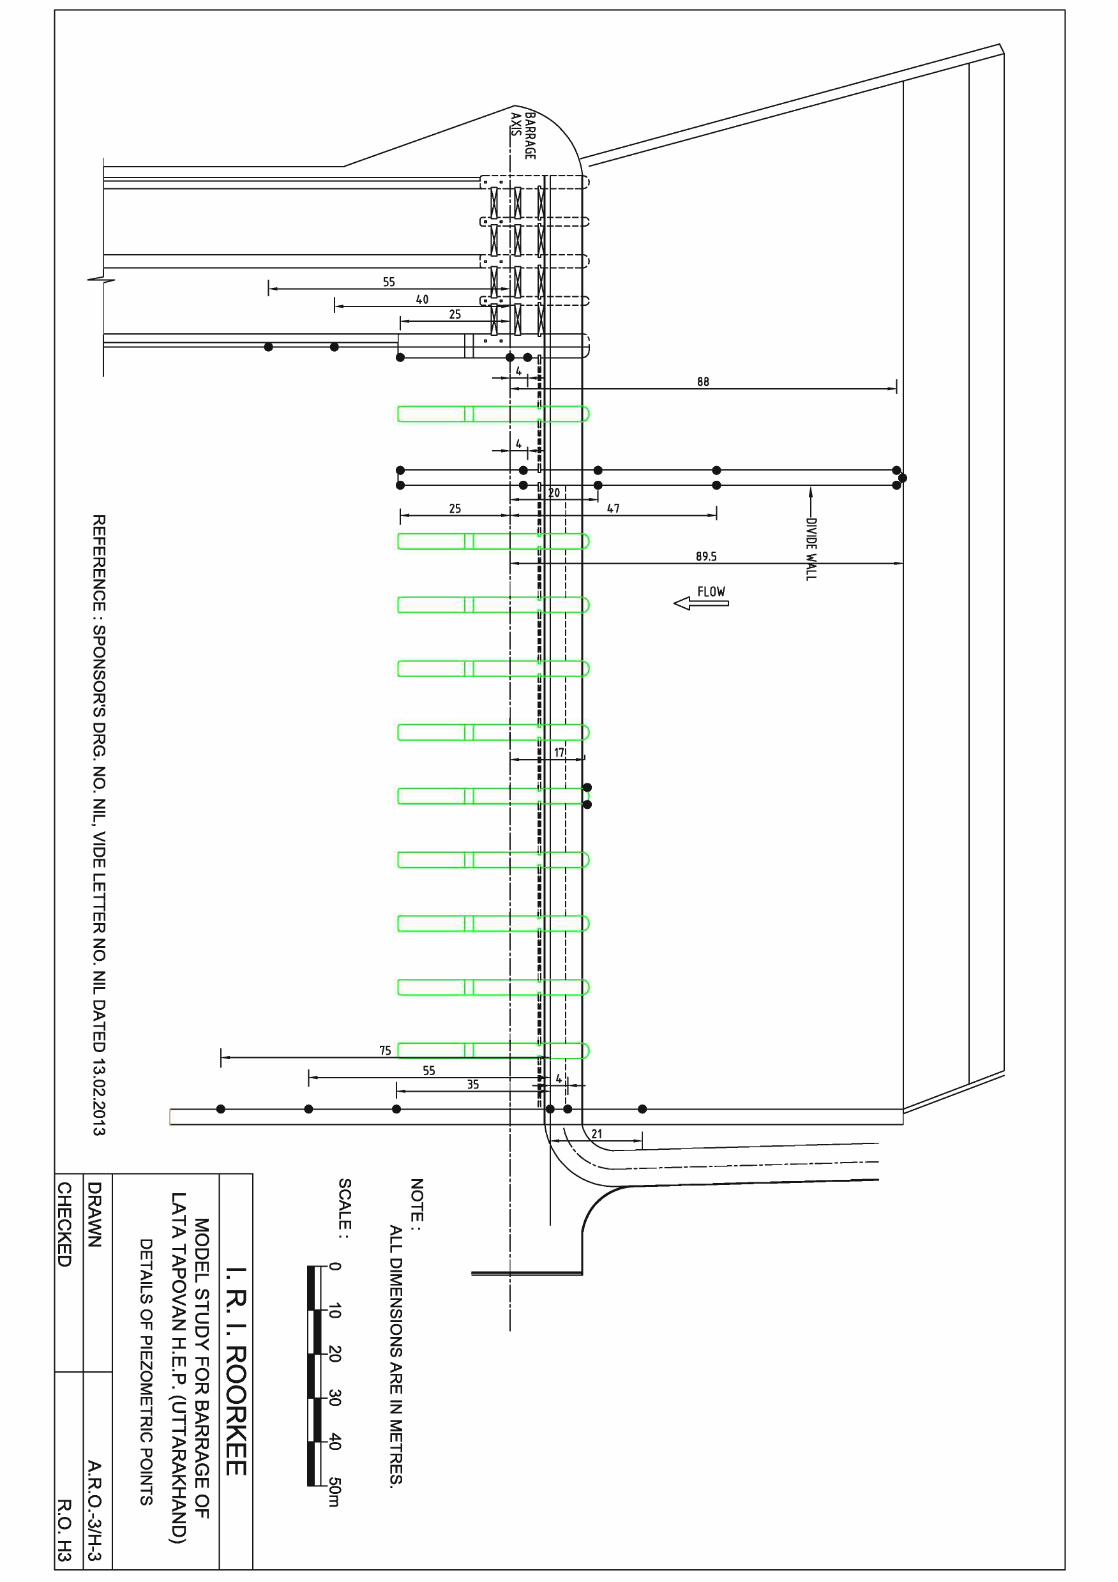
Drg. -9 Locations of piezometric points.
Drg. -10 Observed velocity pattern in upstream and downstream of barrage
at 300 cumec discharge under free flow condition.
Drg. -11 Observed velocity pattern in upstream and downstream of barrage
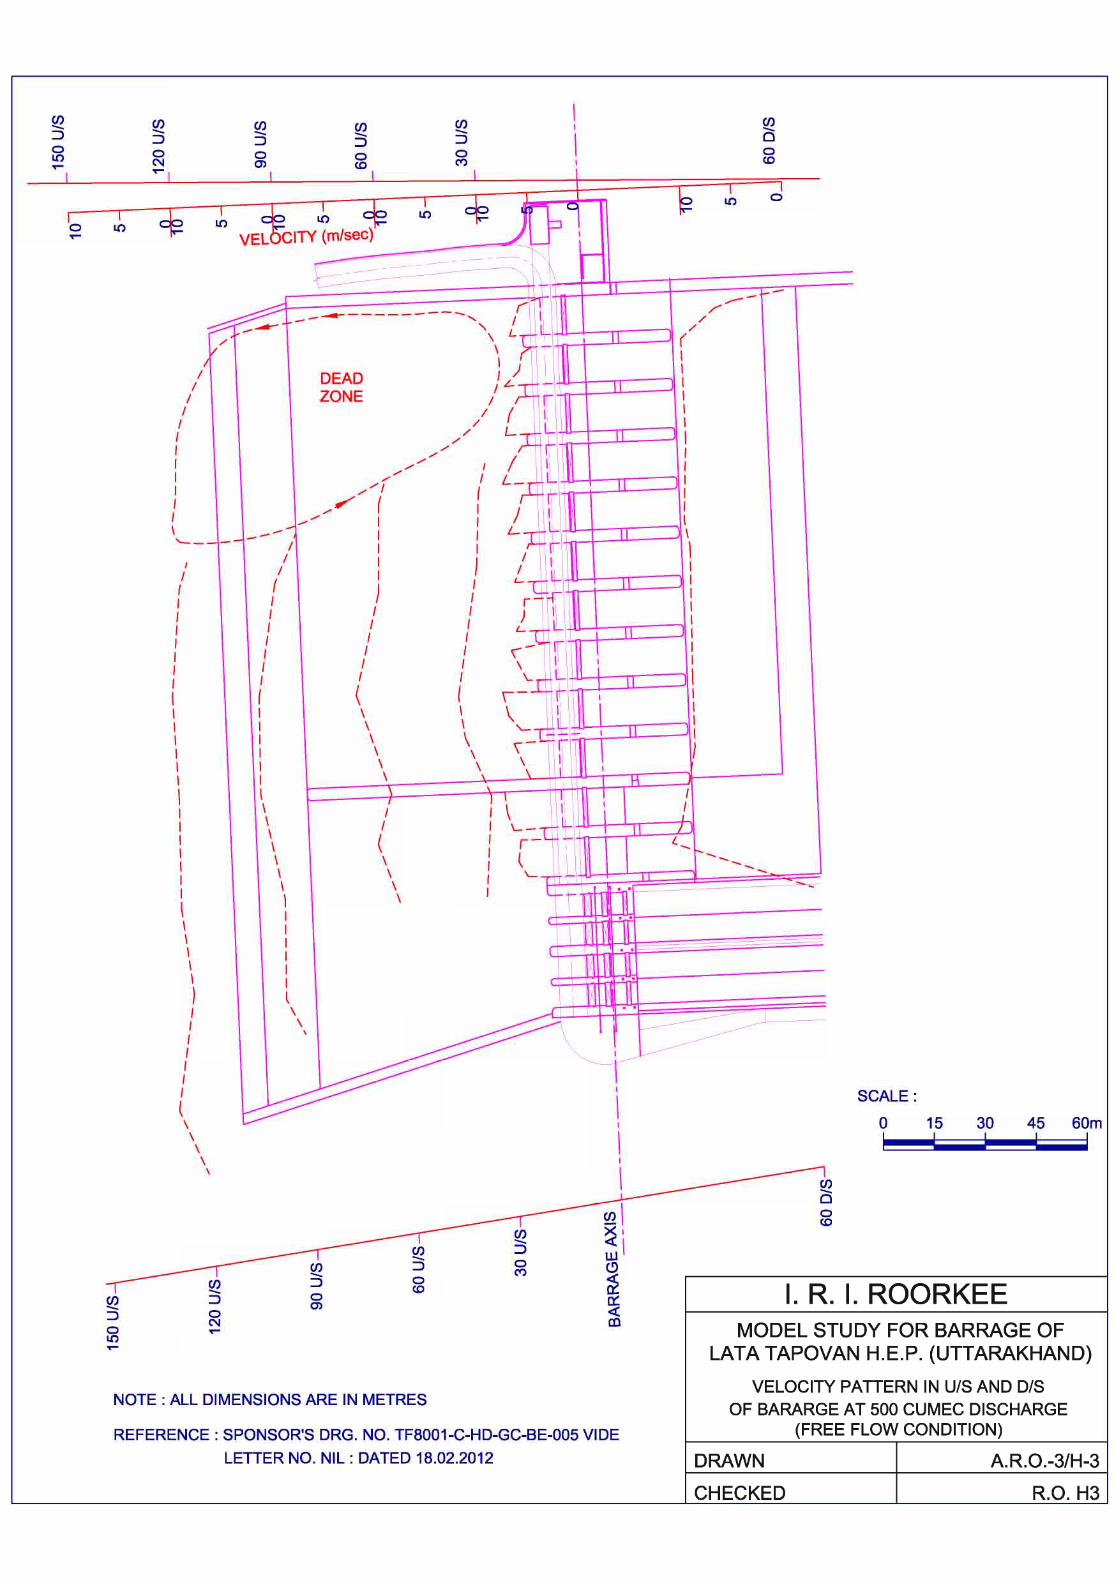
at 500 cumec discharge under free flow condition.
Drg. -12 Observed velocity pattern in upstream and downstream of barrage
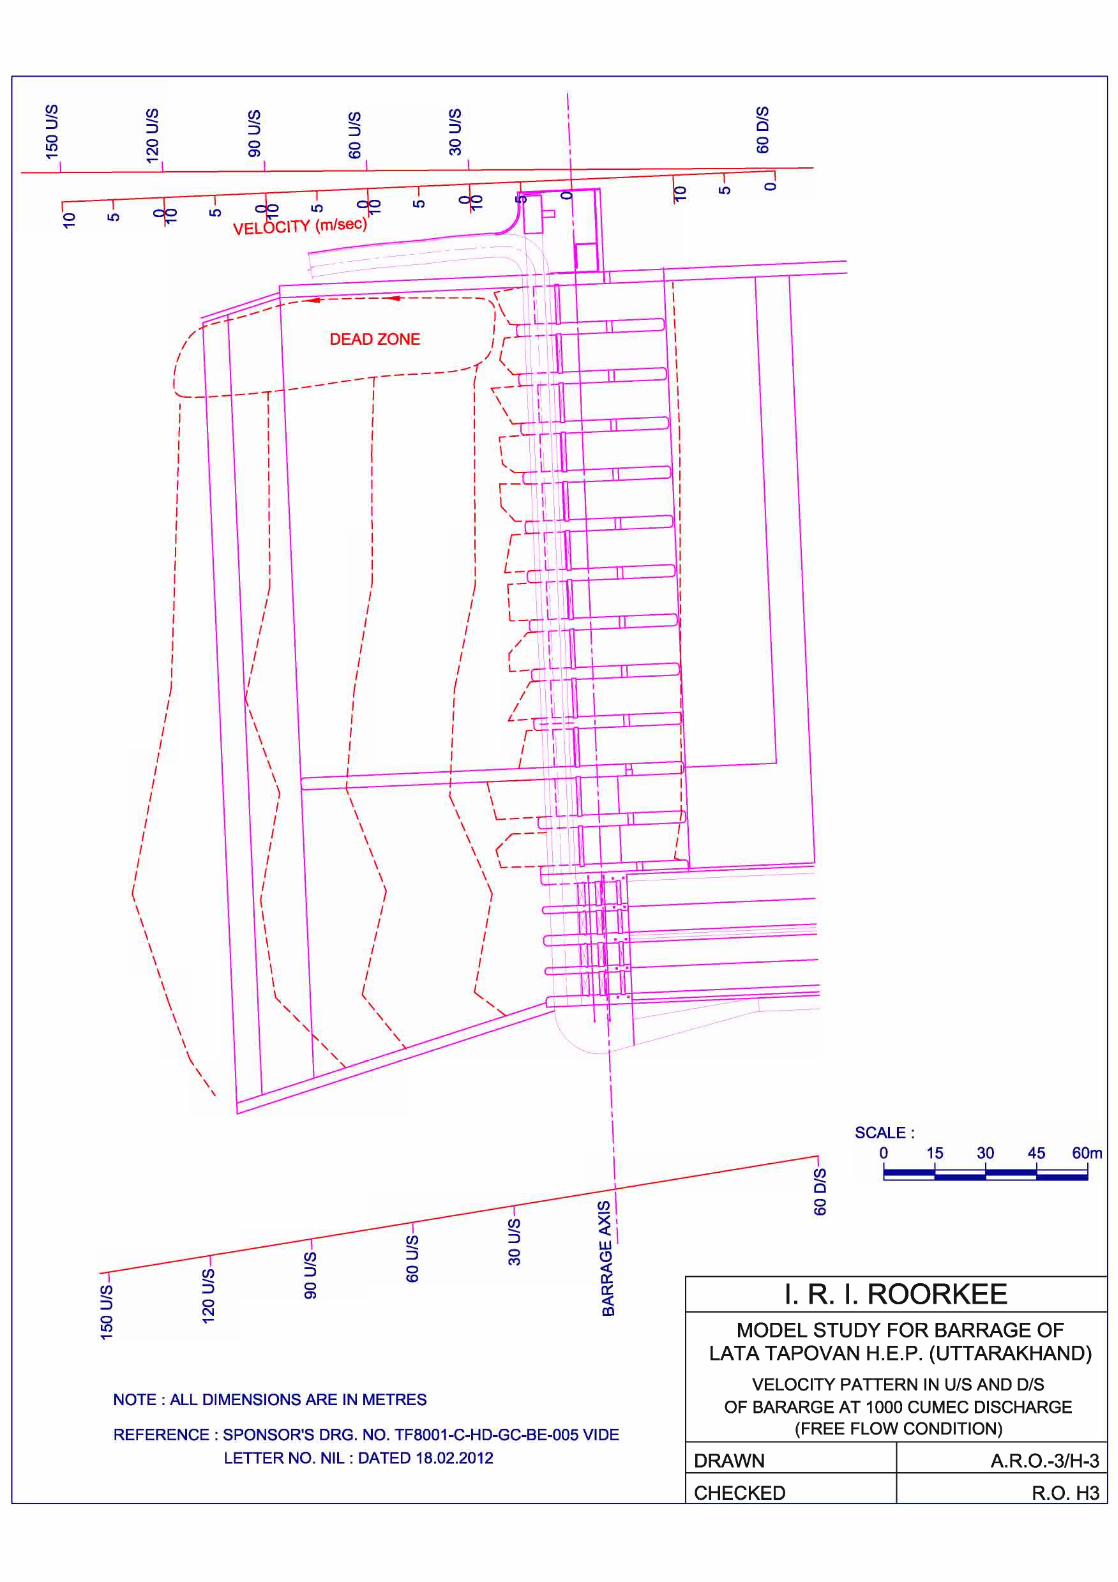
At 1000 cumec discharge under free flow condition.
Drg. -13 Observed velocity pattern in upstream and downstream of barrage
at 2000 cumec discharge under free flow condition.
Drg. -14 Observed velocity pattern in upstream and downstream of barrage
at 0.3m,0.5m,1.0m and 2.0m equal gate openings at FRL.
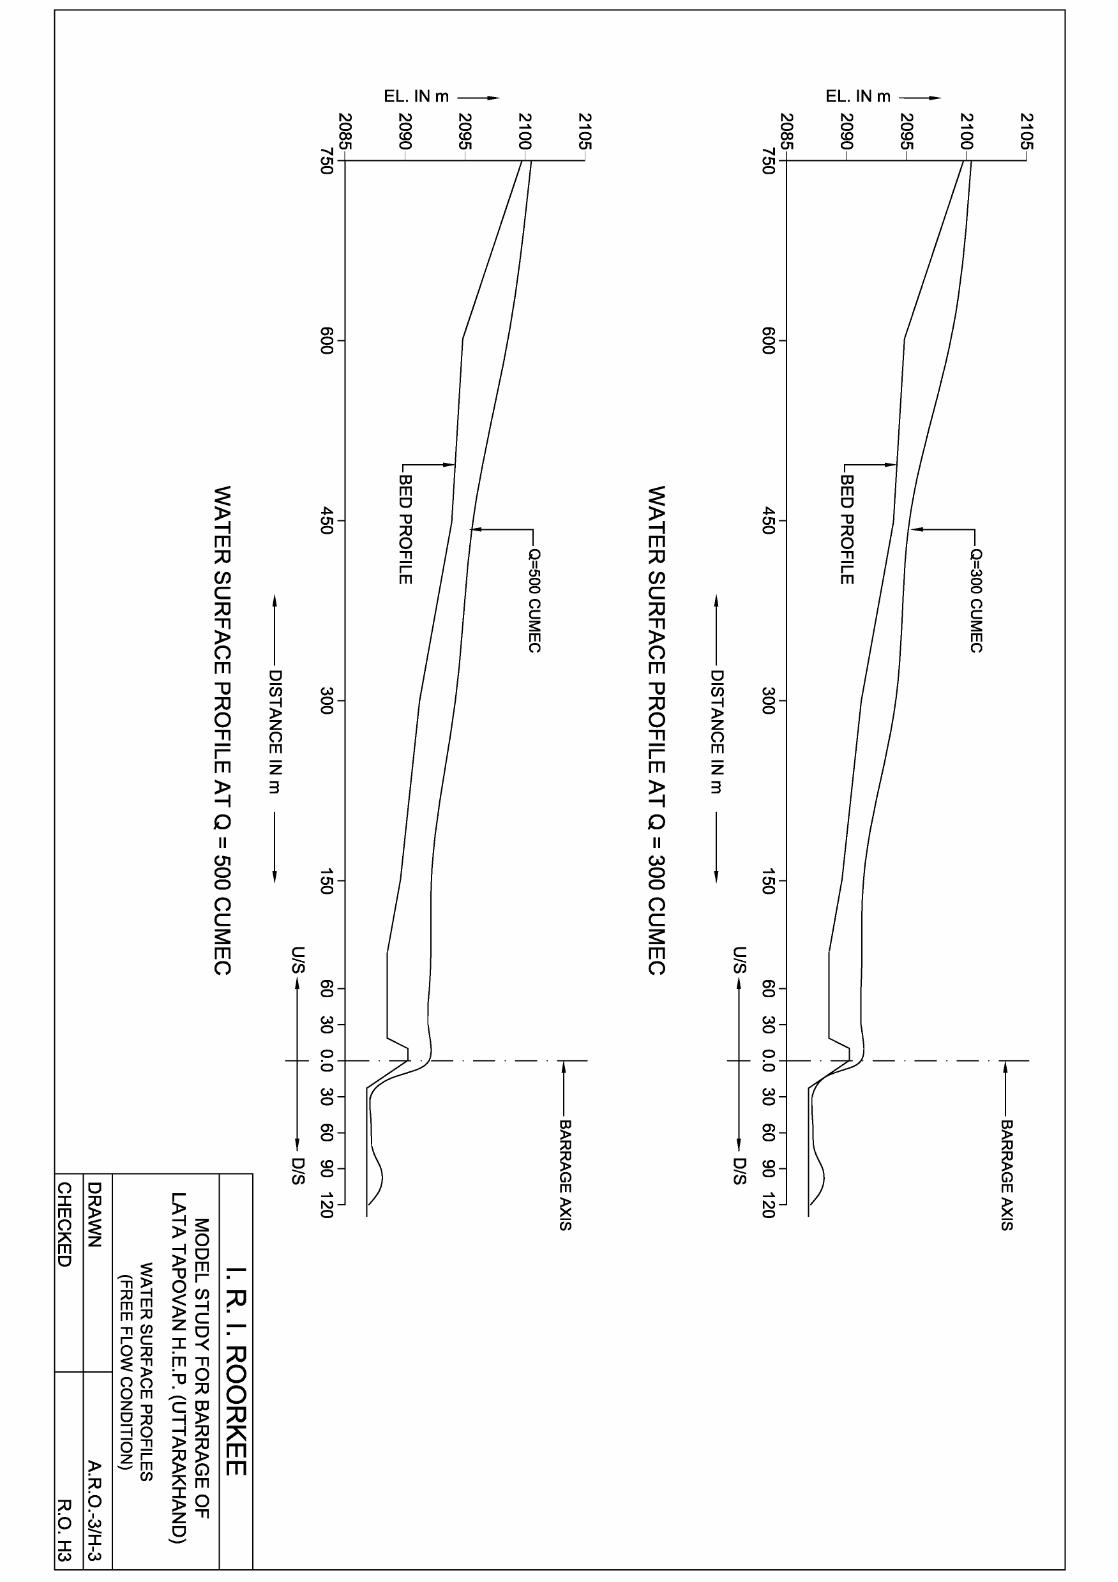
Drg. -15 Water surface profile under free flow condition at 300 and 500
cumec discharge.
Drg. -16 Water surface profile under free flow condition at 1000 and 2000
cumec discharge.
Drg. -17 Water surface profile under gated condition at 0.3m, 0.5m, 1.0m
and 2.0m equal gate openings at FRL (EL. 2103.0m).
Model Studies for Barrage – Intake of Lata Tapovan, H.E.Project across river Dhauliganga in Distt. Chamoli (Uttarakhand)
I.R.I.Roorkee (An ISO 9001:2008 certified organization) T.M.No. 84 R R (H3 – 05) October, 2013
4
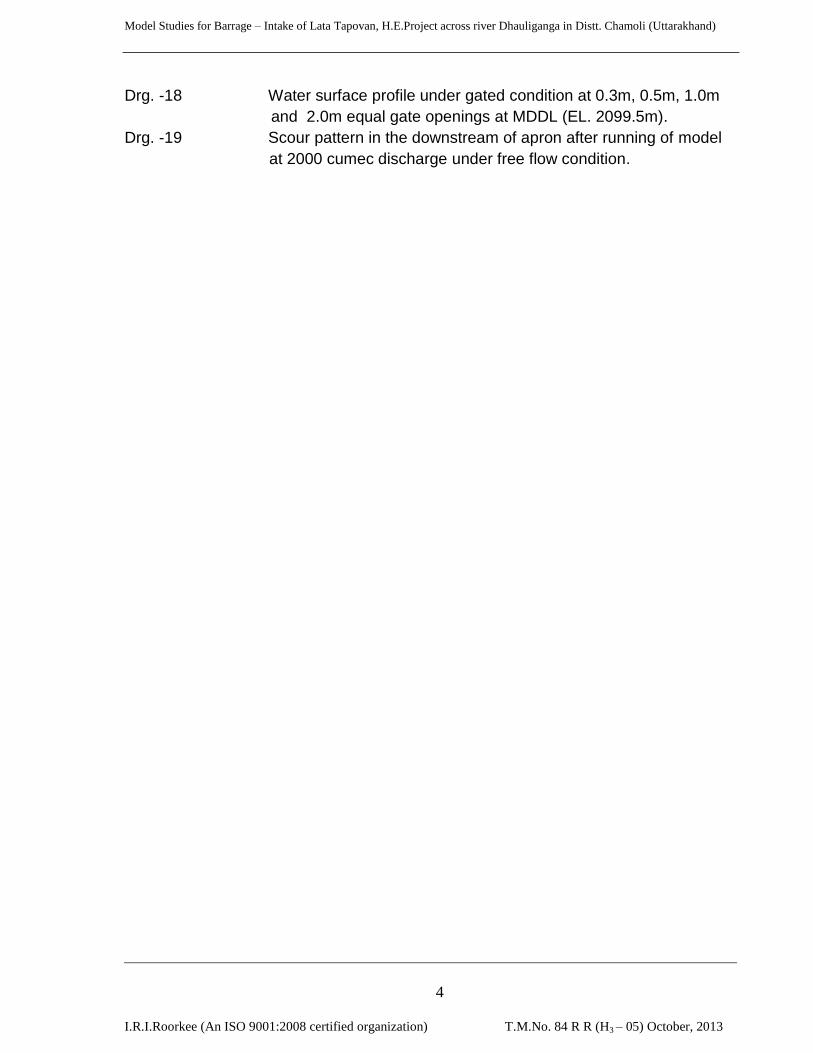
Drg. -18 Water surface profile under gated condition at 0.3m, 0.5m, 1.0m
and 2.0m equal gate openings at MDDL (EL. 2099.5m).
Drg. -19 Scour pattern in the downstream of apron after running of model
at 2000 cumec discharge under free flow condition.
Model Studies for Barrage – Intake of Lata Tapovan, H.E.Project across river Dhauliganga in Distt. Chamoli (Uttarakhand)
I.R.I.Roorkee (An ISO 9001:2008 certified organization) T.M.No. 84 R R (H3 – 05) October, 2013
5
REPORT
Model Studies for Barrage – Intake of Lata Tapovan, H.E.Project across river Dhauliganga in Distt. Chamoli (Uttarakhand)
I.R.I.Roorkee (An ISO 9001:2008 certified organization) T.M.No. 84 R R (H3 – 05) October, 2013
6
1.0 INTRODUCTION
Lata – Tapovan Hydro Electric Project is proposed to be constructed across
river Dhauliganga near Lata village in Joshimath Tehsil, District Chamoli in
Uttarakhand. The project site is located at a distance of about 250 km from
Rishikesh. The power house is situated near Tapovan village. River
Dhauliganga is an important tributary of holy river Ganga. The project will be
executed by Larsen & Toubro Ltd. and envisages the construction of 18.0 m
high barrage to divert 79.25 cumec river discharge for power generation and a
required discharge for sediment flushing, through a water conductor system
comprising an intake, desilting chamber, HRT intake, 7.315 km. long head race
tunnel, a surge shaft, a pressure shaft, a surface power house with installation
of 3 units of 57 MW each and a tail race channel, utilizing a gross head of
277.65 m available between barrage and tail race exit point. The barrage has
been designed for 2000 cumec discharge with full reservoir level (FRL) as
2103.0 m and maximum draw down level (MDDL) as 2099.5 m. The index map
of Lata - Tapovan H.E. Project is shown in Drg. - 1.
2.0 THE PROBLEM
Model studies for barrage and desilting basin of Lata – Tapovan H.E. Project
were referred to IRI Roorkee by DGM – Hydro Design, L&T Ltd, Faridabad vide
his letter no. L&T / FBD – EDRC / Lata, dated 18.02.2012. The scopes of
studies are as follows:
2.1 For barrage model
(a) Discharge carrying capacity of spillways.
(b) Adequacy of energy dissipation arrangement.
(c) Sediment flushing capacity of spillways
(d) Checking the adequacy of upstream and downstream apron length.
(e) Checking scour depth in the downstream of barrage.
2.2 For desanding basin model
(a) Efficiency of desanding basin for the removal of 0.20 mm particles as per
gradation curve.
Model Studies for Barrage – Intake of Lata Tapovan, H.E.Project across river Dhauliganga in Distt. Chamoli (Uttarakhand)
I.R.I.Roorkee (An ISO 9001:2008 certified organization) T.M.No. 84 R R (H3 – 05) October, 2013
7
(b) Overall efficiency of desanding basin.
(c) Checking the adequacy of upstream slope and transitions.
(d) Trap efficiency of desanding basin.
(e) Optimization of holes given in the slab.
(f) Flushing capacity of trench.
(g) Checking the adequacy of intakes.
This report deals only with model studies regarding barrage model and
studies have been done for point ‘a’ to ‘e’ except point ‘c’.
2.3 Hydraulic model studies of barrage
Model studies will be carried out to confirm the adequacy of barrage to pass
the design flood corresponding to full reservoir level (FRL). The discharge rating
curve will be provided as per model observation. Hydraulic design of control
structure and arrangements for training the flow will be finalized on the hydraulic
model. Water surface profile for different range of discharges will be observed
and reported. All the above mentioned observations will be taken at full
reservoir level (El. 2103.0 m) for partial as well as full gate openings and also
different gate openings. Energy dissipation arrangements will be studied.
2.4 Hydraulic model studies of desanding basin
Model studies will be carried out for general performance and efficient
functioning of desilting arrangement for the removal of sediment particles of
0.20 mm size and to supply 68.9 cumec sediment free discharge to the head
race tunnel (HRT) for power generation. The desilting arrangement system will
be tested for different sediment concentration in lieu with the model scale.
Model studies for desilting chamber will be carried out on a separate model.
3.0 THE DATA
Following data was supplied by sponsor in various steps.
1. The contour plan of river from 900 m u/s to 450 m d/s of barrage axis.
2. X-sections of the river in above reach, at an interval of 30 m having
3. spot levels at 10 m distance on separate sheets.
3. Detailed drawings of barrage-intake.
4. Detailed drawings of power intake.
Model Studies for Barrage – Intake of Lata Tapovan, H.E.Project across river Dhauliganga in Distt. Chamoli (Uttarakhand)
I.R.I.Roorkee (An ISO 9001:2008 certified organization) T.M.No. 84 R R (H3 – 05) October, 2013
8
5. Detailed drawings of silt flushing tunnel.
6. Detailed drawings of desanding basin.
7. Detailed plan and sections of HRT.
8. Plan and sections of desanding basin.
9. Size of holes in slabs of silt flushing tunnel.
10. Silt gradation curves of suspended load of the river.
11. Tail rating curves at barrage axis and 135 m d/s of barrage axis.
12. Sediment size 0.2 mm and above was desired to be removed by silt
flushing tunnel of desanding basin.
13. Manning‟s value of “n” for river bed and banks must be taken 0.035.
4.0 THE MODEL
A geometrically similar comprehensive model of river Dhauliganga was
constructed to a scale of 1:30 (discharge scale 1:4929.5). A river reach from
900 m upstream to 450 m downstream of proposed barrage axis was
represented in the model in cement concrete.
The discharge fed into the model was measured over a sharp crested weir
provided in the upstream of the model with the help of pointer gauge having
least count of 0.01 cm. A v-notch arrangement was made in the downstream of
power intake to measure the discharge passing through it. The velocities were
observed using well calibrated mini-current meter and the water levels were
observed with the model scale. The layout plan of the comprehensive model is
shown in Drg. - 2. The view of the model is shown in Photograph-1 & 2.
5.0 MODEL INVESTIGATIONS
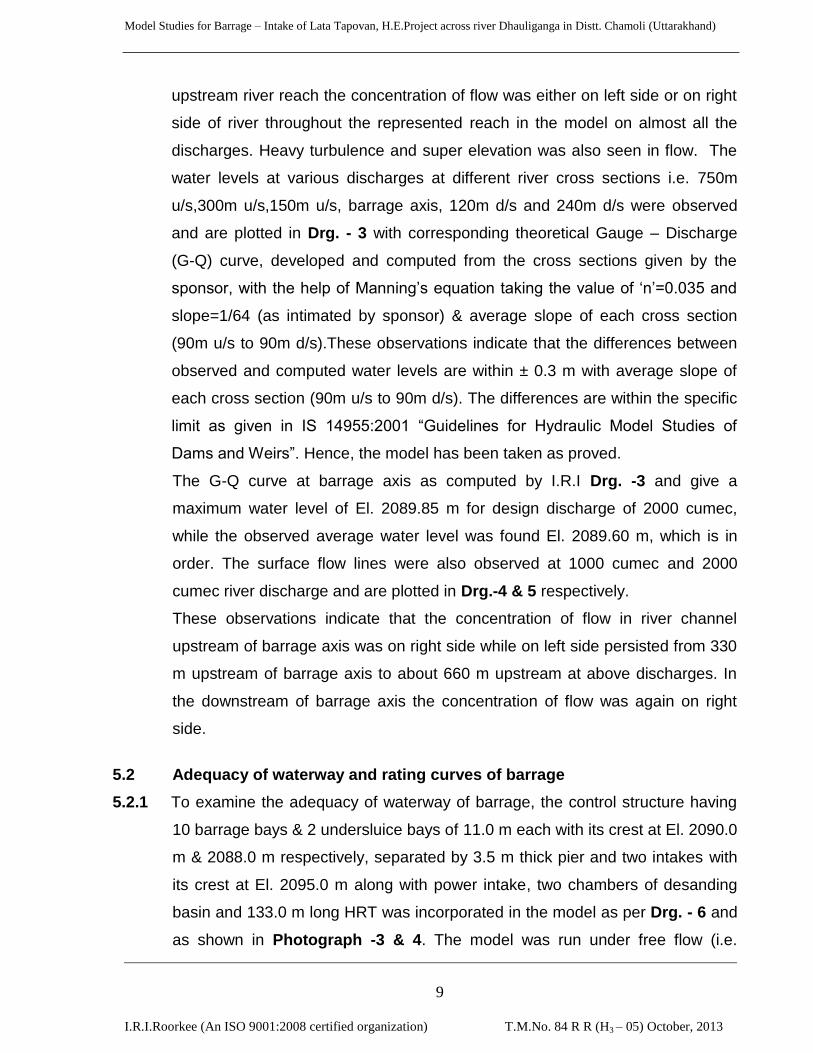
5.1 Proving of model
To examine the general flow condition of river, the model was run without
barrage - intake at different discharges varying from 200 cumec to maximum
design discharge of 2000 cumec and corresponding tail water levels were
maintained at 360 m downstream of barrage axis as per tail rating curve
computed from the cross sections supplied by the sponsor. The visual
behaviour of the river was seen and it was noted that due to the bends in
Model Studies for Barrage – Intake of Lata Tapovan, H.E.Project across river Dhauliganga in Distt. Chamoli (Uttarakhand)
I.R.I.Roorkee (An ISO 9001:2008 certified organization) T.M.No. 84 R R (H3 – 05) October, 2013
9
upstream river reach the concentration of flow was either on left side or on right
side of river throughout the represented reach in the model on almost all the
discharges. Heavy turbulence and super elevation was also seen in flow. The
water levels at various discharges at different river cross sections i.e. 750m
u/s,300m u/s,150m u/s, barrage axis, 120m d/s and 240m d/s were observed
and are plotted in Drg. - 3 with corresponding theoretical Gauge – Discharge
(G-Q) curve, developed and computed from the cross sections given by the
sponsor, with the help of Manning‟s equation taking the value of „n‟=0.035 and
slope=1/64 (as intimated by sponsor) & average slope of each cross section
(90m u/s to 90m d/s).These observations indicate that the differences between
observed and computed water levels are within ± 0.3 m with average slope of
each cross section (90m u/s to 90m d/s). The differences are within the specific
limit as given in IS 14955:2001 “Guidelines for Hydraulic Model Studies of
Dams and Weirs”. Hence, the model has been taken as proved.
The G-Q curve at barrage axis as computed by I.R.I Drg. -3 and give a
maximum water level of El. 2089.85 m for design discharge of 2000 cumec,
while the observed average water level was found El. 2089.60 m, which is in
order. The surface flow lines were also observed at 1000 cumec and 2000
cumec river discharge and are plotted in Drg.-4 & 5 respectively.
These observations indicate that the concentration of flow in river channel
upstream of barrage axis was on right side while on left side persisted from 330
m upstream of barrage axis to about 660 m upstream at above discharges. In
the downstream of barrage axis the concentration of flow was again on right
side.
5.2 Adequacy of waterway and rating curves of barrage
5.2.1 To examine the adequacy of waterway of barrage, the control structure having
10 barrage bays & 2 undersluice bays of 11.0 m each with its crest at El. 2090.0
m & 2088.0 m respectively, separated by 3.5 m thick pier and two intakes with
its crest at El. 2095.0 m along with power intake, two chambers of desanding
basin and 133.0 m long HRT was incorporated in the model as per Drg. - 6 and
as shown in Photograph -3 & 4. The model was run under free flow (i.e.

Model Studies for Barrage – Intake of Lata Tapovan, H.E.Project across river Dhauliganga in Distt. Chamoli (Uttarakhand)
I.R.I.Roorkee (An ISO 9001:2008 certified organization) T.M.No. 84 R R (H3 – 05) October, 2013
10
without gate operation) and steady state condition at different discharges
varying from 200 cumec to the maximum discharge of 2000 cumec with
maintaining their corresponding tail water levels at 360 m downstream of
barrage axis as per tail rating curve and corresponding water levels at about
30m upstream of barrage axis were observed. These observed water levels
corresponding to different discharges are given in Table-1 and plotted in Drg.-7
to develop the discharge rating curve of the barrage under free flow condition.
It is seen that the design discharge of 2000 cumec passed through the spillway
at average water level of El. 2093.83 m against the supplied FRL as El. 2103.0
m indicated that the discharging capacity of barrage is more than its design
discharge of 2000 cumec.
The model was also run with closing of gates of barrage from left side and
reservoir levels were observed. The observed reservoir levels are given in
Table-2. These observations indicate that after closing 9 gates of barrage, the
reservoir level was recorded at about FRL (El. 2103.0 m). Thus, the 4 barrage
bays from left side are surplus as per model observations.
The discharge rating curve under ponding condition at full reservoir level (El.
2103.0 m) and maximum draw down level (El. 2099.5 m) at 0.3m, 0.5m,
1.0m,1.5m and 2.0m equal gate opening were also observed on the model.
Discharges passing through barrage under steady state conditions were
observed for different and equal gate openings maintaining the full reservoir
level in twelve bays operative conditions. The observed discharges passing
through barrage and corresponding gate openings at the desired reservoir level
(FRL) & (MDDL) are given in Table-3 and corresponding discharge rating
curves under gated condition are plotted in Drg. - 8.
5.2.2 Hydrostatic Pressures
5.2.2.1 Hydrostatic pressures under free flow condition without energy dissipation
arrangement were observed along the left & right abutment, pier and divide wall
of the floor at 2000 cumec, 1000 cumec, 500 cumec and 300 cumec river
discharges. Observed pressures were found mostly positive but at 25.0 m d/s
in left of divide wall the negative pressure was 0.45m. The locations of

Model Studies for Barrage – Intake of Lata Tapovan, H.E.Project across river Dhauliganga in Distt. Chamoli (Uttarakhand)
I.R.I.Roorkee (An ISO 9001:2008 certified organization) T.M.No. 84 R R (H3 – 05) October, 2013
11
piezometric points is shown in Drg.-9. Observed hydrostatic pressures along
the left & right abutment, pier and divide wall at 2000 cumec discharge are
given in Table-4.
5.2.2.2 Hydrostatic pressures were also observed under gated condition maintaining
FRL at El. 2103.00m at different equally gate openings of 0.3m, 0.5m, 1.0m,
2.0m. Observed pressures were found mostly positive but at some locations
they were negative within 10% of the corresponding heads. To overcome the
effects of these negative pressures sufficient grade of concrete has to be used.
Observed hydrostatic pressures along the left & right abutment, pier and divide
wall at 0.30m gate opening at FRL are given in Table-5.
5.3 Adequacy of intakes and power intake
To examine the adequacy of intakes and power intake, the tests were observed
in ponding condition at full reservoir level (El. 2103.0 m) and maximum draw
down level (El. 2099.5 m) at 0.3m to 2.0m equal gate opening on the model.
The observed discharges were as follows.
Gate Opening
(in m)
Observed discharge at
FRL in cumec
Observed discharge at
MDDL in cumec
With two
chambers
With one
chamber
With two
chambers
With one
chamber
0.3 79.6 59.9 69.3 54.0
0.5 80.8 58.9 71.0 55.0
1.0 84.5 65.5 80.8 61.9
2.0 90.8 70.4 84.5 66.1
The design discharge of HRT is 68.9 cumec. These tests indicate that at FRL
and MDDL the discharge carrying capacity of HRT is adequate. But the
discharge carrying capacity of intakes at FRL is adequate, while at MDDL it is
87 % and 90 % of required discharge 79.25 cumec with two chambers at 0.3m
and 0.5m gate opening respectively.
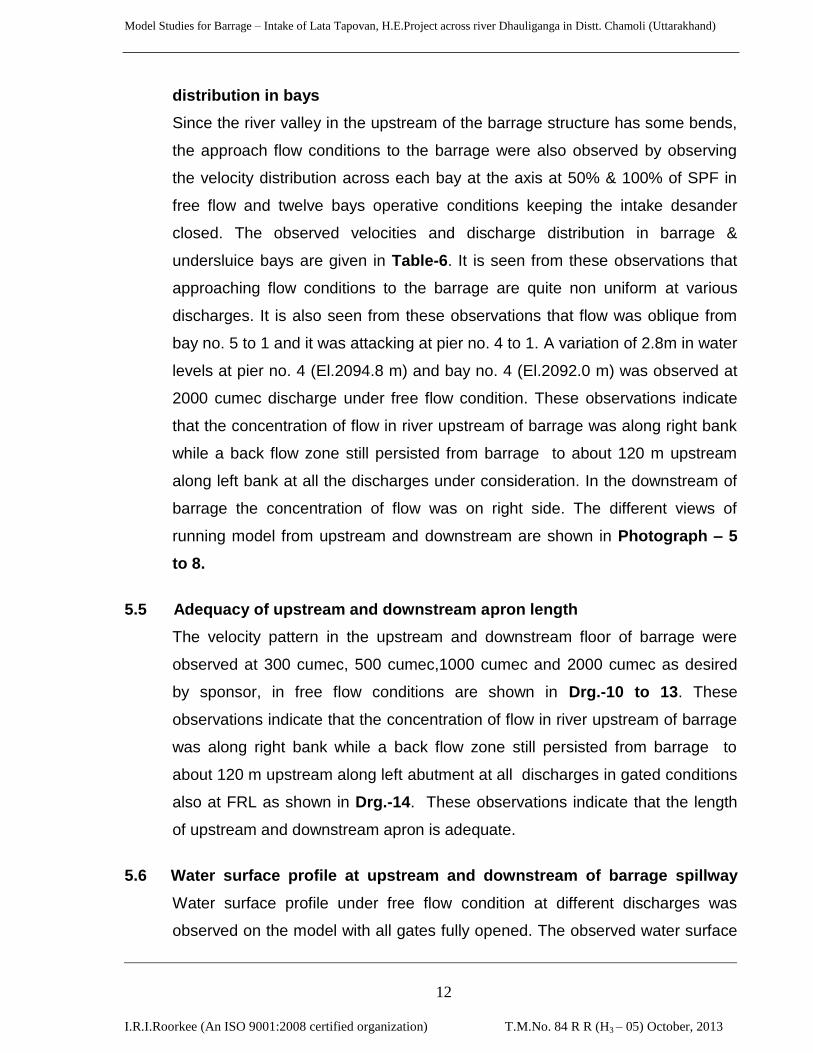
5.4 Approach flow conditions to the barrage structure and discharge
Model Studies for Barrage – Intake of Lata Tapovan, H.E.Project across river Dhauliganga in Distt. Chamoli (Uttarakhand)
I.R.I.Roorkee (An ISO 9001:2008 certified organization) T.M.No. 84 R R (H3 – 05) October, 2013
12
distribution in bays
Since the river valley in the upstream of the barrage structure has some bends,
the approach flow conditions to the barrage were also observed by observing
the velocity distribution across each bay at the axis at 50% & 100% of SPF in
free flow and twelve bays operative conditions keeping the intake desander
closed. The observed velocities and discharge distribution in barrage &
undersluice bays are given in Table-6. It is seen from these observations that
approaching flow conditions to the barrage are quite non uniform at various
discharges. It is also seen from these observations that flow was oblique from
bay no. 5 to 1 and it was attacking at pier no. 4 to 1. A variation of 2.8m in water
levels at pier no. 4 (El.2094.8 m) and bay no. 4 (El.2092.0 m) was observed at
2000 cumec discharge under free flow condition. These observations indicate
that the concentration of flow in river upstream of barrage was along right bank
while a back flow zone still persisted from barrage to about 120 m upstream
along left bank at all the discharges under consideration. In the downstream of
barrage the concentration of flow was on right side. The different views of
running model from upstream and downstream are shown in Photograph – 5
to 8.
5.5 Adequacy of upstream and downstream apron length
The velocity pattern in the upstream and downstream floor of barrage were
observed at 300 cumec, 500 cumec,1000 cumec and 2000 cumec as desired
by sponsor, in free flow conditions are shown in Drg.-10 to 13. These
observations indicate that the concentration of flow in river upstream of barrage
was along right bank while a back flow zone still persisted from barrage to
about 120 m upstream along left abutment at all discharges in gated conditions
also at FRL as shown in Drg.-14. These observations indicate that the length
of upstream and downstream apron is adequate.
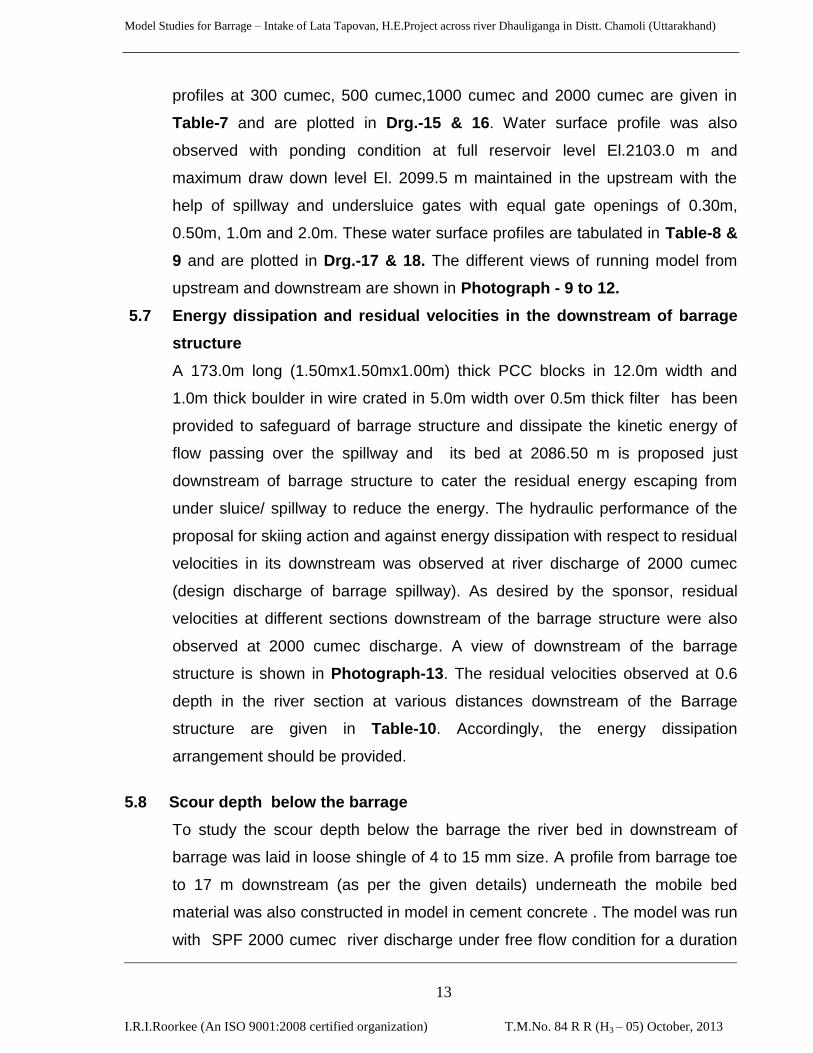
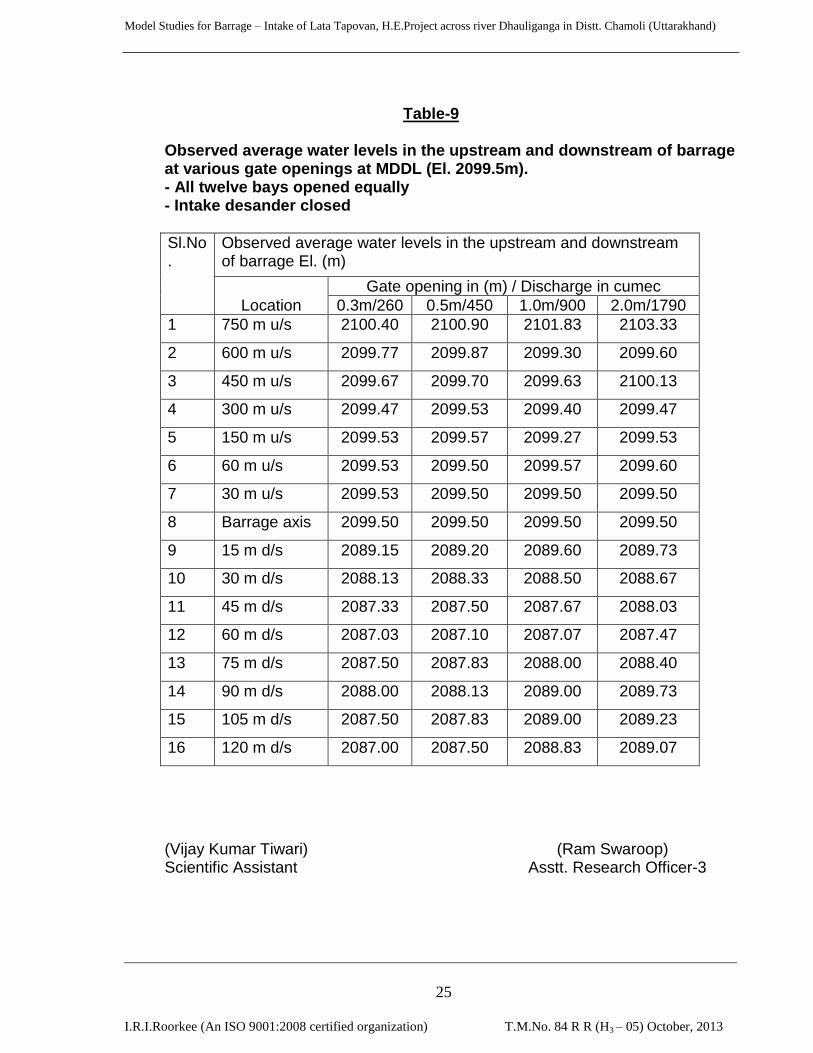
5.6 Water surface profile at upstream and downstream of barrage spillway
Water surface profile under free flow condition at different discharges was
observed on the model with all gates fully opened. The observed water surface
Model Studies for Barrage – Intake of Lata Tapovan, H.E.Project across river Dhauliganga in Distt. Chamoli (Uttarakhand)
I.R.I.Roorkee (An ISO 9001:2008 certified organization) T.M.No. 84 R R (H3 – 05) October, 2013
13
profiles at 300 cumec, 500 cumec,1000 cumec and 2000 cumec are given in
Table-7 and are plotted in Drg.-15 & 16. Water surface profile was also
observed with ponding condition at full reservoir level El.2103.0 m and
maximum draw down level El. 2099.5 m maintained in the upstream with the
help of spillway and undersluice gates with equal gate openings of 0.30m,
0.50m, 1.0m and 2.0m. These water surface profiles are tabulated in Table-8 &
9 and are plotted in Drg.-17 & 18. The different views of running model from
upstream and downstream are shown in Photograph - 9 to 12.
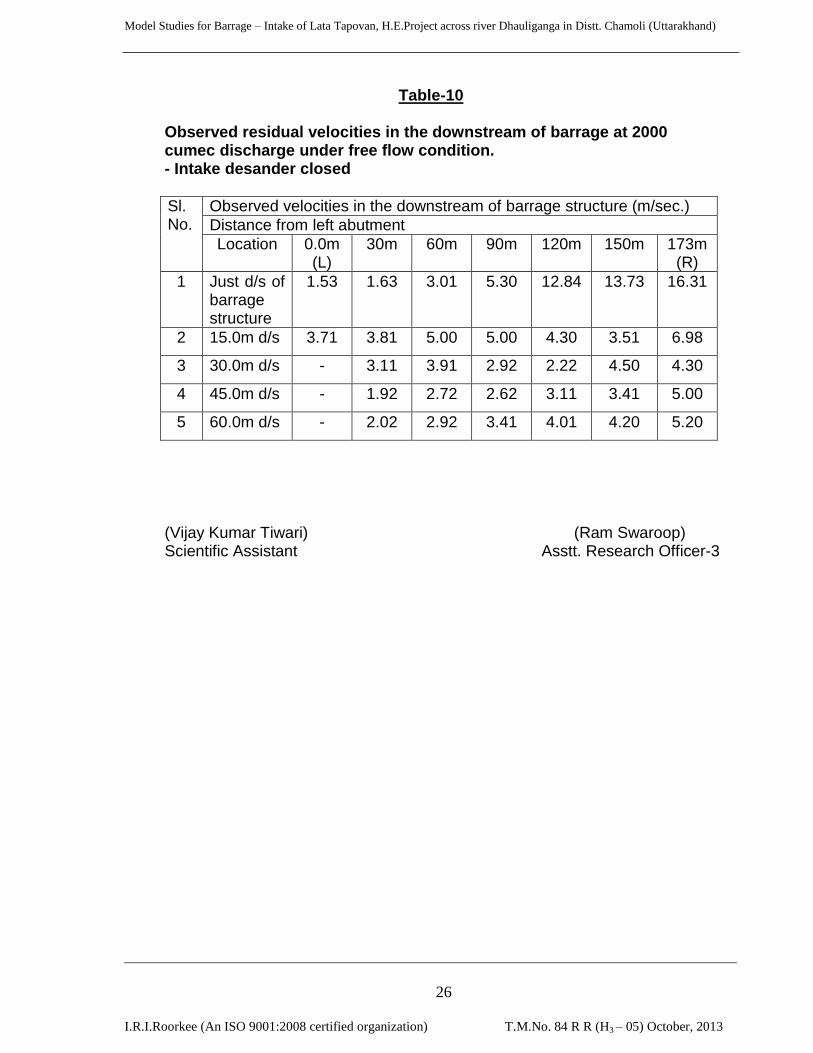
5.7 Energy dissipation and residual velocities in the downstream of barrage
structure
A 173.0m long (1.50mx1.50mx1.00m) thick PCC blocks in 12.0m width and
1.0m thick boulder in wire crated in 5.0m width over 0.5m thick filter has been
provided to safeguard of barrage structure and dissipate the kinetic energy of
flow passing over the spillway and its bed at 2086.50 m is proposed just
downstream of barrage structure to cater the residual energy escaping from
under sluice/ spillway to reduce the energy. The hydraulic performance of the
proposal for skiing action and against energy dissipation with respect to residual
velocities in its downstream was observed at river discharge of 2000 cumec
(design discharge of barrage spillway). As desired by the sponsor, residual
velocities at different sections downstream of the barrage structure were also
observed at 2000 cumec discharge. A view of downstream of the barrage
structure is shown in Photograph-13. The residual velocities observed at 0.6
depth in the river section at various distances downstream of the Barrage
structure are given in Table-10. Accordingly, the energy dissipation
arrangement should be provided.
5.8 Scour depth below the barrage
To study the scour depth below the barrage the river bed in downstream of
barrage was laid in loose shingle of 4 to 15 mm size. A profile from barrage toe
to 17 m downstream (as per the given details) underneath the mobile bed
material was also constructed in model in cement concrete . The model was run
with SPF 2000 cumec river discharge under free flow condition for a duration

Model Studies for Barrage – Intake of Lata Tapovan, H.E.Project across river Dhauliganga in Distt. Chamoli (Uttarakhand)
I.R.I.Roorkee (An ISO 9001:2008 certified organization) T.M.No. 84 R R (H3 – 05) October, 2013
14
of 4 hour 23 minutes (taking Tr=Lr/√Dr for 24 hours of prototype).
Where,
Tr = ratio of Time scale
Lr = ratio of Length scale
Dr = ratio of Depth scale
A maximum scour of the order of 5.0m at 32.0m downstream of barrage toe
along right bank was observed at design discharge of 2000 cumec. The scour
pattern in the downstream of apron after running of model was observed and is
plotted in Drg.- 19. The view of scoured bed profile is shown in Photograph-14.
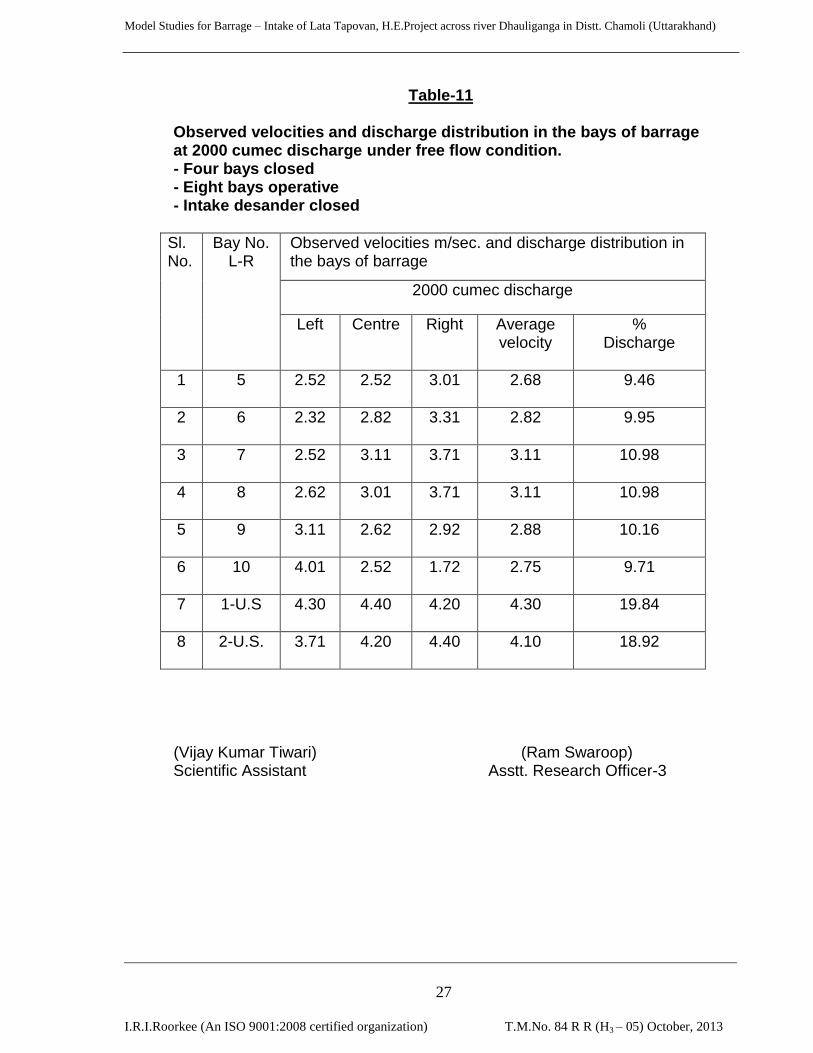
5.9 Proposal for even discharge distribution in barrage bays
(without left four bays)
To improve the flow condition and even discharge distribution in barrage bays a
proposal was incorporated in the model. In proposal the left abutment was
constructed along 4 no. pier in a straight length of 120m and a smooth curve
merged to upstream hill rock. The proposal was tested at 2000 cumec
discharge under free flow condition. It was observed that flow was uniform and
flow conditions were better as shown in Photograph-15 in respect of earlier
study as described in para 5.4. The average observed reservoir level was El.
2096.5m. The discharge distribution was even in barrage bays as given in
Table-11. It may be helpful to increase the discharging capacity of intake at
MDDL (El.2099.5m) with 0.3m and 0.5m gate opening. The apron length was
60.5m. It was also observed that the jump formation was at 90.0m downstream
of barrage axis as shown in Photograph-16. So the apron length is inadequate.
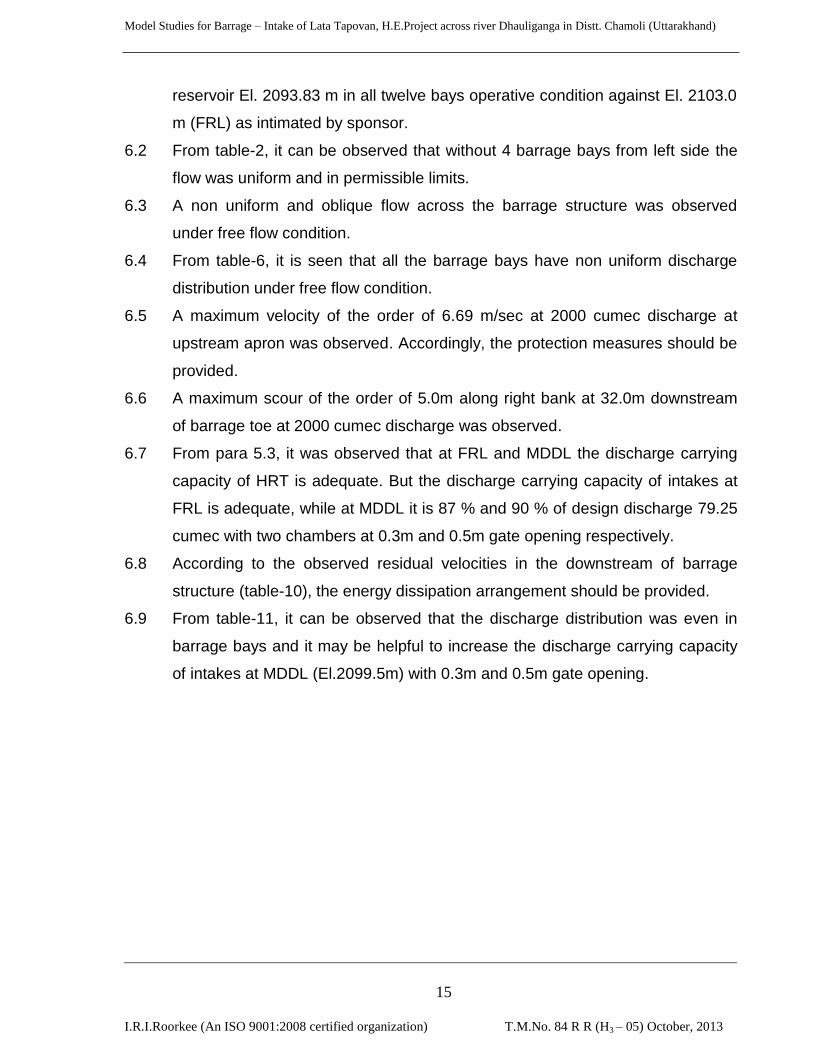
6.0 DISCUSSION OF RESULTS AND CONCLUSIONS
The hydraulic tests conducted on comprehensive model of barrage-intake of
Lata Tapovan H.E.Project revealed that:-
6.1 From table-1, it can be seen that the proposed waterway of barrage 110.0 m
with its crest El. 2090.0 m and waterway of undersluice of 22.0 m with its crest
El. 2088.0 m is found adequate to pass its design discharge of 2000 cumec at
Model Studies for Barrage – Intake of Lata Tapovan, H.E.Project across river Dhauliganga in Distt. Chamoli (Uttarakhand)
I.R.I.Roorkee (An ISO 9001:2008 certified organization) T.M.No. 84 R R (H3 – 05) October, 2013
15
reservoir El. 2093.83 m in all twelve bays operative condition against El. 2103.0
m (FRL) as intimated by sponsor.
6.2 From table-2, it can be observed that without 4 barrage bays from left side the
flow was uniform and in permissible limits.
6.3 A non uniform and oblique flow across the barrage structure was observed
under free flow condition.
6.4 From table-6, it is seen that all the barrage bays have non uniform discharge
distribution under free flow condition.
6.5 A maximum velocity of the order of 6.69 m/sec at 2000 cumec discharge at
upstream apron was observed. Accordingly, the protection measures should be
provided.
6.6 A maximum scour of the order of 5.0m along right bank at 32.0m downstream
of barrage toe at 2000 cumec discharge was observed.
6.7 From para 5.3, it was observed that at FRL and MDDL the discharge carrying
capacity of HRT is adequate. But the discharge carrying capacity of intakes at
FRL is adequate, while at MDDL it is 87 % and 90 % of design discharge 79.25
cumec with two chambers at 0.3m and 0.5m gate opening respectively.
6.8 According to the observed residual velocities in the downstream of barrage
structure (table-10), the energy dissipation arrangement should be provided.
6.9 From table-11, it can be observed that the discharge distribution was even in
barrage bays and it may be helpful to increase the discharge carrying capacity
of intakes at MDDL (El.2099.5m) with 0.3m and 0.5m gate opening.

Model Studies for Barrage – Intake of Lata Tapovan, H.E.Project across river Dhauliganga in Distt. Chamoli (Uttarakhand)
I.R.I.Roorkee (An ISO 9001:2008 certified organization) T.M.No. 84 R R (H3 – 05) October, 2013
16
TABLES
Model Studies for Barrage – Intake of Lata Tapovan, H.E.Project across river Dhauliganga in Distt. Chamoli (Uttarakhand)
I.R.I.Roorkee (An ISO 9001:2008 certified organization) T.M.No. 84 R R (H3 – 05) October, 2013
17
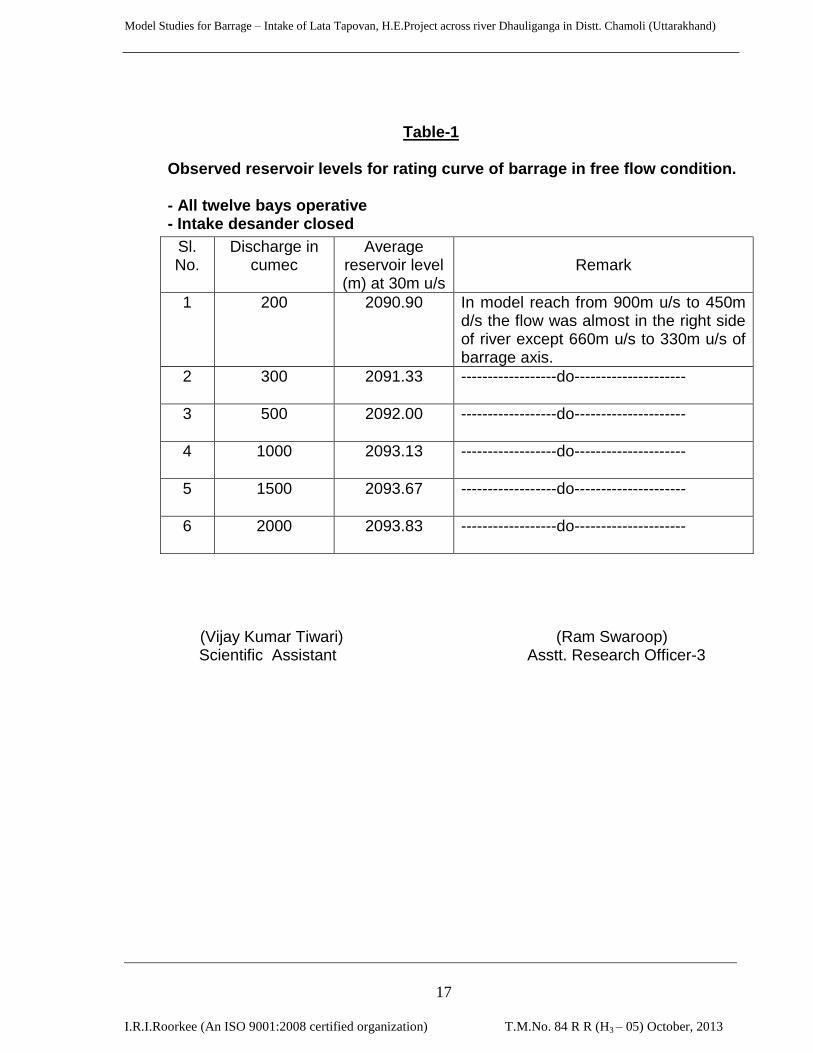
Table-1
Observed reservoir levels for rating curve of barrage in free flow condition. - All twelve bays operative - Intake desander closed
Sl. No.
Discharge in cumec
Average reservoir level (m) at 30m u/s
Remark
1 200 2090.90 In model reach from 900m u/s to 450m d/s the flow was almost in the right side of river except 660m u/s to 330m u/s of barrage axis.
2 300 2091.33 ------------------do---------------------
3 500 2092.00 ------------------do---------------------
4 1000 2093.13 ------------------do---------------------
5 1500 2093.67 ------------------do---------------------
6 2000 2093.83 ------------------do---------------------
(Vijay Kumar Tiwari) (Ram Swaroop)
Scientific Assistant Asstt. Research Officer-3
Model Studies for Barrage – Intake of Lata Tapovan, H.E.Project across river Dhauliganga in Distt. Chamoli (Uttarakhand)
I.R.I.Roorkee (An ISO 9001:2008 certified organization) T.M.No. 84 R R (H3 – 05) October, 2013
18
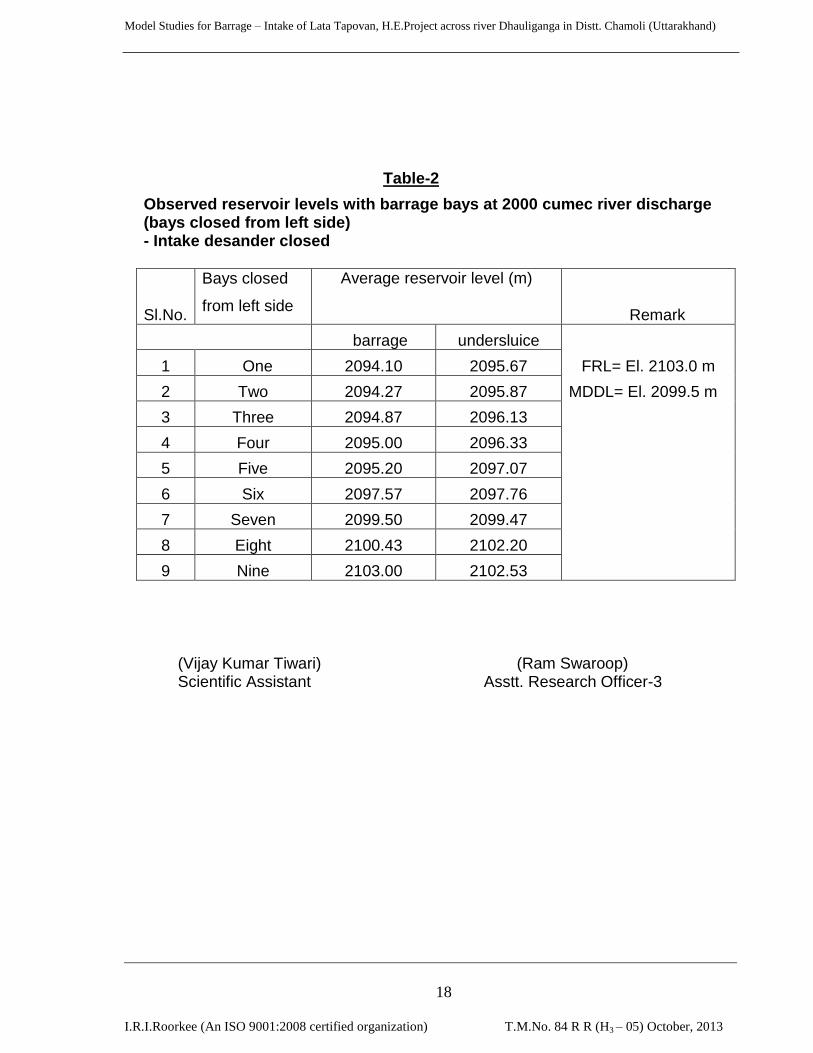
Table-2
Observed reservoir levels with barrage bays at 2000 cumec river discharge (bays closed from left side)
- Intake desander closed
Sl.No.
Bays closed
from left side
Average reservoir level (m)
Remark
barrage undersluice
1 One 2094.10 2095.67 FRL= El. 2103.0 m
2 Two 2094.27 2095.87 MDDL= El. 2099.5 m
3 Three 2094.87 2096.13
4 Four 2095.00 2096.33
5 Five 2095.20 2097.07
6 Six 2097.57 2097.76
7 Seven 2099.50 2099.47
8 Eight 2100.43 2102.20
9 Nine 2103.00 2102.53
(Vijay Kumar Tiwari) (Ram Swaroop) Scientific Assistant Asstt. Research Officer-3

Model Studies for Barrage – Intake of Lata Tapovan, H.E.Project across river Dhauliganga in Distt. Chamoli (Uttarakhand)
I.R.I.Roorkee (An ISO 9001:2008 certified organization) T.M.No. 84 R R (H3 – 05) October, 2013
19
Table-3
Observed river discharge for rating curve of barrage at FRL and MDDL.
- Under gated condition - All twelve bays equally opened - Intake desander closed
Sl. No.
Equal gate opening (m)
River discharge in cumec at FRL (El. 2103.0 m)
River discharge in cumec at MDDL (El. 2099.5 m)
1 0.30 300 260
2 0.50 500 450
3 1.00 1000 900
4 1.50 1500 1350
5 2.00 2000 1790
(Vijay Kumar Tiwari) (Ram Swaroop) Scientific Assistant Asstt. Research Officer-3
Model Studies for Barrage – Intake of Lata Tapovan, H.E.Project across river Dhauliganga in Distt. Chamoli (Uttarakhand)
I.R.I.Roorkee (An ISO 9001:2008 certified organization) T.M.No. 84 R R (H3 – 05) October, 2013
20
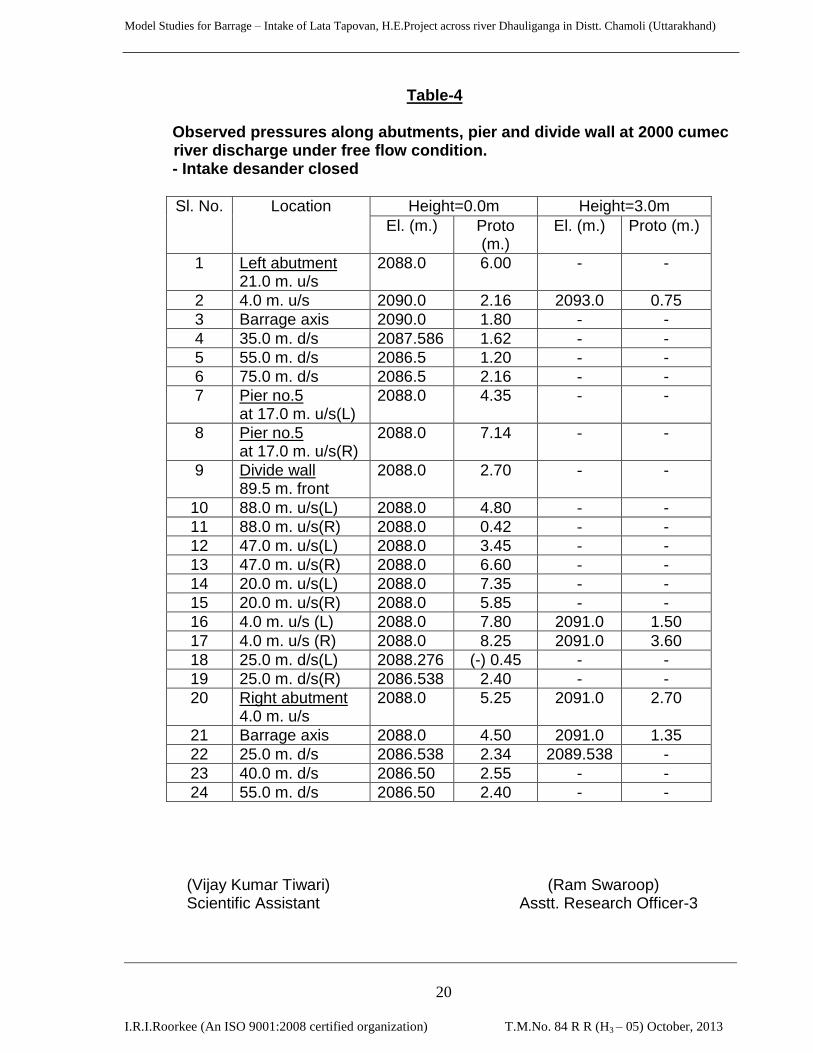
Table-4
Observed pressures along abutments, pier and divide wall at 2000 cumec river discharge under free flow condition. - Intake desander closed
Sl. No. Location Height=0.0m Height=3.0m
El. (m.) Proto (m.)
El. (m.) Proto (m.)
1 Left abutment 21.0 m. u/s
2088.0 6.00 - -
2 4.0 m. u/s 2090.0 2.16 2093.0 0.75
3 Barrage axis 2090.0 1.80 - -
4 35.0 m. d/s 2087.586 1.62 - -
5 55.0 m. d/s 2086.5 1.20 - -
6 75.0 m. d/s 2086.5 2.16 - -
7 Pier no.5 at 17.0 m. u/s(L)
2088.0 4.35 - -
8 Pier no.5 at 17.0 m. u/s(R)
2088.0 7.14 - -
9 Divide wall 89.5 m. front
2088.0 2.70 - -
10 88.0 m. u/s(L) 2088.0 4.80 - -
11 88.0 m. u/s(R) 2088.0 0.42 - -
12 47.0 m. u/s(L) 2088.0 3.45 - -
13 47.0 m. u/s(R) 2088.0 6.60 - -
14 20.0 m. u/s(L) 2088.0 7.35 - -
15 20.0 m. u/s(R) 2088.0 5.85 - -
16 4.0 m. u/s (L) 2088.0 7.80 2091.0 1.50
17 4.0 m. u/s (R) 2088.0 8.25 2091.0 3.60
18 25.0 m. d/s(L) 2088.276 (-) 0.45 - -
19 25.0 m. d/s(R) 2086.538 2.40 - -
20 Right abutment 4.0 m. u/s
2088.0 5.25 2091.0 2.70
21 Barrage axis 2088.0 4.50 2091.0 1.35
22 25.0 m. d/s 2086.538 2.34 2089.538 -
23 40.0 m. d/s 2086.50 2.55 - -
24 55.0 m. d/s 2086.50 2.40 - -
(Vijay Kumar Tiwari) (Ram Swaroop) Scientific Assistant Asstt. Research Officer-3
Model Studies for Barrage – Intake of Lata Tapovan, H.E.Project across river Dhauliganga in Distt. Chamoli (Uttarakhand)
I.R.I.Roorkee (An ISO 9001:2008 certified organization) T.M.No. 84 R R (H3 – 05) October, 2013
21
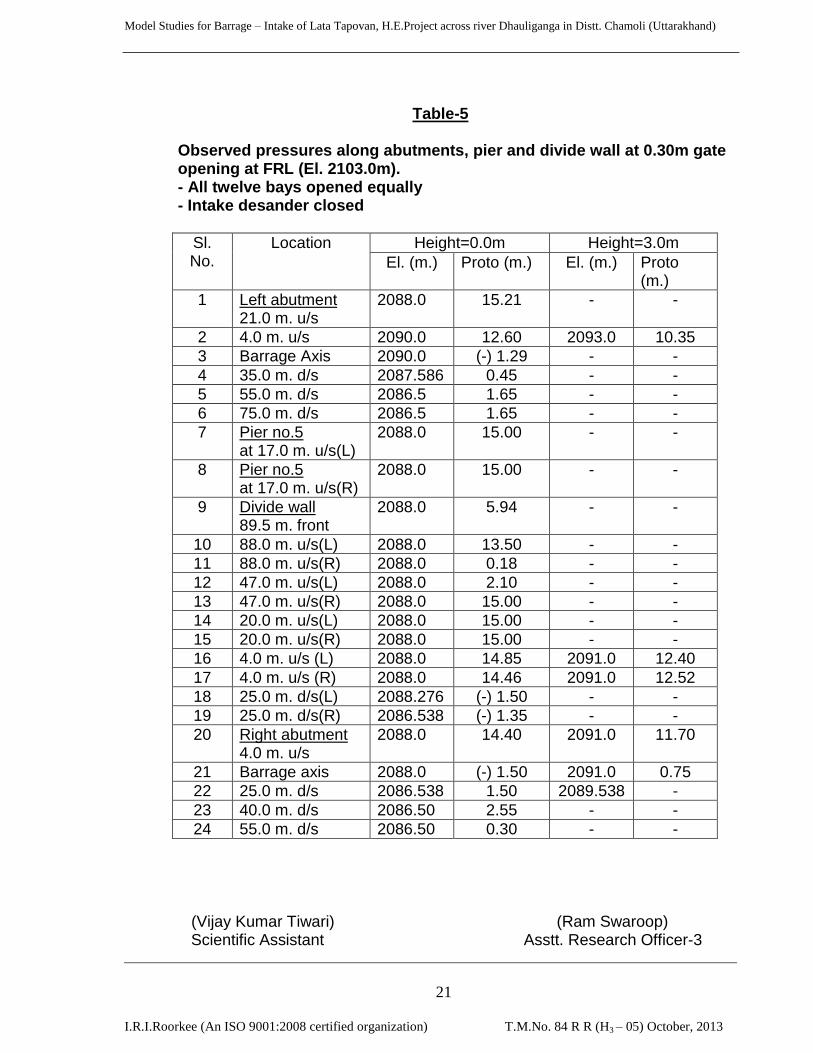
Table-5
Observed pressures along abutments, pier and divide wall at 0.30m gate opening at FRL (El. 2103.0m). - All twelve bays opened equally - Intake desander closed
Sl. No.
Location Height=0.0m Height=3.0m
El. (m.) Proto (m.) El. (m.) Proto (m.)
1 Left abutment 21.0 m. u/s
2088.0 15.21 - -
2 4.0 m. u/s 2090.0 12.60 2093.0 10.35
3 Barrage Axis 2090.0 (-) 1.29 - -
4 35.0 m. d/s 2087.586 0.45 - -
5 55.0 m. d/s 2086.5 1.65 - -
6 75.0 m. d/s 2086.5 1.65 - -
7 Pier no.5 at 17.0 m. u/s(L)
2088.0 15.00 - -
8 Pier no.5 at 17.0 m. u/s(R)
2088.0 15.00 - -
9 Divide wall 89.5 m. front
2088.0 5.94 - -
10 88.0 m. u/s(L) 2088.0 13.50 - -
11 88.0 m. u/s(R) 2088.0 0.18 - -
12 47.0 m. u/s(L) 2088.0 2.10 - -
13 47.0 m. u/s(R) 2088.0 15.00 - -
14 20.0 m. u/s(L) 2088.0 15.00 - -
15 20.0 m. u/s(R) 2088.0 15.00 - -
16 4.0 m. u/s (L) 2088.0 14.85 2091.0 12.40
17 4.0 m. u/s (R) 2088.0 14.46 2091.0 12.52
18 25.0 m. d/s(L) 2088.276 (-) 1.50 - -
19 25.0 m. d/s(R) 2086.538 (-) 1.35 - -
20 Right abutment 4.0 m. u/s
2088.0 14.40 2091.0 11.70
21 Barrage axis 2088.0 (-) 1.50 2091.0 0.75
22 25.0 m. d/s 2086.538 1.50 2089.538 -
23 40.0 m. d/s 2086.50 2.55 - -
24 55.0 m. d/s 2086.50 0.30 - -
(Vijay Kumar Tiwari) (Ram Swaroop) Scientific Assistant Asstt. Research Officer-3

Model Studies for Barrage – Intake of Lata Tapovan, H.E.Project across river Dhauliganga in Distt. Chamoli (Uttarakhand)
I.R.I.Roorkee (An ISO 9001:2008 certified organization) T.M.No. 84 R R (H3 – 05) October, 2013
22
Table-6
Observed velocities and discharge distribution in the bays of barrage at 1000 cumec and 2000 cumec discharge under free flow condition. - All twelve bays operative - Intake desander closed
Sl. No.
Bay No. L-R
Observed velocities in m/sec. and discharge distribution in the bays of barrage
1000 cumec discharge 2000 cumec discharge
L C R Av. vel.
% L C R Av. vel.
%
1 1
3.1
8
2.7
1
1.7
7
2.5
5
5.4
7
3.2
8
3.5
6
2.5
2
3.1
2
5.8
5
2 2
2.4
3
2.7
1
1.3
9
2.1
8
4.6
7
3.8
4
2.9
9
2.1
4
2.9
9
4.8
0
3 3
3.2
8
3.1
8
1.5
8
2.6
8
5.0
2
4.0
3
3.7
5
2.0
5
3.2
8
4.3
9
4 4
2.9
0
2.9
9
1.6
7
2.5
2
4.3
7
3.2
8
3.5
6
1.9
6
2.9
3
3.9
2
5 5
3.1
8
2.9
9
1.7
7
2.5
6
7.1
0
4.9
7
2.9
9
2.3
3
3.4
3
6.4
3
6 6
2.6
2
2.8
0
2.9
0
2.7
7
8.1
6
4.4
1
4.4
1
2.2
4
3.6
8
8.8
7
7 7
2.9
0
2.8
0
2.7
1
2.8
0
9.0
0
4.0
3
4.0
3
2.7
1
3.5
9
7.6
9
8 8
2.1
4
2.9
9
2.6
2
2.5
8
6.9
1
3.2
8
4.0
3
3.6
5
3.6
5
7.8
2
9 9
1.3
9
2.3
3
2.6
2
2.1
2
3.4
1
3.8
4
3.2
8
2.7
1
3.2
8
7.0
3
10 10
1.4
8
2.0
5
2.1
4
1.8
9
2.0
3
2.8
0
2.9
9
3.1
8
2.9
9
5.6
1
11 1
5.0
7
5.0
7
4.7
9
4.9
8
24
.02
5.9
2
6.5
8
6.7
7
6.4
3
18
.94
12 2
4.2
2
4.4
1
3.4
7
4.0
4
19
.48
6.7
7
6.4
8
5.7
3
6.3
3
18
.65
(Vijay Kumar Tiwari) (Ram Swaroop) Scientific Assistant Asstt. Research Officer-3
Model Studies for Barrage – Intake of Lata Tapovan, H.E.Project across river Dhauliganga in Distt. Chamoli (Uttarakhand)
I.R.I.Roorkee (An ISO 9001:2008 certified organization) T.M.No. 84 R R (H3 – 05) October, 2013
23
Table-7
Observed average water levels in the upstream and downstream of barrage at different discharges under free flow condition. - Intake desander closed
Sl.No.
Observed average water levels in the upstream and downstream of barrage El. (m)
Discharge in cumec
Location 300 500 1000 2000
1 750 m u/s 2100.40 2100.53 2101.83 2102.30
2 600 m u/s 2098.67 2098.57 2098.77 2099.87
3 450 m u/s 2095.23 2095.67 2096.67 2097.20
4 300 m u/s 2094.10 2094.20 2094.87 2096.27
5 150 m u/s 2091.40 2092.20 2093.13 2094.00
6 60 m u/s 2091.20 2092.03 2093.00 2093.73
7 30 m u/s 2091.20 2091.93 2093.13 2093.83
8 Barrage axis 2091.20 2092.00 2093.23 2094.00
9 15 m d/s 2089.20 2089.43 2089.67 2089.87
10 30 m d/s 2088.13 2088.27 2088.50 2088.83
11 45 m d/s 2087.13 2087.50 2087.73 2088.50
12 60 m d/s 2087.20 2087.33 2087.53 2087.93
13 75 m d/s 2087.33 2087.87 2088.33 2088.67
14 90 m d/s 2088.00 2088.50 2089.13 2089.87
15 105 m d/s 2088.00 2088.50 2089.00 2089.67
16 120 m d/s 2887.50 2088.00 2088.60 2089.33
(Vijay Kumar Tiwari) (Ram Swaroop)
Scientific Assistant Asstt. Research Officer-3

Model Studies for Barrage – Intake of Lata Tapovan, H.E.Project across river Dhauliganga in Distt. Chamoli (Uttarakhand)
I.R.I.Roorkee (An ISO 9001:2008 certified organization) T.M.No. 84 R R (H3 – 05) October, 2013
24
Table-8 Observed average water levels in the upstream and downstream of barrage at different gate opening at FRL (El. 2103.0m). - All twelve bays opened equally - Intake desander closed
Sl.No.
Observed average water levels in the upstream and downstream of barrage El. (m)
Gate opening in (m) / Discharge in cumec
Location 0.3m/300 0.5m/500 1.0m/1000 2.0m/2000
1 750 m u/s 2101.93 2102.63 2103.27 2103.47
2 600 m u/s 2102.00 2102.33 2103.13 2103.23
3 450 m u/s 2101.97 2102.37 2103.40 2103.43
4 300 m u/s 2102.00 2103.00 2103.00 2103.00
5 150 m u/s 2102.47 2103.00 2103.00 2103.00
6 60 m u/s 2103.00 2103.00 2103.00 2103.00
7 30 m u/s 2102.90 2103.00 2103.00 2103.00
8 Barrage axis 2103.00 2103.00 2103.00 2103.00
9 15 m d/s 2089.20 2089.27 2089.40 2089.73
10 30 m d/s 2088.15 2088.20 2088.33 2088.97
11 45 m d/s 2087.13 2087.80 2087.73 2088.50
12 60 m d/s 2087.13 2087.33 2087.50 2087.87
13 75 m d/s 2087.33 2087.63 2088.53 2088.67
14 90 m d/s 2088.07 2088.67 2089.13 2089.67
15 105 m d/s 2088.00 2088.53 2089.00 2089.53
16 120 m d/s 2087.23 2088.00 2089.00 2089.33
(Vijay Kumar Tiwari) (Ram Swaroop) Scientific Assistant Asstt. Research Officer-3
Model Studies for Barrage – Intake of Lata Tapovan, H.E.Project across river Dhauliganga in Distt. Chamoli (Uttarakhand)
I.R.I.Roorkee (An ISO 9001:2008 certified organization) T.M.No. 84 R R (H3 – 05) October, 2013
25
Table-9
Observed average water levels in the upstream and downstream of barrage at various gate openings at MDDL (El. 2099.5m). - All twelve bays opened equally - Intake desander closed
Sl.No.
Observed average water levels in the upstream and downstream of barrage El. (m)
Gate opening in (m) / Discharge in cumec
Location 0.3m/260 0.5m/450 1.0m/900 2.0m/1790
1 750 m u/s 2100.40 2100.90 2101.83 2103.33
2 600 m u/s 2099.77 2099.87 2099.30 2099.60
3 450 m u/s 2099.67 2099.70 2099.63 2100.13
4 300 m u/s 2099.47 2099.53 2099.40 2099.47
5 150 m u/s 2099.53 2099.57 2099.27 2099.53
6 60 m u/s 2099.53 2099.50 2099.57 2099.60
7 30 m u/s 2099.53 2099.50 2099.50 2099.50
8 Barrage axis 2099.50 2099.50 2099.50 2099.50
9 15 m d/s 2089.15 2089.20 2089.60 2089.73
10 30 m d/s 2088.13 2088.33 2088.50 2088.67
11 45 m d/s 2087.33 2087.50 2087.67 2088.03
12 60 m d/s 2087.03 2087.10 2087.07 2087.47
13 75 m d/s 2087.50 2087.83 2088.00 2088.40
14 90 m d/s 2088.00 2088.13 2089.00 2089.73
15 105 m d/s 2087.50 2087.83 2089.00 2089.23
16 120 m d/s 2087.00 2087.50 2088.83 2089.07
(Vijay Kumar Tiwari) (Ram Swaroop) Scientific Assistant Asstt. Research Officer-3
Model Studies for Barrage – Intake of Lata Tapovan, H.E.Project across river Dhauliganga in Distt. Chamoli (Uttarakhand)
I.R.I.Roorkee (An ISO 9001:2008 certified organization) T.M.No. 84 R R (H3 – 05) October, 2013
26
Table-10 Observed residual velocities in the downstream of barrage at 2000 cumec discharge under free flow condition. - Intake desander closed
Sl.No.
Observed velocities in the downstream of barrage structure (m/sec.)
Distance from left abutment
Location 0.0m (L)
30m 60m 90m 120m 150m 173m (R)
1 Just d/s of barrage structure
1.53 1.63 3.01 5.30 12.84 13.73 16.31
2 15.0m d/s 3.71 3.81 5.00 5.00 4.30 3.51 6.98
3 30.0m d/s - 3.11 3.91 2.92 2.22 4.50 4.30
4 45.0m d/s - 1.92 2.72 2.62 3.11 3.41 5.00
5 60.0m d/s - 2.02 2.92 3.41 4.01 4.20 5.20
(Vijay Kumar Tiwari) (Ram Swaroop) Scientific Assistant Asstt. Research Officer-3
Model Studies for Barrage – Intake of Lata Tapovan, H.E.Project across river Dhauliganga in Distt. Chamoli (Uttarakhand)
I.R.I.Roorkee (An ISO 9001:2008 certified organization) T.M.No. 84 R R (H3 – 05) October, 2013
27
Table-11 Observed velocities and discharge distribution in the bays of barrage at 2000 cumec discharge under free flow condition. - Four bays closed - Eight bays operative - Intake desander closed
Sl. No.
Bay No. L-R
Observed velocities m/sec. and discharge distribution in the bays of barrage
2000 cumec discharge
Left Centre Right Average velocity
% Discharge
1 5 2.52 2.52 3.01 2.68 9.46
2 6 2.32 2.82 3.31 2.82 9.95
3 7 2.52 3.11 3.71 3.11 10.98
4 8 2.62 3.01 3.71 3.11 10.98
5 9 3.11 2.62 2.92 2.88 10.16
6 10 4.01 2.52 1.72 2.75 9.71
7 1-U.S 4.30 4.40 4.20 4.30 19.84
8 2-U.S. 3.71 4.20 4.40 4.10 18.92
(Vijay Kumar Tiwari) (Ram Swaroop) Scientific Assistant Asstt. Research Officer-3

Model Studies for Barrage – Intake of Lata Tapovan, H.E.Project across river Dhauliganga in Distt. Chamoli (Uttarakhand)
I.R.I.Roorkee (An ISO 9001:2008 certified organization) T.M.No. 84 R R (H3 – 05) October, 2013
28
PHOTOGRAPHS

Model Studies for Barrage – Intake of Lata Tapovan, H.E.Project across river Dhauliganga in Distt. Chamoli (Uttarakhand)
I.R.I.Roorkee (An ISO 9001:2008 certified organization) T.M.No. 84 R R (H3 – 05) October, 2013
29
Photograph-1: Model view as seen from upstream under existing condition.
Photograph-2: Model view as seen from downstream under existing condition.
Model Studies for Barrage – Intake of Lata Tapovan, H.E.Project across river Dhauliganga in Distt. Chamoli (Uttarakhand)
I.R.I.Roorkee (An ISO 9001:2008 certified organization) T.M.No. 84 R R (H3 – 05) October, 2013
30
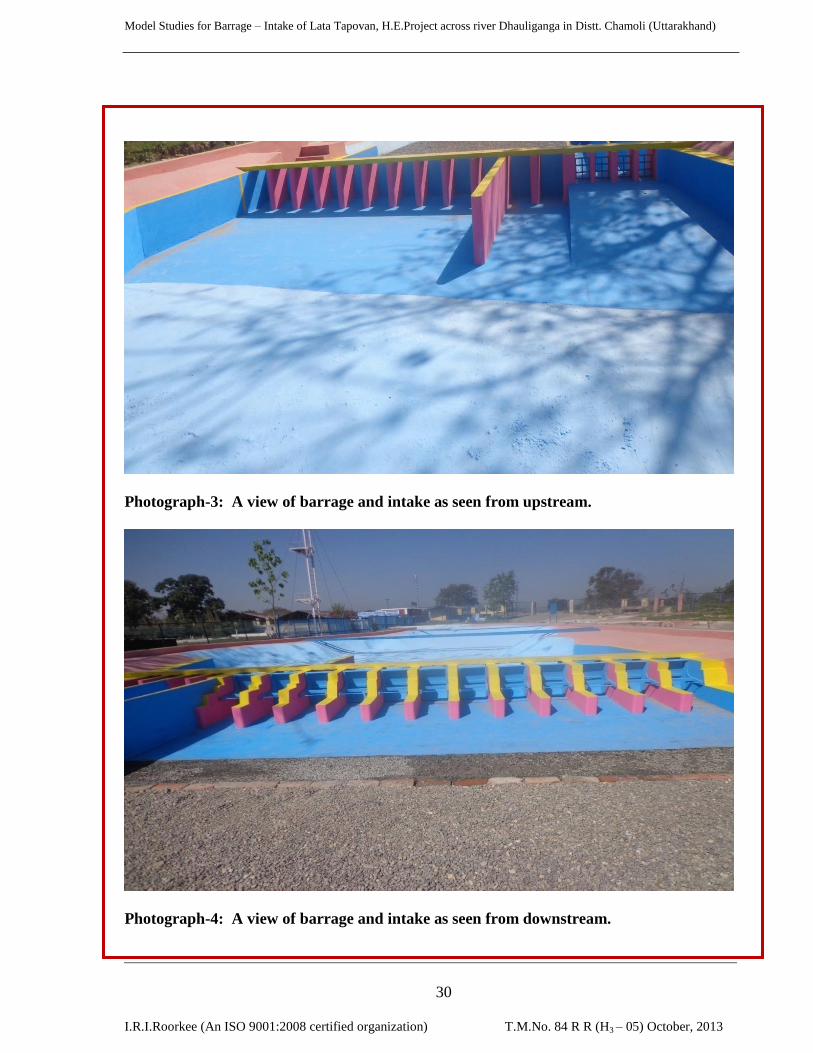
Photograph-3: A view of barrage and intake as seen from upstream.
Photograph-4: A view of barrage and intake as seen from downstream.
Model Studies for Barrage – Intake of Lata Tapovan, H.E.Project across river Dhauliganga in Distt. Chamoli (Uttarakhand)
I.R.I.Roorkee (An ISO 9001:2008 certified organization) T.M.No. 84 R R (H3 – 05) October, 2013
31
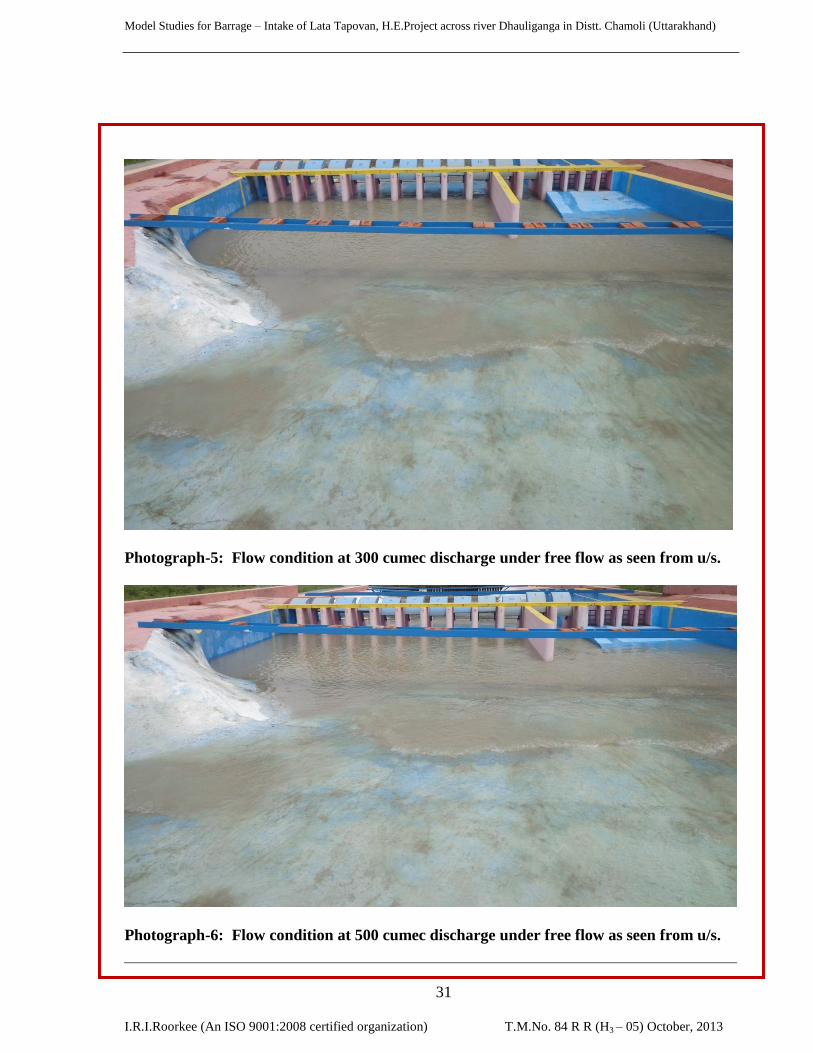
Photograph-5: Flow condition at 300 cumec discharge under free flow as seen from u/s.
Photograph-6: Flow condition at 500 cumec discharge under free flow as seen from u/s.

Model Studies for Barrage – Intake of Lata Tapovan, H.E.Project across river Dhauliganga in Distt. Chamoli (Uttarakhand)
I.R.I.Roorkee (An ISO 9001:2008 certified organization) T.M.No. 84 R R (H3 – 05) October, 2013
32
Photograph-7: Flow condition at 1000 cumec discharge under free flow as seen from d/s.
Photograph-8: Flow condition at 2000 cumec discharge under free flow as seen from u/s.
Model Studies for Barrage – Intake of Lata Tapovan, H.E.Project across river Dhauliganga in Distt. Chamoli (Uttarakhand)
I.R.I.Roorkee (An ISO 9001:2008 certified organization) T.M.No. 84 R R (H3 – 05) October, 2013
33
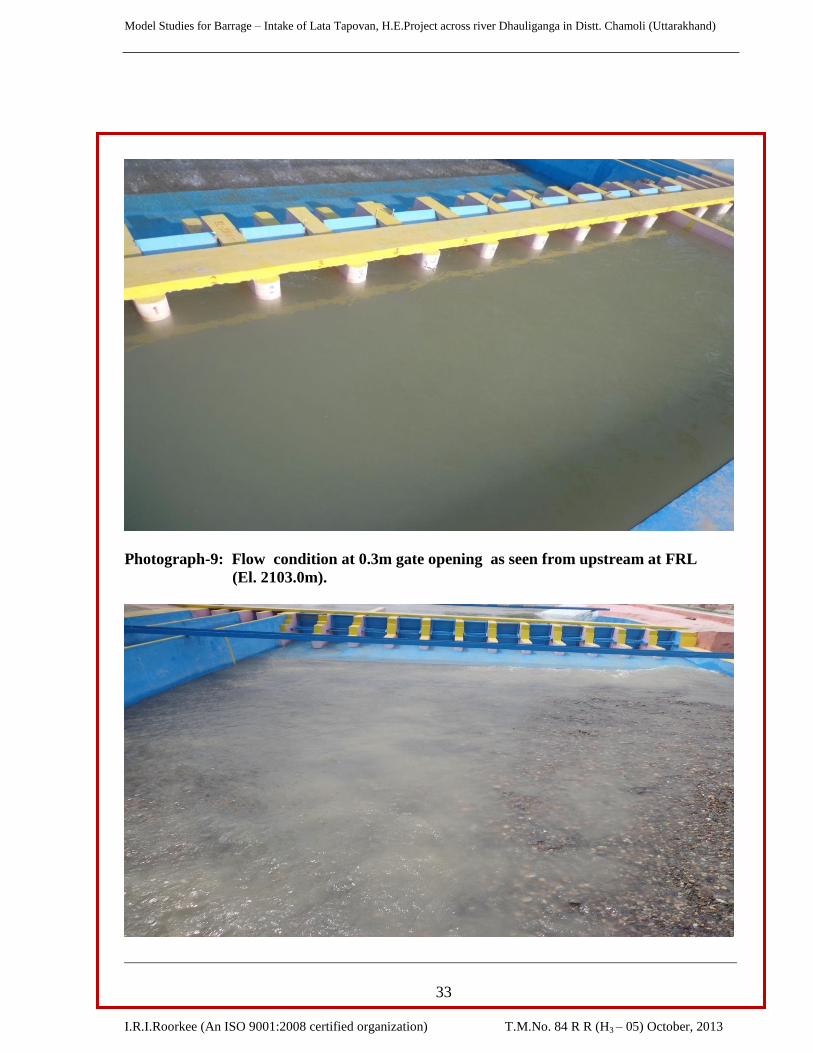
Photograph-9: Flow condition at 0.3m gate opening as seen from upstream at FRL
(El. 2103.0m).
Model Studies for Barrage – Intake of Lata Tapovan, H.E.Project across river Dhauliganga in Distt. Chamoli (Uttarakhand)
I.R.I.Roorkee (An ISO 9001:2008 certified organization) T.M.No. 84 R R (H3 – 05) October, 2013
34
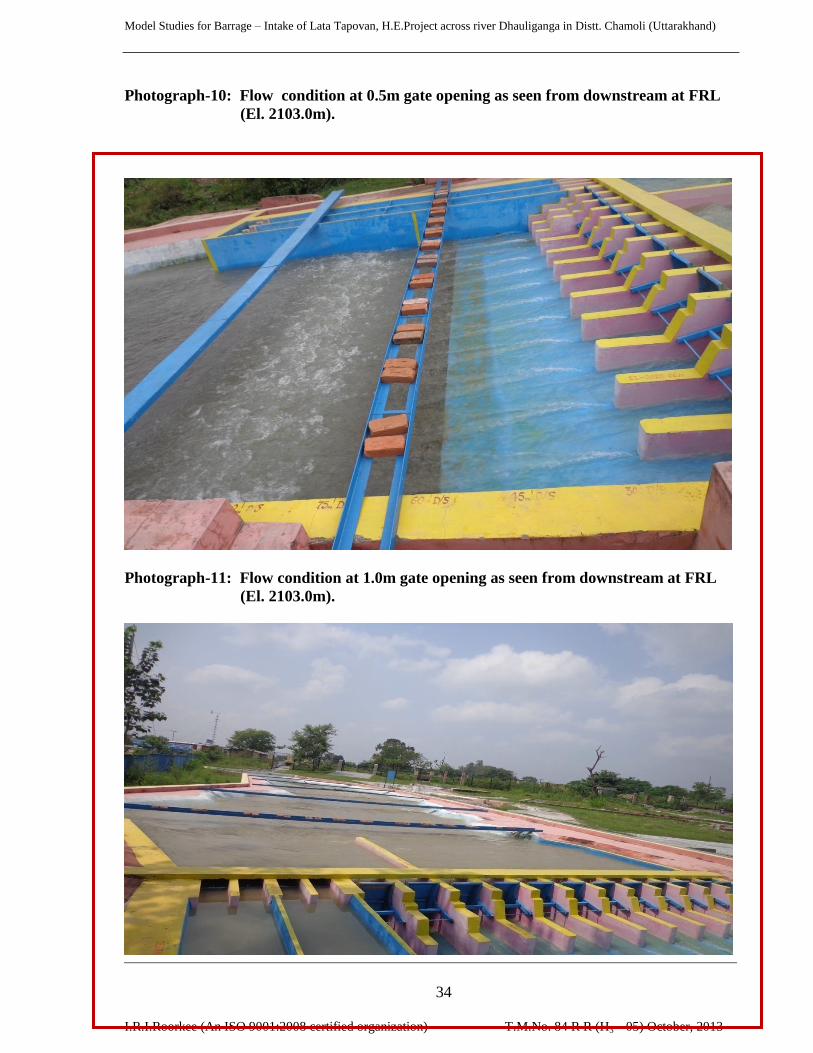
Photograph-10: Flow condition at 0.5m gate opening as seen from downstream at FRL
(El. 2103.0m).
Photograph-11: Flow condition at 1.0m gate opening as seen from downstream at FRL
(El. 2103.0m).
Model Studies for Barrage – Intake of Lata Tapovan, H.E.Project across river Dhauliganga in Distt. Chamoli (Uttarakhand)
I.R.I.Roorkee (An ISO 9001:2008 certified organization) T.M.No. 84 R R (H3 – 05) October, 2013
35
Photograph-12: Flow condition at 2.0m gate opening as seen from downstream at FRL
(El. 2103.0m).
Phatograph-13: Flow condition at 2000 cumec discharge under free flow as seen from
downstream.

Model Studies for Barrage – Intake of Lata Tapovan, H.E.Project across river Dhauliganga in Distt. Chamoli (Uttarakhand)
I.R.I.Roorkee (An ISO 9001:2008 certified organization) T.M.No. 84 R R (H3 – 05) October, 2013
36
Phatograph-14: A view of scoured bed profile in downstream of barrage after running
2000 cumec discharge under free flow condition.
Photograph-15: Flow condition at 2000 cumec discharge (without 4 left bays) under free
flow as seen from upstream.

Model Studies for Barrage – Intake of Lata Tapovan, H.E.Project across river Dhauliganga in Distt. Chamoli (Uttarakhand)
I.R.I.Roorkee (An ISO 9001:2008 certified organization) T.M.No. 84 R R (H3 – 05) October, 2013
37
Photograph-16: Flow condition at 2000 cumec discharge (without 4 left bays) under free
flow as seen from downstream.

Model Studies for Barrage – Intake of Lata Tapovan, H.E.Project across river Dhauliganga in Distt. Chamoli (Uttarakhand)
I.R.I.Roorkee (An ISO 9001:2008 certified organization) T.M.No. 84 R R (H3 – 05) October, 2013
38
DRAWINGS


Annexure-2:
Further model studies for Barrage–Intake of Lata Tapovan, H.E.Project across river Dhauliganga in Distt. Chamoli
(Uttarakhand)
______________________________________________________________________________________________________
I.R.I. Roorkee Research Report No. 85 RR (H3-06) March, 2015
1
CONTENTS
PARA NO. TITLES PAGE NO.
_ LIST OF TABLES 2
_ LIST OF PHOTOGRAPHS 2
_ LIST OF DRAWINGS 3
1 INTRODUCTION 5
2 THE PROBLEM 5
3 MODEL INVESTIGATIONS 6
4 DISCUSSION OF RESULTS AND
CONCLUSIONS 8
Further model studies for Barrage–Intake of Lata Tapovan, H.E.Project across river Dhauliganga in Distt. Chamoli
(Uttarakhand)
______________________________________________________________________________________________________
I.R.I. Roorkee Research Report No. 85 RR (H3-06) March, 2015
2
(A) LIST OF TABLES
Table-1 Observed velocities and discharge distribution across the barrage and Under-sluice bays at 1000 cumec and 2000 cumec discharge under free flow condition(Proposal-2). Table-2 Observed velocities and scour in bed, d/s of barrage at 1200 cumec and 2000 cumec discharge under gated condition. Table-3 Observed velocities and scour in bed, d/s of barrage at 2000 cumec discharge under free flow condition. Table-4 Observed velocities and discharge distribution across the barrage and Under-sluice bays at 1000 cumec and 2000 cumec discharge under free flow condition. Table-5 Observed velocities and scour in bed, d/s of barrage at 2000 cumec discharge under gated and free flow condition (Proposal-3). Table-6 Observed reservoir levels with closing barrage bays at 2000 cumec discharge under free flow condition (barrage bays closed from left side). Table-7 Observed velocities and scour in bed, d/s of barrage at 2000 cumec discharge under gated and free flow condition (Proposal-4).
(B) LIST OF PHOTOGRAPHS
Photograph-1 View of cutting rock ledge in left bank at 180m u/s of barrage and
upstream floor, blocks, gabion protection. (Proposal-2)
Photograph-2 View of downstream floor, blocks and gabion protection. (Proposal-2)
Photograph-3 Flow conditions in upstream of barrage maintaining FRL at 2000 cumec
discharge.
Photograph-4 Flow conditions in downstream of barrage in free flow condition at 1000
cumec discharge.
Photograph-5 Flow conditions in upstream of barrage in free flow condition at 2000
cumec discharge.
Photograph-6 View of upstream floor, blocks, gabion protection. (Proposal-3)
Photograph-7 View of downstream floor, blocks, pit and gabion protection.(Proposal-3)
Photograph-8 Flow conditions in upstream of barrage maintaining FRL at 2000 cumec
discharge.
Photograph-9 Flow conditions in downstream of barrage maintaining FRL at 2000
cumec discharge.
Further model studies for Barrage–Intake of Lata Tapovan, H.E.Project across river Dhauliganga in Distt. Chamoli
(Uttarakhand)
______________________________________________________________________________________________________
I.R.I. Roorkee Research Report No. 85 RR (H3-06) March, 2015
3
Photograph-10 Flow conditions in downstream of barrage maintaining FRL at 2000 cumec discharge. (Proposal-4) Photograph-11 Flow conditions in downstream of barrage in free flow condition at 1000 cumec discharge. Photograph-12 Flow conditions in downstream of barrage in free flow condition at
2000 cumec discharge. (C) LIST OF DRAWINGS
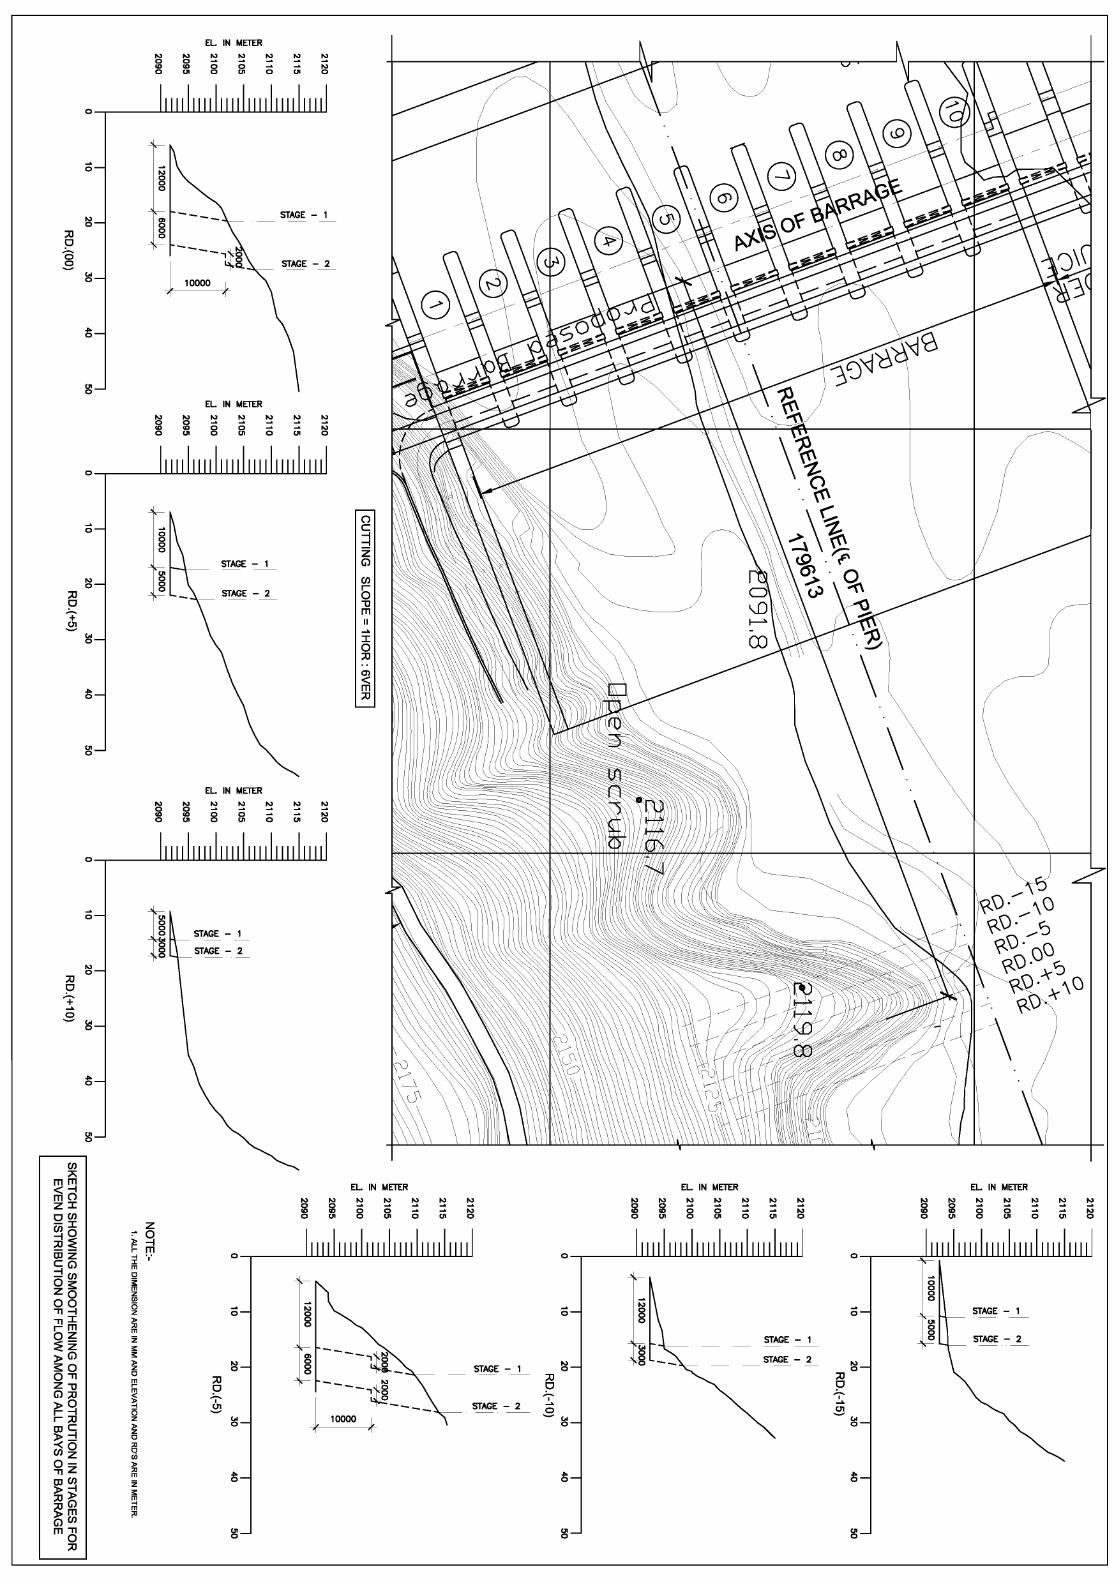
Drawing-1 Sketch of cutting rock ledge in left bank at 180m u/s of barrage in stages.
(Proposal-2)
Drawing-2 Plan of barrage with upstream floor, blocks, gabion protection and
downstream floor, blocks, pit and gabion protection. (Proposal-3)
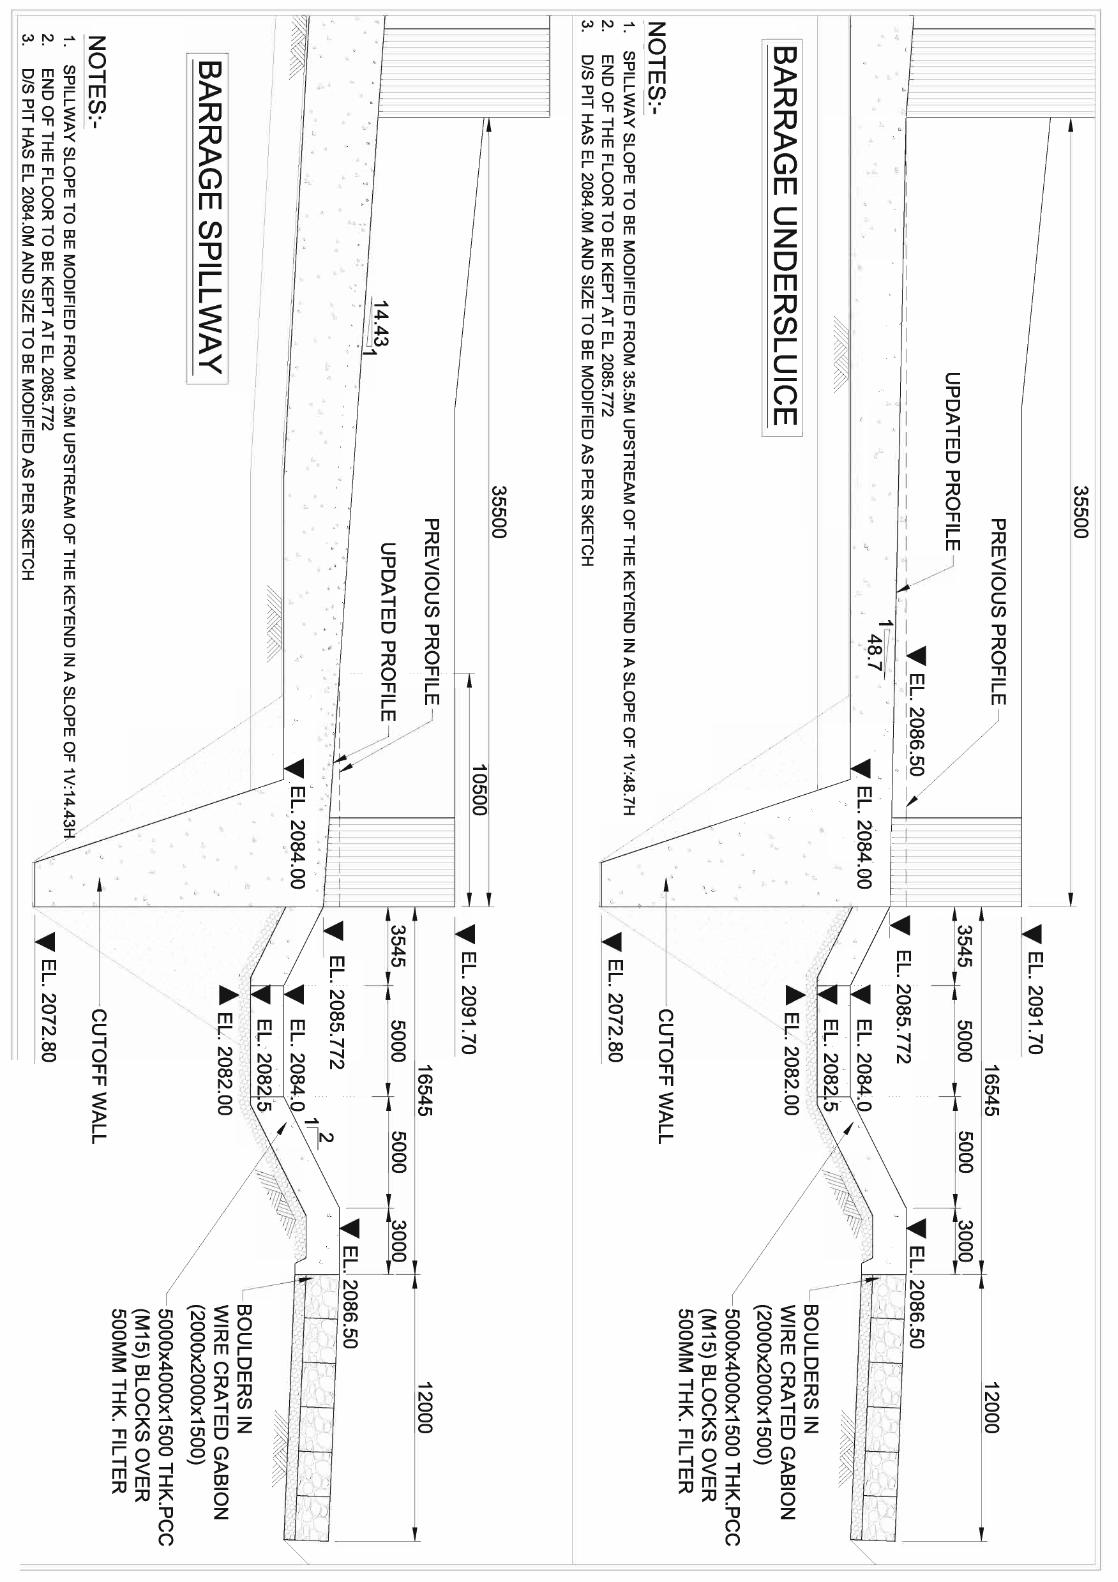
Drawing-3 L-section of barrage and under-sluice bays. (Proposal-3)
Drawing-4 L-section of barrage and under-sluice bays. (Proposal-4)

Further model studies for Barrage–Intake of Lata Tapovan, H.E.Project across river Dhauliganga in Distt. Chamoli
(Uttarakhand)
______________________________________________________________________________________________________
I.R.I. Roorkee Research Report No. 85 RR (H3-06) March, 2015
4
REPORT

Further model studies for Barrage–Intake of Lata Tapovan, H.E.Project across river Dhauliganga in Distt. Chamoli
(Uttarakhand)
______________________________________________________________________________________________________
I.R.I. Roorkee Research Report No. 85 RR (H3-06) March, 2015
5
1.0 INTRODUCTION
Lata – Tapovan Hydro Electric Project is proposed to be constructed across
river Dhauliganga near Lata village in Joshimath Tehsil, District Chamoli in
Uttarakhand. The project site is located at a distance of about 250 km from
Rishikesh. The power house is situated near Tapovan village. River
Dhauliganga is an important tributary of holy river Ganga. The project will be
executed by Larsen & Toubro Ltd. and envisages the construction of 18.0 m
high barrage to divert 79.25 cumec river discharge for power generation and a
required discharge for sediment flushing, through a water conductor system
comprising an intake, desilting chamber, HRT intake, 7.315 km. long head race
tunnel, a surge shaft, a pressure shaft, a surface power house with installation
of 3 units of 57 MW each and a tail race channel. A gross head of 277.65 m is
available between barrage and tail race exit point. The barrage has been
designed for 2000 cumec discharge with full reservoir level (FRL) at El. 2103.0
m and maximum draw down level (MDDL) at El. 2099.5 m.
2.0 THE PROBLEM
Model studies for barrage-intake of Lata – Tapovan H.E. Project was referred to
IRI Roorkee by DGM – Hydro Design, L&T Ltd, Faridabad vide his letter no.
L&T / FBD – EDRC / Lata, dated 18.02.2012. The scope of studies are as
follows:
2.1 For barrage model
(a) Discharge carrying capacity of spillways.
(b) Adequacy of energy dissipation arrangement.
(c) Sediment flushing capacity of spillways.
(d) Checking the adequacy of upstream and downstream apron length.
(e) Checking scour depth in the downstream of barrage.
2.2 Hydraulic model studies of barrage
T.M. No. 84RR(H3-05), October 2013 was issued with model studies regarding barrage model and studies have been done for point ‘a’ to ‘e’ except aforesaid point ‘c’ of para 2.1.

Further model studies for Barrage–Intake of Lata Tapovan, H.E.Project across river Dhauliganga in Distt. Chamoli
(Uttarakhand)
______________________________________________________________________________________________________
I.R.I. Roorkee Research Report No. 85 RR (H3-06) March, 2015
6
3.0 MODEL INVESTIGATIONS
3.1 In continuation, sponsor desired by his letter dated 10.01.2014 to run the model as per following modifications to study the impact on flow due to non-uniform flow distribution in barrage bays (Proposal-2).
1. Change in upstream bed of river from concrete bed to representative mobile bed at 380m u/s from barrage axis.
2. To study the possibility to minimize the non-uniformity of flow in barrage
bays by smoothening the protruding rock ledge at about 180m u/s on the left
bank of barrage. (Drg.-1)
3. To reduce the length of upstream raft and divide wall from barrage axis-
57.5m (39.5m from start of pier upstream).
4. True representation of upstream and downstream concrete C/C blocks and gabion protection as per following details.
(a) U/S side- C/C blocks – 5m, Gabion protection – 8m.
(b) D/S side- C/C blocks – 8m, Gabion protection – 8m.
3.2 Incorporating above modifications (Photograph-1 & 2), the model was run at
500 cumec, 1000 cumec & design discharge of 2000 cumec and corresponding
tail water levels were maintained at 360 m downstream of barrage axis as per
tail rating curve computed from the cross sections supplied by the sponsor. The
visual behaviour of the river was seen in free flow condition and it was observed
that due to the bends in upstream river reach, the concentration of flow was
either on left side or on right side of river throughout the represented reach in
the model on almost all the discharges. The discharge distribution in the bays of
barrage was found to be improved as compared with that found in earlier study
as shown in Table-1. The model was operated, maintaining FRL at 1200 cumec
& design discharge of 2000 cumec. The observed velocities and scour in bed,
d/s of barrage structure were almost same as found in earlier study. The results
are tabulated in Table-2 & 3. The pictorial views of flow conditions are shown in
(Photograph-3 to 5).
3.3 Having witnessed the above observations on dated 23.02.2014, the sponsor
proposed to conduct the model study with the following modifications in the
Further model studies for Barrage–Intake of Lata Tapovan, H.E.Project across river Dhauliganga in Distt. Chamoli
(Uttarakhand)
______________________________________________________________________________________________________
I.R.I. Roorkee Research Report No. 85 RR (H3-06) March, 2015
7
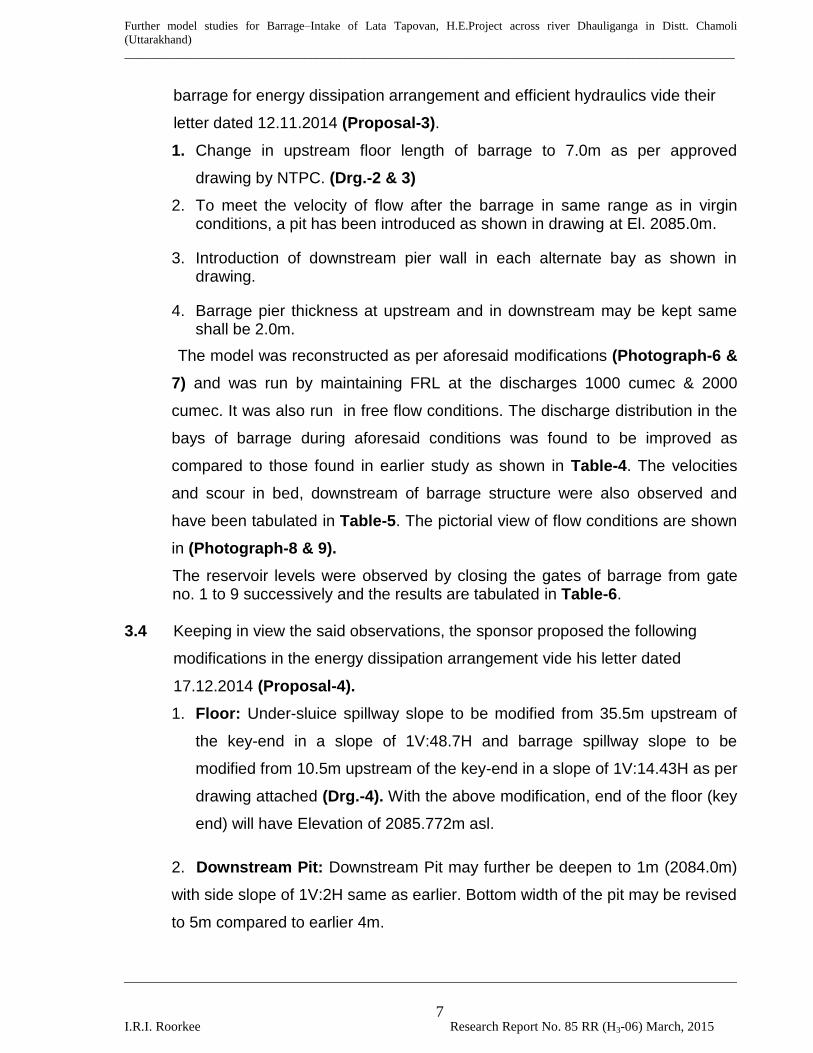
barrage for energy dissipation arrangement and efficient hydraulics vide their
letter dated 12.11.2014 (Proposal-3).
1. Change in upstream floor length of barrage to 7.0m as per approved
drawing by NTPC. (Drg.-2 & 3)
2. To meet the velocity of flow after the barrage in same range as in virgin conditions, a pit has been introduced as shown in drawing at El. 2085.0m.
3. Introduction of downstream pier wall in each alternate bay as shown in drawing.
4. Barrage pier thickness at upstream and in downstream may be kept same shall be 2.0m.
The model was reconstructed as per aforesaid modifications (Photograph-6 &
7) and was run by maintaining FRL at the discharges 1000 cumec & 2000
cumec. It was also run in free flow conditions. The discharge distribution in the
bays of barrage during aforesaid conditions was found to be improved as
compared to those found in earlier study as shown in Table-4. The velocities
and scour in bed, downstream of barrage structure were also observed and
have been tabulated in Table-5. The pictorial view of flow conditions are shown
in (Photograph-8 & 9).
The reservoir levels were observed by closing the gates of barrage from gate no. 1 to 9 successively and the results are tabulated in Table-6.
3.4 Keeping in view the said observations, the sponsor proposed the following
modifications in the energy dissipation arrangement vide his letter dated
17.12.2014 (Proposal-4).
1. Floor: Under-sluice spillway slope to be modified from 35.5m upstream of
the key-end in a slope of 1V:48.7H and barrage spillway slope to be
modified from 10.5m upstream of the key-end in a slope of 1V:14.43H as per
drawing attached (Drg.-4). With the above modification, end of the floor (key
end) will have Elevation of 2085.772m asl.
2. Downstream Pit: Downstream Pit may further be deepen to 1m (2084.0m)
with side slope of 1V:2H same as earlier. Bottom width of the pit may be revised
to 5m compared to earlier 4m.
Further model studies for Barrage–Intake of Lata Tapovan, H.E.Project across river Dhauliganga in Distt. Chamoli
(Uttarakhand)
______________________________________________________________________________________________________
I.R.I. Roorkee Research Report No. 85 RR (H3-06) March, 2015
8
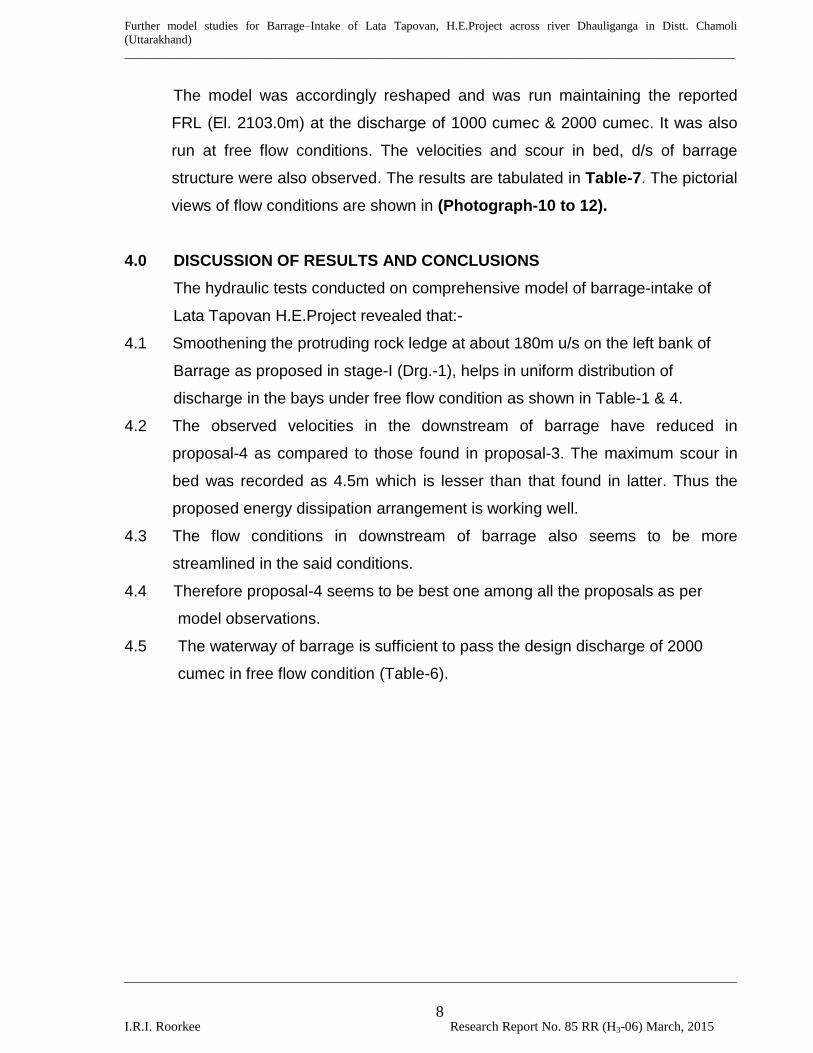
The model was accordingly reshaped and was run maintaining the reported
FRL (El. 2103.0m) at the discharge of 1000 cumec & 2000 cumec. It was also
run at free flow conditions. The velocities and scour in bed, d/s of barrage
structure were also observed. The results are tabulated in Table-7. The pictorial
views of flow conditions are shown in (Photograph-10 to 12).
4.0 DISCUSSION OF RESULTS AND CONCLUSIONS
The hydraulic tests conducted on comprehensive model of barrage-intake of
Lata Tapovan H.E.Project revealed that:-
4.1 Smoothening the protruding rock ledge at about 180m u/s on the left bank of
Barrage as proposed in stage-I (Drg.-1), helps in uniform distribution of
discharge in the bays under free flow condition as shown in Table-1 & 4.
4.2 The observed velocities in the downstream of barrage have reduced in
proposal-4 as compared to those found in proposal-3. The maximum scour in
bed was recorded as 4.5m which is lesser than that found in latter. Thus the
proposed energy dissipation arrangement is working well.
4.3 The flow conditions in downstream of barrage also seems to be more
streamlined in the said conditions.
4.4 Therefore proposal-4 seems to be best one among all the proposals as per
model observations.
4.5 The waterway of barrage is sufficient to pass the design discharge of 2000
cumec in free flow condition (Table-6).

Further model studies for Barrage–Intake of Lata Tapovan, H.E.Project across river Dhauliganga in Distt. Chamoli
(Uttarakhand)
______________________________________________________________________________________________________
I.R.I. Roorkee Research Report No. 85 RR (H3-06) March, 2015
9
TABLES
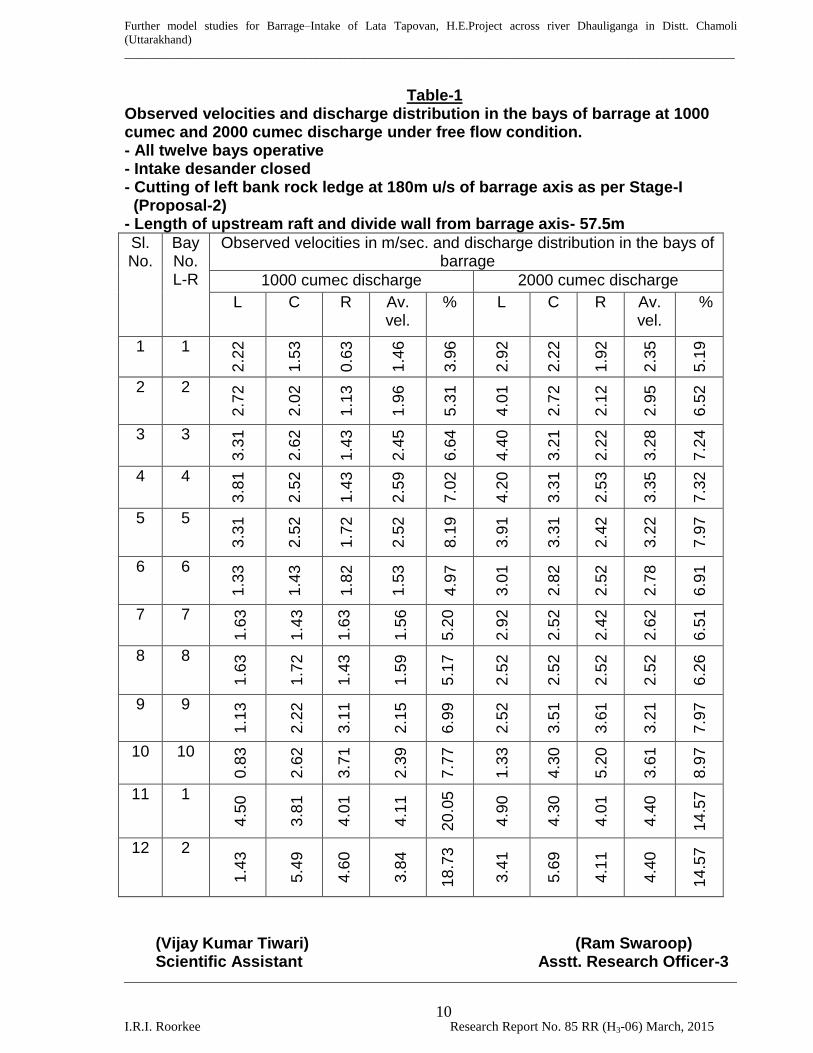
Further model studies for Barrage–Intake of Lata Tapovan, H.E.Project across river Dhauliganga in Distt. Chamoli
(Uttarakhand)
______________________________________________________________________________________________________
I.R.I. Roorkee Research Report No. 85 RR (H3-06) March, 2015
10
Table-1 Observed velocities and discharge distribution in the bays of barrage at 1000 cumec and 2000 cumec discharge under free flow condition. - All twelve bays operative - Intake desander closed - Cutting of left bank rock ledge at 180m u/s of barrage axis as per Stage-I (Proposal-2) - Length of upstream raft and divide wall from barrage axis- 57.5m
Sl. No.
Bay No. L-R
Observed velocities in m/sec. and discharge distribution in the bays of barrage
1000 cumec discharge 2000 cumec discharge
L C R Av. vel.
% L C R Av. vel.
%
1 1
2.2
2
1.5
3
0.6
3
1.4
6
3.9
6
2.9
2
2.2
2
1.9
2
2.3
5
5.1
9
2 2
2.7
2
2.0
2
1.1
3
1.9
6
5.3
1
4.0
1
2.7
2
2.1
2
2.9
5
6.5
2
3 3
3.3
1
2.6
2
1.4
3
2.4
5
6.6
4
4.4
0
3.2
1
2.2
2
3.2
8
7.2
4
4 4
3.8
1
2.5
2
1.4
3
2.5
9
7.0
2
4.2
0
3.3
1
2.5
3
3.3
5
7.3
2
5 5
3.3
1
2.5
2
1.7
2
2.5
2
8.1
9
3.9
1
3.3
1
2.4
2
3.2
2
7.9
7
6 6
1.3
3
1.4
3
1.8
2
1.5
3
4.9
7
3.0
1
2.8
2
2.5
2
2.7
8
6.9
1
7 7
1.6
3
1.4
3
1.6
3
1.5
6
5.2
0
2.9
2
2.5
2
2.4
2
2.6
2
6.5
1
8 8
1.6
3
1.7
2
1.4
3
1.5
9
5.1
7
2.5
2
2.5
2
2.5
2
2.5
2
6.2
6
9 9
1.1
3
2.2
2
3.1
1
2.1
5
6.9
9
2.5
2
3.5
1
3.6
1
3.2
1
7.9
7
10 10
0.8
3
2.6
2
3.7
1
2.3
9
7.7
7
1.3
3
4.3
0
5.2
0
3.6
1
8.9
7
11 1
4.5
0
3.8
1
4.0
1
4.1
1
20
.05
4.9
0
4.3
0
4.0
1
4.4
0
14
.57
12 2
1.4
3
5.4
9
4.6
0
3.8
4
18
.73
3.4
1
5.6
9
4.1
1
4.4
0
14
.57
(Vijay Kumar Tiwari) (Ram Swaroop) Scientific Assistant Asstt. Research Officer-3

Further model studies for Barrage–Intake of Lata Tapovan, H.E.Project across river Dhauliganga in Distt. Chamoli
(Uttarakhand)
______________________________________________________________________________________________________
I.R.I. Roorkee Research Report No. 85 RR (H3-06) March, 2015
11
Table-2
Observed velocities and scour in bed, d/s of barrage at 1200 cumec discharge under gated condition maintaining FRL 2103.0m. - All gates equally opened - Intake desander closed - Cutting of left bank rock ledge at 180m u/s of barrage axis as per Stage-I - Length of upstream raft and divide wall from barrage axis- 57.5m
Sl.No.
Observed velocities in the downstream of barrage axis (m/sec.)
Location from barrage axis and d/s of bay no.
Location Bay-2 Bay-5 Bay-8 Bay-11 Bay-12
1 Just d/s of gate
18.99 14.82 14.03 20.57 19.19
2 30.0m d/s 19.28 18.89 18.99 14.92 19.88
3 60.0m d/s 5.79 5.59 11.05 18.59 9.07
4 75.0m d/s 3.61 3.51 3.21 8.07 6.29
Scoured bed and scour depth
Bay-1 Bay-3 Bay-5 Bay-7 Bay-9 Bay-12
1 2084.1 2084.8 2084.4 2083.8 2082.4 2083.2
2 2.4m 1.7m 2.1m 2.7m 4.1m 3.3m
2000 cumec discharge
Sl.No.
Observed velocities in the downstream of barrage axis (m/sec.)
Location from barrage axis and d/s of bay no.
Location Bay-2 Bay-5 Bay-8 Bay-11 Bay-12
1 Just d/s of gate
16.61 16.90 17.50 16.80 17.40
2 30.0m d/s 17.80 17.80 19.19 17.50 18.39
3 60.0m d/s 11.65 9.26 12.14 15.12 14.72
4 75.0m d/s 3.31 4.20 7.48 7.08 8.87
Scoured bed and scour depth
Bay-1 Bay-3 Bay-5 Bay-7 Bay-9 Bay-12
1 2084.0 2085.1 2084.2 2083.0 2083.0 2082.0
2 2.5m 1.4m 2.3m 3.5m 3.5m 4.5m
(Vijay Kumar Tiwari) (Ram Swaroop)
Scientific Assistant Asstt. Research Officer-3
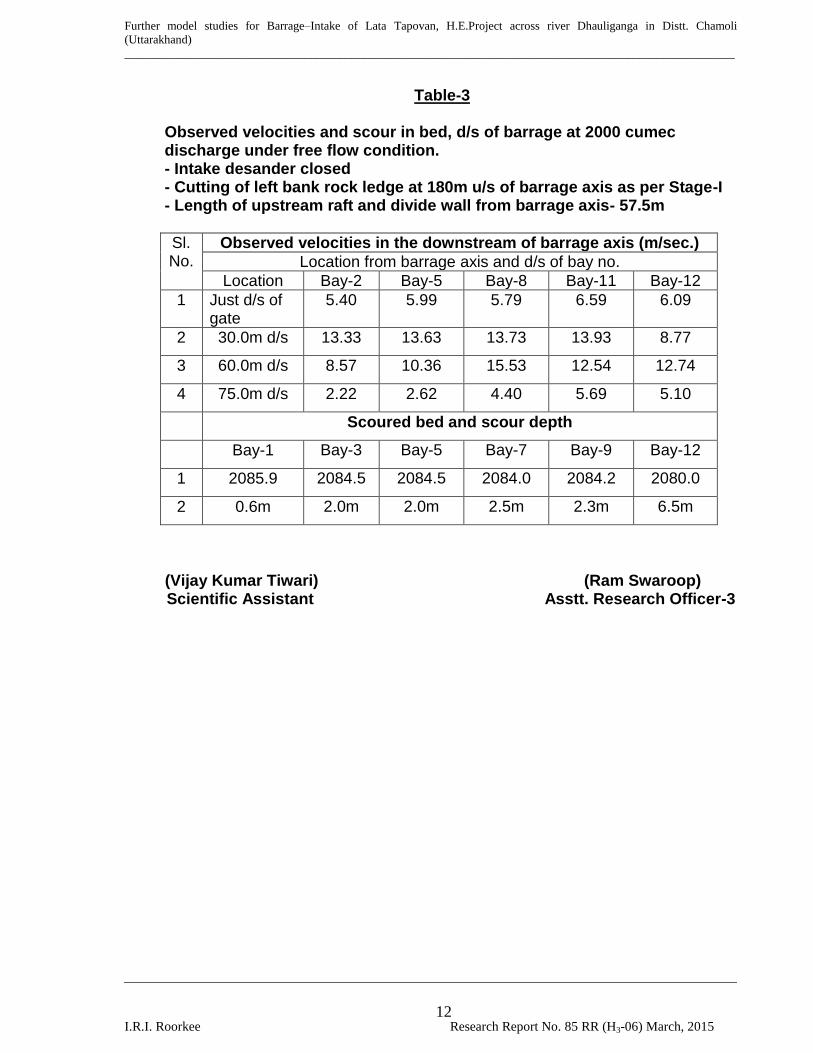
Further model studies for Barrage–Intake of Lata Tapovan, H.E.Project across river Dhauliganga in Distt. Chamoli
(Uttarakhand)
______________________________________________________________________________________________________
I.R.I. Roorkee Research Report No. 85 RR (H3-06) March, 2015
12
Table-3
Observed velocities and scour in bed, d/s of barrage at 2000 cumec discharge under free flow condition. - Intake desander closed - Cutting of left bank rock ledge at 180m u/s of barrage axis as per Stage-I - Length of upstream raft and divide wall from barrage axis- 57.5m
Sl.No.
Observed velocities in the downstream of barrage axis (m/sec.)
Location from barrage axis and d/s of bay no.
Location Bay-2 Bay-5 Bay-8 Bay-11 Bay-12
1 Just d/s of gate
5.40 5.99 5.79 6.59 6.09
2 30.0m d/s 13.33 13.63 13.73 13.93 8.77
3 60.0m d/s 8.57 10.36 15.53 12.54 12.74
4 75.0m d/s 2.22 2.62 4.40 5.69 5.10
Scoured bed and scour depth
Bay-1 Bay-3 Bay-5 Bay-7 Bay-9 Bay-12
1 2085.9 2084.5 2084.5 2084.0 2084.2 2080.0
2 0.6m 2.0m 2.0m 2.5m 2.3m 6.5m
(Vijay Kumar Tiwari) (Ram Swaroop)
Scientific Assistant Asstt. Research Officer-3

Further model studies for Barrage–Intake of Lata Tapovan, H.E.Project across river Dhauliganga in Distt. Chamoli
(Uttarakhand)
______________________________________________________________________________________________________
I.R.I. Roorkee Research Report No. 85 RR (H3-06) March, 2015
13
Table-4
Observed velocities and discharge distribution in the bays of barrage at 1000 cumec and 2000 cumec discharge under free flow condition. - All twelve bays operative, Intake desander closed - Cutting of left bank rock ledge at 180m u/s of barrage axis as per Stage-I - Length of upstream raft and divide wall from barrage axis- 7.0m (Proposal-3)
Sl. No.
Bay No. L-R
Observed velocities in m/sec. and discharge distribution in the bays of barrage
1000 cumec discharge 2000 cumec discharge Depth
(m) Vel.
(m/sec) Discharge (m
3/sec)
% Depth (m)
Vel. (m/sec)
Discharge (m
3/sec)
%
1 1 2.5 1.78 49.04 4.91 3.5 2.37 91.25 4.42
2 2 2.5 2.10 57.75 5.78 3.5 2.88 110.88 5.37
3 3 2.5 1.99 54.73 5.48 3.5 3.29 126.67 6.14
4 4 2.5 2.20 60.50 6.05 3.5 3.49 134.37 6.51
5 5 2.5 2.31 63.53 6.36 3.5 4.00 154.00 7.46
6 6 2.5 2.31 63.53 6.36 3.5 4.11 158.24 7.67
7 7 2.5 2.52 69.30 6.94 3.5 3.90 150.15 7.28
8 8 2.5 3.14 86.35 8.64 3.5 3.29 126.67 6.14
9 9 2.5 3.14 86.35 8.64 3.5 3.49 134.37 6.51
10 10 2.5 3.25 89.38 8.94 3.5 4.21 162.09 7.86
11 1 3.5 3.98 153.23 15.33 4.5 7.37 364.82 17.68
12 2 3.5 4.30 165.55 16.57 4.5 7.07 349.97 16.96
Total 999.24 100.00 2063.48 100.00
(Vijay Kumar Tiwari) (Ram Swaroop) Scientific Assistant Asstt. Research Officer-3
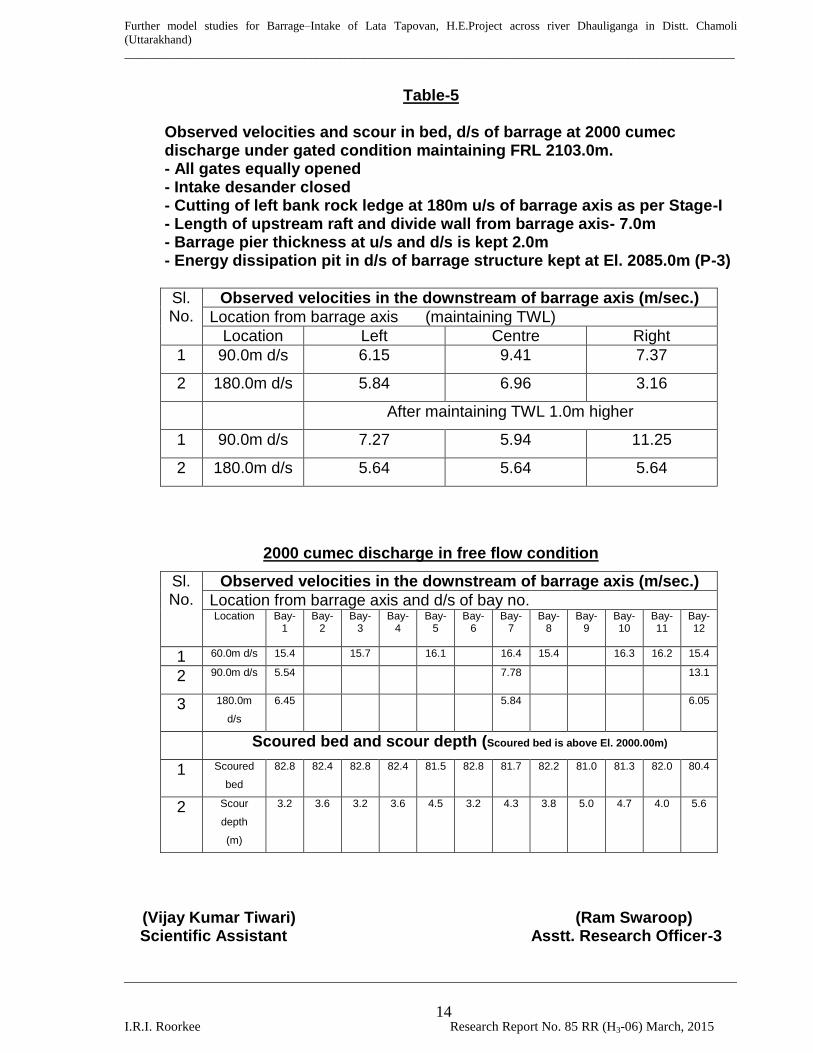
Further model studies for Barrage–Intake of Lata Tapovan, H.E.Project across river Dhauliganga in Distt. Chamoli
(Uttarakhand)
______________________________________________________________________________________________________
I.R.I. Roorkee Research Report No. 85 RR (H3-06) March, 2015
14
Table-5
Observed velocities and scour in bed, d/s of barrage at 2000 cumec discharge under gated condition maintaining FRL 2103.0m. - All gates equally opened - Intake desander closed - Cutting of left bank rock ledge at 180m u/s of barrage axis as per Stage-I - Length of upstream raft and divide wall from barrage axis- 7.0m - Barrage pier thickness at u/s and d/s is kept 2.0m - Energy dissipation pit in d/s of barrage structure kept at El. 2085.0m (P-3)
Sl.No.
Observed velocities in the downstream of barrage axis (m/sec.)
Location from barrage axis (maintaining TWL)
Location Left Centre Right
1 90.0m d/s 6.15 9.41 7.37
2 180.0m d/s 5.84 6.96 3.16
After maintaining TWL 1.0m higher
1 90.0m d/s 7.27 5.94 11.25
2 180.0m d/s 5.64 5.64 5.64
2000 cumec discharge in free flow condition
Sl.No.
Observed velocities in the downstream of barrage axis (m/sec.)
Location from barrage axis and d/s of bay no. Location Bay-
1 Bay-
2 Bay-
3 Bay-
4 Bay-
5 Bay-
6
Bay-7
Bay-8
Bay-9
Bay-10
Bay-11
Bay-12
1 60.0m d/s 15.4 15.7 16.1 16.4 15.4 16.3 16.2 15.4
2 90.0m d/s 5.54 7.78 13.1
3 180.0m
d/s
6.45 5.84 6.05
Scoured bed and scour depth (Scoured bed is above El. 2000.00m)
1 Scoured
bed
82.8 82.4 82.8 82.4 81.5 82.8 81.7 82.2 81.0 81.3 82.0 80.4
2 Scour
depth
(m)
3.2 3.6 3.2 3.6 4.5 3.2 4.3 3.8 5.0 4.7 4.0 5.6
(Vijay Kumar Tiwari) (Ram Swaroop) Scientific Assistant Asstt. Research Officer-3
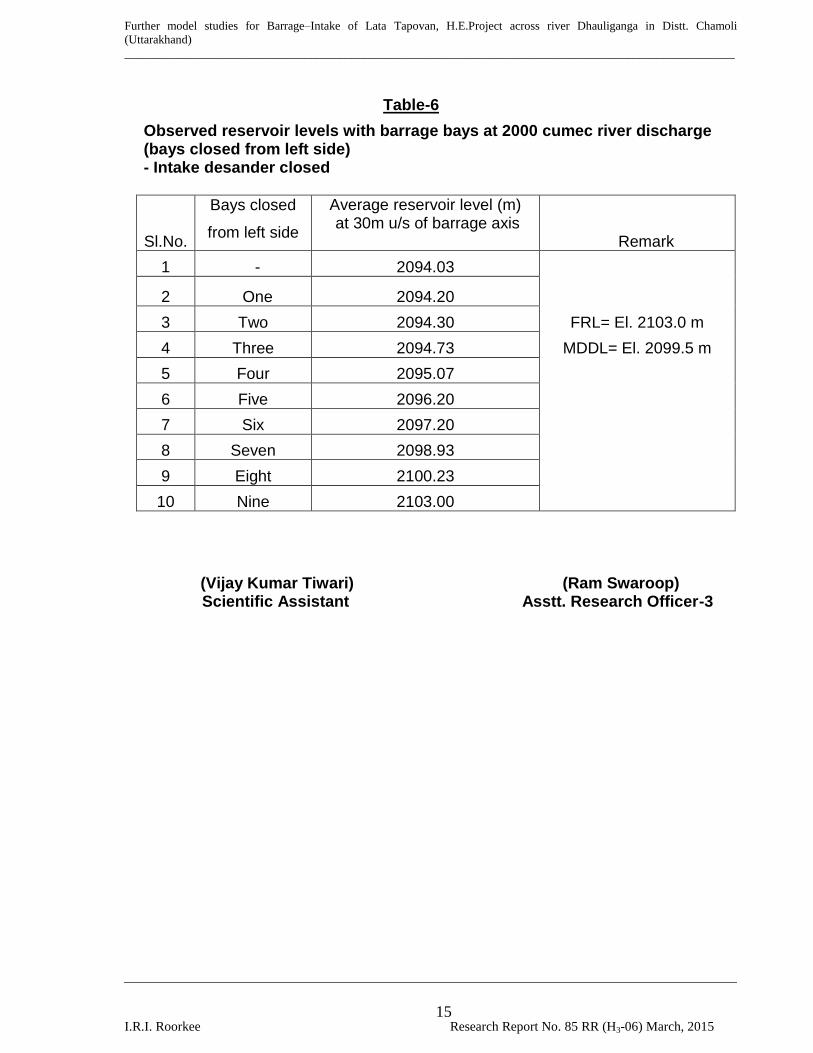
Further model studies for Barrage–Intake of Lata Tapovan, H.E.Project across river Dhauliganga in Distt. Chamoli
(Uttarakhand)
______________________________________________________________________________________________________
I.R.I. Roorkee Research Report No. 85 RR (H3-06) March, 2015
15
Table-6
Observed reservoir levels with barrage bays at 2000 cumec river discharge (bays closed from left side)
- Intake desander closed
Sl.No.
Bays closed
from left side
Average reservoir level (m) at 30m u/s of barrage axis
Remark
1 - 2094.03
2 One 2094.20
FRL= El. 2103.0 m
3 Two 2094.30
4 Three 2094.73 MDDL= El. 2099.5 m
5 Four 2095.07
6 Five 2096.20
7 Six 2097.20
8 Seven 2098.93
9 Eight 2100.23
10 Nine 2103.00
(Vijay Kumar Tiwari) (Ram Swaroop) Scientific Assistant Asstt. Research Officer-3

Further model studies for Barrage–Intake of Lata Tapovan, H.E.Project across river Dhauliganga in Distt. Chamoli
(Uttarakhand)
______________________________________________________________________________________________________
I.R.I. Roorkee Research Report No. 85 RR (H3-06) March, 2015
16
Table-7
Observed velocities and scour in bed, d/s of barrage at 1000 & 2000 cumec discharge under gated condition maintaining FRL 2103.0m. - All gates equally opened - Intake desander closed - Cutting of left bank rock ledge at 180m u/s of barrage axis as per Stage-I - Length of upstream raft and divide wall from barrage axis- 7.0m - Barrage pier thickness at u/s and d/s is kept 2.0m - Energy dissipation pit in d/s of barrage structure kept at El. 2084.0m (Proposal-4)
Sl.No.
Observed velocities in the downstream of barrage axis (m/sec.)
Location from barrage axis (maintaining TWL) at 1000 cumec
Location Left Centre Right
1 60.0m d/s 15.13 14.52 15.64
2 90.0m d/s 5.43 6.76 7.68
3 180.0m d/s 2.88 4.21 4.41
At 2000 cumec
1 60.0m d/s 14.52 14.52 15.54
2 90.0m d/s 6.15 5.43 6.15
3 180.0m d/s 6.15 6.35 4.21
2000 cumec discharge in free flow condition
Sl.No.
Observed velocities in the downstream of barrage axis (m/sec.)
Location from barrage axis and d/s of bay no. Location Bay-
1 Bay-
2 Bay-
3 Bay-
4 Bay-
5 Bay-
6
Bay-7
Bay-8
Bay-9
Bay-10
Bay-11
Bay-12
1 60.0m d/s 14.1 15.3 13.9 14.6 12.4 12.2 12.1 12.3 12.1 12.0 13.3 12.1
2 90.0m d/s 5.43 6.56 7.88
3 180.0m
d/s
5.02 5.43 5.74
Scoured bed and scour depth (Scoured bed is above El. 2000.00m)
1 Scoured
bed
83.2 82.8 84.2 83.1 83.0 83.2 82.0 82.4 82.5 82.8 83.5 81.5
2 Scour
depth
(m)
2.8 3.2 1.8 2.9 3.0 2.8 4.0 3.6 3.5 3.2 2.5 4.5
(Vijay Kumar Tiwari) (Ram Swaroop) Scientific Assistant Asstt. Research Officer-3

Further model studies for Barrage–Intake of Lata Tapovan, H.E.Project across river Dhauliganga in Distt. Chamoli
(Uttarakhand)
______________________________________________________________________________________________________
I.R.I. Roorkee Research Report No. 85 RR (H3-06) March, 2015
17
PHOTOGRAPHS
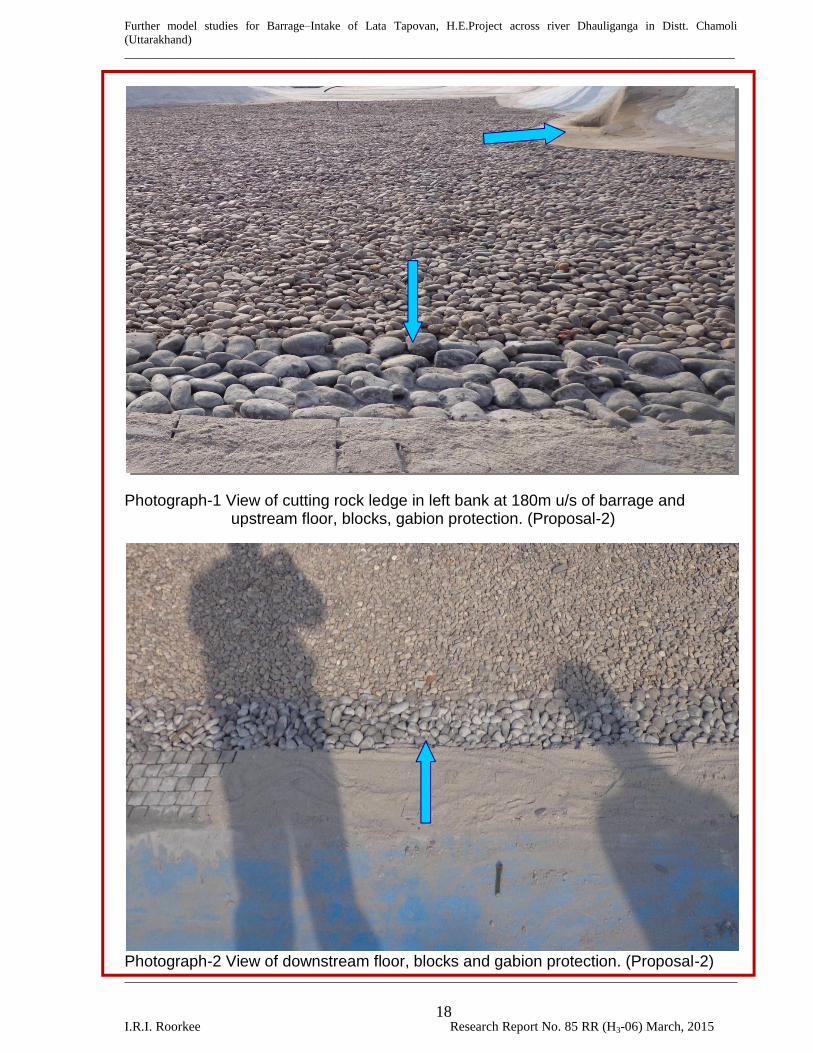
Further model studies for Barrage–Intake of Lata Tapovan, H.E.Project across river Dhauliganga in Distt. Chamoli (Uttarakhand)______________________________________________________________________________________________________
I.R.I. Roorkee Research Report No. 85 RR (H3-06) March, 2015 18
Photograph-1 View of cutting rock ledge in left bank at 180m u/s of barrage and upstream floor, blocks, gabion protection. (Proposal-2)
Photograph-2 View of downstream floor, blocks and gabion protection. (Proposal-2)

Further model studies for Barrage–Intake of Lata Tapovan, H.E.Project across river Dhauliganga in Distt. Chamoli
(Uttarakhand)
______________________________________________________________________________________________________
I.R.I. Roorkee Research Report No. 85 RR (H3-06) March, 2015
19
Photograph-3 Flow conditions in upstream of barrage maintaining FRL at 2000 cumec discharge.
Photograph-4 Flow conditions in downstream of barrage in free flow condition at 1000 cumec discharge.
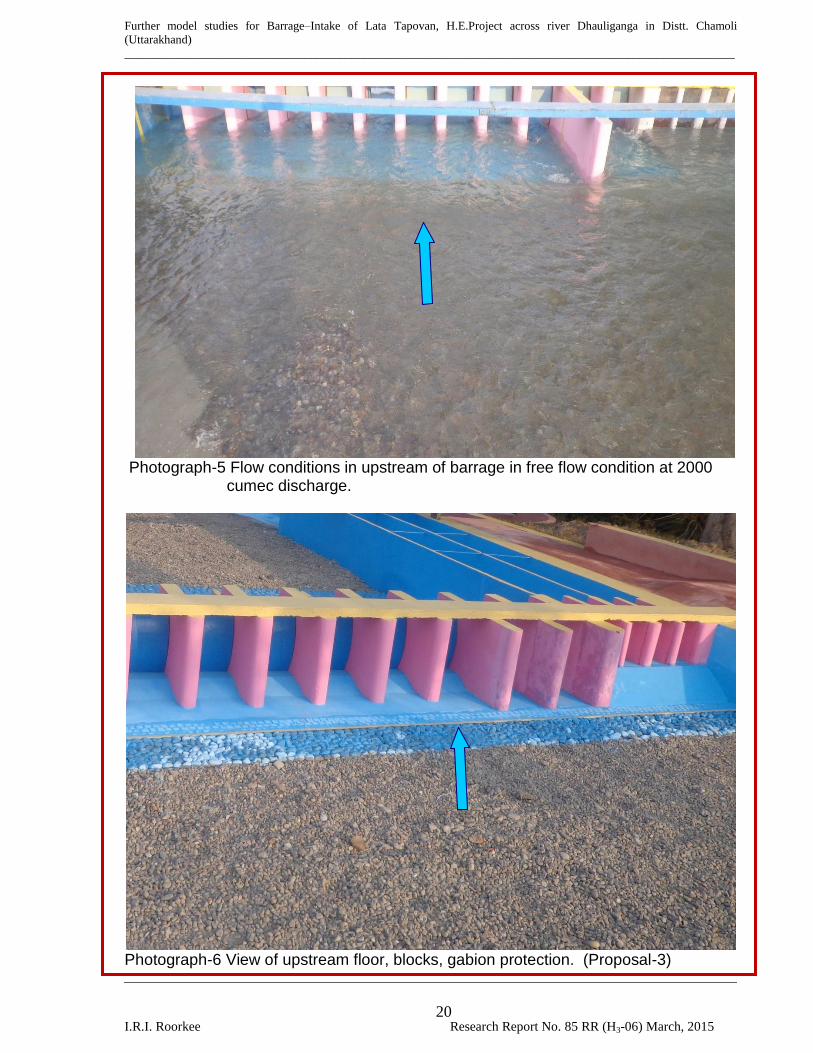
Further model studies for Barrage–Intake of Lata Tapovan, H.E.Project across river Dhauliganga in Distt. Chamoli
(Uttarakhand)
______________________________________________________________________________________________________
I.R.I. Roorkee Research Report No. 85 RR (H3-06) March, 2015
20
Photograph-5 Flow conditions in upstream of barrage in free flow condition at 2000 cumec discharge.
Photograph-6 View of upstream floor, blocks, gabion protection. (Proposal-3)
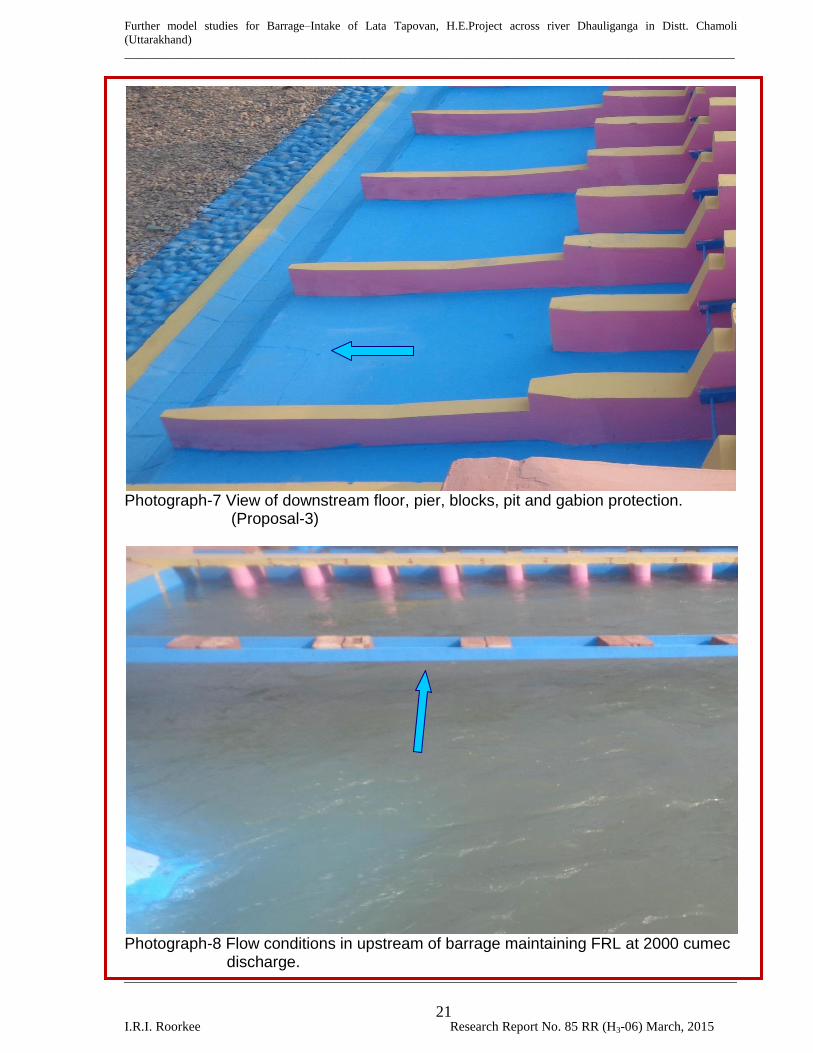
Further model studies for Barrage–Intake of Lata Tapovan, H.E.Project across river Dhauliganga in Distt. Chamoli
(Uttarakhand)
______________________________________________________________________________________________________
I.R.I. Roorkee Research Report No. 85 RR (H3-06) March, 2015
21
Photograph-7 View of downstream floor, pier, blocks, pit and gabion protection. (Proposal-3)
Photograph-8 Flow conditions in upstream of barrage maintaining FRL at 2000 cumec discharge.
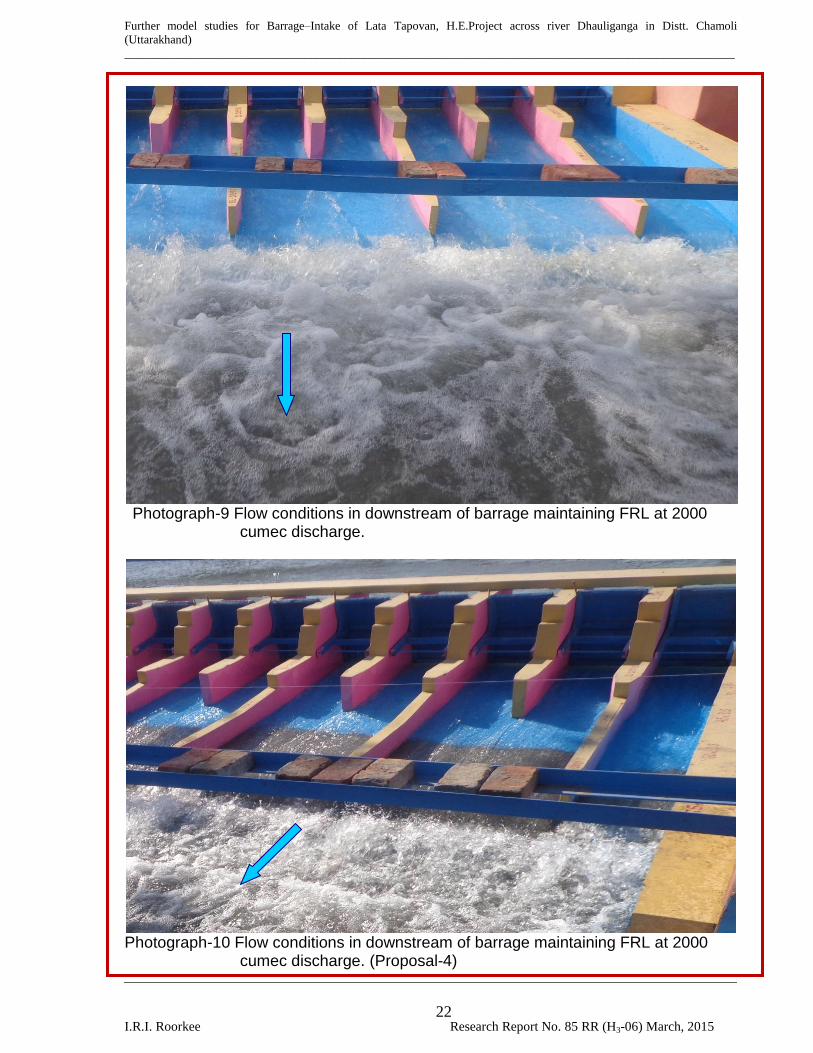
Further model studies for Barrage–Intake of Lata Tapovan, H.E.Project across river Dhauliganga in Distt. Chamoli
(Uttarakhand)
______________________________________________________________________________________________________
I.R.I. Roorkee Research Report No. 85 RR (H3-06) March, 2015
22
Photograph-9 Flow conditions in downstream of barrage maintaining FRL at 2000 cumec discharge.
Photograph-10 Flow conditions in downstream of barrage maintaining FRL at 2000 cumec discharge. (Proposal-4)

Further model studies for Barrage–Intake of Lata Tapovan, H.E.Project across river Dhauliganga in Distt. Chamoli
(Uttarakhand)
______________________________________________________________________________________________________
I.R.I. Roorkee Research Report No. 85 RR (H3-06) March, 2015
23
Photograph-11 Flow conditions in downstream of barrage in free flow condition at 1000 cumec discharge.
Photograph-12 Flow conditions in downstream of barrage in free flow condition at
2000 cumec discharge.

Further model studies for Barrage–Intake of Lata Tapovan, H.E.Project across river Dhauliganga in Distt. Chamoli
(Uttarakhand)
______________________________________________________________________________________________________
I.R.I. Roorkee Research Report No. 85 RR (H3-06) March, 2015
24
DRAWINGS