MODEL OF TRANSPORTATION MODE SELECTION … · line over private vehicle service because fast travel...
12
MODEL OF TRANSPORTATION MODE SELECTION BETWEEN PRIVATE VEHICLE AND SERPONG- TANAHABANG COMMUTER LINE A Y Nurhidayat 1 , H Widyastuti 2 , Sucipto 3 , D P Utomo 4 1. Sepuluh Nopember Institute of Technology, 2. Sepuluh Nopember Institute of Technology, 3. Agency For The Assesment and Application of Technology, 4. Agency For The Assesment and Application of Technology corresponding author: [email protected] Abstract: Transportation demand from Bodetabek to Jakarta during the period of 2002 up to 2010 has increased by ± 20% per year. While the growth of the road network in the same period only grew 0.01% per year. This condition is so unbalanced that the efficiency of road space usage must be done, one of which is by increasing the role of public transportation especially by promoting the use of mass transportation based on rail road as the mode choice in doing daily trip. This research was conducted to analyze the model of transportation mode selection between private vehicle and Serpong-Tanahabang commuter line route as an empirical case study. Revealed Preference techniques and binomial logit model are used in this study as tools for data collection and processing. We found that with the operation Serpong-Tanahabang commuter line route thas a negative impact on private vehicle demand because a big number of passengers preferred commuter line over private vehicle service because fast travel time and less travel cost. Keywords: demand, public transportation, mode choice, commuter line, revealed preference Introduction Jakarta as the capital of the Republic of Indonesia, became the center of economic activity of the country. The many economic activities in Jakata cause transportation problems such as traffic congestion on the road, decreasing air quality, loss of time value and so on. The problem of congestion due to the use of private vehicles is not only happening in Jakarta, but also on the connecting roads of Jakarta with the supporting areas of Bogor, Depok, Tangerang and Bekasi (Jabodetabek). Increasing congestion due to private use encourages the government to continue improving and adding transportation facilities and infrastructure. The development of facilities and infrastructure is carried out to improve the services of public transportation especially related to the use of mass transportation. 238 Copyright © 2018, the Authors. Published by Atlantis Press. This is an open access article under the CC BY-NC license (http://creativecommons.org/licenses/by-nc/4.0/). Advances in Engineering Research (AER), volume 147 Conference on Global Research on Sustainable Transport (GROST 2017)
Transcript of MODEL OF TRANSPORTATION MODE SELECTION … · line over private vehicle service because fast travel...

MODEL OF TRANSPORTATION MODE SELECTION
BETWEEN PRIVATE VEHICLE AND SERPONG-
TANAHABANG COMMUTER LINE
A Y Nurhidayat1, H Widyastuti2, Sucipto3, D P Utomo4
1. Sepuluh Nopember Institute of Technology, 2. Sepuluh Nopember Institute
of Technology, 3. Agency For The Assesment and Application of
Technology, 4. Agency For The Assesment and Application of Technology
corresponding author: [email protected]
Abstract: Transportation demand from Bodetabek to Jakarta during the period of
2002 up to 2010 has increased by ± 20% per year. While the growth of the road
network in the same period only grew 0.01% per year. This condition is so
unbalanced that the efficiency of road space usage must be done, one of which is
by increasing the role of public transportation especially by promoting the use of
mass transportation based on rail road as the mode choice in doing daily trip. This
research was conducted to analyze the model of transportation mode selection
between private vehicle and Serpong-Tanahabang commuter line route as an
empirical case study. Revealed Preference techniques and binomial logit model are
used in this study as tools for data collection and processing. We found that with
the operation Serpong-Tanahabang commuter line route thas a negative impact on
private vehicle demand because a big number of passengers preferred commuter
line over private vehicle service because fast travel time and less travel cost.
Keywords: demand, public transportation, mode choice, commuter line, revealed
preference
Introduction
Jakarta as the capital of the Republic of Indonesia, became the center
of economic activity of the country. The many economic activities in Jakata
cause transportation problems such as traffic congestion on the road,
decreasing air quality, loss of time value and so on. The problem of
congestion due to the use of private vehicles is not only happening in
Jakarta, but also on the connecting roads of Jakarta with the supporting
areas of Bogor, Depok, Tangerang and Bekasi (Jabodetabek). Increasing
congestion due to private use encourages the government to continue
improving and adding transportation facilities and infrastructure. The
development of facilities and infrastructure is carried out to improve the
services of public transportation especially related to the use of mass
transportation.
238Copyright © 2018, the Authors. Published by Atlantis Press. This is an open access article under the CC BY-NC license (http://creativecommons.org/licenses/by-nc/4.0/).
Advances in Engineering Research (AER), volume 147Conference on Global Research on Sustainable Transport (GROST 2017)

The complexity of mobilization of people living in urban areas
Indonesia is often not supported by the availability of infrastructure and
modes adequate public transport. The continued growth of population
increasingly requires the central government and local governments to do
anticipation of the provision of public transportation services that can
accommodate those interests. One of the specific features of urbanization at
Indonesia is an increasing city with metropolitan categories (Ashari, 2016).
In the era of globalization and technology that has been very advanced
and develop, then, the transport sector holds an important role because it
makes it easier for people to reach a place to a certain purpose (Haryono,
2016).
Public transport is one of the economic growth pulse, especially in
urban areas. Public transport can not be separated from the planning and
growth of areas where public transport is very big role in supporting
community activities. Public transport becomes the main choice for moving
needs for most people, especially middle to lower class society. In the
context of urban transport, public transport is a vital component affecting
urban transport systems. A good, well-planned, and well-coordinated public
transport system will improve the effectiveness and efficiency of urban
transport systems.
Meanwhile, when viewed from the change in the use of vehicles for
the trip (trip by mode) in the Jabodetabek area for the year 2002 compared
to the year 2010 increased 27.5% for motorcycle users. On the other hand
there is a decrease in the use of public transport (buses, trains, motorcycles)
of 28.4%. Changes in vehicle usage in Jabodetabek area for the year of 2002
compared to 2010 are complete as follows:
239
Advances in Engineering Research (AER), volume 147

Table 1. Mode Share
Year Motorcycle Car Bus Others Total
2002 28.7% 15.2% 50.1% 6.9% 100%
2010 62.9% 17.4% 16.7% 3.0% 100%
Source : JUPTI Commuter Survey, 2010
The type of mass transportation technology that is still being discussed
is public transportation based on road and rail based public transportation.
The main factor in determining the choice of mass transportation
technology mass is the amount of demand, besides that is not less important
is the factor of affordability by the community. To know the factors that
affect the public against the selection of modes between private vehicles
with mass-based public transportation rail Serpong-Tanahabang commuter
line.
Along with the development of the times, found a vehicle that can
meet the increasingly complex human needs. Naturally, people want to own
a private vehicle for transportation needs can be met easily. This is certainly
causing problems in big cities like Jakarta. Jakarta as the capital of the State
creates a need for greater economic activity compared to other cities. The
impacts caused by the high activity are air pollution caused by exhaust gas
from motor vehicles and, road capacity that can not accommodate vehicle
volume (Tamin, 2000).
The choice of mode is one of the important models in transportation
planning both for the government as the builder and provider of
transportation system as well as for transportation service entrepreneurs in
making decisions to invest in public transportation. In addition, the selection
of appropriate mode can also be the basis of consideration for public
transport operators in seizing the market and increasing the competitiveness
between modes by increasing the utility of travel attributes.
The transportation service industry, especially ground transportation
like railway, is one of the most strategic industries at this time. This is
240
Advances in Engineering Research (AER), volume 147
because the need for cheap transportation services for lower middle class
society in Indonesia is an urgent need (Haris, 2016).
The need for land transportation management effectively in the sense
of cheap, smooth, fast, easy, organized and comfortable is a demand from
the community (Kadarisman, 2016). At present, the service industry of
various transportation modes is increasingly widespread in Indonesia
(Saribaonon, 2016).
The commuter train is a rail-based transport system that connects the
central business district in the urban areas with the suburban. Commuter
trains are organized to serve commuters or commuters operated by PT.
Kereta Komuter Indonesia.
Model of mode of transportation is modeling or stages of the
transportation planning process that serves to determine loading travel or
knowing the number (in terms of proportion) of people and goods that will
use or choose different modes of transportation available to serve a
particular point of origin, for the sake of some intent certain trips also.
(Tamin, 2000)
In general, the discrete selection model is expressed as the chances
each individual chooses an option is a function of the socio-economic trait
and the appeal of that choice. To express the appeal of an alternative, use
the concept of utility. Utility is defined as something that is maximized by
the individual. The alternative does not produce utility, but is derived from
its characteristics and from each individual. (Landcaster, 1966 in Tamin,
2008).
In the preference survey, two approaches are known. The first
approach is the revealed preference (RP) and satated preference (SP). The
revealed preference technique analyzes community choices based on
existing reports. Using the statistical techniques identified factors that elicit
the election. The revealed preference technique has the disadvantage of
predicting an individual's response to a state of service that is not present at
the present time and may be much different from the current situation
(Ortuzar and Willumsen, 2001).
241
Advances in Engineering Research (AER), volume 147

The enhancement of services provided by the Serpong-Tanahabang
commuter line is intended to fulfill the public's desire for public transport
that has adequate travel comfort, high speed, efficient, reliable and
affordable by people's purchasing power.
Given the alternatives to the selection of the two modes of public
transport, it is considered necessary to analyze the modeling of the behavior
of prospective users of the Serpong-Tanahabang commuter line with private
vehicle users. So with the modeling of mode selection in this research can
be known attributes that influence in the selection of modes, trends and the
amount of demand for private vehicle users on the Serpong-Tanahabang
commuter line.
In line with the formulation of the problem. Then, will be tested some
the hypothesis is basically a conclusion that is while, which will be proven
through statistical tests. As for hypotheses proposed in this study are as
follows:
a. Independent variables that affect the users of private vehicles in
determining the choice of using Serpong-Tanahabang commuter line.
b. How much is the probability of moving private vehicle users to
Serpong-Tanahabang commuer line.
Method
One of the elements in the framework of data collection in this study
is the design and implementation of field surveys. The survey was
conducted in BSD hinterland area, Serpong station area, Rawabuntu station
area. The point is chosen by considering the location is still around the
study area and located around the station so it is very easy to access to the
station. The condition of the study sites also meruakan commercial areas,
education, offices, and housing will offer a sample of respondents who are
quite heterogeneous. Jam station location also occurs transfer between
modes that are competed to facilitate the process of data retrieval.
The model developed in this research uses the RP technique because
the two modes are already in operation, this technique requires input
242
Advances in Engineering Research (AER), volume 147

variables such as passenger characteristics (age, education, occupation, and
other socio-economic) and other travel attributes that are considered to have
a major effect on the behavior of the election mode. Implementation of the
survey of passenger characteristics and selection of these modes is carried
out very effectively and directly at the level of individual passengers in
order to obtain appropriate information for this research. In this survey,
respondents were offered a number of travel attributes offered in relation to
the modes to be reviewed in this study.
The main survey was conducted after the design of the questionnaire
fulfilled the requirements. Respondents should be guided to complete the
questionnaire completely and not allowed to select more than one option. In
addition, data inconsistencies and fanatism in certain modes should be
avoided so that users' responses to changes in travel attributes and the
addition of new modes can be well observed. The main survey examines the
competition between private vehicle users and the Serpong-Tanahabang
commuter line. Users of each mode only compare the usual mode of use, so
there will be models that will represent the chance of passenger selection of
a mode.
Selecting choice variabel dependent
Binary logistic regression method were used to analyze how much the
private vehicle willingness will move using Tanahabang-Serpong commuter
line, where variables are dichotomized with two possibilities (1: yes and 0:
no). The answer YES for those who want to move using Tanahabang-
Serpong commuter line and NOT for those who still want to use private
vehicle mode.
Selecting choice variabel independent
In our revealed preference design, there are transportation modes on the
Serpong-Tanahabang commuter line: private vehicle and Serpong-
Tanahabang commuter line as an alternative mode of transportation. As
discussed in previous sections, the authors decided to use not travel time
and travl cost. It is necessary to set the evels of value of these two variables.
243
Advances in Engineering Research (AER), volume 147

Authors too include variables gender, age, income level, job, educattion
level, trip purpose and the modes used to the airport.
Travel time attribute
Travel time is the travel time of the vehicle in minutes or hours, which is
the time required to start the journey from the starting point until arriving at
the destination. The average travel time of private vehicle Serpong-
Tanahabang from major cities was 120 min.
Travel cost attribute
Travel costs incurred for the payment of the transportation fee in rupiah
per person, which is the cost of the Serpong-Tanahabang route as fuel
vehicle, freeway ticket and parking.
Structure of the questionnaire
As described in previous sections, two factors which influence transport
modal choice behaviour were determined as attributes for the RP
experiment: travel costand travel time. Three levels were assigned for each
attribute. Table 1 shows the fractional factorial plan of combinations of
attribute levels. This fractional factorial plan is based on the catalogue of
fractional factorial designs found in the Orthogonal Experimental Design
Table (Hahn and Shapiro, 1966). Following the design table 1, the test plan
code corresponds, and then by applying the master plan number, which can
be designated as questions can be created by the Hahn’s table. The
alternative experimental designs shown in Tables 2.
Table 2. Values Of Each Attribute Level
Attribute
Value of each attribute level (differences private vehicle and
commuter line)
Level 1 Level 2 Level 3
Travel Cost (IDR) -35.000 -30.000 -20.000
Travel Time (Min) +30 +45 +60
244
Advances in Engineering Research (AER), volume 147

Revealed preference survey and model calibration
In general, the sample size for the stated preference survey should be
large enough to accommodate at least 75–100 numbers for each attribute or
segment, examples of which include gender, income level, job, age and trip
purpose, which are determined by the intention and purpose of the analysis
(Bradely and Kores, 1990; Kim, 2001; Park, 2006).
In general, regression analysis is essentially a study of dependent
variables with one or more independent variables in order to estimate and /
or predict the average population or the mean value of the dependent
variable based on the value of the known independent variable. The result of
regression analysis is a coefficient for each independent variable. This
coefficient is obtained by predicting the value of the dependent variable
with an equation. The regression coefficient is calculated with the aim of
minimizing the deviation between the actual value and the estimated value
of the dependent variable based on the available data.
In the binomial logit model the decision is confronted with a pair of
discrete alternatives, in which the alternatives to be chosen are those with
the greatest utility. The utility in this case is seen as a random variable. The
logistic regression model is a nonlinear model with which a transformation
can be brought to a linear form. To get the linear form, then logistic
regression transformed into logit form that is formula 1.
𝑙𝑛𝑝
1−𝑝= 𝛽0 + 𝛽1𝑋1 + 𝛽2𝑋2 … … . . + 𝛽𝑛𝑋𝑛 (1)
The choice probabilities of the logit model is the integral calculus of the
choice probability in the density of parameters as shown in formula 2.
P = exp(𝛽0+𝛽1𝑋)
1+exp(𝛽0+𝛽1 𝑋) (2)
Discussion and Result
The questionnaire was prepared and issued by the surveyors directly to
the respondents and collected immediately. The survey was conducted on
70 respondens in BSD area, Serpong Station and Rawabuntu station. The
245
Advances in Engineering Research (AER), volume 147
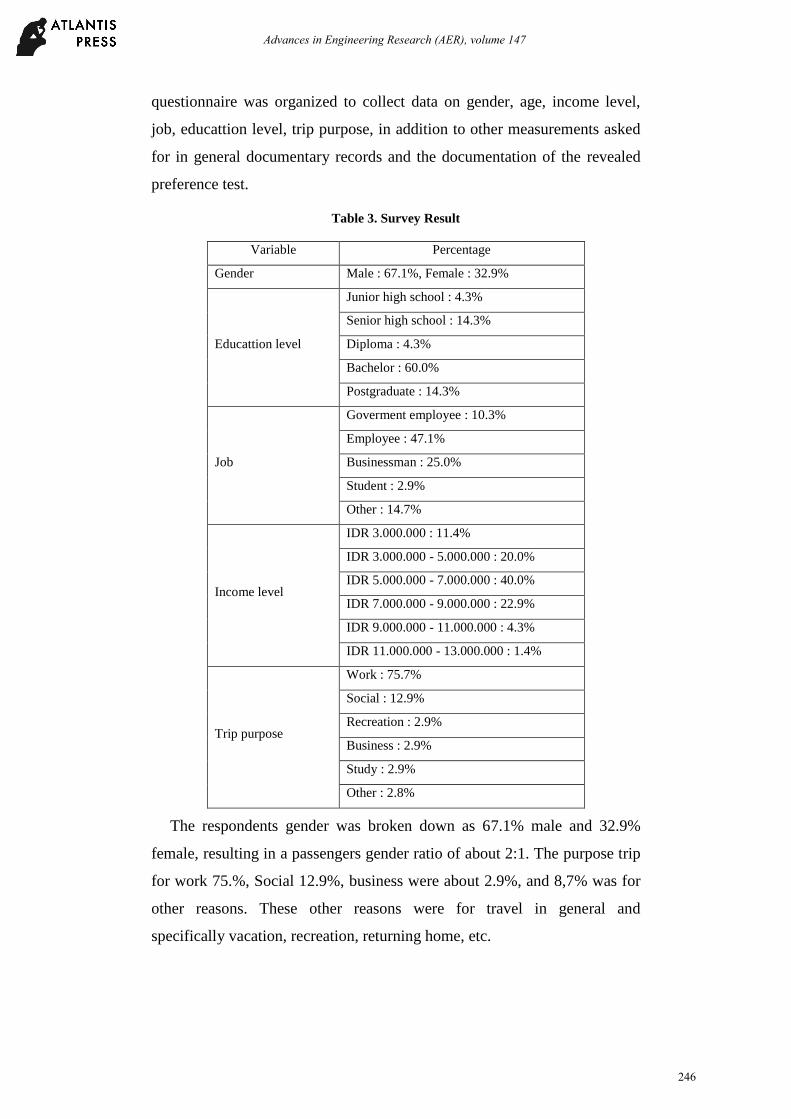
questionnaire was organized to collect data on gender, age, income level,
job, educattion level, trip purpose, in addition to other measurements asked
for in general documentary records and the documentation of the revealed
preference test.
Table 3. Survey Result
Variable Percentage
Gender Male : 67.1%, Female : 32.9%
Educattion level
Junior high school : 4.3%
Senior high school : 14.3%
Diploma : 4.3%
Bachelor : 60.0%
Postgraduate : 14.3%
Job
Goverment employee : 10.3%
Employee : 47.1%
Businessman : 25.0%
Student : 2.9%
Other : 14.7%
Income level
IDR 3.000.000 : 11.4%
IDR 3.000.000 - 5.000.000 : 20.0%
IDR 5.000.000 - 7.000.000 : 40.0%
IDR 7.000.000 - 9.000.000 : 22.9%
IDR 9.000.000 - 11.000.000 : 4.3%
IDR 11.000.000 - 13.000.000 : 1.4%
Trip purpose
Work : 75.7%
Social : 12.9%
Recreation : 2.9%
Business : 2.9%
Study : 2.9%
Other : 2.8%
The respondents gender was broken down as 67.1% male and 32.9%
female, resulting in a passengers gender ratio of about 2:1. The purpose trip
for work 75.%, Social 12.9%, business were about 2.9%, and 8,7% was for
other reasons. These other reasons were for travel in general and
specifically vacation, recreation, returning home, etc.
246
Advances in Engineering Research (AER), volume 147
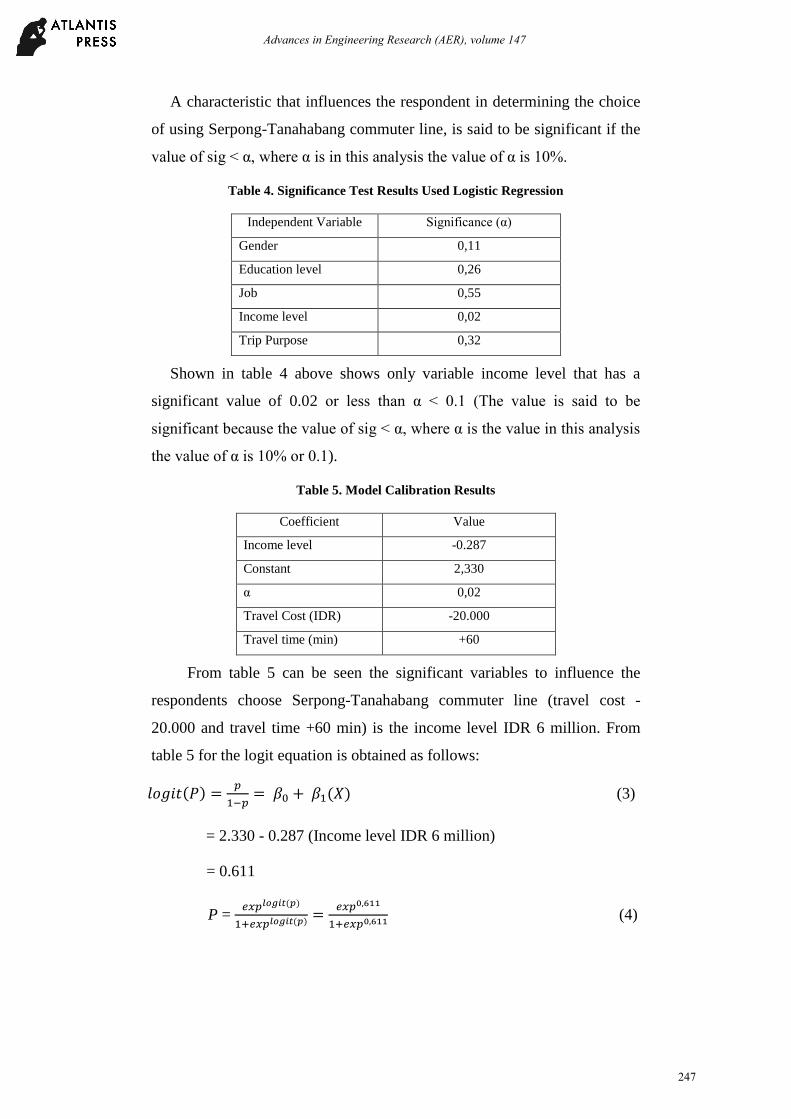
A characteristic that influences the respondent in determining the choice
of using Serpong-Tanahabang commuter line, is said to be significant if the
value of sig < α, where α is in this analysis the value of α is 10%.
Table 4. Significance Test Results Used Logistic Regression
Independent Variable Significance (α)
Gender 0,11
Education level 0,26
Job 0,55
Income level 0,02
Trip Purpose 0,32
Shown in table 4 above shows only variable income level that has a
significant value of 0.02 or less than α < 0.1 (The value is said to be
significant because the value of sig < α, where α is the value in this analysis
the value of α is 10% or 0.1).
Table 5. Model Calibration Results
Coefficient Value
Income level -0.287
Constant 2,330
α 0,02
Travel Cost (IDR) -20.000
Travel time (min) +60
From table 5 can be seen the significant variables to influence the
respondents choose Serpong-Tanahabang commuter line (travel cost -
20.000 and travel time +60 min) is the income level IDR 6 million. From
table 5 for the logit equation is obtained as follows:
𝑙𝑜𝑔𝑖𝑡(𝑃) =𝑝
1−𝑝= 𝛽0 + 𝛽1(𝑋) (3)
= 2.330 - 0.287 (Income level IDR 6 million)
= 0.611
P = 𝑒𝑥𝑝𝑙𝑜𝑔𝑖𝑡(𝑝)
1+𝑒𝑥𝑝𝑙𝑜𝑔𝑖𝑡(𝑝) =𝑒𝑥𝑝0,611
1+𝑒𝑥𝑝0,611 (4)
247
Advances in Engineering Research (AER), volume 147

P = 2.7180,611
1+2.7180.611 = 0.6481~ 65%
So the chances of passenger private vehicle that will move using
Serpong-Tanahabang commuter line is a income level of IDR 6 million of
65%. The analysis results are based on respondence used private vehicle.
Obviously for motorcycle has a characteristic or selection of different
modes with the above model due to the existence of different independent
variables that influence in the selection of modes.
Conclusion
The goal of this research was to analyse mode choice private vehicle
and Serpong-Tanahabang commuter line. The analyzed only one variables,
namely income level. The result obtained from the analysis showed that
only 65% of passengers would prefer to travel by Serpong-Tanahabang
commuter line. Therefore, a big number of passengers preferred commuter
line over private vehicle service because fast travel time and less travel cost.
This study had certain limitations in analyzing passengers preferences
on the Serpong-Tanahabang route because the only variable which influence
the model. Also, the actual commeter line service frequencies were shown
to be much longer than assumed in this paper because waiting time in
station, delay, walking time etc. Therefore, the interdependent relationship
between the two modes private vehicle and Serpong-Tanahabang in terms
of high speed transport will be an area of continuing interest for researchers.
It appears that more time is needed to see the stabilization of the operating
system of commuter line before more detailed analyses can be made.
Additional variables used in advanced studies were found to influence
the behavioral mode of transportation options of each type of passenger.
Values representing the coefficients of each model variable show a slight
significance value with the additional variables applied to the model.
References
Ashari, Y. , and Setyowati, T.M. (2016). Leverage Analysis Increase
Progressive Rate And Commuter Line Warranty To The Passenger
248
Advances in Engineering Research (AER), volume 147
Expected Level (Case Study Bogor - Manggarai Road), Journal of
Business Management of Transportation and Logistics, Vol. 2 No. 3,
May 2016.
Directorate General of Highways. (1995). Indonesian Highway Capacity
Manual Part 1. Urban Road, Directorat General of Highways, Ministry
of Public Works, Jakarta.
Haris., et al. (2016). Predicting Business Continuity of PT KAI Through
Altman Z-Score Approach, Journal of Transportation & Logistics
Management (JMTranslog) - Vol. 03 No. 1, March 2016.
Haryono., et al. (2016). Analysis Of Effect Of Price And Quality Of Service
To Customer Satisfaction Pt. Dms Tour And Travel, Journal of
Transportation and Logistics Business Management, Vol.2 No. 2,
January 2016.
Hess, S., Polak, J.W. (2005). Mixed logit modeling of airport choice in
multi-airport regions. J. Air Transp. Manag. 11, 59e68.
Kadarisman, M., et al. (2016). Land Transport Management Policy and Its
Impact on People's Economy in Depok City, Journal of Transportation
& Logistics Management (JMTranslog) - Vol. 03 No. 1, March 2016.
Lee, J.-K., et al. (2016). A study on travelers' transport mode choice
behavior using the mixed logit model: A case study of the Seoul-Jeju
route, Journal of Air Transport Management.
http://dx.doi.org/10.1016/j.jairtraman.2016.04.020
Ortuzar, J.D. , and Willumsen, L.G. (2001). Modelling Transport 3rd edition,
John Wiley and Sons Ltd, England.
Park, Y., Ha, H.-K., 2006. Analysis of the impact of high-speed railroad
service on air transport demand. Transp. Res. Part E 42 (2), 95e105.
Pearmain, D., Swanson, J., Kroes, E., Bradley, M. (1991). Stated Preference
Techniques : A Guide to Practice 2nd Edition, Steer Davies Gleave and
Haque Consulting Group, London.
Puthcer J. et al. (1981). The Socioeconomic Characteristic of Transit User
Some Recent Evidence, Transportation Quartelly, USA.
Saribanon, E., et al. (2016). The Satisfaction Of Transportation’s Customers
To Enchance Loyalty, Journal of Transportation & Logistics
Management (JMTransLog) - Vol. 03 No. 03, November 2016.
Stubs, P.C., Tyson W.J., dan Dalvi, M.Q. (1980). Transport Economics,
George Allen and Unwin (Publisher)Ltd., London.
Tamin, Ofyar Z. (2000). Planning and Modelling Transportation. Bandung,
Indonesia: Publisher ITB
Tamin, Ofyar Z. (2008). Planning and Modelling Transportation. Bandung,
Indonesia: Publisher ITB
249
Advances in Engineering Research (AER), volume 147