
Model Ducted Fan Calutation 1353043533 2431 Ft145838 Duct PDF
9
American Institute of Aeronautics and Astronautics 1 Effects of Duct Shape on a Ducted Propeller Performance Serdar Yılmaz 1 and Duygu Erdem 2 Istanbul Technical University , 34469, Maslak, Istanbul, Turkey Mehmet Şerif Kavsaoğlu 3 Anadolu University,26470, Eskişehir,Turkey Performance characteristics and velocity field of a ducted propeller in hover and axial flight conditions are investigated experimentally. Five different circular duct shapes has been tested. Effect of duct geometry is studied by means of measurements at various flow conditions. Velocity field upstream and downstream of the propeller, axial force acting on each component of the propulsive system, rotor speed and torque are measured. Pressure distribution on duct inner surface is also investigated. Experimental results obtained for open and ducted propeller are compared. Nomenclature C p = power coefficient (P/ρn 3 D 5 ) C T = thrust coefficient (T/ρn 2 D 4 ) C TD = thrust coefficient of duct C TP = thrust coefficient of propeller inside a duct D = duct inner diameter at propeller plane J = advance ratio (U/nD) L = duct length n = revolutions per second N = revolutions per minute P = power (2nQ) Q = torque T = thrust U ∞ = free stream velocity x = axial direction r = radial direction η = efficiency I. Introduction hrouded propellers are preferred for UAV applications in recent years owing to provide higher propulsive efficiency and operational safety. Vertical takeoff and landing capability of unmanned aircrafts equipped with ducted propellers make them favorable for military and civil applications. Introduction of duct reduces thrust losses originating from the tip leakage flow. Duct also, controls the flow velocity and pressure at the rotor section. Duct (or shroud) shape that has been used in these applications has a significant effect on the efficiency of the propeller. Inverse airfoil profiles (converging-diverging duct inner geometry) are used for flow acceleration, in low-speed, high static thrust applications. If the flow is accelerated by the duct, the duct develops an additional thrust. Ducted fans are preferred in low speed applications such as vertical takeoff and landing aircrafts, hovercrafts, flying platforms and helicopter tail rotors. While a propeller is inserted into a duct, flow structure produces more complicated problems than an open propeller. Both for clarifying these problems and gaining more information, systematic experiments were made on 1 Graduate Student, Graduate School of Science Engineering & Technology, [email protected]. 2 Assistant Prof. Dr., Faculty of Aeronautics and Astronautics, [email protected]. 3 Prof. Dr., Faculty of Aerospace Sciences, [email protected], Senior Member, AIAA S
-
Upload
elmer-villegas -
Category
Documents
-
view
27 -
download
2
Transcript of Model Ducted Fan Calutation 1353043533 2431 Ft145838 Duct PDF

American Institute of Aeronautics and Astronautics
1
Effects of Duct Shape on a Ducted Propeller Performance
Serdar Yılmaz1 and Duygu Erdem2 Istanbul Technical University , 34469, Maslak, Istanbul, Turkey
Mehmet Şerif Kavsaoğlu3 Anadolu University,26470, Eskişehir,Turkey
Performance characteristics and velocity field of a ducted propeller in hover and axial flight conditions are investigated experimentally. Five different circular duct shapes has been tested. Effect of duct geometry is studied by means of measurements at various flow conditions. Velocity field upstream and downstream of the propeller, axial force acting on each component of the propulsive system, rotor speed and torque are measured. Pressure distribution on duct inner surface is also investigated. Experimental results obtained for open and ducted propeller are compared.
Nomenclature Cp = power coefficient (P/ρn3D5) CT = thrust coefficient (T/ρn2D4) CTD = thrust coefficient of duct CTP = thrust coefficient of propeller inside a duct D = duct inner diameter at propeller plane J = advance ratio (U/nD) L = duct length n = revolutions per second N = revolutions per minute P = power (2nQ) Q = torque T = thrust U∞ = free stream velocity x = axial direction r = radial direction
η = efficiency
I. Introduction hrouded propellers are preferred for UAV applications in recent years owing to provide higher propulsive efficiency and operational safety. Vertical takeoff and landing capability of unmanned aircrafts equipped with
ducted propellers make them favorable for military and civil applications. Introduction of duct reduces thrust losses originating from the tip leakage flow. Duct also, controls the flow
velocity and pressure at the rotor section. Duct (or shroud) shape that has been used in these applications has a significant effect on the efficiency of the propeller. Inverse airfoil profiles (converging-diverging duct inner geometry) are used for flow acceleration, in low-speed, high static thrust applications. If the flow is accelerated by the duct, the duct develops an additional thrust. Ducted fans are preferred in low speed applications such as vertical takeoff and landing aircrafts, hovercrafts, flying platforms and helicopter tail rotors.
While a propeller is inserted into a duct, flow structure produces more complicated problems than an open propeller. Both for clarifying these problems and gaining more information, systematic experiments were made on
1 Graduate Student, Graduate School of Science Engineering & Technology, [email protected]. 2 Assistant Prof. Dr., Faculty of Aeronautics and Astronautics, [email protected]. 3 Prof. Dr., Faculty of Aerospace Sciences, [email protected], Senior Member, AIAA
S

American Institute of Aeronautics and Astronautics
2
several ducted propeller test models. One of the first significant studies in this area was carried out by Sacks and Burnell in 1959 [20]. Researchers investigated the effects of blade pitch, propeller and duct shape such as; chord, diameter ratio, duct profile, leading edge radius for static operation (hovering flight) and axial flight. Total force, power, total moment, division of forces and moment, pressure distribution and velocity field were measured in the experimental parts of the research. Experimental studies were compared with theoretical studies and it was shown that the majority of thrust in efficiently ducted fan can be produced on the shroud. Similar research has been conducted by Fletcher [2]. Five duct made of circular airfoils was used in his study. These airfoils had same projected area (S=diameter x chord) on the other hand, they had diverse chords and diameters. Researchers tested the effect of angle of attack on lift, drag and pitching moment of ducted fans.
There are more detailed theoretical studies on ducted fan. One of them is Morgan’s [16] research. Linearized circular airfoil theory and lifting line propeller theory were applied for this study. Variables that are formed by interaction between shroud and propeller such as, radial velocity induced by the propeller, duct trailing vortex system and induced drag of the duct, theoretically investigated. To confirm and develop the theoretical research, experimental and theoretical studies were examined in comparison. Kriebel and Mendenhall [11] in 1966 investigated both theoretically and experimentally performance of two full-scale ducted propellers. Difference between experimental and theoretical problem were attributed to dissimilarity of blade loading distribution and the occurrence of flow separation from the inner duct surfaces by researchers. In order to eliminate this problem, it is recommended that information of the flow distribution in and around a shrouded propeller is determined in more detail. Black, Wainasuski and Rochrbach [5] examined performance of shrouded propeller experimentally. Pressure distribution on shroud surface, axial velocity, forces acting on the shroud and propeller were measured apart by changing the lip shape, chord, exit area ratio, propeller location within the shroud, blade tip clearance and propeller blade shape. Similar studies experimentally and theoretically are conducted by Kallman, Kenneth and Goodson [8], Mort [17], Hough and Kaskel [9].
In recent years, studies on ducted fans are generally focused on a specific aerodynamic design or parameter. Leading edge ratio, aspect ratio (chord/diameter) are the variables that Dyer [6] studied on small size ducted fan for VTOL aircraft. Graf [7] investigated similar variables in 2005 by using different duct lip shape. It was observed that leading edge radius has more affect than thickness of airfoil on static thrust of duct. Martin et al. [13] designed, analyzed and researched experimentally ducted fan for hover performance. In experimental part, tip gap effects mostly are investigated. Tip gap effects directly influence the figure of merit of a ducted propeller. In CFD analysis part of Martin’s research 3D individual blade modelling for the standard duct and stepped duct is used. Variables such as; duct angle of attack, exit vane flap length, flap deflection angle and duct chord length are examined for axial and forward flight by Abrego and Bulaga [1]. In order to improve performance of ducted fan Ahm and Lee [2] used a computational method. One of the results of their research is that, major fan duct parameter is the diffuser angle. And it is also determined that the fan duct performance is not affected by the inlet geometry at high thrust coefficients. It is required that boundary layer model including viscous effects. Tip clearance effect on performance of the ducted fan is investigated by Martin and Tung [14] in 2004. It is shown that decreasing tip gap between propeller tip and the duct surface increases the total thrust. At low RPM, thrust produced by the duct is affected by viscous effects inside the duct. Moreover isolated propeller produces higher thrust than ducted propeller at low RPM.
Performance of the ducted propeller is researched both experimentally and analytically by Lind and et al [12]. Aerodynamic characteristics of ducted fan for hover and forward flight are investigated by Aktürk, Shavalikul and Camcı [3] using PIV methods. It is shown that, flow over the propeller is symmetric in hover flight. However; separation area is observed ob the leading edge of the ducted fan in forward flight. Thus, flow losses its symmetry, and lack of symmetry also has an influence on total moment and duct exit variables. Same researchers investigated how tip clearance and flow distribution in duct can affect performance in 2010 [4]. Graf, Flamming and NF [19], Zhao and Bill [20] and Myers [18] are contributed the evaluation of ducted fan systems by similar researches.
In this study, trust of a ducted propeller proposed for a vertical takeoff and landing (VTOL) UAV is investigated experimentally under various flow conditions. Thrust of the open propeller, drag/thrust produced by the duct and thrust of the whole system (ducted fan) are measured one by one in order to reveal amount of the thrust augmentation obtained by duct addition. Velocity distributions upstream and downstream of the propeller are measured therefore boundary conditions for computational studies are obtained. Pressure distribution on duct inner surface is also investigated to clarify more detailed thrust augmentation. Measurements that are carried out during this study may be categorized in three classes: thrust and torque measurements, velocity measurements inside the channel and pressure distribution on duct inner surface. Thrust measurements are conducted by force transducers and torque and rotor speed measurements are conducted by torque sensor. Velocity distribution at the downstream of the duct is measured by hot-wire anemometer. Pressure distribution is measured by pressure scanner ports.

American Institute of Aeronautics and Astronautics
3
II. Duct Geometry & Experimental Setup Full scale model of ducts (Figure 1-a)
are tested at different free stream velocities. NACA 0012, NACA0018 and NACA 4312 profiles are tested in the first part of experiments. In the second part, forebody effect is investigated. Behind the propeller plane (propeller locates at the narrowest cross section inside of duct) same aftbody duct profile is used for these experiments (Figure 1-b). Although ducts have the same inner radius at propeller plane, leading edge radius, maximum camber and inlet area ratio of ducts are different. Model parameters are shown in Table 1.
Experiments are performed in a 80x80 cm test section open-circuit subsonic wind tunnel of Trisonic Research
Laboratory. Wind tunnel provides free stream velocities from 0 m/s up to 25 m/s. Experiments are conducted at 7000 rpm rotor speeds. Models are tested at zero angle of attack forward flight conditions.
Figure 1. Ducted Propeller.
Figure 2. Schematic diagram of duct model a) Test Model, b) Aft-forebody of Duct c) Forebody Duct Profiles.

American Institute of Aeronautics and Astronautics
4
Table 1. Geometry Parameters of Test Model
Geometric Parameter NACA 0012 NACA 0018 NACA 4312 NACA 7312
+4312
NACA M21
+4312
Thickness ratio 12% 18% 12% 12% 12%
Duct inner radius(at propeller plane)
211,7 mm 211,7 mm 211,7 mm 211,7 mm 211,7 mm
Aspect ratio (L/D) 0,5 0.5 0,5 0,5 0,5
Leading Edge Radius(mm) 3,83 8.38 3,59 3,59 3.59
Max Camber 0% 0% -4% -7% 6%
Area Ratio (APropeller/AExit) 0.81 0.76 0.76 0.76 0,76
III. Force and Torque Measurements Force sensor (Fig. 3-a) system is used to
measure drag and thrust forces. Force/Torque sensor measures the full six components of force and torque using a monolithic instrumented transducer. The F/T transducer uses silicon strain gages. Sensing range in measurement direction (parallel to motor axis) is ±80 N and resolution is 0.04 N. Torque applied to the propeller shaft and rotational speed (rpm) is measured by an in-line rotary torque transducer (Fig. 3-b). Measurement range of torque transducer is 0-5Nm and accuracy is %0.5 of full scale.
Duct is oriented parallel to free-stream direction. Propeller locates at the narrowest cross-section of the duct. A brushless DC electric motor drives two bladed ducted propellers (Fig.4). Motor speed is controlled by an electronic speed control (ESC) system (Fig. 4). Driving power of electric motor is altered so that rotor speed remains constant
Figure 3. a) Force Sensor b) Torque Transducer.
Figure 4. Schematic diagram of Force and Torque Measurements Experimental Set.
American Institute of Aeronautics and Astronautics
5
under different free stream velocity conditions. APC-16x8 thin electric 2-bladed propeller is used. Propeller locates at the narrowest cross-section of the duct. Force transducer is mounted at the bottom of the motor and the duct. Transducers sensing elements are directly connected to an electronic board located separately because of minimized sensor dimensions. A controller processes the strain gage information and outputs analog force data. Axial forces acting on duct and propeller are measured one by one for the dynamic case. Torque Transducer is located between electric motor and propeller shaft by using couplings and special fittings.
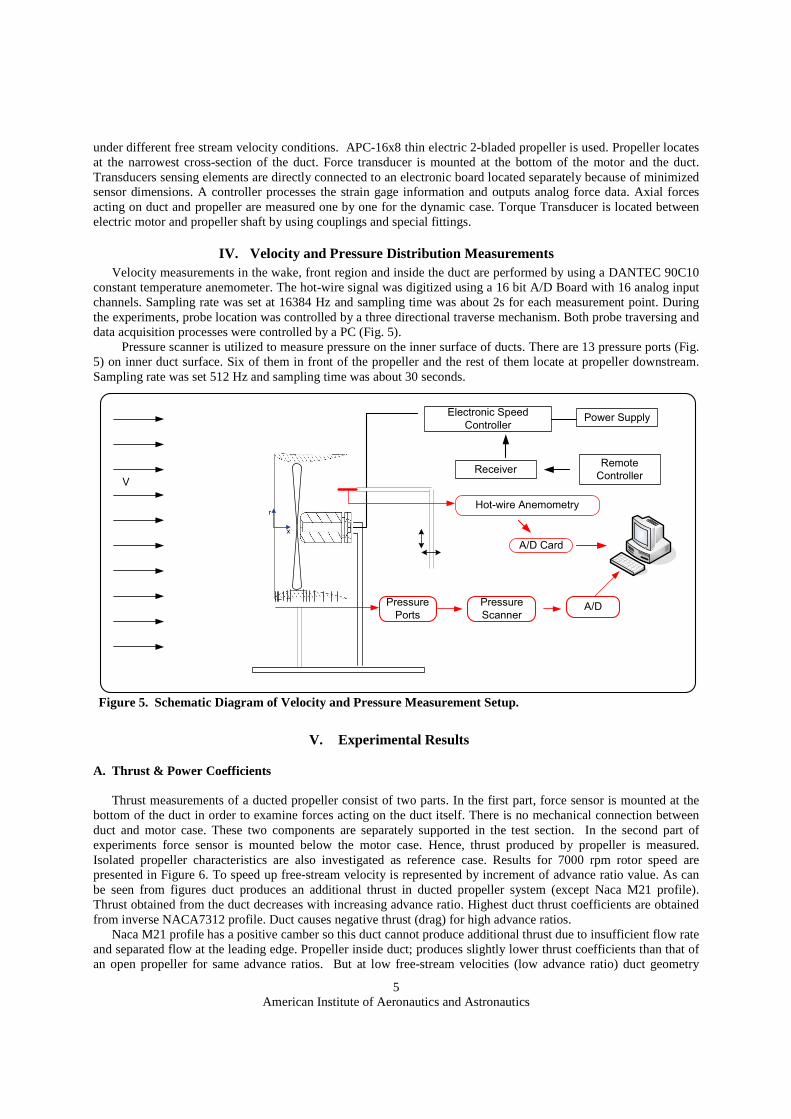
IV. Velocity and Pressure Distribution Measurements Velocity measurements in the wake, front region and inside the duct are performed by using a DANTEC 90C10
constant temperature anemometer. The hot-wire signal was digitized using a 16 bit A/D Board with 16 analog input channels. Sampling rate was set at 16384 Hz and sampling time was about 2s for each measurement point. During the experiments, probe location was controlled by a three directional traverse mechanism. Both probe traversing and data acquisition processes were controlled by a PC (Fig. 5).
Pressure scanner is utilized to measure pressure on the inner surface of ducts. There are 13 pressure ports (Fig. 5) on inner duct surface. Six of them in front of the propeller and the rest of them locate at propeller downstream. Sampling rate was set 512 Hz and sampling time was about 30 seconds.
V. Experimental Results
A. Thrust & Power Coefficients Thrust measurements of a ducted propeller consist of two parts. In the first part, force sensor is mounted at the
bottom of the duct in order to examine forces acting on the duct itself. There is no mechanical connection between duct and motor case. These two components are separately supported in the test section. In the second part of experiments force sensor is mounted below the motor case. Hence, thrust produced by propeller is measured. Isolated propeller characteristics are also investigated as reference case. Results for 7000 rpm rotor speed are presented in Figure 6. To speed up free-stream velocity is represented by increment of advance ratio value. As can be seen from figures duct produces an additional thrust in ducted propeller system (except Naca M21 profile). Thrust obtained from the duct decreases with increasing advance ratio. Highest duct thrust coefficients are obtained from inverse NACA7312 profile. Duct causes negative thrust (drag) for high advance ratios.
Naca M21 profile has a positive camber so this duct cannot produce additional thrust due to insufficient flow rate and separated flow at the leading edge. Propeller inside duct; produces slightly lower thrust coefficients than that of an open propeller for same advance ratios. But at low free-stream velocities (low advance ratio) duct geometry
V
Electronic Speed
ControllerPower Supply
Remote
ControllerReceiver
Pressure
ScannerA/D
x
r
Pressure
Ports
Hot-wire Anemometry
A/D Card
Figure 5. Schematic Diagram of Velocity and Pressure Measurement Setup.

American Institute of Aeronautics and Astronautics
6
strongly affects propeller thrust coefficient. Most effective duct shape is NACA 7312 according to Figure 6. Therefore, the effects of the duct geometry on thrust system performance are also shown in figures. Ducted propellers require less power than open propeller (Figure 6). It is shown that power coefficient of inverse NACA 4312 shaped duct has the lowest values. Total thrust coefficients are represented in figure 6. Higher rotor speeds provides greater thrust. Total thrust of ducted systems at 7000 rpm reach equivalent or higher values comparing with open propeller case in low velocity range except NACA M21 profile. Although power coefficient values of NACA M21 profile are similar other ducted systems, this profile produces drag instead of additional thrust due to forebody geometry. As it is observed from Figure 7, NACA 7312 profile has better efficiency according to bare propeller. Up to 0,3 advance ratio, ducted propeller has higher efficiencies than open propeller. Maximum percentage of the augmentation in efficiency according to bare propeller is occurred on both NACA 4312 and NACA 7312 profile (Fig. 7-b). Maximum increment in efficiency is almost %10.
0.1 0.2 0.3 0.40
0.005
0.01
0.015
0.02
0.025
0.03
J - Advance Ratio
Cp
- P
ow
er C
oeffi
cen
t
Naca4312Naca0012Naca0018Naca7312+4312Naca M21+4312BarePropeller
0.1 0.2 0.3 0.40
0.01
0.02
0.03
0.04
0.05
0.06
0.07
J - Advance Ratio
Ct -
Th
rust
Co
effi
cen
t
0.1 0.2 0.3 0.4-0.01
-0.005
0
0.005
0.01
J - Advance Ratio
Ctd
- D
uct
Thr
ust
Coe
ffice
nt
0.1 0.2 0.3 0.40
0.01
0.02
0.03
0.04
0.05
0.06
0.07
J - Advance Ratio
Ctp
- P
rope
ller T
hru
st C
oe
ffice
nt
Naca 4312
Naca 7312
Propeller
Location
Naca M21
Naca 0018
Naca 0012
Figure 6. Comparison of Thrust and Power Coefficients.
0.1 0.2 0.3 0.40
0.2
0.4
0.6
J - Advance Ratio
Effi
cein
cy
Naca4312Naca0012Naca0018Naca7312+4312Naca M21+4312BarePropeller
0.05 0.1 0.15 0.2 0.25 0.3-10
-5
0
5
10
J - Advance Ratio
% E
ffic
ienc
y In
crem
ent
Naca 4312
Naca 7312
Propeller
Location
Naca M21
Naca 0018
Naca 0012
Figure 7. Comparison of Efficiency

American Institute of Aeronautics and Astronautics
7
B. Velocity Field Velocity profiles at the exit plane are measured by using hot-wire probe. All duct profiles are tested at 10 and 20
m/s free-stream velocities and results are presented in Figure 8. Radial distance is normalized with duct diameter (D) and velocity values with free-stream velocity. Continuous line in Figure represents duct boundary. Results are compared with open propeller velocity profiles in slipstream. According to force and torque results; measurements at 10 m/s (J=0.21) represents the case which the duct yields efficiency augmentation while measurements at 20 m/s (J=0.42) characterize the flow conditions where efficiency loss is occurred in the ducted propeller configuration.
At low free-stream velocities, both bare propeller and ducted propellers accelerate flow much more. The presence of the duct reduces the slipstream contraction of bare propeller. Hence, velocity profiles at the duct exit plane shows that flow spreads out and effective flow area becomes larger at the exit. Velocity profile close to the duct boundaries has a secondary flow region caused by the tip gap effects. Velocity profiles at front plane (5mm front of leading edge) of all ducts at different free-stream conditions are presented in Figure 8. Flow acceleration at the front plane of ducted propeller system is greater than that of open propeller except Naca M21 profile. According to thrust and torque measurements, this profile is not efficient for this application. Highest acceleration is occurred on NACA 7312 profile. Higher free-stream velocity causes acceleration decrease but ducted propeller system still makes flow speed up more than bare propeller.
Volumetric flow rate and maximum mean velocity values at different free-stream conditions are presented in Fig. 9. Higher flow rate is obtained for NACA7312+4312 duct profile then both other duct profiles and bare
propeller. Again it is shown Fig. 9 that duct accelerates flow more than bare propeller. Maximum mean velocity values are obtained from Naca 7312+4312. Naca 7312 has greater inlet area then Naca 4312 profile, so that higher volume of air passes through the propeller on Naca 7312 inlet. It can be concluded that higher negative camber affects efficiency positively.
0 0.5 1 1.5-1
-0.5
0
0.5
1Non-Dimensional Velocity Profiles @ Leading Edge, J=0,2
U / U∞c
r/D
0 0.5 1 1.5 2 2.50.1
0.2
0.3
0.4
0.5
0.6
0.7
0.8Non-Dimensional Velocity Profiles @ Trailing Edge, J=0,2
U / U∞c
r/D
Naca 4312Naca 0012Naca 0018Naca7312Naca M21Bare Propeller
0 0.2 0.4 0.6 0.8 1 1.2 1.4 1.6 1.8-0.8
-0.6
-0.4
-0.2
0
0.2
0.4
0.6
0.8Non-Dimensional Velocity Profiles @ Leading Edge, J=0,4
U / U∞c
r/D
0 0.5 1 1.5 2 2.50.1
0.2
0.3
0.4
0.5
0.6
0.7
0.8Non-Dimensional Velocity Profiles @ Trailing Edge, J=0,4
U / U∞c
r/D
Naca 4312
Naca 7312
Propeller
Location
Naca M21
Naca 0018
Naca 0012
Figure 8. Comparison of Non-Dimensional Velocity Profiles @ Leading edge and Trailing Edge

American Institute of Aeronautics and Astronautics
8
Acknowledgement
This research is supported by the Scientific and Technical Research Council of Turkey (TUBITAK) through Project No: 108M434.
References 1ABREGO A. I. & BULAGA R. W., 2002. Performance Study of a Ducted Fan System. AHS Aerodynamics, Acoustics
and Test and Evaluation Technical Specialist Meeting, San Francisco, California. 2AHM J. & LEE K. T., 2004. Performance Prediction and Design of Ducted Fan System. 40th AIAA/ASME/SAE/ASEE
Joint Propulsion Conference and Exhibit, Fort Lauderdale, Florida 3AKTURK, A., 2010. Ducted Fan Inlet / Exit and Rotor Tip Flow Improvements for Vertical Lift Systems. PhD Thesis of
the Pennsylvania State University, USA. 4AKTRUK. & CCAMCI C., 2010. Influence of Tip Clearance and Inlet Flow Distortion of Ducted Fan Performance in
VTOL UAV’s. American Helicopter Society 66th Annual Forum, Phoenix. 5BLACK, D. M., WAINAUSKI, H. S. & ROHBACH, C., 1971. Shrouded Propellers – A Comprehensive Performance
Study. Hamilton Standard Division of United Aircraft Corporation, Connecticut 6DYER, K. 2002. Aerodynamic Study of a Small Ducted VTOL Aerial Vehicle, Master Thesis of Massachusetts Institute
of Technology. 7GRAF W. E., 2005. Effect of Duct Lip Shaping Various Control Devices on the Hover and Forward Flight Performance
of Ducted Fan UAV’s. Master Thesis of Virginia Polytechnic Institute and State University, Virginia 8GRUNDALD, K. J. & GOODSON, K. W., 1962. Aerodynamic Loads on Isolated Shrouded- Propeller Configuration for
Angles of Attack from -100 to 1100. NASA Technical Note D-995. Washington 9HOUGH, G. R., & KASKEL, A. L., 1965. A Comparison of Ducted Propeller Theory with Bell X-22A Experimental
Data. Air Program, Office of Naval Research, Washington. 10KOC, S. T., 2011, Experimental Investigation of Ducted Propeller Designed for UAV, Master Thesis in the Istanbul
Technical University, Institute of Science & Technology, Turkey 11KRIEBEL, A. R. & MENDENHALL, M. R., 1966. Predicted and Measured Performance of Two Full-Scale Ducted
Propellers, Aerodynamic Problem Associated With V/STOL Aircraft, Symposium Proceedings, and July 1966 Buffalo, New York.
12LIND R., NATHMAN, J. K. & GILCHRIST, I., 2006. Ducted Rotor Performance Calculations and Comparisons with Experimental Data, 44th AIAA Aerospace Sciences Meeting and Exhibit, Reno, Nevada
13MARTIN P. & TUNG C., 2004, Performance and Flow field Measurements in a 10-inch Ducted Rotor VTOL UAV, NASA Technical Report, Document ID:20050009943, Ames Research Center
14MARTIN P., BOXWELL. D., NYGAARD. T. & TUNG. C., 2004. Design, Analysis, and Experiments on a 10- inch ducted Rotor VTOL UAV. US Army Research, Development, and Engineering Command, Ames Research Center, California.
15MONAL P, Propeller Performance Measurements for Low Reynolds Number Unmanned Aerial Vehicle Applications, MS Thesis, University, 2004
0.1 0.2 0.3 0.41.5
2
2.5
3
3.5
4
4.5
J - Advance Ratio
Vo
lum
etric
Ma
ss F
low
(m3 /s
)
0.1 0.2 0.3 0.41
1.5
2
2.5
3
J - Advance Ratio
Um
ax /
U∞
Naca4312Naca0012Naca0018Naca7312+4312Naca M21+4312BarePropeller
Figure 9. Volumetric flow rate and Maximum Velocities
Vo
lum
etr
ic F
low
Ra
te

American Institute of Aeronautics and Astronautics
9
16MORGAN, W. B., 1961. A Theory of the Ducted Propeller with a Finite Number of Blades, University of California Institute of Engineering Research, California
17MORT, W. K., 1965. Performance Characteristics of a 4-foot Diameter Ducted Fan at Zero Angle of Attack for Blade Angles. Ames Research Center, Moffett Field. California.
18MYERS, L. M., 2009. Aerodynamic Experiments on a Ducted Fan in Hover and Edgewise Flight. Master Thesis in the Pennsylvania State University. USA
19NAIPEI P, KEVIN R and DAVID J., Performance Investigation of Ducted Aerodynamic Propeller, 1st International Symposium on Marine Propulsors, 2000.
20SACKS A. H. & BURNELL, J. A. 1959. Ducted Propellers- A Critical Review of the State of the Art, Armed Services Technical Information Agency Report No. ARD-232, Virginia
21ZHAO, H. W. & BIL. C., 2008. Aerodynamic Design and Analysis of a VTOL Ducted-Fan UAV. 26th AIAA Applied Aerodynamics Conference. Honolulu, Hawaii


![The Smart Gridin2010 2431[1]](https://static.fdocuments.in/doc/165x107/55d4de7cbb61eb042a8b462f/the-smart-gridin2010-24311.jpg)


![Job Name: Location: Date: Purchaser: Engineer: …...SEZ-KD09,12,15,18NA (For data on specific indoor units [all ducted, all non-ducted, and both ducted and non-ducted] combinations,](https://static.fdocuments.in/doc/165x107/5f3ef44adb4c0539d030f3d9/job-name-location-date-purchaser-engineer-sez-kd09121518na-for-data.jpg)


