Model Category Structures on - Inna Z
42
Grade 11 U/C – Unit 2: Functions through Quadratics 1 Unit 2: Functions (6 days + 0 jazz days + 1 summative evaluation day) BIG Ideas: • quadratic expressions can be expanded and simplified • the solutions to quadratic equations have real-life connections • properties of quadratic functions • problems can be solved by modeling quadratic functions DAY Lesson Title & Description 2P 2D Expectations Teaching/Assessment Notes and Curriculum Sample Problems 1 Is It or Isn't It? • Explore relations in various forms to determine it is a function • A vertical line test can be used to determine if a graph is a function Lesson Included N N QF2.01 explain the meaning of the term function, and distinguish a function from a relation that is not a function, through investigation of linear and quadratic relations using a variety of representations (i.e., tables of values, mapping diagrams, graphs, function machines, equations) and strategies (e.g., using the vertical line test) Sample problem: Investigate, using numeric and graphical representations, whether the relation x = y 2 is a function, and justify your reasoning.); 2 Frame It • Students will investigate and model quadratic data Lesson Included C C QF3.01 collect data that can be modelled as a quadratic function, through investigation with and without technology, from primary sources, using a variety of tools (e.g., concrete materials; measurement tools such as measuring tapes, electronic probes, motion sensors), or from secondary sources (e.g., websites such as Statistics Canada, E- STAT), and graph the data Sample problem: When a 3 x 3 x 3 cube made up of 1 x 1 x 1 cubes is dipped into red paint, 6 of the smaller cubes will have 1 face painted. Investigate the number of smaller cubes with 1 face painted as a function of the edge length of the larger cube, and graph the function. 3 Applications of Linear & Quadratic Functions • Evaluate functions using function notation N N QF2.02 substitute into and evaluate linear and quadratic functions represented using function notation [e.g., evaluate f ( ½ ), given f (x) = 2x 2 + 3x – 1], including functions arising from real-world applications Sample problem: The relationship between the selling price of a sleeping bag, s dollars, and the revenue at that selling price, r (s) dollars, is represented by the function r (s) = –10s 2 + 1500s. Evaluate, interpret, and compare r (29.95), r (60.00), r (75.00), r (90.00), and r (130.00).
Transcript of Model Category Structures on - Inna Z

Grade 11 U/C – Unit 2: Functions through Quadratics 1
Unit 2: Functions (6 days + 0 jazz days + 1 summative evaluation day)
BIG Ideas:
• quadratic expressions can be expanded and simplified • the solutions to quadratic equations have real-life connections • properties of quadratic functions • problems can be solved by modeling quadratic functions
DAY Lesson Title & Description 2P 2D Expectations
Teaching/Assessment Notes and Curriculum Sample Problems
1
Is It or Isn't It? • Explore relations in various forms
to determine it is a function • A vertical line test can be used to
determine if a graph is a function Lesson Included
N N QF2.01
explain the meaning of the term function, and distinguish a function from a relation that is not a function, through investigation of linear and quadratic relations using a variety of representations (i.e., tables of values, mapping diagrams, graphs, function machines, equations) and strategies (e.g., using the vertical line test)
Sample problem: Investigate, using numeric and graphical representations, whether the relation x = y2 is a function, and justify your reasoning.);
2
Frame It • Students will investigate and
model quadratic data Lesson Included
C C QF3.01
collect data that can be modelled as a quadratic function, through investigation with and without technology, from primary sources, using a variety of tools (e.g., concrete materials; measurement tools such as measuring tapes, electronic probes, motion sensors), or from secondary sources (e.g., websites such as Statistics Canada, E-STAT), and graph the data
Sample problem: When a 3 x 3 x 3 cube made up of 1 x 1 x 1 cubes is dipped into red paint, 6 of the smaller cubes will have 1 face painted. Investigate the number of smaller cubes with 1 face painted as a function of the edge length of the larger cube, and graph the function.
3
Applications of Linear & Quadratic Functions • Evaluate functions using function
notation N N QF2.02
substitute into and evaluate linear and quadratic functions represented using function notation [e.g., evaluate f ( ½ ), given f (x) = 2x2 + 3x – 1], including functions arising from real-world applications
Sample problem: The relationship between the selling price of a sleeping bag, s dollars, and the revenue at that selling price, r (s) dollars, is represented by the function r (s) = –10s2 + 1500s. Evaluate, interpret, and compare r (29.95), r (60.00), r (75.00), r (90.00), and r (130.00).

Grade 11 U/C – Unit 2: Functions through Quadratics 2
4
Home on the Range • Different notations of domain and
range of functions in various forms will be explored
Lesson Included
N N QF2.03 QF2.04
explain the meanings of the terms domain and range, through investigation using numeric, graphical, and algebraic representations of linear and quadratic functions, and describe the domain and range of a function appropriately (e.g., for y = x2 + 1, the domain is the set of real numbers, and the range is y ≥ 1); explain any restrictions on the domain and the range of a quadratic function in contexts arising from real-world applications
Sample problem: A quadratic function represents the relationship between the height of a ball and the time elapsed since the ball was thrown. What physical factors will restrict the domain and range of the quadratic function?
5
Applications of Quadratic Relations Part I • Create and solve real-world
problems using tables and graphs
C C QF1.01
pose and solve problems involving quadratic relations arising from real-world applications and represented by tables of values and graphs (e.g.,“From the graph of the height of a ball versus time, can you tell me how high the ball was thrown and the time when it hit the ground?”);
6
Applications of Quadratic Relations Part II • Solve real-world problems using
an algebraic representation of a quadratic function.
C C
QF3.03
solve problems arising from real-world applications, given the algebraic representation of a quadratic function (e.g., given the equation of a quadratic function representing the height of a ball over elapsed time, answer questions that involve the maximum height of the ball, the length of time needed for the ball to touch the ground, and the time interval when the ball is higher than a given measurement)
Sample problem: In a DC electrical circuit, the relationship between the power used by a device, P (in watts,W), the electric potential difference (voltage), V (in volts,V ), the current, I (in amperes, A), and the resistance, R (in ohms,Ω), is represented by the formula P = IV – I2 R. Represent graphically and algebraically the relationship between the power and the current when the electric potential difference is 24 V and the resistance is 1.5 Ω. Determine the current needed in order for the device to use the maximum amount of power.
7 Summative Unit Evaluation

Grade 11 U/C – Unit 2: Functions through Quadratics 3
Unit 2 : Day 1 : Function or Not? Grade 11 U/C Minds On: 10
Action: 45
Consolidate:20 Total=75
min
Description/Learning Goals • Explore and formulate a definition for the term function • Distinguish a function from a relation that is not a function
Materials • BLM 2.1.1 -
BLM 2.1.8 Overheads • BLM 2.1.1 • BLM 2.1.3 • BLM 2.1.5
Assessment Opportunities
Minds On… Pairs → Think/Pair/Share Pose the following questions for students to consider individually before sharing with a partner. Given the model of a car (i.e. civic), can you determine the make of the car? (i.e. Honda). Is this the only possible answer? Given the make of a car (i.e. Honda), can you determine the model of the car? (i.e. civic). Is this the only possible answer? Whole Class → Discussion Discuss the answers to these questions.
Action! Individual Concept Attainment Teacher will use BLM 2.2.1 to provide students with examples and non-examples of the concept (functions) to be explored through Concept Attainment. Students should write down important criteria that distinguish an example from a non-example based on specimens from BLM 2.2.1 Students will be provided with one tester at a time from BLM 2.2.2, that they will place under the headings EXAMPLES and NON-EXAMPLES using their individual criteria. . Students should be given 1 minute of process time before teacher confirms appropriate placement of each tester and provides student with new testers. Repeat the process for BLM 2.2.3, BLM 2.2.4, BLM 2.2.5 and BLM 2.2.6. At the completion of BLM 2.2.6, elicit from students descriptions of how a ruler could be used to determine if a given graph is an example of the concept (function). Define this process as the vertical line test. Mathematical Process Focus: Reasoning and Proving (Students will use Concept Attainment to reason and prove their choices.)
Consolidate Debrief Pairs→Consolidate
Teacher identifies the name of the concept being explored as Function. Students will consolidate their understanding of the concept using the Frayer Model, BLM 2.2.7.
Purposely do not identify the word function at this time. Project BLM 2.2.1 one example or non-example at a time. Students will need time to compare and contrast and note important criteria. Cut BLM 2.2.2, BLM 2.2.4 and BLM 2.2.6 into rectangles to distribute to students. Instructional Strategy: Concept Attainment, refer to Beyond Monet by Barrie Bennett and Carol Rolheiser, p 188-239 Literacy Strategy: Use the Frayer Model to assist students in understanding the various representations of the concept of Function.
Concept Application
Home Activity or Further Classroom Consolidation Students will create 8 testers, 2 for each representation of a function (description, mapping diagram, table of values and graph) on BLM 2.2 to be exchanged and completed in the following class.

Grade 11 U/C – Unit 2: Functions through Quadratics 4
2.1.1 Function or Not? (Overhead) Examples Non Examples
21 22 45
0 1 5
Honda Toyota Ford
Civic Camry Accord Mustang
Civic Accord Pilot
Honda
--2 --1 0 1 2
0 1 4
-2 -1 0 1 2
0 1 4
21 22 45
0 1 5

Grade 11 U/C – Unit 2: Functions through Quadratics 5
2.1.2 Function or Not? (Tester)
Collie Hound Pursian Siamese
Dog Cat
Bread Drink
White Whole Wheat Pop Water
2 3 4 5
4 6 8 10
-1 1 0 2 -2
1 0 4

Grade 11 U/C – Unit 2: Functions through Quadratics 6
2.1.3 Function or Not? (Overhead) Examples Non Examples x y x y 21 1 21 0 22 0 21 1 45 5 22 5 45 0 x y x y -1 -3 -1 5 0 1 0 5 1 5 1 5 2 9 2 5 x y x y -2 3 -1 0 -1 0 0 -1 0 -1 0 1 1 0 3 -2 2 3 3 2

Grade 11 U/C – Unit 2: Functions through Quadratics 7
2.1.4 Function or Not? (Testers) x y x y 0 3 6 5 2 0 8 4 5 -1 9 4.5 11 5 x y x y 1 5 -2.5 -1 1 7 -2.5 0 2 3 -2.5 -2 7 8 -2.5 -3

Grade 11 U/C – Unit 2: Functions through Quadratics 8
2
-2
y
x
-π
π
4
2
y
x
2-2
2
-2
y
x
2-2
2.1.5 Function or Not? (Overhead) Examples Non Examples
4
2
y
x
2-2
2
-2
y
x
2-2

Grade 11 U/C – Unit 2: Functions through Quadratics 9
2.1.6 Function or Not? (Tester)
4
2
-2
y
x
2-2
-2
y
x
1
π
-2
2
-2
y
5
x
y
x

Grade 11 U/C – Unit 2: Functions through Quadratics 10
2.1.7 What is a Function? Name: ______________________________________Date: _____________________ Definition
Rules
Examples
Non-Examples
Function

Grade 11 U/C – Unit 2: Functions through Quadratics 11
2.1.8 Function or Not? Created by:____________________________________ Date:___________________ Answered by:_________________________________ Date:___________________ Description:
Description:
Example OR Non-Example Example OR Non-Example Mapping Diagram:
Mapping Diagram:
Example OR Non-Example Example OR Non-Example Table of Values: Table of Values:
Example OR Non-Example Example OR Non-Example Graph:
Graph:
Example OR Non-Example Example OR Non-Example

Grade 11 U/C – Unit 2: Functions through Quadratics 12
Unit 2 : Day 2 : Frame It MCF 3M
Minds On: 15
Action: 40
Consolidate:20
Total = 75 min
Description/Learning Goals • Collect data that can be modelled as quadratic functions • Create scatter plots of quadratic data • Model the data with the graphing calculator using quadratic regression • Use models to verify hypothesis
Materials • BLMs 2.2.1 - 2.2.9 • cube-a-links • pieces for Frogs game
(e.g., cube-a-links) • graphing calculators • chart paper
Assessment Opportunities
Minds On… Small Groups Class Discussion Students will spend up to 10 minutes sharing “testers” from previous home activity to determine if they are examples or non-examples of functions. Explain to students that they will be examining a special type of function, a quadratic function. With the remaining 5 minutes, students will use the Place Mat activity to activate the sharing of prior knowledge about quadratic functions (covered in 10P and 10D) (BLM 2.2.1)
Action! Small Groups Exploration In groups, students will examine quadratic data and present their findings to the class. Each group will examine a different scenario (BLM 2.2.2 – 2.2.8) Students will: • work in groups to complete a table of values, create a scatter plot,
generate a curve of best fit and record the equation for this model on chart paper,
• present their findings to the class, and • complete columns “sketch” and “algebraic model” on BLM 2.2.9 as
other groups present. Mathematical Process Focus: Communicating (Students will model the correct use of mathematical symbols, conventions, vocabulary, and notations)
Consolidate Debrief Whole Class Discussion
Discuss the limitations/reasonableness of the algebraic model (e.g., discrete data vs. continuous model, informally discuss domain). What are the similarities/differences seen in the presentations? Students will add new information to their FRAME graphic organizer for quadratic functions started in Unit 1 (remind students that they will be adding to this throughout their examination of quadratic functions). Individual Consolidation Have students examine the quadratic models around the room and/or on BLM 2.2.9 and answer the following question: “Explain how you know that a model is a quadratic function. Refer to the graphical, numerical (table of values) and algebraic (equation) models.” Mathematical Process Focus: Connecting (Students will make connections between different representations e.g., numeric, graphical and algebraic.)
Literacy strategy: During the Minds On, introduce the Place Mat activity. Post student scenarios on chart paper around the room to use in subsequent lessons. Students will record information presented using BLM 2.2.9. Opportunity to assess communication as they present to class. This could be a journal entry and used for formative assessment.
Application Concept Practice
Home Activity or Further Classroom Consolidation Complete “focus question” column from BLM 2.2.9. Using 2 different strategies

Grade 11 U/C – Unit 2: Functions through Quadratics 13
2.2.1 Frayer Model
Quadratic Functions
Grade 11 U/C – Unit 2: Functions through Quadratics 14
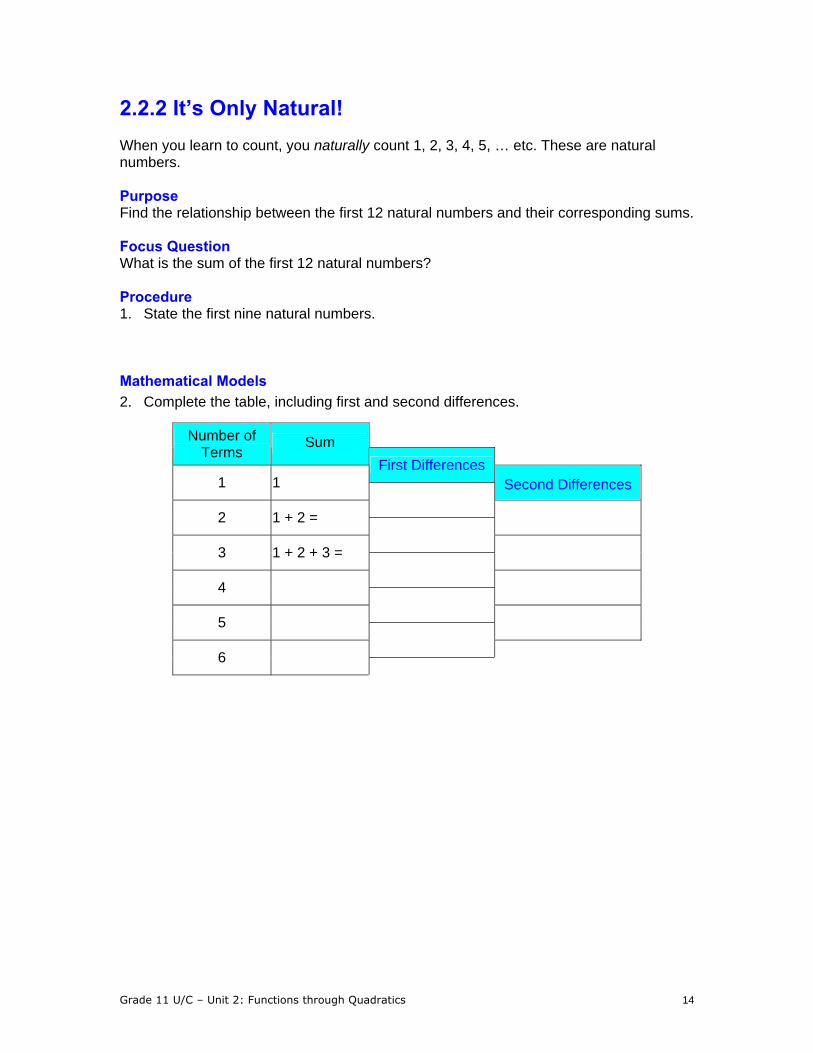
2.2.2 It’s Only Natural! When you learn to count, you naturally count 1, 2, 3, 4, 5, … etc. These are natural numbers. Purpose Find the relationship between the first 12 natural numbers and their corresponding sums. Focus Question What is the sum of the first 12 natural numbers? Procedure 1. State the first nine natural numbers. Mathematical Models 2. Complete the table, including first and second differences.
Number of Terms
Sum First Differences
1 1 Second Differences
2 1 + 2 =
3 1 + 2 + 3 =
4
5
6

Grade 11 U/C – Unit 2: Functions through Quadratics 15
2.2.2 It’s Only Natural! (continued) 3. Enter the data in L1 and L2 of your calculator. 4. Create a scatter plot on the calculator using the window
settings provided. 5. Use the window settings as the scales for your axes to construct the graph on your
chart paper. On your chart paper, construct a scatter plot of Number of Terms vs. Sum.
6. Explore the regressions available on the graphing
calculator and circle the regression on the screen shot at right that best models the data. Graph the best model on the same screen as your scatter plot.
7. Sketch the best model on the chart paper in a different
colour. Extend the model as shown in the graphing calculator.
8. Write the equation for your model on the chart paper. 9. Your group will present your findings to the rest of the class. Your presentation
should include: • The scenario your group investigated. • The data you collected. • The model that best fit the data. • Make your work on the chart paper neat as we will be posting these in the
class to use throughout the unit.

Grade 11 U/C – Unit 2: Functions through Quadratics 16
2.2.3 Pop Cans Pop cans are arranged in a pattern that involves triangular numbers. The top row has one cup, the second row has three cups, and so on. Purpose Find the relationship between the number of rows and the total number of cans. Focus Question What is the total number of cans in an arrangement with 15 rows? Procedure 1. Examine the relationship between the row number and the number of cups in the
corresponding row.
2. Create the next model in the sequence. Mathematical Models 3. Complete the table, including first and second differences.
Number of Rows
Total Number of Cans
First Differences1 1 Second Differences
2 3
3
4
5
6

Grade 11 U/C – Unit 2: Functions through Quadratics 17
2.2.3 Pop Cans (continued) 4. Enter the data in L1 and L2 of your calculator. 5. Create a scatter plot on the calculator using the window
settings provided. 6. Use the window settings as the scales for your axes to construct the graph on your
chart paper. On your chart paper, construct a scatter plot of Total Number of Cans vs. Number of Rows.
7. Explore the regressions available on the graphing
calculator and circle the regression on the screen shot at right that best models the data. Graph the best model on the same screen as your scatter plot.
8. Sketch the best model on the chart paper in a different
colour. Extend the model as shown in the graphing calculator.
9. Write the equation for your model on the chart paper. 10. Your group will present your findings to the rest of the class. Your presentation
should include: • The scenario your group investigated. • The data you collected. • The model that best fit the data. • Make your work on the chart paper neat as we will be posting these in the
class to use throughout the unit.

Grade 11 U/C – Unit 2: Functions through Quadratics 18
2.2.4 Frogs The game of Frogs has a simple set of rules but it is challenging to play. Purpose Find the minimum number of moves needed to move the pieces on the left to the right. You can move a piece by sliding it to an empty space next to it or by jumping a piece if the space on the other side is empty. You cannot jump more than one piece and you cannot move backwards. Focus Question How many moves would be required to switch ten pairs of playing pieces? Procedure One pair of playing pieces
1. How many moves will it take to switch the playing pieces? Two pairs of playing pieces 2. How many moves will it take to switch the playing pieces? Mathematical Models 3. Complete the table, including first and second differences.
Number of pairs
Number of Moves
First
Differences1 Second
Difference 2
3
4
5
6

Grade 11 U/C – Unit 2: Functions through Quadratics 19
2.2.4 Frogs (continued) 4. Enter the data in L1 and L2 of your calculator. 5. Create a scatter plot on the calculator using the window
settings provided.
6. Use the window settings as the scales for your axes to construct the graph on your
chart paper. On your chart paper, construct a scatter plot of Minimum Number of Moves vs. Number of Pairs.
7. Explore the regressions available on the graphing
calculator and circle the regression on the screen shot at right that best models the data. Graph the best model on the same screen as your scatter plot.
8. Sketch the best model on the chart paper in a different
colour. Extend the model as shown in the graphing calculator.
9. Write the equation for your model on the chart paper. 10. Your group will present your findings to the rest of the class. Your presentation
should include: • The scenario your group investigated. • The data you collected. • The model that best fit the data. • Make your work on the chart paper neat as we will be posting these in the
class to use throughout the unit.
Grade 11 U/C – Unit 2: Functions through Quadratics 20
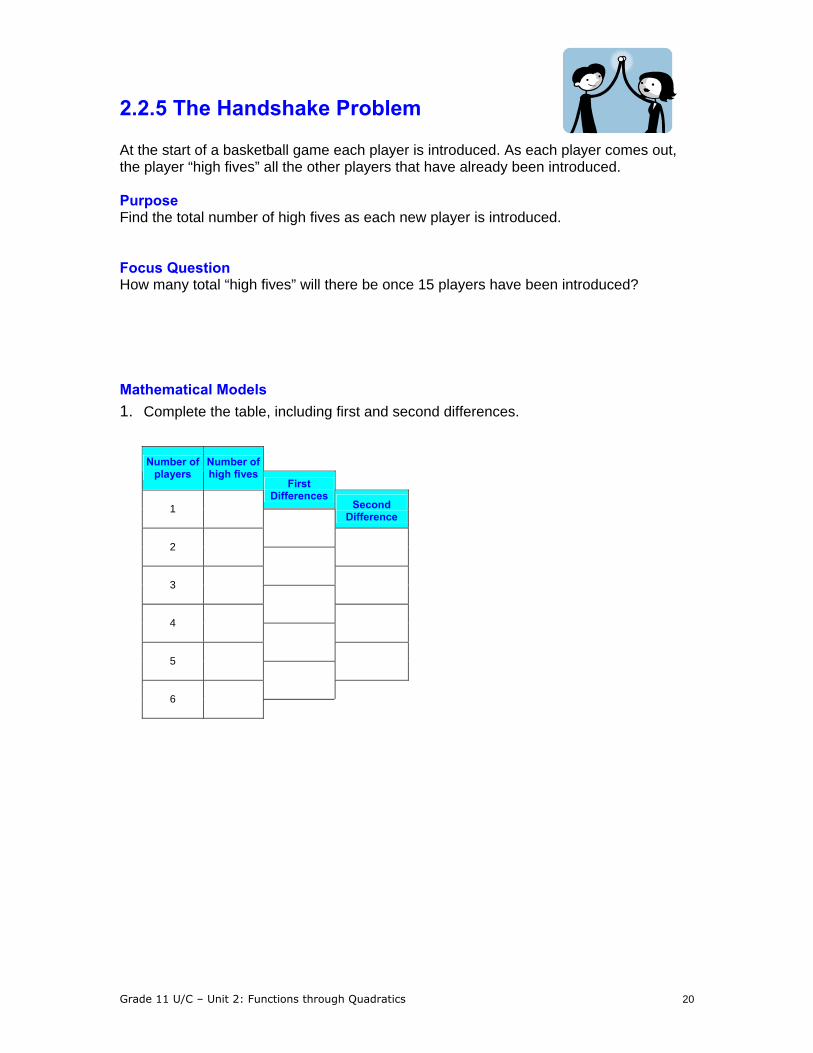
2.2.5 The Handshake Problem At the start of a basketball game each player is introduced. As each player comes out, the player “high fives” all the other players that have already been introduced. Purpose Find the total number of high fives as each new player is introduced. Focus Question How many total “high fives” will there be once 15 players have been introduced? Mathematical Models 1. Complete the table, including first and second differences.
Number of players
Number of high fives
First Differences
1 Second Difference
2
3
4
5
6

Grade 11 U/C – Unit 2: Functions through Quadratics 21
2.2.5 The Handshake Problem (continued) 2. Enter the data in L1 and L2 of your calculator. 3. Create a scatter plot on the calculator using the window
settings provided. 4. Use the window settings as the scales for your axes to construct the graph on your
chart paper. On your chart paper, construct a scatter plot of Number of High Fives vs. Number of Players.
5. Explore the regressions available on the graphing
calculator and circle the regression on the screen shot at right that best models the data. Graph the best model on the same screen as your scatter plot.
6. Sketch the best model on the chart paper in a different
colour. Extend the model as shown in the graphing calculator.
7. Write the equation for your model on the chart paper. 8. Your group will present your findings to the rest of the class. Your presentation
should include: • The scenario your group investigated. • The data you collected. • The model that best fit the data. • Make your work on the chart paper neat as we will be posting these in the
class to use throughout the unit.

Grade 11 U/C – Unit 2: Functions through Quadratics 22
2.2.6 On the Buses The local transit company is trying to determine how much to raise fares in order to maximize revenues. Currently there is an average of 56 000 riders that pay an average fare of $2. Market research has determined that an increase of $0.10 in the fare will lead to a loss of 2000 riders. Purpose Find the fare and the number of riders that will lead to the maximum revenue? Focus Question What is the fare that will provide the maximum revenue? (Note: Revenue = fare x number of riders) Procedure 1. What is the revenue at the current fare ($2) and the current number of riders (56
000)? 2. If the fare is increased by $0.10, determine the revenue. Mathematical Models 3. Complete the table, including first and second differences.
Number of fare increases Revenue
First Differences
1 Second Difference
2
3
4
5
6

Grade 11 U/C – Unit 2: Functions through Quadratics 23
2.2.6 On the Buses (continued) 4. Enter the data in L1 and L2 of your calculator. 5. Create a scatter plot on the calculator using the window
settings provided. 6. Use the window settings as the scales for your axes to
construct the graph on your chart paper. On your chart paper, construct a scatter plot of Number of fare increases vs. Revenue.
7. Explore the regressions available on the graphing
calculator and circle the regression on the screen shot at right that best models the data. Graph the best model on the same screen as your scatter plot.
8. Sketch the best model on the chart paper in a different
colour. Extend the model as shown in the graphing calculator.
9. Write the equation for your model on the chart paper. 10. Your group will present your findings to the rest of the class. Your presentation
should include: • The scenario your group investigated. • The data you collected. • The model that best fit the data. • Make your work on the chart paper neat as we will be posting these in the
class to use throughout the unit.

Grade 11 U/C – Unit 2: Functions through Quadratics 24
2.2.7 To the Wall and Back Your coach wants to see how fast you really are. She places a motion detector to record this information as you run towards the wall; touch it; then run back. The table at the bottom of this page displays the data collected for your run. Purpose Find the relationship between distance and time. Focus Question How far from the motion detector would you be after 1.25 seconds? Procedure 1. Examine the relationship between the distance travelled and the elapsed time in the
given chart. Mathematical Models 2. Complete the first differences and second differences columns.
Time (s)
Distance from Motion Detector
(m)
First Differences0 0 Second Differences
0.5 7
1 12
1.5 15
2 16
2.5 15
3 12
3.5 7
4 0

Grade 11 U/C – Unit 2: Functions through Quadratics 25
2.2.7 To the Wall and Back (continued) 3. Enter the data in L1 and L2 of your calculator. 4. Create a scatter plot on the calculator using the window
settings provided. 5. Use the window settings as the scales for your axes to construct the graph on your
chart paper. On your chart paper, construct a scatter plot of Distance from the Motion Detector vs. Time.
6. Explore the regressions available on the graphing
calculator and circle the regression on the screen shot at right that best models the data. Graph the best model on the same screen as your scatter plot.
7. Sketch the best model on the chart paper in a different
colour. Extend the model as shown in the graphing calculator.
8. Write the equation for your model on the chart paper. 9. Your group will present your findings to the rest of the class. Your presentation
should include: • The scenario your group investigated. • The data you collected. • The model that best fit the data. • Make your work on the chart paper neat as we will be posting these in the
class to use throughout the unit.

Grade 11 U/C – Unit 2: Functions through Quadratics 26
2.2.8 Pizza Anyone? When you cut a pizza using straight lines the maximum number of pieces created increases. Purpose Find the relationship between the number of cuts and the maximum number of pieces. Focus Question What is the maximum number of pieces when you cut the pizza 10 times? Procedure 1. Examine the relationship between the number of cuts and the maximum number of
pieces. 2. Create the next model in the sequence.
Hint: To maximize the number of pieces, the next cut should not go through an existing intersection.
Mathematical Models 3. Complete the table, including first and second differences.
Number of Cuts
Maximum Number of
Pieces
First Differences
0 1 Second Differences
1
2
3
4
5

Grade 11 U/C – Unit 2: Functions through Quadratics 27
2.2.8 Pizza Anyone? (continued) 4. Enter the data in L1 and L2 of your calculator. 5. Create a scatter plot on the calculator using the window
settings provided. 6. Use the window settings as the scales for your axes to construct the graph on your
chart paper. On your chart paper, construct a scatter plot of Maximum Number of Pieces vs. Number of Cuts.
7. Explore the regressions available on the graphing
calculator and circle the regression on the screen shot at right that best models the data. Graph the best model on the same screen as your scatter plot.
8. Sketch the best model on the chart paper in a different
colour. Extend the model as shown in the graphing calculator.
9. Write the equation for your model on the chart paper. 10. Your group will present your findings to the rest of the class. Your presentation
should include: • The scenario your group investigated. • The data you collected. • The model that best fit the data. • Make your work on the chart paper neat as we will be posting these in the
class to use throughout the unit.

Grade 11 U/C – Unit 2: Functions through Quadratics 28
2.2.9 Summarizing the Results Complete the table.
Activity Title Sketch Algebraic Model Question
It’s Only Natural
What is the sum of the first 12 natural numbers?
Pop Cans
What is the total number of cans in an arrangement with 15 rows?
Frogs
How many moves would be required to switch ten pairs of playing pieces?

Grade 11 U/C – Unit 2: Functions through Quadratics 29
2.2.9 Summarizing the Results (continued)
The Handshake Problem
How many total “high fives” will there be once 15 players have been introduced?
On the Buses
What is the fare that will provide the maximum revenue?
To the Wall and Back
How far from the motion detector would you be after 1.25 seconds?
Pizza Anyone?
What is the maximum number of pieces created when you cut the pizza 10 times?

Grade 11 U/C – Unit 2: Functions through Quadratics 30
Unit 2 : Day 4 : Domain and Range Grade 11 U/C Minds On: 15
Action: 40
Consolidate:20 Total=75 min
Description/Learning Goals • Explore the meanings of the terms domain and range. • Describe the domain and range of a function appropriately. • Working co-operatively.
Materials • BLM 2.4.1 • BLM 2.4.2 • BLM 2.4.3 • Computer
Projector
Assessment Opportunities
Minds On… Small Groups Four Corners The four corners words, number line, list of numbers, inequality statement are posted in the room see BLM 2.4.1. Students will be given one card each from BLM 2.4.1. Instructions to students “Look at your card and decide which corner of the room your card represents. Move to that corner of the room. Once you are in your corner, each person should justify their rational for their choice and give further examples of numbers described by their card.” After each corner has completed their task, each person needs to find the people from the other corners whose description represents the same set of numbers. (There will be 8 groups of 4 people with common sets.) Post each set of cards around the room for student reference during the remainder of the lesson. (There will be 8 groups of 4 cards)
Action! Small Groups Investigation Students will remain in the groupings from the Minds On activity. Students will complete B.L.M 2.4.2 (two of the scenarios from the lesson 2.2 ) Small Groups Activity Students will read the definitions of domain and range and identify the domain for each of the graphs on BLM 2.4.3 using the choices posted around the room and record as per instructions on BLM 2.4.3. Students will individually complete the range column and discuss their answers within their group. Teacher will circulate among the groups to ensure correct answers. Mathematical Process Focus – Representing (Students will represent domain and range using words, number line, list of numbers and inequality statements.)
Consolidate Debrief Whole Class Demonstration
Demonstrate an example of creating a function and stating the domain and range from the website http://www.shodor.org/interactivate/activities/verttest/.
Students have not seen inequality statements prior to this lesson. Literacy Strategy: Four Corners Set up the four corners in the room with the signs: words, number line, list of numbers, inequality statement. Cut up BLM 2.4.1 into individual cards to be distributed to students as they arrive in class. Explain that domain and ranges can be whole numbers, integers or real numbers. The domains are the data sets that are posted around the room. The website provides a set of points which can be rearranged to create a function.
Concept Practice
Home Activity Have the students go to the website demonstrated, create and print 4 different functions. For each function, state the domain and range using a different notation each time. These will be shared in the next class.
If students do not have access to the internet, teacher can create four graphs to give to students

Grade 11 U/C – Unit 2: Functions through Quadratics 31
2.4.1 Domain and Range of a Function

Grade 11 U/C – Unit 2: Functions through Quadratics 32
2.4.1 Domain and Range of a Function (continued)

Grade 11 U/C – Unit 2: Functions through Quadratics 33
2.4.1 Domain and Range of a Function (continued)

Grade 11 U/C – Unit 2: Functions through Quadratics 34
2.4.1 Domain and Range of a Function (continued)

Grade 11 U/C – Unit 2: Functions through Quadratics 35
2.4.1 Domain and Range of a Function (continued) Cut cards out and give one to each student.
0x ≥
0,1,2,3,…
x is greater than or equal to zero.
0x >
1,2,3,4,...
x is greater than zero.
1 2 -1 0 3
1 2 -1 0

Grade 11 U/C – Unit 2: Functions through Quadratics 36
2.4.1 Domain and Range of a Function (continued)
6 3x− ≤ ≤ −
6, 5, 4, 3− − − −
x is between -6 and -3
inclusive.
1x ≥ −
1,...,0,...,1,..., 2...−
x is greater than or equal to negative one.
-4 -3 -6 -5 -2 -7
0 1 -2 -1 -3

Grade 11 U/C – Unit 2: Functions through Quadratics 37
2.4.1 Domain and Range of a Function (continued)
ℜ∈x
..., 1,..., .75,..., .5,...,0,...,5,...,7.7,...− − −
x is an element of the
real numbers.
Zx∈
..., 2, 1,0,1,2...− −
x is an element of the integers.
1 2 -1 0 -2
0 1 -2 -1 2

Grade 11 U/C – Unit 2: Functions through Quadratics 38
2.4.1 Domain and Range of a Function (continued)
0 8x≤ ≤
0,..., 2,..., 4,...,6,...,8
x is between 0 and 8 inclusive.
2 4x− ≤ ≤
2,...,0,..., 2,..., 4−
x is between -2 and 4 inclusive.
6 8 2 4 0
4 6 0 2 -2 -4

Grade 11 U/C – Unit 2: Functions through Quadratics 39
2.4.2 Domain and Range of a Function When you cut a pizza using straight lines the maximum number of pieces created increases.
Number of Cuts
Maximum Number of
Pieces
0 1
1 2
2 4
3 7
4 11
5 16
Number of Rows
Total Number of
Cans
1 1
2 3
3 6
4 10
5 15
6 21
The number of __________ determines the number of __________. Examine the values in the table to the left. What are other possible values for the number of cuts? Use one of the notations from the cards (words, number line, list of numbers, inequality statement) to express the possible values for the number of cuts. What are other possible values for the maximum number of pieces? Use a different notation from the cards (words, number line, list of numbers, inequality statement) to express the possible values for the maximum number of pieces.
The number of __________ determines the number of __________. Use a different notation from the cards (words, number line, list of numbers, inequality statement) to express the possible values for the number of rows. Use the remaining notation from the cards (words, number line, list of numbers, inequality statement) to express the possible values for the total number of cans.
Pop cans are arranged in a pattern that involves triangular numbers. The top row has one cup, the second row has three cups, and so on.

Grade 11 U/C – Unit 2: Functions through Quadratics 40
2.4.3 Domain and Range of a Function Definition of the Domain of a Function The set of the first coordinates of the ordered pairs in the function. (i.e. independent values, x values) Definition of the Range of a Function The set of the second coordinates of the ordered pairs in the function. (i.e. dependent values, y values) In your group, select the domain for the following graphs from the card sets posted around the room and record the domain in the space provided using two different notations. (words, number line, list of numbers, inequality statement) Individually, state the range for the each graph using two different notations.
Graph Domain Range

Grade 11 U/C – Unit 2: Functions through Quadratics 41
2.4.3 Domain and Range of a Function (continued)

Grade 11 U/C – Unit 2: Functions through Quadratics 42
2.4.3 Domain and Range of a Function (continued)