Model-based Organization Manning, Strategy, and … Model-based Organization Manning, Strategy, and...
27
0 Cover Sheet Model-based Organization Manning, Strategy, and Structure Design via Team Optimal Design (TOD) Methodology Paper: 134 Names of Authors: Georgiy Levchuk * , Kari Chopra, Michael Paley, Yuri Levchuk, and Dave Clark 1 1 Aptima , Inc. 12 Gill St, Suite 1400 Woburn, MA 01801 (781) 935-3966 [email protected] ; [email protected] , [email protected] , [email protected] , [email protected] *Denotes author to contact. Track Topic: Modeling and Simulation 10 TH INTERNATIONAL COMMAND AND CONTROL RESEARCH AND TECHNOLOGY SYMPOSIUM THE FUTURE OF C2 McLean, Virginia, June 13-16, 2005
-
Upload
nguyenkhue -
Category
Documents
-
view
221 -
download
2
Transcript of Model-based Organization Manning, Strategy, and … Model-based Organization Manning, Strategy, and...

0
Cover Sheet
Model-based Organization Manning, Strategy, and Structure Design via Team Optimal Design (TOD)
Methodology
Paper: 134
Names of Authors: Georgiy Levchuk*, Kari Chopra, Michael Paley, Yuri Levchuk, and Dave Clark1
1Aptima, Inc. 12 Gill St, Suite 1400 Woburn, MA 01801
(781) 935-3966 [email protected]; [email protected], [email protected], [email protected],
*Denotes author to contact.
Track Topic: Modeling and Simulation
10TH INTERNATIONAL COMMAND AND CONTROL RESEARCH AND TECHNOLOGY SYMPOSIUM THE FUTURE OF C2
McLean, Virginia, June 13-16, 2005

1
Model-based Organization Manning, Strategy, and Structure Design via Team Optimal Design (TOD)
Methodology
Georgiy Levchuk, Kari Chopra, Michael Paley, Yuri Levchuk, and Dave Clark1
Abstract This paper describes a quantitative Team Optimal Design (TOD) methodology and its application to the design of optimized manning for E-10 Multi-sensor Command and Control Aircraft. The E-10 (USAF, 2002) is intended to consolidate command and control (C2), battle management (BM), intelligence, surveillance and reconnaissance (ISR), and selected information warfare (IW) functions and eventually replace elements of the current C2ISR force mix. Our TOD design approach allows specification of team configurations (number and roles of operators) for efficiently operating E-10 to execute mission scenarios of various contingencies. The objective is to maximize the speed of mission execution while balancing the workload among team members, provided the decision-making, expertise, workload threshold and organization cost constraints are satisfied. In order to analyze and simulate the operations of E-10, we conducted mission decomposition to define functional responsibilities for the E-10 within the context of an operational mission. Working with subject matter experts, we developed functional process flows of E-10 by decomposing each stage into representative functions. Each of these functions is in turn decomposed into high level task responsibilities, defining a directed graph of tasks with precedence/information flow constraints.
Keywords—team optimal design, organizational structure, optimal manning
1 Aptima Inc., 12 Gill Street, Suite 1400, Woburn, MA 01801, p: 781-935-3966, f: 781-935-4385
2
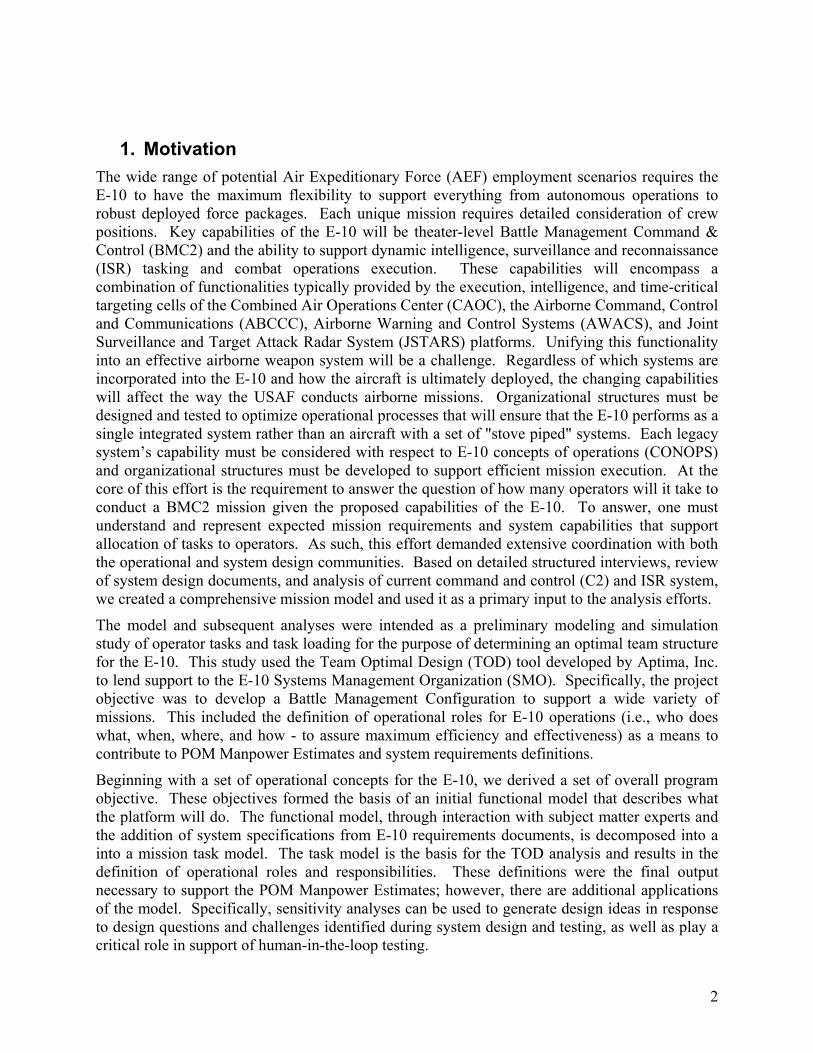
1. Motivation The wide range of potential Air Expeditionary Force (AEF) employment scenarios requires the E-10 to have the maximum flexibility to support everything from autonomous operations to robust deployed force packages. Each unique mission requires detailed consideration of crew positions. Key capabilities of the E-10 will be theater-level Battle Management Command & Control (BMC2) and the ability to support dynamic intelligence, surveillance and reconnaissance (ISR) tasking and combat operations execution. These capabilities will encompass a combination of functionalities typically provided by the execution, intelligence, and time-critical targeting cells of the Combined Air Operations Center (CAOC), the Airborne Command, Control and Communications (ABCCC), Airborne Warning and Control Systems (AWACS), and Joint Surveillance and Target Attack Radar System (JSTARS) platforms. Unifying this functionality into an effective airborne weapon system will be a challenge. Regardless of which systems are incorporated into the E-10 and how the aircraft is ultimately deployed, the changing capabilities will affect the way the USAF conducts airborne missions. Organizational structures must be designed and tested to optimize operational processes that will ensure that the E-10 performs as a single integrated system rather than an aircraft with a set of "stove piped" systems. Each legacy system’s capability must be considered with respect to E-10 concepts of operations (CONOPS) and organizational structures must be developed to support efficient mission execution. At the core of this effort is the requirement to answer the question of how many operators will it take to conduct a BMC2 mission given the proposed capabilities of the E-10. To answer, one must understand and represent expected mission requirements and system capabilities that support allocation of tasks to operators. As such, this effort demanded extensive coordination with both the operational and system design communities. Based on detailed structured interviews, review of system design documents, and analysis of current command and control (C2) and ISR system, we created a comprehensive mission model and used it as a primary input to the analysis efforts.
The model and subsequent analyses were intended as a preliminary modeling and simulation study of operator tasks and task loading for the purpose of determining an optimal team structure for the E-10. This study used the Team Optimal Design (TOD) tool developed by Aptima, Inc. to lend support to the E-10 Systems Management Organization (SMO). Specifically, the project objective was to develop a Battle Management Configuration to support a wide variety of missions. This included the definition of operational roles for E-10 operations (i.e., who does what, when, where, and how - to assure maximum efficiency and effectiveness) as a means to contribute to POM Manpower Estimates and system requirements definitions.
Beginning with a set of operational concepts for the E-10, we derived a set of overall program objective. These objectives formed the basis of an initial functional model that describes what the platform will do. The functional model, through interaction with subject matter experts and the addition of system specifications from E-10 requirements documents, is decomposed into a into a mission task model. The task model is the basis for the TOD analysis and results in the definition of operational roles and responsibilities. These definitions were the final output necessary to support the POM Manpower Estimates; however, there are additional applications of the model. Specifically, sensitivity analyses can be used to generate design ideas in response to design questions and challenges identified during system design and testing, as well as play a critical role in support of human-in-the-loop testing.
3
The paper is organized as follows. We present the Team Optimal Design (TOD) methodology in Section 2. The TOD fundamental concepts are outlined in Section 2.1, while TOD architecture is described in Section 2.2. Modeling of individual task processing and selection rules is presented in Section 2.3, while utilization of TOD in model-based training and assessment systems is outlined in Section 2.4. Section 2.5 provides a detailed account of our current and future modeling activities. Section 3 presents the application of TOD model to the design of E-10 team and operator responsibilities. Finally, results and future directions are described in Section 4.
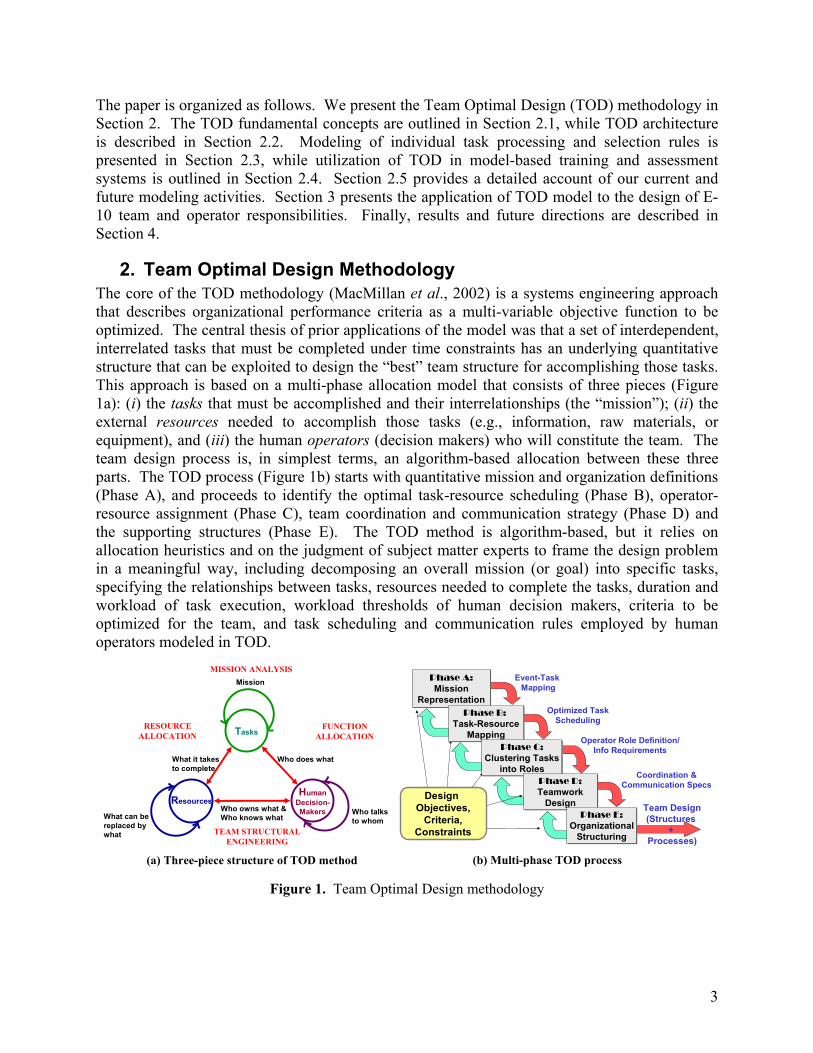
2. Team Optimal Design Methodology The core of the TOD methodology (MacMillan et al., 2002) is a systems engineering approach that describes organizational performance criteria as a multi-variable objective function to be optimized. The central thesis of prior applications of the model was that a set of interdependent, interrelated tasks that must be completed under time constraints has an underlying quantitative structure that can be exploited to design the “best” team structure for accomplishing those tasks. This approach is based on a multi-phase allocation model that consists of three pieces (Figure 1a): (i) the tasks that must be accomplished and their interrelationships (the “mission”); (ii) the external resources needed to accomplish those tasks (e.g., information, raw materials, or equipment), and (iii) the human operators (decision makers) who will constitute the team. The team design process is, in simplest terms, an algorithm-based allocation between these three parts. The TOD process (Figure 1b) starts with quantitative mission and organization definitions (Phase A), and proceeds to identify the optimal task-resource scheduling (Phase B), operator-resource assignment (Phase C), team coordination and communication strategy (Phase D) and the supporting structures (Phase E). The TOD method is algorithm-based, but it relies on allocation heuristics and on the judgment of subject matter experts to frame the design problem in a meaningful way, including decomposing an overall mission (or goal) into specific tasks, specifying the relationships between tasks, resources needed to complete the tasks, duration and workload of task execution, workload thresholds of human decision makers, criteria to be optimized for the team, and task scheduling and communication rules employed by human operators modeled in TOD.
Who does what
What can be replaced by what
Resources
What it takesto complete
Who talks to whom
HumanDecision-MakersWho owns what &
Who knows what
Tasks
Mission
RESOURCEALLOCATION
TEAM STRUCTURALENGINEERING
FUNCTIONALLOCATION
MISSION ANALYSIS
(a) Three-piece structure of TOD method (b) Multi-phase TOD process
Event-Task Mapping
Optimized TaskScheduling
Operator Role Definition/Info Requirements
Coordination &Communication Specs
Team Design(Structures
+ Processes)
Design Objectives,
Criteria,Constraints
Phase A:Mission
Representation
Phase A:Mission
RepresentationPhase B:
Task-ResourceMapping
Phase B:Task-Resource
MappingPhase C:
Clustering Tasksinto Roles
Phase C:Clustering Tasks
into RolesPhase D:Teamwork
Design
Phase D:Teamwork
DesignPhase E:
OrganizationalStructuring
Phase E:Organizational
Structuring
Figure 1. Team Optimal Design methodology

4
2.1. TOD fundamental concepts This subsection introduces a brief description and notation for the four fundamental constructs in the TOD model – agents, tasks, resources, and time – and how TOD ties these constructs together through the mission schedule.
An agent (Ak) (or operator, decision maker) is an entity with information-processing, decision-making, and operational capabilities that can control the necessary resources to execute mission tasks. An agent can execute more than one task in parallel at a time, subject to workload constraints (discussed in further detail below).
A task is an activity that contributes to accomplishing the objectives of a mission. Tasks are represented by two different concepts. The first is a task class (Ch), which represents a generic kind of activity that can be carried out (e.g., “Identify radar track”). The second is a task instance (Ti), which represents a specific execution of an activity (e.g., “Identification of radar track 247”). Each task instance represents an execution of a single task class; thus we use the notation C(Ti) to refer to the class of task Ti. For the sake of brevity, we will frequently use the single term task; where necessary, the specific terms task class and task instance will be used to distinguish between the two.
A resource (Rj) is a physical asset of an organization that provides resource capabilities and is used to process tasks. Resources are controlled by the agents in the organization.
Time (tn) in the mission is represented by a sequence of timesteps. In the current implementation, it is assumed that timesteps are spaced at equal intervals. It is also assumed that a task instance is executed for a contiguous interval of time.
The TOD methodology specifies the allocation of resources to agents, assignment of tasks to agents, schedule of tasks on resources and/or agents, and inter-agent command and coordination networks. The parameters of task scheduling and organization structures define performance and process measures for the corresponding team. The TOD methodology employs heuristic resource-constrained task-to-operator scheduling, which incorporates normative models of synthetic operators and teams. The synthetic operators utilize the design of priority rules to model human preferences for task selection. Individual task execution is modeled by accounting for human workload constraints and the impact of workload, experience, and learning on task execution accuracy. Team processes are modeled using operator interactions in the form of synthetic communication, including (i) decision/action; (ii) command; (iii) information request/transfer; and (iv) task execution synchronization. The synthetic team structures (information transfer and command responsibility) serve as a medium for this communication.
2.2. Scheduling architecture The TOD model can employ two scheduling architectures, either with or without a commander. The commander architecture explores operator strategies for task prioritization and interactions between the global organizational objectives and the local operator objectives. The architecture consists of a hierarchy with a commander (Figure 2a), which produces a temporal assignment of tasks to operators using the global organizational objectives, and the local operator modules, which select tasks for processing from their assignment set under operators’ local priority rules. The operator modules can accept or reject the task assignment from a commander (Figure 2b). The commander monitors mission events and the operators’ processes, and feedbacks the strategy adjustment to the operators. There is no direct interaction among individual operators in

5
this architecture. The TOD methodology utilizes the decision tree approach to find the clustering of tasks according to various task parameters, and assigns these clusters to decision-makers using the global control policy.
CommanderCommander
• Organizational objectives• Operator expertise• Training requirements
DM1
Mission Events
DM2 DM3 DMN…
Temporal task
assignment& task values
Rejected tasks
(a) Commander architecture (b) Operator model
Workloadcontroller
Task queue
Task selection
Task execution
Acceptedtasks
CommanderCommander
Temporal task assignment &
task value
Rejected tasks
DM
• Expertise• Learning
Priority rule
Figure 2. TOD architecture
2.3. Individual task processing The Team Optimal Design (TOD) represents task performance in terms of task accuracy and task duration. These measurements provide the basis for computing an overall performance measure for a mission as the total value derived from tasks completed in time available.
TOD models the dependence of task processing accuracy on various parameters, including task resource requirements, operator expertise, operator learning, operator workload, etc. Human operators execute multiple similar tasks during a mission. Training on tasks that are embedded in the mission complements the training received before mission execution (“pre-experiment training”). Thus, each execution of a task influences the accuracy of consequent executions of tasks of the same type. This influence is modeled by specifying the learning curve (fading average of learned actions) with parameters which can be elicited from experts or learned from human-in-the-loop experiments. In our current research, we utilize neural networks to predict human operator accuracy and workload, as well as the effects of action execution on operator and organizational goals.
A. Task Load and Workload The task load (denoted w(Ti) or simply wi) represents the amount of workload imposed on an agent by performing task Ti. The task load is determined by the task class; thus one of the input parameters to TOD is the set of task load values {wh = w(Ch)}, from which it follows that wi = w(C(Ti)).
The workload (Wk[n]) of agent Ak at time tn is composed of two components: the active workload incurred from the tasks the agent is executing at time tn, and the residual workload representing effects such as stress and fatigue resulting from effort expended on prior tasks. The load fade rate qk represents the rate at which agent Ak is able to recover from these residual effects. Thus the formula for computing the total workload of agent Ak at time tn is given by:

6
∑∑=
−=N
jk
jk
Tkik jnWqnxnW
i0, ][)(][][ ,
where N is a cutoff parameter on the length of time for which residual workload effects continue to linger.
B. Skill, Experience, and Incompetence In the TOD model, the effects of an agent’s skill and experience on task performance is represented by the concept of incompetence. The effect of incompetence is to detract from optimal performance of a task; thus higher skill and more experience lead to lower incompetence. Moreover, an agent’s incompetence at a task is dynamic and continually updated throughout the simulation. Thus the incompetence level of agent kA according to the task iT at time tn is represented by: ]1,0[][, ∈nkiα , where an incompetence level of αi,k[n] = 1 indicates that the agent has no skill or prior experience at the task, and an incompetence level of αi,k[n] = 0 indicates that the agent has fully mastered the task and can achieve optimal performance.
An initial value for the incompetence level is provided as input to TOD. This value is chosen to reflect the amount of inherent skill, training, and prior experience the agent has in the task. The incompetence level is then updated throughout the mission based on the amount of experience the agent gains at the task during the mission and the agent’s general cognitive ability to absorb and retain learning from that experience.
The formula for computing incompetence is implemented as a sigmoid function:
][
0,
, ,12
][ nyki
ki kiken ⋅⋅+= ηβ
αα ,
where:
• 0,kiα is the initial incompetence level of agent Ak at task Ti. This is determined by the task
class to which Ti belongs, i.e., khki ,0, αα = , where Ch = C(Ti).
• kβ is the experience utilization parameter of agent Ak, i.e., the rate at which the agent learns from repeated executions of a task;
• kη is the memory rate of agent Ak, i.e., the rate at which the agent is able to retain this experiential learning over time; and
• ][, ny ki is the on-line training experience of agent Ak in task Ti at time tn, reflecting the combined effects of task execution with absorption and retention. This quantity is computed by the following formula:
∑=
− −=M
jki
jki jnxny
1,
1, ][][ η ,
where M is a cutoff parameter for the length of time over which the experience continues to accrue.

7
Figure 3 depicts an example of an agent’s incompetence level at a particular task as a function of time. As an agent repeatedly executes a task, the incompetence level drops; while if the agent stops executing a task, the incompetence level subsequently rises due to the effect of forgetting. It reaches a minimum when the agent continuously executes tasks of the same corresponding task class.
0,kiα
)(, tkiα
time
inco
mpe
tenc
e le
vel
0 Figure 3. Agent incompetence level in a task over time
Figure 4 illustrates how the incompetence level is affected by the increase in the memory rate (in the experience usage/retention), and by the rate with which the agent learns from experience. The larger the learning rate and the memory rate, the smaller the incompetence level, hence the better the performance.
0,kiα
minα′
Memory Rate
inco
mpe
tenc
e le
vel
0minα ′′
1
kβ ′
kβ ′′
kk ββ ′′<′
skills (experience)
increase
Faster learning
Figure 4. Effect of agent learning and memory rates on incompetence level
C. Task Accuracy The effects of workload, skill and experience on task acscuracy are modeled as reductions from the optimal performance of 100% accuracy. These reductions are implemented according to the following principles:
• Agent workload degrades the overall performance of the agent, effecting all tasks currently in execution by the agent;
• Agent incompetence at a particular task further degrades the performance of the agent at that specific task.
Furthermore, accuracy is dynamically updated throughout the mission. Thus the accuracy with which agent Ak is executing task Ti at time tn is represented by:

8
[ ] )(,
,])[()(~ nkkki
kinWana α= ,
where:
• ])[( nWkkα is a function that computes the overall accuracy of the agent based on its workload (see below);
• )(, nkiα is the level of incompetence of the agent kA according to the task iT at time tn, as described above.
Note that the above formula calculates the instantaneous accuracy of agent Ak at task Ti at a specific time tn. To calculate a measure of the task accuracy over its entire duration, we compute the average of the instantaneous accuracy values. Thus the accuracy with which agent Ak performs task Ti is represented as:
starti
stopi
t
tnki
ki tt
nstop
ki
startki
−=∑=
,
,
][~~
,
,
αα ,
where startit and stop
it represent the times at which task Ti is initiated and completed, respectively.
Currently, the user can choose to represent the workload effect function as either a Gaussian or an inverted quadratic curve, as shown in Figure 5.
Inverted QuadraticGaussian
Figure 5. Alternate forms for the effect of workload on operator accuracy
D. Task prioritization The TOD algorithms utilize the Subjective Expected Value (SEV; see Figure 6) criterion to model optimal task selection under cognitive constraints (Pattipati et al., 1980) when presented with task values (according to joint organizational objectives) by the commander, and must decide how to sequence the task execution to obtain the highest gain. The parameters that affect the sequencing are: task value, deadline, load, resource requirements, operators’ current and predicted workload, accuracy versus workload function, available resources.
The operator finds the expected reward (equal to expected gain less the expected loss), also termed attractiveness of a task, from executing each task at a current time. When the rewards are calculated, the task is selected for execution using stochastic choice, which uses Luce’s

9
SEVCriterion
SEVCriterion
StochasticChoice
StochasticChoice
AccuracyCalculatorAccuracyCalculator
Task Selection
Task Selection
Assigned Task set(with values)
• • •
•Accuracy model•Agent expertise
•Uncertainty model
Mimic human decision-making
taskattractiveness
taskaccuracy
selectionprobabilities
selectedtask
Dynamic WorkloadDynamic Workload
Learning Effect
Learning Effect
Task Processing
Task Processing
Figure 6. Task selection model in TOD
axiom (Luce, 1977) to model the selection process. The commander can be used as a tutor to adjust task values and explore their influence on operator task selection and accrued task gain.
Let us define )(Wak an accuracy of executing tasks by agent kA when its workload is equal W units (without loss of generality, we assume that the accuracy function is the same for all tasks). Then, the average accuracy of task iT is
∫+ ii
i
ds
skk
idWa
dττ ))((1 , where is is the start time
and id is the duration of task iT . The profit of executing task iT at time t is defined as the value of the task multiplied by the average accuracy:
∫+
+=idt
tikk
i
ii
profit dwWadrtr ττ ))(()(~ , where
)(tWW kk = is a dynamic workload of the agent kA , ir is the value and iw is a workload of task iT . The cost )(~cos tr i
t of executing the task iT is defined as the value of tasks currently executed by the agent lost due to assigning task iT . The cost is positive when the accuracy of the task execution is inversely proportional to the workload of the agent. In this case, since the assignment of task iT incurs additional workload of iw units onto the agent during
id time units, the total profit achieved by the agent from executing already assigned tasks during
that period is decreased. Hence, we get: [ ]∫+
−+=idt
tkkkikki
t dVWawWatr ττττ )())(())(()(~cos , where
( )∑≠
−−−−=
kjij
jjjj
jk dstustu
dr
tV
toassigned :
)()()( , and ≥= otherwise
xxu ,00,1)( .
Therefore, reward of acting on task iT is defined as: )(~)(~)(~ cos trtrtr it
iprofit
i −= .
To determine what tasks to select for execution, we define the task attractiveness measure following Subjective Expected Value (SEV) modeling (Pattipati et al., 1980). For details on how to derive this measure, wee Appendix 1. Hence, the team’s task selection process consists of the following steps:

10
E. Responsibility assignment The process described above assumes the policy to allocate tasks from the commander to the subordinate as given. This policy can be defined by specifying the areas of responsibility and supplying this information to the operators (decision-makers). Then, operators will know their task and command responsibilities in the mission, can plan accordingly, have limited conflict with other operators as to command responsibilities, and have higher situational awareness. The actual task allocation, which corresponds to operator roles in the mission, can then be performed by the commander that knows operators’ task responsibilities. The examples of responsibilities include the assignment of tasks to operators according to tasks’ geographic/topologic constraints as in divisional organizations, and the assignment of tasks according to their resource requirements as in functional organizations. The TOD methodology utilizes the decision trees approach (Figure 7) to find the clustering of tasks according to various tasks parameters, and further assignment of these clusters to decision-makers by commanders.
geographyresources
1
2
1
DM
DM
DM
34301204143342
7
6
5
4
3
2
1
21
TTTTTTT
RRRegion A Region B
Hybrid clustering
∈Ayes no
DM1 DM2
yes no
DM2 DM1
yes no
T1
T2T3
T4
T6
T7
T5
21,TT
21,TT ∅ 543 ,, TTT 76 ,TT
R1>1 R2<2
76543 ,,,, TTTTT
Tasks withhigher R1
Tasks withhigher R2
Tasks withhigher R1
Tasks withhigher R2
task
s
Figure 7. Example of hybrid clustering using decision-tree
2.4. Utilization of TOD in model-based training and assessment TOD model can be used to experiment with different task priorities and show the effects of various operator parameters & constraints (e.g., expertise, workload threshold, accuracy, learning
Step 1. The commander agent selects the subordinate to allocate the task based on information about dynamic workload, task workload and duration per each agent.
Step 2. The local controller at agent node recalculates the reward from task execution. Find: )(~ tri .
Step 3. The local controller at agent node explores the tasks that can be executed at the current time, and identifies the task attractiveness using “SEV Criterion” for those tasks (using task’s reward values and agent’s task duration, workload, accuracy, etc.). Find:
)(tMi .
Step 4. The local controller at agent node calculates the “allocation probability”, using “stochastic choice” model. Find: )(tPi .
Step 5. The agent selects a task to execute according to this probability (randomly). The dynamic workload function is updated.
11
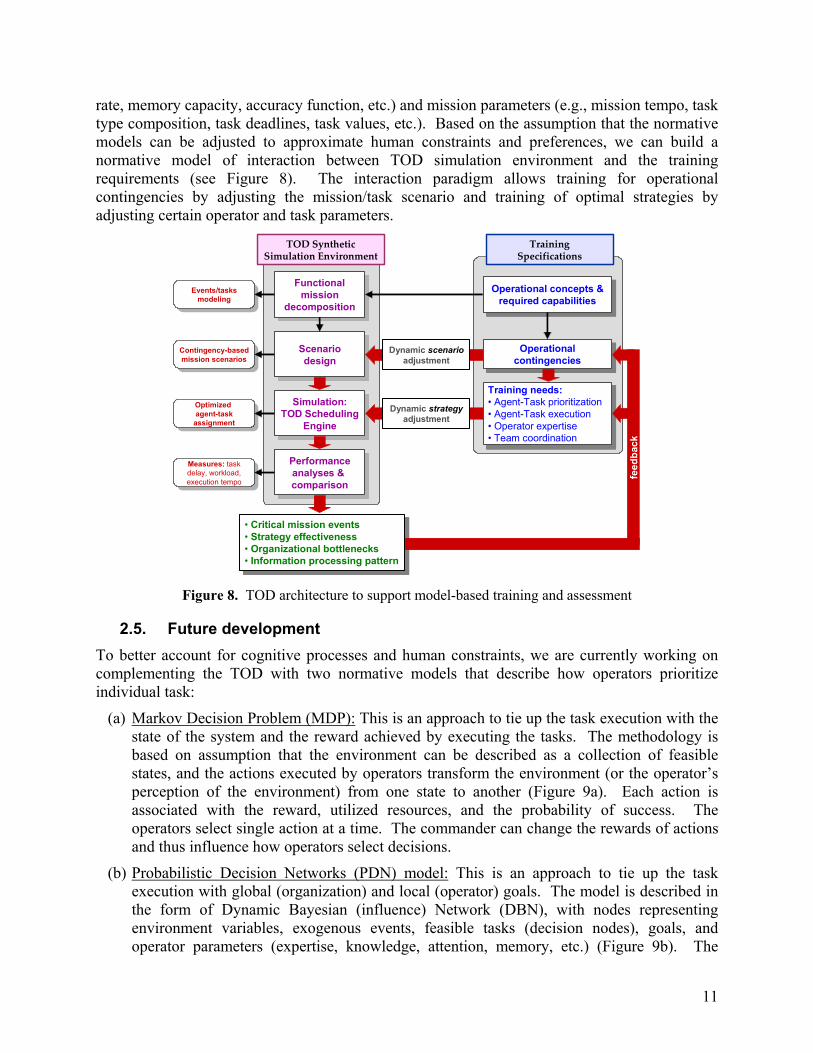
rate, memory capacity, accuracy function, etc.) and mission parameters (e.g., mission tempo, task type composition, task deadlines, task values, etc.). Based on the assumption that the normative models can be adjusted to approximate human constraints and preferences, we can build a normative model of interaction between TOD simulation environment and the training requirements (see Figure 8). The interaction paradigm allows training for operational contingencies by adjusting the mission/task scenario and training of optimal strategies by adjusting certain operator and task parameters.
Functionalmission
decomposition
Functionalmission
decompositionOperational concepts &
required capabilitiesOperational concepts &
required capabilitiesEvents/tasks
modelingEvents/tasks
modeling
Scenariodesign
Scenariodesign
Simulation:TOD Scheduling
Engine
Simulation:TOD Scheduling
Engine
Contingency-basedmission scenarios
Contingency-basedmission scenarios
Optimized agent-task
assignment
Optimized agent-task
assignment
Performanceanalyses & comparison
Performanceanalyses & comparison
Measures: taskdelay, workload,execution tempo
Measures: taskdelay, workload,execution tempo
TOD Synthetic Simulation Environment
TrainingSpecifications
• Critical mission events• Strategy effectiveness• Organizational bottlenecks• Information processing pattern
• Critical mission events• Strategy effectiveness• Organizational bottlenecks• Information processing pattern
OperationalcontingenciesOperational
contingenciesDynamic scenario
adjustment
Training needs:• Agent-Task prioritization• Agent-Task execution• Operator expertise• Team coordination
Training needs:• Agent-Task prioritization• Agent-Task execution• Operator expertise• Team coordination
Dynamic strategyadjustment
feed
back
Figure 8. TOD architecture to support model-based training and assessment
2.5. Future development To better account for cognitive processes and human constraints, we are currently working on complementing the TOD with two normative models that describe how operators prioritize individual task:
(a) Markov Decision Problem (MDP): This is an approach to tie up the task execution with the state of the system and the reward achieved by executing the tasks. The methodology is based on assumption that the environment can be described as a collection of feasible states, and the actions executed by operators transform the environment (or the operator’s perception of the environment) from one state to another (Figure 9a). Each action is associated with the reward, utilized resources, and the probability of success. The operators select single action at a time. The commander can change the rewards of actions and thus influence how operators select decisions.
(b) Probabilistic Decision Networks (PDN) model: This is an approach to tie up the task execution with global (organization) and local (operator) goals. The model is described in the form of Dynamic Bayesian (influence) Network (DBN), with nodes representing environment variables, exogenous events, feasible tasks (decision nodes), goals, and operator parameters (expertise, knowledge, attention, memory, etc.) (Figure 9b). The

12
utility structure identifies the preferences given to the corresponding goals, and the conditional probability structure quantifies the influence among the BN nodes. The dynamic BN modeling is needed to infer how the current actions of the operators influence the actions of the tutoring system. Each operator carries its own PDN, and the interaction with a tutor consists of directly influencing the operators’ parameters (such as knowledge, expertise, etc.), adjusting the influences among nodes and the conditional probabilities, changing the goal nodes, and correcting the utility function. The operators can select multiple actions at the same time. The PDN is a natural model to learn the human behavior and dynamically adapt the tutoring to affect operator’s decisions, as well as conduct diagnosis, prediction, and sensitivity analysis.
(a) MDP model
- environment state
- current state
- tasks - tasks feasible at current time
(b) PDN model
Multi-step Prediction
Multi-step Prediction
Learn States & Action
Influences
Learn States & Action
Influences
Select Action
Select Action
Execute Action
Execute Action
Tutor:Task
Reward
Tutor:Task
Reward
Transition in State Space
Transition in State Space
Tutor:Influence
Knowledge
Tutor:Influence
Knowledge
Single Time-Slice
Knowledge & Expertise
Knowledge & Expertise
AttentionAttention
EnvironmentEnvironment
TasksTasks GoalsGoalsTutor actionsTutor
actions
Multiple Time-Slices
UtilityUtility
KEKE
AA
EE
TT GG
UU
TT
KEKE
AA
EE
TT GG
UU
Current time Next time
Figure 9. Two alternative task selection components for TOD model
Task execution
Observation:mission events
DM
• Expertise• Learning
Info processing
Observation
Commandprocessing
other DMs
other DMs
other DMs
other DMs
Task selection
Task assignment
CommandStrategy
Priority rule
(a) Distributed commander architecture (b) Agent model in distributed architecture Figure 10. Distributed command architecture
To improve our team modeling, we are planning to modify the scheduling architecture and utilize the distributed command concept. Instead of utilizing a global commander, this architecture is based on decomposition of the mission execution problem into subproblems that can be handled by individual decision-makers, and is used to model the operators’ interactions. In this architecture, the operators are given responsibility to distribute tasks among their

13
subordinates, thus acting as local scheduling controllers and communicating to accomplish this task through constrained information and command structures (Figure 10a). The task information enters the organization in the form of observations conducted by the local operators, and is converted into command at the appropriate operator nodes (Figure 10b). The architecture allows investigating different local command and task allocation behaviors, the effects of command & communication structures on team performance, and the effects of limited knowledge on task allocation and execution effectiveness.
3. TOD Application to E-10 Design
3.1. Generic architecture In E-10 experimentation, we utilized TOD methodology to create the optimized team configuration for specified scenarios. The configuration consists of human operators and the specification of their roles. The TOD methodology addresses the problem of finding the optimal allocation (scheduling) or mapping of tasks with precedence constraints and information flow requirements to organizational members while satisfying various constraints. The objective function is to maximize the speed of mission execution. The output of the TOD model is a tentative assignment of tasks to team members that allows predicting the workload levels and dynamic operational characteristics of simulated team. Consequently, the sensitivity analysis can be conducted to vary the number and type of operational roles for the configuration to obtain the team with optimized performance given constraints on resources and cost of organization. In TOD, the sensitivity analysis is conducted based on optimization of estimated “marginal” workload. The flow chart of our modeling methodology is outlined in Figure 11.
Functional missiondecomposition
Functional missiondecomposition
operationalconcepts &
requiredcapabilities
Events/tasks modelingEvents/tasks modeling
Scenariodesign
Scenariodesign
Operationalcontingencies
Simulation:TOD Scheduling
Engine
Simulation:TOD Scheduling
Engine
MTW, SSC, AEFscenarios
MTW, SSC, AEFscenarios Agent-task
assignmentAgent-taskassignment
Performanceanalysis
Performanceanalysis
Measures: taskdelay, workload,execution tempo
Measures: taskdelay, workload,execution tempo
Team size andagent roles
Training/humanops constraints
Estimatedworkload
optimization
Estimatedworkload
optimization
OPTIMALCONFIGURATION
SELECTION
OPTIMALCONFIGURATION
SELECTION
Figure 11. Flow chart of TOD modeling and simulation
TOD software implements new algorithms for optimizing teams to execute missions. Specifically, TOD helps the designer to define the constraints on team structure and to generate teams that satisfy requirements for rapid mission execution, balanced workload, and minimal size. TOD enables system designers to answer several difficult questions that are key to organizational design:
• What is the potential of existing teams to accomplish a mission? • How much does optimized task assignment (alone) improve performance? • How much does optimized task assignment and optimal team size improve performance?

14
• How much does improved backup potential improve performance? • How much does breadth of skill improve performance? • How much does depth of skill improve performance? • How intense a scenario can the team execute?
TOD takes data representing a mission, tasks, and operators, and applies algorithms that optimally assign tasks to a new team, schedule its tasks, and measure its performance. A simple set of parameters enables the user to perform analyses of workload, coordination, and mission execution tempo in support of trade analyses.
3.2. Scenario development and model components Model development is rarely a linear process and development of the E-10 mission model was no exception. The current model evolved over time, starting with a process model describing a Find, Fix, Track, Target, Engage & Assess (F2T2EA) process, followed by an activities model that focused on E-10 Spiral 2 end state (i.e., full integration of organic ground and air moving track indicator sensors), which was ultimately scaled back to address Spiral 1 capabilities only. Independent of the model’s focus, development centered on defining a set of operational tasks and linking these tasks to specific mission scenario events. Relying on subject matter experts from the operational community to describe the domain, we first identified a set of functions or high level capabilities that are decomposed into tasks. These tasks are described as a flow diagram within each function. Functions are mapped to mission events, providing the means to describe task flows (i.e., operational requirements) within events. This is the specification of what tasks must be completed given a specific environmental effect. Examples of these stages are presented below.
A. Functions and tasks As mentioned, the model was initially created using a list of functions. Each function represented activities that could be described as a set of inter-related tasks. The functions included in the final model were as follows:
1. Basic surveillance routine 2. Coverage assessment 3. Modify sensor tasking 4. Dynamic sensor management 5. Target development 6. Radar service request 7. Process indications and warning 8. Assess military developments 9. Perform Cross-Cueing 10. Jamming/Electronic Support 11. Nominate emerging target list 12. Nominate dynamic target list 13. Air tasking order changes 14. ATO anomaly 15. Execute close air support 16. Execute combat search and rescue 17. Coordinate airspace control
18. Provide threat update 19. Direct retrogrades 20. Assess battlespace for time sensitive targets 21. Weapons target pairing 22. Conduct Focused AMTI 23. PBA 24. Approve ID 25. Override ID 26. Assess active threats 27. Target management 28. ATO execution 29. Define CAS needs 30. BDA 31. Wounded A/C assessment 32. Focused surveillance support 33. Clear airspace

15
Monitor current battle picture
Assess changes in EBO
Review geolocationof targets/threats
Risk assessment for friendly assets
Determine tactical significance
Determine impact on planned operations
Pass threat information
(a) Task Flow within the Function “Assess Active Threats”
(b) Functional Flow within the Event “Task XCAS to CAS”
ATO Execution
Focused Surveillance
Support
Execute Close Air Support
Figure 12. Examples of task flow and functional flow design
For each function a task flow diagram was created. These flow diagrams were crucial in helping illustrate the modeling effort to the SMEs and supported the interview process that garnered the feedback to revise and improve the model. Figure 12(a) illustrates an example of a task flow diagram within the function “Assess Active Threats”. Attributes were assigned to each task to help further define the model, such as information requirements, workloads and durations. For example, the task “Review object Data” was assigned a workload of 4 (out of a scale of 1 – 10), a duration of 90 seconds, four different information inputs (Current situation, possible track, SAR imagery, and ISR inputs), and one information output (Pending Track). The next step was to create suitable events for possible scenarios and assign functions to these events. Graphical representations of functional flows within events were created and then the functions were decomposed into the tasks within the event. This step was necessary to help realize any duplicate tasking and to connect the tasks between functions. The duplicate tasks were removed with the assumption that once a task has been completed, it was not required to be repeated. An example of a functional flow within an event can be seen in Figure 12(b).
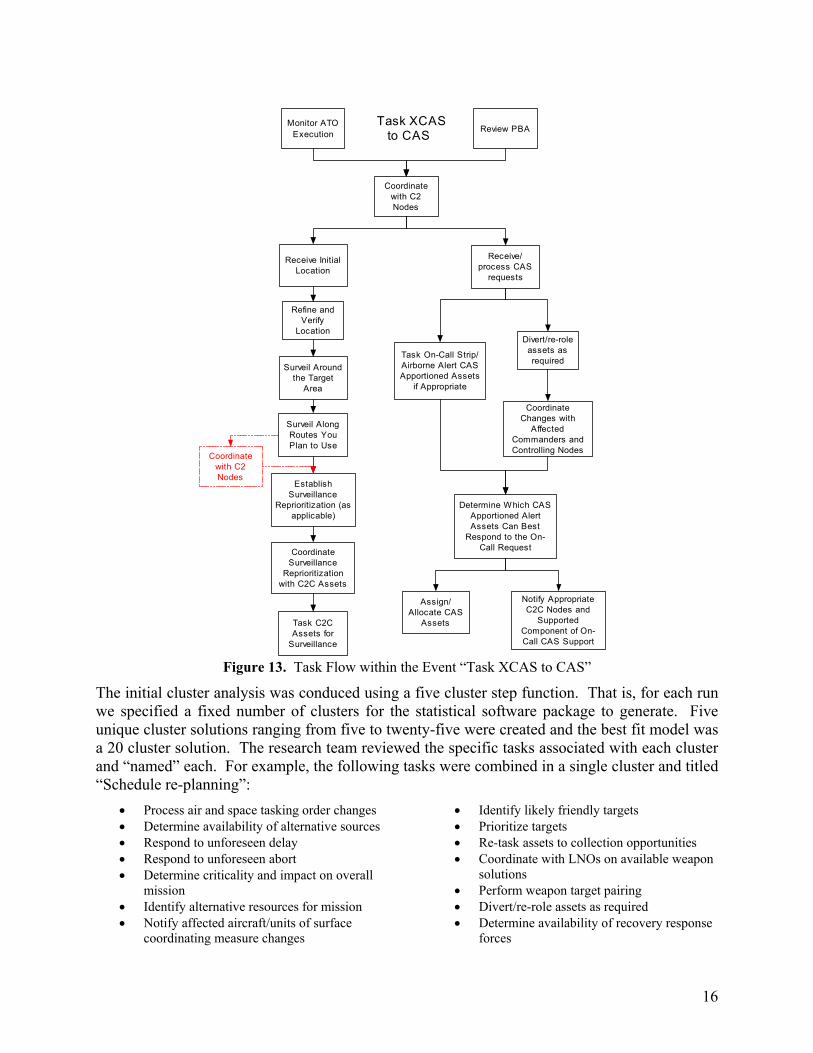
Figure 13, below, illustrates the event “Task XCAS to CAS” as seen above, but this time the functions are further decomposed into tasks. The dashed line represents the connection between the tasks of the different functions. This event also includes a duplicate task which was removed (denoted in red), “Coordinate with C2 Nodes.” This task was originally within the function “Focused Surveillance Support”, but within the event “Task XCAS to CAS” it had already been completed within the function “ATO Execution”.
B. Organizational roles As part of the model development effort we conducted a set of preliminary analyses to define a set of organizational roles tailored to meet the requirements imposed by the tasks described above. We specified task clusters based on information requirements and flows within the E-10 mission model. The objective was to define basic roles and responsibilities for team positions that were not constrained by current Air Force Specialty Codes (AFSC) or “traditional” task allocations. To define these roles, we conducted a cluster analysis, a statistical method of identifying relationships among tasks, and generated a set of information-centric organizational roles. These roles represent initial operator positions and provided a baseline allocation of tasks to operators. We viewed this method as a basis for revolutionary design and one that limited bias associated with legacy positions and AFSC.
16
Task XCAS to CAS
Coordinatewith C2Nodes
Monitor ATOExecution Review PBA
Receive InitialLocation
Refine andVerify
Location
Surveil Aroundthe Target
Area
Surveil AlongRoutes YouPlan to Use
EstablishSurveillance
Reprioritization (asapplicable)
CoordinateSurveillance
Reprioritizationwith C2C Assets
Task C2CAssets for
Surveillance
Task On-Call Strip/Airborne Alert CASApportioned Assets
if Appropriate
CoordinateChanges with
AffectedCommanders andControlling Nodes
Determine Which CASApportioned AlertAssets Can Best
Respond to the On-Call Request
Assign/Allocate CAS
Assets
Notify AppropriateC2C Nodes and
SupportedComponent of On-Call CAS Support
Divert/re-roleassets asrequired
Receive/process CAS
requests
Coordinatewith C2Nodes
Figure 13. Task Flow within the Event “Task XCAS to CAS”
The initial cluster analysis was conduced using a five cluster step function. That is, for each run we specified a fixed number of clusters for the statistical software package to generate. Five unique cluster solutions ranging from five to twenty-five were created and the best fit model was a 20 cluster solution. The research team reviewed the specific tasks associated with each cluster and “named” each. For example, the following tasks were combined in a single cluster and titled “Schedule re-planning”:
• Process air and space tasking order changes • Determine availability of alternative sources • Respond to unforeseen delay • Respond to unforeseen abort • Determine criticality and impact on overall
mission • Identify alternative resources for mission • Notify affected aircraft/units of surface
coordinating measure changes
• Identify likely friendly targets • Prioritize targets • Re-task assets to collection opportunities • Coordinate with LNOs on available weapon
solutions • Perform weapon target pairing • Divert/re-role assets as required • Determine availability of recovery response
forces

17
The complete list of clusters is as follows: • External coordination • Schedule re-planning • Schedule timeline • Link management • Identification • Sensor control • Threat management • Asset coordination • Data management • Track coordination
• Target coordination • Situation assessment • Collection management • Target development • Surveillance • ISR technician • Mission prioritization • IO • Information management • Link and asset coordination
These clusters served as the baseline organizational structure for the TOD modeling. That is, the clusters were used to define who could do what tasks. Following an iterative method of consolidation based on task delay and workload, the twenty roles were collapsed to form five core operational roles. Of note, these five roles are not the same as the five cluster solution mentioned above and are not directly equivalent to current roles. Each is presented below with a brief description:
• Command – mission command and leadership
• Assessment – interpretation of operational picture
• Battle Management – command and control of operations
• Surveillance – generation of operational picture
• ISR Allocation – control of ISR assets (constellation)
C. Mission Scenarios The TOD methodology is goal or mission-driven. That is, the model uses a detailed scenario that specifies the tasks required to accomplish a goal and the resources available to accomplish those tasks, and uses algorithms to optimally allocate these tasks and resources to team members to create an organizational structure for best accomplishing the mission. In practice this requires that the functions and tasks described above are linked to specific mission events. This provides the basic simulation capability in that a scenario composed of a set of events is defined and serves as the trigger of what tasks must be completed by the organization.
In initial modeling activities, a generic set of events was used to structure model development. We then refined the model with a validated mission scenario provided by the TACCSF also known as the DMOC. The scenario was based on their Desert Pivot/Virtual Flag training exercises and specified a set of mission events and frequency of occurrence. The list of mission events, divided into friendly and enemy activities, was developed; it provided a mechanism to construct three mission scenarios from a single data set: (1) Major Theater Warfare; (2) Contingency Operations; and (3) Air Expeditionary Force. The differentiation between the three was a variation in both type and frequency of events.
Once the event list was obtained from DMOC, a two-day working meeting was conducted at Hurlbert AFB. During this effort, subject matter experts from the various organizations defined specific functions that are associated with each scenario event. Figures 9 and 10 presented above are specific examples of the output of this meeting. The final E-10 model included 147 tasks, 33 functions, and 36 events. The model was primarily based upon the E-10 activities list and refined
18
Mission Crew Commander
Director of Operations
Surveillance Officer
Surveillance Team (5 Ops)
Assessment Officer
Assessment Team (5 Ops)
Senior Director
Battle Management
Team (10 Ops)Surveillance
Team (5 Ops)Surveillance
Team (5 Ops)Assessment
Team (5 Ops)Assessment
Team (5 Ops)
Battle Management
Team (10 Ops)
Battle Management
Team (10 Ops) Figure 15. Mission Crew Composition (25 Operators)
for Contingency Mission Scenario
with the aid of SME input. The final model was primarily execution-based, focusing on a Ground Moving Target Indicator (GMTI) time critical targeting mission with some Airborne Moving Target Indicator (AMTI) requirements associated with cruise missile defense, and assumed capabilities associated with E-10 Spiral 1 end state. Of those assumptions, none was more critical than the existence of highly automated systems. Technology assumptions served as a primary driver for workload estimates and determination of crew size. Deviation from these assumptions could have substantial impact on crew configuration. These assumptions involve significant improvements in automation not currently possible through technology - automation of functions now rigorously performed with humans.
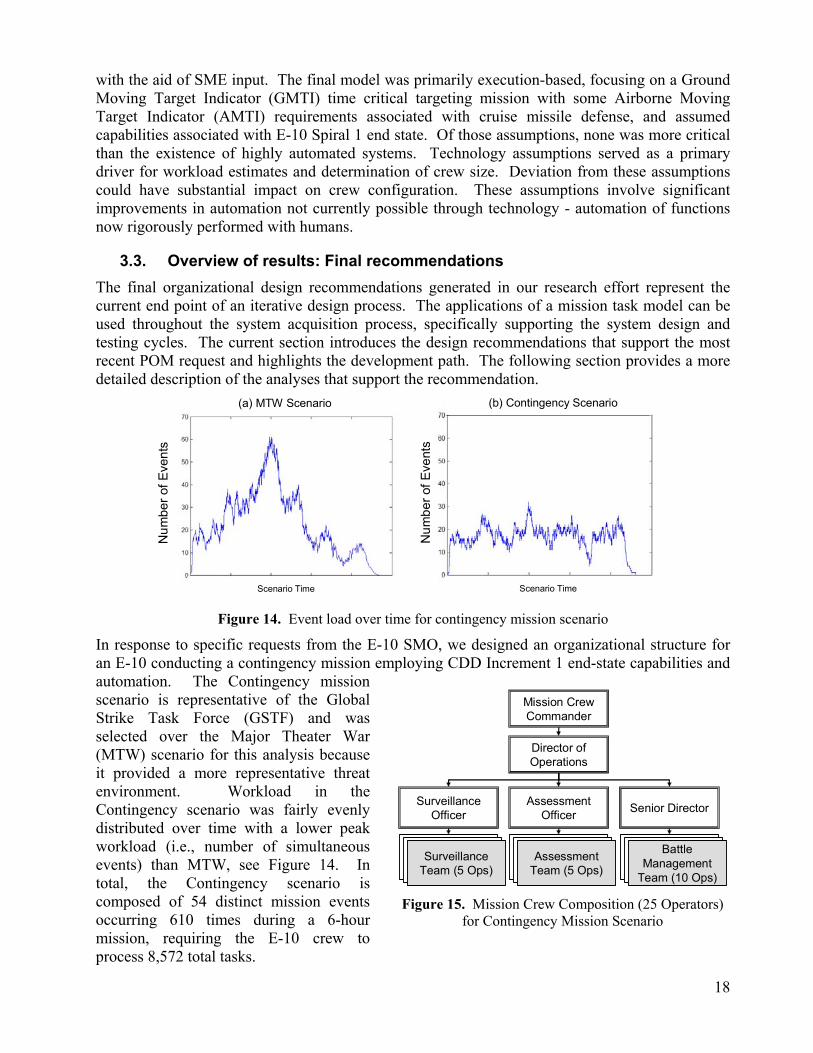
3.3. Overview of results: Final recommendations The final organizational design recommendations generated in our research effort represent the current end point of an iterative design process. The applications of a mission task model can be used throughout the system acquisition process, specifically supporting the system design and testing cycles. The current section introduces the design recommendations that support the most recent POM request and highlights the development path. The following section provides a more detailed description of the analyses that support the recommendation.
Scenario TimeScenario Time
Num
ber o
f Eve
nts
(a) MTW Scenario
Num
ber o
f Eve
nts
(b) Contingency Scenario
Figure 14. Event load over time for contingency mission scenario
In response to specific requests from the E-10 SMO, we designed an organizational structure for an E-10 conducting a contingency mission employing CDD Increment 1 end-state capabilities and automation. The Contingency mission scenario is representative of the Global Strike Task Force (GSTF) and was selected over the Major Theater War (MTW) scenario for this analysis because it provided a more representative threat environment. Workload in the Contingency scenario was fairly evenly distributed over time with a lower peak workload (i.e., number of simultaneous events) than MTW, see Figure 14. In total, the Contingency scenario is composed of 54 distinct mission events occurring 610 times during a 6-hour mission, requiring the E-10 crew to process 8,572 total tasks.

19
To complete this mission, we proposed a 25 person crew as depicted in Figure 15. The selection of number and type of operators was based on sensitivity analyses (see Appendix 2 for more details) focused on workload (both average levels within individuals and distribution across individuals, see Figure 16), internal coordination, and task delay. Design iteration to arrive at this solution was influenced significantly by feedback from subject matter experts and should be viewed as a traceable, quantitative assessment of mission needs to support programmatic and testing concerns.
In addition to providing workload and operational performance estimates, the TOD process specifies the roles and responsibilities for the proposed operational positions. As such, we defined crew position job descriptions as a means to describe mission activities on the aircraft. For each position, we specified a set of core roles and provided representative tasks within each.
0102030405060708090
100
MCC DO
Asses
smen
t Offic
er
Asses
smen
t
Asses
smen
t
Asses
smen
t
Asses
smen
t
Asses
smen
t
Senior
Dire
ctor
Battle
manag
er
Battle
manag
er
Battle
manag
er
Battle
manag
er
Battle
manag
er
Battle
manag
er
Battle
manag
er
Battle
manag
er
Battle
manag
er
Battle
manag
er
Surveil
lance
Offic
er
Surveil
lance
Surveil
lance
Surveil
lance
Surveil
lance
Surveil
lance
Crew Position
Ave
rage
Wor
kloa
d
Figure 16. Workload Distribution for Contingency Mission Scenario
For example, the following list identifies the responsibility of “assessment team members”: • Risk assessment
Assess changes in EOB Review geolocation of targets/threats Risk assessment for friendly assets Pass threat information Associate threats with objects Receive I&W from RJ and other sources Analyze I&W Correlate tracks to I & W
• Target development
Develop targetable coordinates Nominate target to ETL Determine which targets need additional
coverage Specify possible target locations
• Implement coverage needs Define collection priorities Generate coverage change orders Determine if any additional ISR
data/coverage is needed
4. Summary and Conclusions
Process: While the core of the TOD modeling approach is a set of optimization algorithms, a detailed representation of the operational environment is imperative. To develop the E-10 mission model, the project team relied on a collaborative effort between modelers, the operational community, and the acquisition community. In addition to collaborative, the process is iterative. We described the various permutations of the model and point to this as a critical and necessary aspect of the design process. Successive iterations provide opportunities for new insights that drive future development. As a result, we developed a model that supported the specification of an
20
organizational design, provided insight to the system requirement developers, and provides a foundation for future modeling and simulation activities.
Results This paper provides a detailed description of a proposed TOD methodology to optimize the organization for the E-10. The specification of a detailed model provides traceability of these recommendations and a high degree of transparency. The various iterations described in this document serve as a testament to the methods ability to be responsive to changing program needs.
The primary contributions of this paper are:
• Modeling of E-10 operational stages, which included function/task decomposition of component process flows;
• Design of mission scenarios for various contingencies;
• TOD methodology for the design of project-based teams;
• Analytic team build-up for sensitivity analysis using optimized estimated workload for scenarios of various contingencies; and
• Comparative analysis and evaluation of simulated teams using average task delay, workload distribution, and execution tempo measures.

21
Appendix 1: Calculation of Task Attractiveness Measure Attractiveness of executing task iT at time t is found as )()()( tlosstgaintM iii −= . Here, )(tgaini is a gain from executing task iT and is equal to the expected reward of executing this task, while
)(tlossi is equal to the expected value of rewards lost if task iT is assigned at time t . We assume that the duration )(tT P
i and time )(tT Ai available to execute task iT are assessed by human agents
with uncertainty. We model these estimates as independent Normally distributed with mean/variance respectively equal to ( )P
iP
i tT σ),( and ( )Ai
Ai tT σ),( . Hence:
( ) } completing ofy probabilitPr{ of value)( iitgaini =
{ }( ) ( )
( ) ( )
+
−+
∞=
=
+
−+=≤−=
)deadline hastask ( otherwise ,2
)(121)(~
)deadline no( )( if ),(~2
)()(1
21)(~0)()()(~
22
22
Ai
Pi
iA
ii
Aii
Ai
Pi
Pi
Ai
iA
iP
ii
dtTerftr
tTtr
tTtTerftrtTtTPtr
σσ
σσ
( ) ( )
{ } { }
( ) ( ) ( ) ( ) ( )
( ) ( )
( ) ( ) ( )∑
∑
∑∑
≠
≠
≠
≠
++
−++
∞=
+
+
−+
∞=
=
++
−+++
+
−+=
≥++≥−=
+=
ijAj
Pj
Pi
Aj
Pj
Pji
j
Ajj
Ai
Pi
Aii
i
Aii
ij Aj
Pj
Pi
Aj
Pj
Pji
jAi
Pi
Ai
Pi
i
ij
Aj
Pji
Pjj
Ai
Pii
iji
tTtTtTerftr
tTtr
tTderftr
tTtr
tTtTtTerftrtTtTerftr
tTtTtTPtrtTtTPtr
jjiitloss
)deadline hastask ( otherwise ,2
)()()(1
21)(~
)deadline no( )( if ),(~
)deadline hastask ( otherwise ,2
)(121)(~
)deadline no( )( if ),(~2
)()()(1
21)(~
2
)()(121)(~
)()()()(~0)()()(~
}future in the loosing ofy probabilitPr{ of value} loosing ofy probabilitPr{ of value)(
222
,
22
222
,
22
,
σσσ
σσ
σσσσσ
I
n the above, }ˆ)(~:0min{)(, kkPji WtWtT ≤+≥= ττ , where t is current time, and
++≤+++
=+otherwise ,)(
)( if ,)()(~jk
Pijik
k wtWtTwwtWtW
τττ
τ . This is the time “delay” that is incurred on the time the
task j can be started given that task i is to be executed at current time. Note: workload is non-increasing function after current time.
22
Attractiveness of not acting at all (acting on null task) is calculated as:
{ }( )∑∑
−
+=≤=assignednot :
20
assignednot :00
2
)(1
21)(~)()(~)(
j Ai
Ai
P
jj
PAjj
tTTerftrTtTPtrtM
σ, where PT0 is the
processing time for the null task ( )(0 tM is a loss due to disappearance of tasks).
In the above, we have: ∫ −=a
u dueaerf0
22)(π
.
Given attractiveness measures estimates 0),(ˆ ≥itM i , we can compute the probability of selecting task i using Luce’s stochastic choice axiom (Luce, 1977):
)(,...,1,0,}0)(ˆ)(ˆ{}0)(ˆ)(ˆ{1)(
1)(
0
tNitMtMPtMtMPtP
tN
ikk ki
iki =
≥−≥−
+=
−
≠=∑
In the above, )(ˆ tMi are Gaussian with mean )(tM i and variance )()( tMct iMi =σ (with c being the
coefficient of variation, usually ]4,.2[.≈c ).
Appendix 2: Examples of Sensitivity Analyses
A. Building a team for MTW scenario For E-10 simulations, we defined 147 task types, with task load (workload imposed on DM executing this task) from 10 to 90 units (task load is defined as percent of DM’s workload capacity: a decision-maker can execute tasks in parallel provided their aggregated load does not exceed DM’s workload capacity). Task duration (time required to execute a task) ranged from 30 to 420 seconds. Scenarios for E-10 consisted of events from predefined 80 types. Each event type triggered the task flow ranging from 3 to 59 tasks, and the resulting event task load was 13 to 208 units (depending on the type of event). We utilized TOD software to conduct multiple sensitivity analyses for three defined missions. In this paper, we present and example of such sensitivity for
The MTW mission scenario was designed as a high-tempo 6-hour mission. It included 709 event instances of 80 event types (between 1 and 32 instances for each type). The total number of tasks in the simulated MTW scenario was 12246. The tempo of MTW scenario is depicted in Figures 17 and 18. Figure 17 shows the instantaneous load of incoming events, and Figure 18 indicates the aggregated load of incoming events, which is equal to the sum of task loads for events that occurred up to the present time (see previous section). The curvature of the aggregated event load curve in Figure 18 determines the pace of the mission: the steeper the curve – the more load is imposed on the organization by the scenario. We can see that the pace of the mission peaks between 4.1 hour point and 1½ hour point, and abates towards the end of the scenario (this could also be easily seen from the instantaneous incoming load plot of Figure 17).

23
x 10
Time, sec
Figure 17. The instantaneous load of events
over time (in seconds) for MTW scenario
x 105
Time, sec
Figure 18. MTW scenario tempo: aggregated
event load
To identify the optimal E-10 team configuration to execute MTW scenario, we conducted a sensitivity analysis for teams of 22 to 37 crew members. The composition of the teams (number of crew members with specific roles) is indicated in Table I.
The measure of aggregated team coordination for teams simulated on MTW scenario is shown in Figure 19, and average task delay measures are shown in Figure 20. We can see that increasing the team size from 22 crew team significantly reduces the total coordination and average task delays. This is due to the fact that as the number of crew members increases, the organization can execute more tasks in parallel. Also, the mission can be distributed among team members with more independence of one on another without sacrificing the execution times, which results in decrease of requirements for team communication. Note that the “33-revised” organization provides lower team coordination and average task delay than another 33-member team. This is due to a difference in the composition of “33-revised” organization, where the addition of “Assessment” and “Battle Manager” roles instead of “ISR allocation” and “Surveillance” provides better balancing of workload among team members while creating more independent crew member assignments, and thus reduces the task delay.
TABLE I. Sensitivity analysis: team configurations for MTW scenario
Commander Assessment Battle Manager ISR allocation Surveilance22 2 4 8 2 624 2 5 9 2 627 2 5 10 3 729 2 6 11 3 731 2 7 12 3 733 2 7 12 4 8
33-revised 2 8 13 3 735 2 8 13 4 837 2 8 13 5 9
Team Configuration
Number of DMs assigned
The data on task delay and team member workload, as well as other performance measures, allowed us to select 33-member team. We exercised a trade-off between organizational resources (number of members) and performance improvement characteristics, given the fact that the addition of new crew members to 33-member team does not result in significant performance improvement. We also note that the composition of the crew and the specific roles of the team members had the most impact on the simulated performance. The addition of members with roles that created the most workload balance provided the optimal improvement in the speed of mission execution (highlighted by the average task delay measure).

24
Coordination
9000
9500
10000
10500
11000
11500
22 24 27 29 31 33 33-revised 35 37Configuration
Load
Figure 19. Sensitivity analysis: team
coordination for MTW scenario
Average Task Delay
0200400600800
10001200140016001800
22 24 27 29 31 33 33-revised 35 37Configuration
Tim
e
Figure 20. Sensitivity analysis: average task
delay for MTW scenario
B. Building a team for Contingency scenario The “Contingency” mission scenario was designed as a lower-tempo 6-hours mission. It included 600 event instances of 80 event types (between 1 and 32 instances for each type), with the total of 8498 tasks. The tempo of MTW scenario is depicted in Figures 21(a) and 21(b). Contingency scenario has 30.3 % reduction in aggregated task load and 30.6% reduction in number of tasks compared to MTW mission.
(a) The instantaneous load of events over time
x 10
(b) Aggregated event load
x 105
Figure 21. “Contingency” Scenario Tempo
Given the DM-task access matrix, the capabilities of 5 core crew member roles to execute tasks of “Contingency” scenario are depicted in Table II. The entries indicate the percentage of tasks and task load in the “Contingency” mission scenario that a DM with the corresponding role can execute. As previously mentioned, the entries indicate the percentage of tasks and task load in the mission that a DM with the corresponding role can execute.
TABLE II. The core role capabilities for “Contingency” scenario
% of tasks % of task loadCommander 54.31 54.49Assessment 60.10 59.09Battle Manager 61.33 65.89ISR allocation 27.30 21.29Surveilance 36.88 34.12
RoleContingency ScenarioCapability to process:

25
To identify the optimized E-10 team to execute “Contingency” scenario, we conducted sensitivity analysis for different teams (see Figures 22-23), reducing number of crew members from 33 to 17 DMs (starting with “33-revised” team). The composition of the teams (number of crew members with specific roles) is indicated in Table III.
TABLE III. Team configurations for “Contingency” scenario
Commander Assessment Battle Manager ISR allocation Surveilance17-atlern-2comms 2 4 7 1 317-revised 1 4 8 1 319-revised 2 4 8 2 321-revised 2 5 8 2 423-revised 2 5 10 2 425-revised 2 6 11 2 427-revised 2 6 12 2 529-revised 2 7 13 2 531-revised 2 8 13 2 633-revised 2 8 13 3 7
Team ConfigurationNumber of DMs assigned
Given the constraints on the team size and relative benefits in terms of decrease in coordination and average task delay that can be obtained by adding additional crew members (see Figures 22-23), we selected the organizational configuration termed “25 revised” for E-10 team executing “Contingency” scenario, which consisted of 2 commanders, 6 assessment, 11 battle-manager, 2 ISR allocation, and 4 surveillance roles.
Coordination
0
1000
2000
3000
4000
5000
6000
7000
8000
17-atlern-2comms
17-revised
19-revised
21-revised
23-revised
25-revised
27-revised
29-revised
31-revised
33-revised
Configuration
Load
Figure 22. Sensitivity analysis: team
coordination for “Contingency” scenario
Average Task Delay
020406080
100120140160180
17-atlern-2comms
17-revised
19-revised
21-revised
23-revised
25-revised
27-revised
29-revised
31-revised
33-revised
Configuration
Tim
e
Figure 23. Sensitivity analysis: average task
delay for “Contingency” scenario
References MacMillan, J., Paley, M.J., Levchuk, Y.N., Entin, E.E., Serfaty, D., and Freeman, J.T. (2002). “Designing the Best
Team for the Task: Optimal Organizational Structures for Military Missions”. In Mike McNeese, Ed Salas, and Mica Endsley (editors), New Trends in Cooperative Activities: System Dynamics in Complex Settings. San Diego, CA: Human Factors and Ergonomics Society Press.
Landry, R. (2002) “Networking for the E-10”, Unpublished PowerPoint presentation.
Levchuk G.M., Levchuk, Y.N., Luo Jie, Pattipati K.R., and Kleinman D.L. (2002a). "Normative design of organizations-part I: mission planning," IEEE Transactions on Systems, Man, and Cybernetics-Part A: Systems and Humans 32(3), 346-359.
Levchuk G.M., Levchuk, Y.N., Luo Jie, Pattipati K.R., and Kleinman D.L. (2002b). "Normative design of organizations - part II: organizational structure," IEEE Transactions on Systems, Man, and Cybernetics-Part A: Systems and Humans 32(3), 360-375.
Luce, R.D. (1977) “The choice axiom after twenty years”, Journal of Mathematical Psychology, 15, pp. 215-33.

26
Pattipati, K.R., D.L. Kleinman, and A.R. Ephrath, “A dynamic decision model of human task selection performance”, IEEE Transactions on Systems, Man, and Cybernetics, SMC-13, 145-66, 1983.
USAF. “Multi-Sensor Command and Control Functionality”, Initial requirements document, HQ USAF/XORI, draft, August 08, 2002.
Whitaker, R., Pfeiffer, B., Walby, E., Perryman, G. (2002). “Concept of Operations for the Multi-Sensor Command and Control Aircraft”, Aerospace C2 & ISR Center, executive summary.


![Instituto de Sistemas e Rob´otica - INESC-ID · be considered. The approach in [Levchuk et al., 2002a, Levchuk et al., 2002b] differs from the proposed approach as it seeks an optimal](https://static.fdocuments.in/doc/165x107/5e786f7ee16f91286d01e56f/instituto-de-sistemas-e-robotica-inesc-id-be-considered-the-approach-in-levchuk.jpg)