MODEL BASED CONTROL OF ABSORPTION … · diffusivity and viscosity is performed in detail; (4) ......
11
Transcript of MODEL BASED CONTROL OF ABSORPTION … · diffusivity and viscosity is performed in detail; (4) ......
MODEL BASED CONTROL OF ABSORPTION
TOWER FOR CO2 CAPTURING
Almat Bedelbayev, Timothy Greer, Bernt Lie
Department of Electrical Engineering, Information Technology, and Cybernetics
Telemark University College, Porsgrunn, Norway
[email protected] (Almat Bedelbayev), [email protected]
Abstract
In this work, CO2 capture by post-combustion using
MEA is considered. The mechanistic model for the
absorption process is elaborated and includes specie
and energy balances for the liquid and gas phases.
Model predictive control is implemented as a control
strategy for the absorption column.
Keywords: CO2 capturing, Absorption tower,
Dynamic model, Control, MPC
1 Introduction
1.1Background for work
Emission of carbon dioxide (CO2) and its possible
negative effect on the climate has gained much interest
lately (IPCC, [1]). Although carbon dioxide has the
lowest global warming potential among the
greenhouse gases, the emitted amount into the
atmosphere is large and continuously increasing. A
large amount of the emitted carbon dioxide belongs to
the energy sector (power plants etc) where the fossil
fuel and natural gas are in use [2].
The capturing of carbon dioxide (CO2) to reduce its
release into the atmosphere is thus of great interest.
Several methods exist to capture carbon dioxide, e.g.
the post-combustion, pre-combustion, and oxyfuel
methods [3].
This study includes the development of a mechanistic
model for the absorption tower of the post-combustion
process using MEA (monoethanolamine) to improve
the separation. Based on the developed model,
predictive control is used to improve the operation of
the system.
1.2Previous work
This study is an outgrowth of the work of Hansen [21]
on post-combustion. Compared to [21], the following
issues are revised: (1) Reaction kinetics between CO2
and MEA; (2) The vapor-liquid equilibrium model is
presented by the Deshmukh-Matter approach; (3)
Investigation of the physical properties such as
diffusivity and viscosity is performed in detail; (4) The
energy and component balances both for the liquid and
gas phases; (5) Model based control strategy for the
absorption tower; (6) Model analysis; (7) Model
validation against the experimental data.
Beside the base study ([21]), a literature survey is
carried out on CO2 capture by means of
alkanolamines in the post-combustion process. Vadya
et al. [4] performed a comprehensive study on the
possible reaction kinetic mechanisms in CO2-MEA
system. Kohl et al. [5] give a detailed overview of the
gas purification techniques and methods, provides a
large set of experimental data for different absorption
liquids. Edali et al. [6] studied the reaction kinetics of
mixed amine solutions for the carbon dioxide capture.
The reactions occurring during the CO2 absorption are
described, and the component balance for different
liquid species are given. Aboudheir et al. [7] also
performed an extensive study on the reaction kinetics
involving CO2 and alkanolamines. Liu et al. [8]
studied vapor-liquid equilibrium models and gave
comparative estimates of the existing VLE models
proposed by other researchers for CO2 � MEA
systems. Rochelle and Freguia [9] modeled CO2
capturing by aqueous amine solutions. The results of
model development both for the absorption and
stripping are presented. Hoff [10] studied carbon
dioxide absorption in a membrane contactor, and
developed specie balances for the CO2 absorption; the
energy balance for the absorption process was not
included, though. While many publications are written
on the reaction kinetics with regard to the CO2-MEA
system, still there is not enough information with
regard to the reaction kinetics data, and there is little
compliance among the researches about the reaction
mechanism. Different approaches are used to develop
specie and energy balances.
Little work appears to be available on the control of
absorption towers. This is partially due to the fact that
this is only a part of the complete post-combustion
set-up.
1.3 Overview
The next section gives an overview of the post-
combustion CO2 absorption process. The general flow
sheet diagram of the absorption process with
corresponding description is given, and the absorption
liquids and absorption tower are discussed.
The third section describes development of the
distributed mechanistic model for the absorption
tower.
The fourth section describes the implementation of
MPC for the absorption process control.
The final section of the paper gives a conclusion of the
performed work.
2 Process description
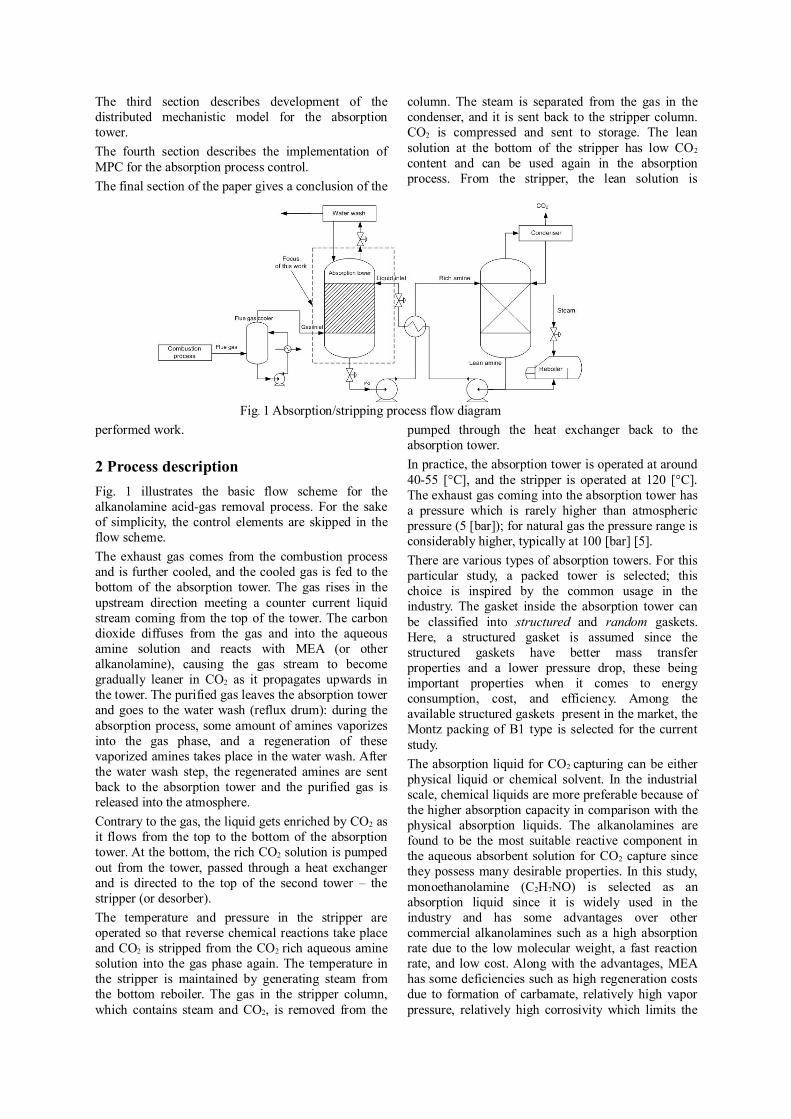
Fig. 1 illustrates the basic flow scheme for the
alkanolamine acid-gas removal process. For the sake
of simplicity, the control elements are skipped in the
flow scheme.
The exhaust gas comes from the combustion process
and is further cooled, and the cooled gas is fed to the
bottom of the absorption tower. The gas rises in the
upstream direction meeting a counter current liquid
stream coming from the top of the tower. The carbon
dioxide diffuses from the gas and into the aqueous
amine solution and reacts with MEA (or other
alkanolamine), causing the gas stream to become
gradually leaner in CO2 as it propagates upwards in
the tower. The purified gas leaves the absorption tower
and goes to the water wash (reflux drum): during the
absorption process, some amount of amines vaporizes
into the gas phase, and a regeneration of these
vaporized amines takes place in the water wash. After
the water wash step, the regenerated amines are sent
back to the absorption tower and the purified gas is
released into the atmosphere.
Contrary to the gas, the liquid gets enriched by CO2 as
it flows from the top to the bottom of the absorption
tower. At the bottom, the rich CO2 solution is pumped
out from the tower, passed through a heat exchanger
and is directed to the top of the second tower � the
stripper (or desorber).
The temperature and pressure in the stripper are
operated so that reverse chemical reactions take place
and CO2 is stripped from the CO2 rich aqueous amine
solution into the gas phase again. The temperature in
the stripper is maintained by generating steam from
the bottom reboiler. The gas in the stripper column,
which contains steam and CO2, is removed from the
column. The steam is separated from the gas in the
condenser, and it is sent back to the stripper column.
CO2 is compressed and sent to storage. The lean
solution at the bottom of the stripper has low CO2
content and can be used again in the absorption
process. From the stripper, the lean solution is
pumped through the heat exchanger back to the
absorption tower.
In practice, the absorption tower is operated at around
40-55 [°C], and the stripper is operated at 120 [°C].
The exhaust gas coming into the absorption tower has
a pressure which is rarely higher than atmospheric
pressure (5 [bar]); for natural gas the pressure range is
considerably higher, typically at 100 [bar] [5].
There are various types of absorption towers. For this
particular study, a packed tower is selected; this
choice is inspired by the common usage in the
industry. The gasket inside the absorption tower can
be classified into structured and random gaskets.
Here, a structured gasket is assumed since the
structured gaskets have better mass transfer
properties and a lower pressure drop, these being
important properties when it comes to energy
consumption, cost, and efficiency. Among the
available structured gaskets present in the market, the
Montz packing of B1 type is selected for the current
study.
The absorption liquid for CO2 capturing can be either
physical liquid or chemical solvent. In the industrial
scale, chemical liquids are more preferable because of
the higher absorption capacity in comparison with the
physical absorption liquids. The alkanolamines are
found to be the most suitable reactive component in
the aqueous absorbent solution for CO2 capture since
they possess many desirable properties. In this study,
monoethanolamine (C2H7NO) is selected as an
absorption liquid since it is widely used in the
industry and has some advantages over other
commercial alkanolamines such as a high absorption
rate due to the low molecular weight, a fast reaction
rate, and low cost. Along with the advantages, MEA
has some deficiencies such as high regeneration costs
due to formation of carbamate, relatively high vapor
pressure, relatively high corrosivity which limits the
Fig. 1 Absorption/stripping process flow diagram
concentration of MEA in aqueous solution to 20% of
weight without corrosion inhibitors and up to 30%
with them. In spite of these disadvantages, MEA is
widely used nowadays for CO2 capturing, alone or in a
mixture with other alkanolamines.
3 Modeling and simulation of the
absorption tower
3.1Distributed mechanistic model
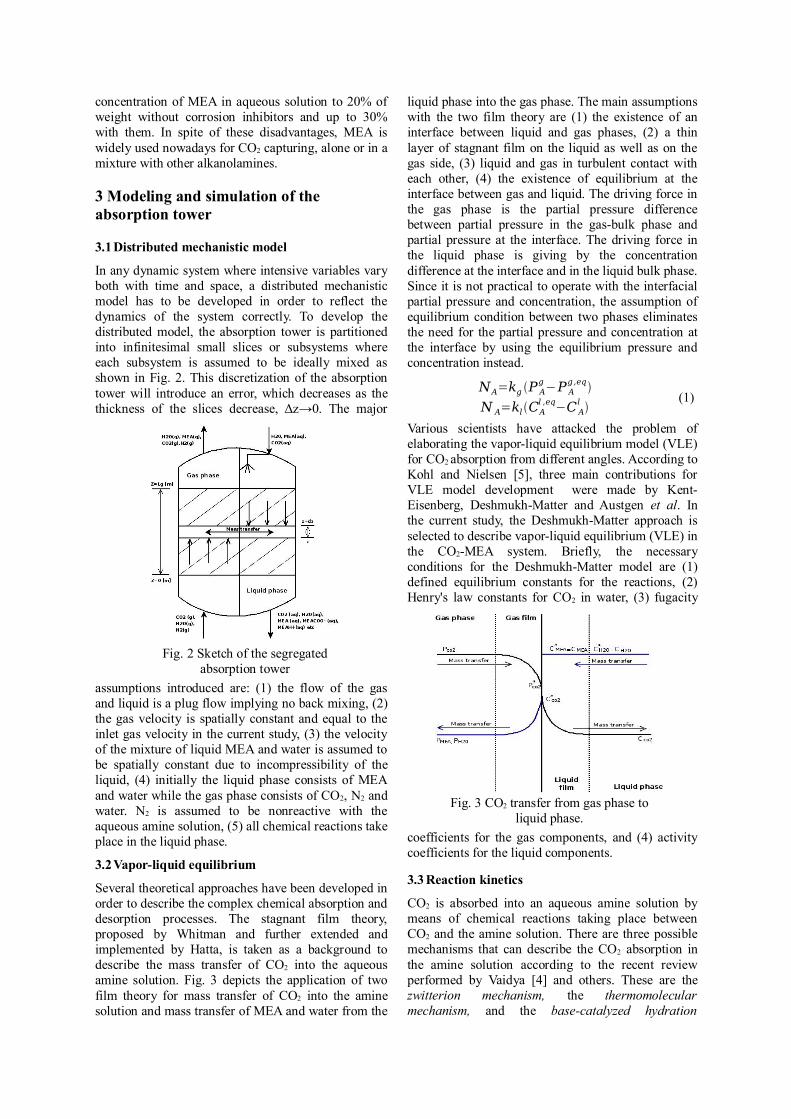
In any dynamic system where intensive variables vary
both with time and space, a distributed mechanistic
model has to be developed in order to reflect the
dynamics of the system correctly. To develop the
distributed model, the absorption tower is partitioned
into infinitesimal small slices or subsystems where
each subsystem is assumed to be ideally mixed as
shown in Fig. 2. This discretization of the absorption
tower will introduce an error, which decreases as the
thickness of the slices decrease, z� 0.� The major
assumptions introduced are: (1) the flow of the gas
and liquid is a plug flow implying no back mixing, (2)
the gas velocity is spatially constant and equal to the
inlet gas velocity in the current study, (3) the velocity
of the mixture of liquid MEA and water is assumed to
be spatially constant due to incompressibility of the
liquid, (4) initially the liquid phase consists of MEA
and water while the gas phase consists of CO2, N2 and
water. N2 is assumed to be nonreactive with the
aqueous amine solution, (5) all chemical reactions take
place in the liquid phase.
3.2Vapor-liquid equilibrium
Several theoretical approaches have been developed in
order to describe the complex chemical absorption and
desorption processes. The stagnant film theory,
proposed by Whitman and further extended and
implemented by Hatta, is taken as a background to
describe the mass transfer of CO2 into the aqueous
amine solution. Fig. 3 depicts the application of two
film theory for mass transfer of CO2 into the amine
solution and mass transfer of MEA and water from the
liquid phase into the gas phase. The main assumptions
with the two film theory are (1) the existence of an
interface between liquid and gas phases, (2) a thin
layer of stagnant film on the liquid as well as on the
gas side, (3) liquid and gas in turbulent contact with
each other, (4) the existence of equilibrium at the
interface between gas and liquid. The driving force in
the gas phase is the partial pressure difference
between partial pressure in the gas-bulk phase and
partial pressure at the interface. The driving force in
the liquid phase is giving by the concentration
difference at the interface and in the liquid bulk phase.
Since it is not practical to operate with the interfacial
partial pressure and concentration, the assumption of
equilibrium condition between two phases eliminates
the need for the partial pressure and concentration at
the interface by using the equilibrium pressure and
concentration instead.
NA=kg �P A
g�P A
g,eq�
N A=kl �CA
l ,eq�CA
l�
(1)
Various scientists have attacked the problem of
elaborating the vapor-liquid equilibrium model (VLE)
for CO2 absorption from different angles. According to
Kohl and Nielsen [5], three main contributions for
VLE model development were made by Kent-
Eisenberg, Deshmukh-Matter and Austgen et al. In
the current study, the Deshmukh-Matter approach is
selected to describe vapor-liquid equilibrium (VLE) in
the CO2-MEA system. Briefly, the necessary
conditions for the Deshmukh-Matter model are (1)
defined equilibrium constants for the reactions, (2)
Henry's law constants for CO2 in water, (3) fugacity
coefficients for the gas components, and (4) activity
coefficients for the liquid components.
3.3 Reaction kinetics
CO2 is absorbed into an aqueous amine solution by
means of chemical reactions taking place between
CO2 and the amine solution. There are three possible
mechanisms that can describe the CO2 absorption in
the amine solution according to the recent review
performed by Vaidya [4] and others. These are the
zwitterion mechanism, the thermomolecular
mechanism, and the base-catalyzed hydration
Fig. 3 CO2 transfer from gas phase to
liquid phase.
Fig. 2 Sketch of the segregated
absorption tower

mechanism. To describe reactions emanating in the
absorption tower, the thermomolecular mechanism is
selected in this work. The termomolecular mechanism
originally proposed by Crooks and Donellan and
revised by Svendsen and da Silva [11] implies a single
step reaction of CO2 with one molecule of MEA and
water as a base at the same time.
According to Mandal et al. [12] and Benamor et al.
[13], the following reactions emanate in the aqueous
amine solution. One phase equilibrium and six
chemical equilibria are introduced to describe the
chemistry involved in the CO2 absorption. The main
reactions in the absorption tower are defined as
1. Solubility of CO2
CO2 �g ��CO
2 �aq� (2)
2. Reaction of MEA and CO2
MEA�CO2�K 1
R'NHCOO
��H
� (3)
The reaction is reversible and has a finite reaction rate.
3. Bicarbonate formation
CO2�OH��K 2
HCO3
� (4)
The reaction is reversible and has a finite reaction rate.
4. Bicarbonate disassociation
HCO3
��H 2O�
K 3
H3O�CO3
2� (5)
The reaction is reversible, instantaneous and at
equilibrium [12].
5. Protonation of MEA
MEA�H��K 4
R'NH3
� (6)
The proton transfer reaction is very fast, instantaneous
and at equilibrium as well as reversible, according to
Hagewiesche et al. [14].
6. Water formation
H��OH
��K 5
H2O (7)
This reaction is also considered as reversible,
instantaneous and at equilibrium.
7. Carbamate reversion
R'NHCOO��H 2O�
K 6
MEA�HCO3
� (8)
The carbamate reversion is considered to be
reversible, instantaneous and at equilibrium.
The reaction of carbon dioxide with water is
considered to be very slow and can be neglected,
according to [14]. MEA also reacts with oxygen-
bearing gases to form degradation products, but those
reactions are not in the focus of this study. However,
those reactions would be important to define the amine
degradation level in the absorption tower and can also
be used for quality control purposes.
The empirical correlations for some equilibrium
constants, and forward and backwards reaction rate
constants, are found in various publications and
adjusted in order to be able to use them in this work.
Many authors in related publications concerning the
kinetics of the CO2 absorption tend to combine
equilibrium constants of the other reactions in order to
find missing ones. An empirical formula for K1 was
not found in scientific publications, and it was
obtained by combining equilibrium constants K2, K5
and K6 by assuming that at some arbitrary time all
reactions will reach chemical equilibrium.
With reference to Mandal et al. [12] and Ahmed et al.
[6], the water can be eliminated from the reactions
and from the stoichiometric matrix under the
assumption of an infinite dilution. The element H3O+
can be regarded as H+ according to [6].
Fig. 4 shows specie concentration plot of this study
and reported. Fig. 4 reflects the change in mole
fraction of the liquid species with regard to the
loading of carbon dioxide to MEA.
3.4 Mass transfer coefficients
In order to elaborate the total mass transfer coefficient
for CO2 and find the expression for mass transfer, a
mole balance was performed for the interface between
the gas and liquid phases. Mass transfer is defined as
follows
NCO2
=K G,CO2�PCO
2
g��AHCO
2
CCO2
l � (9)
where KG ,CO2 is total mass transfer coefficient
Fig. 4 Specie concentration plot for 15% MEA and
TL=40°C.
a) reported by Liu [8], b) this study
a)
b)
K
G ,CO2
=1
� HE,CO2
Eklag /l
�RT
g
kgag /l� (10)
The salting-out effect is an indicator of the deviation
from an ideal behavior of the liquid mixture. In order
to take into account the salting-out effect, Eq. (9) is
modified by adding �A. Here,
�A=�HA
HA
s �=10hAI
(11)
The enhancement factor is introduced in Eq. (10) in
order to allow reactions to take place at the liquid film.
The elaboration of the total mass transfer coefficient
for both MEA and H2O is similar to the one with
CO2. However, under the assumption of a well mixed
liquid phase, the equilibrium concentration both for
MEA and H2O can be taken equal to the liquid bulk
concentration of MEA and H2O respectively (i.e.
CMEA
l, eq�CMEA
l, CH
2O
l, eq�CH
2O
l). In other words, the
absence of liquid film is assumed, whereas there is
present a gas film on the gas phase side (Fig. 3). MEA
and H2O are considered to be volatile components and
they are likely to evaporate into the gas phase. Mass
transfer in the gas phase for MEA is given as
NMEA=K G,MEA �PMEA
g,eq�PMEA
g� (12)
and for water is given as
NH2O=KG ,H
2O �PH
2O
g,eq�PH
2O
g� (13)
The development of mass transfer for MEA and water
can be accomplished under non-ideal behavior of the
gas phase. Instead of using Henry's approximation to
describe the vapor-liquid equilibrium, which implies a
linear relationship between partial pressure and
concentration at equilibrium, the vapor-liquid
equilibrium can be expressed using fugacities of each
of the phases. In order to find the equilibrium partial
pressures for MEA and water as well as the partial
pressure of MEA and water in the gas phase, the
fugacity can be introduced as a function of partial
pressure. The driving force for molecules of water and
MEA to evaporate to gas phase, can be presented as
the fugacity difference between fugacity at the
interface and fugacity in the bulk side of the gas as if
NMEA=K G,MEA � f MEA
V ,eq� f MEA
V�
NH 2O=K G,H2O
� f H2O
V ,eq� f H2O
V�
(14)
The fugacity coefficients are found by using the Peng-
Robinson equation of states for the vapor side and the
activity coefficients are determined by the Wilson
equation.
3.5Gasket properties
The mass transfer coefficient both for liquid and gas
depends on the type of chosen packing design for the
absorption tower. Billet [15] provides the empirical
expressions for the mass transfer coefficients for the
gas and liquid sides, and for the various types of
packings. Those expressions require some knowledge
of the physical properties of both gas and liquid in the
absorption tower. In order to find overall gas
viscosity, the Herning-Zipperer correction to the
Wilke's equation is applied [16]. Diffusivity of water
and carbon dioxide in the gas phase is found using the
Chapman-Enskog equation. Diffusivity of MEA in the
gas phase can be found using an equation given by
Fuller et al. [16]. To find the diffusivity of CO2 in the
aqueous amine solution, a CO2-N2O analogy is
applied ([17], [18], [8]) and estimated by the
expression proposed by Snijder et al. [17]. The
diffusivity of CO2 in the water is found by the
expression suggested by Versteeg and Swaaj [19].
3.6 Component balances
The expression for the concentration of CO2 in the
liquid phase is based on the mole balance. The specie
balances for CO2 in the liquid, MEA, and water are
�CCO2
l
�t=�u
l
�CCO2
l
� z�N
CO2
�r1�r
2 (15)
�CMEA
l
�t=�ul
�CMEA
l
�z�NMEA�r 1�r 4�r 6
(16)
�CH
2O
l
� t=�u
l
�CH2O
l
�z�N
H2O(17)
The specie balances for the six ionic species in the
liquid phase are also developed.
The specie balances for the gas phase is similar to the
ones in the liquid phase. The dynamic expression for
CO2 in the gas phase can be written as
�CCO2
g
�t=�u
g
�CCO2
g
� z�N
CO2 (18)
and similarly for MEA
�CMEA
g
�t=�ug
�CMEA
g
�z�NMEA (19)
and for water
�CH2O
g
� t=�u
g
�CH2O
g
� z�N
H 2O (20)
3.7 Energy balances
To be able to reflect the change in temperature both in
the liquid and gas phases, the corresponding energy
balances are developed. The heat transfer between the
liquid and gas phase is found assuming external
turbulent forced convective flow over a flat plate [20].
The temperature model for the liquid phase is of the
form
�T l
�t=�u
l
�T l
� z�
j
��H~
rjr j�
j
�C j
l c~
p , j
l ��
j
N j
j
�C j
l c~
p , j
l �H
~
v�
ag / lhg �Tz�z
l�T z�z
g�
j
�Cj
l c~
p , j
l �
(21)
The temperature model for the gas phase is of form
�Tg
� t=�ug
�T g
�z�ag / lhg �T z�z
l�T z�z
g�
j
�C j
gc~
p,i
g � (22)
3.8Exhaust gas simulation
The input data for the simulation is calculated on the
basis of 400 MW power plant with the annual
emission of CO2 equal to one million tons. The partial
derivatives are solved by converting them into
ordinary derivative equations by the MOL (Method of
Lines). The simulation of the absorption tower is
calculated for 50000 sec (ca. 14 hours and 20 min).
The liquid flow rate is selected to be 0.81 [m3 s-1] and
the height of the absorption column equals to 15 [m].
The hydraulic retention time is calculated to be 3000
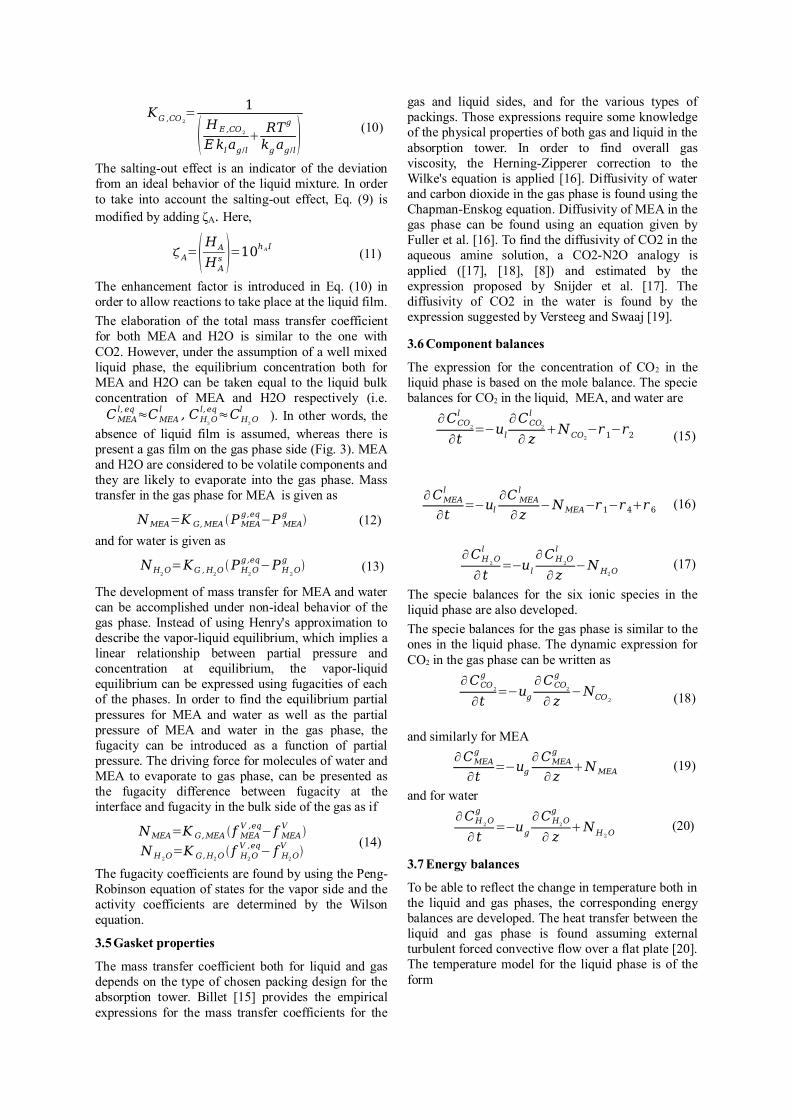
[s] or approximately 50 [min]. Fig. 5 illustrates the
concentration of MEA in the gas phase. From the
figure it can observed that the concentration of MEA
in the gas phase starts to increase as the gas
propagates from the inlet to the outlet of the
absorption tower. However, near the top of the
absorption tower (L=14 [m]) the concentration starts
to decrease slightly since the gas temperature
decreases at L=14 [m] (the fugacity is depended on
the temperature). The increase and decrease of MEA
in the gas phase are stipulated by the mass transfer
between the liquid and gas phases caused by the
fugacity difference. The fugacity difference defines
the direction of diffusion whether the diffusion occurs
from the gas phase into the liquid or vice versa.
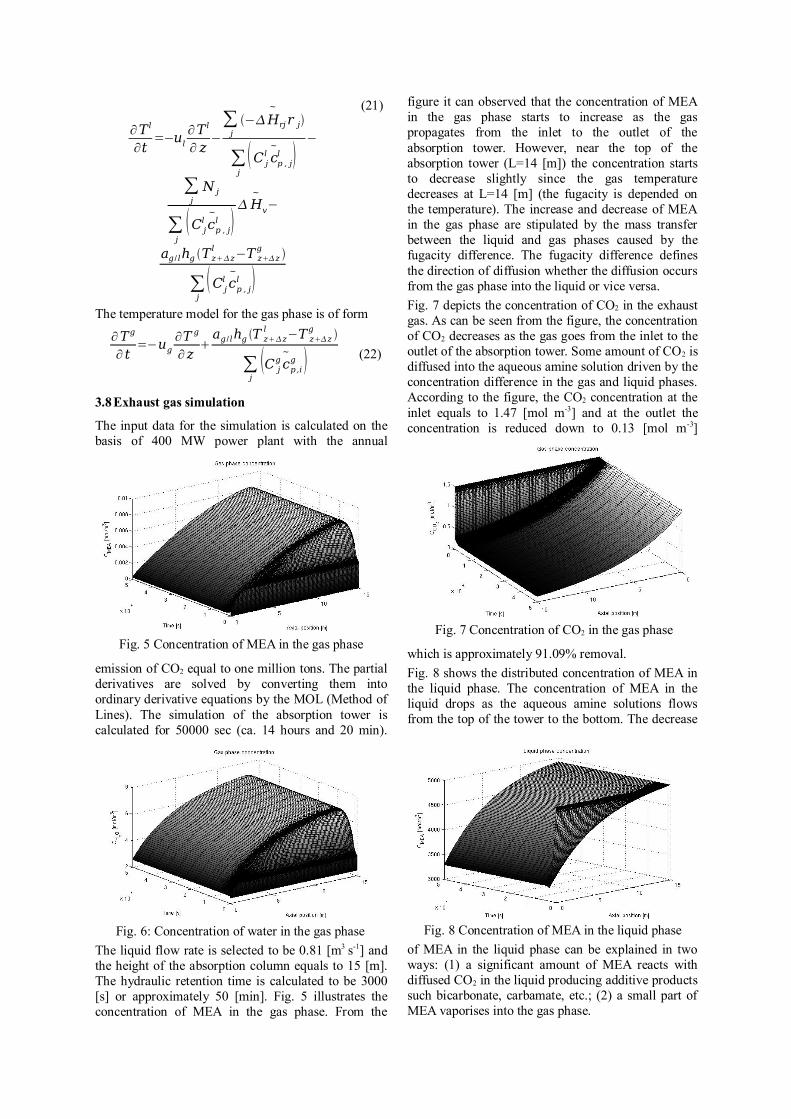
Fig. 7 depicts the concentration of CO2 in the exhaust
gas. As can be seen from the figure, the concentration
of CO2 decreases as the gas goes from the inlet to the
outlet of the absorption tower. Some amount of CO2 is
diffused into the aqueous amine solution driven by the
concentration difference in the gas and liquid phases.
According to the figure, the CO2 concentration at the
inlet equals to 1.47 [mol m-3] and at the outlet the
concentration is reduced down to 0.13 [mol m-3]
which is approximately 91.09% removal.
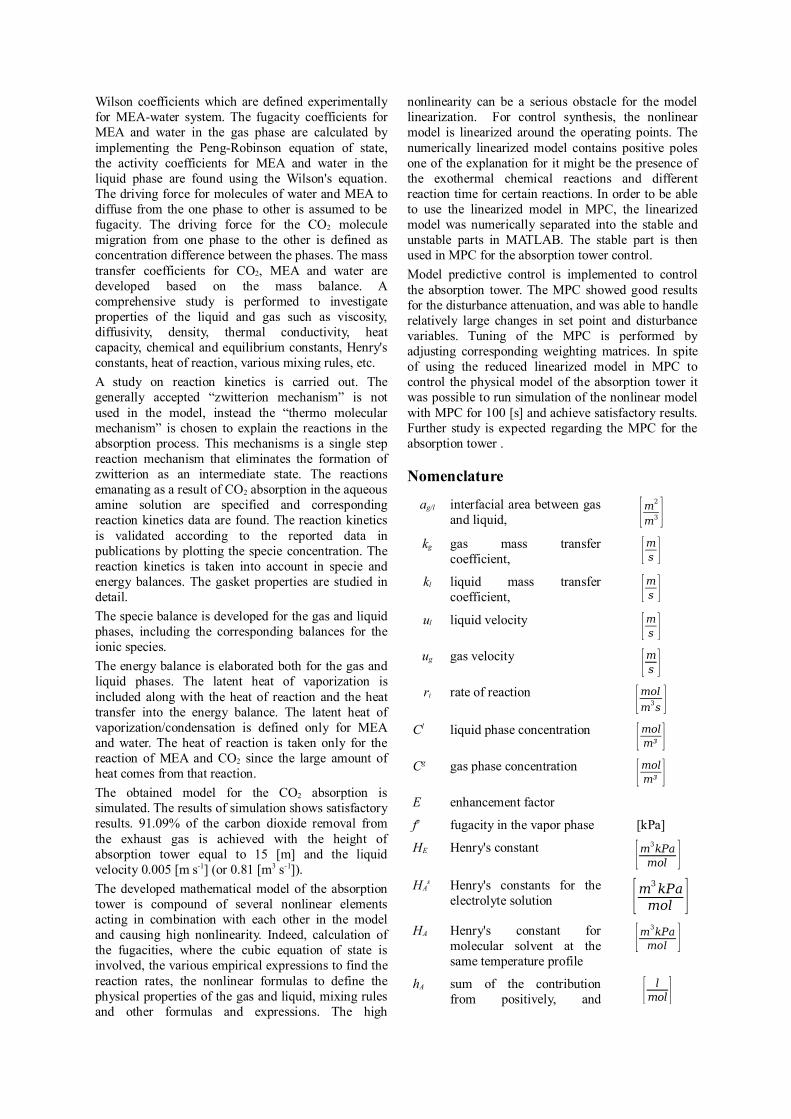
Fig. 8 shows the distributed concentration of MEA in
the liquid phase. The concentration of MEA in the
liquid drops as the aqueous amine solutions flows
from the top of the tower to the bottom. The decrease
of MEA in the liquid phase can be explained in two
ways: (1) a significant amount of MEA reacts with
diffused CO2 in the liquid producing additive products
such bicarbonate, carbamate, etc.; (2) a small part of
MEA vaporises into the gas phase.
Fig. 5 Concentration of MEA in the gas phase
Fig. 6: Concentration of water in the gas phase
Fig. 7 Concentration of CO2 in the gas phase
Fig. 8 Concentration of MEA in the liquid phase

Fig. 12 illustrates the concentration of CO2 in the
liquid phase. The concentration of CO2 is almost zero
and starts to increase insignificantly (up to 2.3·10-5
[mol m-3]) as liquid flows from the top to the bottom
of the tower. The comparatively high concentration of
CO2 at the bottom of the tower is explained by the
high concentration of CO2 in the gas phase at the inlet
of the tower. Since the VLE is given by Henry's law
for CO2, it requires the concentration of CO2 in the
liquid to be equal to the partial pressure of CO2 in the
gas phase at equilibrium. As carbon dioxide diffuses
into the liquid, it is consumed in the reactions with
MEA and hydroxide which leads to virtually zero
(6.6·10-7 [mol m3]) concentration of free CO2 in the
aqueous amine solution. Fig. 6 displays the
concentration of water in the gas phase. The
concentration of water in the aqueous amine solution
is depicted in Figure 9.
The liquid and gas temperatures are displayed in Fig.
10 and 11, respectively. The liquid temperature starts from 318 [K] (45°C) on
the top of the absorption tower and then increases due
to the heat transfer from the gas to liquid, heat of
reaction due to the chemical absorption of CO2 into
the amine solution, latent heat of vaporization and/or
condensation due to the particle diffusion. Near the
top of the tower (L=14 [m]) the liquid reaches its
maximum temperature of 330.9 [K] (57.9 ) and the
temperature then starts to decrease as liquid flows
from the top to the bottom of the tower transferring
the heat to the gas.
The gas coming to the absorption tower has a
temperature of 313 [K] (40°C). As the gas comes in
contact with the liquid, the temperature of the gas
increases due to the heat transfer from the liquid to the
gas since the liquid has a higher temperature than the
gas. Near the top of the absorption tower (L=13) the
gas temperature reaches its maximum temperature of
330.9 [K] (57.9°C). The decrease of the gas
temperature on the top of the absorption tower can
also be observed since the liquid coming into the
tower has a lower temperature, and the heat is
transferred from the gas to the liquid causing the
temperature of liquid to increase.
4 Process control
The design of the control strategy for the CO2
absorption process requires to take into consideration
Fig. 12 Concentration of CO2 in the liquid phase.
Fig. 11 Gas phase temperature
Fig. 9 Concentration of water in the liquid phase
Fig. 10 Liquid phase temperature
Fig. 13 MPC for the absorption tower control.

the whole process in order to avoid undesirable effects
during the plant operation and to attain satisfactory
performance. Looking at the process as a whole will
ensure secure, stable and reliable operational
conditions and also points out at the potential
disturbances and miscellaneous control problems.
This study is focused only on the control of the
absorption process, as an initial study.
4.1MPC
In order to be able to implement MPC to control the
absorption tower, the physical model of the absorption
tower was linearized numerically around the operating
points due to the complex nature of the developed
model. Fig. 13 shows schematically MPC for the
absorption tower control. The output variable or
controlled variable represents the direct measure of
quality and process performance. The controlled
variable in the case of the absorption tower is the
concentration of CO2 at the exit of the tower. Another
possible controlled variable could be the concentration
of MEA degradation products; however this is beyond
the current study. The MPC for the mathematical
model of the absorption tower is calculated using
Model Predictive Control Toolbox in MATLAB,
which provides graphical interface to the MPC
calculation routines.
The input variables or manipulated variables are the
liquid velocity, the liquid concentration of MEA and
the liquid temperature. However, the liquid
temperature and the content of MEA in the liquid
phase have to be manipulated through the stripper
which is not in the scope of the this study. The large
influence on the controlled variable comes from liquid
velocity in the absorption tower.
The disturbances affecting the absorption process
significantly are the inlet content of CO2 (gas
composition), the inlet gas temperature (fluctuation of
gas temperature) and the inlet gas velocity; these
variables can not be considered as manipulated
variables since they depend on external processes (eg.
combustion process).
During the simulation of the mechanistic model, the
upper and lower limits for the liquid velocity is found.
The minimum liquid velocity is determined to be
0.001 [m s-1] and the maximum liquid velocity is
determined to be 0.009 [m s-1]; this is subject to
constraint the input variable which is the liquid
velocity. Since the input variable is constrained, one
should remember to avoid to give large steps in the set
point.
The temperature of the liquid and MEA concentration
in the liquid are also defined as manipulated variables.
These variables are also constrained to keep the
temperatures in the range of absorption process and
avoid reverse reactions.
The prediction horizon is selected to be 10 and the
control horizon to be equal to 5. The MPC controller
based on the linearized model is simulated to control
the non-linear system.
Fig. 14 depicts the performance of MPC during a
given step change to the set point: decreasing CO2
content in the gas phase from 0.5 [mol m-3] to 0.3
[mol m-3]. As it can be seen from Figure 14, the
process variable follows the set point after the applied
step change, sufficiently good.
It is of interest to give some change in the disturbance
variables and observe how the MPC compensates for
the applied disturbances. The disturbances such as
inlet gas velocity, gas temperature and inlet content of
CO2 in the gas can be regarded as measured
disturbances, and a feed forward to the MPC can be
used. The inlet gas content of CO2 at time 50 [s] is
increased in a step change from 1.47 [mol m-3] up to
1.97 [mol m-3], the inlet gas temperature is increased
to 1 [K] and gas velocity is changed from 3 [m s-] to
3.5 [m s-]. Figure 15 illustrates the compensation for
the measured disturbances.
The disturbances are applied in different time
instances. As it can be observed, all disturbances are
well attenuated; the process variable does not deviate
much from the set point.
5 Discussion and conclusions
The absorption is an inherently complex process
which dependends on various factors such as reaction
kinetics, physical properties of the fluid, temperature,
mass transfer, etc. The two film theory is used to
describe the absorption process. The vapor-liquid
equilibrium model for CO2 is approximated by the
Henry's law approach, for MEA and water the concept
of fugacity and activity coefficient is introduced. The
fugacity coefficient is depended on the temperature,
binary interaction parameters and mixing rules for
MEA-water system. The activity coefficient also has
strong dependency with the temperature and the
Fig. 14 Step change in the setpoint
Fig. 15 Disturbance compensation abilities
Wilson coefficients which are defined experimentally
for MEA-water system. The fugacity coefficients for
MEA and water in the gas phase are calculated by
implementing the Peng-Robinson equation of state,
the activity coefficients for MEA and water in the
liquid phase are found using the Wilson's equation.
The driving force for molecules of water and MEA to
diffuse from the one phase to other is assumed to be
fugacity. The driving force for the CO2 molecule
migration from one phase to the other is defined as
concentration difference between the phases. The mass
transfer coefficients for CO2, MEA and water are
developed based on the mass balance. A
comprehensive study is performed to investigate
properties of the liquid and gas such as viscosity,
diffusivity, density, thermal conductivity, heat
capacity, chemical and equilibrium constants, Henry's
constants, heat of reaction, various mixing rules, etc.
A study on reaction kinetics is carried out. The
generally accepted �zwitterion mechanism� is not
used in the model, instead the �thermo molecular
mechanism� is chosen to explain the reactions in the
absorption process. This mechanisms is a single step
reaction mechanism that eliminates the formation of
zwitterion as an intermediate state. The reactions
emanating as a result of CO2 absorption in the aqueous
amine solution are specified and corresponding
reaction kinetics data are found. The reaction kinetics
is validated according to the reported data in
publications by plotting the specie concentration. The
reaction kinetics is taken into account in specie and
energy balances. The gasket properties are studied in
detail.
The specie balance is developed for the gas and liquid
phases, including the corresponding balances for the
ionic species.
The energy balance is elaborated both for the gas and
liquid phases. The latent heat of vaporization is
included along with the heat of reaction and the heat
transfer into the energy balance. The latent heat of
vaporization/condensation is defined only for MEA
and water. The heat of reaction is taken only for the
reaction of MEA and CO2 since the large amount of
heat comes from that reaction.
The obtained model for the CO2 absorption is
simulated. The results of simulation shows satisfactory
results. 91.09% of the carbon dioxide removal from
the exhaust gas is achieved with the height of
absorption tower equal to 15 [m] and the liquid
velocity 0.005 [m s-1] (or 0.81 [m3 s-1]).
The developed mathematical model of the absorption
tower is compound of several nonlinear elements
acting in combination with each other in the model
and causing high nonlinearity. Indeed, calculation of
the fugacities, where the cubic equation of state is
involved, the various empirical expressions to find the
reaction rates, the nonlinear formulas to define the
physical properties of the gas and liquid, mixing rules
and other formulas and expressions. The high
nonlinearity can be a serious obstacle for the model
linearization. For control synthesis, the nonlinear
model is linearized around the operating points. The
numerically linearized model contains positive poles
one of the explanation for it might be the presence of
the exothermal chemical reactions and different
reaction time for certain reactions. In order to be able
to use the linearized model in MPC, the linearized
model was numerically separated into the stable and
unstable parts in MATLAB. The stable part is then
used in MPC for the absorption tower control.
Model predictive control is implemented to control
the absorption tower. The MPC showed good results
for the disturbance attenuation, and was able to handle
relatively large changes in set point and disturbance
variables. Tuning of the MPC is performed by
adjusting corresponding weighting matrices. In spite
of using the reduced linearized model in MPC to
control the physical model of the absorption tower it
was possible to run simulation of the nonlinear model
with MPC for 100 [s] and achieve satisfactory results.
Further study is expected regarding the MPC for the
absorption tower .
Nomenclature
ag/l interfacial area between gas
and liquid, [m2
m3 ]kg gas mass transfer
coefficient, [ms ]kl liquid mass transfer
coefficient, [ms ]ul liquid velocity [ms ]ug gas velocity [ms ]ri rate of reaction [mol
m3s ]
Cl liquid phase concentration [mol
m³ ]Cg gas phase concentration [mol
m³ ]E enhancement factor
fv fugacity in the vapor phase [kPa]
HE Henry's constant [m3kPa
mol ]HA
s Henry's constants for the
electrolyte solution [m3kPa
mol ]HA Henry's constant for
molecular solvent at the
same temperature profile
[m3kPa
mol ]
hA sum of the contribution
from positively, and [ l
mol ]

negatively charged ionic
species and attributed to
dissolved gas
hg heat transfer coefficient for
the gas phase, [ J
m2Ks ]
c~
j ,p
l specific heat capacity in
constant pressure for specie
i in the liquid phase.
[ J
mol K ]
c~
j ,p
g specific heat capacity in
constant pressure for specie
i in the phase phase.
[ J
mol K ]
�Hvspecific molar enthalpy of
vaporization. [ J
mol ]H
r heat of reaction [ Js ]I ionic strength [mol
l ]KG overall mass transfer
coefficient
N mass transfer [mol
m³s ]Pg partial pressure in the gas
phase
[kPa]
Pg,eq equilibrium partial pressure
R universal gas constant [m3kPa
Kmol ]Tg gas phase temperature [K]
Tl liquid phase temperature [K]
z leight of the control volume [m ]
�A salting-out effect correction
References
[1] IPCC, Climate Change 2007: Synthesis report,
http://www.ipcc.ch/ipccreports/index.htm.
[2] The free encyclopedia Wikipedia, The greenhouse
gases,
http://en.wikipedia.org/wiki/Greenhouse_gas.
[3] IPCC, IPCC Special Report on Carbon dioxide
capture and storage, Cambridge university press,
2005.
[4] Prakash D. Vaidya, Eugeny Y. Kenig, CO2-
alkanolamine reaction kinetics: a review of recent
studies, Chem. Eng. Technol., Vol. 30, No. 11, pp.
1467�1474, 2007.
[5] Kohl Arthur, Nielsen Richard, Gas Purification,
5th edition, Gulf Publishing Company, 1997.
[6] Mohamed Edali, Ahmed Aboudheir, Raphael
Idem, Kinetics of Carbon Dioxide Absorption into
Mixed Aqueous Solutions of MDEA and MEA
using Laminar Jet Apparatus and Numerically
Solved Absorption-Rate/Kinetic Model, Excerpt
from the Proceedings of the COMSOL
Conference 2007, Boston.
[7] A. Aboudheir, P. Tontiwachwuthikula, A.
Chakmab , R. Idema, Kinetics of the reactive
absorption of carbon dioxide in high CO2-
loaded, concentrated aqueous
monoethanolamine solutions, Chem. Eng.
Science, Vol. 58, pp. 5195�5210, 2003.
[8] Yunda Liu, Luzheng Zhang, and Suphat
Watanasiri, Representing vapor-liquid
equilibrium for an aqueous MEA-CO2 system
using the Electrolyte Nonrandom-Two-Liquid
Model, Ind. Eng. Chem. Res., Vol. 38, pp.
2080-2090, 1999.
[9] Stefano Freguia and Gary T. Rochelle, Modeling
of CO 2 Capture by Aqueous Monoethanolamine,
AIChE Journal, Vol. 49, No. 7, 2003.
[10] Karl A. Hoff, Modeling and experimental study
of carbon dioxide absorption in a membrane
contactor, Doctoral thesis, NTNU, 2003.
[11] Eirik F. da Silva, Hallvard F. Svendsen,
Computational chemistry study of reactions,
equilibrium and kinetics of chemical CO2
absorption, International journal of greenhouse
gas control, Vol. I, pp. 151�157, 2007.
[12] B. P. Mandal , M. Guhab , A. K. Biswasb , S. S.
Bandyopadhyaya, Removal of carbon dioxide by
absorption in mixed amines: modelling of
absorption in aqueous MDEA-MEA and AMP-
MEA solutions, Chemical Engineering Science
Vol. 56, pp. 6217�6224, 2001.
[13] A. Benamor, M.K. Aroua, Modeling of CO2
solubility and carbamate concentration in DEA,
MDEA and their mixtures using the Deshmukh�
Mather model, Fluid Phase Equilibria 231, pp.
150�162, 2005.
[14] Daniel P. Hagewiesche, Sami S. Ashour, Hani A.
Al-Ghawas , Orville C. Sandall, Absorption of
carbon dioxide into aqueous blends of
monoethanolamine and -methyldiethanolamine,
Chemical Engineering Science, Vol. 50, No. 7,
pp. 1071-1079, 1995.
[15] R. Billet, Packed Towers, VCH
Verlagsgesellschaft mbH, 1995.
[16] R.C. Reid, J.M. Prausnitz, Bruce E. Poling, The
Properties of Gases and Liquids, 4th edition,
McGraw-Hill Inc., 1987.
[17] E.D. Snijder, G.F. Versteeg, W.P.M. van Swaij,
Diffusion coefficients of several aqueous
alkonolamine solutions, J. Chem. Eng. Data, Vol.
38, pp. 475-480, 1993.
[18] Jimmy Xiao, Chih-Wei Li, Meng-Hui Li,
Kinetics of absorption of carbon dioxide into

aqueous solutions of 2-amino-2-methyl-1-
propanol+monoethanolamine, Chemical
Engineering Science, Vol. 55, pp. 161-175, 2000.
[19] G.F. Versteeg, P.M.M. Blauwhoff, W.P.M. van
Swaaij, The effect of diffusivity on gas-liquid
mass transfer in stirred vessels. Experiments at
atmospheric and elevated pressures, Chemical
Engineering Science, Vol. 42, pp. 1103-1119,
1987.
[20] A. Aroonwilas, A. Chakma, P.
Tontiwaxhwuthikul, A. Veawab, Mathematical
modeling of mass-transfer and hydrodynamics in
CO2 absorbers packed with structured packings,
Chem. Eng. Science, Vol. 58, pp. 4037-4053,
2003.
[21] Dag-Kjetil Hansen, Dynamic modeling of an
absorption tower for the removal of carbon
dioxide from exhaust gas by means of
monoethanolamine, M.Sc. thesis, Telemark
University College, 2004.