
MODEL 514 NDIR ANALYZER - teledyne-ai.com · The 514 contains an optical system consisting of a...
74
Teledyne Analytical Instruments A Business Unit of Teledyne Electronic Technologies INSTRUCTION MANUAL MODEL 514 NDIR ANALYZER P/N M63700 08/06/99 ECO # 99-0323 HIGHLY TOXIC AND OR FLAMMABLE LIQUIDS OR GASES MAY BE PRESENT IN THIS MONITORING SYSTEM. PERSONAL PROTECTIVE EQUIPMENT MAY BE REQUIRED WHEN SERVICING THIS SYSTEM. HAZARDOUS VOLTAGES EXIST ON CERTAIN COMPONENTS INTERNALLY WHICH MAY PERSIST FOR A TIME EVEN AFTER THE POWER IS TURNED OFF AND DISCONNECTED. ONLY AUTHORIZED PERSONNEL SHOULD CONDUCT MAINTENANCE AND/OR SERVICING. BEFORE CONDUCTING ANY MAINTENANCE OR SERVICING CONSULT WITH AUTHORIZED SUPERVISOR/ MANAGER. DANGER
Transcript of MODEL 514 NDIR ANALYZER - teledyne-ai.com · The 514 contains an optical system consisting of a...

Teledyne Analytical InstrumentsA Business Unit of Teledyne Electronic Technologies
INSTRUCTION MANUAL
MODEL 514 NDIR
ANALYZER
P/N M6370008/06/99
ECO # 99-0323
HIGHLY TOXIC AND OR FLAMMABLE LIQUIDS OR GASES MAY BE PRESENT IN THIS MONITORINGSYSTEM.
PERSONAL PROTECTIVE EQUIPMENT MAY BE REQUIRED WHEN SERVICING THIS SYSTEM.
HAZARDOUS VOLTAGES EXIST ON CERTAIN COMPONENTS INTERNALLY WHICH MAY PERSIST FORA TIME EVEN AFTER THE POWER IS TURNED OFF AND DISCONNECTED.
ONLY AUTHORIZED PERSONNEL SHOULD CONDUCT MAINTENANCE AND/OR SERVICING. BEFORECONDUCTING ANY MAINTENANCE OR SERVICING CONSULT WITH AUTHORIZED SUPERVISOR/MANAGER.
DANGER

Teledyne Analytical InstrumentsA Business Unit of Teledyne Electronic Technologies
Copyright © 1999 Teledyne Analytical Instruments
All Rights Reserved. No part of this manual may be reproduced, transmitted,transcribed, stored in a retrieval system, or translated into any other language or com-puter language in whole or in part, in any form or by any means, whether it be elec-tronic, mechanical, magnetic, optical, manual, or otherwise, without the prior writtenconsent of Teledyne Analytical Instruments, 16830 Chestnut Street, City of Industry, CA91749-1580.
Warranty
This equipment is sold subject to the mutual agreement that it is warranted by usfree from defects of material and of construction, and that our liability shall be limited toreplacing or repairing at our factory (without charge, except for transportation), or atcustomer plant at our option, any material or construction in which defects becomeapparent within one year from the date of sale, except in cases where quotations oracknowledgements provide for a shorter period. Components manufactured by othersbear the warranty of their manufacturer. This warranty does not cover defects caused bywear, accident, misuse, or neglect. We assume no liability for direct or indirect damagesof any kind and the purchaser by the acceptance of the equipment will assume allliability for any damage which may result from its use or misuse.
We reserve the right to employ any suitable material in the manufacture of ourapparatus, and to make any alterations in the dimensions, shape or weight of any parts,in so far as such alterations do not adversely affect our warranty.
Important Notice
This instrument is intended to be used a tool to gather valuable data. The informa-tion provided by the instrument may assist the user in eliminating potential hazardscaused by the process that the instrument is intended to monitor; however, it is essentialthat all personnel involved in the use of the instrument or its interface with theprocess being measured be properly trained in the process itself, as well as allinstrumentation related to it.
The safety of personnel is ultimately the responsibility of those who controlprocess conditions. While this instrument may be able to provide early warning ofimminent danger, it has no control over process conditions, and can be misused. Inparticular, any alarm or control system installed must be tested and understood, both asthey operate and as they can be defeated. Any safeguards required such as locks, labels,or redundancy must be provided by the user or specifically requested of Teledyne.
The purchaser must be aware of the hazardous conditions inherent in theprocess(es) he uses. He is responsible for training his personnel, for providing hazardwarning methods and instrumentation per the appropriate standards, and for ensuringthat hazard warning devices and instrumentation are maintained and operated properly.
TAI, the manufacturer of this instrument, cannot accept responsibility for condi-tions beyond its knowledge and control. No statement expressed or implied by thisdocument or any information disseminated by the manufacturer or his agents is tobe construed as a warranty of adequate safety control under the user's processconditions.

Teledyne Analytical InstrumentsA Business Unit of Teledyne Electronic Technologies
Table of Contents
1.0 Introduction1.1 Method of Analysis ............................................................1-11.2 Modules (Condulets) .........................................................1-2
1.2.1 Source Module .......................................................1-51.2.2 Sample Module ..................................................1-51.2.3 Power Module ..................................................1-51.2.4 Detector Module ..................................................1-51.2.5 Local Meter Readout ..............................................1-61.2.6 Control Module ..................................................1-6
1.3 Typical Applications ..........................................................1-6
2.0 Operational Theory2.1 Circuit Description .............................................................2-2
2.1.1 Source Module .................................................... 2-22.1.2 Sample Module ..................................................2-32.1.3 Power Module ..................................................2-42.1.4 Detector Module ..................................................2-82.1.5 Control Module ..................................................2-10
3.0 Installation3.1 Location ............................................................................3-13.2 Sample Saction Installation ...............................................3-1
3.2.1 Filtering ..................................................................3-13.2.2 Effluent Return ........................................................3-23.2.3 Flow Control ...........................................................3-23.2.4 Selector Manifold ....................................................3-33.2.5 Automatic Zero Operation .......................................3-3
3.3 Electrical Installation .........................................................3-33.3.1 Power Check ..........................................................3-3
3.4 Analysis Unit .....................................................................3-53.5 Optical Alignement ............................................................3-6
4.0 Operations4.1 Control Functions ..............................................................4-1
4.1.1 General Purpose Version: Analysis Section ...........4-14.1.2 General Purpose Version: Controle Module ...........4-24.1.3 Explosion-Proof Version: Control Module ..............4-3
Teledyne Analytical InstrumentsA Business Unit of Teledyne Electronic Technologies
4.2 Start-up..............................................................................4-44.2.1 Preliminary Inspection ............................................4-44.2.2 Pre-Start-up Electrical Checkout ............................4-54.2.3 Power On Observation ...........................................4-5
4.3 Calibration .........................................................................4-6
5.0 Maintenance & Troubleshooting5.1 Replacement of Sample Cell Optics .................................5-25.2 Replacement of Filter Wheel Optics ..................................5-25.3 Replacement of Source Lamp Assembly ..........................5-35.4 Replacement of Filter Position Sensor ..............................5-45.5 Replacement of Preamplifier Circuitr Card ........................5-45.6 Re-screening of Lens ..................................................5-55.7 Troubleshooting ..................................................5-5
AppendixSpecifications ....................................................................A.1Application Data ................................................................A.2Recommended Spare Parts List .......................................A.3Drawing List ......................................................................A.4
1–1
Introduction 1.0
Teledyne Analytical InstrumentsA Business Unit of Teledyne Electronic Technologies
1.0 Introduction
The Model 514 Photometric Analyzer measures the concentration ofone component in a mixture of liquids or gases continuously by measuringthe radiation absorbed in selected bands in the near infrared (NIR) spectralregion. Most liquids or gases having a characteristic absorption spectrum inthis region can be measured with the analyzer. When we refer to the NIRregion we mean that portion of the electromagnetic energy spectrum from1.0 to 2.8µ. This range can be extended to somewhat longer wavelengthsusing special detectors. Most organic and some inorganic compounds can beanalyzed in the NIR region.
For example, the 514 is used to analyze parts per million (PPM) or thepercentage concentration of water in a variety of compounds (see TypicalApplications). The analyzer can also be used to measure the concentration ofone organic compound in the presence of another organic compound.
1.1 Method of Analysis
The 514 contains an optical system consisting of a quartz iodine sourcelamp for NIR energy emission, collimating lens, sample cell and detector.Isolator or light beam tubes filled with nitrogen gas interconnect the sourceand sample, and sample and detector modules. In front of the detector is amotor-driven filter wheel containing two optical interference-type filters,located 180° from each other. These filters, designated the reference andmeasuring filters, are alternately and continuously rotated in and out of theoptical path. The sample flows continuously through the sample cell absorb-ing energy at various wavelengths throughout the NIR spectrum. The wave-lengths and intensities of absorption peaks throughout the spectrum arecharacteristic of the specific compounds that are present in the sample.
In any photometric analysis, there is always the component that we areinterested in analyzing, and background components that we are not inter-ested in measuring. Both the component of interest and the backgroundcomponent may have complex NIR absorption spectra.

Teledyne Analytical InstrumentsA Business Unit of Teledyne Electronic Technologies
1–2
1.0 Introduction
The quantitative measurement of a compound using the 514 is based onBeer’s Law, which states that the intensity of a beam of monochromaticradiation transmitted through a sample decreases exponentially as the con-centration of the absorbing sample increases.
To approximate monochromatic radiation, a specific wavelength isisolated by the use of the interference-type filters. The filters allow transmis-sion of NIR over a narrow band pass region of the NIR spectra and com-pletely block all other wavelengths. Proper selection of the measuring andreference filter wavelengths allows the accurate isolation and measurementof the component of interest.
The use of two filters allows cancellation of energy changes due toturbidity, dirty sample cell windows, and aging of the source and electroniccomponents.
The center band pass of the measuring filter is selected to transmitenergy in a narrow region where the component of interest absorbs stronglyin comparison with background absorbance. The center band pass of thereference filter is selected to transmit energy in a band pass region where thebackground absorption of NIR energy is equivalent to that seen by themeasuring filter. The reference filter is also selected to be in a region wherethe component of interest has minimal absorption of energy.
The optical beam is converted from steady state to pulsed energy by therotation of the filters in the optical path. The measuring and reference pulsesof radiation strike a detector which converts the pulses of radiation intoelectrical pulses which are then amplified. Signal processing involvesconverting the electrical signals to logarithmic signals, and then comparingthe measuring to the reference logarithmic signals in order to give a readoutrepresenting the concentration of the component of interest in the sample.
1.2 Modules (Condulets)
Physical layout of the analyzer is shown in Figures 1-1 and 1-2. Thecontrol module is usually located apart from the analysis unit in a controlroom. The explosion-proof version has the control and analysis unitsmounted in one weather-resistant NEMA-12 enclosure suitable for outdoorinstallation.
The analysis section is designed for hazardous area installation. Hous-ings are rated for use in Class I, Div. I, Group D hazardous environments.

1–3
Introduction 1.0
Teledyne Analytical InstrumentsA Business Unit of Teledyne Electronic Technologies
Figure 1-1. Model 514 Photometric Analyzer (with General-Purpose Control Unit)

Teledyne Analytical InstrumentsA Business Unit of Teledyne Electronic Technologies
1–4
1.0 Introduction
Figure 1-2. Model 514 Photometric Analyzer (with Explosion-Proof Control Unit)

1–5
Introduction 1.0
Teledyne Analytical InstrumentsA Business Unit of Teledyne Electronic Technologies
1.2.1 Source ModuleThe source module or condulet houses the quartz iodine source lamp,
collimating lens/lens holder, and transformer. The 115 VAC power to thesource transformer is derived directly from the line voltage regulating trans-former installed in the power module.
1.2.2 Sample ModuleThe insulated sample module has sample inlet and outlet lines con-
structed of 1/8" O.D. 316SS tubing. The sample is routed through apreheater, through the sample cell, then drained from the outlet port. Athermistor-controlled preheater and compartment space heater are poweredfrom temperature controllers located in the power module. A thermal cutoutswitch prevents temperature “runaway”.
The sample cell, which is configured for each particular application, isprovided with sapphire windows to admit NIR radiation.
1.2.3 Power ModuleThe power module contains a line voltage regulating transformer (with
capacitor) and three temperature controller circuit cards.
Each of the controllers incorporates a bridge circuit containing a ther-mistor located in the volume/compartment to be controlled. Bridge imbalanceproduces an error signal, resulting in operation of the final control element(heater) to restore bridge balance, and controlling the temperature to within afairly narrow proportional band.
Control functions for the analysis section are located on the powermodule (see Figure 4-1).
1.2.4 Detector ModuleAs noted above, the detector is a part of the optical system (see Figure
2-1). The detector cell is mounted within a hermetically sealed block with aquartz window through which the optical energy enters. The assembled cellblock, together with the preamplifier subassembly, filter wheel, and filterposition sensor, are contained within a temperature-controlled compartment
In addition to the heated optical compartment, the detector modulecontains the chopper motor, power transformer, and six circuit cards whosefunction is described in section 2. 2. 4, Detector Module.
Teledyne Analytical InstrumentsA Business Unit of Teledyne Electronic Technologies
1–6
1.0 Introduction
1.2.5 Local Meter ReadoutFor analyzer configurations having a remotely located control module,
the local meter is used to read the reference and measuring peak heights, orthe voltage output from the buffer amplifier before voltage-to-current conver-sion.
When the control module is integral with the analysis section, i. e., theexplosion-proof configuration, the meter is connected to the output of thecontrol module in order to display the concentration of the component ofinterest as well as the previously mentioned information.
1.2.6 Control ModuleIn the explosion-proof version, the calibration meter is used as an all
purpose readout; in this case, there is some modification in the switching atboth the control module and power module.
In addition to control switching, adjustment (zero and span), and read-out components, the control module has provisions for five circuit cards: anautomatic zero/extended voltage amplifier, E-to-I converter, I-to-E converter,power supply, and alarm comparator. The alarm comparator circuit cardincorporates two circuits with jumpers that permit setting the alarm(s) forhigh, low, high/low, high/high, and low/low settings. Setpoint adjustmentsare performed with potentiometers on the module front panel.
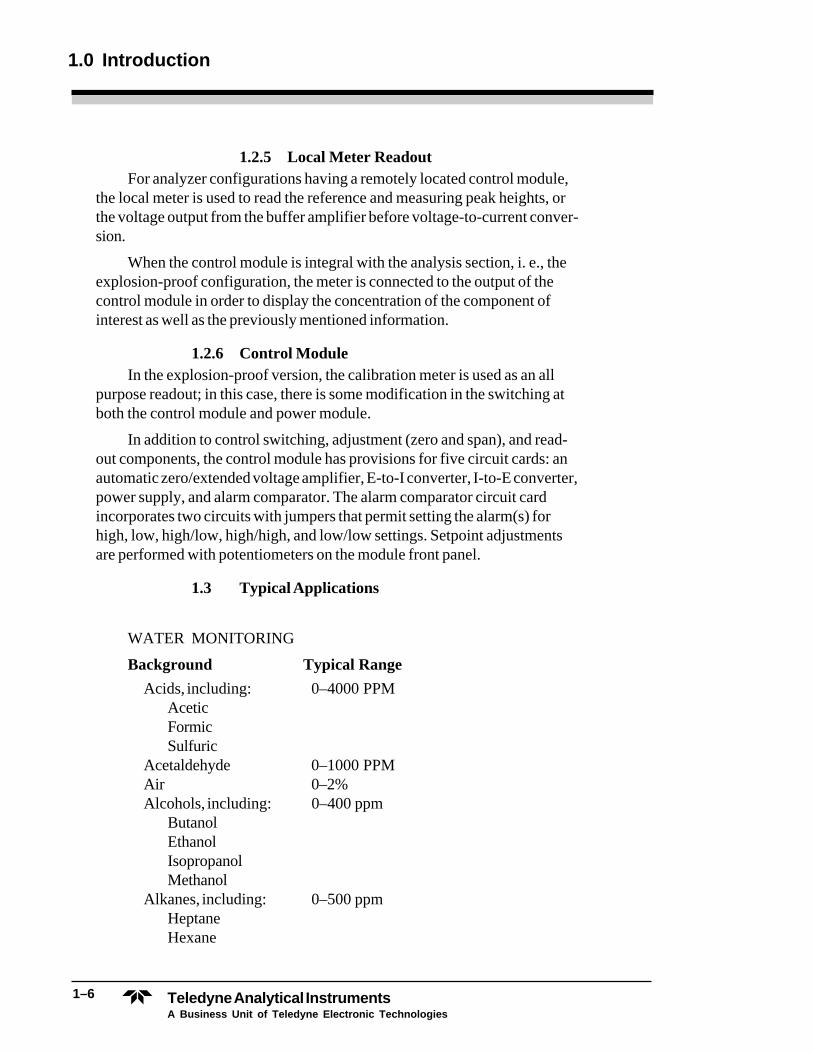
1.3 Typical Applications
WATER MONITORING
Background Typical RangeAcids, including: 0–4000 PPM
AceticFormicSulfuric
Acetaldehyde 0–1000 PPMAir 0–2%Alcohols, including: 0–400 ppm
ButanolEthanolIsopropanolMethanol
Alkanes, including: 0–500 ppmHeptaneHexane

1–7
Introduction 1.0
Teledyne Analytical InstrumentsA Business Unit of Teledyne Electronic Technologies
Ammonia 0–1000 ppmAromatics, including: 0–500 ppm
BenzeneCumeneTolueneXylene
Chlorinated Hydrocarbons including: 0–200 ppmCarbon TetrachlorideEthyl ChlorideEthylene DichlorideMethyl ChloridePerchloroethylenePropylene DichlorideTrichloroethyleneVinyl Chloride
Chloroprene 0–200 ppmChloropicrin 0–200 ppmDeuterium Oxide 0–200 ppmEpichlorohydrin 0–2000 ppmEthylene Glycol 0–500 ppmFreons 0–500 ppmGasoline 0–500 ppmHydrogen Fluoride 0–10%Hydroperoxides 0–5%Kerosene 0–500 ppmKetones 0–1000 ppmMethyl Acetate 0–1000 ppmMethyl Methacrylate 0–1000 ppmOils 0–1%Olefins 0–500 ppmPentane 0–300 ppmα-Picolene 0–300 ppmPhenol 0–1000 ppmPolyols 0–500 ppmPropylene Glycol 0–500 ppmPropylene Oxide 0–200 ppmSulfinol 0–15%Sulfur Dioxide 0–1000 ppmVinyl Acetate 0–2%
NOTE: Range may be higher or lower per application.

Teledyne Analytical InstrumentsA Business Unit of Teledyne Electronic Technologies
1–8
1.0 Introduction
OTHER NIR ABSORBERSAcetic AcidAlcoholsAminesAromaticsButadieneCarbonylsChloropreneEstersHydrocarbonsHydrogen ChlorideHydrogen FluorideHydroxyl ValueKetonesOlefinsOximesEpoxidesMethylene

2–1
Operational Theory 2.0
Teledyne Analytical InstrumentsA Business Unit of Teledyne Electronic Technologies
2.0 Operational Theory
The energy source for the analyzer is provided by a high intensityquartz iodine lamp located in the source module. Quartz iodine was chosenbecause it produces sufficient NIR to operate the system and maintains anearly constant brightness over its lifetime. (See Figures 2-1 and 2-2).
This energy is then fed through the sample, which is temperaturecontrolled, and into the detector module where it passes through a rotatingfilter wheel before reaching the lead sulfide (PbS) detector.
The filter wheel, driven at 30 RPS or 1800 RPM by a synchronousAC motor, contains two optical filters with bandpasses selected for eachapplication, thus providing reference and measuring pulses from which therequired information may be obtained.
The detector receives pulses at the rate of 60 PPS, or two pulses perrevolution of the filter wheel. Every other pulse is from the measuringfilter, while the alternate pulse is from the reference filter, so that pulsesthrough the measuring filter alternate with pulses through the referencefilter. A filter position sensor, which is an optical device having an integrallight source and light detector, differentiates between the two.
The two entrained pulses received by the detector each revolution areamplified through a preamplifier which is physically located inside thesealed compartment with the filter wheel and detector. This signal is thensent to a clamping circuit where an exact zero reference is established.
This clamped video signal is then fed through a gain control network,which is controlled by the automatic gain control loop, through anotheramplifier, to the electronic switch. This switch is controlled by the switchdriver network which derives its information from the filter position sensorin order to separate the entrained video signal into its component parts of ameasuring peak and a reference peak. These peaks are then fed through abalancing network and channeled into separate peak height detectors whichproduce DC voltage levels which are exactly equal to the peak height orabsolute magnitude of the voltage from the base to the peak of each of thepulses.
2–2
2.0 Operational Theory
Teledyne Analytical InstrumentsA Business Unit of Teledyne Electronic Technologies
At this point the reference signal is fed back to the automatic gaincontrol loop to maintain the desired system gain. In addition, both themeasuring and reference levels are fed to selector switches in order toenable direct meter indication, which greatly eases the task of balancingthe system during initial system installation and periods of calibration.
The DC voltage levels are fed to a logarithmic ratio amplifier whichproduces a voltage output that is proportional to the logarithm of the ratioof the two DC input voltages. This output voltage, directly proportional tothe concentration of sample, is, within certain limits, a linear function ofthe concentration. For purposes of transmission, the voltage signal isconverted by an E-to-I converter; thus, the output signal from the analysisunit is a current signal that is proportional to the concentration of sample inthe sample module.
Upon arrival at the control module, which is normally located in aremote location away from the analyzer unit, the signal is processedthrough an I-to-E converter which incorporates fine zero and span controlsfor calibration. Following the span control, a buffer amplifier providesisolation between the calibrated signal and any of the selected outputdevices. This signal is then sent to the meter driver circuit and readoutmeter, to the alarm comparator circuits, voltage output circuits, currentoutput circuits, etc., depending upon the particular application requirement.
There is also an option of providing an automatic zero circuit (seedrawing B-14729) in the control unit. This circuit provides electricalsignals for switching a fluid which contains none of the material to bemeasured into the sample module, electrically adjusting the zeros andswitching back to sample.
2.1 Circuit Descriptions
2.1.1 Source ModuleThe source module is the source of infrared energy. This is provided
through the use of a high-intensity quartz iodine lamp operating directlyfrom a 6.3 V transformer. To ensure a stable source of radiation in the faceof line-voltage variations, the lamp transformer derives its input directlyfrom a line voltage-regulating transformer, selected for its ability to main-tain a constant output voltage level regardless of fluctuations in the inputline voltage within the control range of 105 to 130 VAC.
In some applications where we have an abundance of energy due tolow sample absorption, the focusing lens is removed to avoid excessenergy reaching the detector. However, other systems have high energy
2–3
Operational Theory 2.0
Teledyne Analytical InstrumentsA Business Unit of Teledyne Electronic Technologies
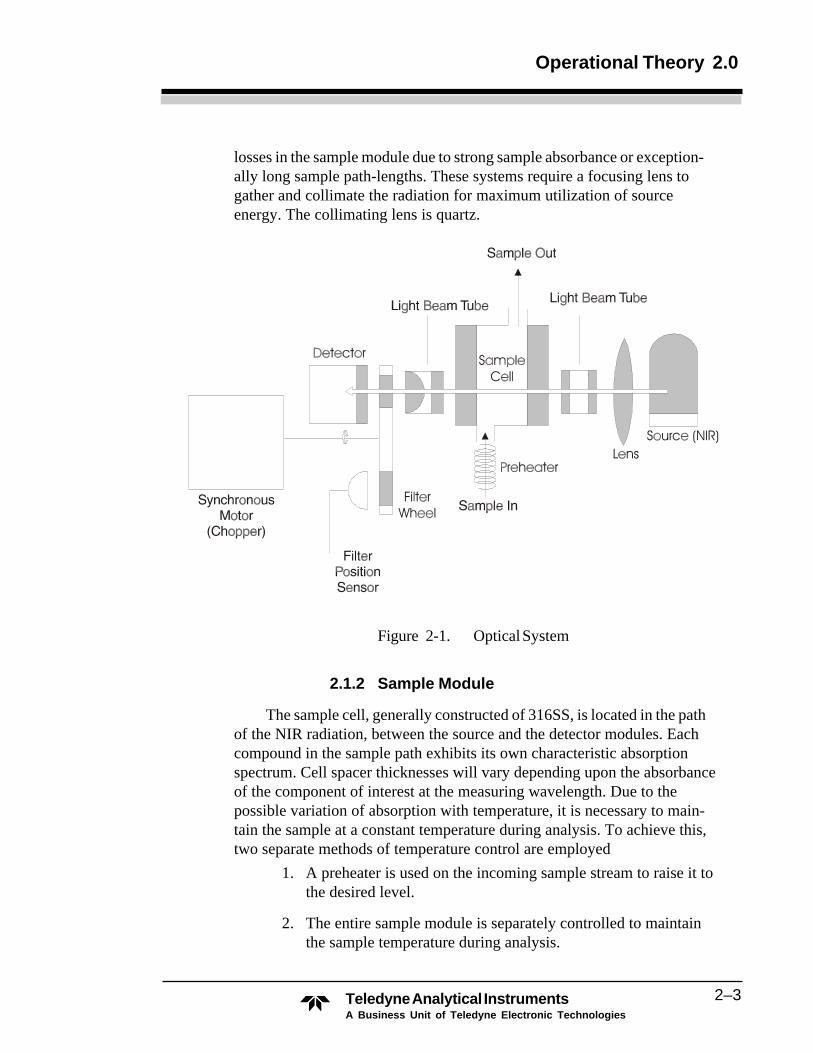
losses in the sample module due to strong sample absorbance or exception-ally long sample path-lengths. These systems require a focusing lens togather and collimate the radiation for maximum utilization of sourceenergy. The collimating lens is quartz.
Figure 2-1. Optical System
2.1.2 Sample Module
The sample cell, generally constructed of 316SS, is located in the pathof the NIR radiation, between the source and the detector modules. Eachcompound in the sample path exhibits its own characteristic absorptionspectrum. Cell spacer thicknesses will vary depending upon the absorbanceof the component of interest at the measuring wavelength. Due to thepossible variation of absorption with temperature, it is necessary to main-tain the sample at a constant temperature during analysis. To achieve this,two separate methods of temperature control are employed
1. A preheater is used on the incoming sample stream to raise it tothe desired level.
2. The entire sample module is separately controlled to maintainthe sample temperature during analysis.

2–4
2.0 Operational Theory
Teledyne Analytical InstrumentsA Business Unit of Teledyne Electronic Technologies
Figure 2-2 Analyzer System - Block Diagram
2.1.3 Power Module
See Figure 2-3. The power module controls power to the analyzer unit,providing the switching function for the local meter, and providing tempera-ture control for the sample and detector modules. In the case of the explo-sion-proof configuration, where the control unit is mounted locally, thepower module simply routes the AC input power to its destination andallows the control unit to provide the ON/OFF function.
When power is applied to the system, it is directed to the constantvoltage transformer and to the three temperature controllers which areinsensitive to line voltage fluctuations.
In order to facilitate easier calibration and to provide a quick visualindication of the instrument’s status, a local meter is provided. With the

2–5
Operational Theory 2.0
Teledyne Analytical InstrumentsA Business Unit of Teledyne Electronic Technologies
NORM/ZERO switch on the power module set to the NORM position, themeter will provide a constant readout of either the reference level or themeasuring level. During calibration periods, the ZERO switch control maybe used to monitor the signal into the E-to-I converter, and if a known zerosample is applied, then the ZERO potentiometer may be varied to ensurezero output to the control unit.
Figure 2-3. Power Module - Block Diagram
All of the temperature controller circuit cards for the analyzer arelocated in the power module. The schematic diagram for these circuits isshown in dwg. B-15016.
The purpose of the time-proportional temperature controllers is to sensethe temperature in the compartment or volume to be controlled and, at a rateof approximately twice per second, turn on the heater(s) for a specifiedportion of the time cycle, depending upon how much heat is needed. When
15 VDC CoarseZero
Control
SelectorSwitch
MEASREFZERO
PowerLine Voltage
RegulatorTransformer5AS1
115 VAC60 HzInput
From
Det
ecto
r Mod
ule
PreheaterTemp.Control
SampleModuleTemp.Control
DetectorModuleTemp.Control
Thermistorand Heater
Thermistorand Heater
Thermistorand Heater
To Log Amplifier
To Meter Driver
115 VAC toSource Module
115 VAC toDetector Module

2–6
2.0 Operational Theory
Teledyne Analytical InstrumentsA Business Unit of Teledyne Electronic Technologies
ON, the heater is fully turned on; only the duration of the ON interval willvary.
As the compartment heats up, the heater-on time interval is shortened.The less heat needed, the shorter the heater-on interval during each cycle.Since TRIAC Q1 is used as the control element for the heater, it is suppliedwith the full AC line power. The output TRIAC is mounted on a heat sinkand can handle the full heater wattage.
A4 is a zero crossing switch and TRIAC driver, providing a gatingsignal output pulse to turn on the TRIAC. Turn-on pulses are only appliedto TRIAC Q1 when commanded by a control signal, i.e., at the time theline voltage crosses zero.
A1B is a comparator that compares the output of the temperatureamplifier (voltage representing temperature) A1A (at pin 5) with a refer-ence ramp voltage from A2B (at pin 6), causing TRIAC Q1 to be turned onfor a time interval proportional to the required heat.
A2B and A3 comprise a ramp generator that produces a sawtoothvoltage ranging from 6 to 12 VDC with a period of approximately one-halfsecond.
The output voltage from the temperature amplifier A1A will rangefrom less than 6 volts to something more than 12 volts. When the outputvoltage is greater than 12 volts, the TRIAC will be turned on a full timeinterval each cycle. When the output is less than 6 volts, the TRIAC will beturned off all the time. When the output is in the middle of the range(approximately 9 volts), the TRIAC will be turned on for about one-half ofthe time interval.
The thermistor, which is a negative temperature coefficient device, isset up in a bridge circuit. Resistor R2, the setpoint resistor, is selected to beapproximately equal to the resistance of the thermistor at the desiredoperating temperature. The other half of the bridge, the voltage dividernetwork comprised of resistors R4 and R5, is balanced. When the resis-tance of the thermistor is equal to the resistance of R2 at the desired opera-ting temperature, the bridge is balanced and the voltage at pins 2 and 3 ofA1A is the same.
When the temperature in the compartment rises, the thermistor resis-tance will decrease and the inverting input of A1A will fall below thereference point. This input will be amplified by A1B to broaden the pro-portional band and preclude the possibility of the device overshooting andoperating as an on/off temperature controller.
2–7
Operational Theory 2.0
Teledyne Analytical InstrumentsA Business Unit of Teledyne Electronic Technologies
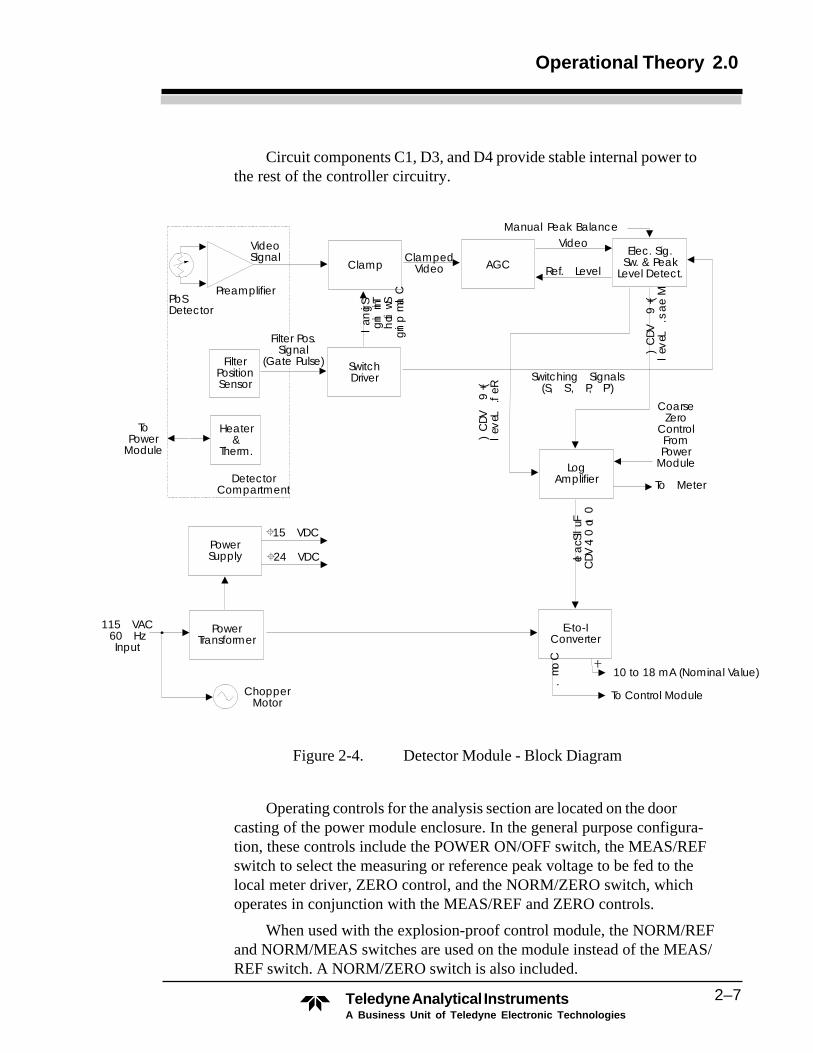
Circuit components C1, D3, and D4 provide stable internal power tothe rest of the controller circuitry.
Figure 2-4. Detector Module - Block Diagram
Operating controls for the analysis section are located on the doorcasting of the power module enclosure. In the general purpose configura-tion, these controls include the POWER ON/OFF switch, the MEAS/REFswitch to select the measuring or reference peak voltage to be fed to thelocal meter driver, ZERO control, and the NORM/ZERO switch, whichoperates in conjunction with the MEAS/REF and ZERO controls.
When used with the explosion-proof control module, the NORM/REFand NORM/MEAS switches are used on the module instead of the MEAS/REF switch. A NORM/ZERO switch is also included.
PbSDetector
Preamplifier
VideoSignal
ClampClamped
Video
SwitchDriver
FilterPositionSensor
Cla
mp
ingSw
itch
Timing
Signa
l
ToPower
Module
Heater&
Therm.
DetectorCompartment
PowerSupply
15 VDC
24 VDC
PowerTransformer
ChopperMotor
115 VAC60 HzInput
E-to-IConverter
To Control Module
10 to 18 mA (Nominal Value)
Co
m.
0to
0.4VD
CFullSc
ale
LogAmplifier
CoarseZero
ControlFromPower
Module
Ref.
Leve
l(+
9VD
C)
Switching Signals(S, S', P, P')
Me
as.
Leve
l(+
9VD
C)
Elec. Sig.Sw. & Peak
Level Detect.
Manual Peak BalanceVideo
Ref. LevelAGC
To Meter
Filter Pos.Signal
(Gate Pulse)

2–8
2.0 Operational Theory
Teledyne Analytical InstrumentsA Business Unit of Teledyne Electronic Technologies
2.1.4 Detector Module
See Figure 2-4. After energy has passed through the sample, it arrives atthe filter wheel where it is fed alternately through two filters (measuring andreference) before reaching the detector.
These filters are specially selected for each application according to theabsorption characteristics of the compounds under analysis. The referenceand measuring filter waveforms occur along a baseline at approximately 16milliseconds intervals; each reference or measuring waveform reoccurs at atime interval of 33 mS, or one per revolution of the filter wheel.
At the detector, infrared energy is transformed into electrical pulses andfed through an impedance-matched preamplifier (see dwg. A-14619). De-pending upon the application, length of the cell spacer, etc., the gain of thepreamplifier may vary from 1 to 10, depending upon the energy intensity atthe detector, to achieve an AC signal output of approximately 0.1 to 1.0 voltpeak-to-peak.
Additionally, the detector, filters, and preamplifier are housed in anelectrically and thermally isolated box to provide maximum stability andminimum noise. This box, or compartment, is normally temperature con-trolled at 46 °C.
The negative-going video from the preamplifier is fed to the clampcircuit (see dwg. B-14561) to establish a precise zero reference to thebaseline of the pulses. This is accomplished by applying a gate to Ql at atime when neither filter is in the energy path. This gated signal is fedthrough A2 where it subtracts itself from the composite signal at the non-inverting input. The signal output of A3 is clamped to ground and has anamplitude of approximately two times the input.
The gating pulse for the clamp circuit is derived from the filter posi-tion sensor which is located in the detector compartment. The sensor emitsradiation which is reflected from the white pattern on the rear side of therotating filter wheel and sensed by a photo transistor. This creates a squarewave of 5 volts amplitude at TP4 which is then further processed by Q2,A4 and A5 to generate the gating pulse for the clamp circuit as well as theswitching signals S, S', P and P', which are later used to demodulate thecomposite video.
The clamped-to-ground, negative-going video is then sent to theautomatic gain control circuit (see dwg. B-14564). This circuit receives areference signal from the peak level detector and uses it to adjust thecurrent through LEDs B1 and B2. The current through LED B1 controls its

2–9
Operational Theory 2.0
Teledyne Analytical InstrumentsA Business Unit of Teledyne Electronic Technologies
light output and, therefore, the resistance of its shunt resistors. This enablesthe signal at TP2 to be continually adjusted up or down to hold the referencesignal at a constant level (nominally 9 volts) and thus eliminate the effects ofturbidity or other foreign substances in the sample, within design limits.
After the automatic gain control circuit, the signal proceeds to the peaklevel detector, where it is demodulated by A1 and A2, using the timingsignals previously generated (see dwg. B-14554). Potentiometer R3 can beused to precisely balance the signal levels by adjusting the feedback loopgain resistance of the two respective peaks. The separate peaks are then sentthrough peak detector networks where they are transformed into stable DCvoltage levels. In the case of the reference peak level, it is from here that a +9VDC signal is fed back to the automatic gain control network. The signallevels are then fed to either one of two logarithmic ratio amplifiers (see dwgs.C-14586 and C-14907).
For applications of high sensitivity, a chopper-stabilized log amplifier isused (see dwgs. C-14586 and C-17706). A3 generates an approximate 200Hz square wave which alternately allows the signals to be fed into the logamplifier (A1) itself, and then blocks the measuring level and feeds thereference level into both log amplifier inputs, allowing it to zero itself. Thelog signal is then applied through amplifier A4 and A6 to A7 where acoarse zero offset voltage may be applied through the ZERO potentiometeron the power module
For less sensitive applications, a simpler log ratio circuit is used (dwg.C-14907). The reference and measuring levels are processed through afilter network before being compared by A1. This comparison results inthe log ratio output which is fed to A2 for application to a zero offsetvoltage from the zero adjust potentiometer on the power module.
From the log amplifier the signal is finally sent to the voltage-to-current (E-to-I) converter for transmission to the control unit. Conversionof the voltage signal to a current signal allows for signal transmission overgreater distances without noise pickup.
The E-to-I converter (see dwg. B-14075) is set with a nominal offsetso that with 0 VDC input, 10 mA output is obtained. This baseline settingis adjustable through R7, the zero adjustment.
The converter is scaled so that with a 0.5 VDC input, the output willbe 20 mA (set with balance potentiometer R12). Output nominally rangesfrom 10 mA to 18 mA with a 0 to 0.4 VDC input. When required, zerodrift can be accommodated; i.e., inputs ranging from -0.5 to +0.5 VDC willproduce 0 to 20 mA outputs.

2–10
2.0 Operational Theory
Teledyne Analytical InstrumentsA Business Unit of Teledyne Electronic Technologies
Power for the detector module is provided by a center-tapped trans-former which takes 115 VAC input, reduces it to 40 VAC, then feeds thevoltage to the DC power supply. An additional winding on the transformerprovides output power to the E-to-I card.
The power supply utilizes a fullwave rectifier in order to provide +24VDC unregulated. The 24 VDC is further filtered, then fed through avoltage regulator to obtain +15 VDC regulated.
As noted previously, the filter wheel is driven by a synchronous ACchopper motor which operates at 1800 RPM. The filter wheel performstwo functions: (1) switching filters, and (2) chopping the optical signal togive pulses which can be amplified for high quality processing.
2.1.5 Control Module
The control module provides voltage and current output signals whichare properly scaled for the application, alarm signals in the form of relaycontacts, and a meter output. Optional provisions are also included for anautomatic zero and dual-range capability.
Upon arrival at the control module, the milliampere signal is con-verted to a 0 to +2 volt full scale output for connection to the spanpotentiometer (see dwg. A-14620). An optional millivolt output can also beprovided by the I-to-E converter circuit card. At this point, fine zerocontrol is also applied by means of a potentiometer located on the front ofthe module.
The voltage is then scaled so that 1 VDC full scale output is obtainedat the center of the span potentiometer. This signal is coupled through anextended voltage amplifier circuit and used to drive the 0 to 100 µA meteron the control module.
The standard 0 to 1 VDC output is also generated by the extendedvoltage amplifier circuit (see dwg. B-16221).
The 0 to 1 VDC full scale from the span potentiometer is connected tothe alarm comparator circuit (see dwg. B-14718) where it is used to drive apair of amplifier circuits which couple the alarm setpoints to relays K1 andK2.
A current output (normally 4 to 20 mA) is optional. If desired, anoptically isolated current transmitter can be installed in the explosion-proofcontrol module.

2–11
Operational Theory 2.0
Teledyne Analytical InstrumentsA Business Unit of Teledyne Electronic Technologies
Power for the control module is provided by a center-tapped trans-former which takes the 115 VAC input, reduces it to 40 VAC, and feeds thevoltage to a DC power supply identical to the one installed in the detectormodule. Power supply outputs are +24 VDC unregulated, and +15 VDCregulated.
Ext. Volt.Amplifier
AlarmComparator
AutoZero
Timer
Manual Setpoint Adjust.#1 #2
Relays
N.O.Com.
N.C.
N.O.Com.
N.C.
E-to-IConverter
Current(4 to 20 mA)
Standard
ValveControlSignal
SpanAdjust.
MeterIndication
Voltage(0 to 1 V f.s.)
Millivolts(0 to 5 mV f.s.)
To I-to-E Converter
To Timer
15 VDC
24 VDC
PowerSupply
PowerTransformer
ManualFine Zero
Power
115 VAC60 Hz
Input
I-to-EConverter
CurrentSignalInputFrom
AnalysisUnit
115 VAC60 Hz
Output±
±
Figure 2-5. Control Module - Block Diagram
2–12
2.0 Operational Theory
Teledyne Analytical InstrumentsA Business Unit of Teledyne Electronic Technologies

3–1
Installation 3.0
Teledyne Analytical InstrumentsA Business Unit of Teledyne Electronic Technologies
3.0 Installation
Before power is supplied to the analyzer, all modules should be openedand inspected for damage or loose components. Also check unit for properwiring and connections. All plug in circuit cards should be removed andchecked individually for correct assembly.
3.1 Location
The analysis section should be installed in an area where the ambienttemperature does not fall below 32 °F or rise above 110 °F. Steam orelectrical enclosure heating may be provided as an option. Do not installthe assembly in the path of an air conditioner or in an extremely draftyarea. The analysis section, as well as the explosion-proof version of theanalyzer, is suitable for installation in Class I, Group D, Division I areas.Since the analysis section of the general purpose version of the analyzer isenclosed in a weather-resistant enclosure, it is suitable for outdoor location.
The control module of the general purpose version of the analyzer isgenerally intended for flush panel mounting indoors in general purposeareas.
3.2 Sample Section: Installation Recommendations
See Figure 3-1. The sample is introduced and drained (or vented) fromtwo 1/8 " Swagelok bulkhead fittings located on the bottom side of thesample module. The following guidelines are recommended:
3.2.1 FilteringSuspended particulate matter must be eliminated from the process
sample prior to introduction into the analyzer sampling system. Aside fromclogging the lines, accessories, integral sample paths of the analyzer andcoating sample cell windows, solid particles may interfere with the analy-

3–2
3.0 Installation
Teledyne Analytical InstrumentsA Business Unit of Teledyne Electronic Technologies
sis. TAI recommends that a bypass filter assembly in the sample loop beinstalled.
Figuire 3-1. Sampling Considerations
3.2.2 Effluent Return
Returning the sample effluent to the process may require a separatecalibration fluid return so that the calibration fluids can be kept out of theprocess during standardization periods.
3.2.3 Flow Control
A differential pressure regulator is often used in TAI systems across thesample flowmeter and needle valve control to give a constant flow, regard-less of upstream or downstream pressure fluctuations. Constant flow may ormay not be important, depending upon the application.
It is necessary to insure sufficient contact of the sample with thepreheater in order to bring the sample up to the control temperature. Do notallow flow in excess of 50 ml/minute.
For liquid applications, TAI recommends that the throttle valve andflowmeter always be downstream from the analyzer. Such an installationwill pressurize the sample cell and eliminate bubbles in the sample.Bubbles suspended in the sample fluid will produce erratic, ambiguousanalysis of the sample.
Analyzer Flow CellSample Inlet
RegulatorBypass Valve
SampleFlowmeter
Diff. Regulator
Ring Manifold
BypassFlowmeter
Sample Outlet
Filter installed onlywhen required
Sample
Zero Fluid
Span Fluid
Cell Drain
CalibrationFluid Return
Sample Return

3–3
Installation 3.0
Teledyne Analytical InstrumentsA Business Unit of Teledyne Electronic Technologies
The cell with sapphire windows will withstand up to 600 psi pressure.TAI does not recommend high pressure sample handling, but don’t hesitateto slightly pressurize the analyzer for optimum results.
3.2.4 Selector Manifold
TAI recommends a three valve selection system that reports into a“ring” manifold for sample and calibration fluid control. Such a systemwill permit you to conserve calibration fluid. Calibration fluids can beintroduced by a simple gravity system. A bypass valve around the differen-tial pressure regulator is recommended for calibrating with gravity feed.Calibration fluid flow need only be long enough to insure adequate flush-ing of the system, and then the calibration fluid drain valve can be closed.A ring manifold will insure a good flush with a minimum expenditure offluid.
3.2.5 Automatic Zero Operation
Analyzers equipped with automatic zero control will require a three-way electrically or pneumatically actuated valve in the sample system. Inaddition, if it is undesirable for zero fluid to return to the process, a similarthree-way valve must be used for the calibration fluid return. In addition, atime delay on the operation of the second three-way valve is desirable toallow sample fluid purging of the zero fluid in the analyzer returning to theprocess stream. This time delay must be built into the analyzer at the timeof purchase.
With automatic zeroing, zero fluid can be actuated manually bysetting the SAMPLE-ZERO switch to the ZERO position. Span fluid isintroduced by setting the switch to SPAN.
3.3 Electrical Installation
3.3.1 Power Check
1. Plug in the +15 volt power supply PC card (see dwg. B-14708)but leave all other PC boards out.
2. Turn power ON.3. With a digital multimeter (DMM), check for +15 volts on the
+15 volt power supply.4. Check for proper starting of the chopper motor and source lamp.
3–4
3.0 Installation
Teledyne Analytical InstrumentsA Business Unit of Teledyne Electronic Technologies
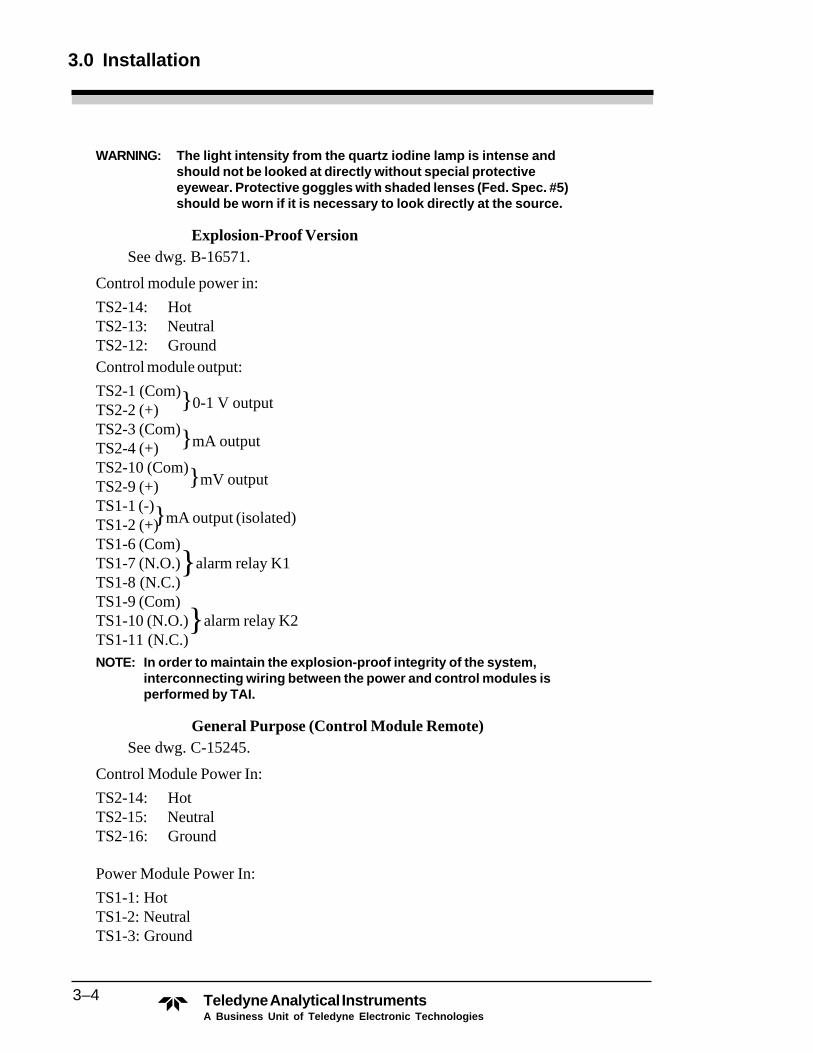
WARNING: The light intensity from the quartz iodine lamp is intense andshould not be looked at directly without special protectiveeyewear. Protective goggles with shaded lenses (Fed. Spec. #5)should be worn if it is necessary to look directly at the source.
Explosion-Proof VersionSee dwg. B-16571.
Control module power in:
TS2-14: HotTS2-13: NeutralTS2-12: GroundControl module output:
TS2-1 (Com)0-1 V outputTS2-2 (+)TS2-3 (Com)mA outputTS2-4 (+)TS2-10 (Com)mV outputTS2-9 (+)TS1-1 (-)mA output (isolated)TS1-2 (+)TS1-6 (Com)TS1-7 (N.O.)alarm relay K1TS1-8 (N.C.)TS1-9 (Com)TS1-10 (N.O.)alarm relay K2TS1-11 (N.C.)NOTE: In order to maintain the explosion-proof integrity of the system,
interconnecting wiring between the power and control modules isperformed by TAI.
General Purpose (Control Module Remote)See dwg. C-15245.
Control Module Power In:
TS2-14: HotTS2-15: NeutralTS2-16: Ground
Power Module Power In:
TS1-1: HotTS1-2: NeutralTS1-3: Ground

3–5
Installation 3.0
Teledyne Analytical InstrumentsA Business Unit of Teledyne Electronic Technologies
Control Module (mA Input):
mA output + - TS2-7 from TS2-7Power moduleCom - TS2-8 from TS2-6
Control Module Output:TS2-1 (Com)0-1 V outputTS2-2 (+)TS2-3 (Com)mA outputTS2-4 (+)TS2-10 (Com)mV outputTS2-9 (+)TS2-12 (Com)TS2-11 (N.O.)alarm relay K1TS2-13 (N.C.)TS1-12 (Com)TS1-11 (N.O.)alarm relay K2TS1-13 (N.C.)
3.4 Analysis Unit
Explosion-Proof Version, Control Unit: Input power connections forthis unit are at TS2 pins: 12 (ground), 13 (neutral), 14 (line) (see dwg. B-16571). The input resistance between line and neutral with the ON/OFFswitch in the ON position should be 4 ohms +10%. The resistance betweenground-hot and ground-neutral should be infinite resistance.
General Purpose Version, Control Unit: Control unit inputpower connections are to be found at TS2 pins: 14 (line), 15 (neutral), 16(ground) (see dwg. C-15245). The input resistance between line andneutral with the ON/OFF switch in the ON position should be infiniteresistance.
General Purpose Version, Power Module: Power Module inputpower connections are at TS1 pins: -1 (line), -2 (neutral), -3 (ground) (seedwg. C-15245). The input resistance between line and neutral with the ON/OFF switch in the ON position should be 5 ohms +10%. The resistancebetween ground-line and ground-neutral should be infinite resistance. Atthis point all interconnections between the control unit and power moduleshould be made. The interconnections are as follows: Connect the input ACpower to TS2: -14 (line), -15 (neutral), -16 (ground).
Next, a power line connection should be installed between the controlunit switch AC power in TS1: -14 (line), -15 (neutral), -16 (ground), andthe power module AC power in TS1: -1 (line), -2 (neutral), -3 (ground).

3–6
3.0 Installation
Teledyne Analytical InstrumentsA Business Unit of Teledyne Electronic Technologies
Signal connections should now be installed from the control unit TS2: -7(plus), 6 (common) (see dwg. C-15245).
3.5 Optical Alignment
The object of optical alignment is to bring the optimum source energyto the detector. Generally the optimum energy will be the maximumamount of energy which can be focused on to the detector. This can be doneby adjusting the various elements in the source module (see dwg. C-14628).
WARNING: The light intensity from the quartz iodine lamp is intense andshould not be looked at directly without special protectiveeyewear. Protective goggles with shaded lenses (Fed. Spec.#5) should be worn if it is necessary to look directly at thesource.
Use a Variac on the input AC line to reduce the voltage and the lampintensity to a tolerable level.
1. Vertical lamp position is achieved by loosening the screws ofthe base lamp bracket and moving the assembly up or down.
2. Horizontal position is achieved by loosening the Allen screw atthe base of the lamp holder which allows side to side movementof the lamp.
3. Beam focusing is then achieved by loosening the lens holdingbracket and moving the lens back and forth until the bestfocusing is obtained.
4. First visually optimize the lamp energy using a white piece ofpaper at various locations in the light path. Make adjustments asin steps 1, 2, and 3 above.
5. Then electronically optimize the energy as follows (the preampmust be installed in the detector compartment):
a. Insert an extender card in the switch driver and clampposition (remove keys as necessary).
b. Connect an oscilloscope to pin 6 (video from pre-amp),and pin 3 (ground).
c. Remove the lens assembly from the light path.d. Optimize lamp energy by adjusting the lamp position as
described in steps 1 and 2 above.e. Replace the lens assembly.f. Focus the lamp as described in step 3 to give the
maximum peak heights displayed on the oscilloscope.g. If a Variac was used to alter the light intensity,
disconnect it and reconnect source to power supply.

4–1
Operations 4.0
Teledyne Analytical InstrumentsA Business Unit of Teledyne Electronic Technologies
4.0 Operations
Before shipment, TAI calibrates the analyzer for your application whenfeasible. Calibration data is listed in the Appendix. Prior to calibration, TAIchecks the electronics of the analyzer and makes all of the necessary internalprinted circuit board adjustments. Calibration is performed to determine theproper zero and span settings, and also to verify that the analyzer response islinear.
After calibration, TAI makes a lengthy stability check to insure that theanalyzer performs within all specifications. We advise that you recalibrateyour equipment as part of start-up for the following reasons:
1. During shipment, it is possible that components have been jarredout of position or damaged.
2. Your process may be of a proprietary nature. Beyond checkingelectrical stability, TAI is unable to make a meaningful calibra-tion of the system, requiring these adjustments to be made byyou.
3. In other cases precise calibration can only be made with theanalyzer connected to your process stream.
In any case, it is important that you calibrate the analyzer when it isfirst installed. Zero checks should be made routinely once or twice a weekand span calibration should be performed weekly, at first, and monthlyafter reproducibility is assured.
4.1 Control Functions
4.1.1 General Purpose Version, Analysis Section
The control functions for the analysis section are located on the powermodule:

4–2
4.0 Operations
Teledyne Analytical InstrumentsA Business Unit of Teledyne Electronic Technologies
1. POWER ON/OFF: This switch controls power to the analysissection.
2. NORM/ZERO: NORM setting gives a local meter reading ofthe peak-to-peak (P-P) voltage of the measuring or referencesignal, depending upon the mode setting of the MEAS/REFswitch.ZERO setting allows the meter to display the voltage output ofthe analysis section after comparing the logarithm of themeasuring and reference signals. This output is fed to meterdriver prior to conversion to a current signal for transmission tothe control module.With zero fluid in the cell, the analysis section local metershould read zero when the NORM/ZERO control is set toZERO. The setting of the MEAS/REF switch has no effect onmeter readout in the ZERO position of this switch.
3. MEAS/REF: selects either the measuring or reference peakvoltage to be fed to the local meter driver. The NORM/ZEROswitch must be in the NORM position; the reference peakvoltage should read 9±0.1 volts. With zero fluid in the samplecell, the measuring peak voltage should be the same as thereference peak voltage.
4. ZERO: potentiometer control allows an adjustment of theanalysis section output voltage to the E-to-I converter. TheZERO control should be adjusted to give a zero reading whenzero fluid is in the sample cell.
5. Local Meter Readout: reads reference or measuring peakheights, or voltage output from buffer amplifier before E-to-Iconversion.
4.1.2 General Purpose Version, Control Module
l. ZERO:control to adjust the control module to read zero outputwhen zero fluid is in the sample cell, i.e., fine zero.
2. SPAN: control to adjust the span calibration to make the controlmodule meter read the correct concentration of the span fluid.
3. POWER ON/OFF: This switch controls power to the controlmodule.

4–3
Operations 4.0
Teledyne Analytical InstrumentsA Business Unit of Teledyne Electronic Technologies
4. ALARM SET (#l and #2): optional controls; position of dialsetting determines alarm setpoints. If dual alarms are used,these may be set for high/low, high/high or low/low. Singlealarms can be either high or low. Dial settings can be determinedfrom the following formula:
X = Unknown dial setting to achieve desired alarm setpoint.A = Analysis scale unit for low end of range.B = Analysis scale unit for high end of range.C = Analysis scale unit desired for alarm setpoint.
X = (C-A)(1000)(B-A)
For example, if the range of analysis is 20-80%, and a desirable alarmsetpoint is 30%, then A = 20, B = 80, and C = 30
X = (30-20)(1000) = 167(80-20)
5. RANGE: optional switch; allows changing the range by somepredetermined amount, such as 4X or 5X; i.e., dual range: lowrange of 0-100 ppm and a high range of 0-500 ppm.
6. Mode: selector for units incorporating an automatic zero.SAMPLE position is the automatic zero; ZERO position is themanual zero; SPAN position is the manual span adjustment.
7. Meter Readout: indicates the concentration of the componentof interest.
4.1.3 Explosion-Proof Version: Control Module
When the control module is integral with the analysis section (explo-sion-proof), it has all of the same control functions as the remote controlmodule. However, the meter readout function will be performed by theanalysis section.
Since the meter readout must handle functions for both the analysissection and the control module, some of the controls on the power moduleare different from those on the general purpose unit.
The NORM/REF and NORM/MEAS switches are on the powermodule in place of the MEAS/REF switch. In addition, the NORM/ZEROswitch is located on the power module.

4–4
4.0 Operations
Teledyne Analytical InstrumentsA Business Unit of Teledyne Electronic Technologies
To read output from the control module, the NORM/ZERO, NORM/REF and NORM/MEAS switches all must be in the NORM position.
4.2 Start-up
Information contained in this paragraph is based on the premise that theanalyzer has been properly installed as outlined in Chapter 3.0, and that it isin operable condition. If difficulties arise during start-up, it is probable thatsome form of damage has incurred during shipment or some installation errorhas inadvertently been made.
Accessory test equipment is not necessary for start-up of the 514.However, if the analyzer malfunctions at start-up, an oscilloscope and amultimeter will be required for troubleshooting (see Chapter 5.0). TAIrecommends that a dual trace oscilloscope be used. A dual trace oscillo-scope will permit the operator to see two different waveforms simulta-neously.
4.2.1 Preliminary Inspection
Before power is supplied to the analyzer, all modules should be openedand inspected for damage or loose components. Plug-in circuit cards shouldbe firmly seated in their sockets. All barrier strip wiring connections must beinspected, and user-installed wiring between units verified as being in agree-ment with the system interconnection diagram.
Control SettingsPrior to turning on the power, the controls on and within the control
module should be positioned as follows:
Analyzers not equipped with Auto Zero1. ON/OFF switches on OFF.
2. SPAN control preset to the setting noted in Specific ApplicationData in the Appendix.
Analyzers equipped with Auto Zero1. ON/OFF switches on OFF.
2. SAMPLE/ZERO switch on ZERO.
3. RUN/TEST switch (on timer unit within control module) inTEST position.

4–5
Operations 4.0
Teledyne Analytical InstrumentsA Business Unit of Teledyne Electronic Technologies
4. SPAN control preset to the setting noted in Specific ApplicationData in the Appendix.
4.2.2 Pre-Start-up Electrical Checkout
After the preliminary procedures have been accomplished (refer toPreliminary Inspection and Control Settings, above), the integrity of thesystem interconnection and the power sources must be verified beforeattempting the analytical start-up procedures.
The observations and measurements described in the following para-graphs are vital to the operation of the analyzer. If the analyzer does notrespond as described, the equipment has been damaged in shipment orinstallation, or the user-installed wiring is in error. If a problem arises,correct it before proceeding further.
The following procedures should be employed in the same sequencein which they appear.
4.2.3 Power On Observations
Turn both the analysis section and control module ON/OFF switches toON and make the following observations:
1. Open the analysis section detector module and verify that thechopper motor is operating. The motor should start turning theinstant power is established. If it does not, check the integrity ofthe main fuse on the control module door. If the fuse is blown,re-check the power service connections on TS2 in the controlmodule, and the control module to analysis sectioninterconnection wiring (refer to Electrical Installation inChapter 3.0: Installation, and dwg. C-15245).
2. The lamp source should light the instant power is established.Open the cover on the source module to verify illumination.
WARNING: 1. The light intensity from the quartz iodine lamp is intenseand should not be looked at directly without special protectiveeyewear. Protective goggles with shaded lenses (Fed. Spec.#5) should be worn if it is necessary to look directly at thesource.2. Before opening any of the enclosure covers with the power on,make certain that the area has been classified as safe to do so.
3. If the analyzer section has been equipped with the automatic zerooption, the zero solenoid device in the accessory sampling system

4–6
4.0 Operations
Teledyne Analytical InstrumentsA Business Unit of Teledyne Electronic Technologies
should have energized the instant power was established. Thedevice (or devices) should be energized because the mode switchhas been preset to the ZERO position.
4. If the test procedure was normal, the devices should have beenseen or heard to operate as described by personnel located at theanalysis section installation site, and no further check need bemade at this time. If operation is not as described, refer toTroubleshooting in Chapter 5.0.
5. Check analyzer operation by completing the calibrationprocedure described below in Calibration after allowing theinstrument to warm up. The electrical circuits take from 30 to40 minutes to stabilize.
NOTE: It will take at least four hours for the analyzer to completely stabilizewith respect to temperature.
4.3 Calibration
Standardization FluidsTwo standardization fluids are necessary to calibrate the analyzer:
1. Zero Fluid:The zero standard fluid must have a compositionsimilar to the sample, and ideally, contains none of thecomponents of interest. The zero fluid should be laboratoryanalyzed to determine its composition. The exact compositionmust be known, as the accuracy of the analysis can be no betterthan the your knowledge of the standardization fluid.
2. Span Fluid: The span fluid must be representative of thesample fluid in composition (like the zero fluid), and contain ameasured quantity of the component of interest. The componentof interest content of the fluid should be in the region of 75% to100% of the range of measurement. As with the zero fluid, theaccuracy of the system is dependent upon the your knowledgeof the span fluid composition. Ideally, the span sample shouldcontain 100% of whatever the instrument is set up to analyze.
Procedure1. Introduce zero fluid (see above) into the sample cell. Flow liquid
samples into the cell at a flow rate of less than 50 ml/minute toallow the sample preheater time to heat the sample up to the

4–7
Operations 4.0
Teledyne Analytical InstrumentsA Business Unit of Teledyne Electronic Technologies
control temperature. Make certain that bubbles are not introducedor formed in the cell. (Some back-pressure may help avoid this.)Gas samples can be introduced at about 200 ml/minute.
2. Turn the power module NORM/ZERO switch to NORM.
3. Turn the power module MEAS/REF switch to REF. Verify thatthe analysis section meter reads 9±0.1 volts.
4. Make adjustment of the measuring peak voltage as follows(zero fluid must be in the sample cell during this adjustment):
a. Switch the MEAS/REF switch to the MEAS position.The meter should read almost the same as in the REFmode. If the reading is somewhat different, themeasuring peak may be re-adjusted with R3 on the peaklevel detector circuit card (see dwg. B-14554 and “PeakLevel Detector” in Chapter 5) inside the detectormodule.
b. If the measuring peak is so far out of balance with thereference peak that it can no longer be adjusted withpotentiometer R3, the optical filters require re-screening. If the analyzer has been in use for some time,it is possible that the sample cell windows need cleaningor that a filter has deteriorated.Another cause of peak imbalance might be that thesample chemical background has changed. In somecases, TAI is not able to duplicate the background yoursample for purposes of optically balancing the analyzerbefore shipment. In these cases, it is necessary for you toscreen for an approximate balance, and to thenelectronically adjust R3 for precise balance. To do so:1. Reset R3 to its midpoint.2. Re-screen the filter wheel, as necessary, to obtain ameasuring voltage within 10% of the reference voltage.Every time a screen is added or removed from a filter, theanalyzer must be turned off, and the filter wheel removedfrom the analyzer. When the filter wheel is replaced in theanalyzer, its rotational position is not critical, but thewhite backing must face in the direction of the positionsensor. The filter wheel must also be securely tightened,so that no slippage or vibration can occur. See Figure 5-1.
NOTE: Refer to Figure 5-1 when installing filter screens. Screens should beinstalled in the filter disk cup, under the filter holder. Also, if a

4–8
4.0 Operations
Teledyne Analytical InstrumentsA Business Unit of Teledyne Electronic Technologies
balance ring is used, it should be placed over the screen.
c. After screening to bring the measuring voltage to within10% of the reference voltage, adjust R3 as in step aabove to make the measuring peak voltage read thesame as the reference peak voltage.
5. Turn the NORM/ZERO switch to ZERO. The analysis sectionmeter should be made to read zero by adjusting the coarseZERO control on the analysis section power module.
6. Check the control module SPAN setting to make sure it agreeswith the calibration results obtained by TAI (see SpecificApplication Data in the Appendix).
7. Adjust the ZERO control on the control module to give a zeroreading on the control module meter.
8. Add span fluid (see Span Fluid, above) to the sample cell. Makecertain that all of the zero fluid is displaced.
9. Adjust the control module SPAN control to obtain the correctmeter reading with reference to the concentration of span fluid.For example, if the sample contains 100% of whatever theinstrument is set up to analyze, then the SPAN control must beadjusted for a full scale reading, i. e., 200 ppm water in EDC.
10. Re-check the ZERO setting with zero fluid.
11. If desired, the linearity of the analyzer can be checked with afluid intermediate in concentration between the zero and thespan fluid.
12. The analyzer is now calibrated. It is often desirable to checkcalibration (fine tune) on a dynamic sample from your process,double checking the 514 analyzer response with laboratoryanalyzed grab samples. This is desirable where there is apossibility that your sample stream may have some backgroundmaterials not in the makeup of the calibration fluid.
13. From time to time, re-check the zero setting. If it is found thatthere is no zero drift, re-checking the zero setting may becomeunnecessary or may be performed only on an occasional basis.
14. Some optical filters used in some applications will be sotemperature sensitive that screening must be performed with thefilters near the operating temperature.
5–1
Maintenance & Troubleshooting 5.0
Teledyne Analytical InstrumentsA Business Unit of Teledyne Electronic Technologies
5.0 Maintenance & Troubleshooting
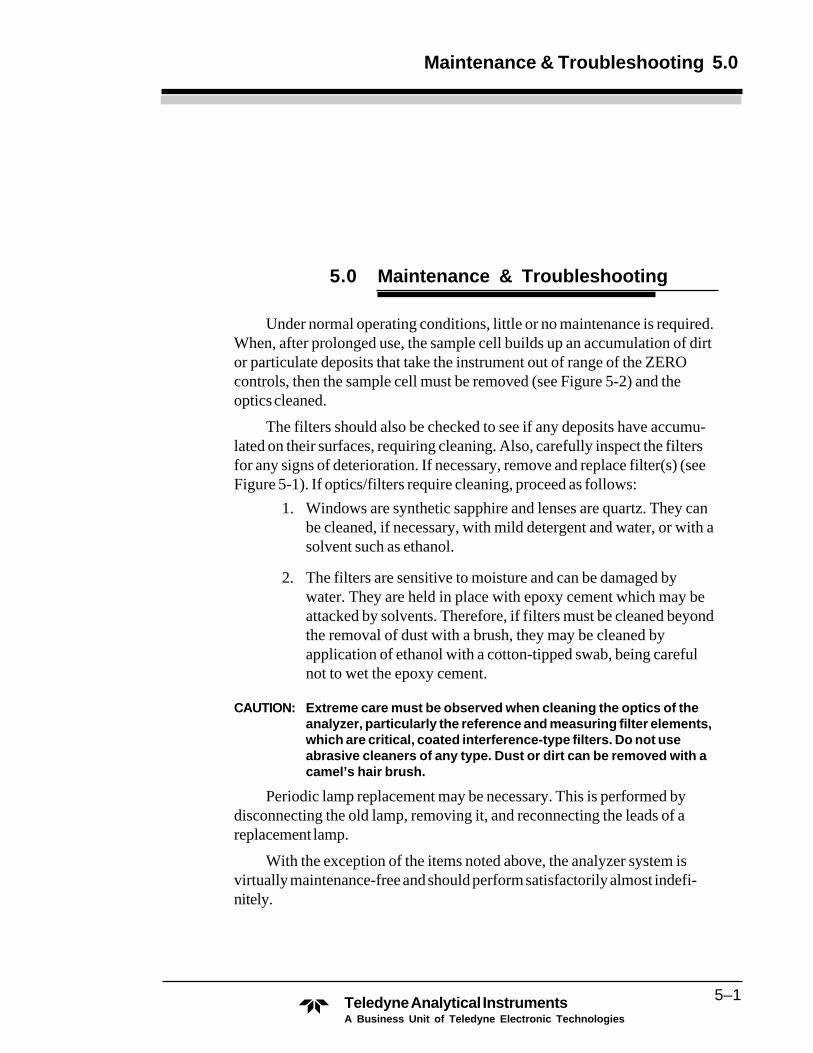
Under normal operating conditions, little or no maintenance is required.When, after prolonged use, the sample cell builds up an accumulation of dirtor particulate deposits that take the instrument out of range of the ZEROcontrols, then the sample cell must be removed (see Figure 5-2) and theoptics cleaned.
The filters should also be checked to see if any deposits have accumu-lated on their surfaces, requiring cleaning. Also, carefully inspect the filtersfor any signs of deterioration. If necessary, remove and replace filter(s) (seeFigure 5-1). If optics/filters require cleaning, proceed as follows:
1. Windows are synthetic sapphire and lenses are quartz. They canbe cleaned, if necessary, with mild detergent and water, or with asolvent such as ethanol.
2. The filters are sensitive to moisture and can be damaged bywater. They are held in place with epoxy cement which may beattacked by solvents. Therefore, if filters must be cleaned beyondthe removal of dust with a brush, they may be cleaned byapplication of ethanol with a cotton-tipped swab, being carefulnot to wet the epoxy cement.
CAUTION: Extreme care must be observed when cleaning the optics of theanalyzer, particularly the reference and measuring filter elements,which are critical, coated interference-type filters. Do not useabrasive cleaners of any type. Dust or dirt can be removed with acamel’s hair brush.
Periodic lamp replacement may be necessary. This is performed bydisconnecting the old lamp, removing it, and reconnecting the leads of areplacement lamp.
With the exception of the items noted above, the analyzer system isvirtually maintenance-free and should perform satisfactorily almost indefi-nitely.
5–2
5.0 Maintenance & Troubleshooting
Teledyne Analytical InstrumentsA Business Unit of Teledyne Electronic Technologies
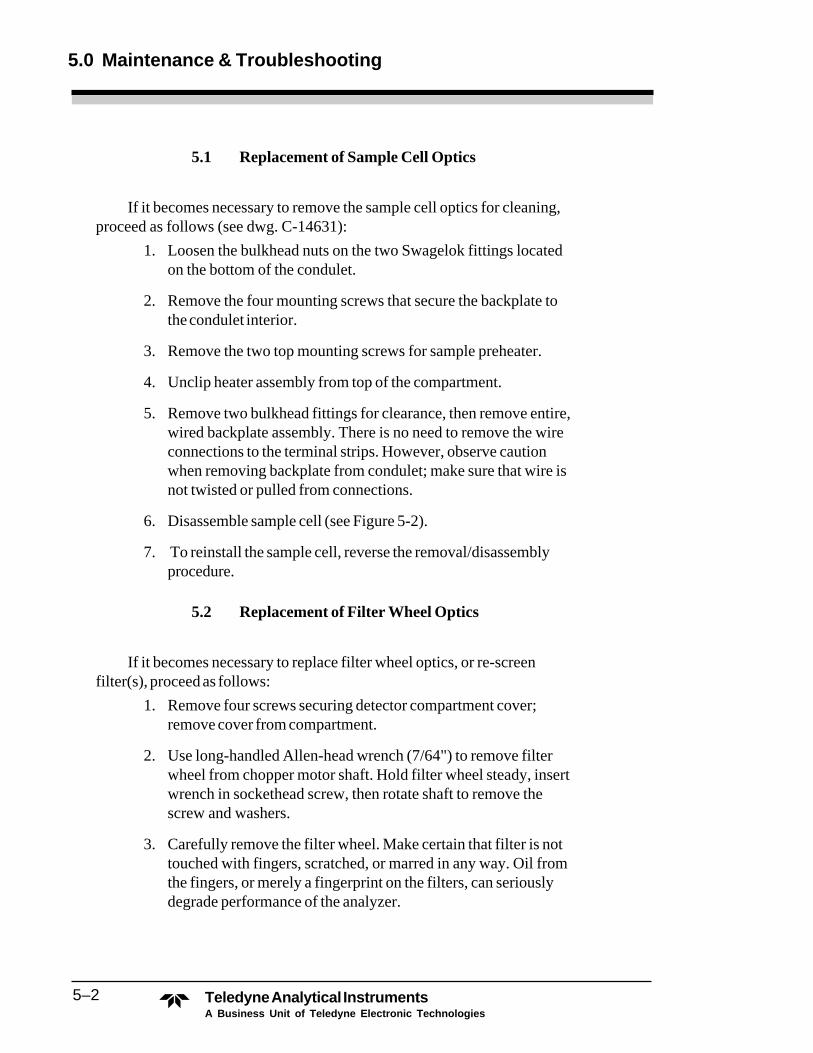
5.1 Replacement of Sample Cell Optics
If it becomes necessary to remove the sample cell optics for cleaning,proceed as follows (see dwg. C-14631):
1. Loosen the bulkhead nuts on the two Swagelok fittings locatedon the bottom of the condulet.
2. Remove the four mounting screws that secure the backplate tothe condulet interior.
3. Remove the two top mounting screws for sample preheater.
4. Unclip heater assembly from top of the compartment.
5. Remove two bulkhead fittings for clearance, then remove entire,wired backplate assembly. There is no need to remove the wireconnections to the terminal strips. However, observe cautionwhen removing backplate from condulet; make sure that wire isnot twisted or pulled from connections.
6. Disassemble sample cell (see Figure 5-2).
7. To reinstall the sample cell, reverse the removal/disassemblyprocedure.
5.2 Replacement of Filter Wheel Optics
If it becomes necessary to replace filter wheel optics, or re-screenfilter(s), proceed as follows:
1. Remove four screws securing detector compartment cover;remove cover from compartment.
2. Use long-handled Allen-head wrench (7/64") to remove filterwheel from chopper motor shaft. Hold filter wheel steady, insertwrench in sockethead screw, then rotate shaft to remove thescrew and washers.
3. Carefully remove the filter wheel. Make certain that filter is nottouched with fingers, scratched, or marred in any way. Oil fromthe fingers, or merely a fingerprint on the filters, can seriouslydegrade performance of the analyzer.

5–3
Maintenance & Troubleshooting 5.0
Teledyne Analytical InstrumentsA Business Unit of Teledyne Electronic Technologies
4. A total of six spare screens are furnished with the analyzersystem. As shown in Figure 5-1, the screens are placed under thefilters. Re-screen, as required, then reassemble filter wheel andinstall by reversing the removal/disassembly procedure. Makesure to reassemble any balance weights or, if balancing facilitiesare available, re-balance filter wheel if re-screening has resultedin a weight shift.
5. It is extremely important that the filters are notinterchanged. The measuring filter is located adjacent to thewhite arc on the filter wheel. If the filters are interchanged, meterreadings will be reversed, i. e., the meter will indicate downscalevalues instead of upscale.
5.3 Replacement of Source Lamp Assembly
The replacement source lamp assembly is installed in place with theevacuation seal oriented toward the right side of the module, i. e., away fromthe lens. Make lamp electrical connections to terminals TS1-3 and TS1-4(green leads).
After replacement, it may be necessary to adjust the lens associated withthe source lamp. Two screws secure the lens mount by means of slottedmounting holes, permitting horizontal and vertical adjustment of the lens.Likewise, the screw securing the source lamp mount can be loosened,allowing movement of the lamp for adjustment purposes. After adjustment,re-tighten all mounting screws. Make adjustments as follows:
1. Disconnect power originating in the power module (line voltageregulating transformer) by removing the leads from TS1-1 andTS1-2 in the source module.
2. Connect lamp transformer primary terminals (black, black-redleads) to a source of adjustable AC (Variac, Powerstat, etc.).
3. Energize the source lamp sufficiently to make the opticaladjustment; however, do not make source lamp illumination soexcessive that brightness can harm the eyes or make the mounttoo hot to handle.
4. Move the lamp until the light can be seen centered in the opticaltube separating the source and sample modules.

5–4
5.0 Maintenance & Troubleshooting
Teledyne Analytical InstrumentsA Business Unit of Teledyne Electronic Technologies
5. Using an oscilloscope, check the AC video signal at TP1 ofautomatic gain control card (see dwg. B-14564). Maximize thesignal output with the adjustment, then tighten all screws in thelens and lamp mounts
6. If an oscilloscope is not available, remove the filter wheel (seeFigure 5-1) and place a sheet of white paper in front of thedetector. Then adjust the lamp until the brightest, most uniformspot of light is obtained. Avoid dark spots in the middle or sides.The light shining on the detector may be viewed with a dentalmirror. Make certain that the detector is completely covered withlight.
NOTE: Do not touch the source lamp with fingers. The envelope must beclean. If necessary, clean with mild detergent and water or solvent.
5.4 Replacement of Filter Position Sensor
The filter position sensor is installed within the detector compartment;the sensor is secured to its mount by a single 4-40 screw. To replace thesensor, proceed as follows:
1. Remove the four screws securing the detector compartmentcover; remove the cover from compartment.
2. Remove mounting screw. Pull the sensor free from its mount.
3. Tag all wiring, then cut the wiring to the sensor.
4. Splice new wiring and cover with shrink tubing. The sensor“tail” should be removed so that the space between the sensorand the filter wheel is approximately 1/8 ".
5. After all wiring has been made and the spacing is correct, securefilter position sensor with 4-40 screw.
5.5 Replacement of Preamplifier Circuit Card
The preamplifier circuit card is installed inside a preamplifier subassem-bly which, in turn, is located within the detector compartment. To replace thepreamplifier circuit card, proceed as follows (see dwg. D-14665 and C-14667):
1. Remove four screws securing detector compartment cover;remove cover from compartment.

5–5
Maintenance & Troubleshooting 5.0
Teledyne Analytical InstrumentsA Business Unit of Teledyne Electronic Technologies
2. Loosen bottom nut on coaxial connector so that connector can bepulled free of the receptacle.
3. Remove mounting screw used to secure subassembly base todetector compartment interior.
4. Release the subassembly box from its mounting flange andcarefully remove it from the compartment. The two additionalconnectors are the slip-on type and can be slipped off of theirreceptacles as the subassembly is removed.
5. After the subassembly box is removed, the box can be opened forremoval of the circuit card.
6. Make certain that the slipon connectors are properly installed andthat the nut is tightened on the coaxial connector. Reverse theremoval procedure to finish reinstallation.
5.6 Re-screening of Lens
Gain resistor R4 in the preamplifier establishes the voltage output to theclamp circuit (see dwg. A-14619). The resistor is selected for the application.If there is too much light for a particular application, R4 is reduced toapproximately 1 megohm. If there is still too much light, the light path can beattenuated by installation of a screen in the lens holder, held in position bythe installed lens.
5.7 Troubleshooting
When troubleshooting the analyzer, it may be helpful to note that thereference and measuring level signals are split at the peak level detector.Thus, if one of the signals is faulty but not the other, it might be an indicationof a malfunction in the peak detector circuit card, ahead of the log amplifier.If the meter indications are the same, but too high or too low, it may be anindication that something is malfunctioning ahead of the peak detectorcircuit.
Use waveforms and voltages in this section to isolate troubles to spe-cific components or circuits.
In the event of an electronic malfunction, always check the powersupply voltages before starting a detailed troubleshooting procedure.
The voltages given in the waveform and voltage tabulations are notnecessarily exact under all operating conditions. Depending upon theapplication and various potentiometric adjustments, they may vary. They are

5–6
5.0 Maintenance & Troubleshooting
Teledyne Analytical InstrumentsA Business Unit of Teledyne Electronic Technologies
Corrective Action
Check lamp and replace, ifnecessary. After replacement,adjust optics (refer to section ×).
Check transformer at sourcelamp module; replace, if neces-sary. Check line voltage regulat-ing transformer in power mod-ule; replace, if necessary.
Check preamplifier outputsignal. Use either J3 at pream-plifier or connector pin 6 atswitch driver. Replace preampli-fier circuit card, if necessary.
Check voltage at calibrationmeter. If both voltages arewell below 9 VDC, check/replace source lamp.
Check for clamped video inputto auto. gain control (checkTP1); replace switch driver andclamp circuit card, if required.Check switch signal outputsfrom switch driver and clampcircuit card: P, P', S, and S'.
Check filter installation. Themeasuring filter should beinstalled adjacent to the whitepainted arc (see Figure 5-1).
Cause
Source lamp burned out.
Changes in voltage to sourcelamp, i.e., changes in linevoltage supply to lamp.
Preamplifier not providing astrong enough output signal.
Source lamp burned out.
Clamp circuit defective (signalnot clamped to ground).
Filters in filter wheel installedincorrectly.
Symptom
Calibration voltages near zeroon local analysis meter (lessthan standard 9 VDC).
Shift in readings at concentra-tion meter.
Noisy output at concentrationmeter (or noisy recorder trace).
Trace wanders (erratic or noisysignal at concentration meter.)
Nonlinear output as a functionof concentration of the sample;output noisy.
Concentration meter operatesbackwards; meter deflection isfrom right to left.

5–7
Maintenance & Troubleshooting 5.0
Teledyne Analytical InstrumentsA Business Unit of Teledyne Electronic Technologies
Symptom
Output goes to zero or fullscale (either extreme).
Discrepancy between re-corder trace (current) andreading on concentrationmeter.
Output drifts slowly up ordown.
Cause
E-to-I converter defective(check output transistors Q3,Q4 or Q5).
Failure of A1 IC (log amplifier) inlog amplifier circuit.
Failure of I-to-E converter.
Failure of extended voltageamplifier.
E-to-I converter defective.
Defect in temperature controllercircuitry.
Corrective Action
Check/replace, if required. Ifmeter sits on zero, also checkauto. gain control circuit card;replace, if required.
Check log amplifier for 0 to 0.4VDC full scale output. If IC A1 isreplaced, make sure thatbalance potentiometers areadjusted. Refer to Table VI.
Check input to pin 14. If input iscorrect, check output at pin 15for 0 to +4 VDC full scale.Replace I-to-E converter, ifrequired.
Check input at pin 2 and outputat pin 5. If pin 5 output voltageis not 0-1 VDC full scale output,check/replace circuit card.
Check/replace, if required. Payparticular attention to the outputtransistors (Q3, Q4 and Q5).Check/replace fuse F1, ifnecessary.
Check/replace temperaturecontroller circuit card, asrequired.

5–8
5.0 Maintenance & Troubleshooting
Teledyne Analytical InstrumentsA Business Unit of Teledyne Electronic Technologies
Secondary AdjustmentsLocation
E-to-I Converter(sch. B-14075)
E-to-I Converter(sch. B-14075)
Log Amplifier(sch. C-14907)
Log Amplifier(sch. C-14907)
Log Amplifier(sch. C-14907)
Log Amplifier(sch. C-14586)
Log Amplifier(sch. C-14586)
Log Amplifier(sch. C-14586)
Peak Level Detector(sch. B-14554)
Automatic Gain Control(sch. B-14564)
Extended Voltage Amplifier(sch. B-16221)
Extended Voltage Amplifier(sch. B-16221)
Alarm Comparator(sch. B-14718)
Ref. Desig.
Detector Module
R7(20K)
R12(500 ohms)
R15(1K)
R26(10K)
R7, R9(2K each)
R16(1K)
R36(20K)
R10, R11(2K each)
R3(10K)
P2(10K)
Control Module
R1(10K)
R5(5K)
R2(10K)
Function
Zero adjustment—adjusts output at 10mA for 0 VDC input.
Balance adjustment—adjusts output at20 mA for 0.5 VDC input.
Span adjustment (coupled with factoryselect R8 and R16)—adjusts output ofA2 for 0.4 VDC full scale.
Meter trim adjustment—adjusts meterdriver and amplifier.
Balance adjustments for logarithmicamplifier A1 (see Note 1).
Span adjustment (coupled with factoryselect R13 and R17)—adjusts output ofA7 (signal to E-to-I converter) for 0.4VDC full scale.
Meter trim adjustment—adjusts meterdriver and amplifier.
Balance adjustments for logarithmicamplifier A1 (see Note 2).
Peak level balancing adjustment—balances signal levels of reference andmeasuring voltages (on local calibrationmeter).
Reference voltage level adjustment forautomatic gain circuit—sets the voltageto whlch the auto. gain control will holdthe reference peaks. To set, switchcalibration meter to “reference” and readthe reference level on the meter. Adjustfor +9 VDC which is the nominal valueused.
Adjusts offset of Q1 amplifier.
Meter trim potentiometer.
Alarrn setpoint trim potentiometer.
5–9
Maintenance & Troubleshooting 5.0
Teledyne Analytical InstrumentsA Business Unit of Teledyne Electronic Technologies
given more as an indication of magnitudes to be expected rather than asexact values.
The troubleshooting chart cannot possibly identify all malfunctions thatmay occur. Isolate the malfunction by using the waveform/voltage informa-tion, then replace the suspected circuit card.
All schematic and and circuit assemblies are given in the Drawing Listin the Appendix.
Adjustment of R7 and R9 on Log Ratio Amplifier CircuitCard
When the log amplifier integrated circuit (A1) is replaced on the logratio amplifier circuit card, it is necessary to readjust potentiometers R7 andR9 in order to balance the circuit.
In order to make the adjustments, have an extender card, a 100Kresistor for connection between A1-2 and A1-7 (across C5), and a high-impedance voltmeter handy to measure the voltage between A1-7 andconnector pin 9.
Proceed as follows:
1. Temporarily install 100K resistor across A1-2 and A1-7 (acrossC5).
2. Disconnect connector pin 9 from 9 VDC by lifting a connectionon the extender card. Connect pin 9 of printed circuit card to A1-1 (signal common).
3. Adjust R7 until the voltage measured at A1-7 is zero.
4. Remove 100K resistor from A1-2 and
5. Reconnect connector pin 9 to 9 VDC.
6. Using a high-impedance voltmeter to measure voltages at pins 7and 9 of the card extender, adjust R3 on the peak detector circuitcard until they are equal. With the reference and measuringvoltages equal and at approximately 9 volts, adjust R9 of the logcircuit card until the voltage at A1-10 is zero.
7. The log amplifier module (A1) is now balanced.

5–10
5.0 Maintenance & Troubleshooting
Teledyne Analytical InstrumentsA Business Unit of Teledyne Electronic Technologies
Adjustment of R10 and R11 on Chopper-Stabilized LogAmplifier Circuit Card
When the log amplifier integrated circuit (A1) is replaced on thechopper-stabilized log amplifier circuit card, it is necessary to readjustpotentiometers R10 and R11 in order to balance the circuit.
In order to make the necessary adjustments, it is necessary to have anextender card, one 20KΩ resistor, and a high impedance voltmeter.
Proceed as follows:
1. Use an extender card so that connections are accessible
2. Temporarily connect a 20K resistor (stable, not composition type)between A1-2 and A1-7 (across C2).
3. Unplug A2, A3 and A5.
4. Jumper A5-7 to A5-5 at socket and A2-3 to A2-6 at socket.
5. Install card in card extender and turn on analysis unit power.
6. Verify that voltage to pin 7 of the card edge connector isapproximately 9 VDC (measure between pin 7 and pin 14).
7. Adjust potentiometer R10 until the voltage measured at A1-7 iszero with respect to signal common (TP3).
8. Remove jumpers installed in step (4).
9. Remove resistor connected in step (2).
10. Disconnect connector pin 7 from input by lifting a connection onthe extender card.
11. Temporarily connect a 20K resistor between A5-7 and A5-15 toA1-16.
12. Jumper between A5-6 and A5-7 to provide the 9 VDC through20K into A1-2 and through 20K into A1-16.
13. Adjust potentiometer R11 until the voltage measured at TP2 iszero.

5–11
Maintenance & Troubleshooting 5.0
Teledyne Analytical InstrumentsA Business Unit of Teledyne Electronic Technologies
14. The log amplifier integrated circuit (A1) is now balanced.
15. Remove the 20K resistor, the jumper, restore connections,replace ICs, then turn on the instrument power and check controlloop by measuring voltage at the output of A2. Voltage should be-3 VDC, nominal.
16. If voltage is positive, R11 is out of balance or a component in theloop has failed.
Photometric Laboratory Adjustment Procedure
Before power is supplied to the analyzer, all modules should be openedand inspected for damage or loose components also check unit for properwiring and connections. All plug in circuit cards should be removed andchecked individually for correct assembly.
Analysis Unit
Explosion-Proof Version, Control Unit: Input power connections forthis unit are at TS2 pins: 12 (ground), 13 (neutral) 14 (line) (see dwg. B-16571). The input resistance between line and neutral with ON/OFF switchin the ON position should be 4 ohms +10%. The resistance between ground-hot and ground-neutral should be infinite resistance.
General Purpose Version, Control Unit: Control unit inputpower connections are to be found at TS2 pins: 14 (line), 15 (neutral), 16(ground) (see dwg. C-15245). The input resistance between line and neutralwith ON/OFF switch in the ON position should be infinite resistance
General Purpose Version, Power Module: Power Module inputpower connections are at TS1 pins: -1 (line), -2 (neutral), -3 (ground) (seedwg. C-15245). The input resistance between line and neutral with ON/OFFswitch in the ON position should be 5 ohms +10%. The resistance betweenground-line and ground-neutral should be infinite resistance. At this point allinterconnections between the control unit and power module should bemade. The interconnections are as follows: Connect the input AC power toTS2: -14 (line), -15 (neutral), -16 (ground).
Next, a power line connection should be installed between the controlunit switch AC power in TS1: -14 (line), -15 (neutral), -16 (ground) and thepower module AC power in TS1: -1 (line), -2 (neutral), -3 (ground). Signal
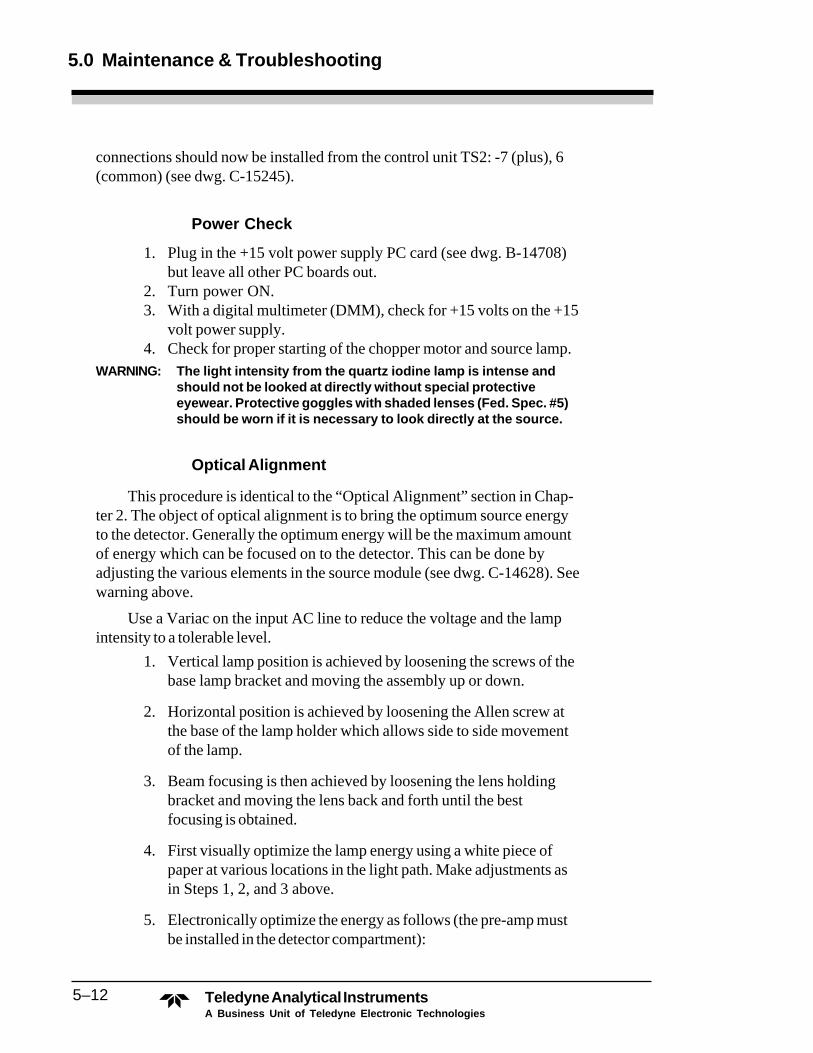
5–12
5.0 Maintenance & Troubleshooting
Teledyne Analytical InstrumentsA Business Unit of Teledyne Electronic Technologies
connections should now be installed from the control unit TS2: -7 (plus), 6(common) (see dwg. C-15245).
Power Check
1. Plug in the +15 volt power supply PC card (see dwg. B-14708)but leave all other PC boards out.
2. Turn power ON.3. With a digital multimeter (DMM), check for +15 volts on the +15
volt power supply.4. Check for proper starting of the chopper motor and source lamp.
WARNING: The light intensity from the quartz iodine lamp is intense andshould not be looked at directly without special protectiveeyewear. Protective goggles with shaded lenses (Fed. Spec. #5)should be worn if it is necessary to look directly at the source.
Optical Alignment
This procedure is identical to the “Optical Alignment” section in Chap-ter 2. The object of optical alignment is to bring the optimum source energyto the detector. Generally the optimum energy will be the maximum amountof energy which can be focused on to the detector. This can be done byadjusting the various elements in the source module (see dwg. C-14628). Seewarning above.
Use a Variac on the input AC line to reduce the voltage and the lampintensity to a tolerable level.
1. Vertical lamp position is achieved by loosening the screws of thebase lamp bracket and moving the assembly up or down.
2. Horizontal position is achieved by loosening the Allen screw atthe base of the lamp holder which allows side to side movementof the lamp.
3. Beam focusing is then achieved by loosening the lens holdingbracket and moving the lens back and forth until the bestfocusing is obtained.
4. First visually optimize the lamp energy using a white piece ofpaper at various locations in the light path. Make adjustments asin Steps 1, 2, and 3 above.
5. Electronically optimize the energy as follows (the pre-amp mustbe installed in the detector compartment):

5–13
Maintenance & Troubleshooting 5.0
Teledyne Analytical InstrumentsA Business Unit of Teledyne Electronic Technologies
a. Insert an extender card in the switch driver and clampposition. Remove keys as necessary.
b. Connect an oscilloscope to pin 6 (video from pre-amp), andpin 3 (ground).
c. Remove the lens assembly from the light path.d. Optimize lamp energy by adjusting the lamp position as
described in steps 1 and 2 above.e. Replace the lens assembly.f. Focus the lamp as described in step 3 to give the maximum
peak heights displayed on the oscilloscope.g. If a Variac was used to alter the light intensity, disconnect it
and reconnect source to power supply.
Component Selection
Each 514 is made for a specific application. Therefore each will havespecifically selected electronic and optical components. These componentvalues are selected per application by the Photometric department.
Measuring and Reference Optical FiltersThe Photometric department will supply the optical filters; mount each
filter in a filter holder (TAI P/N A1810) using 5-minute epoxy. Mount theseoptical filter assembly in the filter chopper wheel. The measuring filter ismounted on the edge of the chopper wheel with the white strip (see Fig. 5-1).
Proportional Temperature PCBTo fine tune temperature control, vary the resistance used by changing out
resistor R2 in the three boards below, which use the same schematic (see dwg.B-15016).
Detector heater: R2Space heater: R2Sample heater: R2
Pre-Amp GainTo select the gain, replace resistor R4 in schematic A-14619.
Log CardOne of three different types of log boards is selected, depending on the
application. Replace the indicated resistors on the boards noted to adjust thelogarithmic waveform.
Chopper-stabilized log PCB: R13 and R17 (See dwg. C-14586)Log ratio PCB: R8 and R16 (See dwg. C-14907)Dual log PCB: R13 and R17 (See dwg. C-17706)

5–14
5.0 Maintenance & Troubleshooting
Teledyne Analytical InstrumentsA Business Unit of Teledyne Electronic Technologies
E-to-I ConvertersAnalysis unit E-to-I (see dwg. B-14075):
0-0.5 volts in10-20 mA outR1 = 50 Ω (TAI P/N R262)
Control unit E-to-I (see dwg. B-16631): This is an optional cardcapable of providing the following outputs with 0-1 volt in andthe listed values for R1:
1. 1 to 4 mA, R1 = 250 Ω2. 4 to 20 mA, R1 = 63.5 Ω3. 10 to 50 mA, R1 = 25 Ω
Alarm Comparator (Optional)See dwg. B-14618.
Extended Voltage AmpR3 is installed for outputs greater than 1 VDC (see dwg. A-14620).
I-to-E ConverterSee dwg. A-14620.Single Range: Strap point A to point B (see dwg. B-14454). R11 is
not used for single range applications.Dual Range: Strap C to I and D to TMillivolt output (Optional): R8 and R9
Filter Position Sensor Adjustment
The filter position sensor is mounted in the detector condulet assembly(see dwg. C-14667). To adjust this sensor (power supplies installed):
1. Plug in the switch driver. Clamp the PCB into a card extenderand insert into the detection module.
2. Loosen the sensor bracket mounting screw.3. Attach an oscilloscope to circuit board connector, pin 8 of the
switch driver PCB.4. Adjust the sensor until the best sensor square wave is achieved.
Refer to Table IV at the end of this chapter.5. A further check will be done later under Automatic Gain Control.
Switch Driver and Clamp Circuit (B-14561)
Refer to Table IV at the end of this chapter. For the remainder of theadjustments in this section continue testing with the switch driver PCBattached to a card extender as described above.
5–15
Maintenance & Troubleshooting 5.0
Teledyne Analytical InstrumentsA Business Unit of Teledyne Electronic Technologies
1. Adjust the input square wave at pin 8 to be equal above andbelow ground. To accomplish this R2 must be raised or loweredin value. This is necessary for proper operation of the rest of theswitching circuit.
2. Check the following test points for proper wave forms (refer toTable IV at the end of the chapter):
a. TP4 (S). Square wave clamped to ground with +5V P-P.b. TP3 (S). Square wave clamped to ground with +5V P-P
180° out of phase with S.c. TP1 (P). Five (5) volt spikes with the tips at ground and
the base line of +5V (5V P-P).d. TP2 (P). Same as TP1 (P) except 180° out of phase.e. TP5. Clamp reset pulse. 30V P-P spike centered around
ground +15V and -15V.f. Remove the card extender and re-insert the switch driver
card in the analyzer.
Balancing the Measuring and Reference PeakHeights
For the electronic checkout the peak heights are balanced with air in thesample cell. The peak heights will later be re-balanced with sample in thesample cell, prior to chemical calibration. The peaks must be balanced within+10% in air before the electronic calibration can be accurately completed.
1. Connect an oscilloscope to pin 6 on the circuit board connectorof the switch driver PCB. The video from the pre-amp willdisplayed on the oscilloscope.
2. To determine which peak is the measuring or reference, connectanother oscilloscope lead (use a dual trace scope) to TP3 on theswitch drive PCB. The +5 volt (positive going) portion of thesquare wave will correspond to the measuring peak (see TableIV).
3. Screen the larger peak until about a +10% balance is achieved.Never screen both filters.
Automatic Gain Control (AGC) PCB
See dwg. B-14564. Insert the AGC in the detector module. Refer toTable IV for wave forms and test points (TPs).

5–16
5.0 Maintenance & Troubleshooting
Teledyne Analytical InstrumentsA Business Unit of Teledyne Electronic Technologies
1. TP1 (Violet): The clamped video should be between -0.4 to –2V P-P volts. The base line is clamped to ground. Screen theoptical beam to achieve -0.4 to -2 volts P-P.
2. At this time set the gain of amplifier A1 to approximately 100. Toaccomplish this, it is necessary that the peak level detector PCBnot be in place due to the fact that it is part of the AGC loop.
a. Connect one lead of a dual trace oscilloscope to TP2(gray), the other to TP3 (green).
b. Set the attenuation so that the signal at TP2 is attenuatedby a factor of 100 compared to the one at TP3.
c. At this point you may note that the wave form at TP3 issaturated. To get it out of saturation simply place screensin the light path until a good trace is obtained.
d. Adjust P1 until both wave forms are the same. (Note:actually 100 to 1)
3. Remove required screens in the light path to bring the voltage atTP1 (violet) back between -0.4 to -2 volts P-P. Install the peaklevel detector PCB. With the scope at TP3 of the AGC youshould see the wave form come out of saturation due to AGCcontrol.
4. Connect one input of the oscilloscope to TP5 on the SwitchDriver and clamp. Connect other input to TP3 on AGC. Thespike should be close to the halfway point between the negativegoing peaks at TP3. It does not have to be exact as long as itdoesn’t coincide with the signal. If the spike is off, move the filterwheel position sensor. If the spike falls on the signal it will clampit to ground.
5. After adjusting the sensor recheck Section 1.6, Switch Driver andClamp Circuit.
Peak Level Detector (PLD) PCB
Refer to Table IV.
1. With the oscilloscope leads at TP1 (red) and TP2 (blue) adjustR3 until the two wave forms are of equal size.
2. With an oscilloscope lead at TP3 (yellow), adjust R15 until thesquare wave is reduced to 20 mV P-P or less (best straight line).
3. Repeat step 2 with a scope lead at TP4 (orange) using R14 foradjustment.

5–17
Maintenance & Troubleshooting 5.0
Teledyne Analytical InstrumentsA Business Unit of Teledyne Electronic Technologies
4. Using a digital multimeter (DMM) at TP4 (orange) adjust P2 onthe AGC PCB until 9 volts is obtained.
5. With the meter at TP3 (yellow) adjust R3 of the peak leveldetector until 9 volts is obtained.
6. Repeat steps 3 and 4 until both TP4 and TP3 read +9.0 VDC.This represents the zero absorbance condition.
Log Amplifier PCBs
One of three different types of log boards is selected, depending on theapplication. Insert the appropriate log PCB in the analyzer, using a cardextender. The meter trim circuit adjustment (below) is common to all threelog boards. The three sections after that describe individual log amplifieradjustments.
Meter Trim Circuit AdjustmentThis adjustment calibrates the local meter so that its readings correlate
with known voltages in from the peak level detector (PLD).
General Purpose Control Unit:
1. Set the power module control functions as follows: MEAS/REFto REF, NORM/ZERO to NORM.
2. Adjust the meter trimpot until the meter reads 90% of full scale.The meter trimpot on the chopper stabilized log amp (C-14586)and the log ratio board (C-14907) is R36, and on the adjustablelog ratio board (C-14907) is R26.
3. Now turn the MEAS/REF switch to the MEAS position. Thelocal meter should read 9 VDC if the PLD adjustments wereproperly done.
Explosion Proof Control Unit:
5–18
5.0 Maintenance & Troubleshooting
Teledyne Analytical InstrumentsA Business Unit of Teledyne Electronic Technologies
With the explosion proof units, the power module ZERO, REF, andMEAS levels, and the control unit meter readout for component of interestconcentration all are read on the local meter.
1. Set the power module control functions as follows: NORM/REFto REF, NORM/MEAS to NORM and NORM/ZERO toNORM. The REF level is now displayed on the local meter.
2. Adjust the meter trimpot until the meter reads 90% of full scale.The meter trimpot or the chopper stabilized log amp (C-14586)and the log ratio board (C-14907) is R36, and on the adjustablelog ratio board (C-14907) it is R26.
3. Now switch the NORM/REF to NORM and NORM/MEAS toMEAS. Meter should now read 9 volts if the PLD balanceadjustments were properly done.
Log Ratio Amplifier Adjustments (dwg. C-14907):
When the log amplifier integrated circuit (A-1) is replaced on the logratio amplifier circuit card, it is necessary to re-adjust potentiometers R7 andR9 in order to balance the circuit. To make the adjustments, the user musthave an extender card, a 100KΩ resistor for connection between A1-2 andA1-7 (across C5), and a high impedance voltmeter to measure the voltagebetween A1-7 and connector pin 9. Proceed as follows:
1. Temporarily install a 100K resistor across A1-2 and A1-7 (acrossC5)
2. Disconnect connector pin 9 from 9 VDC by lifting a connectionon the extender card. Connect pin 9 of printed circuit card to A1-1 (signal common).
3. Adjust R7 until the voltage measured at A1-7 is zero.4. Remove 100K resistor from A1-2 and A1-7.5. Reconnect connector pin 9 to 9 VDC.6. Using a high impedance voltmeter to measure voltages at pins 7
and 9 of the card extender, adjust R3 on the peak detector circuitcard until they are equal. With the reference and measuringvoltages equal and at approximately 9 volts, adjust R9 of the logcircuit card until the voltage at A1-10 is zero.
7. The log amplifier module (A-1) is now balanced..8. The adjustment of R1 will be done during chemical calibration.
This adjustment allows fine adjustment on the gain of A2, so thatthe output of A2 will be 0 to 0.4 VDC when zero and span fluidsare passed through the analyzer.

5–19
Maintenance & Troubleshooting 5.0
Teledyne Analytical InstrumentsA Business Unit of Teledyne Electronic Technologies
9. Switch NORM/REF to REF. Adjust R36 to give 90% of scaleon the analysis section meter.
10. Switch to MEAS. Meter should read 9 VDC.
11. Switch the NORM/ZERO switch to ZERO. Adjust the courseZERO so that the meter reads zero. The ZERO control shouldend up around 500.
12. The remainder of the adjustments on this PCB must be made inby TAI Photometric personnel.
Chopper Stabilized Log AmplifierRefer to dwg. C-14586. When the log amplifier integrated circuit (A-1)
is replaced on the chopper stabilized log amplifier circuit card, it is necessaryto readjust potentiometers R10 and R11 in order to balance the circuit. Inorder to make the necessary adjustments, it is necessary to have an extendercard, one 20KΩ resistor, and a high impedance voltmeter. Proceed as fol-lows:
1. Use an extender card so that connections are accessible.
2. Temporarily connect a 20KΩ resistor (stable, not compositiontype, between A1-2 and A1-7 (across C2).
3. Unplug A2, A3 and A1.
4. Jumper A5-7 to A5-5 at socket and A2-3 to A2-6 at socket.
5. Install card in card extender and turn on analysis unit power.
6. Verify that voltage to pin 7 of the card edge connector isapproximately 9 VDC (measure between pin 7 and pin 14).
7. Adjust potentiometer R10 until the voltage measured at A1-7 iszero with respect to signal common (TP3).
8. Remove jumpers installed in step 4.
9. Remove resistor connected in step 2.
10. Disconnect connector pin 7 from input by lifting a connection onthe extender card.
11. Temporarily connect a 20K resistor between A5-7 and A5-15 toA1-16.
12. Jumper between A5-6 and A5-7 to provide the 9 VDC through20K into A1-2 and through 20K into A1-16.
5–20
5.0 Maintenance & Troubleshooting
Teledyne Analytical InstrumentsA Business Unit of Teledyne Electronic Technologies
13. Adjust potentiometer R11 until the voltage measured at TP2 iszero.
14. The log amplifier integrated circuit A-1 should now be balanced.
15. Remove the 20K resistor and the jumper. Restore connections,replace IC’s, turn on the instrument power, and check controlloop by measuring voltage at the output of A2. Voltage should be-3 VDC, nominal.
16. If voltage is positive, R11 is out of balance or a component in theloop has failed. A slight adjustment of R11 (no more than 2 or 3turns) should cause the voltage to change polarity to give therequired negative voltage at pin 6 of A2.
17. Check pins 8 and 10 on amplifier A3 for presence of +5 voltsquare wave on the oscilloscope.
18. Switch NORM/REF to REF. Adjust R36 to give 90% of scale (9VDC) on the analysis section meter.
19. Switch to MEAS. Meter should read 9 VDC.
20. Switch the NORM/ZERO switch to ZERO position. Adjust thecoarse ZERO to cause the meter to read zero. The ZERO controlshould end up around 500.
21. The remainder of the adjustments on this PCB must be made byTAI Photometric personnel
Chopper Stabilized Adjustable Log Ratio Amplifier(Dual Log Board)
See dwg. C-17706. The dual log circuit is used when it becomesnecessary to unequally balance the logarithmic waveform of the referencevoltage and the logarithmic waveform of the measuring voltage so that aninterfering, NIR absorbing, background compound can be cancelled out.When an interfering compound, in a three or more component mixture,absorbs more at the selected reference wavelength than it does at the measur-ing wavelength, the dual log PCB affords a means of balancing, and therebycancelling, these inequalities. This type of compensation is only necessary ina three or more component mixture. It is not necessary where only twocompounds are present.
1. When the adjustable log ratio board is used, disable the AGCcircuit by removing A3 and A4 on the AGC board (B-14430).

5–21
Maintenance & Troubleshooting 5.0
Teledyne Analytical InstrumentsA Business Unit of Teledyne Electronic Technologies
2. When the log amplifier integrated circuit A1 is replaced on thechopper stabilized log amplifier circuit card, it is necessary to re-adjust potentiometers R10 and R11 in order to balance the circuit.You should have on hand an extender card to help makeconnections accessible, one 20K ohm resistor, and a highimpedance voltmeter.
a. Temporarily connect a 20K resistor (stable, notcomposition type) between A1-2 and A1-7, across C2.
b. Unplug A2, A3, A5, and A9.c. Jumper A5-7 to A5-5 at the socket and A2-3 to A2-6 at
the socket.d. Install the card in the card extender and turn on the
analysis unit power.e. Verify that voltage to pin 7 of the card edge connector is
approximately 9 volts. Measure between pin 7 and pin14.
f. Adjust potentiometer R10 until the voltage measured atA1-7 is zero with respect to signal common TP3
g. Remove jumpers installed in step c.h. Remove resistor connected in step a.i. Set R34 to give 9 volts on A9-6. Also set R34 to give 9
volts on A9-14.j. Remove Q1 from its socket.k. Disconnect connector pin 7 from input by lifting a
connection on the extender card.l. Temporarily connect a 20K resistor between A5-7 and
A5-15 to A1-16.m. Jumper between A9-6 and A5-7 to provide the 9 VDC
through 20K into A1-2 and through 20K into A1-16.n. Adjust potentiometer R11 until the voltage measured at
TP2 is zero.o. The log amplifier integrated circuit A-1 is now balanced.p. Remove the 20K resistor and the jumper. Restore
connections and replace IC’s. Turn on the instrumentpower and check the control loop by measuring voltage atthe output of A2. Voltage should be -3 VDC, nominal.
q. If voltage is positive, R11 is out of balance or acomponent in the loop has failed. A slight adjustment ofR11 should cause the voltage to change polarity. Afterchecking this go back to the nominal -3 VDC byadjusting R11.

5–22
5.0 Maintenance & Troubleshooting
Teledyne Analytical InstrumentsA Business Unit of Teledyne Electronic Technologies
r. Check pins 8 and 10 on amplifier A3 for presence of +5volt square wave on scope.
s. Switch NORM/REF to REF. Adjust R36 to give 90% ofscale (9 VDC) on the analysis section meter.
t. Switch to MEAS. Meter should read 9 volts.u. Switch the NORM/ZERO switch to ZERO position.
Adjust the coarse ZERO to cause the meter to read zero.The ZERO control should end up around 500.
v. The remainder of the adjustments on this PCB must bemade by TAI Photometric personnel
E-to-I Converter for Analysis Unit
Refer to dwg. B-14075. This unit will have 10 to 20 mA output, with 0to 0.5 volts input. This means when operating at the recommended range of0 to 0.4 volts from the log PCB, the output from E-to-I PCB will be 10 to 18mA.
1. Insert this board in the analyzer using a card extender.
2. Adjust the coarse ZERO control, on the power module, for zerovolts into the E-to-I converter. Measure this voltage with a DMMat TP1 (red) on the log board or at pin 6 of the E-to-I circuitboard connector.
3. Adjust R7 to give 10 mA output between pins 1 and 13.
4. Adjust the coarse ZERO control to give 0.5 volts in at pin 6.In some cases you may not be able to adjust from 0 to 0.5 volts.Since the E-to-I board gives a linear current output with voltage,the following formula can be used to calculate the current output(I out) in mA relative to voltage in (V in)
I out = 20 (V in) + 10mA5. Adjust R12 to obtain 20 mA or the appropriate output determined
in step 4 between pins 1 and 13.
6. Repeat steps 2 through 5 until the results are reproducible.
Note: This card is the last PCB located in the detector condulet.
5–23
Maintenance & Troubleshooting 5.0
Teledyne Analytical InstrumentsA Business Unit of Teledyne Electronic Technologies
Proportional Heater PCBs
See dwg. B-15016. There are three proportional heat PCBs, all ofwhich are located in the power module.
1. There are no adjustments on this card other than the installationof R2 per desired temperature regulation (see section 5.×:Component Selection). The type and value of thermistor used isnecessary for proper selection of R2.
2. There are two ways of testing the controlling action of the PCBs.The first is a preliminary test on the board. The second tests theperformance of the board in the 514 analyzer.
a. Test the heater PCB in the “heater card test jig” in TAI’squality control area. A potentiometer on the test jig willsimulate the thermistor resistance. As this pot is varied,the lamp (simulating the analyzer heater) will turn on andoff.
b. Place the PCBs in their normal positions in the analyzerpower module. Connect a 100V neon lamp between thecase of Q1 and the positive side of C1, or across theheaters. When the heater has reached temperatureequilibrium the lamp will blink on and off at a rapid rate(fraction of a second) indicating proper proportionalcontrol. A slow blink rate (several seconds) indicates ON/OFF heat control, but improper proportional control.
Control Unit
Power Supply, +15 Volts.
To check the control unit power supply, plug in control unit +15 voltpower supply and check for +15 volts.
I-to-E Converter
See dwg. A-14620. This card has no calibration adjustments, so all thatcan be checked is proper operation at the output of A2 (circuit board pin 15),which is 0-1 volt out for an input of 10-20 mA at circuit board pin 14.
5–24
5.0 Maintenance & Troubleshooting
Teledyne Analytical InstrumentsA Business Unit of Teledyne Electronic Technologies
Extended Voltage Amplifier
See dwg. B-16221. To adjust the offset voltage of Q1:
1. Remove the I-to-E converter.
2. With zero volts into pin 2 install a meter at the output of Q1.
3. Adjust R1 for zero offset at the output of Q1.
4. Reinstall the I-to-E board.
Meter Trim & Output Voltage CalibrationFor localized explosion-proof control modules, the trim calibration is
done as in the “Meter Trim Circuit Adjustment” section under Log AmplifierPCBs.
For the General Purpose Control Unit Models:
1. Place a DMM on the output pin 6, on Q1 or circuit boardconnector pins. Set the SPAN setting to 250 or higher.
2. Adjust the coarse ZERO potentiometer on the power module togive zero volts on the DMM. The control unit meter should readzero.
3. Adjust the coarse ZERO potentiometer to give the full scaleoutput voltage on the DMM (generally 1.00 volt). If the 0-1 voltadjustment cannot be made with the coarse ZERO, increase thespan control setting.
4. Once the instrument is set for the proper output voltage, adjustR5 to make the control unit meter read exactly 100% of full scale.Check a few points in between 0 and 100% to see if the outputtracks with meter reading in a linear fashion.
Control Unit Options
E-to-I Converter
See dwg. B-16631.
1. Install R1 per current output desire (see “Control Unit E-to-I”under Component Selection). With zero volts in adjust R7 untilthe desired lower current output level is obtained.

5–25
Maintenance & Troubleshooting 5.0
Teledyne Analytical InstrumentsA Business Unit of Teledyne Electronic Technologies
2. Change the input voltage to 1 volt. Adjust R12 until the uppercurrent level is achieved.
3. Repeat 1 and 2 until repeatability is achieved.
Alarm Comparators, Single and Dual
See dwg. B-14718.
1. PCB strappings (jumper wires) for set point alarm actuation areas follows:
Dual: Above-Above: A to F & E, B to G, C to DDual: Below-Below: A to G & D, B to F, C to EDual: Above-Below: A to F & D, B to G, C to EDual: Below-Above: A to G & E, B to F, C to DSingle: Below: A to G, B to FSingle: Above: A to F, B to G
2. Single Alarm PCB: Adjust R2 until 1 volt is obtained at thefull clockwise position of P2 (setting of 1000). If the instrumentoutput of the alarm is set for 1 volt full scale the alarm is set for 1volt full scale. The alarm relay should activate or deactivatewithin +2% of the P2 dial setting.
3. Dual Alarm PCB: Same as above, except both relays shouldactivate or deactivate within +2% of P2 and P3 dial settings.

5–26
5.0 Maintenance & Troubleshooting
Teledyne Analytical InstrumentsA Business Unit of Teledyne Electronic Technologies
Photometric Laboratory CalibrationProcedure
1. Connect a recorder to the control unit.
2. Remove any screens placed over the sample cell that are in theoptical path.
3. Bolt cover on sample compartment.
4. Remove main cover from detector module to gain access to testpoints.
5. Make certain proper optical filters are in place.
6. Small detector compartment covers must be in place.
7. Turn on analyzer and recorder.
8. With an oscilloscope, check all sync. pulses on the switch driverand clamp circuit (refer to Table IV at the end of this chapter).
9. Wait one hour for warm-up.
10. Flow zero fluid into the sample cell. Lock in place. Zero fluid isthe background fluid with a minimum amount of the componentbeing measured.
11. With an oscilloscope, check the waveform at TP1 (violet).Balance measure and reference peaks heights within 20%. Theclamped video should be between -0.4 to -2 volts P-P. The baseline is clamped to ground. Change the preamplifier gain resistor,R4, to obtain -0.4 to -2 volts P-P, if necessary.
12. Connect one lead of a dual trace oscilloscope to TP2 (gray), theother to TP3 (green).
13. On the peak level detector PCB connect a DMM to TP4 (orange)and ground (any black test point). Adjust P2 on the automaticgain control PCB until 9.00 volts are obtained.
14. With the meter at TP3 (yellow) adjust R3 on the PLD until thecalculated voltage is obtained. Some calculations will have to bemade to properly calibrate the analyzer when the zero fluid is notexactly zero for the component of interest. When the zero fluid iszero for the component of interest the PLD voltage at TP3 is set

5–27
Maintenance & Troubleshooting 5.0
Teledyne Analytical InstrumentsA Business Unit of Teledyne Electronic Technologies
to 9.00 volts. When the zero fluid concentration (Cz) is someother value, proceed as follows:
Estimate the absorbance change (Afs) expected for full scalechanges in concentration. Then from the concentration of thecomponent of interest in the zero fluid (Cz) and the full scalemeter reading (Mfs) calculate the voltage setting at TP3 for thezero fluid (Vz).
log (Vz) = - (Afs) Cz 9 Mfs
Example: If Afs = 1 unitMfs = 10%Cz = 1%
Then:
log Vz = - (1) (1)9 10
log Vz 10 9 = 10-.1
Vz = (9) (0.79) = 7.15 volts15. On the chopper stabilized log board place a DMM at TP1 (red).
Adjust the coarse ZERO control on the analysis unit to give anoutput equal to (Cz/Cfs)(Vfs). Vfs equals the voltage output fromthe chopper stabilized log board for a full scale deflection, whichequals 400 mV. For example, if:
Cz = 1%Cfs = 10%
then the voltage output at TP1 will equal
(1/10)(400 mV) = 40 mV.16. Set the span control on the control unit to 500.
17. Adjust the fine ZERO control on the control unit to give a meterreading equal to Cz.
18. Re-check the peak voltages on the switch driver and clampcircuit at TP1 (violet). If the peaks have increased, it is probablydue to outgassing in the sample cell caused by improperlylocked-in sample, or by a leak in the system. Correct the problemand repeat steps 10 thru 20.

5–28
5.0 Maintenance & Troubleshooting
Teledyne Analytical InstrumentsA Business Unit of Teledyne Electronic Technologies
19. Fill the sample cell with span fluid. Turn unit off, removechopper stabilized log board and place it on an extender board.Turn the unit back on and adjust R16 on the chopper stabilizedlog board to give a voltage at TP1 (red) equal to:
(Cs - Cz) VfsMfs
where Vfs is the voltage output from TP1 for full scale deflection,which equals 400 mV.
Example: If Cs = 8%Cz = 1%Mfs = 10%
Then:
Voltage output at TP1 = 8-1 (400 mV)10
= 280 mVSet the SPAN control (on the control module) to give a meterreading of
Cs - Cz20. Adjust the coarse ZERO control on the analysis unit until the
voltage at TP1 (red) is equal to:
(Cs/Mfs)Vfs
21. Record the following data:
a. VDC on PLD, TP3 and TP4b. VDC on chopper stabilized log operator, TP1 (red)c. AC P-P on chopper stabilized log operator, TP2 (yellow)d. AC P-P on automatic gain control PCB TP1 (violet)e. Control unit meter readout.
22. An oscilloscope on TP2 (yellow) will display a 400 Hz squarewave. If this peak-to-peak voltage is less than 100 mV, decreasethe value of R13 (which will be 1KΩ for most applications). Ifthe P-P voltage is greater than 0.4 volts, increase the value ofR13. If the voltage is still above 0.4 volts, the cell spacer must bedecreased, or other optical filters selected.
23. With a DMM on the log PCB TP1 (red) record VDC. If it isbelow 0.2 volts, adjust R16; increase R17 if you run out ofadjustment with R16. If the voltage is higher than 0.4 volts,

5–29
Maintenance & Troubleshooting 5.0
Teledyne Analytical InstrumentsA Business Unit of Teledyne Electronic Technologies
adjust R16; decrease R17 if you run out of adjustment with R16.The actual limit is 0.5 volts, with 0.4 volts giving some leeway.The log circuit will give accurate results for much higher voltage(as high as 4 volts), but the next stage (E-to-I) will not beaccurate above 0.5 volts in.
24. As a check go back to the zero fluid. The meter should read thecorrect zero fluid concentration. Record the data points as in step23.
25. Lock zero fluid in the sample cell. Run overnight stability.Visually inspect the sample cell for bubbles, indicating sampleoutgassing and cell leakage. Stability can also be run byremoving the liquid from the sample cell, and drying out the cellwith acetone followed by dry nitrogen or air purging. Screen theoptical path to obtain the same P-P voltages (as when liquid wasin the cell) at TP1 (violet) on the automatic gain control PCB.Purge with dry gas continuously.
Reference Filter
Measuring Filter
White Enamel
Chopper MotorShaft
Screen
Balance Ring
Reference Filter
Measuring Filter
Rotated 180 Degrees
Figure 5-1. Filter Wheel - Exploded View
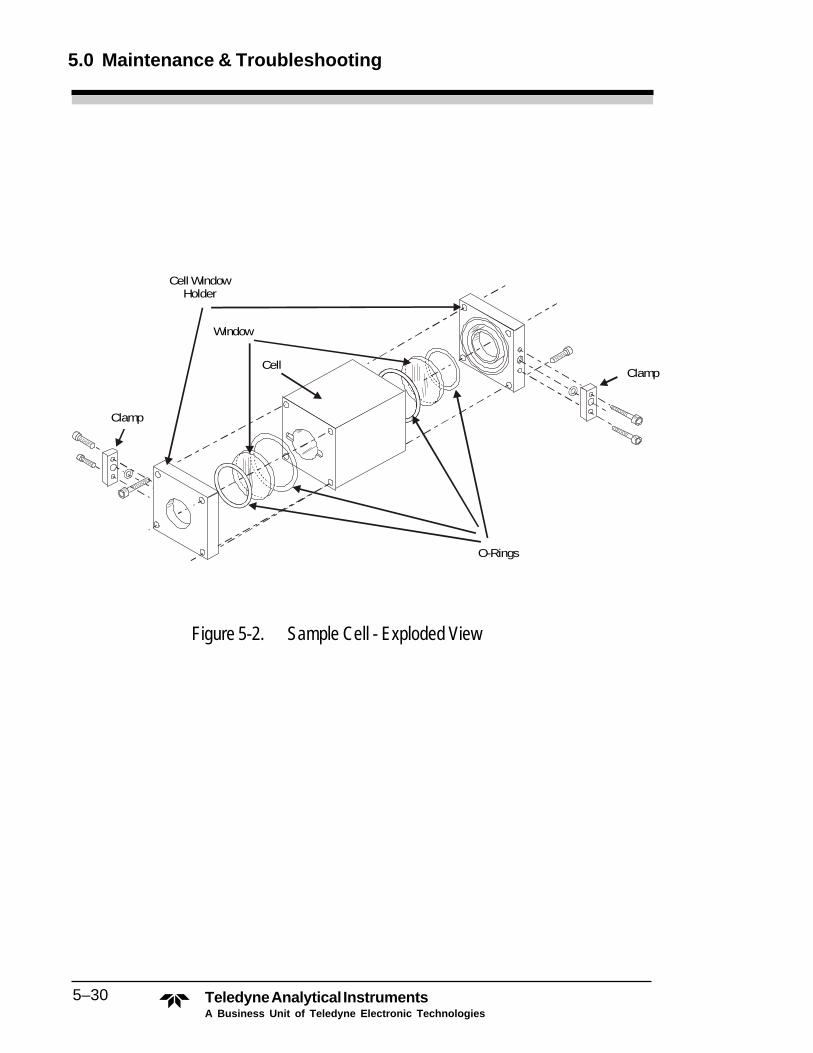
5–30
5.0 Maintenance & Troubleshooting
Teledyne Analytical InstrumentsA Business Unit of Teledyne Electronic Technologies
O-Rings
Window
Clamp
Clamp
Cell
Cell WindowHolder
Figure 5-2. Sample Cell - Exploded View

A–1
Appendix
Teledyne Analytical InstrumentsA Business Unit of Teledyne Electronic Technologies
Appendix
Specifications
Accuracy: ±2% full scale or betterReproducibility: ±1% full scale or better
Noise: Less than ±1%Drift: Less than 1% per day
Diurnal: Less than 1% per daySensitivity: 0.02 to 1.5 absorbance units
Electronic Response: 90% in 10 secondsLight Source: Quartz iodine lamp
Filter Wavelengths: 1.0 to 2.8 micronsSample Cell: Stainless steel with sapphire windows,
standard; others available;length per application
Flow Rate: Typically 50-200 cc/min. (dependingupon application)
Ambient Temperature: 0° to 50° C (without available auxiliaryheating).
Electrical Requirements: 115 VAC, 60 Hz (standard)Readout Device: Meter on control module
Analog Output Signal: 0-1 V (standard)
Options Designated by Model # SuffixB1: Local Explosion Proof Control UnitB2: Remote Explosion-proof Control Unit
I5, I20 or I50: Current OutputsS1 or S2: One or Two Alarm Circuits
K5, K10 or K100: Millivolt Output SignalsE5 or E10: Voltage Outputs in lieu of 0 to 1 V output
D: Dual RangeA: Automatic Zero
O5, O20 or O50: Optically Isolated Current Outputs(explosion-proof control unit only)

A–2
Appendix
Teledyne Analytical InstrumentsA Business Unit of Teledyne Electronic Technologies
Specific Application Data
StatisticsCustomer Order No.: _________________________________________TAI Sales Order No.: _________________________________________
Equipment Model Nos.: _________________________________________Analyzer: _________________________________________System: _________________________________________
Analyzer Serial No.: _________________________________________
AnalysisComponent of Interest: _________________________________________
Range 1: ______________________ Range 2: ___________Background: _________________________________________
Start-up ZERO setting: __ Coarse _____________ Fine ______________Start-up SPAN setting: _________________________________________
Noise: _________ Linearity: ___________ Diurnal: _____
OpticsSource: _________________________________________
Measuring CellLength: _________________________________________
MaterialsSpacer: _________________________________________O-Ring: _________________________________________
Windows: _________________________________________
TemperaturePreheater: _________ °C Space Heater: __________ °C
Optical Filters:Measuring Wavelength: _________ µ, 1/2 BW __________ TAI #:_______Reference Wavelength: _________ µ, 1/2 BW __________ TAI #:_______
Detector Type: _________________________________________Detector Compartment Temperature: ________ °C
Meter Dial Marking: _________________________________________Output Signals: _________ mV _________ V ___________ I
_________ Iso I
Alarms:Mode: Relays energized above or below setpoint
ABOVE BELOWNo. 1
No. 2

A–3
Appendix
Teledyne Analytical InstrumentsA Business Unit of Teledyne Electronic Technologies
Drawing List
Circuit Connection DrawingsSource Module A-14704Sample Module A-14703Detector Module C-14581Power Module (for Explosion-Proof Control Unit) C-14746Power Module (for General Purpose Control Unit) C-14731Control Module (Explosion Proof) C-15829
C-15695Control Module (General Purpose) C-14691
Outline DrawingsAnalysis Unit w/Explosion-Proof Control Unit D-18308General Purpose Control Unit C-16801Analysis Unit D-18307Source Module Assembly C-14628Sample Module Assembly C-17356Detector Module Assembly D-14665Detector Box Subassembly C-14667Analyzer System Outline w/Integral
Explosion-Proof Control Unit C-15644Analysis Unit Outline C-18313Control Unit Outline General Purpose B-15066
Electrical-Power ModuleProportional Temperature Controller Sch. B-15016Proportional Temperature Controller Assy. B-14449
Electrical-Control ModuleI-to-E Converter Sch. A-14620I-to-E Converter Assy. B-14454Alarm Comparator Sch. B-14718Alarm Comparator Assy. A-9309Extended Voltage Amplifier Sch. B-16221Extended Voltage Amplifier Assy. A-15163E-to-I Converter Sch. B-16631E-to-I Converter Assy. B-14702Auto Zero/Ext. Voltage Ampl. Sch. B-14729Automatic Zero Assy. A-16888

A–4
Appendix
Teledyne Analytical InstrumentsA Business Unit of Teledyne Electronic Technologies
Drawing List, Continued
Electrical-Detector ModulePreamplifier Sch. A-14619Preamplifier Assy. A-14505Switch Driver and Clamp Sch. B-14561Switch Driver and Clamp Assy. B-14434Automatic Gain Control (AGC) Sch. B-14564Automatic Gain Control (AGC) Assy. B-14430Peak Level Detector, Sample and Hold Sch. B-14554Peak Level Detector, Sample and Hold Assy. B-14441Chopper-Stabilized Log Amplifier Sch. C-14586Chopper-Stabilized Log Amplifier Assy. B-14579Log Ratio Amplifier Sch. C-14907Log Ratio Amplifier Assy. B-14083E-to-I Converter Sch. B-14075E-to-I Converter Assy. B-14453
Electrical-Power SupplyRegulated Power Supply Sch. B-14708Regulated Power Supply Assy. A-9306
Interconnection DiagramsAnalyzer System (w/Explosion-Proof Control Unit) B-16571Analyzer System (w/General Purpose Control Unit) C-15245
Spare Parts List
QTY P/N DESCRIPTIONPower Condulet Assembly
5 F11 Fuse, 5 A3 B14449 Printed Circuit Card Assembly, Temperature Controller
Control Unit Assembly
1 A9306 Printed Circuit Card Assembly, Power Supply1 B14454 Printed Circuit Card Assembly, I/E Converter1 A9309 Printed Circuit Card Assembly, Alarm Comparator (if
equipped with alarm option)1 B14702 Printed Circuit Card Assembly, E/I Converter (if
equipped with current output option)

A–5
Appendix
Teledyne Analytical InstrumentsA Business Unit of Teledyne Electronic Technologies
1 A16888 Printed Circuit Card Assembly, Auto Zero/Meter Driver(if equipped with automatic zero)
1 A15163 Printed Circuit Card Assembly, Extended VoltageAmplifier (if not equipped with automatic zero)
1 O84 Optically Isolated E/I Converter Assembly (ExplosionProof only)
5 F11 Fuse, 5 ADetector Condulet Assembly
1 A9306 Printed Circuit Card Assembly, Power Supply1 B14430 Printed Circuit Card Assembly, AGC1 B14434 Printed Circuit Card Assembly, Switch Driver1 B14441 Printed Circuit Card Assembly, Peak Level Detector1 B14453 Printed Circuit Card Assembly, E/I Converter1 B14083 Printed Circuit Card Assembly, Log Ratio Module
or1 B14579 Printed Circuit Card Assembly, Chopper Stabilized Log
Amplifier1 S239 Filter Position Sensor1 T174 Thermistor1 B14668 Detector Cell Assembly1 A14505 Printed Circuit Card Assembly, Preamplifier1 D60976 Power Supply Assembly
A minimum charge is applicable to spare parts orders.
IMPORTANT: Orders for replacement parts should include the part numberand the model and serial number of the system for which theparts are intended.
Send orders to:TELEDYNE ANALYTICAL INSTRUMENTS16830 Chestnut StreetCity of Industry, CA 91749-1580Telephone: (626) 934-1500TWX: (910) 584-1887 TDYANYL COIDFAX: (626) 961-2538Web: www.teledyne-ai.comor your local representative

A–6
Appendix
Teledyne Analytical InstrumentsA Business Unit of Teledyne Electronic Technologies


