Mode group diversity multiplexing in multimode fiber ... · Mode group diversity multiplexing in...
147
Mode group diversity multiplexing in multimode fiber transmission systems Citation for published version (APA): Tsekrekos, C. P. (2008). Mode group diversity multiplexing in multimode fiber transmission systems. Eindhoven: Technische Universiteit Eindhoven. https://doi.org/10.6100/IR632346 DOI: 10.6100/IR632346 Document status and date: Published: 01/01/2008 Document Version: Publisher’s PDF, also known as Version of Record (includes final page, issue and volume numbers) Please check the document version of this publication: • A submitted manuscript is the version of the article upon submission and before peer-review. There can be important differences between the submitted version and the official published version of record. People interested in the research are advised to contact the author for the final version of the publication, or visit the DOI to the publisher's website. • The final author version and the galley proof are versions of the publication after peer review. • The final published version features the final layout of the paper including the volume, issue and page numbers. Link to publication General rights Copyright and moral rights for the publications made accessible in the public portal are retained by the authors and/or other copyright owners and it is a condition of accessing publications that users recognise and abide by the legal requirements associated with these rights. • Users may download and print one copy of any publication from the public portal for the purpose of private study or research. • You may not further distribute the material or use it for any profit-making activity or commercial gain • You may freely distribute the URL identifying the publication in the public portal. If the publication is distributed under the terms of Article 25fa of the Dutch Copyright Act, indicated by the “Taverne” license above, please follow below link for the End User Agreement: www.tue.nl/taverne Take down policy If you believe that this document breaches copyright please contact us at: [email protected] providing details and we will investigate your claim. Download date: 07. Apr. 2020
Transcript of Mode group diversity multiplexing in multimode fiber ... · Mode group diversity multiplexing in...

Mode group diversity multiplexing in multimode fibertransmission systemsCitation for published version (APA):Tsekrekos, C. P. (2008). Mode group diversity multiplexing in multimode fiber transmission systems. Eindhoven:Technische Universiteit Eindhoven. https://doi.org/10.6100/IR632346
DOI:10.6100/IR632346
Document status and date:Published: 01/01/2008
Document Version:Publisher’s PDF, also known as Version of Record (includes final page, issue and volume numbers)
Please check the document version of this publication:
• A submitted manuscript is the version of the article upon submission and before peer-review. There can beimportant differences between the submitted version and the official published version of record. Peopleinterested in the research are advised to contact the author for the final version of the publication, or visit theDOI to the publisher's website.• The final author version and the galley proof are versions of the publication after peer review.• The final published version features the final layout of the paper including the volume, issue and pagenumbers.Link to publication
General rightsCopyright and moral rights for the publications made accessible in the public portal are retained by the authors and/or other copyright ownersand it is a condition of accessing publications that users recognise and abide by the legal requirements associated with these rights.
• Users may download and print one copy of any publication from the public portal for the purpose of private study or research. • You may not further distribute the material or use it for any profit-making activity or commercial gain • You may freely distribute the URL identifying the publication in the public portal.
If the publication is distributed under the terms of Article 25fa of the Dutch Copyright Act, indicated by the “Taverne” license above, pleasefollow below link for the End User Agreement:www.tue.nl/taverne
Take down policyIf you believe that this document breaches copyright please contact us at:[email protected] details and we will investigate your claim.
Download date: 07. Apr. 2020

Mode group diversity multiplexing inmultimode fiber transmission systems
Christos P. Tsekrekos

Mode group diversity multiplexing inmultimode fiber transmission systems
PROEFSCHRIFT
ter verkrijging van de graad van doctor aan deTechnische Universiteit Eindhoven, op gezag van de
Rector Magnificus, prof.dr.ir. C.J. van Duijn, voor eencommissie aangewezen door het College voor
Promoties in het openbaar te verdedigenop maandag 14 januari 2008 om 16.00 uur
door
Christos Panagiotis Tsekrekos
geboren te Cholargos, Griekenland
Dit proefschrift is goedgekeurd door de promotoren:
prof.ir. A.M.J. Koonenenprof.dr.ir. J.W.M. Bergmans
Copromotor:dr.ir. B.P. de Hon
The work described in this thesis was performed in the Faculty of Electrical Engi-neering of the Eindhoven University of Technology and was financially supportedby the Freeband Impulse Program of the Ministry of Economic Affairs of theNetherlands.
CIP-DATA LIBRARY TECHNISCHE UNIVERSITEIT EINDHOVEN
Tsekrekos, Christos P.
Mode group diversity multiplexing in multimode fiber transmission systems / byChristos Panagiotis Tsekrekos. - Eindhoven : Technische Universiteit Eindhoven,2008.Proefschrift. - ISBN 978-90-386-1724-4NUR 959Trefw.: optische telecommunicatie / breedbandcommunicatie / vezeloptica / lokalecomputernetwerken.Subject headings: optical fibre communication / MIMO systems / polymer fibres/ local area networks.
Copyright c© 2008 by Christos P. TsekrekosAll rights reserved. No part of this publication may be reproduced, stored in a re-trieval system, or transmitted in any form or by any means without the prior writ-ten consent of the author.
Typeset using LATEX, printed in the Netherlands.

to my parents Panagiotis and Zoeand my sisters Maria and Eleni

Summary
Mode group diversity multiplexing in multimode fiber trans-mission systems
Multimode fibers (MMFs) and particularly graded-index (GI) MMFs are widelyemployed in campus and in-building networks. MMF is also considered to be aninteresting option for future optical in-house networks. Next to silica-based MMF,polymer optical fiber (POF) may be an interesting option due to its large coreand the flexibility of the polymer material that facilitate handling and installationin ducts. MMF connections can offer a larger bandwidth compared to electricalwireless and copper-based ones. Light in an MMF propagates in several spatialmodes. The bandwidth of MMF links is limited by modal dispersion, which orig-inates in the differential propagation delay of the modes. At the same time, thesespatial modes offer extra degrees of freedom that can be exploited in transmission.
Most MMF systems use light intensity modulation and direct detection (IM-DD). IM-DD is the simplest way of building an optical communication link. Anorthogonality relation exists for the fields of the propagating modes of an MMF.Nothing similar, though, holds for the intensity profiles of the modes. Any effortto exploit the spatial modes should be simple and pragmatic, since MMFs areused in short-range applications where simplicity and low cost are key issues. Thedevelopment of multiple-input multiple-output techniques in wireless communica-tions has triggered similar research in transmission over MMFs. Several schemeshave been so far proposed, mode group diversity multiplexing (MGDM) being oneof them. MGDM creates parallel, independent communication channels, transpar-ent to the transmission format, using groups of the propagating modes. MGDMuses IM-DD, but it does not require orthogonality among the intensity profilesof the detected mode groups, since it mitigates cross-talk — due to the lack oforthogonality — with electronic signal processing.
To the author’s knowledge, this is the first doctoral thesis to present a theoreti-cal and experimental investigation of the MGDM technique. This thesis primarilydeals with the optical aspects of MGDM transmission over GI-MMFs. A mathe-matical model is developed and the conditions under which a broadband MGDMsystem can be described by a real-valued transmission matrix are identified. Thismatrix relates the electrical output to the electrical input signals of the system.In the most general case, irrespective of the amount of spatial overlap among thefields of the detected mode groups, these fields should be mutually incoherent. The
iv
real-valued transmission matrix expresses the spatial overlap among the intensityprofiles of the detected mode groups and cannot compensate for differential delays.Therefore, the MGDM system should operate below the dispersion limit. Further,the effect of noise is studied, considering matrix inversion as the demultiplexingalgorithm in line with the requirement of signal format transparency.
A major objective of this thesis is to show that it is possible to build a simple,stable and robust MGDM system. Guidelines for the design of such a system aredrawn and concrete conclusions are obtained that can be used for the design andmanufacture of an MGDM multi/demultiplexer. Numerical simulations supportthe experimental observation that propagation in silica-based GI-MMFs does notaffect the design of the multi/demultiplexer for at least 1 km of propagation. Thecase of GI-POFs differs in that mode mixing is stronger and therefore the transmis-sion matrix of a GI-POF-based MGDM system depends strongly on the GI-POFlength. Further, GI-POF is more sensitive to bending and stressing. A stabletwo-input, two-output MGDM link with silica-based GI-MMF is demonstrated,using components originally made for other applications.
The proposed design approach for an MGDM system benefits from the all-electronic mitigation of cross-talk. However, it lacks scalability with the number ofchannels. More specifically, although it would be possible to build a robust systemwith two or three channels, for a larger number of channels, the performance of thesystem would become very sensitive to changes in the transmission matrix. Therobustness of the system depends on the condition number of the transmissionmatrix. The ideal case is a system without cross-talk, i.e. a system characterizedby the identity matrix. To increase the robustness of an MGDM system andallow for a larger number of channels, mode-selective spatial filtering (MSSF) isintroduced and demonstrated.
MSSF is a new optical technique, first proposed in the framework of the re-search presented in this thesis. It only requires an imaging system, e.g. a lens, toproject the near-field intensity pattern at the GI-MMF output facet onto the de-tectors of the MGDM system. The numerical aperture (NA) of the imaging systemat the side of the output facet of the GI-MMF should be smaller than the centralNA of the GI-MMF. MSSF provides an optical way to mitigate cross-talk. For asystem with up to three channels, MSSF could eliminate the need for electronicdemultiplexing. Further, a robust five-channel MGDM system can be realizedwith MSSF and partial electronic cross-talk mitigation. MSSF greatly relaxes therequirement of mutual incoherence among the fields of the mode groups at theoutput end of the GI-MMF and hence it facilitates the combination of MGDMwith wavelength division multiplexing.
The results presented in this thesis offer insight into light propagation in GI-MMFs and give a new perspective in the use of the propagating modes of GI-MMFsfor transmission applications. So far, a stable, robust and transparent five-channelmodal multiplexing system would only have seemed fanciful. However, this thesisshows the way of turning such a scenario into a practical reality.

Contents
Summary iii
1 Introduction 11.1 Multimode fiber telecommunication systems . . . . . . . . . . . . . 1
1.1.1 Campus and in-building networks . . . . . . . . . . . . . . . 21.1.2 Transparent in-house networks . . . . . . . . . . . . . . . . 31.1.3 Optical interconnects . . . . . . . . . . . . . . . . . . . . . . 4
1.2 Multimode fibers . . . . . . . . . . . . . . . . . . . . . . . . . . . . 41.2.1 Basic properties . . . . . . . . . . . . . . . . . . . . . . . . 41.2.2 Silica- and polymer-based MMFs . . . . . . . . . . . . . . . 7
1.3 Multiplexing techniques . . . . . . . . . . . . . . . . . . . . . . . . 81.3.1 WDM, SCM, TDM, PDM and CDM . . . . . . . . . . . . . 91.3.2 Wireless MIMO techniques . . . . . . . . . . . . . . . . . . 101.3.3 Modal multiplexing techniques . . . . . . . . . . . . . . . . 11
1.4 Mode group diversity multiplexing . . . . . . . . . . . . . . . . . . 121.5 Outline of the thesis . . . . . . . . . . . . . . . . . . . . . . . . . . 14
2 Model of an M ×N MGDM system 172.1 Introduction . . . . . . . . . . . . . . . . . . . . . . . . . . . . . . . 172.2 Linearity of an MGDM link . . . . . . . . . . . . . . . . . . . . . . 18
2.2.1 Propagation in MMFs . . . . . . . . . . . . . . . . . . . . . 182.2.2 Spatially selective detection . . . . . . . . . . . . . . . . . . 20
2.3 An experimental example of non-linear system response . . . . . . 212.4 The effect of noise on an MGDM system . . . . . . . . . . . . . . . 22
2.4.1 Power penalty due to additive thermal and shot noise . . . 232.4.2 Modal noise . . . . . . . . . . . . . . . . . . . . . . . . . . . 252.4.3 Relative intensity noise . . . . . . . . . . . . . . . . . . . . 25
2.5 Bandwidth limitations . . . . . . . . . . . . . . . . . . . . . . . . . 262.6 The relation between M and N . . . . . . . . . . . . . . . . . . . . 272.7 Conclusions . . . . . . . . . . . . . . . . . . . . . . . . . . . . . . . 28

vi CONTENTS
3 Design of an N ×N MGDM link 293.1 Selective excitation of GI-MMFs . . . . . . . . . . . . . . . . . . . 293.2 A link with radially offset input beams . . . . . . . . . . . . . . . . 30
3.2.1 Experimental NFP at the GI-MMF output . . . . . . . . . 313.2.2 Transmission matrix and cross-talk estimation . . . . . . . 33
3.3 Introducing an angular offset . . . . . . . . . . . . . . . . . . . . . 353.4 Cross-talk and power penalty minimization . . . . . . . . . . . . . 373.5 Sensitivity to misalignments . . . . . . . . . . . . . . . . . . . . . . 393.6 Passive optical components . . . . . . . . . . . . . . . . . . . . . . 39
3.6.1 Topologies of local area networks . . . . . . . . . . . . . . . 393.6.2 Experimental results . . . . . . . . . . . . . . . . . . . . . . 41
3.7 Conclusions . . . . . . . . . . . . . . . . . . . . . . . . . . . . . . . 44
4 Near-field pattern of silica GI-MMFs with restricted excitation 454.1 Selective excitation of GI-MMFs with an SMF . . . . . . . . . . . 454.2 Experimental investigation . . . . . . . . . . . . . . . . . . . . . . . 464.3 Numerical investigation . . . . . . . . . . . . . . . . . . . . . . . . 48
4.3.1 Differential mode delay . . . . . . . . . . . . . . . . . . . . 484.3.2 Mode mixing . . . . . . . . . . . . . . . . . . . . . . . . . . 494.3.3 Differential mode attenuation . . . . . . . . . . . . . . . . . 504.3.4 Results . . . . . . . . . . . . . . . . . . . . . . . . . . . . . 51
4.4 Refractive index profile defects . . . . . . . . . . . . . . . . . . . . 534.4.1 Modeling . . . . . . . . . . . . . . . . . . . . . . . . . . . . 534.4.2 Results . . . . . . . . . . . . . . . . . . . . . . . . . . . . . 58
4.5 Conclusions . . . . . . . . . . . . . . . . . . . . . . . . . . . . . . . 59
5 A stable 2× 2 MGDM system 615.1 Introduction . . . . . . . . . . . . . . . . . . . . . . . . . . . . . . . 615.2 The impact of variations of the transmission matrix . . . . . . . . 625.3 Experimental setup . . . . . . . . . . . . . . . . . . . . . . . . . . . 635.4 Measurements of the transmission matrix . . . . . . . . . . . . . . 655.5 Electrical cross-talk after demultiplexing . . . . . . . . . . . . . . . 675.6 Linearity and distortion in the 2× 2 MGDM link . . . . . . . . . . 69
5.6.1 Signal distortion . . . . . . . . . . . . . . . . . . . . . . . . 695.6.2 System response . . . . . . . . . . . . . . . . . . . . . . . . 70
5.7 Analog transmission . . . . . . . . . . . . . . . . . . . . . . . . . . 745.7.1 Non-adaptive demultiplexing . . . . . . . . . . . . . . . . . 765.7.2 Adaptive demultiplexing . . . . . . . . . . . . . . . . . . . . 78
5.8 Conclusions . . . . . . . . . . . . . . . . . . . . . . . . . . . . . . . 78
CONTENTS vii
6 Mode-selective spatial filtering 816.1 Introduction . . . . . . . . . . . . . . . . . . . . . . . . . . . . . . . 816.2 Transmission impairments in MGDM systems . . . . . . . . . . . . 826.3 MSSF principle . . . . . . . . . . . . . . . . . . . . . . . . . . . . . 836.4 Experimental results . . . . . . . . . . . . . . . . . . . . . . . . . . 856.5 A 2× 2 MGDM link with MSSF . . . . . . . . . . . . . . . . . . . 876.6 Conclusions . . . . . . . . . . . . . . . . . . . . . . . . . . . . . . . 89
7 MGDM in GI-POF links 937.1 Introduction . . . . . . . . . . . . . . . . . . . . . . . . . . . . . . . 937.2 PMMA- and PF-based GI-POFs . . . . . . . . . . . . . . . . . . . 947.3 Selective excitation of PMMA-based GI-POFs with an SMF . . . . 957.4 Conclusions . . . . . . . . . . . . . . . . . . . . . . . . . . . . . . . 101
8 Conclusions and recommendations 1038.1 Conclusions . . . . . . . . . . . . . . . . . . . . . . . . . . . . . . . 1038.2 Recommendations for further research . . . . . . . . . . . . . . . . 107
References 109
A List of Acronyms 121
B List of Publications 123
Samenvatting 127
Acknowledgements 131
Curriculum Vitæ 133

Chapter 1
Introduction
This dissertation presents an investigation of the mode group diversity multi-plexing (MGDM) technique. MGDM is an intensity-modulation, direct-detection,multiple-input, multiple-output transmission method. It creates parallel, indepen-dent communication channels over a multimode fiber (MMF). This chapter pro-vides an introduction to the area of interest in which MGDM falls. In particular,it is the purpose of this chapter to introduce MMFs, to describe applications whereMMFs are used, to present multiplexing techniques that can be used in MMF trans-mission and to give the main characteristics of MGDM.
1.1 Multimode fiber telecommunication systems
Telecommunications is one of the major fields of technology where human activ-ities have focused. The need to communicate is vital in human activities. Forexample, in the case of research and development, it would seem impossible toachieve any progress whatsoever, without sufficiently communicating the alreadyknown results. In this case, communications facilitate the transfer of knowledgeand experience. In our information-based societies, advanced telecommunicationtechnologies are a prerequisite for economic growth.
Telecommunication systems are characterized by their geographical range. Theyspan from very short interconnections between chips or equipment to long-haultransoceanic links. Optical fiber communications offer a very attractive solutionfor a telecommunication infrastructure. Optical systems enable high-speed andreliable communications. They can be very diverse and can be found in manydifferent applications. The international undersea network uses fiber optics sys-tems [1]. The same can hold for intercity, metropolitan, campus, in-building orautomobile systems and networks. In access networks, fiber to the home/fiber tothe premises (FTTH/FTTP) appears as a very promising solution to meet therequirements of broadband communications [2].
2 Introduction
Campus Backbone Fiber (USA)
SMF9,5%
GI-MMF 62.5/12581,5%
GI-MMF 50/1259,0%
In-building Backbone Fiber (USA)
SMF0,8% GI-MMF 50/125
9,8%
GI-MMF 62.5/12589,4%
In-building Backbone Fiber (Western Europe)
SMF0,5%
GI-MMF 62.5/12565,0%
GI-MMF 50/12534,5%
Campus Backbone Fiber (Western Europe)
SMF4,8%
GI-MMF 62.5/12562,3%
GI-MMF 50/12532,9%
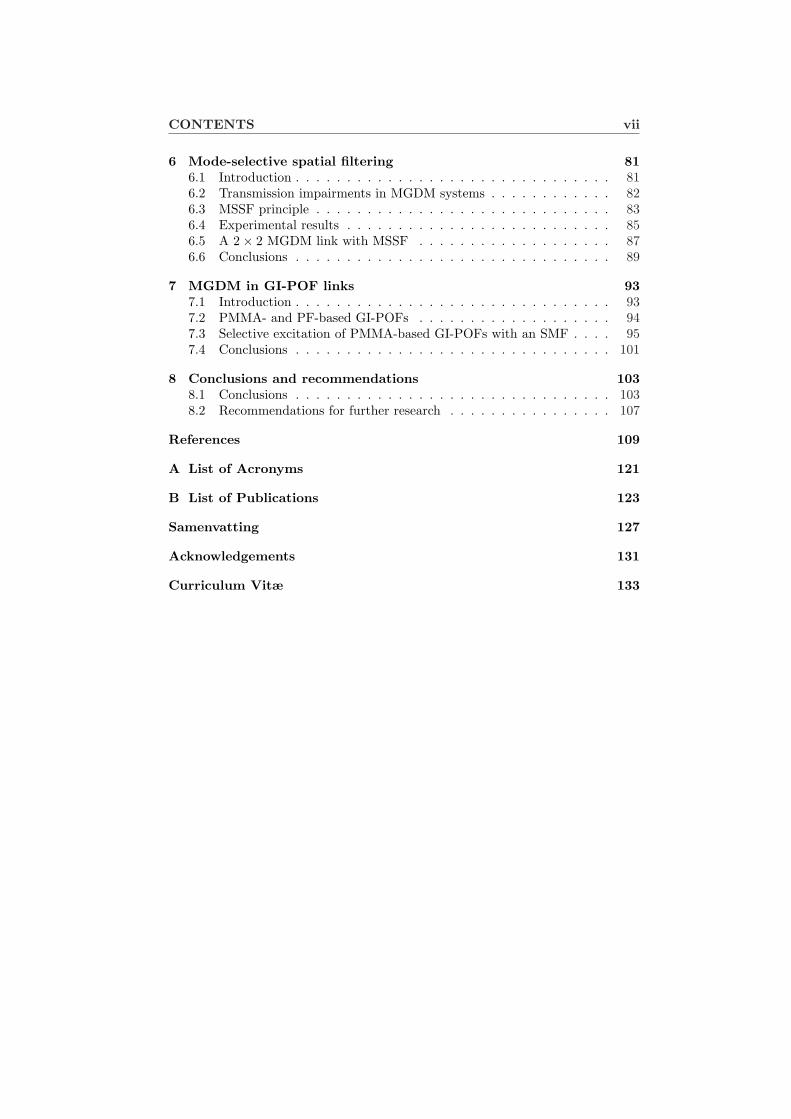
Figure 1.1: Statistics showing the types of silica-based optical fiber links in in-building and campus networks. The statistics represent the cases of Western Eu-rope and the Unites States of America in 1999. SMF: single-mode fiber. GI-MMF62.5/125 (50/125): graded-index multimode fiber with a core/cladding diameterof 62.5/125 (50/125) µm.
In short range optical networks, where the length of the optical fibers does notexceed a few kilometers, multimode fibers (MMFs) have been primarily used. Agood reason for this is that the size of their core is much larger than the size ofthe core of single-mode fibers (SMFs). Therefore handling of MMFs is easier thanof SMFs, since there is more tolerance in the required alignment for the couplingof light in and out of the MMF as well as for splicing MMFs.
1.1.1 Campus and in-building networks
In campus and in-building networks, MMF has been the transmission medium ofchoice. Figure 1.1 shows the statistics of the types of silica-based optical fibersused in these local area networks (LANs). These statistics represent the cases ofWestern Europe and the United States of America in 1999 [3, 4]. The wider use ofSMFs can be found in campus networks in the USA. Even in this case, however,the use of SMFs does not exceed the 10% of the links in these networks. From
1.1 Multimode fiber telecommunication systems 3
Table 1.1: Fiber length in in-building and campus backbone in Western Europeand the Unites States of America (1999).
Area In-building backbone Campus backbone
Western Europe < 300 m, 88% < 1 km, 90%USA < 300 m, 84% < 1 km, 85%
Figure 1.1, it is clear that the transmission medium of choice in these LANs isthe graded-index (GI) MMF with a core/cladding diameter of 62.5/125 µm. Since1999, the use of the 62.5/125 µm GI-MMF has been decreased in favor of the useof the 50/125 µm GI-MMF as well as of SMF that support higher transmissionbandwidth [4].
The length of the fiber links in the LANs of Figure 1.1 is usually up to a fewhundreds of meters. Table 1.1 shows the percentage of the fiber links in thesenetworks with a length shorter than 300 m and 1 km. In Western Europe and theUSA, the length of 90% and 85% of these fiber links, respectively, does not exceed1 km.
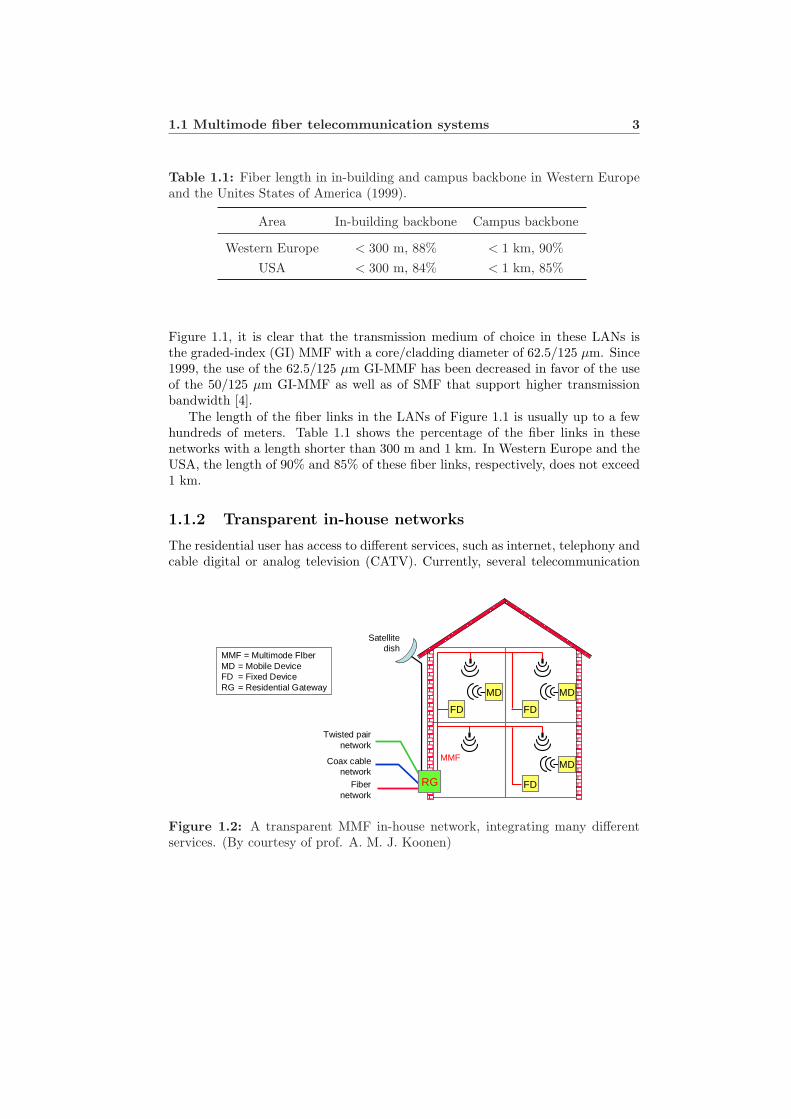
1.1.2 Transparent in-house networks
The residential user has access to different services, such as internet, telephony andcable digital or analog television (CATV). Currently, several telecommunication
FD
MD
MMF
Twisted pairnetwork
Coax cablenetwork
Fibernetwork
MD
RG
FD
FD
MD
Satellite dish
MMF = Multimode FIberMD = Mobile DeviceFD = Fixed DeviceRG = Residential Gateway
Figure 1.2: A transparent MMF in-house network, integrating many differentservices. (By courtesy of prof. A. M. J. Koonen)
4 Introduction
operators offer these three services, which is commonly called “triple play”. Tra-ditionally, for each of these services a different telecommunication infrastructureis used for its distribution to and inside the house. Having a common broadbandinfrastructure allows for more flexible access, with dynamic bandwidth allocationand service provision based on the users’ demands.
An MMF infrastructure can meet both the requirements of broadband accessand flexibility of future residential networks. Figure 1.2 shows an example ofan MMF-based in-house network where several services are integrated. Differentaccess connections reach a residential gateway, via which the various services aredistributed in the house over the MMF infrastructure.
1.1.3 Optical interconnects
Optical systems are considered a viable option for high speed optical intercon-nects [5, 6]. Current electrical interconnects are reaching their performance limits.This is due to power dissipation and other engineering challenges that need to bemet for the continuous reduction of the dimensions of transistor devices. Opticscan potentially offer solutions featuring large bandwidth, electrical isolation andlow power consumption. MMFs can be used in optical interconnects and havealready been employed in proposed interconnection systems [7–9].
1.2 Multimode fibers
1.2.1 Basic properties
An optical fiber is a dielectric cylindrical waveguide. Light propagates in the coreof the optical fiber. The core is surrounded by the cladding, which has a smallerrefractive index. Therefore the mechanism of light propagation in optical fibers istotal internal reflection. It is possible to create optical waveguides using photonicband-gap effects and not total internal reflection [10, 11]. However, in this doctoralthesis we are not dealing with photonic band-gap fibers.
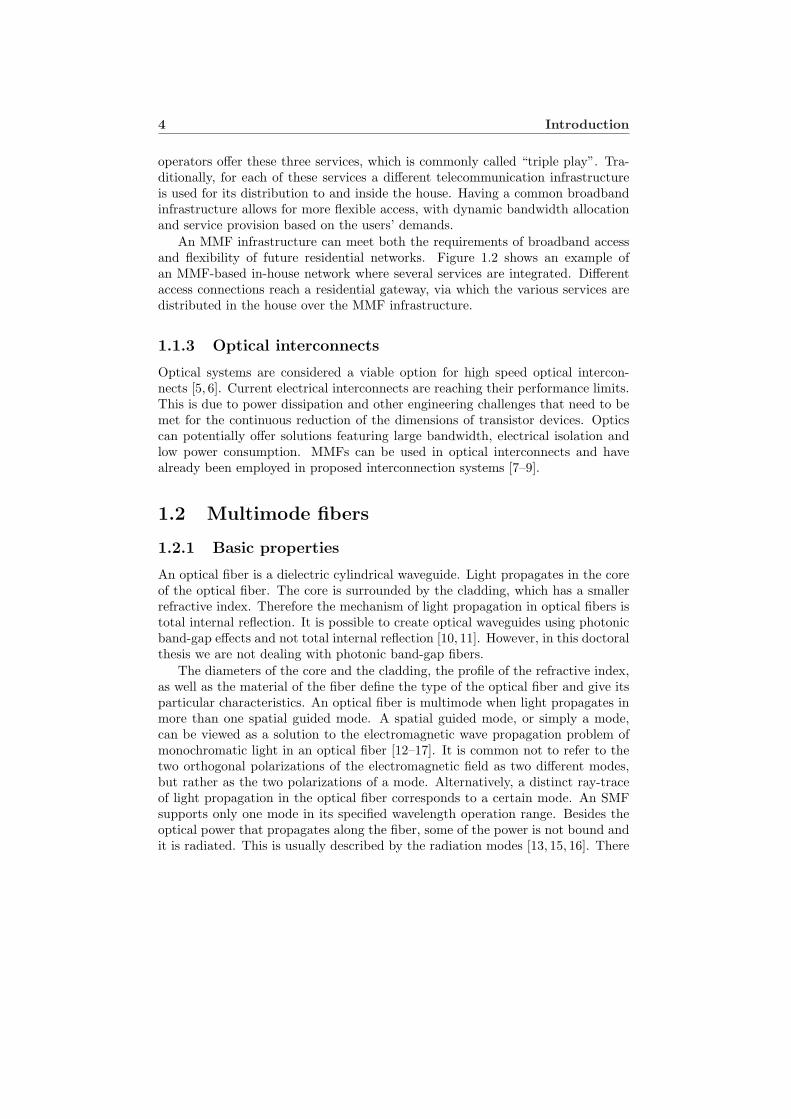
The diameters of the core and the cladding, the profile of the refractive index,as well as the material of the fiber define the type of the optical fiber and give itsparticular characteristics. An optical fiber is multimode when light propagates inmore than one spatial guided mode. A spatial guided mode, or simply a mode,can be viewed as a solution to the electromagnetic wave propagation problem ofmonochromatic light in an optical fiber [12–17]. It is common not to refer to thetwo orthogonal polarizations of the electromagnetic field as two different modes,but rather as the two polarizations of a mode. Alternatively, a distinct ray-traceof light propagation in the optical fiber corresponds to a certain mode. An SMFsupports only one mode in its specified wavelength operation range. Besides theoptical power that propagates along the fiber, some of the power is not bound andit is radiated. This is usually described by the radiation modes [13, 15, 16]. There
1.2 Multimode fibers 5
(a) (b)
n(a)
r=a r=aclad r=a r=aclad
Refractive index profile
n0
n(a)
Refractive index profile
n0
Figure 1.3: Refractive index profile n(r) of (a) an SI-MMF (α = ∞) and (b) aparabolic GI-MMF (α = 2).
(a) (b)
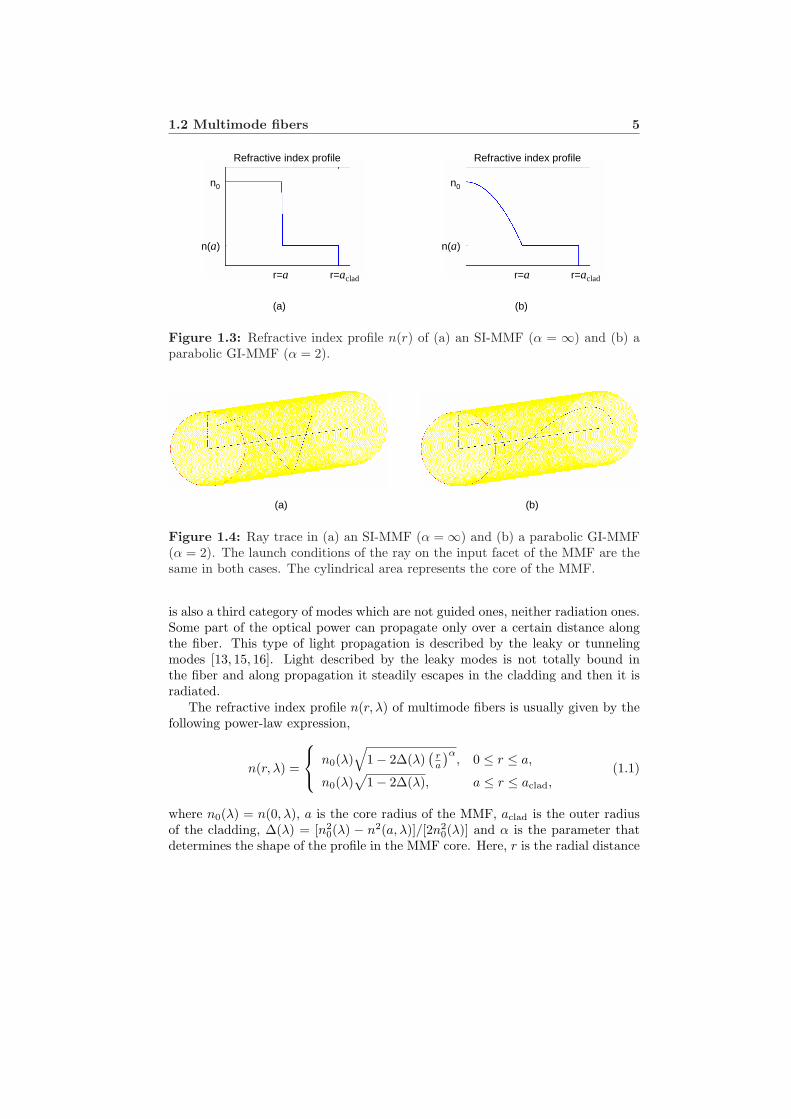
Figure 1.4: Ray trace in (a) an SI-MMF (α = ∞) and (b) a parabolic GI-MMF(α = 2). The launch conditions of the ray on the input facet of the MMF are thesame in both cases. The cylindrical area represents the core of the MMF.
is also a third category of modes which are not guided ones, neither radiation ones.Some part of the optical power can propagate only over a certain distance alongthe fiber. This type of light propagation is described by the leaky or tunnelingmodes [13, 15, 16]. Light described by the leaky modes is not totally bound inthe fiber and along propagation it steadily escapes in the cladding and then it isradiated.
The refractive index profile n(r, λ) of multimode fibers is usually given by thefollowing power-law expression,
n(r, λ) =
n0(λ)√
1− 2∆(λ)(
ra
)α, 0 ≤ r ≤ a,
n0(λ)√
1− 2∆(λ), a ≤ r ≤ aclad,(1.1)
where n0(λ) = n(0, λ), a is the core radius of the MMF, aclad is the outer radiusof the cladding, ∆(λ) = [n2
0(λ) − n2(a, λ)]/[2n20(λ)] and α is the parameter that
determines the shape of the profile in the MMF core. Here, r is the radial distance
6 Introduction
from the MMF axis and λ is the wavelength of light in vacuum. It is usual to referto this profile as the α-profile. If α = ∞, the optical fiber is a step-index (SI) one,while in any other case it is a GI one. For α = 2, the profile is called parabolic andit is of great interest in practical GI-MMFs. In GI-MMFs, modal dispersion, dueto the differential propagation delays of the modes, is much reduced compared toSI-MMFs. The parabolic index profile is very close to the optimal profile wheredifferential mode delays are minimized. Figures 1.3(a) and 1.3(b) show the re-fractive index profile of an SI-MMF and a parabolic GI-MMF, respectively. In anSI-MMF, any propagating ray which is not parallel to the fiber axis always reflectson the core-cladding interface and its trace consists of straight segments. In con-trast, in GI-MMFs, the curve of the trace a non-parallel ray has no critical pointswhere the derivative does not exist and need not reach the core-cladding interface.Figure 1.4 shows the trace of a ray in an SI-MMF and a parabolic GI-MMF. Thelaunch conditions of the ray are the same in both cases.
The range of angles under which an optical system can accept or emit a rayis expressed by the numerical aperture (NA). The NA is a dimensionless numberand it is defined by
NA = n sin θ, (1.2)
where n is the refractive index of the medium where rays propagate and θ denoteshalf the value of the angle that defines the cone of light acceptance or emission ofthe optical system in the same medium. For a GI-MMF, θ is the maximum anglebetween a ray that can enter the GI-MMF and the fiber axis. The local NA of aGI-MMF for guided rays is given by
NAGI-MMF(r, λ) =√
n2(r, λ)− n2(a, λ). (1.3)
The value NAGI-MMF(0, λ) is commonly referred to as the central NA of a GI-MMF.
The number of guided modes Nm of an optical fiber can be approximatedby [16]
Nm(λ) =α
α + 2
(πa
λ
)2
NA2GI-MMF(0, λ), (1.4)
The number Nm is a property of the fiber and it depends on the wavelength. Whenlight propagates in an MMF, it is not always the case that all modes are excited. Itmay be that the optical power is distributed only among a few of these modes. Thisis commonly referred as to selective or restricted excitation. Excitation of all themodes is described as overfilled launch. The distribution of the optical propagatingpower among the modes depends on the excitation conditions and mode mixing.Mode mixing is the gradual redistribution of the optical power among the modesas light propagates along the MMF. Mode mixing is due to irregularities in therefractive index profile, either macroscopic or microscopic. These irregularitiesmay change in time, e.g. due to temperature variations. Ideally, light propagatesin a straight, cylindrical waveguide, with a refractive index that depends only on
1.2 Multimode fibers 7
the radial coordinate. Any deviation from this ideal case, for example due tobending or impurities of the material, can induce mode mixing.
1.2.2 Silica- and polymer-based MMFs
As mentioned in the previous section, an MMF is characterized by the diame-ters of the core and the cladding, as well as the refractive index profile. Anotherimportant feature is the material of which an MMF is made. MMFs are man-ufactured from glass or polymer materials. There can also be fibers made of acombination of materials, such as plastic-clad silica (PCS) fibers. PCS fibers havea silica-based core and a plastic cladding, and are mostly used in automotive andsensor applications [19–21]. Glass optical fibers (GOFs) are based on silica. Poly-mer optical fibers (POFs) are mostly made of polymethylmethacrylate (PMMA)or perfluorinated (PF) polymer. Dopant elements are used to form the refractiveindex profile. POFs are mostly used in short range connections, such as in auto-motive applications, and are considered good candidates for high speed LAN andin-house connections [22, 23].
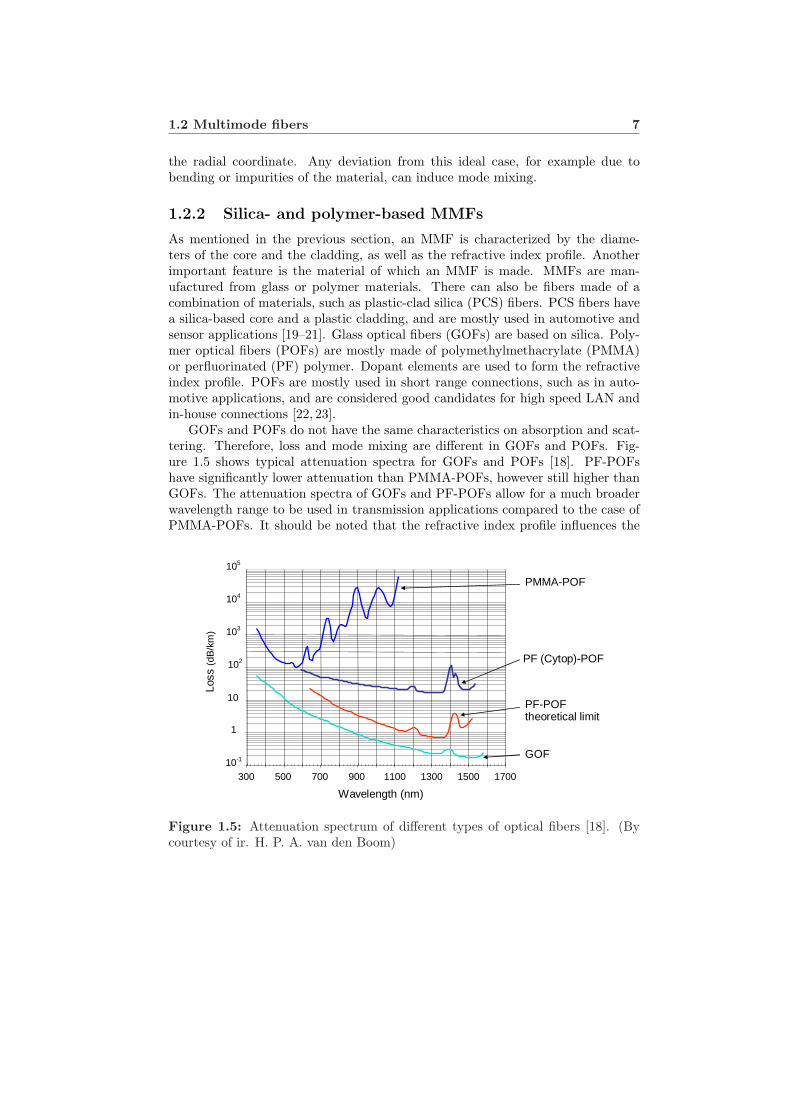
GOFs and POFs do not have the same characteristics on absorption and scat-tering. Therefore, loss and mode mixing are different in GOFs and POFs. Fig-ure 1.5 shows typical attenuation spectra for GOFs and POFs [18]. PF-POFshave significantly lower attenuation than PMMA-POFs, however still higher thanGOFs. The attenuation spectra of GOFs and PF-POFs allow for a much broaderwavelength range to be used in transmission applications compared to the case ofPMMA-POFs. It should be noted that the refractive index profile influences the
Loss
(dB
/km
)
10-1
1
10
102
103
104
105
300 500 700 900 1100 1300 1500 1700
PMMA-POF
PF (Cytop)-POF
PF-POFtheoretical limit
GOF
Wavelength (nm)
Figure 1.5: Attenuation spectrum of different types of optical fibers [18]. (Bycourtesy of ir. H. P. A. van den Boom)
8 Introduction
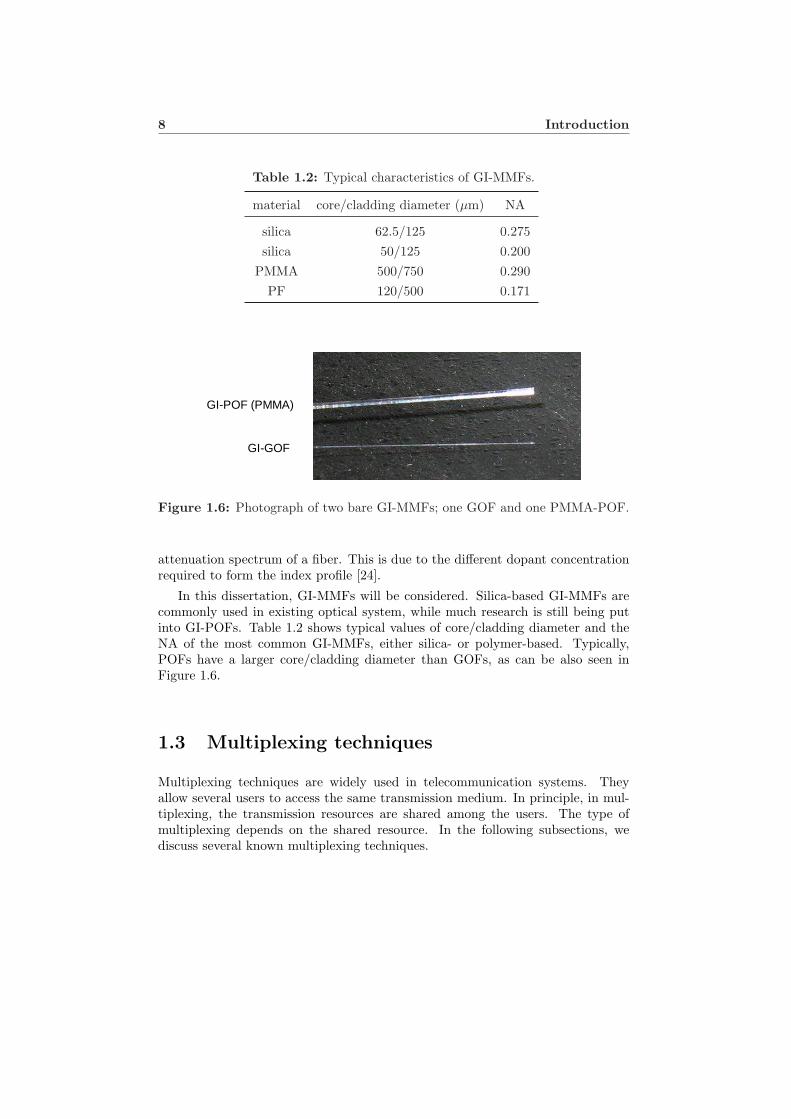
Table 1.2: Typical characteristics of GI-MMFs.
material core/cladding diameter (µm) NA
silica 62.5/125 0.275silica 50/125 0.200
PMMA 500/750 0.290PF 120/500 0.171
GI-POF (PMMA)
GI-GOF
Figure 1.6: Photograph of two bare GI-MMFs; one GOF and one PMMA-POF.
attenuation spectrum of a fiber. This is due to the different dopant concentrationrequired to form the index profile [24].
In this dissertation, GI-MMFs will be considered. Silica-based GI-MMFs arecommonly used in existing optical system, while much research is still being putinto GI-POFs. Table 1.2 shows typical values of core/cladding diameter and theNA of the most common GI-MMFs, either silica- or polymer-based. Typically,POFs have a larger core/cladding diameter than GOFs, as can be also seen inFigure 1.6.
1.3 Multiplexing techniques
Multiplexing techniques are widely used in telecommunication systems. Theyallow several users to access the same transmission medium. In principle, in mul-tiplexing, the transmission resources are shared among the users. The type ofmultiplexing depends on the shared resource. In the following subsections, wediscuss several known multiplexing techniques.
1.3 Multiplexing techniques 9
1.3.1 WDM, SCM, TDM, PDM and CDM
Wavelength division multiplexing
A powerful technique in optical communications is wavelength division multiplex-ing (WDM). WDM creates several channels over the same fiber, either SMF orMMF, using a different wavelength for each channel. At the receiving side of aWDM system, optical filters are required in order to demultiplex the transmittedsignals. The format of the transmitted signals can be arbitrary since the demul-tiplexing is based on wavelength differentiation. There are two WDM variants,namely dense WDM (DWDM) and coarse WDM (CWDM). CWDM, sometimesreferred to as wideband WDM, uses a much wider spacing in the wavelengths ofthe optical sources and therefore it has increased tolerance with respect to wave-length drifting and consequently to temperature fluctuations. CWDM is a lowercost technique than DWDM due to the more relaxed requirements in the systemdesign and related components. Therefore CWDM seems more suitable for ap-plication in MMF systems. Both CWDM [25–27] and DWDM [28, 29] have beenconsidered and demonstrated in MMF transmission.
Subcarrier multiplexing
Similarly to WDM, in radio communications, frequency division multiplexing(FDM) is applied. In a sense, WDM is an optical form of FDM. It is possibleto use a radio FDM signal to modulate the laser intensity of an optical link. Atthe end of such a link, the electrical received signal can be processed with an FDMdemultiplexer. Therefore several radio channels can be multiplexed over the samefiber, either SMF or MMF. This technique is known as subcarrier multiplexing(SCM) and it is mainly used in radio-over-fiber systems, such as the cable tele-vision (CATV) distribution systems [30]. In SCM, the transmission channels aretransparent to the transmission format and their bandwidth is limited by the sub-carrier spacing. SCM transmission has been considered over MMF [31–35], andcombined with DWDM has yielded a very high aggregate bit rate of 204 Gbit/sover 3 km of 50/125 µm silica-based GI-MMF [28].
Time division multiplexing
In digital communications, it is possible to divide the transmission time in slots andtransmit each digital channel periodically. This technique is called time divisionmultiplexing (TDM). Similarly to WDM and FDM, TDM can apply directly in theoptical domain or electrical TDM can apply over the intensity of the transmittedoptical carrier [36–38]. TDM requires a digital signal format. Optical TDM aimsat achieving a very high capacity per transmission wavelength in long-haul SMFtransmission systems. Electrical TDM can be a cost-effective approach in LANsand optical access systems.
10 Introduction
Polarization division multiplexing
In SMFs, the optical field propagates in one mode with two orthogonal polariza-tions. Therefore, polarization division multiplexing (PDM) can be achieved andtwo channels can be transmitted over an SMF [39]. The two polarizations shouldbe separated at the receiving end to demultiplex the two channels, which can trans-port signals of any format. PDM requires that polarization is maintained alongpropagation and it is an example of spatial multiplexing. It is usually employed intransmission experiments where record capacities are pursued. In principle, PDMcan also apply in MMF transmission to create two independent channels, as longas polarization maintenance can be achieved [40, 41].
Code division multiplexing
In all multiplexing techniques, a minimum level of orthogonality is needed in acertain domain among the received signals in order to demultiplex the channels.The previously mentioned techniques achieve the necessary orthogonality in thewavelength, frequency, time and polarization (space) domains. It is possible tocreate several communication channels by using a unique code at each channel totransmit a digital data stream. The necessary orthogonality can then be achievedwith the use of mutually orthogonal codes. This technique is called code divi-sion multiplexing (CDM) or code division multiple access (CDMA), dependingon the application and whether it uses synchronous or asynchronous transmis-sion. CDMA has been originally introduced in radio communications but opticalCDMA has been investigated as well [42–45]. In CDM/CDMA, the communica-tion channels can use the same wavelength, frequency, time or polarization (ingeneral, spatial mode).
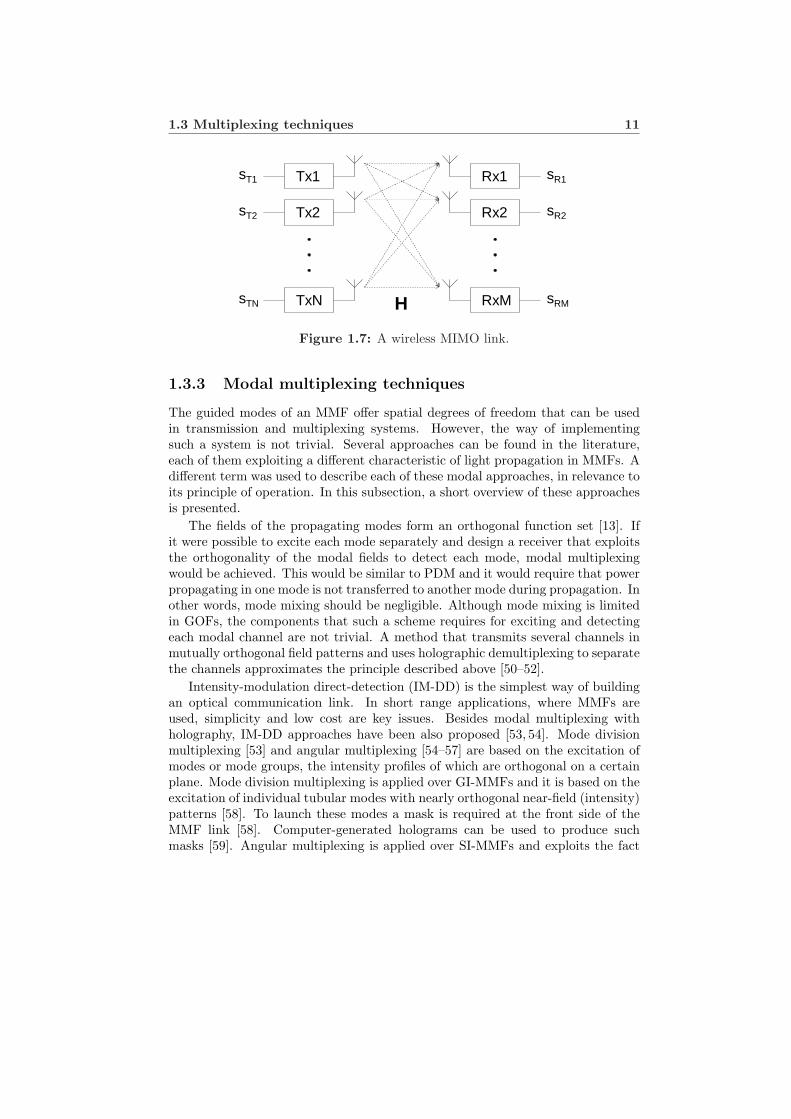
1.3.2 Wireless MIMO techniques
In electrical wireless systems, multiple-input multiple-output (MIMO) techniquesusing multiple antennas at both the transmitting and receiving sides have recentlyattracted a lot of attention. They can improve the spectral efficiency and therobustness of wireless communication systems [46–49]. The huge capacity growththat these MIMO techniques promise is due to the exploitation of the spatial di-mensions of the system. A rich scattering environment is required and the capacityscales linearly with the number of antennas, while keeping the total transmittedpower and channel bandwidth constant.
Figure 1.7 illustrates a wireless MIMO link. The impulse response of the linkhas a matrix form H to reflect the spatial dimensions of the system. The receivedsignals sR are related to the transmitted signals sT via H. Techniques for theestimation of H are required in a MIMO system. It should be noted that with toomuch scattering, the elements of H will be almost identical, rendering impossibleto recover sR at the receiving side of the link.
1.3 Multiplexing techniques 11
Tx1
Tx2
TxN
Rx1
Rx2
RxMH
sT1
sT2
sTN
sR1
sR2
sRM
Figure 1.7: A wireless MIMO link.
1.3.3 Modal multiplexing techniques
The guided modes of an MMF offer spatial degrees of freedom that can be usedin transmission and multiplexing systems. However, the way of implementingsuch a system is not trivial. Several approaches can be found in the literature,each of them exploiting a different characteristic of light propagation in MMFs. Adifferent term was used to describe each of these modal approaches, in relevance toits principle of operation. In this subsection, a short overview of these approachesis presented.
The fields of the propagating modes form an orthogonal function set [13]. Ifit were possible to excite each mode separately and design a receiver that exploitsthe orthogonality of the modal fields to detect each mode, modal multiplexingwould be achieved. This would be similar to PDM and it would require that powerpropagating in one mode is not transferred to another mode during propagation. Inother words, mode mixing should be negligible. Although mode mixing is limitedin GOFs, the components that such a scheme requires for exciting and detectingeach modal channel are not trivial. A method that transmits several channels inmutually orthogonal field patterns and uses holographic demultiplexing to separatethe channels approximates the principle described above [50–52].
Intensity-modulation direct-detection (IM-DD) is the simplest way of buildingan optical communication link. In short range applications, where MMFs areused, simplicity and low cost are key issues. Besides modal multiplexing withholography, IM-DD approaches have been also proposed [53, 54]. Mode divisionmultiplexing [53] and angular multiplexing [54–57] are based on the excitation ofmodes or mode groups, the intensity profiles of which are orthogonal on a certainplane. Mode division multiplexing is applied over GI-MMFs and it is based on theexcitation of individual tubular modes with nearly orthogonal near-field (intensity)patterns [58]. To launch these modes a mask is required at the front side of theMMF link [58]. Computer-generated holograms can be used to produce suchmasks [59]. Angular multiplexing is applied over SI-MMFs and exploits the fact
12 Introduction
that the far-field (intensity) pattern of principal mode groups (PMGs), i.e. agroup of modes with very similar propagation coefficients, forms a ring, the radiusof which depends on the order of the PMG. Each PMG propagates with a differentangle with respect to the propagation axis. Excitation of a PMG can be achievedby launching light with a proper angle on the input facet of the SI-MMF.
The developments in wireless MIMO systems have triggered research in opticalMIMO transmission over MMFs. The first reported optical MIMO technique isdispersive multiplexing [60, 61]. In dispersive multiplexing, phase modulated elec-trical subcarriers are used to intensity-modulate the lasers and a complex-valuedmatrix relates the electrical input and output signals of the system. The tech-nique requires that there is a significant phase difference among the propagationpaths. This is achieved with an MMF which is highly dispersive and/or a highfrequency electrical subcarrier. To allow for short MMFs to be used, coherentoptical MIMO has been introduced [62, 63]. Coherent optical MIMO is the op-tical analogy of radio MIMO [64], but it comes at the expense of complexity dueto the optical coherent demodulation. IM-DD MIMO can be also applied withother digital signal formats, such as on-off keying [9, 65]. Mode group diversitymultiplexing (MGDM) [66–69] is a MIMO technique that uses IM-DD and createsparallel, independent communication channels, transparent to the signal format,as is further explained in the next section.
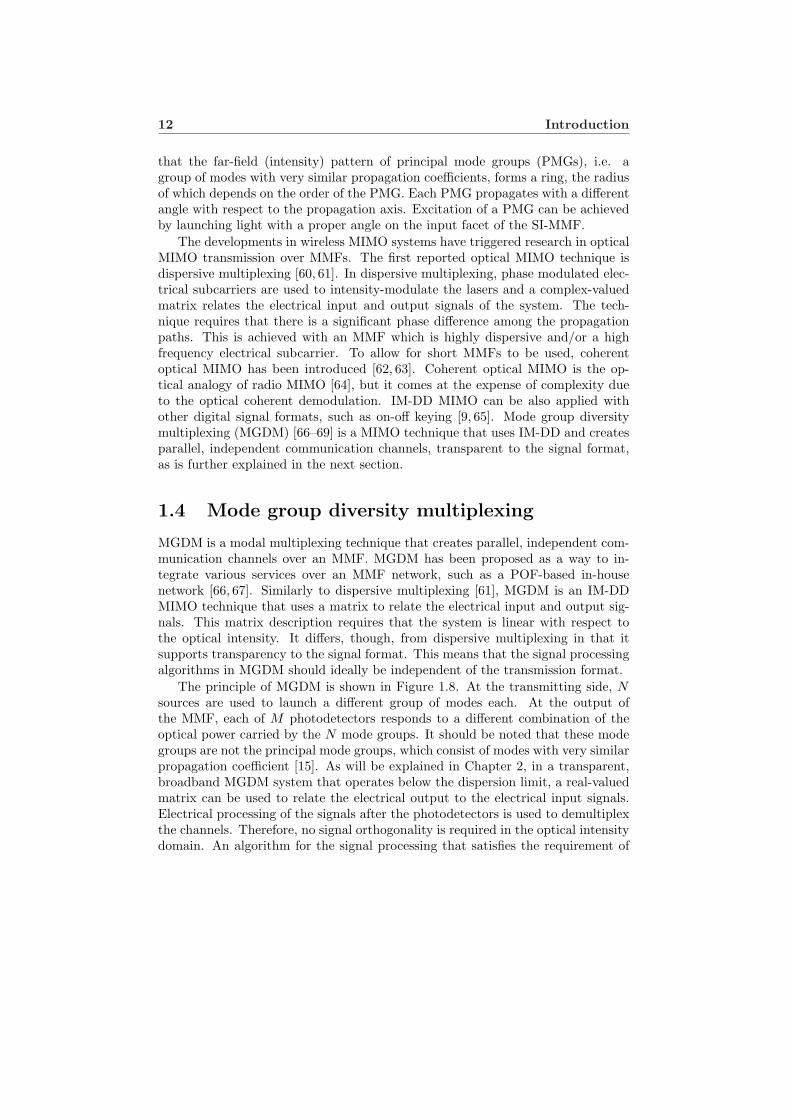
1.4 Mode group diversity multiplexing
MGDM is a modal multiplexing technique that creates parallel, independent com-munication channels over an MMF. MGDM has been proposed as a way to in-tegrate various services over an MMF network, such as a POF-based in-housenetwork [66, 67]. Similarly to dispersive multiplexing [61], MGDM is an IM-DDMIMO technique that uses a matrix to relate the electrical input and output sig-nals. This matrix description requires that the system is linear with respect tothe optical intensity. It differs, though, from dispersive multiplexing in that itsupports transparency to the signal format. This means that the signal processingalgorithms in MGDM should ideally be independent of the transmission format.
The principle of MGDM is shown in Figure 1.8. At the transmitting side, Nsources are used to launch a different group of modes each. At the output ofthe MMF, each of M photodetectors responds to a different combination of theoptical power carried by the N mode groups. It should be noted that these modegroups are not the principal mode groups, which consist of modes with very similarpropagation coefficient [15]. As will be explained in Chapter 2, in a transparent,broadband MGDM system that operates below the dispersion limit, a real-valuedmatrix can be used to relate the electrical output to the electrical input signals.Electrical processing of the signals after the photodetectors is used to demultiplexthe channels. Therefore, no signal orthogonality is required in the optical intensitydomain. An algorithm for the signal processing that satisfies the requirement of
1.4 Mode group diversity multiplexing 13
N input signals
N recoveredsignals
Multimode fiber
N sources M detectorssignal
processing
…… ……feedback
signalprocessing
laserdetector
…… ………… ………… ……
Figure 1.8: Mode group diversity multiplexing principle. (By courtesy of prof.A. M. J. Koonen)
signal-format transparency is matrix inversion. Matrix inversion is a zero-forcingalgorithm that cancels cross-talk among the channels [49]. In the work presentedin this thesis, matrix inversion is considered.
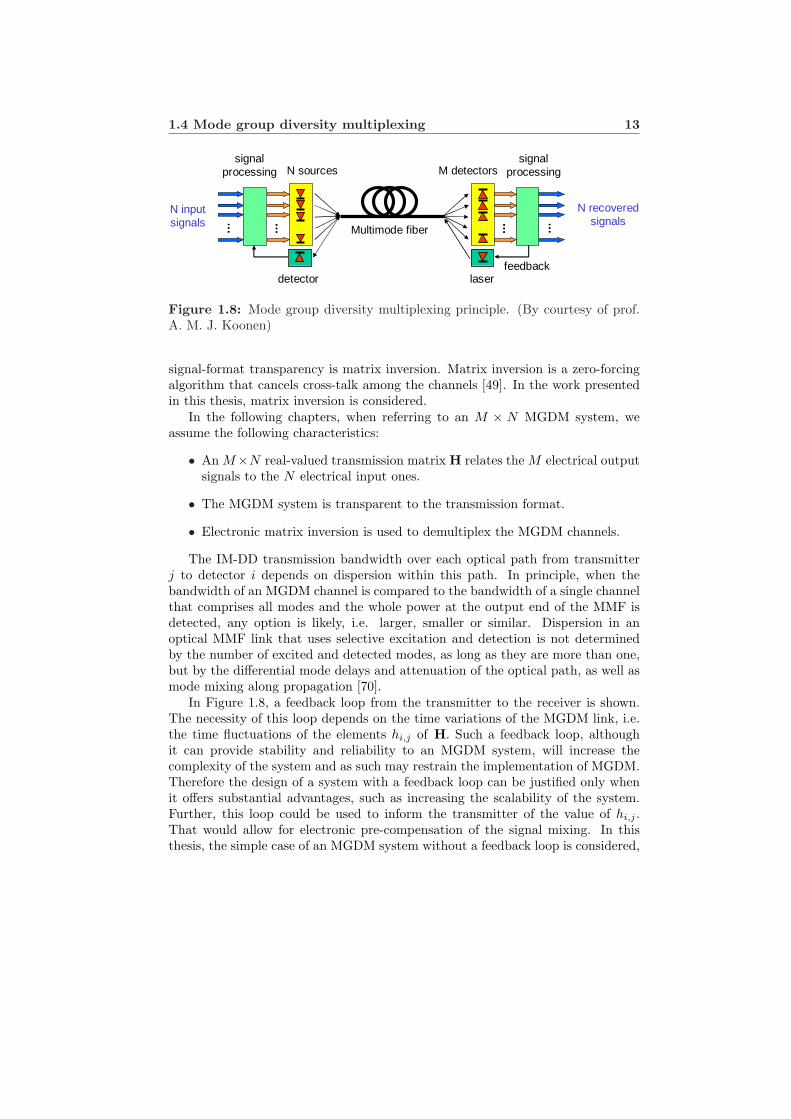
In the following chapters, when referring to an M × N MGDM system, weassume the following characteristics:
• An M×N real-valued transmission matrix H relates the M electrical outputsignals to the N electrical input ones.
• The MGDM system is transparent to the transmission format.
• Electronic matrix inversion is used to demultiplex the MGDM channels.
The IM-DD transmission bandwidth over each optical path from transmitterj to detector i depends on dispersion within this path. In principle, when thebandwidth of an MGDM channel is compared to the bandwidth of a single channelthat comprises all modes and the whole power at the output end of the MMF isdetected, any option is likely, i.e. larger, smaller or similar. Dispersion in anoptical MMF link that uses selective excitation and detection is not determinedby the number of excited and detected modes, as long as they are more than one,but by the differential mode delays and attenuation of the optical path, as well asmode mixing along propagation [70].
In Figure 1.8, a feedback loop from the transmitter to the receiver is shown.The necessity of this loop depends on the time variations of the MGDM link, i.e.the time fluctuations of the elements hi,j of H. Such a feedback loop, althoughit can provide stability and reliability to an MGDM system, will increase thecomplexity of the system and as such may restrain the implementation of MGDM.Therefore the design of a system with a feedback loop can be justified only whenit offers substantial advantages, such as increasing the scalability of the system.Further, this loop could be used to inform the transmitter of the value of hi,j .That would allow for electronic pre-compensation of the signal mixing. In thisthesis, the simple case of an MGDM system without a feedback loop is considered,
14 Introduction
N input signals
N recoveredsignals
Multimode fiber
N sources M detectorssignal
processing
…… …… …… ………… ……
MµN matrix H
mat
rix
inve
rsio
n
Figure 1.9: A mode group diversity multiplexing system without a feedback loop.The electronic processing is based on matrix inversion.
as shown in Figure 1.9. A major track of the presented work is the design andimplementation of a stable system that can perform reliably without feedbackfrom the receiver to the transmitter. However, adaptive estimation of H at thereceiving side of the system is still required to account for moderate changes inthe value of hi,j .
1.5 Outline of the thesis
In this thesis, several aspects of the MGDM technique are considered and analyzed.The work is primarily devoted to the optical aspects of the system. Given thatthis thesis presents some of the first results on MGDM, some effort has been putto reveal the aspects of MGDM that deserve special attention and research. Themain goal is to reach practical conclusions that enable the efficient design andapplicability of an MGDM system. As mentioned in Section 1.3.3, conceptually, itis well-known that the modes offer spatial degrees of freedom that could be used fortransmission purposes. However, the orthogonality of the modes is with respectto their fields, while MGDM uses intensity-modulation and direct-detection. InChapters 2 to 6, silica-based GI-MMFs are used to obtain experimental results,since they are widely employed in other transmission systems and have very lowmode mixing. In Chapter 7, the use of GI-POFs is investigated.
More specifically, Chapter 2 presents an MGDM model. This model tries toshow under which conditions the MGDM link is linear with the optical intensityand can be described by a simple M × N matrix. It is shown that the matrixelements are real-valued in a transparent, broadband system. Given the linearityof the MGDM system, the effect of noise is examined and the power penalty dueto additive thermal and shot noise is calculated. Further, the factors that limitthe bandwidth of an MGDM system are identified and it is shown that, althoughin principle M ≥ N , M = N may improve the signal-to-noise ratio (SNR).
MGDM uses selective excitation and selective detection. Design considerationsfor an N ×N MGDM system with GI-MMF are given in Chapter 3. On the inputfacet of the GI-MMF, N radially offset Gaussian-like beams are launched and
1.5 Outline of the thesis 15
at the receiving end a multisegment detector geometry is proposed for spatiallyselective detection of the near-field pattern (NFP). This detector consists of Nconcentric annular segments. The power budget and the robustness of the proposedscheme are evaluated in terms of the power penalty due to the electronic matrixinversion, calculated in Chapter 2. The radial offsets of the input beams and theareas of the detector segments are chosen so as to minimize the power penalty dueto the electronic matrix inversion. It is shown that the geometric parameters ofan MGDM system, i.e. the radial offsets of the input beams and the areas of thedetector segments, do not depend on the GI-MMF length for at least up to 1 kmlong silica-based GI-MMF. Other issues are also addressed, such as introducingan angular offset into the input beams and the use of standard GI-MMF passiveoptical components in MGDM transmission over network topologies beyond thebasic point-to-point scenario.
One of the strongest aspects of the MGDM link proposed in Chapter 3 is thatthe geometric parameters of the system design hold independently of the GI-MMFlength for at least 1 km long silica-based GI-MMF. In Chapter 4, the impact ofthe propagation effects on the NFP on the output facet of GI-MMFs is examined.These effects include differential mode delay and attenuation as well as modemixing. Selective excitation with a radially offset SMF is considered. Given thelaunch conditions, the NFP depends on these propagation effects and the refractiveindex profile of the GI-MMF. It is shown that although light propagation affectsthe speckle pattern, the overall NFP does not change due to differential mode delayand attenuation, small deviations in the refractive index profile of the GI-MMF,or full intra-group mode mixing. The latter refers to mixing among the modes ofa principal mode group. Finally, it is shown that when the refractive index profileexhibits a central dip, the overall NFP under central excitation can significantlyexpand, while in the case of a central peak, the overall NFP remains practicallyintact.
Factors such as temperature changes, wavelength drifting, or mechanical vi-brations may change the distribution of the optical power among the modes, thelaunch conditions on the MMF input facet, and the coupling of the optical power tothe photodetectors. Any such change will cause temporal variations in the trans-mission matrix of an MGDM system and will therefore affect its performance.Chapter 5 describes an experimental 2 × 2 MGDM link and it shows that sucha link can be stable over time. In principle, to achieve reliable and high qualitytransmission, the MGDM system should be adaptive. Based on measurementsof the transmission matrix over 12.7 h, cross-talk between the two channels iscalculated as a function of the period of estimation of the transmission matrix.
The research presented in this thesis was carried out in the frame of the project“High capacity multi-service in-house networks, using mode group diversity mul-tiplexing”. This was a part of the Freeband Impulse Program of the Ministry ofEconomic Affairs of the Netherlands. Within this project, the Signal ProcessingSystems group of the Faculty of Electrical Engineering of the Eindhoven Univer-sity of Technology led the investigation of the electrical signal processing aspects
16 Introduction
of MGDM, both theoretically and experimentally. The last part of Chapter 5gives a short description of the expansion of the 2×2 experimental setup, in orderto include the electronic unit that performs the signal demultiplexing based onmatrix inversion. A non-adaptive as well as an adaptive circuit was implementedand two analog, low-bandwidth signals were transmitted, showing the feasibilityof the MGDM technique.
The linearity of an MGDM link as discussed in Chapter 2 requires that thefields of the mode groups at the output end of the GI-MMF are mutually incoher-ent. Further, when the number of channels increases, the power penalty due tothe electronic matrix inversion also increases and the system becomes less robustto changes in the transmission matrix. An optical method to reduce cross-talkwould allow for a more robust system, a larger number of channels and it wouldrelax the requirement of mutual incoherence among the fields of the mode groups.Further, if cross-talk is sufficiently low, the need for electronic demultiplexing canbe eliminated and a single source can be used with external modulators. This isa very important feature in order to combine MGDM with WDM, using a singlesource for each wavelength, and it would allow the use of MGDM in applicationswhere maximization of the aggregate bandwidth per wavelength would be desired.In Chapter 6, mode-selective spatial filtering (MSSF), a new optical method toreduce cross-talk, is introduced and demonstrated. MSSF is shown to be veryeffective, while still keeping the MGDM system simple, since it can be achievedwith only a single lens between the GI-MMF output end and the detectors.
In Chapter 7, the possibility of using POF in MGDM systems is examined. Lit-erature results on POF are explored and some experimental results are presented.In principle, GI-POFs can be used in MGDM systems in a similar fashion as GI-GOFs. However, mode mixing in GI-POFs is very strong and this is detrimentalto the use of GI-POF in MGDM systems, since the transmission matrix wouldstrongly depend on the fiber length. Further, it is indicated that the flexibilityof GI-POF, although advantageous for in-building installation, can pose practicaldifficulties in achieving a reliable system, since the NFP at its output end can bestrongly affected by bending the GI-POF close to its output end or by applyingstress to the GI-POF.
The final chapter of this thesis, Chapter 8, highlights the main conclusionsfrom the research results presented in the preceding chapters. Further, MGDM iscompared with other multiplexing techniques and suggestions for further researchare given.
Chapter 2
Model of an M ×N MGDMsystem
A mathematical model that describes an N -input, M -output MGDM system ispresented. The model shows under which conditions the MGDM system is linearwith respect to the optical intensity. For a broadband system, transparent to thesignal format, the elements of the transmission matrix are positive, real numbers.The effect of noise sources that may influence an MGDM system is examinedand the power penalty due to the additive thermal and shot noise is calculated.Furthermore, limitations in the bandwidth of the transmitted signals are explored.Finally, the relation between M and N is investigated, showing that preferablyM = N .
2.1 Introduction
In Chapter 1, the principle of MGDM was briefly introduced. A simple relationwas claimed to hold between the electrical input and output signals of an MGDMsystem. In particular, the N × 1 vector sT (t) of the N electrical signals thatmodulate the intensity of the N optical sources is related to the M×1 vector sR(t)of the M output electrical signals after photodetection and electrical amplificationvia an M ×N transmission matrix H(t) with real-valued elements hi,j(t), i.e.,
sR(t) = H(t)sT (t) + n(t), (2.1)
where n(t) is an M ×1 additive noise vector. Electronic matrix inversion can thenrecover the input signals, irrespective of their format. A real-valued matrix onlyexpresses the spatial diversity and cannot compensate for differential delays in thesystem. Therefore, Eq. (2.1) assumes that dispersion does not pose a limitation,
Parts of this chapter are published in Ref. [4] of Appendix B.

18 Model of an M ×N MGDM system
i.e. the reciprocals of the differential delays are much larger than the bandwidthof the transmitter signals. The relative delay between the transmitted and re-ceived signals is not included in Eq. (2.1) to keep the notation simple. The timedependence of H(t) is due to several reasons such as temperature changes andmechanical vibrations, as will be further explained in Chapter 5. For Eq. (2.1) tohold, the value of hi,j(t) must vary slowly with time and more specifically, muchslower than the signal vector sT (t). The element hi,j(t) expresses the portion ofthe total received power from the jth mode group that is seen by the ith segmentof the MGDM detector. Therefore, the sum of the elements of each column of His equal to one, i.e.,
M∑
i=1
hi,j = 1. (2.2)
A matrix for which Eq. (2.2) holds is commonly called column stochastic or leftstochastic matrix.
In this chapter, we address the following questions:
• Under which conditions does Eq. (2.1) hold?
• How does noise affect an MGDM system?
• Which are the factors that limit the bandwidth of the transmitted signals?
• What should be the relation between M and N?
The analysis presented in this chapter uses the wave description of light, as wellas some elements from communication and matrix theories. To provide betterinsight, a simple experimental result is included.
2.2 Linearity of an MGDM link
2.2.1 Propagation in MMFs
Propagation in MMFs introduces dispersion, attenuation and mode mixing. Letus assume that light from the jth source (Tj) is launched into the MMF. Thepropagating electric (ej) and magnetic (hj) complex fields are
[ej(r, φ, z, t)hj(r, φ, z, t)
]=
∑m
cjm(z)
[em(r, φ)hm(r, φ)
]ejωjt (2.3)
where em, hm are the modal electric and magnetic complex fields of the mthguided normal mode (m = 1 . . . Nm), normalized to unit power, cj
m is the complexmodal amplitude, ωj is the optical frequency of Tj and j is the imaginary unit [13].Here, r, φ, z are cylindrical coordinates with the z-axis coinciding with the MMFaxis. At the MMF input end z = 0 and at the MMF output end z = L. It
2.2 Linearity of an MGDM link 19
should be noted that for simplicity of notation, the dependence of em and hm
on ωj is suppressed, given that this dependence is low in an MGDM system forwhich the N sources have the same or very similar ωj . Further, when the opticalsources are modulated with electrical signals, cj
m is time-dependent. Therefore,strictly speaking, Eq. (2.3) holds for continuous wave sources. However, sincethe bandwidth of the modulating electrical signals is typically much lower thanωj , again for reasons of simplicity of notation, the dependence of cj
m on time issuppressed.
Propagation affects the propagating fields as far as the value of cjm(z) is con-
cerned, as can be seen in Eq. (2.3). In general,
cj(z + ∆z) = D(∆z) cj(z), (2.4)
where cj is the Nm × 1 vector of the modal amplitudes. Here, D = BA, andD, B, A are complex-valued Nm ×Nm matrices describing the effect of propaga-tion. In particular, A and B express the loss and phase shift due to propagation,respectively. It is assumed that loss is limited, so that it can be treated as a per-turbation of the lossless case [13]. In the case of a lossless MMF, A is equal to theNm × Nm identity matrix and D = B. B is always a unitary matrix expressingenergy conservation in the absence of losses. If mode mixing is neglected, matricesB and A are diagonal with elements
bm,m(∆z) = e−jβm∆z and am,m(∆z) = e−γm∆z, (2.5)
where βm, γm are the propagation and attenuation coefficients of the normalmode m. Therefore,
cjm(z) = cj
m(0)e−jβmze−γmz. (2.6)
The complex value of cjm(0) depends on the excitation condition at the MMF input
end and it can be calculated by the overlap integral method at z = 0. Particularly,the orthogonality of the modal fields at z = 0 reads
cm(0) =∫ 2π
0
∫ ∞
0
ein(r, φ)× h∗m(r, φ) · uzrdrdφ (2.7)
where ein(r, φ) is the excitation electric field at z = 0 and uz is the unit vector inthe direction of propagation.
In an MGDM link comprising N optical sources, the total propagating elec-tric (e) and magnetic (h) fields are given as the superposition of the fields due tosource Tj (j = 1 . . . N), i.e.,
[e(r, φ, z, t)h(r, φ, z, t)
]=
∑
j
[ej(r, φ, z, t)hj(r, φ, z, t)
](2.8)
and the corresponding intensity distribution at z = L is given by
I(r, φ, L, t) =12Re
[e(r, φ, L, t)× h∗(r, φ, L, t) · uz
]. (2.9)
20 Model of an M ×N MGDM system
Substituting (2.8) to (2.9) gives
I(r, φ, L, t) =12Re
[∑
j
ej(r, φ, L)× hj∗(r, φ, L) · uz
+∑
j 6=k
ej(r, φ, L)× hk∗(r, φ, L)ej(ωj−ωk)t · uz
]. (2.10)
The second term on the right-hand side (RHS) of Eq. (2.10) shows that non-linearinterference among the channels may occur.
2.2.2 Spatially selective detection
The power detected over an area As at z = L is
PAs(t) =
∫
As
I(r, φ, L, t) dA. (2.11)
Substituting (2.10) to (2.11) gives
PAs(t) =12Re
[∑
j
∫
As
ej(r, φ, L)× hj∗(r, φ, L) · uzdA
+∑
j 6=k
∫
As
ej(r, φ, L)× hk∗(r, φ, L)ej(ωj−ωk)t · uzdA
]. (2.12)
MGDM uses spatially selective detection and As is the area of one of theM detectors. The first term on the RHS of Eq. (2.12) is the summation of theoptical powers due to each Tj alone and the second term expresses the interferenceof the N field distributions. Each field distribution carries different information.Equation (2.12) shows that, in principle, due to this interference term, the MGDMlink is not linear with the optical power and signal distortion can be caused. Evenin the case where each mode group comprises a completely different set of modes,the term expressing interference will not be zero since the modes are not orthogonalover the finite cross section As [13].
For a single-channel case with spatially selective detection, Eqs. (2.10) and(2.12) can still give the intensity and power, respectively, at z = L, with ωj = ωk
and j, k referring to different modes. Integration over the finite As yields a non-zero interference term. When dispersion cannot be neglected, the signal will bedistorted, since at z = L each modal field carries the signal with a different delay.This sort of distortion is different from the distortion caused by modal dispersionalone and it is the combined effect of modal dispersion and spatially selectivedetection. Modal dispersion is included in the phase of the fields in Eqs. (2.10)and (2.12).
2.3 An experimental example of non-linear system response 21
Furthermore, Eq. (2.12) shows that optical heterodyning can occur when theoptical frequencies ωj are not the same. In a system with N different sources,such a possibility exists. If the intermediate frequency ωj − ωk falls within thetransmission bandwidth, the system performance degrades. Heterodyning, though,could be used as a way to filter out the non-linear system response, since it canset the interference term of Eq. (2.12) out of the transmission band. However,this would require some control over ωj and thus the system would not be entirelywavelength-blind. Indeed, in Ref. [61], it is suggested that the wavelengths shouldnot overlap exactly, in order to avoid coherent optical beat noise in the receiver.In order (2.1) to hold always, the interference term of Eq. (2.12) should be equalto zero independent of As, cj(L), ωj and the amount of spatial overlap amongthe fields of the mode groups at z = L. This could be achieved on average whenthe N field distributions at z = L are mutually incoherent. In practice, opticalsources with a relatively wide linewidth can fulfill this requirement within a certainbandwidth. Although on average the interference term of Eq. (2.12) can be zero,its standard deviation will not be zero, hence inducing beat noise. The larger thetransmission bandwidth, the stronger the impact of this beat noise.
2.3 An experimental example of non-linear sys-tem response
A straightforward way to observe experimentally the non-linear system responseexpressed by the second term on the RHS of Eq. (2.12) is to launch two highlycoherent, continuous wave signals with slightly different wavelengths at the MMFinput end. The interference term is then demonstrated as heterodyning.
The experimental setup is shown in Figure 2.1. We used two external cavitytype, tunable, semiconductor, continuous wave lasers with a linewidth of 85 kHzand a 100 m long 50/125 µm silica-based GI-MMF with a numerical apertureof 0.2. The lasers were pigtailed with standard single-mode fibers and a 50/50single-mode directional coupler was used to launch the two signals in the GI-MMF. The wavelengths were tuned to 1350 nm. In particular, the wavelengthof one laser was kept constant while the other laser was slightly de-tuned so asto observe heterodyning. At the GI-MMF output end a photodiode detected thewhole area of the GI-MMF core. The photodiode was followed by a widebandamplifier (100 kHz to 20 GHz) with 20 dB gain.
Figure 2.2 shows the beat tone in the electrical spectrum at the amplifier out-put. This tone corresponds to the difference in the optical frequencies of the twolasers. In Figures 2.2(a) and 2.2(b), light at the output of the coupler was launchedinto the GI-MMF with 0 µm and 15 µm radial offset from the GI-MMF axis, cor-respondingly, by means of translational stages. In both cases, the lasers emittedequal power and the total optical power at the GI-MMF output end was approxi-mately -3 dBm. For the 15 µm offset launch, the power emitted by the lasers washigher than for central launch to compensate for coupling and propagation losses.
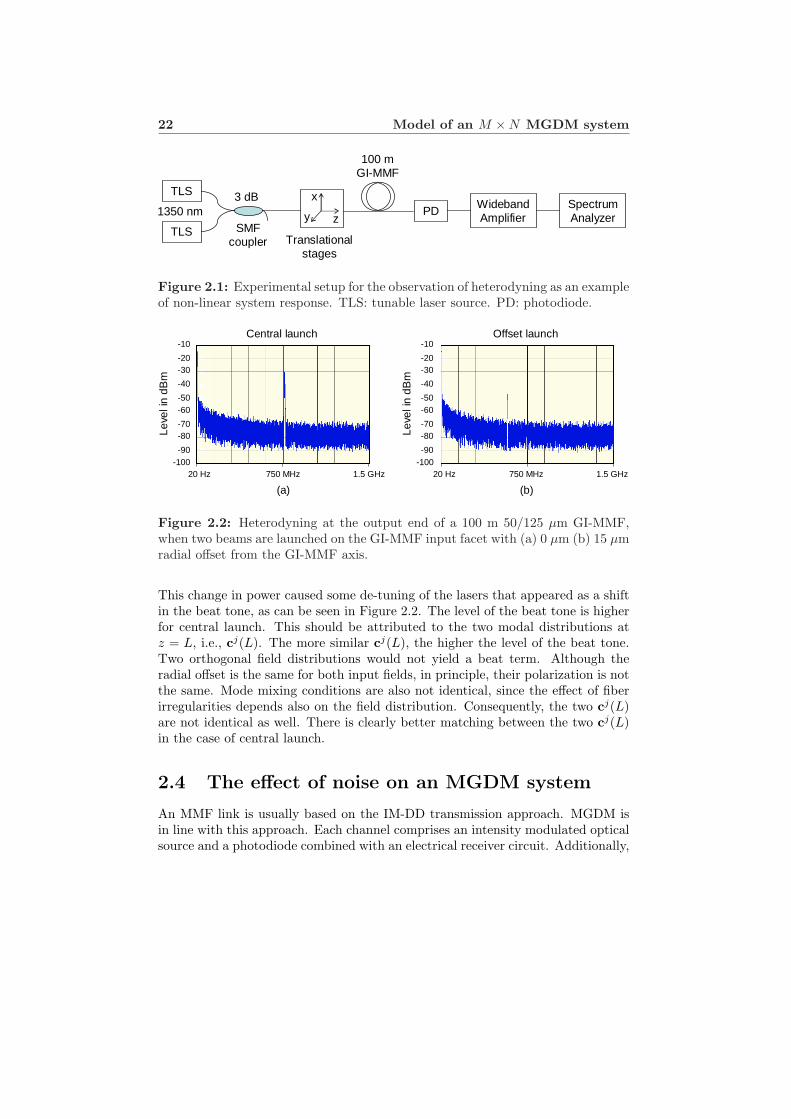
22 Model of an M ×N MGDM system
TLS
TLS
3 dB
100 mGI-MMF
Translationalstages
x
y zPD
Wideband Amplifier
Spectrum Analyzer
SMF coupler
1350 nm
Figure 2.1: Experimental setup for the observation of heterodyning as an exampleof non-linear system response. TLS: tunable laser source. PD: photodiode.
(a) (b)
-10
-20-30
-40
-50-60
-70-80
-90-100
20 Hz 750 MHz 1.5 GHz
-10
-20-30
-40
-50-60
-70-80
-90-100
20 Hz 750 MHz 1.5 GHz
Central launch Offset launch
Leve
l in
dBm
Leve
l in
dBm
Figure 2.2: Heterodyning at the output end of a 100 m 50/125 µm GI-MMF,when two beams are launched on the GI-MMF input facet with (a) 0 µm (b) 15 µmradial offset from the GI-MMF axis.
This change in power caused some de-tuning of the lasers that appeared as a shiftin the beat tone, as can be seen in Figure 2.2. The level of the beat tone is higherfor central launch. This should be attributed to the two modal distributions atz = L, i.e., cj(L). The more similar cj(L), the higher the level of the beat tone.Two orthogonal field distributions would not yield a beat term. Although theradial offset is the same for both input fields, in principle, their polarization is notthe same. Mode mixing conditions are also not identical, since the effect of fiberirregularities depends also on the field distribution. Consequently, the two cj(L)are not identical as well. There is clearly better matching between the two cj(L)in the case of central launch.
2.4 The effect of noise on an MGDM system
An MMF link is usually based on the IM-DD transmission approach. MGDM isin line with this approach. Each channel comprises an intensity modulated opticalsource and a photodiode combined with an electrical receiver circuit. Additionally,
2.4 The effect of noise on an MGDM system 23
the received electrical signals are fed into the electrical circuit that performs matrixinversion in order to demultiplex the transmitted signals. Each transmitted signalpropagates over a different group of modes and the link requires selective excitationand detection.
Following these system characteristics, the performance of an MGDM link canbe affected by thermal noise, shot noise, modal noise, as well as relative intensitynoise and phase (or frequency) noise from the optical sources. The phase noise ofthe optical sources will manifest itself as modal noise. In the following subsections,we investigate the effect of each noise source in the system.
2.4.1 Power penalty due to additive thermal and shot noise
In Section 2.2, we investigated under which conditions an MGDM link can bedescribed by Eq. (2.1). Assuming these conditions hold, electronic matrix inversioncan recover the transmitted signals. The estimated transmitted signals sT (t) are
sT (t) = H†(t)sR(t) + nde(t)= sT (t) + H†(t)n(t) + nde(t), (2.13)
where nde(t) is an M × 1 vector that represents noise from the demultiplexingcircuit and H†(t) = {h†i,j(t)} is a N × M matrix such that H†(t)H(t) = IN×N ,where IN×N denotes the N ×N identity matrix. For an invertible N ×N system,H†(t) is the inverse of H(t), while for an M ×N system H†(t) can be the Moore-Penrose pseudoinverse [71–73]. It is assumed that the estimation of H†(t) is ideal,so that H†(t)H(t) = IN×N . If the latter does not hold, residual cross-talk willdegrade the performance of the system. The system has to adapt to changes inthe value of the elements hi,j(t). The temporal behavior of the system will beinvestigated in Chapter 5.
Equation (2.13) shows that the noise term n(t) changes to a new value H†(t)n(t).This induces a power penalty to maintain the desired value of signal-to-noise ra-tio (SNR). In the following, this power penalty is calculated1. In the calculationthat follows, the term nde(t) is neglected, in order to isolate the influence of ma-trix inversion. We distinguish two cases where either shot or thermal noise is theprevalent noise source. Shot noise is due to the discreteness of photons and elec-trons as well as due to the stochastic electron-hole recombination in semiconductormaterials [17]. It poses a fundamental limit to the sensitivity of the receiver of anoptical link. Thermal noise is due to the random thermal motion of electrons insideelectrical conductors and it is proportional to the absolute temperature [16, 17].Both shot and thermal noise are assumed to be added to the received signals.
Let SNRj denote the SNR at the jth electrical output of the MGDM system,i.e. at the jth output port of the electrical circuit that performs the demultiplex-ing based on matrix inversion. The number of the electrical output ports of the
1This calculation was first introduced for on-off keying modulation by Alfonso Martinez (Sig-nal Processing Systems group, Eindhoven University of Technology, the Netherlands).
24 Model of an M ×N MGDM system
demultiplexer is N . At the jth output port, the signal that propagates over thejth mode group should appear. SNRj is given by
SNRj =(RPj)2
σ2j
, (2.14)
where R is the responsivity of the detectors, Pj is the average received opticalpower from the jth mode group and σ2
j the noise variance. It is assumed thatall M detectors have the same responsivity. The variance of the noise at the jthelectrical output of the system is
σ2j = E
[( M∑
k=1
h†j,knk
)2]
=M∑
k=1
(h†j,k)2 Var(nk
), (2.15)
where nk are the statistically independent elements of the noise vector n withzero mean value, and E, Var denote the expected value and the variance of arandom variable, respectively. Vector n expresses noise at the M input ports ofthe electronic demultiplexer. When shot noise prevails, Var
(nk
)is proportional
to the optical power [16, 17], i.e.,
Var(nk
)∣∣shot
∝N∑
l=1
hk,lPl, (2.16)
while when noise is dominated by thermal noise, Var(nk
)is independent of the
optical power [16, 17], i.e.,
Var(nk
)∣∣thermal
= σ2thermal. (2.17)
The SNR of the single-channel case is SNR0 = (RP0)2/ Var(nk
), where P0 is the
average received optical power, Var(nk
)∣∣shot
∝ P0 and Var(nk
)∣∣thermal
= σ2thermal.
To ensure that SNRj = SNR0, the value of Pj will differ from the value of P0, andtherefore the following optical power penalty will be induced at the thermal noiselimit:
Pj
P0
∣∣∣∣thermal
=
√√√√M∑
k=1
(h†j,k)2. (2.18)
At the shot noise limit, assuming equal value of Pj for j = 1 . . . N , the opticalpower penalty is
Pj
P0
∣∣∣∣shot
=M∑
k=1
N∑
l=1
(h†j,k)2hk,l. (2.19)
In order SNRj ≥ SNR0, ∀j, at the shot noise limit, the actual power penalty at ev-ery channel will equal the maximum of the power penalties calculated with (2.19).The above power penalty is with regard to the SNR. Other metrics, such as thebit-error rate could be used. The SNR was chosen as a suitable metric for atransmission system transparent to the signal format.
2.4 The effect of noise on an MGDM system 25
2.4.2 Modal noise
In MMF links, the SNR can be degraded by modal noise [16, 17, 74, 75]. At theoutput end of the MMF, light distribution exhibits a speckle pattern. Temporalvariations of this speckle pattern that is detected by the photodiode, in combina-tion with spatial filtering are translated into intensity variations. Spatial filteringis often due to connector misalignments and splices. Additionally, in MGDM theoptical power at the GI-MMF output end is split among M detectors. Further,MGDM uses restricted excitation of the MMF and this may increase the varianceof modal noise compared to the case of overfilled launch [76]. However, at thesame time, an MGDM system uses adaptive estimation of the transmission ma-trix. Therefore only changes in the optical intensity seen by each detector thatoccur faster than the adaptation rate will be manifest as modal noise.
Modal noise does not pose a fundamental limit to the system performanceand it can be combatted with a proper system design. The speckle pattern isdue to interference among the modes. It depends on the optical spectrum of thesources as well as on the length of the MMF [74, 75]. Mechanical disturbances anddeformation of the MMF, e.g. due to temperature variations, will affect the specklepattern. The same holds for variations of the optical spectrum of the sources. Thenarrower the spectrum of the optical source, the larger its coherence time andthe larger the contrast in the speckle pattern. Phase (or frequency) noise of theoptical source tends to widen the optical spectrum. Employing light emittingdiodes (LEDs) can eliminate modal noise. Of course, this limits the bandwidth ofthe transmitted signals and it is not a good choice for a system that uses selectiveexcitation of GI-MMFs, due to the large angular divergence of light emitted byLEDs.
The use of relative wide-spectrum optical sources is beneficial for both thelinearity of an MGDM link, as discussed in Section 2.2, and the reduction ofmodal noise. This is in line with the use of MMFs in short reach networks, wherethe low cost of the related components is a key parameter.
2.4.3 Relative intensity noise
The output optical power from semiconductor lasers can fluctuate, even whenthe laser is driven by a constant current. This is due to spontaneous emissionand electron-hole recombination. In semiconductor lasers, the power fluctuationsare attributed primarily to spontaneous emission [17]. This effect is referred toas relative intensity noise (RIN) and it can degrade the SNR of the transmittedsignals. In an optical communication system, RIN can increase due to reflections.If nRIN (t) is the N × 1 RIN signal vector in an MGDM system, the vector of thereceived electrical signals will be
sR(t) = H(t)[sT (t) + nRIN (t)] + n(t), (2.20)
26 Model of an M ×N MGDM system
and therefore ideal matrix inversion will not change the variance of RIN, since
H†(t)sR(t) = sT (t) + nRIN (t) + H†(t)n(t). (2.21)
The difference between RIN and thermal or shot noise is that noise variablesat each detector due to RIN, i.e. the elements of HnRIN , are not statisticallyindependent, since the noise source is at the transmitting side of the link. Thesame holds for any noise that is generated at the transmitting side, e.g. thermalnoise from the laser drivers.
2.5 Bandwidth limitations
An attractive feature of optical communication systems is that they support broad-band transmission. As discussed above, an MGDM system can be characterizedby a real-valued matrix as long as the fields of the mode groups at the outputend of the GI-MMF are mutually incoherent and dispersion does not pose a lim-itation. This is because a real-valued matrix cannot account for any differentialdelay. In MGDM, H simply expresses the spatial diversity. Further, as discussedin Section 2.2, dispersion combined with spatial filtering can further induce signaldistortion, due to the non-orthogonality of the modal fields over a finite area ofdetection. We can then conclude that in an MGDM system the transmission band-width is limited by fiber dispersion. Different transmission formats have a differenttolerance with respect to dispersion. How severe is the bandwidth limitation fromdispersion in GI-MMFs?
To answer this last question, we should first try to identify what is meantby broadband transmission. For the residential user, where the word broadbandcommonly applies, any connection that offers a bit rate of a few Mbit/s is consid-ered broadband. Such connections are widely provided by digital subscriber line(DSL) techniques. Certainly, the DSL bandwidth can be easily furnished by fiberconnections and therefore an optical fiber infrastructure is a broadband one. Fur-thermore, estimations for the future bandwidth demands of the residential user aredebated. Predictions vary from a few hundreds of MHz to a few GHz. An MMFinfrastructure offers more scalability to the bandwidth of an in-house network thanany solution based on copper.
Dispersion in MMFs depends on the refractive index profile, the excitation anddetection conditions as well as mode mixing. GI-MMFs have much lower dispersionthan SI-MMFs and this is the main reason for their preferred use. In MMFtransmission, selective excitation and detection affect the dispersive properties ofthe communication channel. Excitation of a single mode would correspond to SMFoperation and maximization of the transmission bandwidth. When more than twomodes are excited and detected, which is the standard case, the total dispersiondepends on the differential delays among the modes. Beyond two, the number ofexcited modes is not therefore the most significant factor for the bandwidth. Itis common to estimate the bandwidth of an IM-DD MMF channel for overfilled
2.6 The relation between M and N 27
launch, i.e. when all modes are equally excited. This condition can be achievedwith a mode scrambler at the input end of the MMF. A reliable technique that canenhance by up to four times the bandwidth of silica-based GI-MMFs, even of oneswith a non-optimal refractive index profile, is the offset launch technique [70, 77].This technique uses selective excitation of a large group of higher order modeswith relatively comparable propagation delays. This excitation is achieved witha Gaussian-like beam launched onto the GI-MMF input facet with a radial offsetfrom the GI-MMF axis.
In modern silica-based GI-MMFs, optimal refractive index profiles minimizeboth differential mode delay and mode mixing, easily allowing for a bandwidth ofseveral GHz over a few hundred meters of GI-MMF. In a recent experiment by Yamet. al. [78], 40 Gbit/s IM-DD transmission at 1551.73 nm over 3.4 km GI-MMF of50/125 µm core/cladding diameter was demonstrated using on-off keying, return-to-zero format and transceivers for SMF links. GI-POFs also allow for a few GHztransmission bandwidth over a few hundreds of meters long links [18]. Further,it should be noted that because MGDM supports signal format transparency,spectrally efficient modulation formats, such as quadrature amplitude modulation,can be used [79, 80].
2.6 The relation between M and N
The M ×N linear system of Eq. (2.1) describes an M ×N MGDM transmissionsystem. The existence and number of solutions of an M ×N linear system dependon the relation between M and N , as well as on the system matrix, which in thecase of an MGDM system is the transmission matrix H. If N > M , the systemcan have infinitely many solutions or no solutions at all. If M > N any optionis possible, i.e. no solutions at all, infinitely many solutions or a unique solution.If M = N the system has a unique solution if H is non-singular. In MGDM,the transmitted signals sT should be determined by the received signals sR andthe transmission matrix H. When the system has infinitely many solutions, itis impossible to find sT by simply knowing H and sR. Some of the elements ofsT should be also known. This makes such a case impractical and therefore thesystem must have a unique solution. This implies that, in principle,
M ≥ N.
In the case of M > N , it is a requirement of the link design to yield a system witha unique solution.
From the noise point of view, when the system is limited by thermal noiseat the receiver, it is favorable for the SNR to have M = N . This is becausethermal noise at each of the M electrical outputs has a given variance, while asM increases the received optical power per detector decreases. Considering modalnoise, it is also favorable that M has the lowest possible value, i.e. M = N , sincethe larger the detecting area is, the smaller the variance of the modal noise will
28 Model of an M ×N MGDM system
be. When shot noise is the limiting factor, the SNR value is proportional to thereceived optical power [17]. Therefore it is beneficial that each detector receivesthe maximum possible power, which prescribes M = N . For these reasons, in thefollowing chapters we will consider the case of
M = N.
Our goal will be to design an N ×N system for which the diagonal elements hi,i
have a larger value than the rest of the elements. In this case, the system’s matrixis said to be a diagonally dominant one. The case H = IN×N , where IN×N is theN ×N identity matrix, represents the ideal scenario where the channels are fullyseparate in the optical intensity domain and no electronic separation is required.
2.7 Conclusions
An MGDM transmission system is described by the linear system of Eq. (2.1),provided that the intensity profiles of the detected mode groups can be simplyadded. In the most general case, without considering the amount of spatial over-lap among the fields of the detected mode groups, this implies that the fields of themode groups at the detection plane must be mutually incoherent. An experimen-tal example of non-linear response was given, in which optical heterodyning wasobserved at the output end of a 100 m long 50/125 µm silica-based GI-MMF, withtwo tunable lasers of narrow linewidth and slightly different central wavelengths atthe input end of the GI-MMF. In practice, mutual incoherence can be achieved byusing optical sources with a relatively wide optical spectrum, which also benefitsthe reduction of modal noise. The adaptivity of the MGDM system can partiallycompensate for modal noise. When the effect of dispersion can be neglected, thetransmission matrix elements hi,j are real-valued expressing the portion of thetotal received power from the jth (1 ≤ j ≤ N) mode group that is seen by theith (1 ≤ i ≤ M) detector. Electronic demultiplexing based on matrix inversioncan separate the channels irrespective of the signal format. The influence of shotnoise and thermal noise, at the receiver, on the variance of the output signals afterelectronic demultiplexing based on matrix inversion has been derived. The powerpenalty which is then induced to maintain the SNR of the single-channel casehas been calculated. Electronic matrix inversion does not affect the variance ofrelative intensity noise, compared to the single-channel case. SNR considerationsimply that M = N is the preferred choice, which means that H should be a squarematrix.
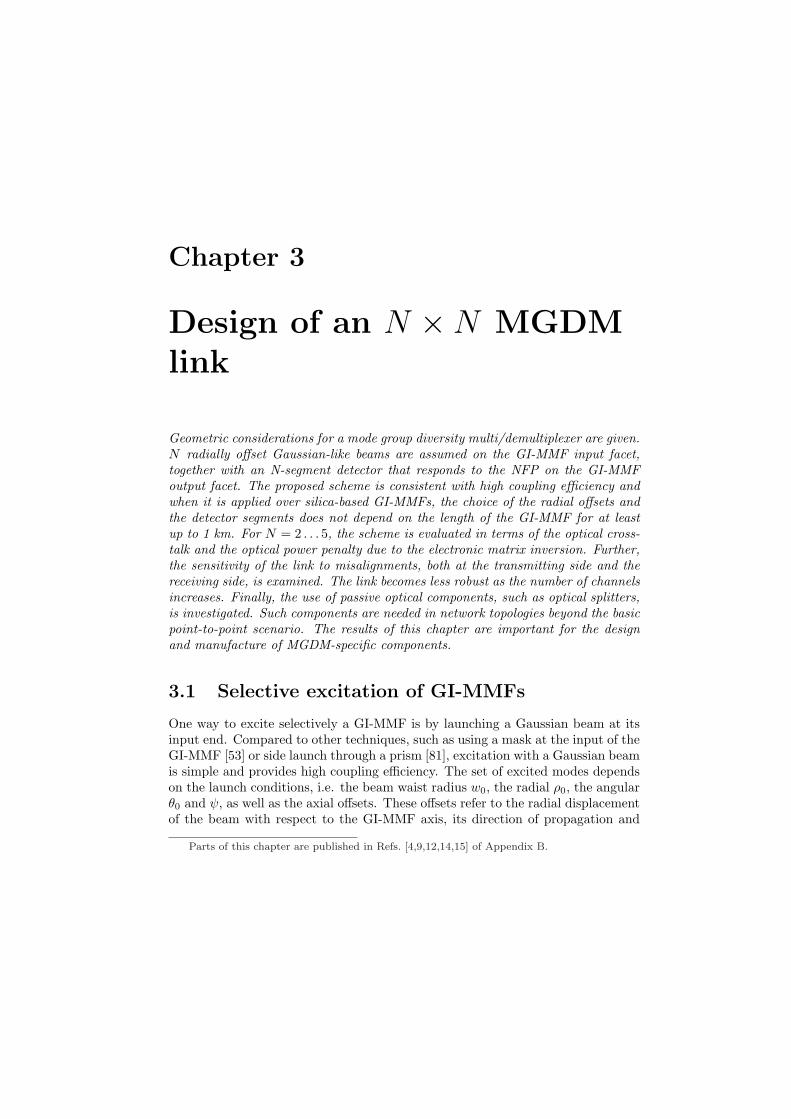
Chapter 3
Design of an N ×N MGDMlink
Geometric considerations for a mode group diversity multi/demultiplexer are given.N radially offset Gaussian-like beams are assumed on the GI-MMF input facet,together with an N-segment detector that responds to the NFP on the GI-MMFoutput facet. The proposed scheme is consistent with high coupling efficiency andwhen it is applied over silica-based GI-MMFs, the choice of the radial offsets andthe detector segments does not depend on the length of the GI-MMF for at leastup to 1 km. For N = 2 . . . 5, the scheme is evaluated in terms of the optical cross-talk and the optical power penalty due to the electronic matrix inversion. Further,the sensitivity of the link to misalignments, both at the transmitting side and thereceiving side, is examined. The link becomes less robust as the number of channelsincreases. Finally, the use of passive optical components, such as optical splitters,is investigated. Such components are needed in network topologies beyond the basicpoint-to-point scenario. The results of this chapter are important for the designand manufacture of MGDM-specific components.
3.1 Selective excitation of GI-MMFs
One way to excite selectively a GI-MMF is by launching a Gaussian beam at itsinput end. Compared to other techniques, such as using a mask at the input of theGI-MMF [53] or side launch through a prism [81], excitation with a Gaussian beamis simple and provides high coupling efficiency. The set of excited modes dependson the launch conditions, i.e. the beam waist radius w0, the radial ρ0, the angularθ0 and ψ, as well as the axial offsets. These offsets refer to the radial displacementof the beam with respect to the GI-MMF axis, its direction of propagation and
Parts of this chapter are published in Refs. [4,9,12,14,15] of Appendix B.
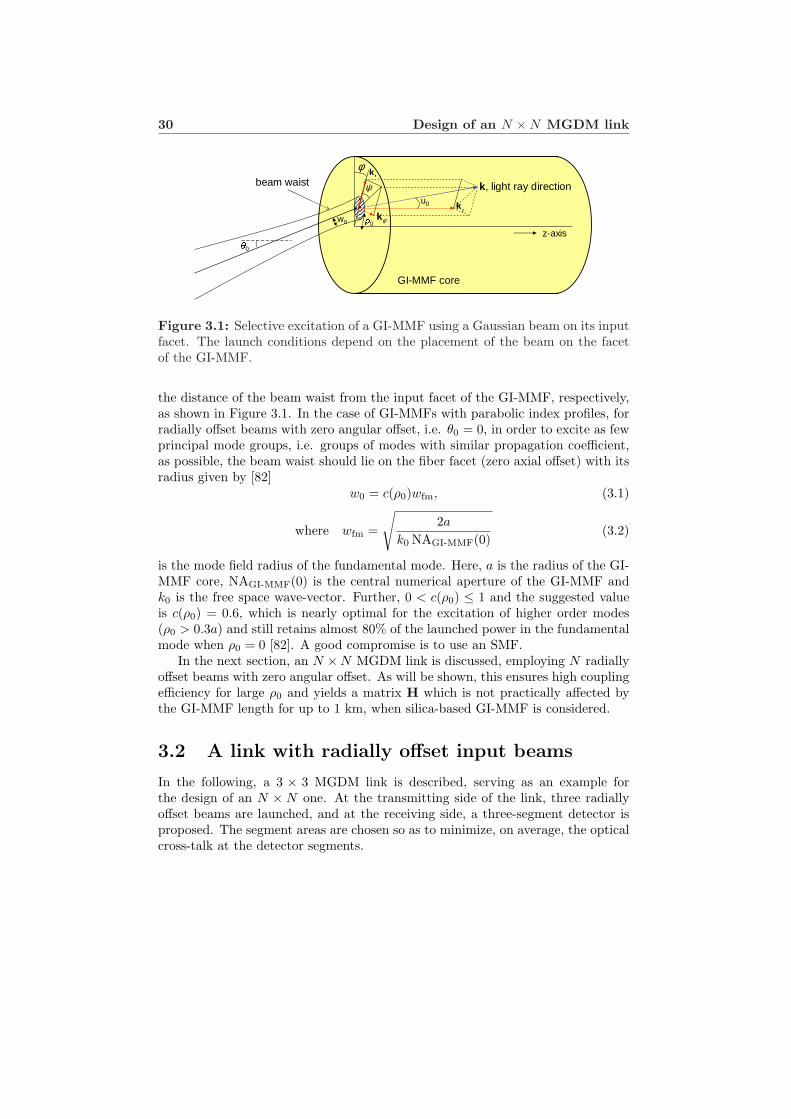
30 Design of an N ×N MGDM link
z-axis
k, light ray direction
GI-MMF core
beam waistrk
zkφk
φ
ψρ0w0θ0
u0
Figure 3.1: Selective excitation of a GI-MMF using a Gaussian beam on its inputfacet. The launch conditions depend on the placement of the beam on the facetof the GI-MMF.
the distance of the beam waist from the input facet of the GI-MMF, respectively,as shown in Figure 3.1. In the case of GI-MMFs with parabolic index profiles, forradially offset beams with zero angular offset, i.e. θ0 = 0, in order to excite as fewprincipal mode groups, i.e. groups of modes with similar propagation coefficient,as possible, the beam waist should lie on the fiber facet (zero axial offset) with itsradius given by [82]
w0 = c(ρ0)wfm, (3.1)
where wfm =
√2a
k0 NAGI-MMF(0)(3.2)
is the mode field radius of the fundamental mode. Here, a is the radius of the GI-MMF core, NAGI-MMF(0) is the central numerical aperture of the GI-MMF andk0 is the free space wave-vector. Further, 0 < c(ρ0) ≤ 1 and the suggested valueis c(ρ0) = 0.6, which is nearly optimal for the excitation of higher order modes(ρ0 > 0.3a) and still retains almost 80% of the launched power in the fundamentalmode when ρ0 = 0 [82]. A good compromise is to use an SMF.
In the next section, an N ×N MGDM link is discussed, employing N radiallyoffset beams with zero angular offset. As will be shown, this ensures high couplingefficiency for large ρ0 and yields a matrix H which is not practically affected bythe GI-MMF length for up to 1 km, when silica-based GI-MMF is considered.
3.2 A link with radially offset input beams
In the following, a 3 × 3 MGDM link is described, serving as an example forthe design of an N × N one. At the transmitting side of the link, three radiallyoffset beams are launched, and at the receiving side, a three-segment detector isproposed. The segment areas are chosen so as to minimize, on average, the opticalcross-talk at the detector segments.
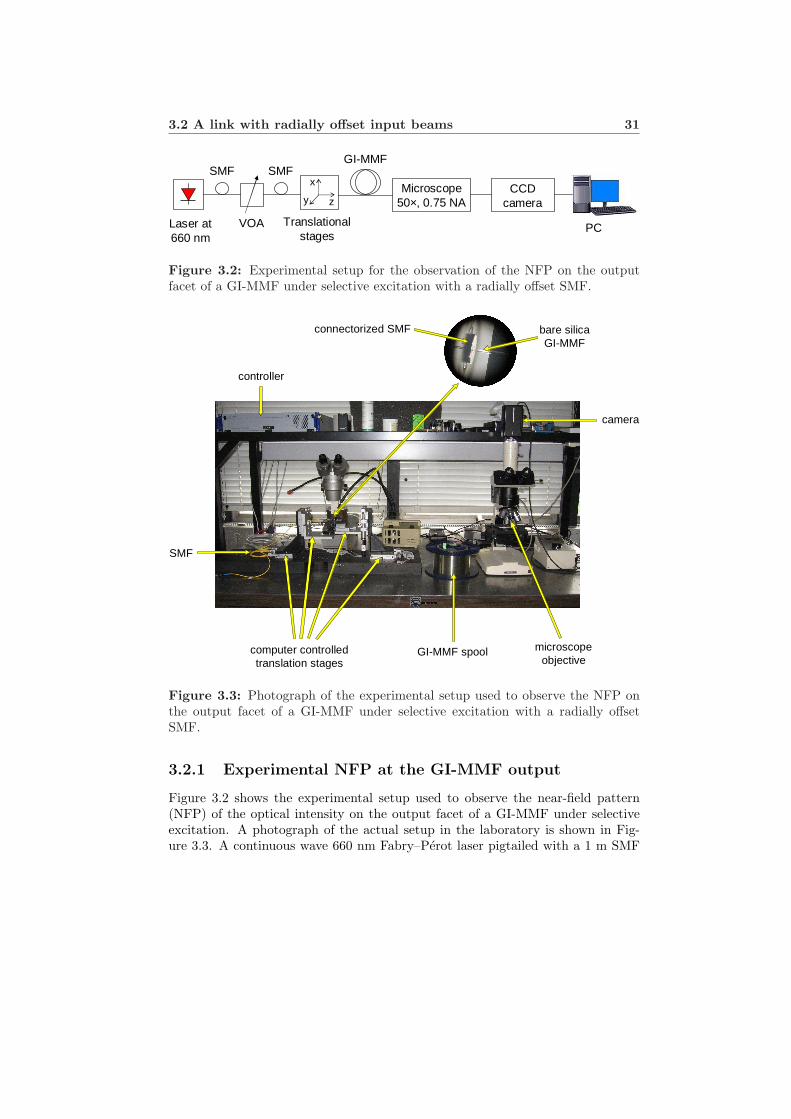
3.2 A link with radially offset input beams 31
CCD camera
GI-MMF
Microscope50×, 0.75 NA
PCLaser at 660 nm
VOA
SMFSMF
Translationalstages
x
y z
Figure 3.2: Experimental setup for the observation of the NFP on the outputfacet of a GI-MMF under selective excitation with a radially offset SMF.
computer controlledtranslation stages
bare silicaGI-MMF
connectorized SMF
GI-MMF spool microscopeobjective
SMF
camera
controller
Figure 3.3: Photograph of the experimental setup used to observe the NFP onthe output facet of a GI-MMF under selective excitation with a radially offsetSMF.
3.2.1 Experimental NFP at the GI-MMF output
Figure 3.2 shows the experimental setup used to observe the near-field pattern(NFP) of the optical intensity on the output facet of a GI-MMF under selectiveexcitation. A photograph of the actual setup in the laboratory is shown in Fig-ure 3.3. A continuous wave 660 nm Fabry–Perot laser pigtailed with a 1 m SMF
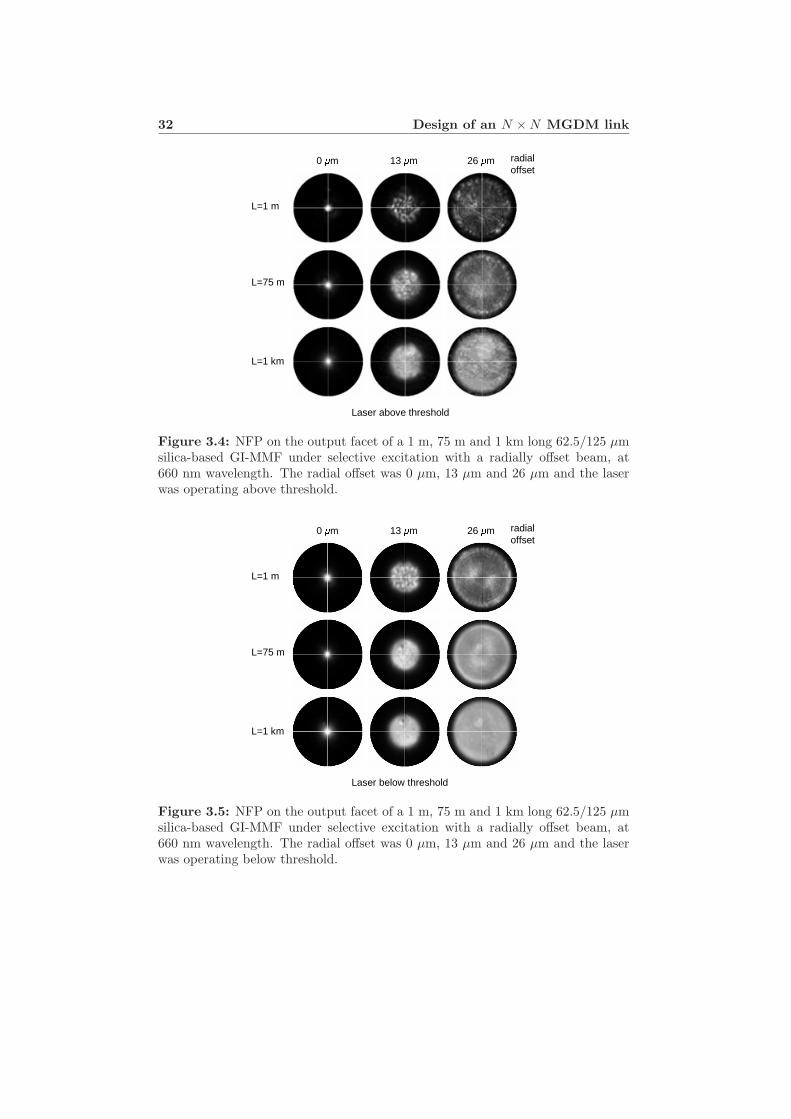
32 Design of an N ×N MGDM link
0 µm 13 µm 26 µm radial offset
L=1 km
L=75 m
L=1 m
Laser above threshold
Figure 3.4: NFP on the output facet of a 1 m, 75 m and 1 km long 62.5/125 µmsilica-based GI-MMF under selective excitation with a radially offset beam, at660 nm wavelength. The radial offset was 0 µm, 13 µm and 26 µm and the laserwas operating above threshold.
0 µm 13 µm 26 µm radial offset
L=1 km
L=75 m
L=1 m
Laser below threshold
Figure 3.5: NFP on the output facet of a 1 m, 75 m and 1 km long 62.5/125 µmsilica-based GI-MMF under selective excitation with a radially offset beam, at660 nm wavelength. The radial offset was 0 µm, 13 µm and 26 µm and the laserwas operating below threshold.
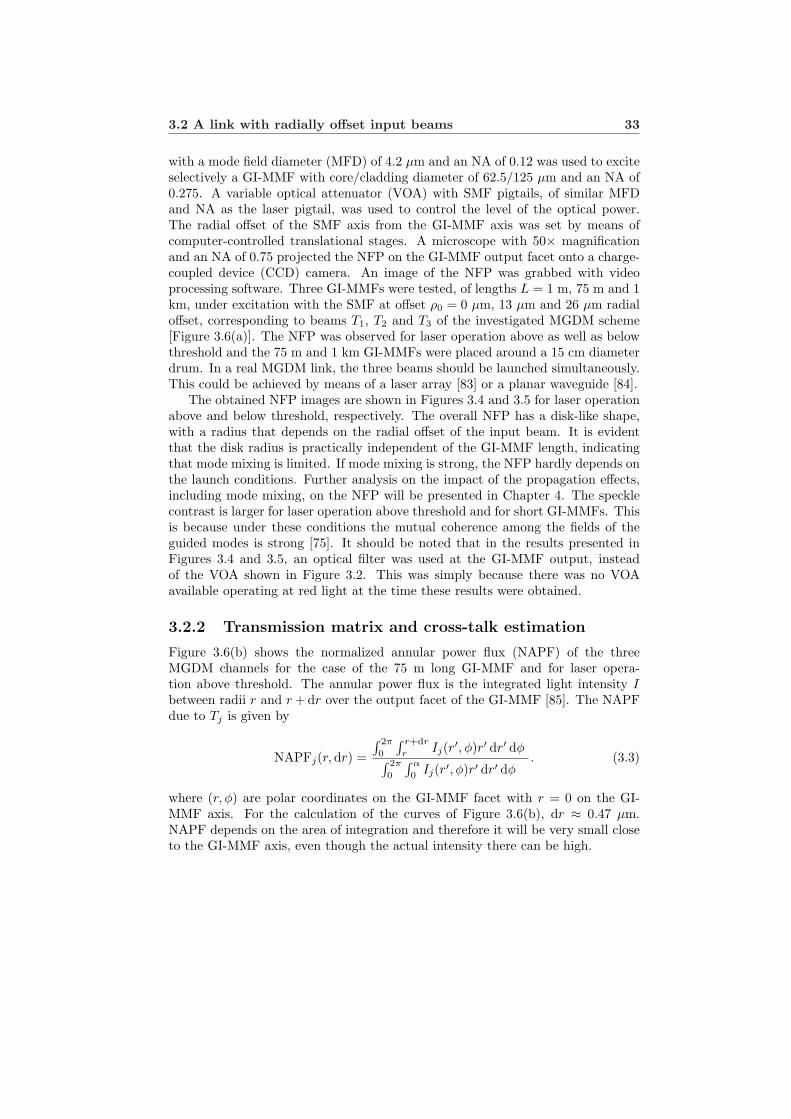
3.2 A link with radially offset input beams 33
with a mode field diameter (MFD) of 4.2 µm and an NA of 0.12 was used to exciteselectively a GI-MMF with core/cladding diameter of 62.5/125 µm and an NA of0.275. A variable optical attenuator (VOA) with SMF pigtails, of similar MFDand NA as the laser pigtail, was used to control the level of the optical power.The radial offset of the SMF axis from the GI-MMF axis was set by means ofcomputer-controlled translational stages. A microscope with 50× magnificationand an NA of 0.75 projected the NFP on the GI-MMF output facet onto a charge-coupled device (CCD) camera. An image of the NFP was grabbed with videoprocessing software. Three GI-MMFs were tested, of lengths L = 1 m, 75 m and 1km, under excitation with the SMF at offset ρ0 = 0 µm, 13 µm and 26 µm radialoffset, corresponding to beams T1, T2 and T3 of the investigated MGDM scheme[Figure 3.6(a)]. The NFP was observed for laser operation above as well as belowthreshold and the 75 m and 1 km GI-MMFs were placed around a 15 cm diameterdrum. In a real MGDM link, the three beams should be launched simultaneously.This could be achieved by means of a laser array [83] or a planar waveguide [84].
The obtained NFP images are shown in Figures 3.4 and 3.5 for laser operationabove and below threshold, respectively. The overall NFP has a disk-like shape,with a radius that depends on the radial offset of the input beam. It is evidentthat the disk radius is practically independent of the GI-MMF length, indicatingthat mode mixing is limited. If mode mixing is strong, the NFP hardly depends onthe launch conditions. Further analysis on the impact of the propagation effects,including mode mixing, on the NFP will be presented in Chapter 4. The specklecontrast is larger for laser operation above threshold and for short GI-MMFs. Thisis because under these conditions the mutual coherence among the fields of theguided modes is strong [75]. It should be noted that in the results presented inFigures 3.4 and 3.5, an optical filter was used at the GI-MMF output, insteadof the VOA shown in Figure 3.2. This was simply because there was no VOAavailable operating at red light at the time these results were obtained.
3.2.2 Transmission matrix and cross-talk estimation
Figure 3.6(b) shows the normalized annular power flux (NAPF) of the threeMGDM channels for the case of the 75 m long GI-MMF and for laser opera-tion above threshold. The annular power flux is the integrated light intensity Ibetween radii r and r + dr over the output facet of the GI-MMF [85]. The NAPFdue to Tj is given by
NAPFj(r,dr) =
∫ 2π
0
∫ r+dr
rIj(r′, φ)r′ dr′ dφ∫ 2π
0
∫ α
0Ij(r′, φ)r′ dr′ dφ
. (3.3)
where (r, φ) are polar coordinates on the GI-MMF facet with r = 0 on the GI-MMF axis. For the calculation of the curves of Figure 3.6(b), dr ≈ 0.47 µm.NAPF depends on the area of integration and therefore it will be very small closeto the GI-MMF axis, even though the actual intensity there can be high.
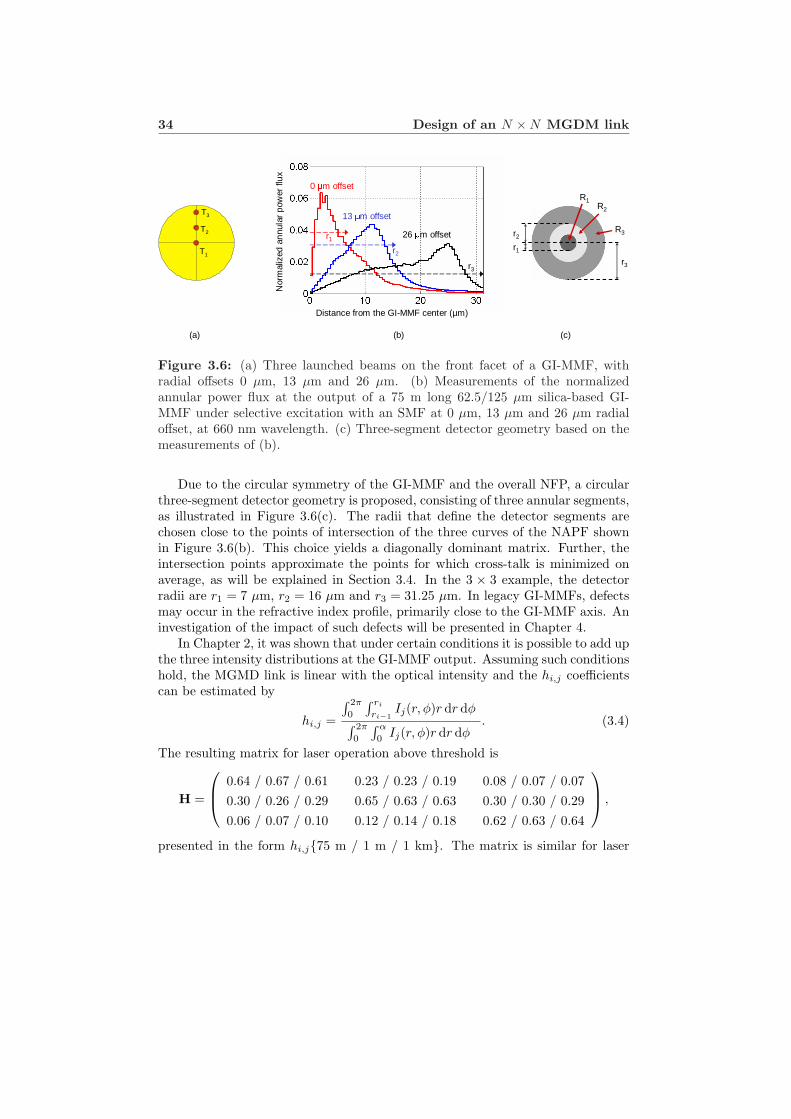
34 Design of an N ×N MGDM link
T3
T1
T2 R3
R2
R1
r2
r1
r3
(b) (c)
0 µm offset
13 µm offset
26 µm offset
Nor
mal
ized
an
nula
r p
ower
flu
x
Distance from the GI-MMF center (µm)
r1
r2
r3
(a)
Figure 3.6: (a) Three launched beams on the front facet of a GI-MMF, withradial offsets 0 µm, 13 µm and 26 µm. (b) Measurements of the normalizedannular power flux at the output of a 75 m long 62.5/125 µm silica-based GI-MMF under selective excitation with an SMF at 0 µm, 13 µm and 26 µm radialoffset, at 660 nm wavelength. (c) Three-segment detector geometry based on themeasurements of (b).
Due to the circular symmetry of the GI-MMF and the overall NFP, a circularthree-segment detector geometry is proposed, consisting of three annular segments,as illustrated in Figure 3.6(c). The radii that define the detector segments arechosen close to the points of intersection of the three curves of the NAPF shownin Figure 3.6(b). This choice yields a diagonally dominant matrix. Further, theintersection points approximate the points for which cross-talk is minimized onaverage, as will be explained in Section 3.4. In the 3 × 3 example, the detectorradii are r1 = 7 µm, r2 = 16 µm and r3 = 31.25 µm. In legacy GI-MMFs, defectsmay occur in the refractive index profile, primarily close to the GI-MMF axis. Aninvestigation of the impact of such defects will be presented in Chapter 4.
In Chapter 2, it was shown that under certain conditions it is possible to add upthe three intensity distributions at the GI-MMF output. Assuming such conditionshold, the MGMD link is linear with the optical intensity and the hi,j coefficientscan be estimated by
hi,j =
∫ 2π
0
∫ ri
ri−1Ij(r, φ)r dr dφ
∫ 2π
0
∫ α
0Ij(r, φ)r dr dφ
. (3.4)
The resulting matrix for laser operation above threshold is
H =
0.64 / 0.67 / 0.61 0.23 / 0.23 / 0.19 0.08 / 0.07 / 0.070.30 / 0.26 / 0.29 0.65 / 0.63 / 0.63 0.30 / 0.30 / 0.290.06 / 0.07 / 0.10 0.12 / 0.14 / 0.18 0.62 / 0.63 / 0.64
,
presented in the form hi,j{75 m / 1 m / 1 km}. The matrix is similar for laser
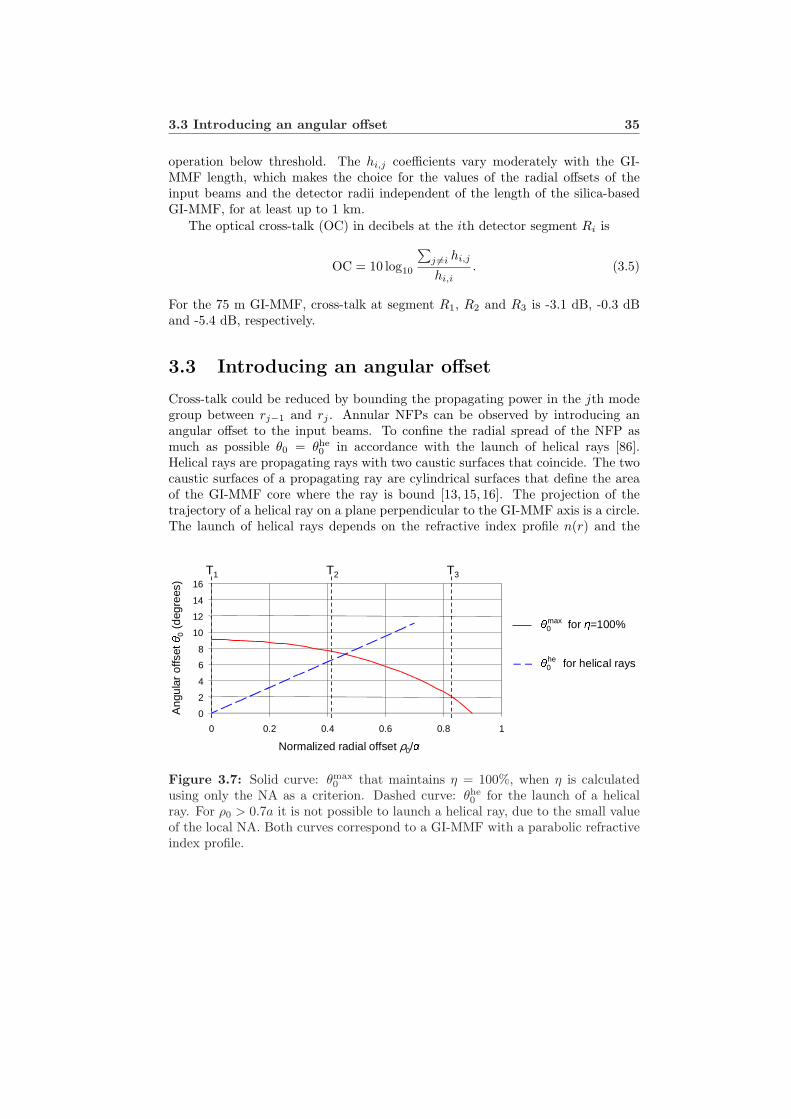
3.3 Introducing an angular offset 35
operation below threshold. The hi,j coefficients vary moderately with the GI-MMF length, which makes the choice for the values of the radial offsets of theinput beams and the detector radii independent of the length of the silica-basedGI-MMF, for at least up to 1 km.
The optical cross-talk (OC) in decibels at the ith detector segment Ri is
OC = 10 log10
∑j 6=i hi,j
hi,i. (3.5)
For the 75 m GI-MMF, cross-talk at segment R1, R2 and R3 is -3.1 dB, -0.3 dBand -5.4 dB, respectively.
3.3 Introducing an angular offset
Cross-talk could be reduced by bounding the propagating power in the jth modegroup between rj−1 and rj . Annular NFPs can be observed by introducing anangular offset to the input beams. To confine the radial spread of the NFP asmuch as possible θ0 = θhe
0 in accordance with the launch of helical rays [86].Helical rays are propagating rays with two caustic surfaces that coincide. The twocaustic surfaces of a propagating ray are cylindrical surfaces that define the areaof the GI-MMF core where the ray is bound [13, 15, 16]. The projection of thetrajectory of a helical ray on a plane perpendicular to the GI-MMF axis is a circle.The launch of helical rays depends on the refractive index profile n(r) and the
T2 T3 θ0 for helical rays
0
2
4
6
8
10
12
14
16
0 0.2 0.4 0.6 0.8 1
Normalized radial offset ρ0/αAng
ular
offs
et θ0(degrees) θ0 for η=100%
T1
max
he
Figure 3.7: Solid curve: θmax0 that maintains η = 100%, when η is calculated
using only the NA as a criterion. Dashed curve: θhe0 for the launch of a helical
ray. For ρ0 > 0.7a it is not possible to launch a helical ray, due to the small valueof the local NA. Both curves correspond to a GI-MMF with a parabolic refractiveindex profile.
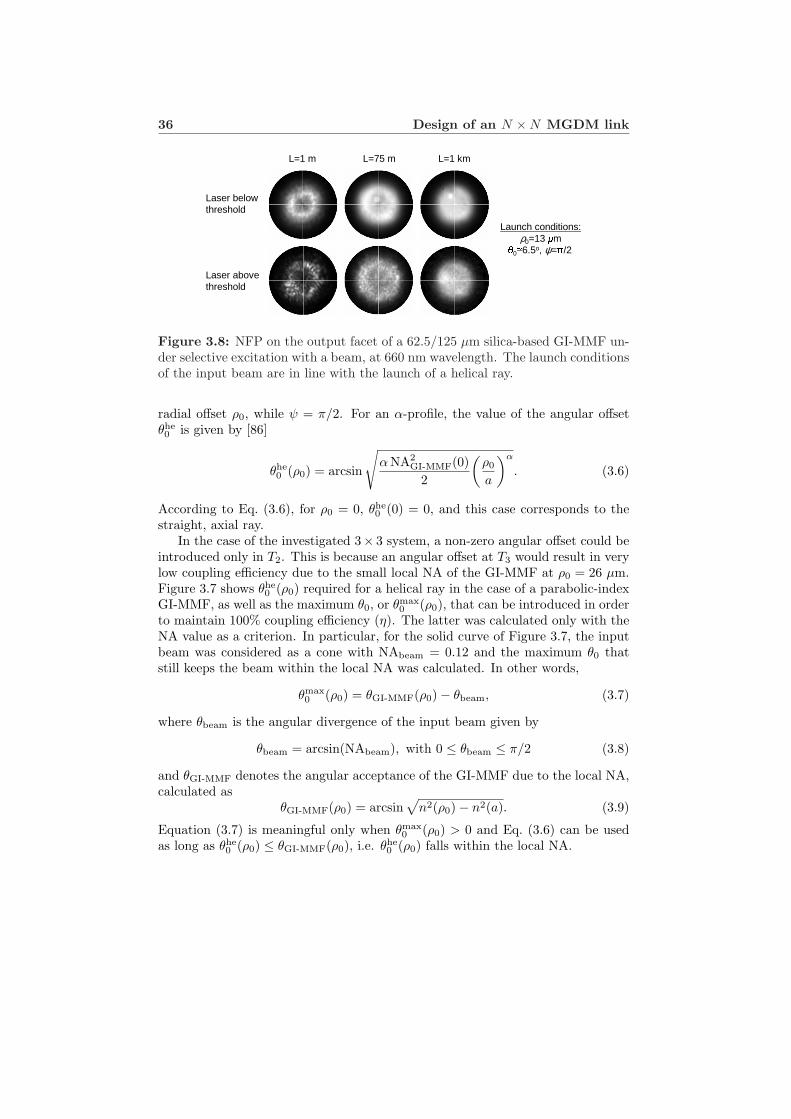
36 Design of an N ×N MGDM link
L=1 m L=75 m L=1 km
Laser below threshold
Laser above threshold
Launch conditions:ρ0=13 µmθ0≃6.5o, ψ=π/2
Figure 3.8: NFP on the output facet of a 62.5/125 µm silica-based GI-MMF un-der selective excitation with a beam, at 660 nm wavelength. The launch conditionsof the input beam are in line with the launch of a helical ray.
radial offset ρ0, while ψ = π/2. For an α-profile, the value of the angular offsetθhe0 is given by [86]
θhe0 (ρ0) = arcsin
√α NA2
GI-MMF(0)2
(ρ0
a
)α
. (3.6)
According to Eq. (3.6), for ρ0 = 0, θhe0 (0) = 0, and this case corresponds to the
straight, axial ray.In the case of the investigated 3× 3 system, a non-zero angular offset could be
introduced only in T2. This is because an angular offset at T3 would result in verylow coupling efficiency due to the small local NA of the GI-MMF at ρ0 = 26 µm.Figure 3.7 shows θhe
0 (ρ0) required for a helical ray in the case of a parabolic-indexGI-MMF, as well as the maximum θ0, or θmax
0 (ρ0), that can be introduced in orderto maintain 100% coupling efficiency (η). The latter was calculated only with theNA value as a criterion. In particular, for the solid curve of Figure 3.7, the inputbeam was considered as a cone with NAbeam = 0.12 and the maximum θ0 thatstill keeps the beam within the local NA was calculated. In other words,
θmax0 (ρ0) = θGI-MMF(ρ0)− θbeam, (3.7)
where θbeam is the angular divergence of the input beam given by
θbeam = arcsin(NAbeam), with 0 ≤ θbeam ≤ π/2 (3.8)
and θGI-MMF denotes the angular acceptance of the GI-MMF due to the local NA,calculated as
θGI-MMF(ρ0) = arcsin√
n2(ρ0)− n2(a). (3.9)
Equation (3.7) is meaningful only when θmax0 (ρ0) > 0 and Eq. (3.6) can be used
as long as θhe0 (ρ0) ≤ θGI-MMF(ρ0), i.e. θhe
0 (ρ0) falls within the local NA.
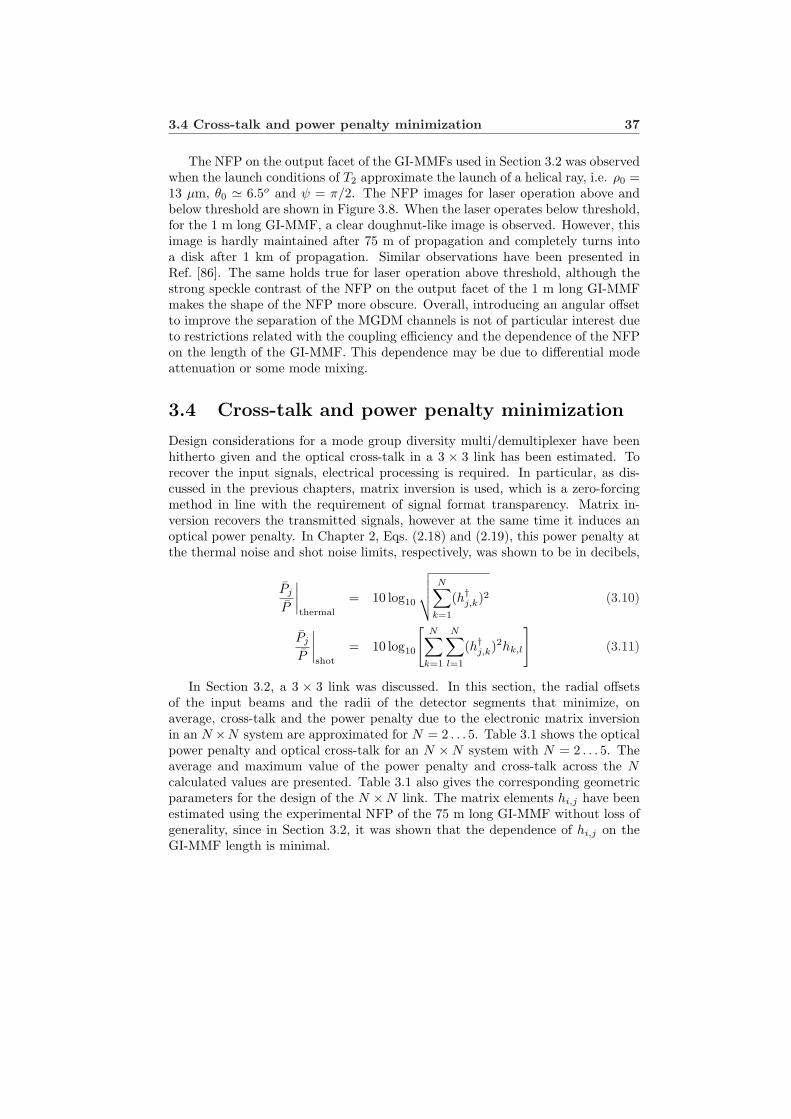
3.4 Cross-talk and power penalty minimization 37
The NFP on the output facet of the GI-MMFs used in Section 3.2 was observedwhen the launch conditions of T2 approximate the launch of a helical ray, i.e. ρ0 =13 µm, θ0 ' 6.5o and ψ = π/2. The NFP images for laser operation above andbelow threshold are shown in Figure 3.8. When the laser operates below threshold,for the 1 m long GI-MMF, a clear doughnut-like image is observed. However, thisimage is hardly maintained after 75 m of propagation and completely turns intoa disk after 1 km of propagation. Similar observations have been presented inRef. [86]. The same holds true for laser operation above threshold, although thestrong speckle contrast of the NFP on the output facet of the 1 m long GI-MMFmakes the shape of the NFP more obscure. Overall, introducing an angular offsetto improve the separation of the MGDM channels is not of particular interest dueto restrictions related with the coupling efficiency and the dependence of the NFPon the length of the GI-MMF. This dependence may be due to differential modeattenuation or some mode mixing.
3.4 Cross-talk and power penalty minimization
Design considerations for a mode group diversity multi/demultiplexer have beenhitherto given and the optical cross-talk in a 3 × 3 link has been estimated. Torecover the input signals, electrical processing is required. In particular, as dis-cussed in the previous chapters, matrix inversion is used, which is a zero-forcingmethod in line with the requirement of signal format transparency. Matrix in-version recovers the transmitted signals, however at the same time it induces anoptical power penalty. In Chapter 2, Eqs. (2.18) and (2.19), this power penalty atthe thermal noise and shot noise limits, respectively, was shown to be in decibels,
Pj
P
∣∣∣∣thermal
= 10 log10
√√√√N∑
k=1
(h†j,k)2 (3.10)
Pj
P
∣∣∣∣shot
= 10 log10
[N∑
k=1
N∑
l=1
(h†j,k)2hk,l
](3.11)
In Section 3.2, a 3 × 3 link was discussed. In this section, the radial offsetsof the input beams and the radii of the detector segments that minimize, onaverage, cross-talk and the power penalty due to the electronic matrix inversionin an N ×N system are approximated for N = 2 . . . 5. Table 3.1 shows the opticalpower penalty and optical cross-talk for an N ×N system with N = 2 . . . 5. Theaverage and maximum value of the power penalty and cross-talk across the Ncalculated values are presented. Table 3.1 also gives the corresponding geometricparameters for the design of the N ×N link. The matrix elements hi,j have beenestimated using the experimental NFP of the 75 m long GI-MMF without loss ofgenerality, since in Section 3.2, it was shown that the dependence of hi,j on theGI-MMF length is minimal.
38 Design of an N ×N MGDM link
Table 3.1: Average (maximum) optical power penalty and optical cross-talk,together with the geometric design parameters for an N ×N MGDM system over62.5/125 µm silica-based GI-MMF.
Power penalty at Power penalty at Optical cross-talkN ×N shot noise limit (dB) thermal noise limit (dB) (dB)
2× 2 2.3 (2.3) 1.2 (1.4) -6.7 (-5.7)3× 3 5.7 (7.2) 2.9 (3.2) -2.8 (-0.4)4× 4 8.3 (10.3) 4.2 (4.7) -0.8 (1.5)5× 5 11.3 (13.3) 5.6 (6.3) 0.8 (2.7)
N ×N Radial offsets (µm) Detector radii (µm)
2× 2 0, 26 12, 31.253× 3 0, 15, 26 7, 17, 31.254× 4 0, 10, 19, 26 5, 12, 20, 31.255× 5 0, 10, 15, 21, 26 5, 10, 16, 22, 31.25
In the results of Table 3.1, apart from optimizing the detector radii, optimaloffsets of the input beams have been approximated as well. The optimizationprocess is with respect to the minimization, on average, of cross-talk and powerpenalty. This process has not been done in a strict mathematical way, but ratherby empirically testing different values. The starting point for the values of thedetector radii has been the intersection points of the NAPF curves. Other criteriafor optimization could have been used, such as an equal value of the optical cross-talk at each detector segment. For example, for a 3× 3 MGDM system, for radialoffsets of 0 µm, 15 µm and 26 µm, and detector radii of 10 µm, 12 µm and31.25 µm, the optical cross-talk at R1, R2 and R3 is -1.6 dB, -1.4 dB and -1.6 dB,respectively, and hence very similar at the three detector segments. However,the average (maximum) power penalty at the shot noise limit is 10.5 dB (13 dB)and the average (maximum) power penalty at the thermal noise limit is 6.9 dB(8.8 dB). These values are much larger than the ones in Table 3.1 for a 3 × 3system. The more diagonally dominant the system matrix, the lower the powerpenalty due to the electronic matrix inversion.
The specification of the geometric parameters included in Table 3.1 can be usedfor the manufacture of MGDM components. An evaluation of such a system isprovided by the calculated values of optical cross-talk and power penalty. In somecases, the optical cross-talk has a positive value in decibels. This indicates that in
3.5 Sensitivity to misalignments 39
detector segment i, the power from the ith mode group is lower than the aggregateinterference from the other mode groups. The power penalty grows significantlywith the number of channels N and this, in practice, can deteriorate N . At thesame time, the sensitivity of the power penalty to changes in the value of hi,j is avery important factor, as will be discussed in the following section.
3.5 Sensitivity to misalignments
A feature of GI-MMF links is tolerance in alignment. Misalignments can be foundat the launching or detecting side of a GI-MMF link, can be caused when connect-ing GI-MMFs, or can be even due to fiber concentricity. In an MGDM system,in order to maintain tolerance in alignment, the largest radial offset for the inputbeams should be ρmax = ρη−dtol, where ρη is the maximum radial offset ensuringa desired η and dtol the required tolerance in alignment. However, misalignmentswill change the sets of excited modes and consequently the NFP. Figure 3.9 showsthe NFP on the output facet of the 75 m long GI-MMF for ±2 µm misalignment atthe input end of the GI-MMF. These changes in the NFP will affect cross-talk andhence the power penalty due to the electronic matrix inversion. Figure 3.10 showsthe influence of misalignments on the power penalty of channel 1 (T1, R1), whichis the most affected channel of the proposed MGDM link with N = 3 and N = 4.The same tolerance dtol = 2 µm has been used at both the transmitting side andthe receiving side. The 3 × 3 link is much more robust than the 4 × 4 one. Thelatter link is primarily affected by the -2 µm misalignment at the transmitting end,since a smaller part of the GI-MMF core is used to propagate the optical power,as can be seen in Figure 3.9. Therefore, the spatial overlap among the intensityprofiles of the excited mode groups increases. Obviously, channel separation wouldfail with a -5 µm misalignment at the transmitting end of the 4× 4 link.
The sensitivity of the link to misalignments depends on the transmission matrixH. In particular, the more diagonally dominant H tends to be, the more robustthe link is to changes in the value of the hi,j coefficients. Figure 3.10 clearly showsthat for N ≥ 4 the proposed MGDM link will be very sensitive to changes in thevalue of the hi,j . This certainly limits the scalability of the link with respect to thenumber of channels. To combat this restriction, in Chapter 6, we introduce a newoptical technique, namely mode-selective spatial filtering, to reduce the opticalcross-talk and therefore increase the robustness of the link.
3.6 Passive optical components
3.6.1 Topologies of local area networks
GI-MMFs are mainly used in local area networks (LANs). In LANs, bus, starand ring topologies are often employed, typically at the electrical signal level (Fig-ure 3.11). MGDM requires mode-selective components. Design considerations for
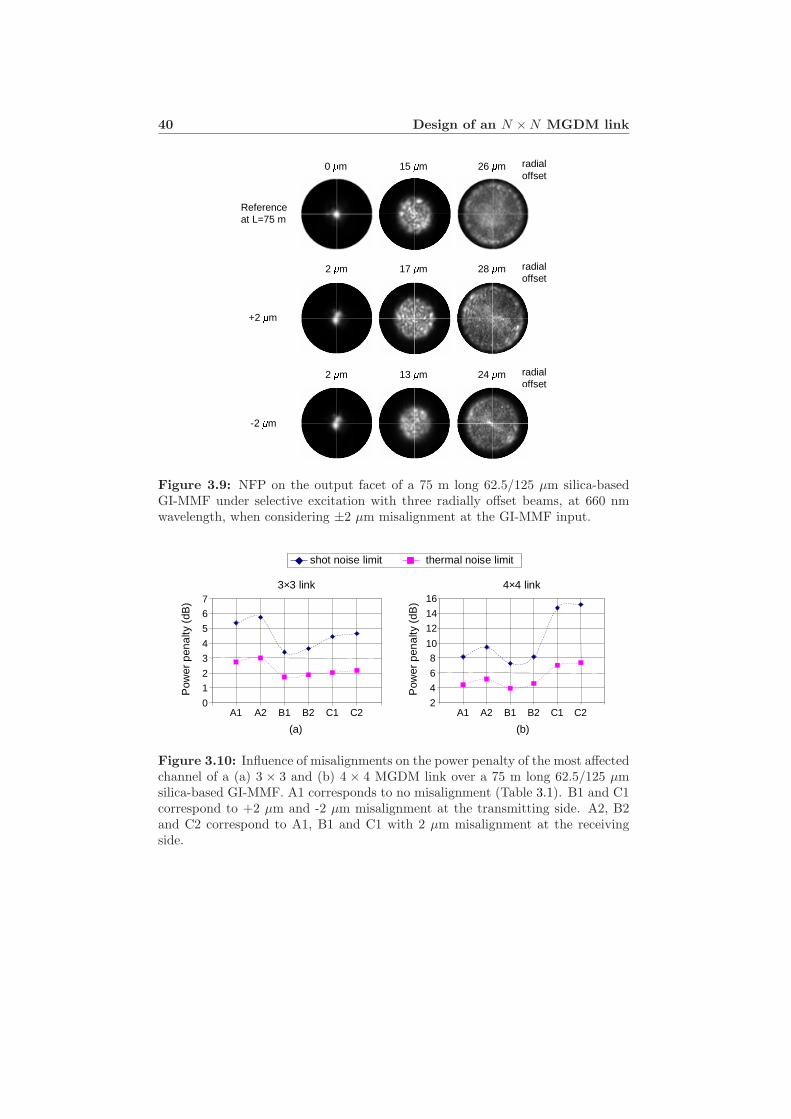
40 Design of an N ×N MGDM link
+2 µm
Referenceat L=75 m
0 µm 15 µm 26 µm radial offset
2 µm 17 µm 28 µm radial offset
-2 µm
2 µm 13 µm 24 µm radial offset
Figure 3.9: NFP on the output facet of a 75 m long 62.5/125 µm silica-basedGI-MMF under selective excitation with three radially offset beams, at 660 nmwavelength, when considering ±2 µm misalignment at the GI-MMF input.
Pow
er p
enal
ty (
dB)
0
1
2
3
4
5
6
7
A1 A2 B1 B2 C1 C2
(a)
2
4
6
8
10
12
14
16
A1 A2 B1 B2 C1 C2
(b)
Pow
er p
enal
ty (
dB)
shot noise limit thermal noise limit
3×3 link 4×4 link
Figure 3.10: Influence of misalignments on the power penalty of the most affectedchannel of a (a) 3 × 3 and (b) 4 × 4 MGDM link over a 75 m long 62.5/125 µmsilica-based GI-MMF. A1 corresponds to no misalignment (Table 3.1). B1 and C1correspond to +2 µm and -2 µm misalignment at the transmitting side. A2, B2and C2 correspond to A1, B1 and C1 with 2 µm misalignment at the receivingside.
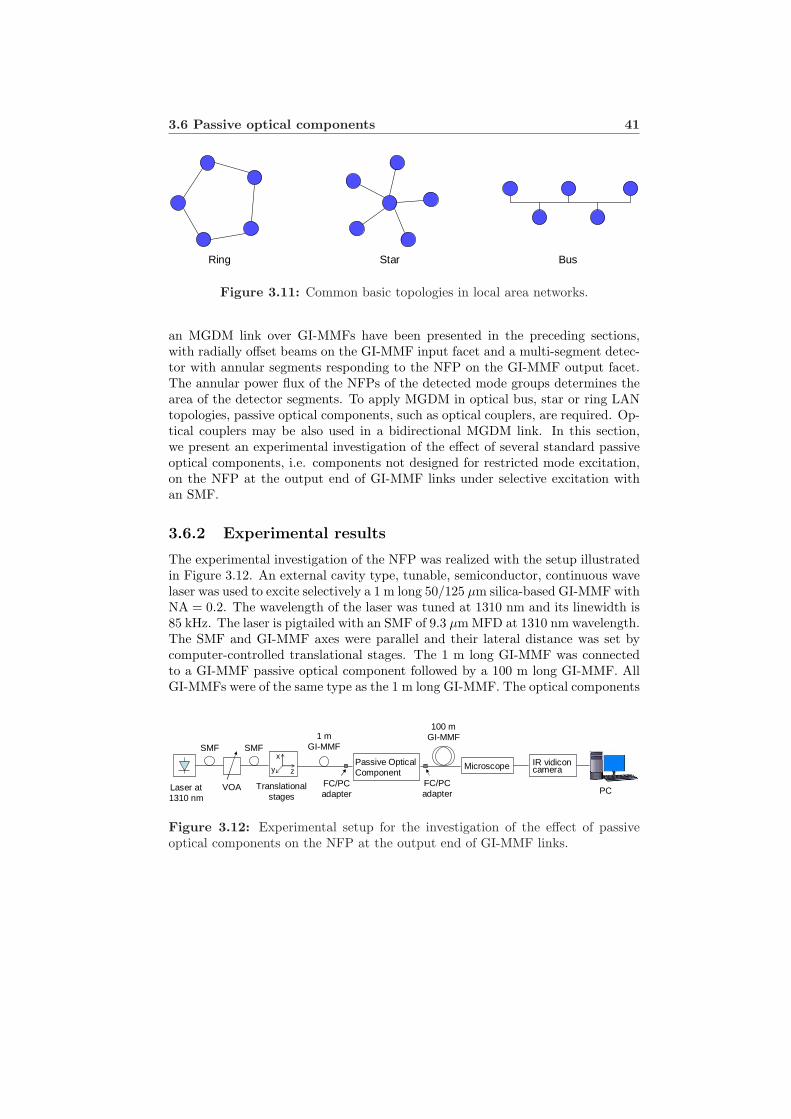
3.6 Passive optical components 41
Ring Star Bus
Figure 3.11: Common basic topologies in local area networks.
an MGDM link over GI-MMFs have been presented in the preceding sections,with radially offset beams on the GI-MMF input facet and a multi-segment detec-tor with annular segments responding to the NFP on the GI-MMF output facet.The annular power flux of the NFPs of the detected mode groups determines thearea of the detector segments. To apply MGDM in optical bus, star or ring LANtopologies, passive optical components, such as optical couplers, are required. Op-tical couplers may be also used in a bidirectional MGDM link. In this section,we present an experimental investigation of the effect of several standard passiveoptical components, i.e. components not designed for restricted mode excitation,on the NFP at the output end of GI-MMF links under selective excitation withan SMF.
3.6.2 Experimental results
The experimental investigation of the NFP was realized with the setup illustratedin Figure 3.12. An external cavity type, tunable, semiconductor, continuous wavelaser was used to excite selectively a 1 m long 50/125 µm silica-based GI-MMF withNA = 0.2. The wavelength of the laser was tuned at 1310 nm and its linewidth is85 kHz. The laser is pigtailed with an SMF of 9.3 µm MFD at 1310 nm wavelength.The SMF and GI-MMF axes were parallel and their lateral distance was set bycomputer-controlled translational stages. The 1 m long GI-MMF was connectedto a GI-MMF passive optical component followed by a 100 m long GI-MMF. AllGI-MMFs were of the same type as the 1 m long GI-MMF. The optical components
100 m GI-MMF
Microscope IR vidiconcamera
PCLaser at 1310 nm
Passive Optical Component
1 m GI-MMF
FC/PC adapter
FC/PC adapter
VOA
SMFSMF
Translationalstages
x
y z
Figure 3.12: Experimental setup for the investigation of the effect of passiveoptical components on the NFP at the output end of GI-MMF links.
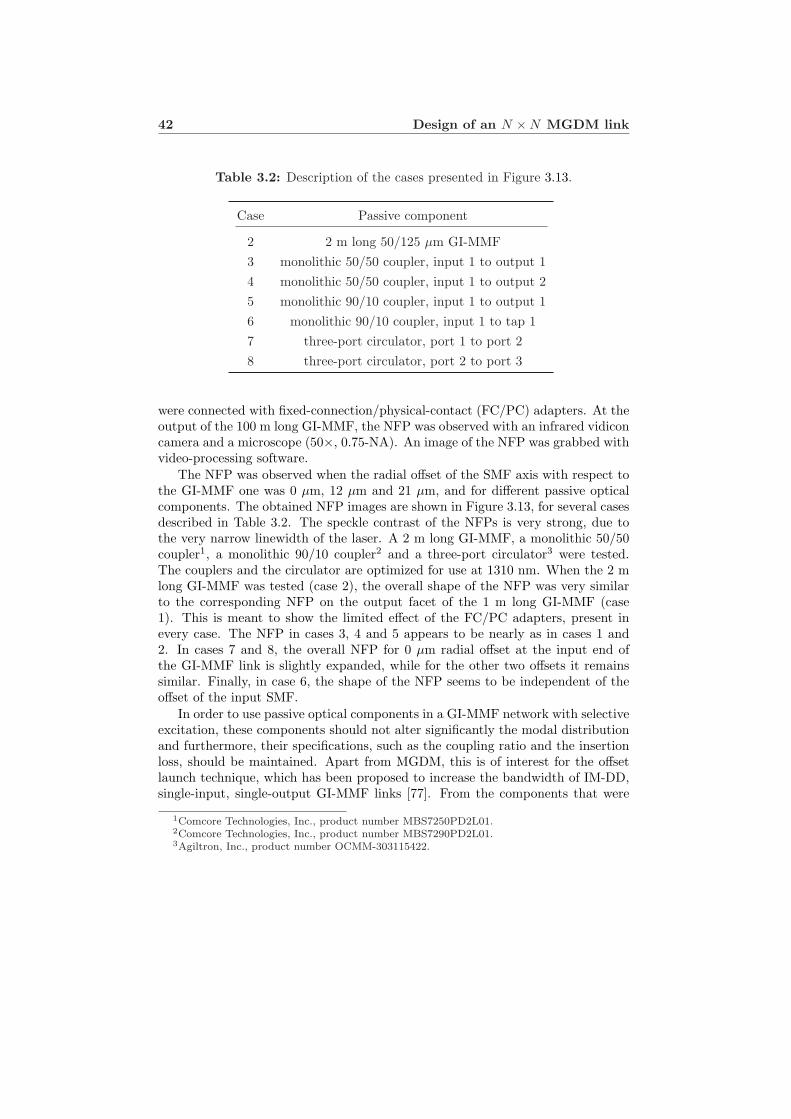
42 Design of an N ×N MGDM link
Table 3.2: Description of the cases presented in Figure 3.13.
Case Passive component
2 2 m long 50/125 µm GI-MMF3 monolithic 50/50 coupler, input 1 to output 14 monolithic 50/50 coupler, input 1 to output 25 monolithic 90/10 coupler, input 1 to output 16 monolithic 90/10 coupler, input 1 to tap 17 three-port circulator, port 1 to port 28 three-port circulator, port 2 to port 3
were connected with fixed-connection/physical-contact (FC/PC) adapters. At theoutput of the 100 m long GI-MMF, the NFP was observed with an infrared vidiconcamera and a microscope (50×, 0.75-NA). An image of the NFP was grabbed withvideo-processing software.
The NFP was observed when the radial offset of the SMF axis with respect tothe GI-MMF one was 0 µm, 12 µm and 21 µm, and for different passive opticalcomponents. The obtained NFP images are shown in Figure 3.13, for several casesdescribed in Table 3.2. The speckle contrast of the NFPs is very strong, due tothe very narrow linewidth of the laser. A 2 m long GI-MMF, a monolithic 50/50coupler1, a monolithic 90/10 coupler2 and a three-port circulator3 were tested.The couplers and the circulator are optimized for use at 1310 nm. When the 2 mlong GI-MMF was tested (case 2), the overall shape of the NFP was very similarto the corresponding NFP on the output facet of the 1 m long GI-MMF (case1). This is meant to show the limited effect of the FC/PC adapters, present inevery case. The NFP in cases 3, 4 and 5 appears to be nearly as in cases 1 and2. In cases 7 and 8, the overall NFP for 0 µm radial offset at the input end ofthe GI-MMF link is slightly expanded, while for the other two offsets it remainssimilar. Finally, in case 6, the shape of the NFP seems to be independent of theoffset of the input SMF.
In order to use passive optical components in a GI-MMF network with selectiveexcitation, these components should not alter significantly the modal distributionand furthermore, their specifications, such as the coupling ratio and the insertionloss, should be maintained. Apart from MGDM, this is of interest for the offsetlaunch technique, which has been proposed to increase the bandwidth of IM-DD,single-input, single-output GI-MMF links [77]. From the components that were
1Comcore Technologies, Inc., product number MBS7250PD2L01.2Comcore Technologies, Inc., product number MBS7290PD2L01.3Agiltron, Inc., product number OCMM-303115422.
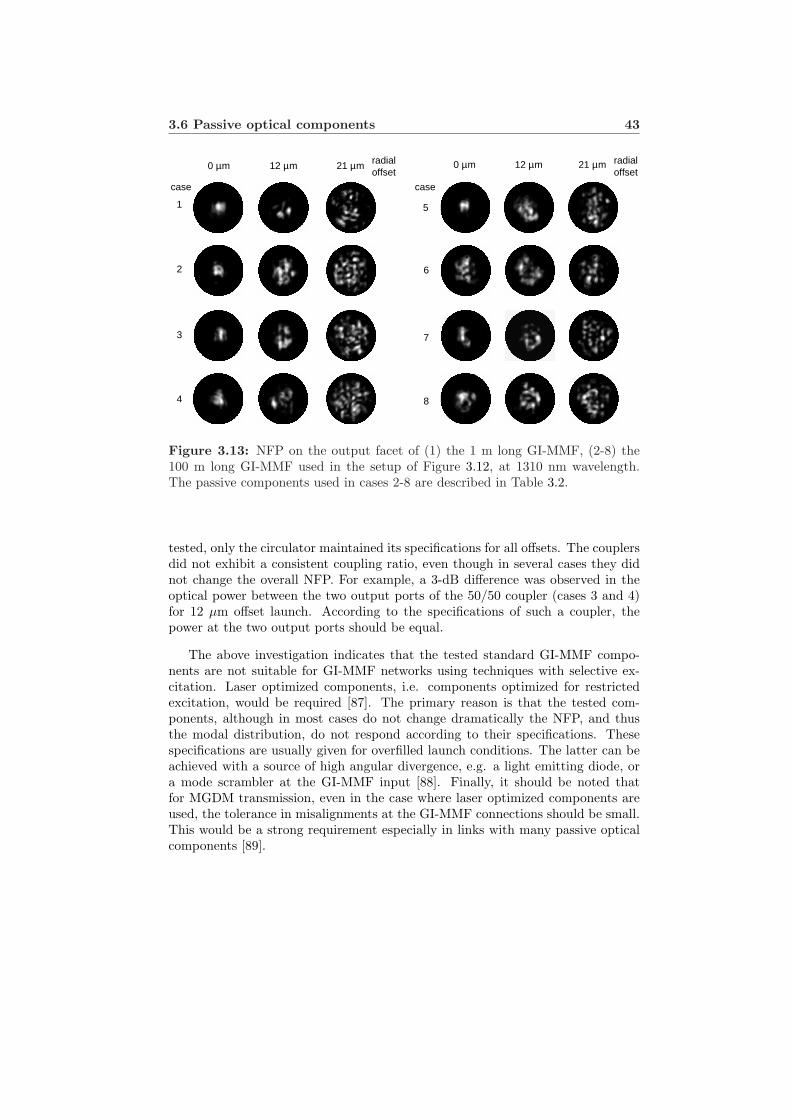
3.6 Passive optical components 43
0 µm 21 µm12 µm 0 µm 21 µm12 µm
1
2
3
4
5
6
7
8
radialoffset
radialoffset
case case
Figure 3.13: NFP on the output facet of (1) the 1 m long GI-MMF, (2-8) the100 m long GI-MMF used in the setup of Figure 3.12, at 1310 nm wavelength.The passive components used in cases 2-8 are described in Table 3.2.
tested, only the circulator maintained its specifications for all offsets. The couplersdid not exhibit a consistent coupling ratio, even though in several cases they didnot change the overall NFP. For example, a 3-dB difference was observed in theoptical power between the two output ports of the 50/50 coupler (cases 3 and 4)for 12 µm offset launch. According to the specifications of such a coupler, thepower at the two output ports should be equal.
The above investigation indicates that the tested standard GI-MMF compo-nents are not suitable for GI-MMF networks using techniques with selective ex-citation. Laser optimized components, i.e. components optimized for restrictedexcitation, would be required [87]. The primary reason is that the tested com-ponents, although in most cases do not change dramatically the NFP, and thusthe modal distribution, do not respond according to their specifications. Thesespecifications are usually given for overfilled launch conditions. The latter can beachieved with a source of high angular divergence, e.g. a light emitting diode, ora mode scrambler at the GI-MMF input [88]. Finally, it should be noted thatfor MGDM transmission, even in the case where laser optimized components areused, the tolerance in misalignments at the GI-MMF connections should be small.This would be a strong requirement especially in links with many passive opticalcomponents [89].
44 Design of an N ×N MGDM link
3.7 Conclusions
The design of an N ×N MGDM system is a non-trivial issue. An approach wasproposed, with N radially offset Gaussian-like beams on the input facet of theGI-MMF exciting N mode groups and a multi-segment detector with N annularsegments responding to the NFP on the output facet of the GI-MMF. This schemewas shown to yield a transmission matrix which is not practically affected by theGI-MMF length for at least up to 1 km, in the case of silica-based GI-MMFs. Fur-ther, the scheme is in line with high coupling efficiency at the transmitting sideof the link. For a system using standard 62.5/125 µm silica-based GI-MMF, withN = 2 . . . 5, the areas of the detector segments as well as the radial offsets of theinput beams were estimated so as to minimize, on average, the optical cross-talkand the optical power penalty due to the electronic matrix inversion. The esti-mation was based on experimental measurements of the NFP on the output facetof a GI-MMF under selective excitation with a radially offset SMF. These resultscan be used for the manufacture of a mode group diversity multi/demultiplexer.The introduction of an angular offset at the input beams was found to be only ofmarginal interest for reducing the optical cross-talk. That was because the NFPshows a strong dependence on the GI-MMF length and the coupling efficiency atthe input end of the GI-MMF decreases significantly as the radial offset increases.The requirements in alignment were shown to be tight and for N ≥ 4, even a2 µm misalignment changes the power penalty due to matrix inversion consider-ably and hence the power budget of the system. Such a system would requiregreat precision to be stable and reliable. Therefore the proposed method is moresuitable for N ≤ 3. Finally, several standard passive GI-MMF components weretested to check whether they could be used in GI-MMF networks where techniqueswith selective excitation, such as MGDM, are employed. The result was negativebecause some of these components can alter the NFP and further, they do notalways maintain their specifications, such as the coupling ratio in the case of anoptical splitter.
Chapter 4
Near-field pattern of silicaGI-MMFs with restrictedexcitation
An analysis of the near-field pattern (NFP) on the output facet of silica-based GI-MMFs excited by a radially offset SMF is presented. Simulation results exhibitall of the features displayed by experimental ones. It turns out that differentialmode attenuation and delay, full intra-group mode mixing, and small deviations inthe refractive index profile of the GI-MMF do not affect the overall NFP, which isdetermined by the radial offset of the input SMF. In particular, the NFP is confinedwithin a disk, the radius of which depends on the radial offset of the launchedbeam. The effect of defects in the refractive index profile, such as deviation of theα-parameter from its optimal value and a central dip or peak, is also examined.The analysis presented in this chapter gives insight into light propagation in GI-MMFs and supports that the design method proposed in Chapter 3 for an MGDMlink yields a robust system with the GI-MMF length, at least for up to 1 km.
4.1 Selective excitation of GI-MMFs with an SMF
Optical transmission systems with GI-MMFs are mostly based on the intensity-modulation direct-detection (IM-DD), single-input single-output (SISO) approach.In this case, the bandwidth limitation comes from inter-modal dispersion, which iscaused by the differential propagation delay of the propagating modes. One wayto enhance the 3-dB bandwidth of IM-DD SISO links with GI-MMF is to restrictthe launch conditions, aiming at the excitation of a subset of modes with similarpropagation delay. Selective excitation with an SMF at the input end of a GI-MMF
Parts of this chapter are published in Ref. [2,15] of Appendix B.
46 Near-field pattern of silica GI-MMFs with restricted excitation
is a simple way to achieve this [77, 78, 90, 91]. A radial offset at the launch positionof the SMF with respect to the GI-MMF axis may be required, depending on therefractive index profile of the GI-MMF. Central launch can be combined withdetectors for SMF systems offering a similar advantage. Subcarrier multiplexingbeyond the 3-dB bandwidth [31, 92] and spatially resolved equalization [93] canalso enhance the transmission bandwidth of GI-MMF links.
Besides the above methods, MIMO techniques are gaining interest to cre-ate parallel channels over the same MMF, by exploiting the propagating spatialmodes [52, 61, 63, 66, 67]. In all MIMO approaches, selective excitation is required.MGDM is an IM-DD MIMO technique and, as proposed in Chapter 3, it can beimplemented with radially offset Gaussian-like beams on the input facet of a GI-MMF and spatially selective detection of the NFP at the GI-MMF output end.The field profile of the single spatial mode of an SMF approximates a Gaussianbeam. This implementation is based on the experimental observation that forsilica-based GI-MMFs, at least up to 1 km long, the NFP of the optical intensityon the GI-MMF output facet remains confined within a disk with a radius thatdepends on the radial offset of the input beam.
The analysis presented in this chapter has been motivated by the aforemen-tioned interest in selective excitation of GI-MMFs with an SMF. The effect ofsuch an excitation scheme on the bandwidth of IM-DD SISO links has been widelyaddressed [77, 78, 90, 91]. Although its effect on the NFP has been observed ex-perimentally in Chapter 3, as well as in Refs. [68, 89, 94], no extended analysishas been reported, to the best of the author’s knowledge. In this chapter, anexperimental and theoretical investigation of the NFP is presented. It is shownthat the overall NFP is not affected by differential mode delay and attenuation,small deviations in the refractive index profile of the GI-MMF, or full intra-groupmode mixing. The latter refers to mixing among modes with similar propagationcoefficient, as will be explained in the following sections. Further, the effect ofrefractive index profile defects is examined. These defects include deviation of theα-parameter from its optimal value that minimizes differential mode delay, as wellas a central dip or peak in the refractive index profile. Such defects are commonin legacy GI-MMFs.
4.2 Experimental investigation
Figure 4.1 shows the experimental setup used to observe the NFP on the outputfacet of a GI-MMF under selective excitation with an SMF. An external cavitytype, tunable, semiconductor, continuous wave laser was used to excite selectivelya GI-MMF with core/cladding diameter of 62.5/125 µm and a numerical aperture(NA) of 0.275. The linewidth of the laser is 85 kHz and its wavelength was tunedto 1310 nm. The laser is pigtailed with a 1 m long standard SMF with a modefield diameter of 9.3 µm at 1310 nm. A variable optical attenuator (VOA) withSMF pigtails was used to control the level of the optical power. The radial offset
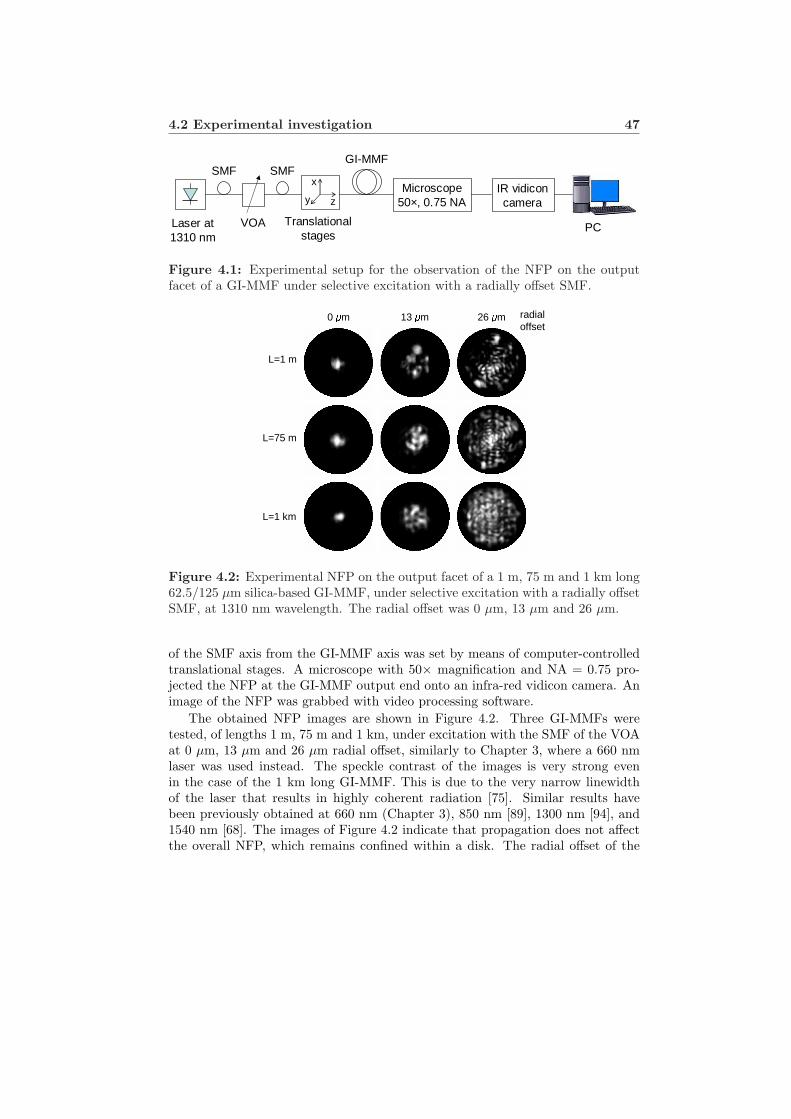
4.2 Experimental investigation 47
IR vidiconcamera
GI-MMF
Microscope50×, 0.75 NA
PCLaser at 1310 nm
VOA
SMFSMF
Translationalstages
x
y z
Figure 4.1: Experimental setup for the observation of the NFP on the outputfacet of a GI-MMF under selective excitation with a radially offset SMF.
0 µm 13 µm 26 µm radial offset
L=1 km
L=75 m
L=1 m
Figure 4.2: Experimental NFP on the output facet of a 1 m, 75 m and 1 km long62.5/125 µm silica-based GI-MMF, under selective excitation with a radially offsetSMF, at 1310 nm wavelength. The radial offset was 0 µm, 13 µm and 26 µm.
of the SMF axis from the GI-MMF axis was set by means of computer-controlledtranslational stages. A microscope with 50× magnification and NA = 0.75 pro-jected the NFP at the GI-MMF output end onto an infra-red vidicon camera. Animage of the NFP was grabbed with video processing software.
The obtained NFP images are shown in Figure 4.2. Three GI-MMFs weretested, of lengths 1 m, 75 m and 1 km, under excitation with the SMF of the VOAat 0 µm, 13 µm and 26 µm radial offset, similarly to Chapter 3, where a 660 nmlaser was used instead. The speckle contrast of the images is very strong evenin the case of the 1 km long GI-MMF. This is due to the very narrow linewidthof the laser that results in highly coherent radiation [75]. Similar results havebeen previously obtained at 660 nm (Chapter 3), 850 nm [89], 1300 nm [94], and1540 nm [68]. The images of Figure 4.2 indicate that propagation does not affectthe overall NFP, which remains confined within a disk. The radial offset of the
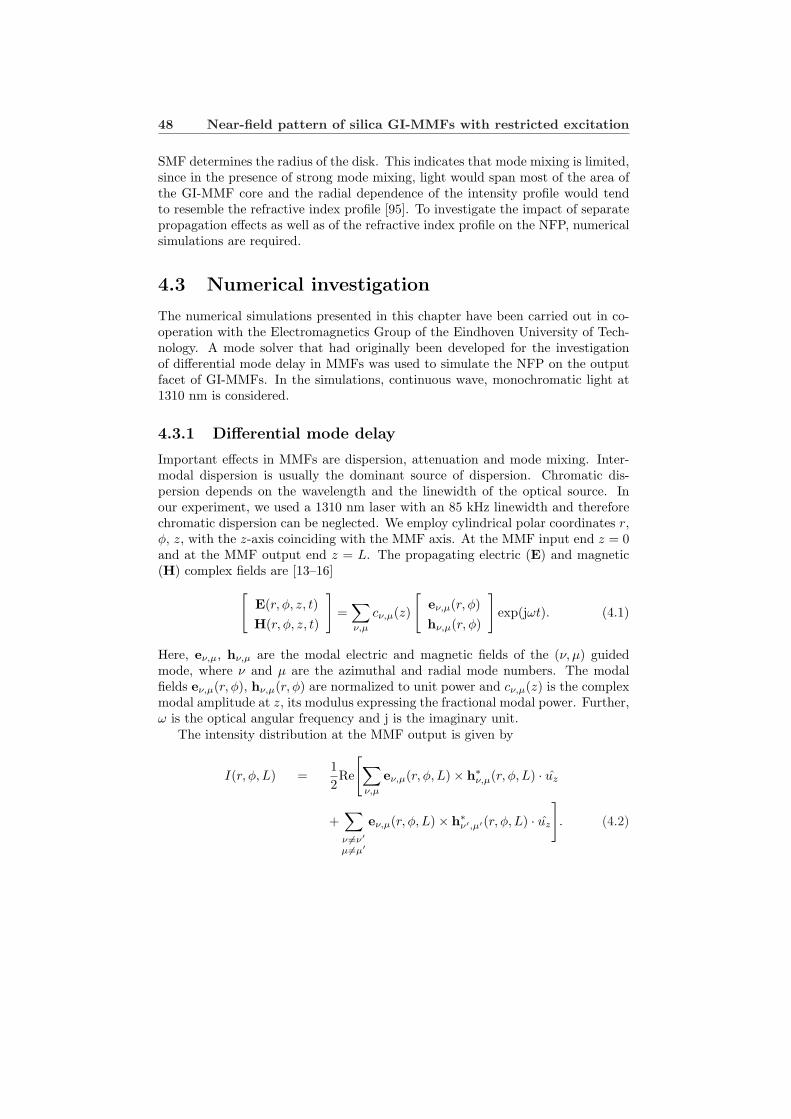
48 Near-field pattern of silica GI-MMFs with restricted excitation
SMF determines the radius of the disk. This indicates that mode mixing is limited,since in the presence of strong mode mixing, light would span most of the area ofthe GI-MMF core and the radial dependence of the intensity profile would tendto resemble the refractive index profile [95]. To investigate the impact of separatepropagation effects as well as of the refractive index profile on the NFP, numericalsimulations are required.
4.3 Numerical investigation
The numerical simulations presented in this chapter have been carried out in co-operation with the Electromagnetics Group of the Eindhoven University of Tech-nology. A mode solver that had originally been developed for the investigationof differential mode delay in MMFs was used to simulate the NFP on the outputfacet of GI-MMFs. In the simulations, continuous wave, monochromatic light at1310 nm is considered.
4.3.1 Differential mode delay
Important effects in MMFs are dispersion, attenuation and mode mixing. Inter-modal dispersion is usually the dominant source of dispersion. Chromatic dis-persion depends on the wavelength and the linewidth of the optical source. Inour experiment, we used a 1310 nm laser with an 85 kHz linewidth and thereforechromatic dispersion can be neglected. We employ cylindrical polar coordinates r,φ, z, with the z-axis coinciding with the MMF axis. At the MMF input end z = 0and at the MMF output end z = L. The propagating electric (E) and magnetic(H) complex fields are [13–16]
[E(r, φ, z, t)H(r, φ, z, t)
]=
∑ν,µ
cν,µ(z)
[eν,µ(r, φ)hν,µ(r, φ)
]exp(jωt). (4.1)
Here, eν,µ, hν,µ are the modal electric and magnetic fields of the (ν, µ) guidedmode, where ν and µ are the azimuthal and radial mode numbers. The modalfields eν,µ(r, φ), hν,µ(r, φ) are normalized to unit power and cν,µ(z) is the complexmodal amplitude at z, its modulus expressing the fractional modal power. Further,ω is the optical angular frequency and j is the imaginary unit.
The intensity distribution at the MMF output is given by
I(r, φ, L) =12Re
[∑ν,µ
eν,µ(r, φ, L)× h∗ν,µ(r, φ, L) · uz
+∑
ν 6=ν′
µ6=µ′
eν,µ(r, φ, L)× h∗ν′,µ′(r, φ, L) · uz
]. (4.2)
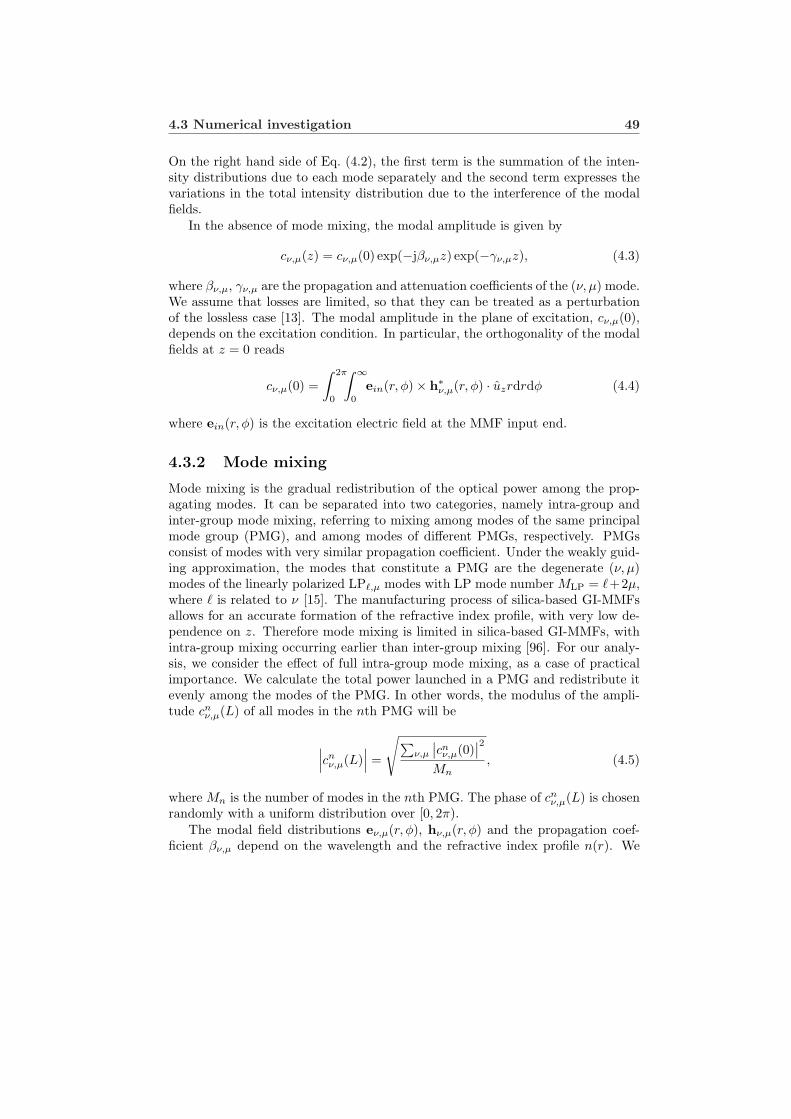
4.3 Numerical investigation 49
On the right hand side of Eq. (4.2), the first term is the summation of the inten-sity distributions due to each mode separately and the second term expresses thevariations in the total intensity distribution due to the interference of the modalfields.
In the absence of mode mixing, the modal amplitude is given by
cν,µ(z) = cν,µ(0) exp(−jβν,µz) exp(−γν,µz), (4.3)
where βν,µ, γν,µ are the propagation and attenuation coefficients of the (ν, µ) mode.We assume that losses are limited, so that they can be treated as a perturbationof the lossless case [13]. The modal amplitude in the plane of excitation, cν,µ(0),depends on the excitation condition. In particular, the orthogonality of the modalfields at z = 0 reads
cν,µ(0) =∫ 2π
0
∫ ∞
0
ein(r, φ)× h∗ν,µ(r, φ) · uzrdrdφ (4.4)
where ein(r, φ) is the excitation electric field at the MMF input end.
4.3.2 Mode mixing
Mode mixing is the gradual redistribution of the optical power among the prop-agating modes. It can be separated into two categories, namely intra-group andinter-group mode mixing, referring to mixing among modes of the same principalmode group (PMG), and among modes of different PMGs, respectively. PMGsconsist of modes with very similar propagation coefficient. Under the weakly guid-ing approximation, the modes that constitute a PMG are the degenerate (ν, µ)modes of the linearly polarized LP`,µ modes with LP mode number MLP = `+2µ,where ` is related to ν [15]. The manufacturing process of silica-based GI-MMFsallows for an accurate formation of the refractive index profile, with very low de-pendence on z. Therefore mode mixing is limited in silica-based GI-MMFs, withintra-group mixing occurring earlier than inter-group mixing [96]. For our analy-sis, we consider the effect of full intra-group mode mixing, as a case of practicalimportance. We calculate the total power launched in a PMG and redistribute itevenly among the modes of the PMG. In other words, the modulus of the ampli-tude cn
ν,µ(L) of all modes in the nth PMG will be
∣∣∣cnν,µ(L)
∣∣∣ =
√∑ν,µ
∣∣cnν,µ(0)
∣∣2Mn
, (4.5)
where Mn is the number of modes in the nth PMG. The phase of cnν,µ(L) is chosen
randomly with a uniform distribution over [0, 2π).The modal field distributions eν,µ(r, φ), hν,µ(r, φ) and the propagation coef-
ficient βν,µ depend on the wavelength and the refractive index profile n(r). We
50 Near-field pattern of silica GI-MMFs with restricted excitation
assume that n(r) follows the power-law profile, i.e.,
n(r) =
n0
√1− 2∆
(ra
)α, r < a,
n0
√1− 2∆, r ≥ a,
(4.6)
where ∆ = [n20 − n2(a)]/(2n2
0) and a is the GI-MMF core radius. The centralNA of the GI-MMF is NA = n0
√2∆. For our simulations, n0 = 1.474 and
NA = 0.275. The α-parameter was 1.97, 2 and 2.06. The value α = 2 correspondsto the parabolic index profile. For α = 1.97 and α = 2.06, differential modedelay is minimized at 1300 nm and 850 nm wavelength, respectively [97, 98], andtherefore these values are of special interest in the design of GI-MMFs. To accountfor the radial dependence of the refractive index in the core, the computationof the propagation coefficient βν,µ and the modal fields eν,µ(r, φ), hν,µ(r, φ) isperformed by a direct numerical integration of Maxwell’s equations in their full-wave form [99]. Models based on ray optics could have also been used to give thenear-field intensity yielded by a mode group, however, in that approach, excitationof a large number of modes is assumed and the phase of the modal amplitudes isnot taken into consideration [67, 100, 101].
4.3.3 Differential mode attenuation
Each mode experiences different attenuation due to propagation. In other words,different propagating rays travel along paths with different length and thereforetheir effective propagation length is not the same. This makes attenuation mode-dependent. In addition, losses will be higher where the concentration of dopant(e.g. Germanium), in order to form the refractive index profile, is larger. Thisrenders an analysis of the losses even more difficult. The following relation can beused to give the attenuation coefficients:
γn(λ) = γ0(λ) + γ0(λ)I9
[7.35
(n− 1M0
)2α/(α+2)], (4.7)
where n = 1, 2, . . ., and I9 is the 9th-order modified Bessel function of the firstkind. This relation has been proposed in Ref. [97] using experimental data fromRef. [102]. According to Eq. (4.7) differential mode attenuation becomes significantin higher order modes. Here, λ is the wavelength and γ0(λ) the attenuation ofthe lowest-order mode which travels the shortest optical path. At 1310 nm itcorresponds to 0.35 dB/km. For n = 1, γ1(λ) = γ0(λ). M0 is the total number ofPMGs. The value of γn(λ) depends on n and therefore is the same for all modes inthe nth PMG. Consequently, in the calculation of exp(−γν,µz) in Eq. (4.3), whenfull intra-group mode mixing is considered, we may take z = L for all modes.
4.3 Numerical investigation 51
α =1.97
L=0 m
L=1 m
L=75 m
L=1 km
0 µm 13 µm 26 µm radial offset
Figure 4.3: Simulated NFP on the output facet of a 62.5/125 µm silica-basedGI-MMF with refractive index parameter α = 1.97, at 1310 nm wavelength. Eachrow corresponds to a different GI-MMF length (L) and each column to a differentradial offset of the input SMF. Mode mixing is not taken into account.
4.3.4 Results
The simulated NFPs are shown in Figures 4.3, 4.4, 4.5, 4.6 and 4.7. Figures 4.3,4.4 and 4.5 illustrate the NFP considering differential mode attenuation and delay,but not taking into account mode mixing. The mode field diameter of the inputSMF was 9.3 µm at 1310 nm and the radial offset was 0 µm, 13 µm and 26 µm.The NFP was calculated for L = 0 m, 1 m, 75 m and 1 km. Figure 4.3 correspondsto α = 1.97, Figure 4.4 to α = 2 and Figure 4.5 to α = 2.06. The speckle patternclearly depends on the refractive index profile. However, for all three index profiles,the overall NFP is confined within a disk with a radius that depends on the offsetof the input SMF, but not on the α-parameter. It should be noted that althoughthe values of the α-parameter used in the simulations have no significant effecton the overall NFP, they can strongly influence the GI-MMF bandwidth [97]. InFigures 4.6 and 4.7, full intra-group mode mixing is taken into account. The sameoffsets of the input SMF and the same index profiles are considered. The NFPis shown at the output of a 75 m and a 1 km long GI-MMF. Full intra-groupmixing does not change the overall NFP either. A distinct difference between
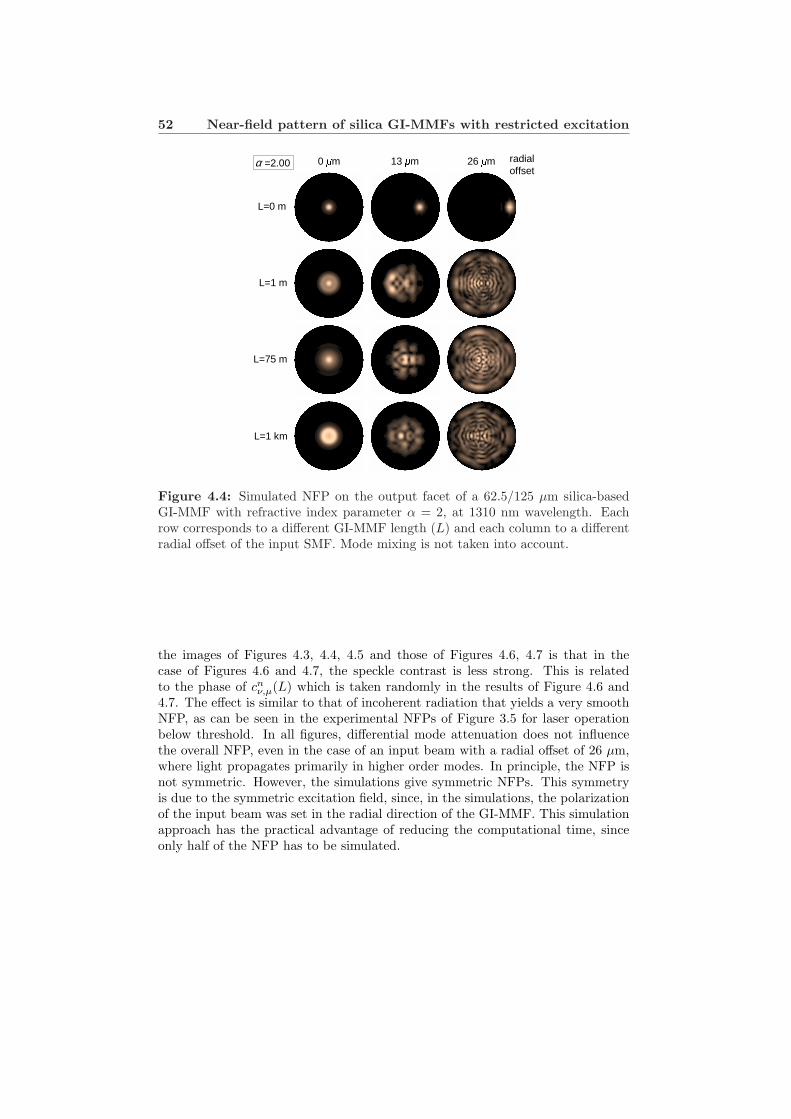
52 Near-field pattern of silica GI-MMFs with restricted excitation
α =2.00
L=0 m
L=1 m
L=75 m
L=1 km
0 µm 13 µm 26 µm radial offset
Figure 4.4: Simulated NFP on the output facet of a 62.5/125 µm silica-basedGI-MMF with refractive index parameter α = 2, at 1310 nm wavelength. Eachrow corresponds to a different GI-MMF length (L) and each column to a differentradial offset of the input SMF. Mode mixing is not taken into account.
the images of Figures 4.3, 4.4, 4.5 and those of Figures 4.6, 4.7 is that in thecase of Figures 4.6 and 4.7, the speckle contrast is less strong. This is relatedto the phase of cn
ν,µ(L) which is taken randomly in the results of Figure 4.6 and4.7. The effect is similar to that of incoherent radiation that yields a very smoothNFP, as can be seen in the experimental NFPs of Figure 3.5 for laser operationbelow threshold. In all figures, differential mode attenuation does not influencethe overall NFP, even in the case of an input beam with a radial offset of 26 µm,where light propagates primarily in higher order modes. In principle, the NFP isnot symmetric. However, the simulations give symmetric NFPs. This symmetryis due to the symmetric excitation field, since, in the simulations, the polarizationof the input beam was set in the radial direction of the GI-MMF. This simulationapproach has the practical advantage of reducing the computational time, sinceonly half of the NFP has to be simulated.
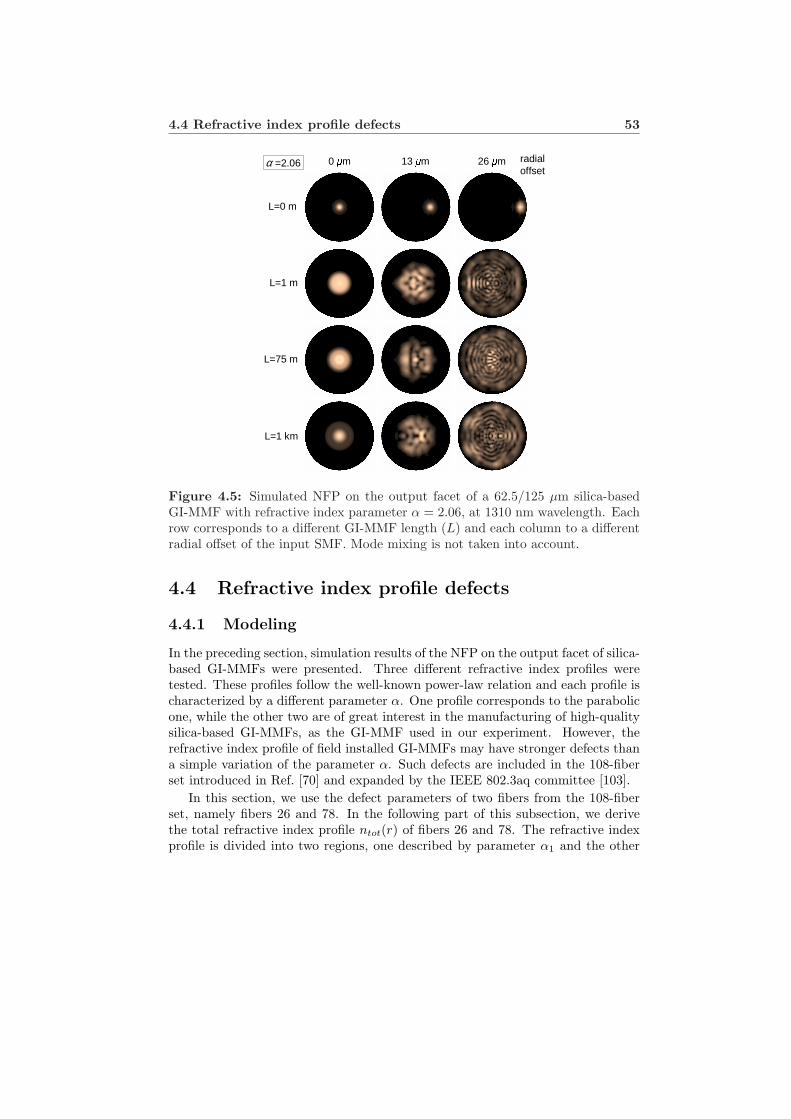
4.4 Refractive index profile defects 53
α =2.06
L=0 m
L=1 m
L=75 m
L=1 km
0 µm 13 µm 26 µm radial offset
Figure 4.5: Simulated NFP on the output facet of a 62.5/125 µm silica-basedGI-MMF with refractive index parameter α = 2.06, at 1310 nm wavelength. Eachrow corresponds to a different GI-MMF length (L) and each column to a differentradial offset of the input SMF. Mode mixing is not taken into account.
4.4 Refractive index profile defects
4.4.1 Modeling
In the preceding section, simulation results of the NFP on the output facet of silica-based GI-MMFs were presented. Three different refractive index profiles weretested. These profiles follow the well-known power-law relation and each profile ischaracterized by a different parameter α. One profile corresponds to the parabolicone, while the other two are of great interest in the manufacturing of high-qualitysilica-based GI-MMFs, as the GI-MMF used in our experiment. However, therefractive index profile of field installed GI-MMFs may have stronger defects thana simple variation of the parameter α. Such defects are included in the 108-fiberset introduced in Ref. [70] and expanded by the IEEE 802.3aq committee [103].
In this section, we use the defect parameters of two fibers from the 108-fiberset, namely fibers 26 and 78. In the following part of this subsection, we derivethe total refractive index profile ntot(r) of fibers 26 and 78. The refractive indexprofile is divided into two regions, one described by parameter α1 and the other
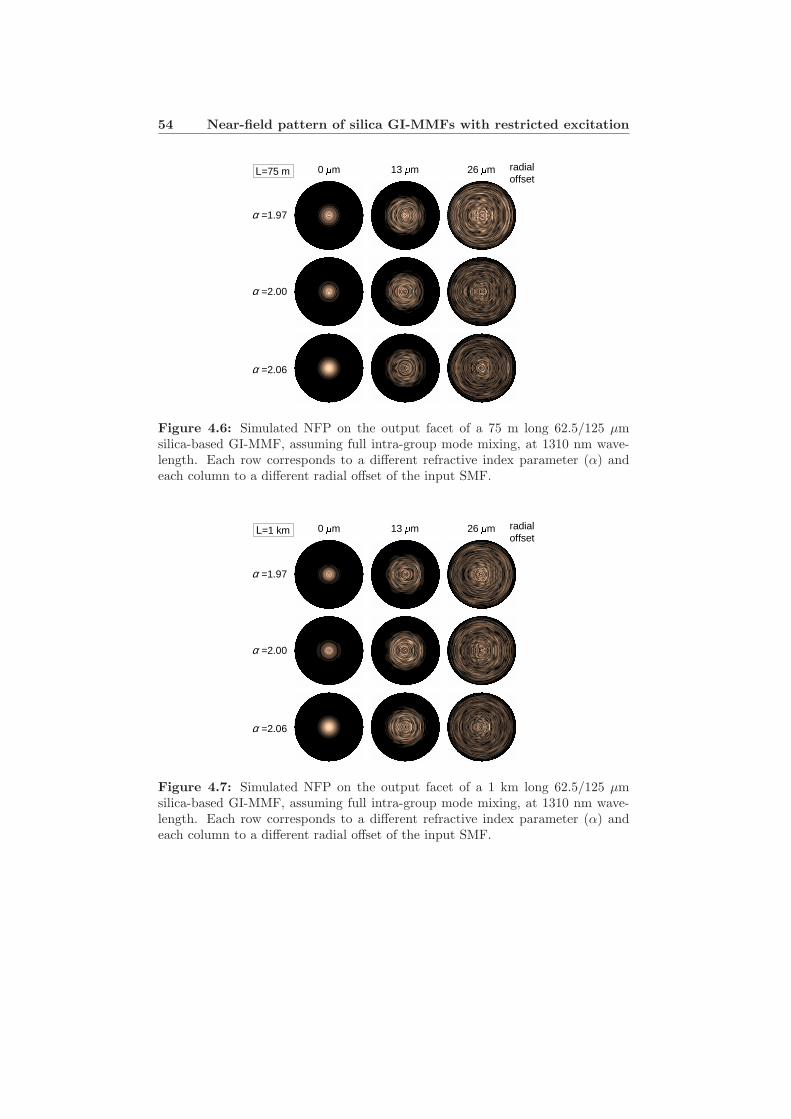
54 Near-field pattern of silica GI-MMFs with restricted excitation
α =1.97
α =2.00
α =2.06
0 µm 13 µm 26 µm radial offset
L=75 m
Figure 4.6: Simulated NFP on the output facet of a 75 m long 62.5/125 µmsilica-based GI-MMF, assuming full intra-group mode mixing, at 1310 nm wave-length. Each row corresponds to a different refractive index parameter (α) andeach column to a different radial offset of the input SMF.
α =1.97
α =2.00
α =2.06
0 µm 13 µm 26 µm radial offset
L=1 km
Figure 4.7: Simulated NFP on the output facet of a 1 km long 62.5/125 µmsilica-based GI-MMF, assuming full intra-group mode mixing, at 1310 nm wave-length. Each row corresponds to a different refractive index parameter (α) andeach column to a different radial offset of the input SMF.

4.4 Refractive index profile defects 55
by α2. In fibers 26 and 78, the difference in the values of α in these two regions isthe largest assured difference in the 108-fiber set, viz. α = 1.89 and α = 2.05. Inparticular, for fiber 26 (78), α1 = 1.89 (2.05) and α2 = 2.05 (1.89). The refractiveindex profile is described by the following equation
nα(r) =
n1(r) = n01
√1− 2∆1
(ra
)α1, 0 ≤ r ≤ a/2,
n2(r) = n02
√1− 2∆2
(ra
)α2, a/2 ≤ r ≤ a,
nclad = n01
√1− 2∆1, a ≤ r,
(4.8)
where ∆1 = (n201 − n2
clad)/(2n201) and ∆2 = (n2
02 − n2clad)/(2n2
02). Continuity atr = a/2, i.e. n1(a/2) = n2(a/2), yields
n02 =
√n2
1(a/2)− n2clad0.5α2
1− 0.5α2(4.9)
In our simulations, n01 = 1.4740 and nclad = 1.4481. Fibers 26 and 78 include akink perturbation in the profile at rk = 27 µm and rk = 19 µm, respectively. If∆α(r) = [n2
α(r)− n2clad]/[2n2
α(r)] and ∆(r) = [n2(r)− n2clad]/[2n2(r)], where n(r)
is the refractive index profile with the kink perturbation, then ∆(r) is given by
∆(r) = ∆α(r) + ak
[e−bk
∣∣ r−rka
∣∣ − e−bk
∣∣ a−rka
∣∣]∆1 (4.10)
where ak = 0.03 and bk = 20 · 5/31.25. The refractive index profile is then
n(r) =nclad√
1− 2∆(r). (4.11)
Additionally, the index profile of fiber 26 has a central (on-axis) dip, while theprofile of fiber 78 shows a central peak. The dip and peak with a full width at halfmaximum FWHM = 3 µm are modeled as follows
naxis(r) = Ae−r2
δ2 , where δ =FWHM2√
ln 2. (4.12)
In the case of a dip, A = −0.004, whereas in the case of a peak, A = 0.002. Thetotal refractive index profile is given by
ntot(r) = n(r) + naxis(r). (4.13)
Figures 4.8 and 4.10 show the total refractive index profiles of fibers 26 and 78,respectively.
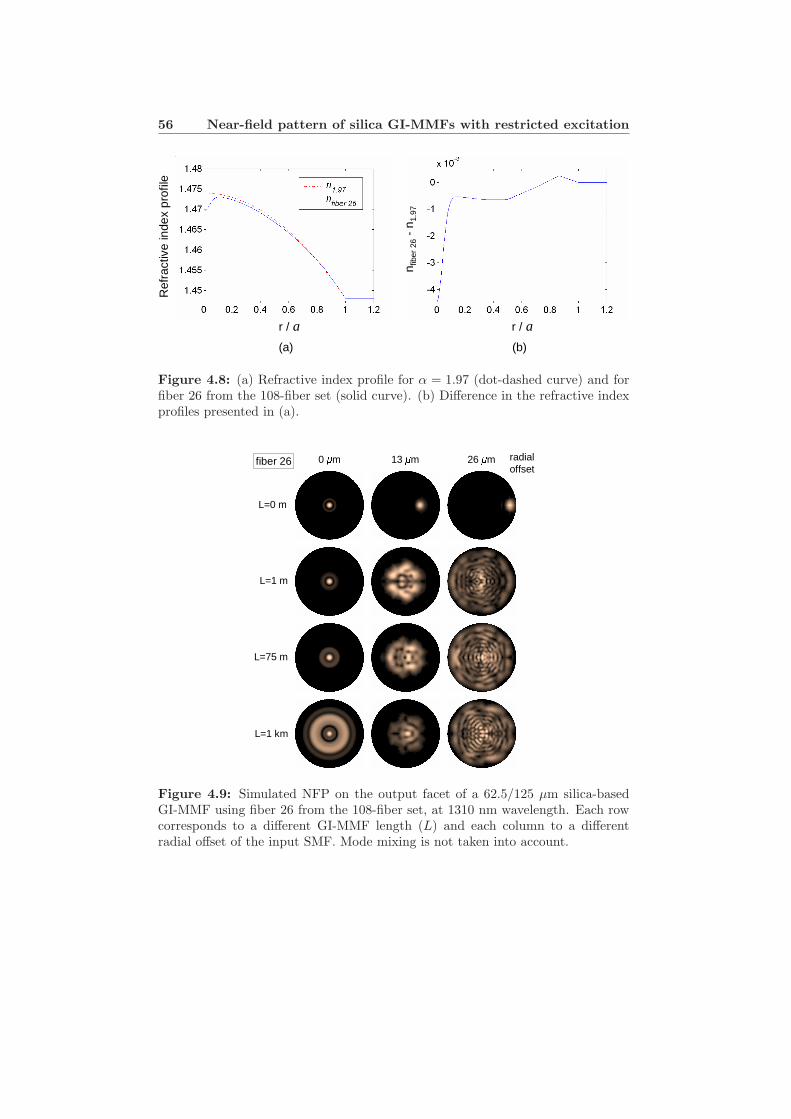
56 Near-field pattern of silica GI-MMFs with restricted excitation
r / a r / a
Ref
ract
ive
inde
x pr
ofile
n fib
er26
-n 1
.97
(a) (b)
Figure 4.8: (a) Refractive index profile for α = 1.97 (dot-dashed curve) and forfiber 26 from the 108-fiber set (solid curve). (b) Difference in the refractive indexprofiles presented in (a).
fiber 26
L=0 m
L=1 m
L=75 m
L=1 km
0 µm 13 µm 26 µm radial offset
Figure 4.9: Simulated NFP on the output facet of a 62.5/125 µm silica-basedGI-MMF using fiber 26 from the 108-fiber set, at 1310 nm wavelength. Each rowcorresponds to a different GI-MMF length (L) and each column to a differentradial offset of the input SMF. Mode mixing is not taken into account.
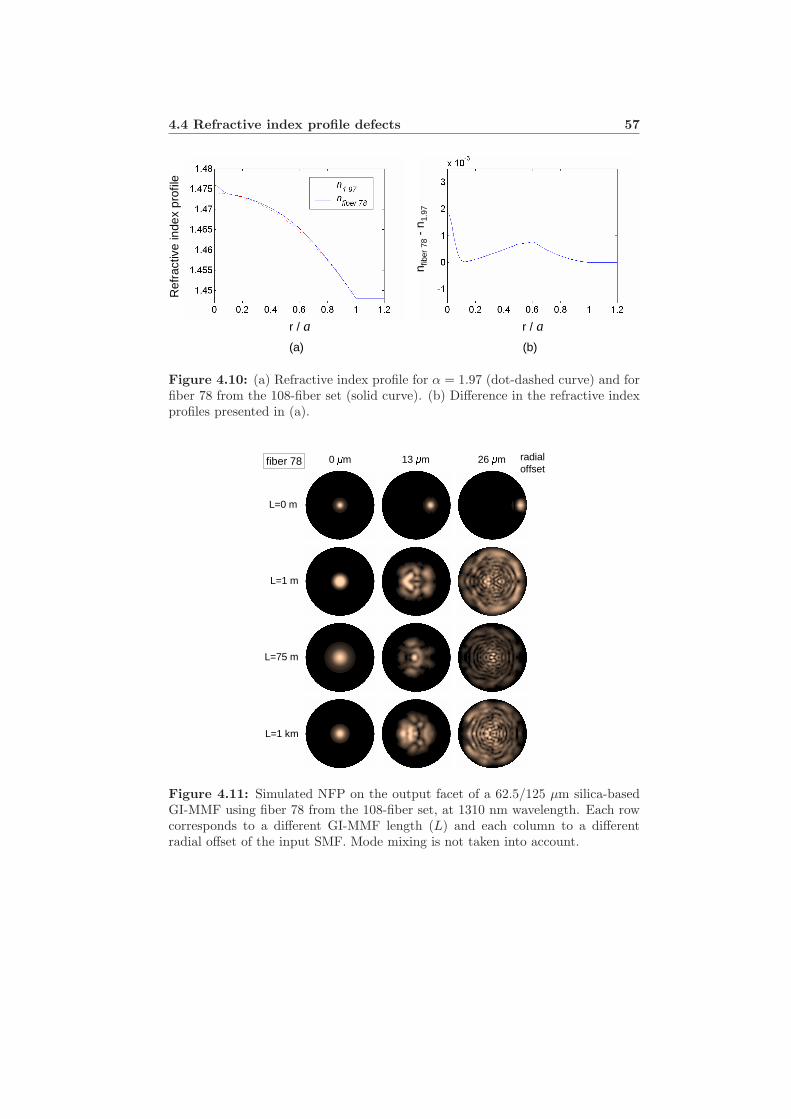
4.4 Refractive index profile defects 57
r / a r / a
Ref
ract
ive
inde
x pr
ofile
n fib
er78
-n 1
.97
(a) (b)
Figure 4.10: (a) Refractive index profile for α = 1.97 (dot-dashed curve) and forfiber 78 from the 108-fiber set (solid curve). (b) Difference in the refractive indexprofiles presented in (a).
fiber 78
L=0 m
L=1 m
L=75 m
L=1 km
0 µm 13 µm 26 µm radial offset
Figure 4.11: Simulated NFP on the output facet of a 62.5/125 µm silica-basedGI-MMF using fiber 78 from the 108-fiber set, at 1310 nm wavelength. Each rowcorresponds to a different GI-MMF length (L) and each column to a differentradial offset of the input SMF. Mode mixing is not taken into account.
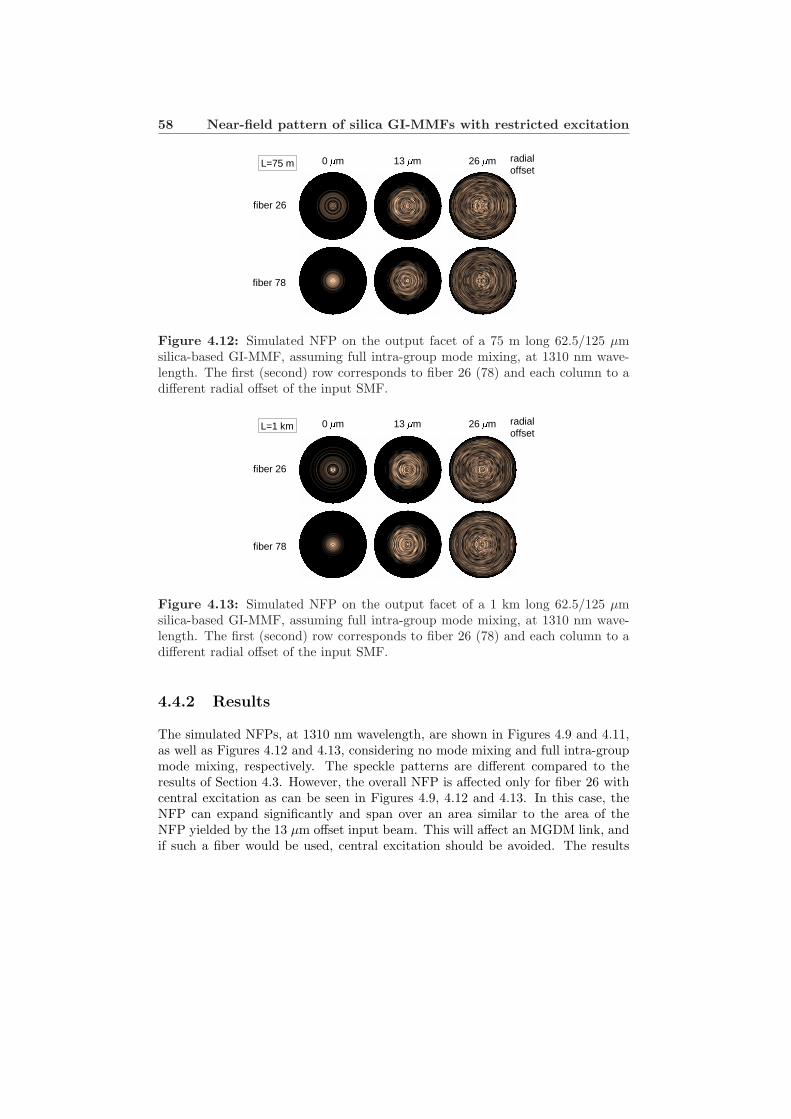
58 Near-field pattern of silica GI-MMFs with restricted excitation
fiber 26
0 µm 13 µm 26 µm radial offset
fiber 78
L=75 m
Figure 4.12: Simulated NFP on the output facet of a 75 m long 62.5/125 µmsilica-based GI-MMF, assuming full intra-group mode mixing, at 1310 nm wave-length. The first (second) row corresponds to fiber 26 (78) and each column to adifferent radial offset of the input SMF.
0 µm 13 µm 26 µm radial offset
fiber 26
fiber 78
L=1 km
Figure 4.13: Simulated NFP on the output facet of a 1 km long 62.5/125 µmsilica-based GI-MMF, assuming full intra-group mode mixing, at 1310 nm wave-length. The first (second) row corresponds to fiber 26 (78) and each column to adifferent radial offset of the input SMF.
4.4.2 Results
The simulated NFPs, at 1310 nm wavelength, are shown in Figures 4.9 and 4.11,as well as Figures 4.12 and 4.13, considering no mode mixing and full intra-groupmode mixing, respectively. The speckle patterns are different compared to theresults of Section 4.3. However, the overall NFP is affected only for fiber 26 withcentral excitation as can be seen in Figures 4.9, 4.12 and 4.13. In this case, theNFP can expand significantly and span over an area similar to the area of theNFP yielded by the 13 µm offset input beam. This will affect an MGDM link, andif such a fiber would be used, central excitation should be avoided. The results
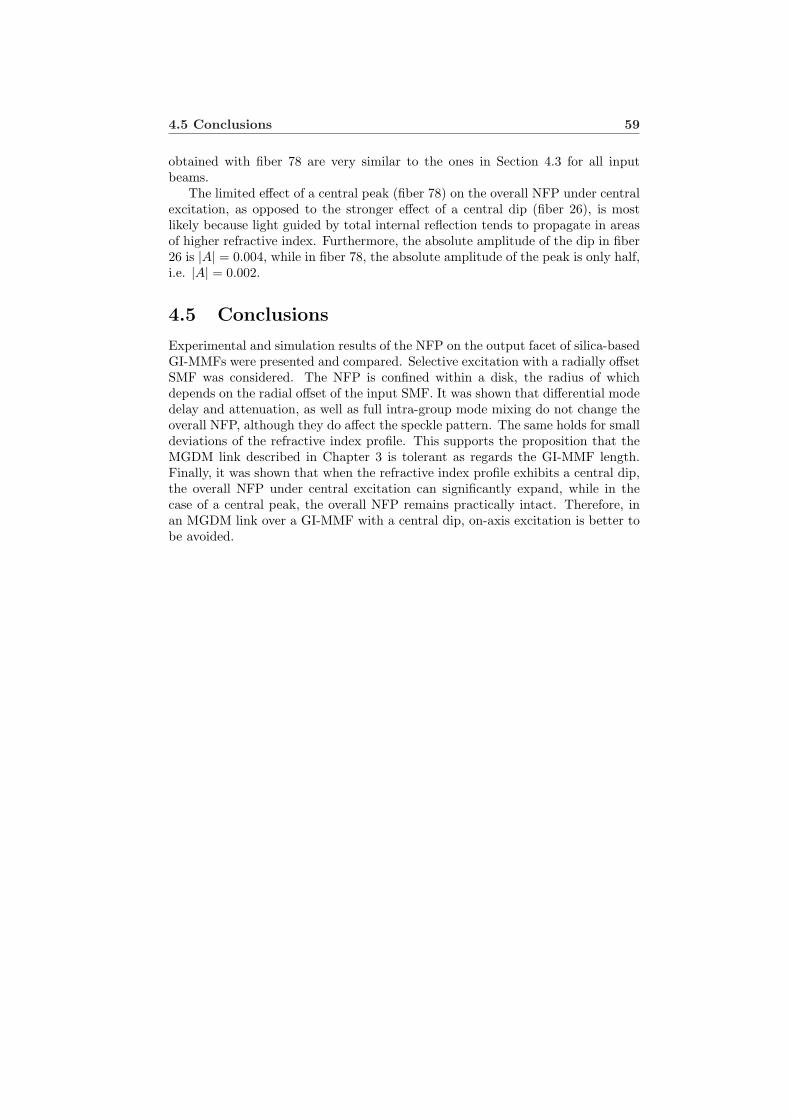
4.5 Conclusions 59
obtained with fiber 78 are very similar to the ones in Section 4.3 for all inputbeams.
The limited effect of a central peak (fiber 78) on the overall NFP under centralexcitation, as opposed to the stronger effect of a central dip (fiber 26), is mostlikely because light guided by total internal reflection tends to propagate in areasof higher refractive index. Furthermore, the absolute amplitude of the dip in fiber26 is |A| = 0.004, while in fiber 78, the absolute amplitude of the peak is only half,i.e. |A| = 0.002.
4.5 Conclusions
Experimental and simulation results of the NFP on the output facet of silica-basedGI-MMFs were presented and compared. Selective excitation with a radially offsetSMF was considered. The NFP is confined within a disk, the radius of whichdepends on the radial offset of the input SMF. It was shown that differential modedelay and attenuation, as well as full intra-group mode mixing do not change theoverall NFP, although they do affect the speckle pattern. The same holds for smalldeviations of the refractive index profile. This supports the proposition that theMGDM link described in Chapter 3 is tolerant as regards the GI-MMF length.Finally, it was shown that when the refractive index profile exhibits a central dip,the overall NFP under central excitation can significantly expand, while in thecase of a central peak, the overall NFP remains practically intact. Therefore, inan MGDM link over a GI-MMF with a central dip, on-axis excitation is better tobe avoided.

Chapter 5
A stable 2× 2 MGDM system
The temporal stability of an MGDM link is examined. The transmission matrix isvulnerable to mode mixing as well as changes of the coupling of light at the inputand output ends of the GI-MMF. An experimental 2 × 2 MGDM link has beenbuilt. Measurements of the transmission matrix of this link over a 12.7 h periodin a not-environmentally-controlled experimental setup show that an MGDM linkcan be very stable. Further, the electrical cross-talk is estimated as a function ofthe period of estimation of the transmission matrix, assuming that the transmittedsignals are demultiplexed with electronic matrix inversion. The linearity of this2× 2 link is examined and the sources of signal distortion are identified. Finally,an analog approach for electronic demultiplexing is described, which was used tobuild the first basic MGDM demonstrator, supporting the transmission of two low-bandwidth signals.
5.1 Introduction
The performance of every optical communication system can be affected by sev-eral factors. Temperature changes, wavelength drifting or mechanical vibrationscan have a severe impact on the performance of a system. For example, tempera-ture changes can affect the level of the optical power emitted by a semiconductorlaser. Temperature controllers or automatic power control loops can be used tocombat this problem. Wavelength drifting, which can be temperature-induced,may affect systems with wavelength-selective components, such as the ones usedin wavelength division multiplexing transmission. Further, wavelength driftingdue to laser chirping widens the spectrum of the transmitted signal. Mechanicalvibrations can alter the MMF propagation characteristics or the coupling of light.
In an MGDM system, the above factors can also induce varying mode mix-ing conditions during propagation and hence change the performance of the link.
Parts of this chapter are published in Refs. [3,7,8,10,13] of Appendix B.
62 A stable 2× 2 MGDM system
Overall, in MGDM transmission, any variation can translate into changes in thetransmission matrix of the system. To accommodate such changes, adaptivity inthe estimation of the transmission matrix is required. Adaptivity can be achievedby updating the value of the transmission matrix coefficients at the receiving sideof the MGDM link. This approach would suffice for a link which is fairly stableand therefore would not require a feedback control loop from the receiving sideto the transmitting side. In this chapter, a 2× 2 MGDM link is described and itshown to be stable, requiring adaptivity only at the receiving side.
5.2 The impact of variations of the transmissionmatrix
As discussed in Chapter 2, in an N×N MGDM system, vector sR(t) of the receivedelectrical signals is related to vector sT (t) of the transmitted electrical signals viaa real-valued N ×N transmission matrix H(t) = {hi,j(t)}, i.e.
sR(t) = H(t)sT (t) + n(t),
where n(t) is a noise term. The matrix elements express the spatial diversity andthe signal mixing. When H(t) is known, the transmitted signals can be recoveredby electronic matrix inversion, a method consistent with the requirement of servicetransparency. The estimated transmitted signals are then
sT (t) = H−1
(t)sR(t) + nde(t) ⇒sT (t) = H
−1(t)H(t)sT (t) + H
−1(t)n(t) + nde(t), (5.1)
where H−1
(t) is an estimate of the inverse of H(t) and nde(t) the noise from theelectronic circuit that performs the demultiplexing based on matrix inversion.
From Eq. (5.1), it is evident that any temporal variations in the elements ofH(t), and consequently of H
−1(t), will change the noise level through the factor
H−1
(t)n(t) and thus the power budget of the link. Furthermore, if the estimationof H(t) is not ideal, i.e. if H
−1(t) 6= H−1(t), then cross-talk will remain among
the channels, since the inner product H−1
(t)H(t) will not result in the N × Nidentity matrix IN×N .
The rate of the temporal variations is an important parameter. Very fast varia-tions may not be trackable and therefore will be manifest as noise. Slow variationscan be tracked and therefore can be compensated. If these variations are strong,then due to the power budget dependence on H(t), the system may require feed-back to adjust the transmitted power. This would increase the complexity of thesystem considerably. As already mentioned in Chapter 1, our investigation aimsat a system without a feedback control loop from the receiver to the transmitter.Therefore, it is in our interest to show that an MGDM link can be stable.
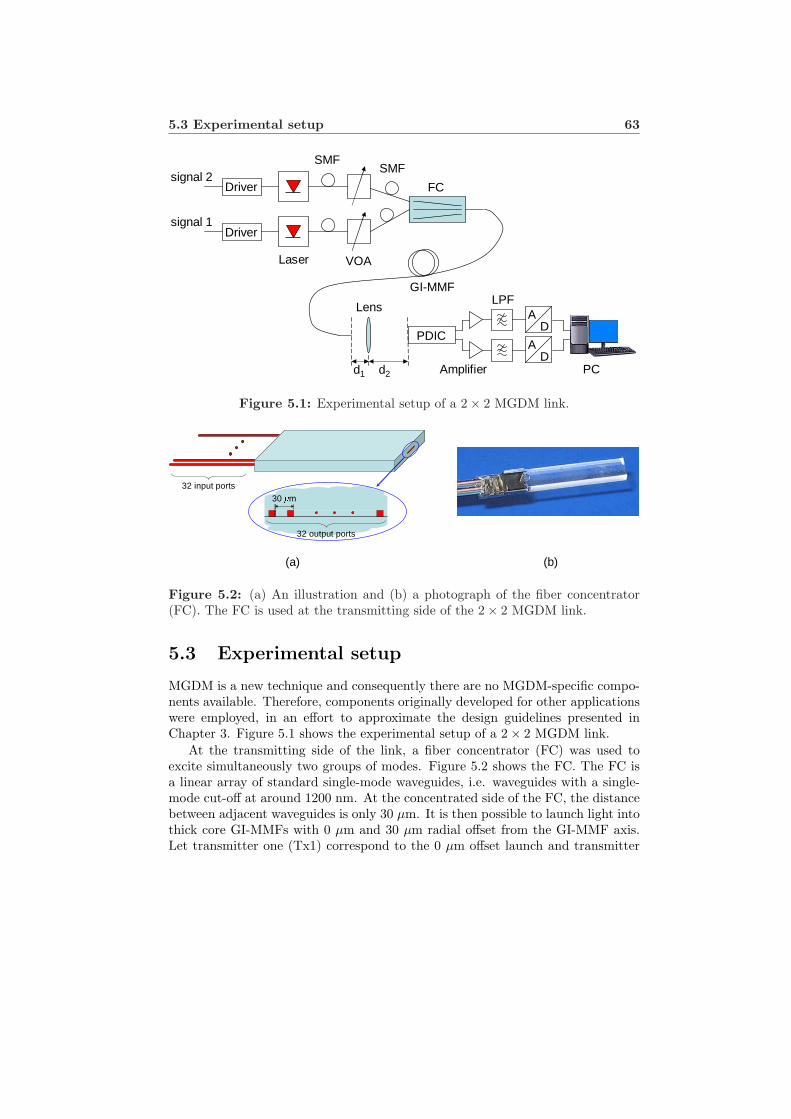
5.3 Experimental setup 63
FC
SMF
VOALaser
Driver
Driversignal 2
signal 1
SMF
GI-MMF
PDIC
d1 d2
Lens
PC
LPF
Amplifier
AD
AD
Figure 5.1: Experimental setup of a 2× 2 MGDM link.
(a) (b)
32 input ports
32 output ports
30 µm
Figure 5.2: (a) An illustration and (b) a photograph of the fiber concentrator(FC). The FC is used at the transmitting side of the 2× 2 MGDM link.
5.3 Experimental setup
MGDM is a new technique and consequently there are no MGDM-specific compo-nents available. Therefore, components originally developed for other applicationswere employed, in an effort to approximate the design guidelines presented inChapter 3. Figure 5.1 shows the experimental setup of a 2× 2 MGDM link.
At the transmitting side of the link, a fiber concentrator (FC) was used toexcite simultaneously two groups of modes. Figure 5.2 shows the FC. The FC isa linear array of standard single-mode waveguides, i.e. waveguides with a single-mode cut-off at around 1200 nm. At the concentrated side of the FC, the distancebetween adjacent waveguides is only 30 µm. It is then possible to launch light intothick core GI-MMFs with 0 µm and 30 µm radial offset from the GI-MMF axis.Let transmitter one (Tx1) correspond to the 0 µm offset launch and transmitter
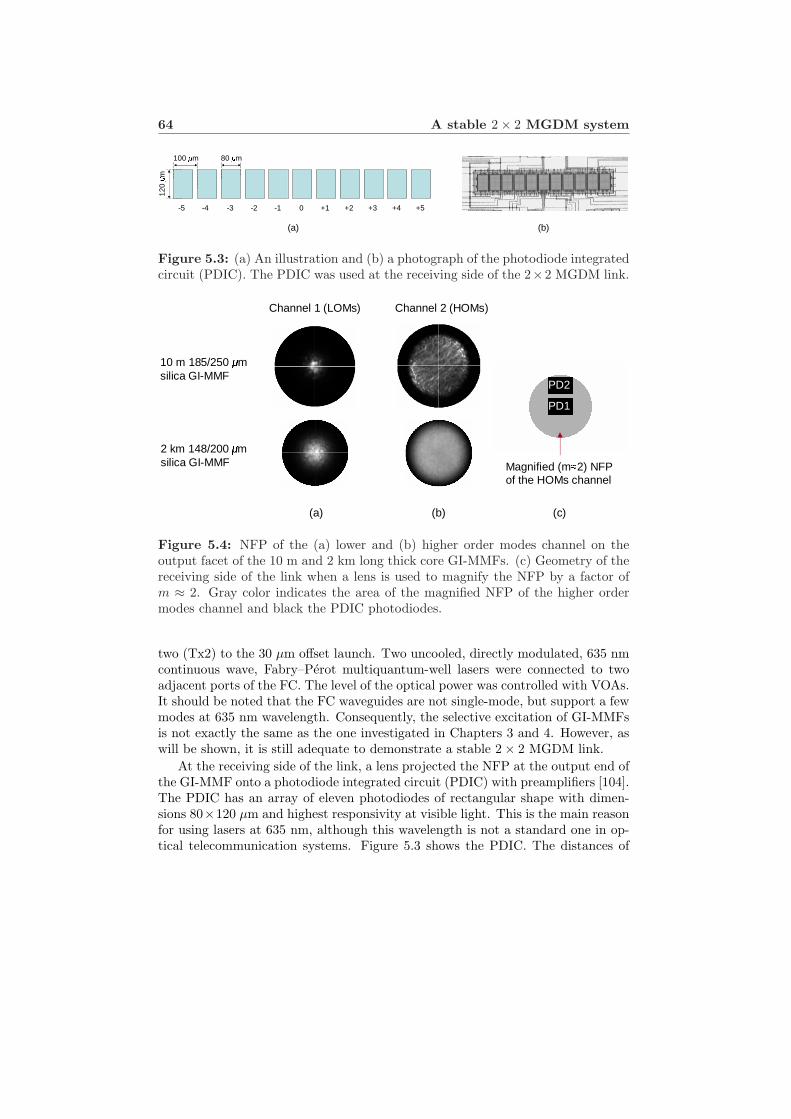
64 A stable 2× 2 MGDM system
100 µm12
0
µm 80 µm
-5 -4 -3 -2 -1 0 +1 +2 +3 +4 +5
(a) (b)
Figure 5.3: (a) An illustration and (b) a photograph of the photodiode integratedcircuit (PDIC). The PDIC was used at the receiving side of the 2×2 MGDM link.
2 km 148/200 µm silica GI-MMF
10 m 185/250 µm silica GI-MMF
Channel 1 (LOMs) Channel 2 (HOMs)
Magnified (m≈2) NFP of the HOMs channel
PD2
PD1
(a) (b) (c)
Figure 5.4: NFP of the (a) lower and (b) higher order modes channel on theoutput facet of the 10 m and 2 km long thick core GI-MMFs. (c) Geometry of thereceiving side of the link when a lens is used to magnify the NFP by a factor ofm ≈ 2. Gray color indicates the area of the magnified NFP of the higher ordermodes channel and black the PDIC photodiodes.
two (Tx2) to the 30 µm offset launch. Two uncooled, directly modulated, 635 nmcontinuous wave, Fabry–Perot multiquantum-well lasers were connected to twoadjacent ports of the FC. The level of the optical power was controlled with VOAs.It should be noted that the FC waveguides are not single-mode, but support a fewmodes at 635 nm wavelength. Consequently, the selective excitation of GI-MMFsis not exactly the same as the one investigated in Chapters 3 and 4. However, aswill be shown, it is still adequate to demonstrate a stable 2× 2 MGDM link.
At the receiving side of the link, a lens projected the NFP at the output end ofthe GI-MMF onto a photodiode integrated circuit (PDIC) with preamplifiers [104].The PDIC has an array of eleven photodiodes of rectangular shape with dimen-sions 80×120 µm and highest responsivity at visible light. This is the main reasonfor using lasers at 635 nm, although this wavelength is not a standard one in op-tical telecommunication systems. Figure 5.3 shows the PDIC. The distances of
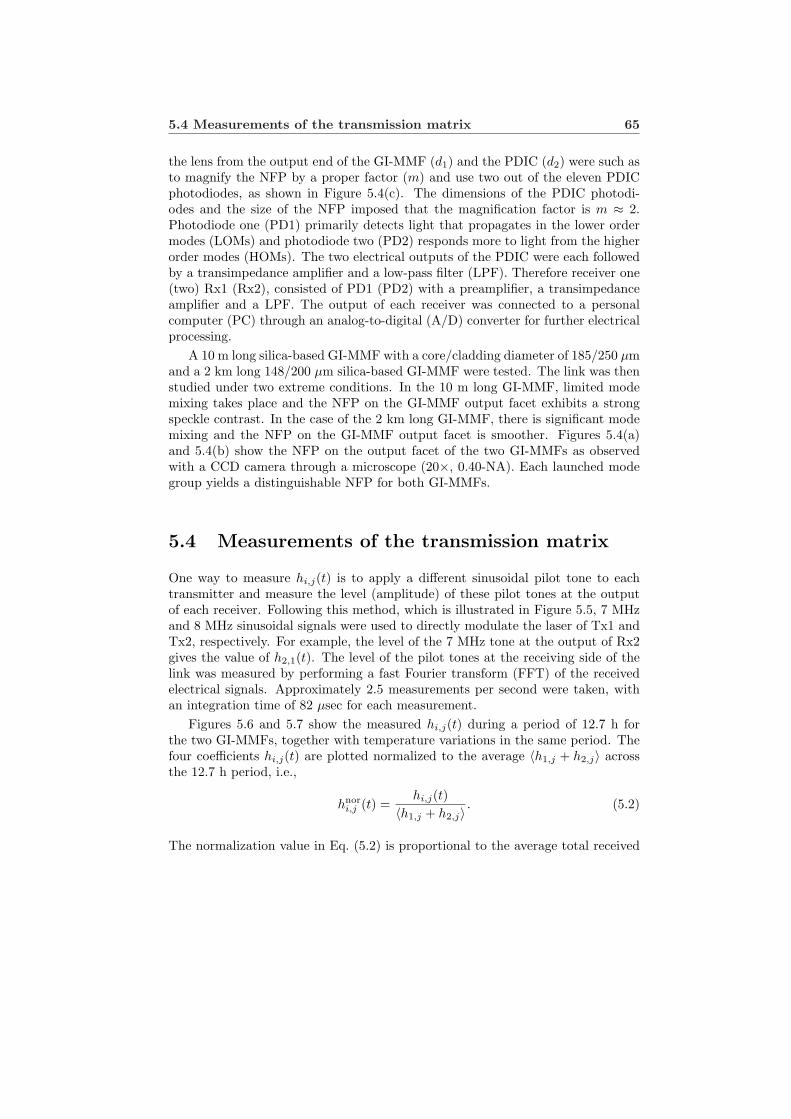
5.4 Measurements of the transmission matrix 65
the lens from the output end of the GI-MMF (d1) and the PDIC (d2) were such asto magnify the NFP by a proper factor (m) and use two out of the eleven PDICphotodiodes, as shown in Figure 5.4(c). The dimensions of the PDIC photodi-odes and the size of the NFP imposed that the magnification factor is m ≈ 2.Photodiode one (PD1) primarily detects light that propagates in the lower ordermodes (LOMs) and photodiode two (PD2) responds more to light from the higherorder modes (HOMs). The two electrical outputs of the PDIC were each followedby a transimpedance amplifier and a low-pass filter (LPF). Therefore receiver one(two) Rx1 (Rx2), consisted of PD1 (PD2) with a preamplifier, a transimpedanceamplifier and a LPF. The output of each receiver was connected to a personalcomputer (PC) through an analog-to-digital (A/D) converter for further electricalprocessing.
A 10 m long silica-based GI-MMF with a core/cladding diameter of 185/250 µmand a 2 km long 148/200 µm silica-based GI-MMF were tested. The link was thenstudied under two extreme conditions. In the 10 m long GI-MMF, limited modemixing takes place and the NFP on the GI-MMF output facet exhibits a strongspeckle contrast. In the case of the 2 km long GI-MMF, there is significant modemixing and the NFP on the GI-MMF output facet is smoother. Figures 5.4(a)and 5.4(b) show the NFP on the output facet of the two GI-MMFs as observedwith a CCD camera through a microscope (20×, 0.40-NA). Each launched modegroup yields a distinguishable NFP for both GI-MMFs.
5.4 Measurements of the transmission matrix
One way to measure hi,j(t) is to apply a different sinusoidal pilot tone to eachtransmitter and measure the level (amplitude) of these pilot tones at the outputof each receiver. Following this method, which is illustrated in Figure 5.5, 7 MHzand 8 MHz sinusoidal signals were used to directly modulate the laser of Tx1 andTx2, respectively. For example, the level of the 7 MHz tone at the output of Rx2gives the value of h2,1(t). The level of the pilot tones at the receiving side of thelink was measured by performing a fast Fourier transform (FFT) of the receivedelectrical signals. Approximately 2.5 measurements per second were taken, withan integration time of 82 µsec for each measurement.
Figures 5.6 and 5.7 show the measured hi,j(t) during a period of 12.7 h forthe two GI-MMFs, together with temperature variations in the same period. Thefour coefficients hi,j(t) are plotted normalized to the average 〈h1,j + h2,j〉 acrossthe 12.7 h period, i.e.,
hnori,j (t) =
hi,j(t)〈h1,j + h2,j〉 . (5.2)
The normalization value in Eq. (5.2) is proportional to the average total received
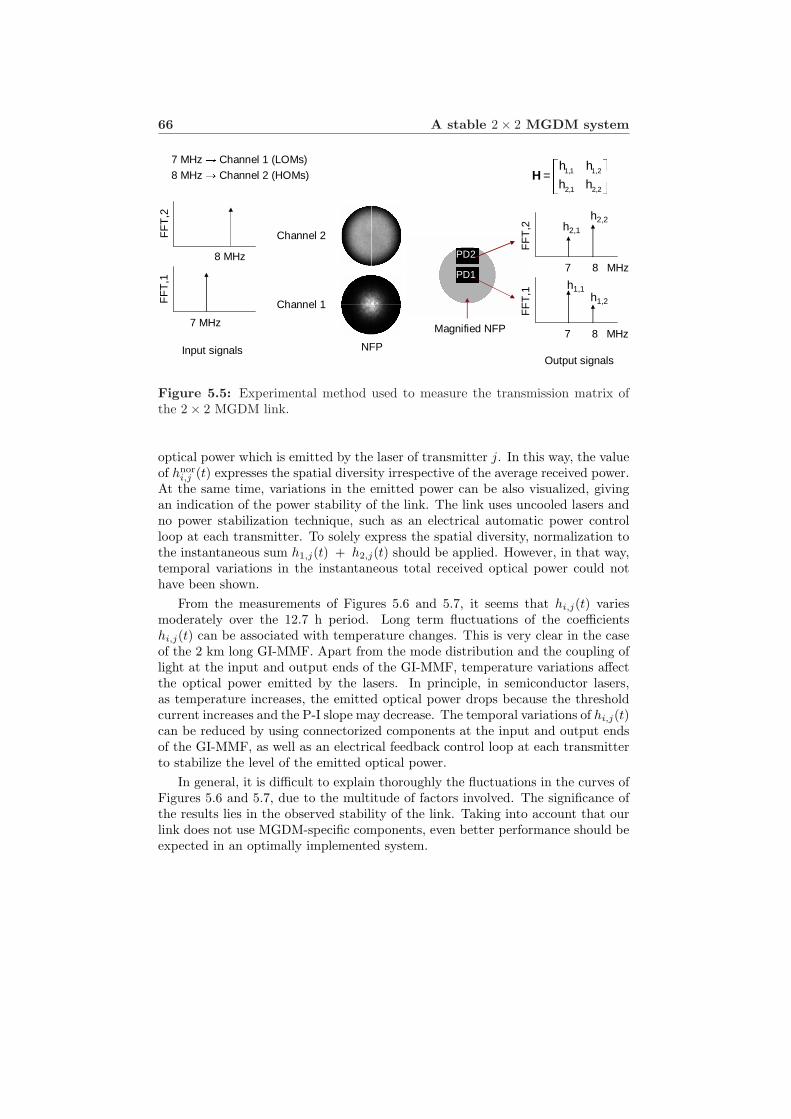
66 A stable 2× 2 MGDM system
7 MHz
8 MHz
FF
T,2
FF
T,1
Input signals
7 MHz → Channel 1 (LOMs)
8 MHz → Channel 2 (HOMs)
Channel 1
Channel 2
NFP7 8 MHz
7 8 MHz
FF
T,2
FF
T,1
PD1
PD2
h1,1h1,2
h2,1
h2,2
1,1 1,2
2,1 2,2
=h h
h h
H
Output signals
Magnified NFP
Figure 5.5: Experimental method used to measure the transmission matrix ofthe 2× 2 MGDM link.
optical power which is emitted by the laser of transmitter j. In this way, the valueof hnor
i,j (t) expresses the spatial diversity irrespective of the average received power.At the same time, variations in the emitted power can be also visualized, givingan indication of the power stability of the link. The link uses uncooled lasers andno power stabilization technique, such as an electrical automatic power controlloop at each transmitter. To solely express the spatial diversity, normalization tothe instantaneous sum h1,j(t) + h2,j(t) should be applied. However, in that way,temporal variations in the instantaneous total received optical power could nothave been shown.
From the measurements of Figures 5.6 and 5.7, it seems that hi,j(t) variesmoderately over the 12.7 h period. Long term fluctuations of the coefficientshi,j(t) can be associated with temperature changes. This is very clear in the caseof the 2 km long GI-MMF. Apart from the mode distribution and the coupling oflight at the input and output ends of the GI-MMF, temperature variations affectthe optical power emitted by the lasers. In principle, in semiconductor lasers,as temperature increases, the emitted optical power drops because the thresholdcurrent increases and the P-I slope may decrease. The temporal variations of hi,j(t)can be reduced by using connectorized components at the input and output endsof the GI-MMF, as well as an electrical feedback control loop at each transmitterto stabilize the level of the emitted optical power.
In general, it is difficult to explain thoroughly the fluctuations in the curves ofFigures 5.6 and 5.7, due to the multitude of factors involved. The significance ofthe results lies in the observed stability of the link. Taking into account that ourlink does not use MGDM-specific components, even better performance should beexpected in an optimally implemented system.
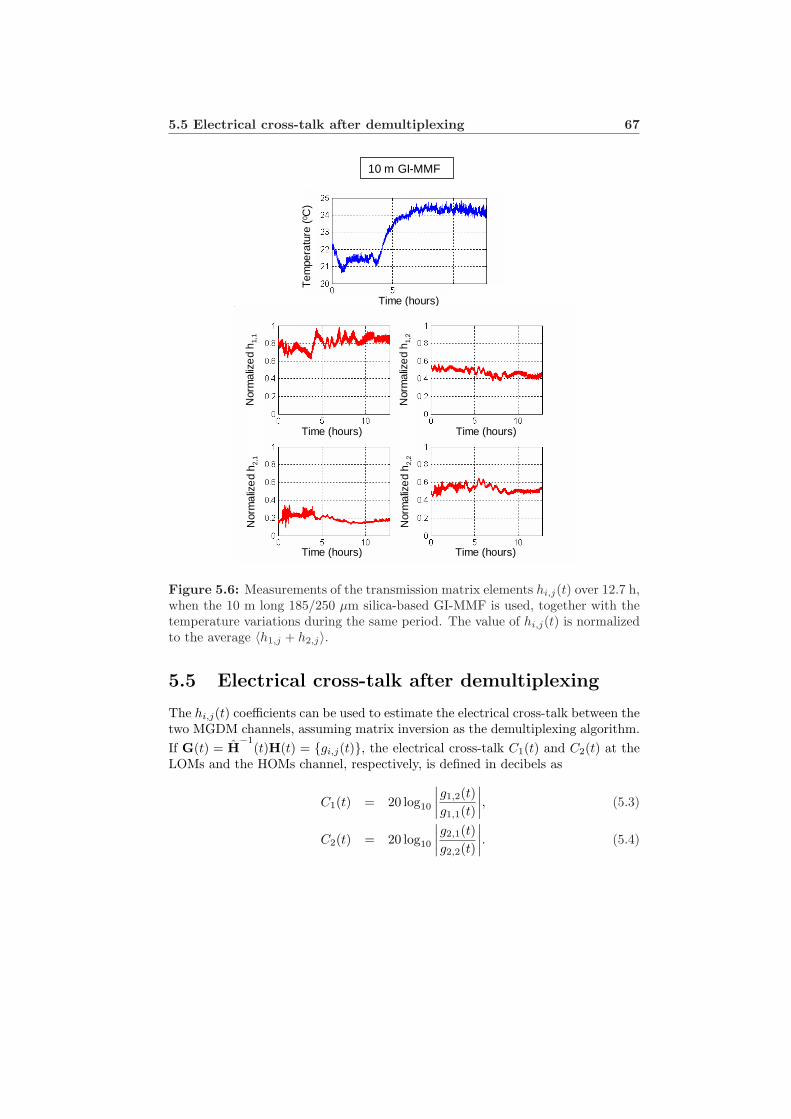
5.5 Electrical cross-talk after demultiplexing 67
Time (hours)T
empe
ratu
re (
0 C)
10 m GI-MMF
Time (hours)
Nor
mal
ize
d h 2
,1N
orm
aliz
ed
h 1,1
Nor
mal
ize
d h 2
,2N
orm
aliz
ed
h 1,2
Time (hours) Time (hours)
Time (hours)
Figure 5.6: Measurements of the transmission matrix elements hi,j(t) over 12.7 h,when the 10 m long 185/250 µm silica-based GI-MMF is used, together with thetemperature variations during the same period. The value of hi,j(t) is normalizedto the average 〈h1,j + h2,j〉.
5.5 Electrical cross-talk after demultiplexing
The hi,j(t) coefficients can be used to estimate the electrical cross-talk between thetwo MGDM channels, assuming matrix inversion as the demultiplexing algorithm.If G(t) = H
−1(t)H(t) = {gi,j(t)}, the electrical cross-talk C1(t) and C2(t) at the
LOMs and the HOMs channel, respectively, is defined in decibels as
C1(t) = 20 log10
∣∣∣∣g1,2(t)g1,1(t)
∣∣∣∣, (5.3)
C2(t) = 20 log10
∣∣∣∣g2,1(t)g2,2(t)
∣∣∣∣. (5.4)
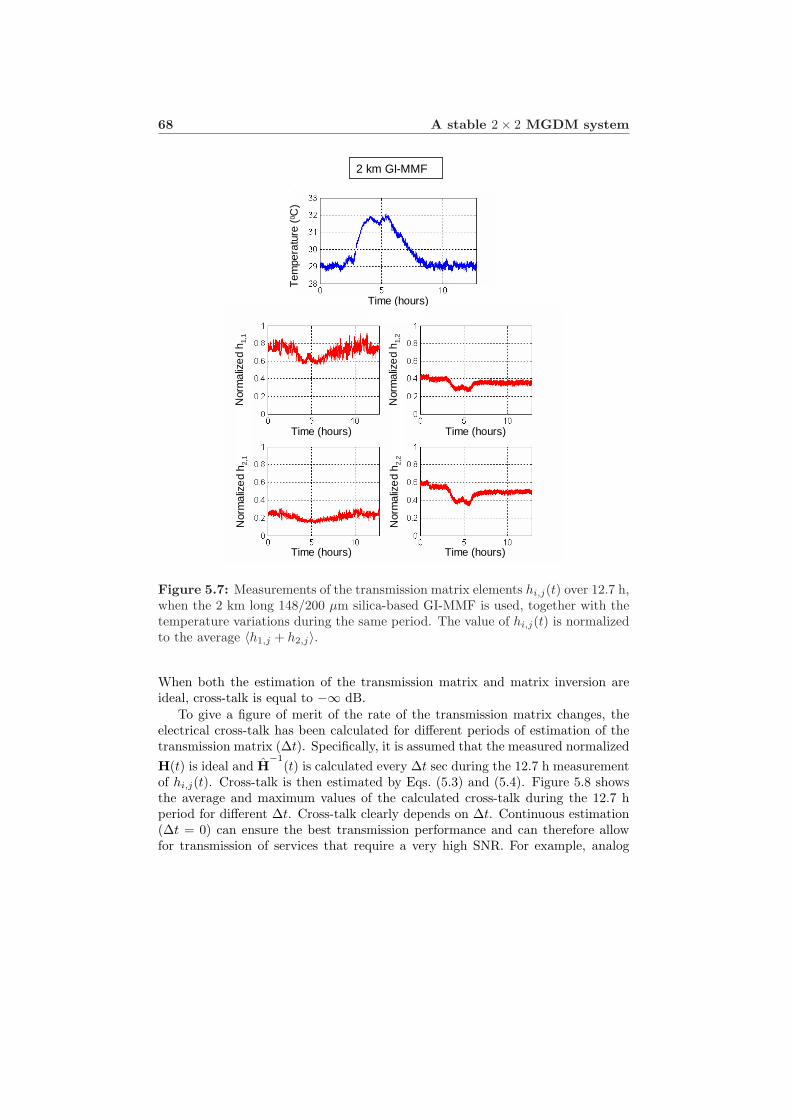
68 A stable 2× 2 MGDM system
Time (hours)
Nor
mal
ize
d h 2
,1N
orm
aliz
ed
h 1,1
Nor
mal
ize
d h 2
,2N
orm
aliz
ed
h 1,2
Time (hours)
Time (hours) Time (hours)
Time (hours)
Tem
pera
ture
(0 C
)
2 km GI-MMF
Figure 5.7: Measurements of the transmission matrix elements hi,j(t) over 12.7 h,when the 2 km long 148/200 µm silica-based GI-MMF is used, together with thetemperature variations during the same period. The value of hi,j(t) is normalizedto the average 〈h1,j + h2,j〉.
When both the estimation of the transmission matrix and matrix inversion areideal, cross-talk is equal to −∞ dB.
To give a figure of merit of the rate of the transmission matrix changes, theelectrical cross-talk has been calculated for different periods of estimation of thetransmission matrix (∆t). Specifically, it is assumed that the measured normalizedH(t) is ideal and H
−1(t) is calculated every ∆t sec during the 12.7 h measurement
of hi,j(t). Cross-talk is then estimated by Eqs. (5.3) and (5.4). Figure 5.8 showsthe average and maximum values of the calculated cross-talk during the 12.7 hperiod for different ∆t. Cross-talk clearly depends on ∆t. Continuous estimation(∆t = 0) can ensure the best transmission performance and can therefore allowfor transmission of services that require a very high SNR. For example, analog
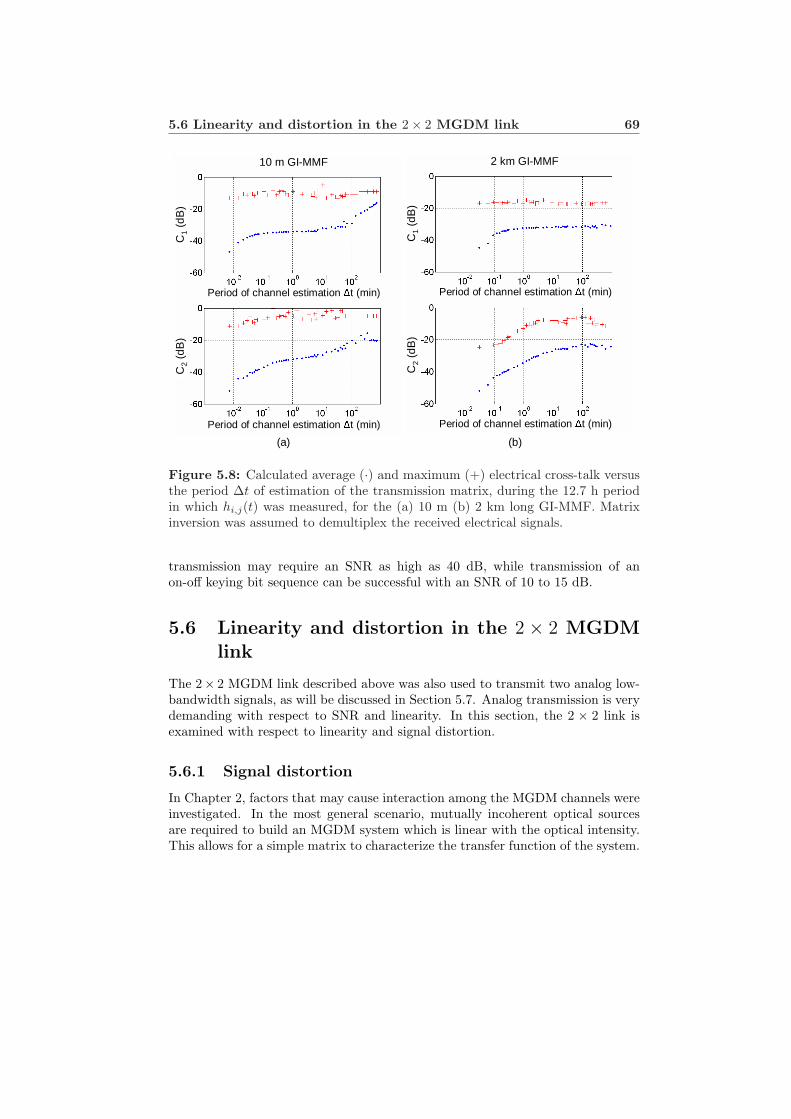
5.6 Linearity and distortion in the 2× 2 MGDM link 69
10 m GI-MMF
C1
(dB
)C
2(d
B)
Period of channel estimation ∆t (min)
Period of channel estimation ∆t (min)
2 km GI-MMF
Period of channel estimation ∆t (min)
Period of channel estimation ∆t (min)
C1
(dB
)C
2(d
B)
(a) (b)
Figure 5.8: Calculated average (·) and maximum (+) electrical cross-talk versusthe period ∆t of estimation of the transmission matrix, during the 12.7 h periodin which hi,j(t) was measured, for the (a) 10 m (b) 2 km long GI-MMF. Matrixinversion was assumed to demultiplex the received electrical signals.
transmission may require an SNR as high as 40 dB, while transmission of anon-off keying bit sequence can be successful with an SNR of 10 to 15 dB.
5.6 Linearity and distortion in the 2 × 2 MGDMlink
The 2× 2 MGDM link described above was also used to transmit two analog low-bandwidth signals, as will be discussed in Section 5.7. Analog transmission is verydemanding with respect to SNR and linearity. In this section, the 2 × 2 link isexamined with respect to linearity and signal distortion.
5.6.1 Signal distortion
In Chapter 2, factors that may cause interaction among the MGDM channels wereinvestigated. In the most general scenario, mutually incoherent optical sourcesare required to build an MGDM system which is linear with the optical intensity.This allows for a simple matrix to characterize the transfer function of the system.
70 A stable 2× 2 MGDM system
Cross-talk is then expressed in the non-diagonal elements of H(t).Similarly to other optical communication systems, the signal in every single
MGDM channel can be distorted. Signal distortion can be caused either by linearor non-linear effects. Overall, MMFs can be viewed simply as dispersive, lossymedia. Loss can be compensated by increasing the transmitting optical power.Dispersion limits the bandwidth of IM-DD transmission. It can also induce har-monic distortion when combined with laser chirping [105–108]. In general, directmodulation results in stronger chirping than external modulation. The signal ismore distorted as chirping and dispersion increase. An MGDM system, with areal-valued H(t), operates below the dispersion limit. This limit depends on thetransmission format and it is also determined by the tolerance of the providedservices to dispersion-induced harmonic distortion.
Non-linear characteristics of the system can introduce harmonic and intermod-ulation distortion. Such non-linear characteristics can be in the P-I curve of thelaser, the dependence of the responsivity of the photodiode on the optical intensityand non-linear responses in the electronic circuitries of the system. Usually, non-linearities from the laser prevail over the ones from the photodiode. A non-linearresponse can be also due to some degree of mutual coherence among the fields ofthe detected mode groups that can cause beat noise, as was shown in Chapter 2.
5.6.2 System response
To examine the linearity and signal distortion in the 2 × 2 experimental link,a simple measurement was performed. At first, the laser bias current and theamplitude of the modulating electrical pilot tone were determined so as to optimizethe linearity of the response. At the bias point, the optical power at the outputend of the SMF patch-cord of the laser was 2 mW, while the amplitude of themodulating signal corresponded to 1 mW optical power (thus 2 mW peak-to-peak).Figures 5.9 and 5.10 show the electrical spectrum of a back-to-back measurement.In particular, they show the spectrum at the output of one receiver of the linkwhen the lasers of Tx1 and Tx2, respectively, were modulated with a pilot tone of1 MHz. The photodiode of the receiver responded to light from the SMF patch-cord of the laser. In both cases, more than 44 dB difference was achieved betweenthe amplitude of the 1 MHz tone and the amplitude of the highest harmonic.
A similar measurement was carried out using the 2 km long 148/200 µmsilica-based GI-MMF and exciting simultaneously both the LOMs channel andthe HOMs channel. The laser of Tx1 (Tx2) was modulated with a pilot tone of1 (1.5) MHz. The electrical spectra at the output of Rx1 and Rx2 are shown inFigures 5.11, 5.12, 5.13, and 5.14. More specifically, Figure 5.11 (5.12) shows thespectra when only the LOMs (HOMs) channel is excited and Figure 5.13 shows thespectra when both channels are active at the same time. Figure 5.14 correspondsto the case when both channels are idle (the lasers are switched off), in order toshow the response of the A/D converters when no signal is transmitted.
In Figures 5.11, 5.12 and 5.13, the pilot-to-the-strongest-harmonic ratio is de-
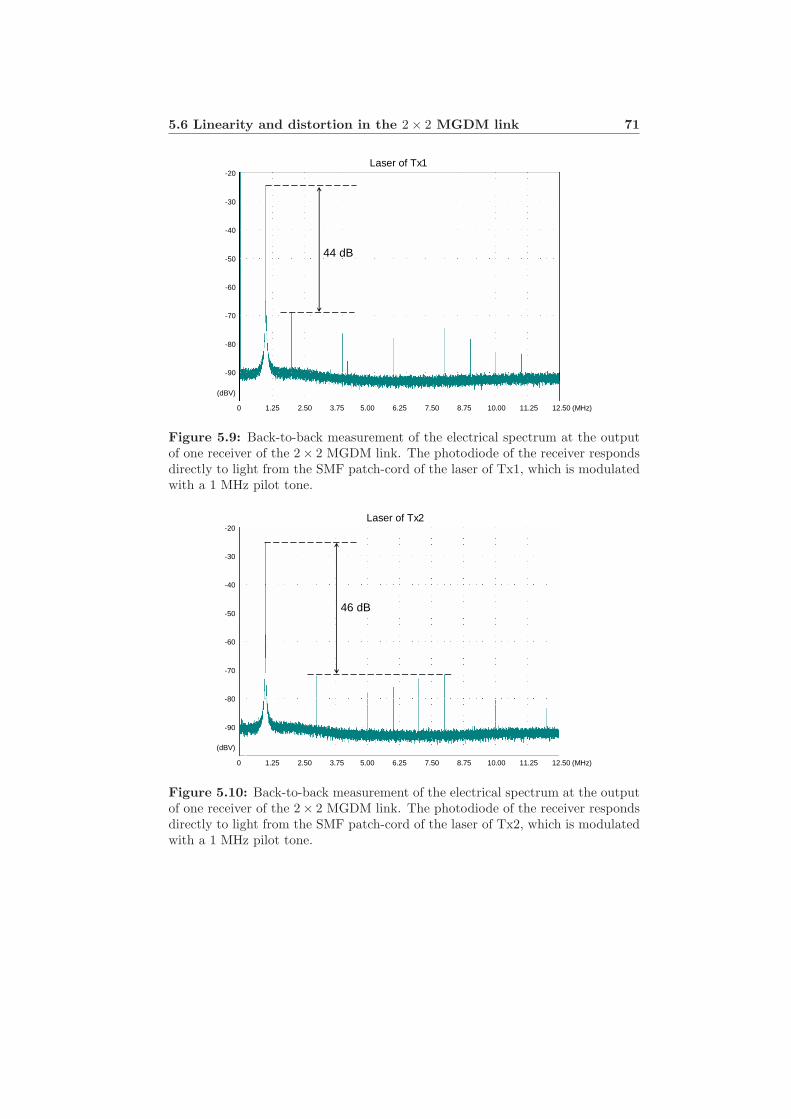
5.6 Linearity and distortion in the 2× 2 MGDM link 71
0 1.25 2.50 3.75 5.00 6.25 7.50 8.75 10.00 11.25 12.50 (MHz)
-20
-30
-40
-50
-60
-70
-80
-90
(dBV)
Laser of Tx1
44 dB
Figure 5.9: Back-to-back measurement of the electrical spectrum at the outputof one receiver of the 2× 2 MGDM link. The photodiode of the receiver respondsdirectly to light from the SMF patch-cord of the laser of Tx1, which is modulatedwith a 1 MHz pilot tone.
0 1.25 2.50 3.75 5.00 6.25 7.50 8.75 10.00 11.25 12.50 (MHz)
-20
-30
-40
-50
-60
-70
-80
-90
(dBV)
Laser of Tx2
46 dB
Figure 5.10: Back-to-back measurement of the electrical spectrum at the outputof one receiver of the 2× 2 MGDM link. The photodiode of the receiver respondsdirectly to light from the SMF patch-cord of the laser of Tx2, which is modulatedwith a 1 MHz pilot tone.
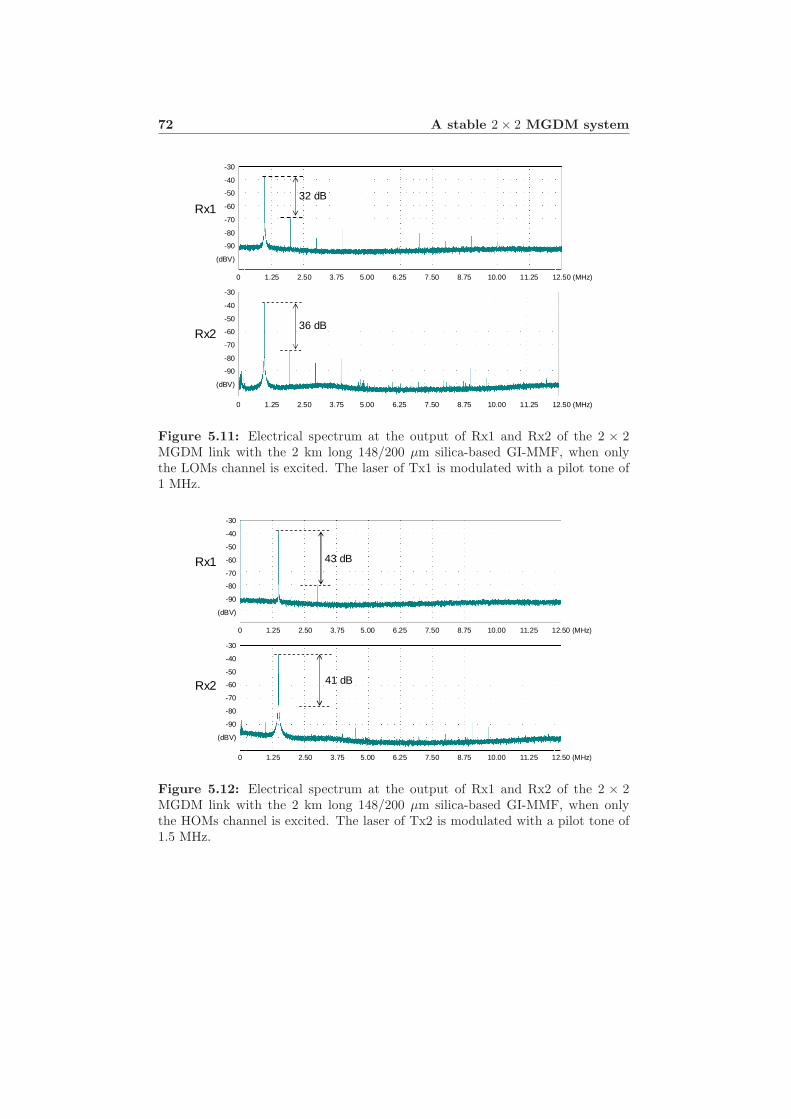
72 A stable 2× 2 MGDM system
0 1.25 2.50 3.75 5.00 6.25 7.50 8.75 10.00 11.25 12.50 (MHz)
-30
-40
-50
-60
-70
-80
-90
(dBV)
0 1.25 2.50 3.75 5.00 6.25 7.50 8.75 10.00 11.25 12.50 (MHz)
-30
-40
-50
-60
-70
-80
-90
(dBV)
32 dB
36 dB
Rx1
Rx2
Figure 5.11: Electrical spectrum at the output of Rx1 and Rx2 of the 2 × 2MGDM link with the 2 km long 148/200 µm silica-based GI-MMF, when onlythe LOMs channel is excited. The laser of Tx1 is modulated with a pilot tone of1 MHz.
0 1.25 2.50 3.75 5.00 6.25 7.50 8.75 10.00 11.25 12.50 (MHz)
-30
-40
-50
-60
-70
-80
-90
(dBV)
0 1.25 2.50 3.75 5.00 6.25 7.50 8.75 10.00 11.25 12.50 (MHz)
-30
-40
-50
-60
-70
-80
-90
(dBV)
43 dB
41 dB
Rx1
Rx2
Figure 5.12: Electrical spectrum at the output of Rx1 and Rx2 of the 2 × 2MGDM link with the 2 km long 148/200 µm silica-based GI-MMF, when onlythe HOMs channel is excited. The laser of Tx2 is modulated with a pilot tone of1.5 MHz.
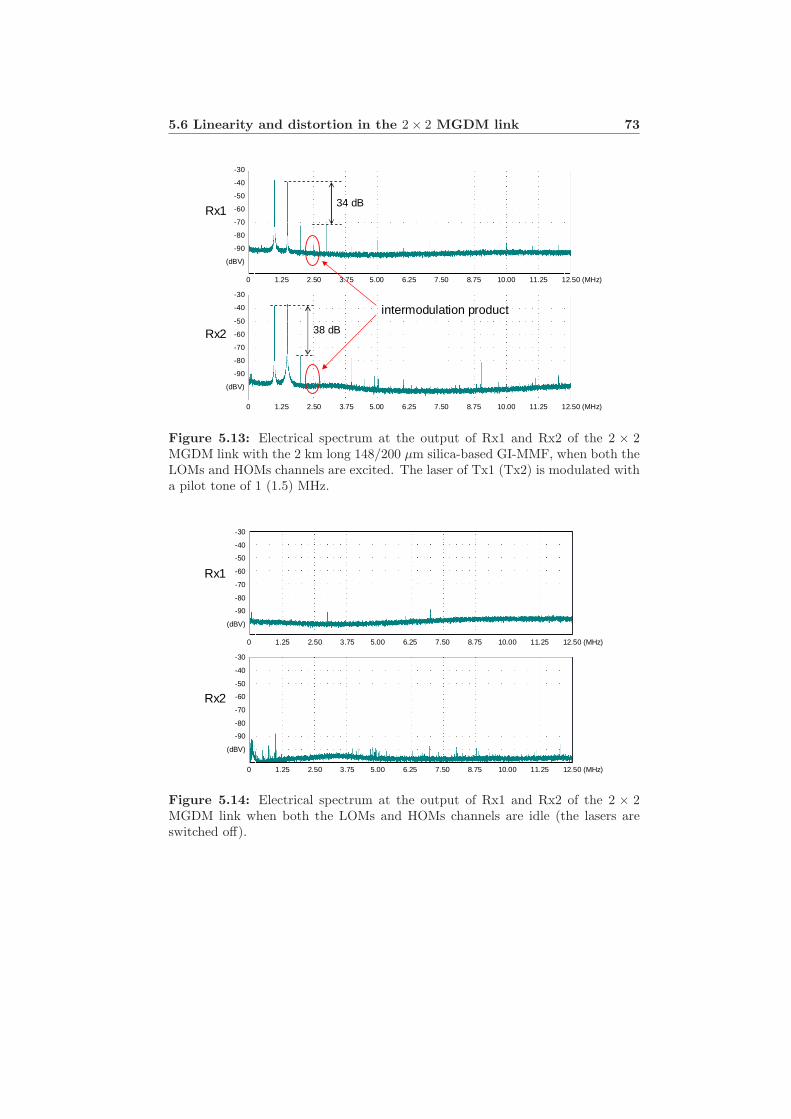
5.6 Linearity and distortion in the 2× 2 MGDM link 73
0 1.25 2.50 3.75 5.00 6.25 7.50 8.75 10.00 11.25 12.50 (MHz)
-30
-40
-50
-60
-70
-80
-90
(dBV)
0 1.25 2.50 3.75 5.00 6.25 7.50 8.75 10.00 11.25 12.50 (MHz)
-30
-40
-50
-60
-70
-80
-90
(dBV)
34 dB
38 dB
Rx1
Rx2
intermodulation product
Figure 5.13: Electrical spectrum at the output of Rx1 and Rx2 of the 2 × 2MGDM link with the 2 km long 148/200 µm silica-based GI-MMF, when both theLOMs and HOMs channels are excited. The laser of Tx1 (Tx2) is modulated witha pilot tone of 1 (1.5) MHz.
0 1.25 2.50 3.75 5.00 6.25 7.50 8.75 10.00 11.25 12.50 (MHz)
-30
-40
-50
-60
-70
-80
-90
(dBV)
0 1.25 2.50 3.75 5.00 6.25 7.50 8.75 10.00 11.25 12.50 (MHz)
-30
-40
-50
-60
-70
-80
-90
(dBV)
Rx1
Rx2
Figure 5.14: Electrical spectrum at the output of Rx1 and Rx2 of the 2 × 2MGDM link when both the LOMs and HOMs channels are idle (the lasers areswitched off).
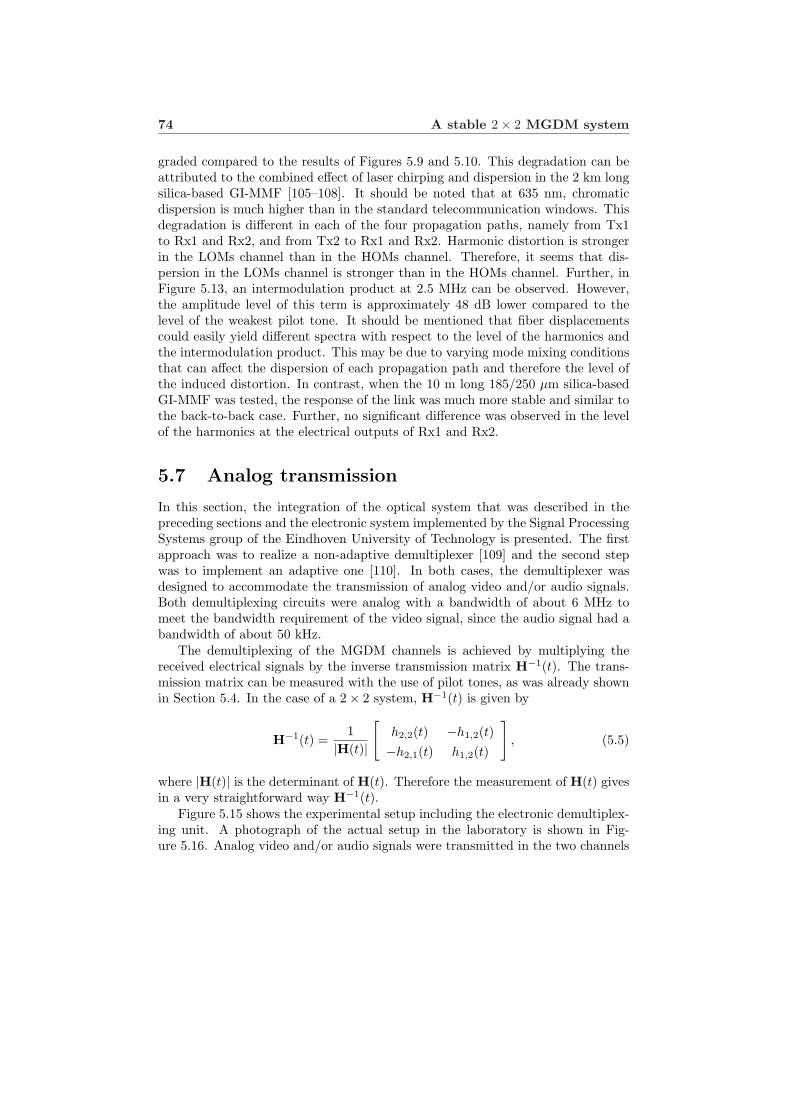
74 A stable 2× 2 MGDM system
graded compared to the results of Figures 5.9 and 5.10. This degradation can beattributed to the combined effect of laser chirping and dispersion in the 2 km longsilica-based GI-MMF [105–108]. It should be noted that at 635 nm, chromaticdispersion is much higher than in the standard telecommunication windows. Thisdegradation is different in each of the four propagation paths, namely from Tx1to Rx1 and Rx2, and from Tx2 to Rx1 and Rx2. Harmonic distortion is strongerin the LOMs channel than in the HOMs channel. Therefore, it seems that dis-persion in the LOMs channel is stronger than in the HOMs channel. Further, inFigure 5.13, an intermodulation product at 2.5 MHz can be observed. However,the amplitude level of this term is approximately 48 dB lower compared to thelevel of the weakest pilot tone. It should be mentioned that fiber displacementscould easily yield different spectra with respect to the level of the harmonics andthe intermodulation product. This may be due to varying mode mixing conditionsthat can affect the dispersion of each propagation path and therefore the level ofthe induced distortion. In contrast, when the 10 m long 185/250 µm silica-basedGI-MMF was tested, the response of the link was much more stable and similar tothe back-to-back case. Further, no significant difference was observed in the levelof the harmonics at the electrical outputs of Rx1 and Rx2.
5.7 Analog transmission
In this section, the integration of the optical system that was described in thepreceding sections and the electronic system implemented by the Signal ProcessingSystems group of the Eindhoven University of Technology is presented. The firstapproach was to realize a non-adaptive demultiplexer [109] and the second stepwas to implement an adaptive one [110]. In both cases, the demultiplexer wasdesigned to accommodate the transmission of analog video and/or audio signals.Both demultiplexing circuits were analog with a bandwidth of about 6 MHz tomeet the bandwidth requirement of the video signal, since the audio signal had abandwidth of about 50 kHz.
The demultiplexing of the MGDM channels is achieved by multiplying thereceived electrical signals by the inverse transmission matrix H−1(t). The trans-mission matrix can be measured with the use of pilot tones, as was already shownin Section 5.4. In the case of a 2× 2 system, H−1(t) is given by
H−1(t) =1
|H(t)|
[h2,2(t) −h1,2(t)−h2,1(t) h1,2(t)
], (5.5)
where |H(t)| is the determinant of H(t). Therefore the measurement of H(t) givesin a very straightforward way H−1(t).
Figure 5.15 shows the experimental setup including the electronic demultiplex-ing unit. A photograph of the actual setup in the laboratory is shown in Fig-ure 5.16. Analog video and/or audio signals were transmitted in the two channels
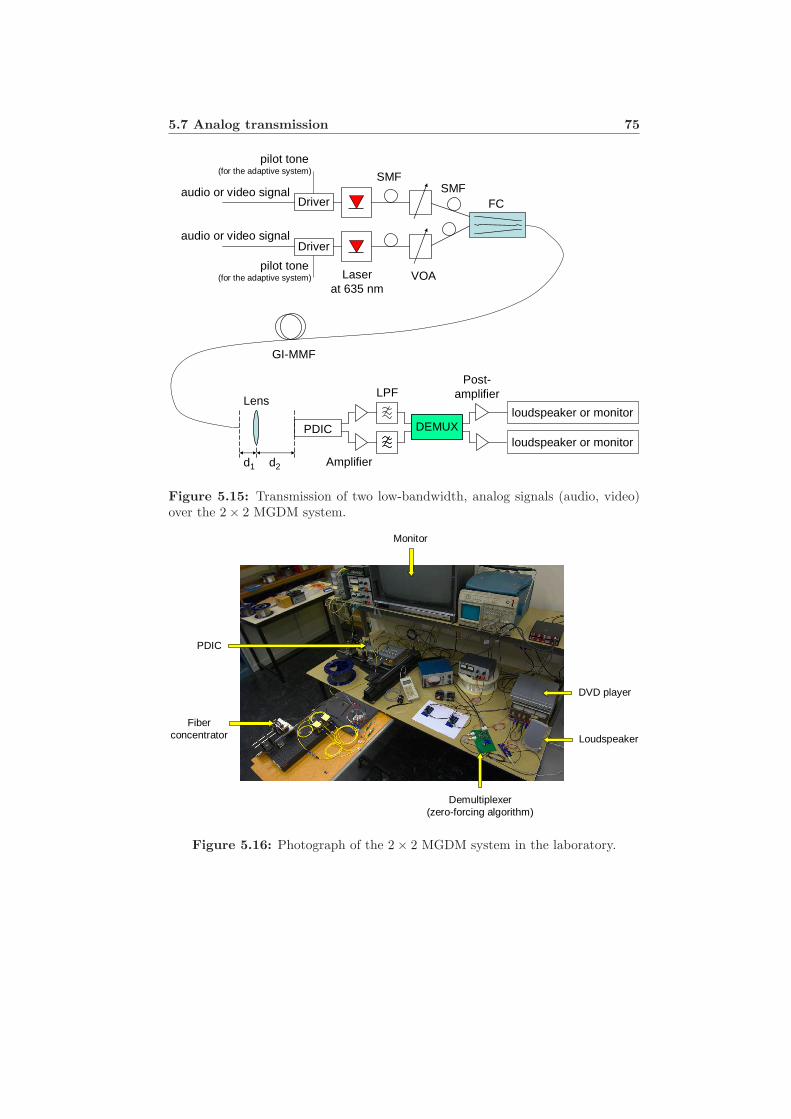
5.7 Analog transmission 75
Driver
Driveraudio or video signal
FC
GI-MMF
PDIC
d1 d2
Lens
SMF
VOALaserat 635 nm
SMF
DEMUX
LPF
Amplifier
Post-amplifier
audio or video signal
loudspeaker or monitor
loudspeaker or monitor
pilot tone (for the adaptive system)
pilot tone (for the adaptive system)
Figure 5.15: Transmission of two low-bandwidth, analog signals (audio, video)over the 2× 2 MGDM system.
Demultiplexer (zero-forcing algorithm)
Fiberconcentrator
DVD player
Monitor
Loudspeaker
PDIC
Figure 5.16: Photograph of the 2× 2 MGDM system in the laboratory.
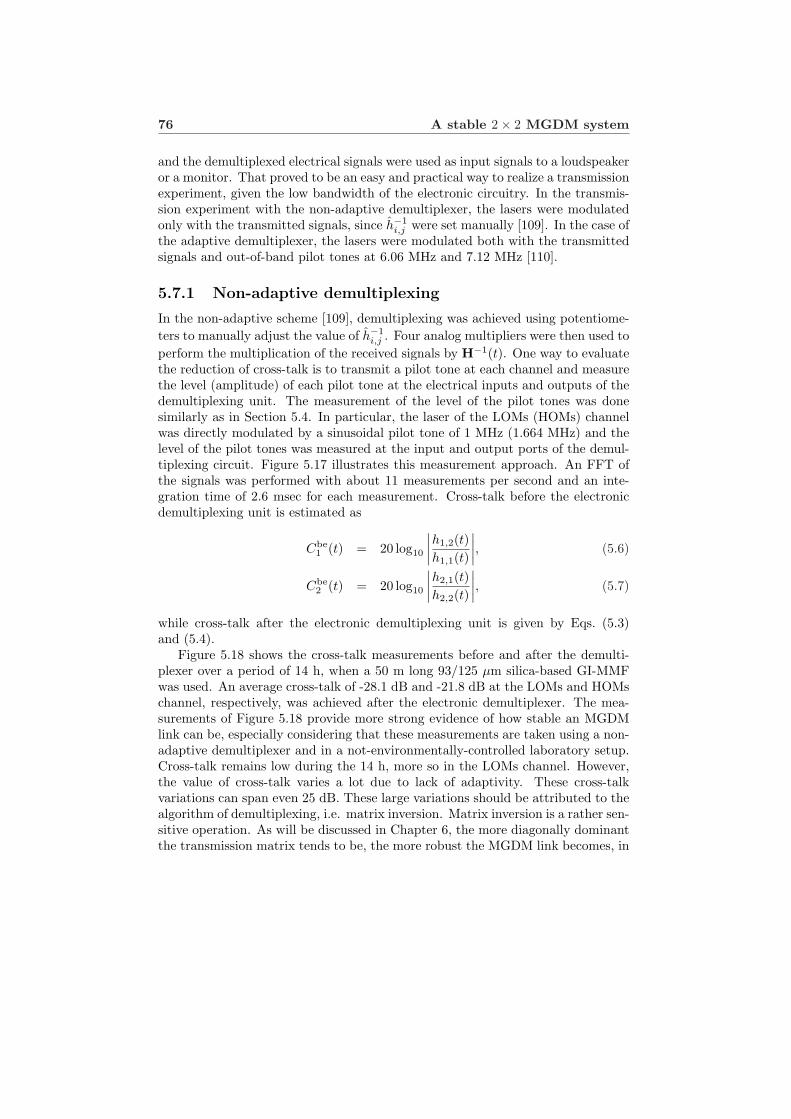
76 A stable 2× 2 MGDM system
and the demultiplexed electrical signals were used as input signals to a loudspeakeror a monitor. That proved to be an easy and practical way to realize a transmissionexperiment, given the low bandwidth of the electronic circuitry. In the transmis-sion experiment with the non-adaptive demultiplexer, the lasers were modulatedonly with the transmitted signals, since h−1
i,j were set manually [109]. In the case ofthe adaptive demultiplexer, the lasers were modulated both with the transmittedsignals and out-of-band pilot tones at 6.06 MHz and 7.12 MHz [110].
5.7.1 Non-adaptive demultiplexing
In the non-adaptive scheme [109], demultiplexing was achieved using potentiome-ters to manually adjust the value of h−1
i,j . Four analog multipliers were then used toperform the multiplication of the received signals by H−1(t). One way to evaluatethe reduction of cross-talk is to transmit a pilot tone at each channel and measurethe level (amplitude) of each pilot tone at the electrical inputs and outputs of thedemultiplexing unit. The measurement of the level of the pilot tones was donesimilarly as in Section 5.4. In particular, the laser of the LOMs (HOMs) channelwas directly modulated by a sinusoidal pilot tone of 1 MHz (1.664 MHz) and thelevel of the pilot tones was measured at the input and output ports of the demul-tiplexing circuit. Figure 5.17 illustrates this measurement approach. An FFT ofthe signals was performed with about 11 measurements per second and an inte-gration time of 2.6 msec for each measurement. Cross-talk before the electronicdemultiplexing unit is estimated as
Cbe1 (t) = 20 log10
∣∣∣∣h1,2(t)h1,1(t)
∣∣∣∣, (5.6)
Cbe2 (t) = 20 log10
∣∣∣∣h2,1(t)h2,2(t)
∣∣∣∣, (5.7)
while cross-talk after the electronic demultiplexing unit is given by Eqs. (5.3)and (5.4).
Figure 5.18 shows the cross-talk measurements before and after the demulti-plexer over a period of 14 h, when a 50 m long 93/125 µm silica-based GI-MMFwas used. An average cross-talk of -28.1 dB and -21.8 dB at the LOMs and HOMschannel, respectively, was achieved after the electronic demultiplexer. The mea-surements of Figure 5.18 provide more strong evidence of how stable an MGDMlink can be, especially considering that these measurements are taken using a non-adaptive demultiplexer and in a not-environmentally-controlled laboratory setup.Cross-talk remains low during the 14 h, more so in the LOMs channel. However,the value of cross-talk varies a lot due to lack of adaptivity. These cross-talkvariations can span even 25 dB. These large variations should be attributed to thealgorithm of demultiplexing, i.e. matrix inversion. Matrix inversion is a rather sen-sitive operation. As will be discussed in Chapter 6, the more diagonally dominantthe transmission matrix tends to be, the more robust the MGDM link becomes, in
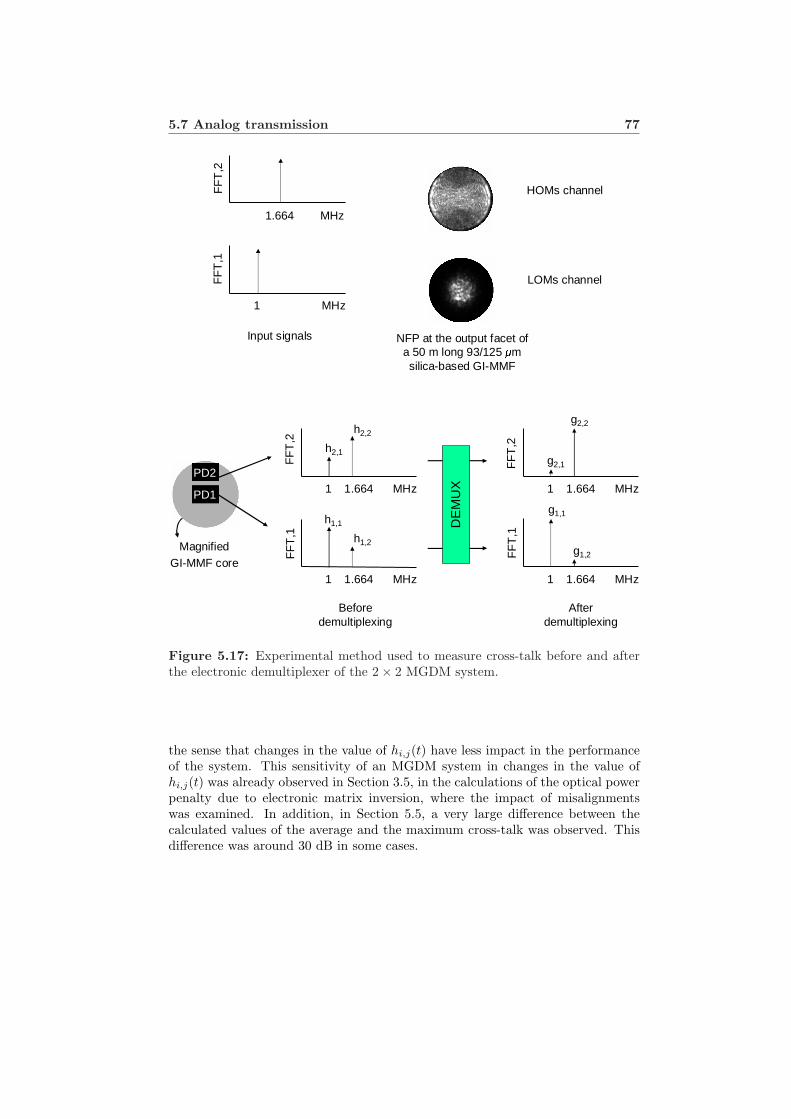
5.7 Analog transmission 77
g1,1
NFP at the output facet of a 50 m long 93/125 µm silica-based GI-MMF
PD1
PD2
Magnified GI-MMF core
PD1
PD2
PD1
PD2
h1,2
FF
T,1
1 1.664 MHz
h1,1
h2,1
h2,2
FF
T,2
1 1.664 MHz
FF
T,1
1 MHz
FF
T,2
1.664 MHz
FF
T,1
1 1.664 MHz
g1,2
g2,1
g2,2
FF
T,2
1 1.664 MHz
DE
MU
X
Input signals
Before demultiplexing
After demultiplexing
HOMs channel
LOMs channel
Figure 5.17: Experimental method used to measure cross-talk before and afterthe electronic demultiplexer of the 2× 2 MGDM system.
the sense that changes in the value of hi,j(t) have less impact in the performanceof the system. This sensitivity of an MGDM system in changes in the value ofhi,j(t) was already observed in Section 3.5, in the calculations of the optical powerpenalty due to electronic matrix inversion, where the impact of misalignmentswas examined. In addition, in Section 5.5, a very large difference between thecalculated values of the average and the maximum cross-talk was observed. Thisdifference was around 30 dB in some cases.
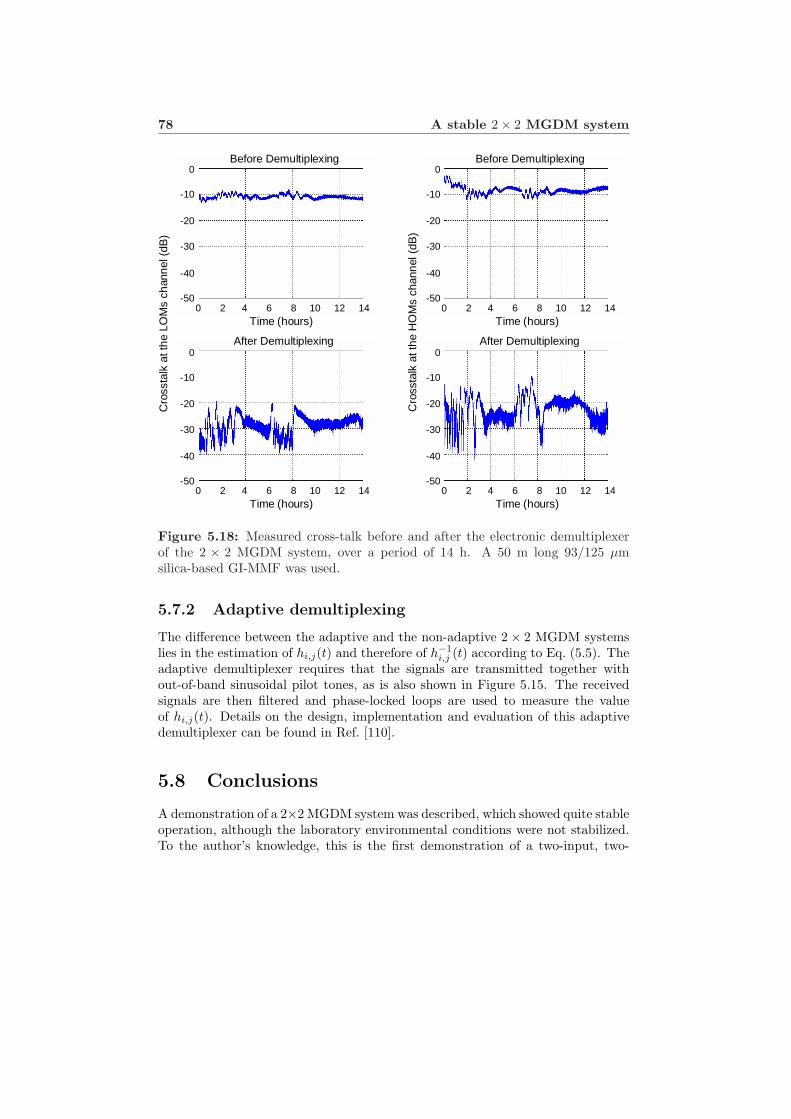
78 A stable 2× 2 MGDM system
Cro
ssta
lk a
t the
LO
Ms
chan
nel (
dB)
Time (hours)0 2 4 6 8 10 12 14
0
-10
-20
-30
-40
-50
Time (hours)0 2 4 6 8 10 12 14
Before Demultiplexing
After Demultiplexing
Cro
ssta
lk a
t the
HO
Ms
chan
nel (
dB)
Time (hours)0 2 4 6 8 10 12 14
0
-10
-20
-30
-40
-50
Time (hours)0 2 4 6 8 10 12 14
0
-10
-20
-30
-40
-50
Before Demultiplexing
After Demultiplexing0
-10
-20
-30
-40
-50
Figure 5.18: Measured cross-talk before and after the electronic demultiplexerof the 2 × 2 MGDM system, over a period of 14 h. A 50 m long 93/125 µmsilica-based GI-MMF was used.
5.7.2 Adaptive demultiplexing
The difference between the adaptive and the non-adaptive 2× 2 MGDM systemslies in the estimation of hi,j(t) and therefore of h−1
i,j (t) according to Eq. (5.5). Theadaptive demultiplexer requires that the signals are transmitted together without-of-band sinusoidal pilot tones, as is also shown in Figure 5.15. The receivedsignals are then filtered and phase-locked loops are used to measure the valueof hi,j(t). Details on the design, implementation and evaluation of this adaptivedemultiplexer can be found in Ref. [110].
5.8 Conclusions
A demonstration of a 2×2 MGDM system was described, which showed quite stableoperation, although the laboratory environmental conditions were not stabilized.To the author’s knowledge, this is the first demonstration of a two-input, two-
5.8 Conclusions 79
output, transparent MGDM system.Components originally made for other applications were used to build a 2× 2
MGDM link, in a way that approximates the design guidelines of Chapter 3. Thetransmission matrix of this link was measured over a 12.7 h period, when a 10 mlong 185/250 µm and a 2 km long 148/200 µm silica-based GI-MMF was used.In both cases, the links were shown to be stable. The stability of the links wasevaluated in terms of cross-talk calculations as a function of the period of esti-mation of the transmission matrix, assuming electronic demultiplexing based onmatrix inversion. The use of MGDM-specific connectorized components, as wellas a feedback control loop at each transmitter to maintain the average emittedoptical power constant can further increase the stability of an MGDM link. Fur-thermore, some simple measurements were performed to examine the linearity andsignal distortion in the 2× 2 MGDM link.
This stable 2×2 link was integrated with a non-adaptive as well as an adaptiveanalog electronic demultiplexer. These electronic circuits implement the demulti-plexing of the channels based on matrix inversion and have a bandwidth of about6 MHz. Both demultiplexing circuits were designed and implemented by the Sig-nal Processing Systems group of the Eindhoven University of Technology. Thetransmission of two low-bandwidth analog signals (video and/or audio) was testedwith both electronic demultiplexers. Cross-talk measurements over a 14 h periodbefore and after the non-adaptive demultiplexer provided strong evidence of thestability of this 2 × 2 MGDM system. A 50 m long 93/125 µm silica-based GI-MMF was used in these measurements. The average cross-talk, during the 14 hperiod, after the demultiplexer was estimated to be -28.1 dB and -21.8 dB at theLOMs and HOMs channels, respectively.

Chapter 6
Mode-selective spatialfiltering
Mode-selective spatial filtering (MSSF) is introduced and demonstrated. MGDMhas initially been approached using electronic mitigation of cross-talk. The elec-tronic mitigation is based on matrix inversion. MSSF is an optical method that re-duces cross-talk among the channels. MSSF is achieved by projecting the near-fieldpattern at the GI-MMF output end onto the detectors via an imaging system witha lower numerical aperture (NA) than the central NA of the GI-MMF. The powerpenalty due to the electronic demultiplexing is then decreased and the robustnessof the link is increased, although some of the optical power is lost. MSSF allowsfor a larger number of channels. With MSSF it would be possible to eliminatethe need for electronic demultiplexing. This facilitates the combination of MGDMwith wavelength division multiplexing, using a single laser source for each wave-length, together with an optical splitter and an external modulator at each MGDMchannel. MSSF is a new optical technique, first proposed in the framework of theresearch presented in this dissertation.
6.1 Introduction
In Chapter 3, a method of designing an MGDM system was proposed. This methodexploits the fact that an MGDM system requires no orthogonality of the receivedsignals in the optical intensity domain. That led to a simple design approach,which can be used as long as the linearity of the link with the optical intensity hasbeen properly addressed as an engineering task. This approach is based on theprinciple that for a MIMO system, cross-talk is not viewed as an impairment as itis in other systems, but rather that it bears useful information. Matrix inversion
Parts of this chapter are published in Ref. [1,6] of Appendix B.
82 Mode-selective spatial filtering
is a zero-forcing method that uses the spatial information to cancel cross-talkregardless of the performance of the system in relation to noise [49]. In MGDMtransmission, matrix inversion allows for transparency to the signal format.
Several factors may limit the performance of an MGDM transmission systembased on the approach of Chapter 3. These transmission impairments are discussedin the following section. It becomes evident that an optical technique of reducingcross-talk can mitigate — partially or fully — these impairments. Subsequently,mode-selective spatial filtering (MSSF) is introduced and demonstrated as such atechnique.
6.2 Transmission impairments in MGDM systems
As explained in Chapter 2, an MGDM system which is not dispersion-limited isdescribed by a real-valued transmission matrix H. In general, this requires thateach channel uses a different laser source so that the fields of the detected modegroups are mutually incoherent and optical beating averages to zero. For a smallnumber of channels and moderate transmission bandwidth, optical beating shouldpose no problem. However, if the use of MGDM is to be extended to applicationswhere maximization of the aggregate bandwidth is of major concern, optical beat-ing may limit the system performance. In Ref. [61], where dispersive multiplexingis proposed, it is suggested that to avoid this problem, the wavelengths of thelasers should not exactly overlap so that any beating term falls outside the trans-mission bandwidth of the system. Such a system still employs a detector whichis wavelength-blind and therefore cost advantages related to the lack of opticalfiltering are maintained. However, if the MGDM technique is to be combined withwavelength division multiplexing (WDM), the use of a single laser source for eachwavelength-channel and external modulation at each MGDM channel would bedesired. In that case, optical beating can pose a limitation.
Assuming that an MGDM system is adequately characterized by a real-valuedtransmission matrix, the demultiplexing of the transmitted signals is based onelectronic matrix inversion. This induces a power penalty, as was explained inChapter 2. Analysis of an MGDM system using the design approach of Chapter 3showed that as the number of channels increases, this penalty grows significantlyand furthermore, the system becomes less robust to changes in the value of thetransmission matrix elements. The robustness of the system depends on the con-dition number of H, denoted as κ(H). This number is defined as [71–73]
κ(H) = ‖H‖‖H−1‖, (6.1)
where ‖ · ‖ denotes a matrix norm [71–73]. The most usual matrix norms are thep-norms and the Frobenius norm [72, 73]. The above definition depends on thespecific choice of the norm, but in general, κ(H) ≥ 1 and when H is singularκ(H) = +∞. The smaller the value of κ(H) is, the better-conditioned the linearproblem that describes an MGDM system is and therefore the more robust the
6.3 MSSF principle 83
solution of the system is to changes in the value of the elements hi,j . For example,the Frobenius norm of H is
‖H‖F =√∑
i
∑
j
|hi,j |2. (6.2)
For the N × N MGDM systems described in Table 3.1 of Chapter 3, in whichthe whole near-field pattern (NFP) on the GI-MMF output facet is detected, thecondition number of H using the Frobenius norm is κF (H) = 2.22, 4.15, 6.74 and10.46, for N = 2, 3, 4 and 5, respectively. As a point of reference, the N × Nidentity matrix IN×N has κF (IN×N ) = N .
Summarizing, the following factors can limit MGDM transmission:
• The need for mutual incoherence among the fields of the detected modegroups can limit the transmission bandwidth and complicates the combina-tion of MGDM with WDM.
• The electronic matrix inversion yields a power penalty to maintain the SNRof the single channel case.
• The robustness of an MGDM system to changes in the value of hi,j dependson the condition number of H.
The above factors limit the bandwidth of the system, the number of channelsand pose some restrictions in the spectral content of the optical sources. If theseissues are not properly addressed by the system designer, they can cause serioustransmission impairments.
These limitations and the transmission impairments that they can cause canbe overcome by reducing the spatial overlap among the intensity profiles of thedetected mode groups. Indeed, the ideal case is H = IN×N . MSSF is a newtechnique that can be used to optically reduce cross-talk among the channels.Therefore it is of great significance in extending MGDM transmission to moredemanding applications.
6.3 MSSF principle
Figure 6.1 illustrates the MSSF principle. Two propagating rays exit the GI-MMF output facet from points with similar distance from the GI-MMF axis [Fig-ure 6.1(b)]. However, their angular divergence θ1 and θ2 from the GI-MMF axisis significantly different. If the MGDM multi-segment detector [Figure 6.1(a)] re-sponds directly to the NFP, as was considered in Chapter 3, then both rays wouldbe detected by the same segment R2. Let us assume that a lens projects theNFP onto the MGDM detector. Let the numerical aperture of the lens at theside of the GI-MMF output end (NAlens) correspond to an angle θlens such thatθ1 ≤ θlens < θ2. Only ray 1 is then gathered by the lens and subsequently detected
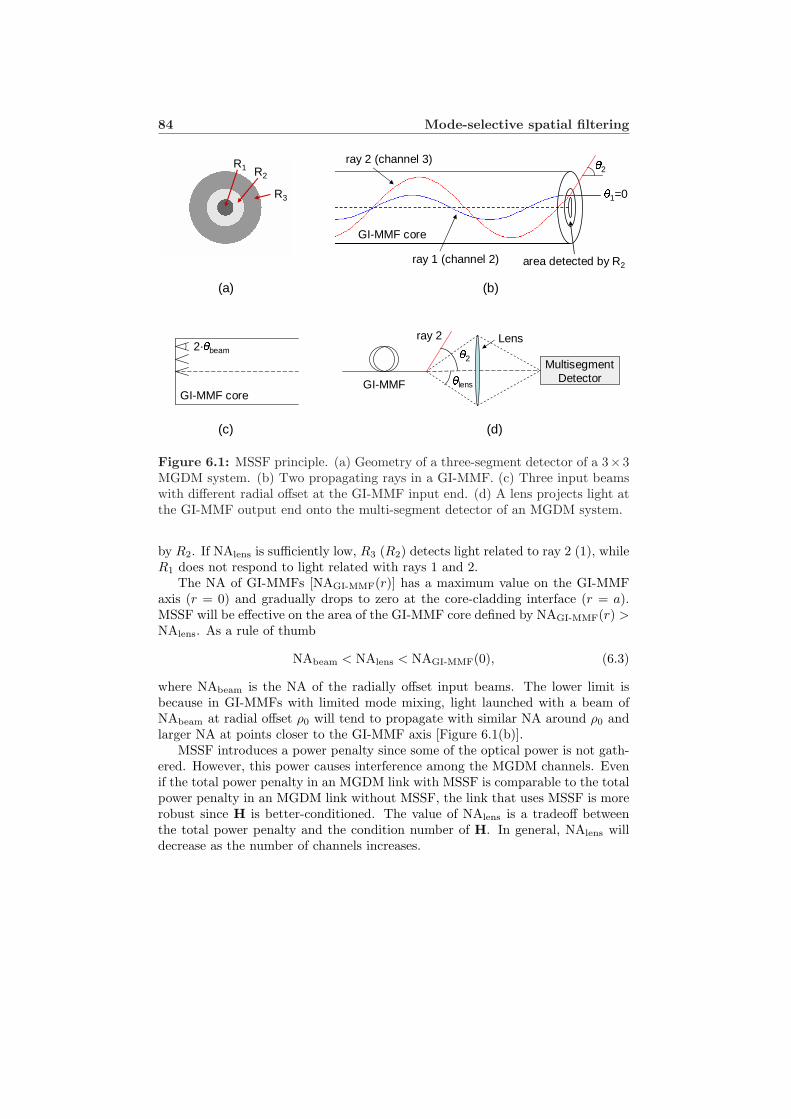
84 Mode-selective spatial filtering
2·θbeam
GI-MMF core
(c)
GI-MMF θlens
(d)
Lens
MultisegmentDetector
R3
R2R1
(a)
θ2θ1=0
(b)
area detected by R2
GI-MMF core
ray 2 (channel 3)
ray 1 (channel 2)θ2
ray 2
Figure 6.1: MSSF principle. (a) Geometry of a three-segment detector of a 3×3MGDM system. (b) Two propagating rays in a GI-MMF. (c) Three input beamswith different radial offset at the GI-MMF input end. (d) A lens projects light atthe GI-MMF output end onto the multi-segment detector of an MGDM system.
by R2. If NAlens is sufficiently low, R3 (R2) detects light related to ray 2 (1), whileR1 does not respond to light related with rays 1 and 2.
The NA of GI-MMFs [NAGI-MMF(r)] has a maximum value on the GI-MMFaxis (r = 0) and gradually drops to zero at the core-cladding interface (r = a).MSSF will be effective on the area of the GI-MMF core defined by NAGI-MMF(r) >NAlens. As a rule of thumb
NAbeam < NAlens < NAGI-MMF(0), (6.3)
where NAbeam is the NA of the radially offset input beams. The lower limit isbecause in GI-MMFs with limited mode mixing, light launched with a beam ofNAbeam at radial offset ρ0 will tend to propagate with similar NA around ρ0 andlarger NA at points closer to the GI-MMF axis [Figure 6.1(b)].
MSSF introduces a power penalty since some of the optical power is not gath-ered. However, this power causes interference among the MGDM channels. Evenif the total power penalty in an MGDM link with MSSF is comparable to the totalpower penalty in an MGDM link without MSSF, the link that uses MSSF is morerobust since H is better-conditioned. The value of NAlens is a tradeoff betweenthe total power penalty and the condition number of H. In general, NAlens willdecrease as the number of channels increases.
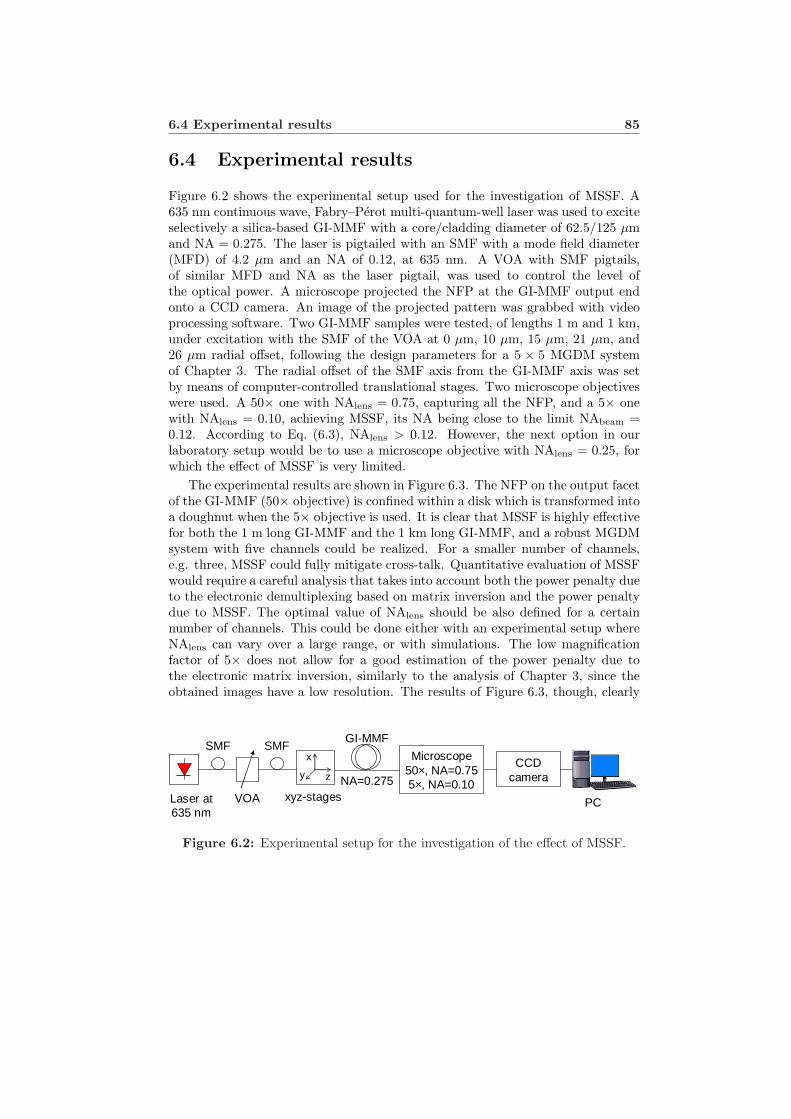
6.4 Experimental results 85
6.4 Experimental results
Figure 6.2 shows the experimental setup used for the investigation of MSSF. A635 nm continuous wave, Fabry–Perot multi-quantum-well laser was used to exciteselectively a silica-based GI-MMF with a core/cladding diameter of 62.5/125 µmand NA = 0.275. The laser is pigtailed with an SMF with a mode field diameter(MFD) of 4.2 µm and an NA of 0.12, at 635 nm. A VOA with SMF pigtails,of similar MFD and NA as the laser pigtail, was used to control the level ofthe optical power. A microscope projected the NFP at the GI-MMF output endonto a CCD camera. An image of the projected pattern was grabbed with videoprocessing software. Two GI-MMF samples were tested, of lengths 1 m and 1 km,under excitation with the SMF of the VOA at 0 µm, 10 µm, 15 µm, 21 µm, and26 µm radial offset, following the design parameters for a 5 × 5 MGDM systemof Chapter 3. The radial offset of the SMF axis from the GI-MMF axis was setby means of computer-controlled translational stages. Two microscope objectiveswere used. A 50× one with NAlens = 0.75, capturing all the NFP, and a 5× onewith NAlens = 0.10, achieving MSSF, its NA being close to the limit NAbeam =0.12. According to Eq. (6.3), NAlens > 0.12. However, the next option in ourlaboratory setup would be to use a microscope objective with NAlens = 0.25, forwhich the effect of MSSF is very limited.
The experimental results are shown in Figure 6.3. The NFP on the output facetof the GI-MMF (50× objective) is confined within a disk which is transformed intoa doughnut when the 5× objective is used. It is clear that MSSF is highly effectivefor both the 1 m long GI-MMF and the 1 km long GI-MMF, and a robust MGDMsystem with five channels could be realized. For a smaller number of channels,e.g. three, MSSF could fully mitigate cross-talk. Quantitative evaluation of MSSFwould require a careful analysis that takes into account both the power penalty dueto the electronic demultiplexing based on matrix inversion and the power penaltydue to MSSF. The optimal value of NAlens should be also defined for a certainnumber of channels. This could be done either with an experimental setup whereNAlens can vary over a large range, or with simulations. The low magnificationfactor of 5× does not allow for a good estimation of the power penalty due tothe electronic matrix inversion, similarly to the analysis of Chapter 3, since theobtained images have a low resolution. The results of Figure 6.3, though, clearly
GI-MMF
NA=0.275
Microscope50×, NA=0.755×, NA=0.10
CCD camera
PCLaser at 635 nm
VOA
SMFSMF
xyz-stages
x
y z
Figure 6.2: Experimental setup for the investigation of the effect of MSSF.
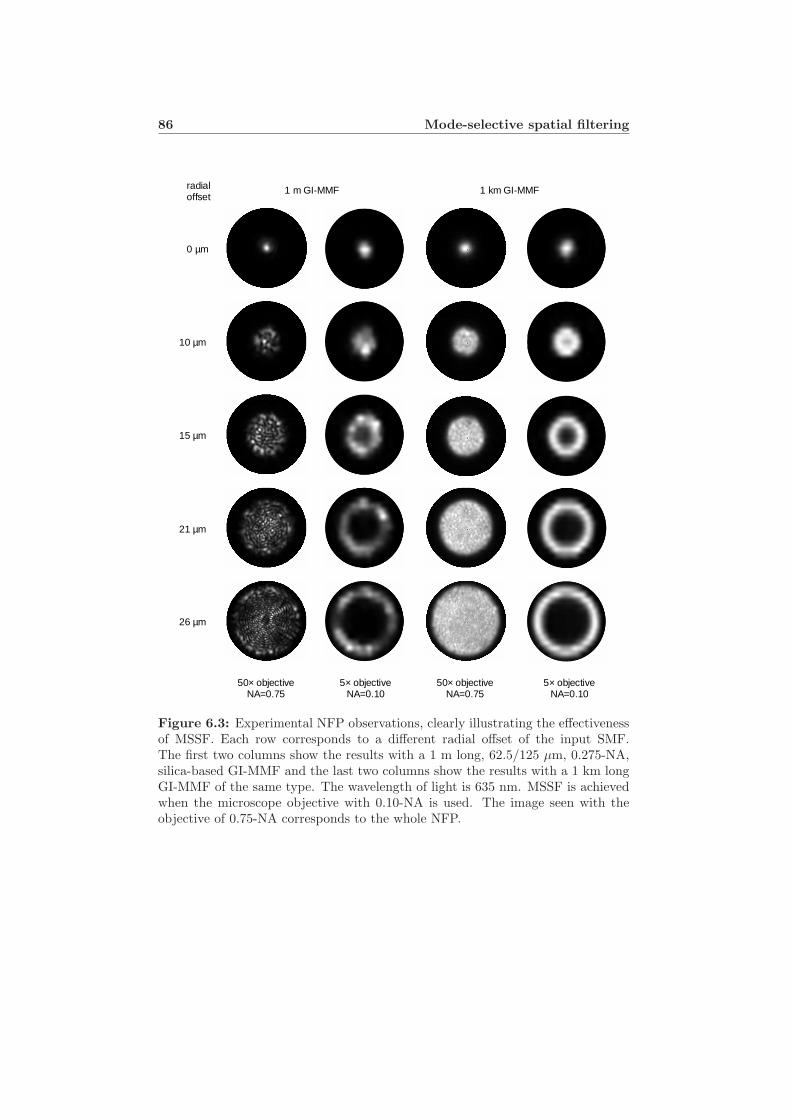
86 Mode-selective spatial filtering
5× objectiveNA=0.10
50× objectiveNA=0.75
50× objectiveNA=0.75
5× objectiveNA=0.10
0 µm
10 µm
26 µm
21 µm
15 µm
1 m GI-MMF 1 km GI-MMFradialoffset
Figure 6.3: Experimental NFP observations, clearly illustrating the effectivenessof MSSF. Each row corresponds to a different radial offset of the input SMF.The first two columns show the results with a 1 m long, 62.5/125 µm, 0.275-NA,silica-based GI-MMF and the last two columns show the results with a 1 km longGI-MMF of the same type. The wavelength of light is 635 nm. MSSF is achievedwhen the microscope objective with 0.10-NA is used. The image seen with theobjective of 0.75-NA corresponds to the whole NFP.
6.5 A 2× 2 MGDM link with MSSF 87
show the effectiveness and great potential of MSSF.A coarse estimation of the optical power loss due to MSSF, in the case of a
5 × 5 MGDM system that could be realized based on the experimental resultsof Figure 6.3, can be done by comparing the area of the disk-like surface of thewhole NFP to the area of the doughnut-like surface of the corresponding patternwhen MSSF is applied. In particular, from Figure 6.3, for 26 µm radial offset atthe input SMF, the doughnut-like area where light is distributed when MSSF isapplied appears to be approximately twice smaller than the disk-like area of thewhole NFP. This means that the loss due to MSSF is approximately 3 dB. Forthe other input beams, loss is smaller, while for central excitation it would appearthat there is no loss due to MSSF. Certainly, though, this approach underestimatesthe loss due to MSSF. For example, since NAlens = 0.10 < 0.12 = NAbeam, forcentral excitation there is some power loss. However, this coarse estimation showsthat the loss due to MSSF is much lower than the power penalty due to matrixinversion in an MGDM system without MSSF. In Chapter 3, in Table 3.1, for a5 × 5 MGDM system, the maximum optical power penalty at the shot (thermal)noise limit is 13.3 dB (6.3 dB).
6.5 A 2× 2 MGDM link with MSSF
In Chapter 5, a stable 2 × 2 MGDM link was demonstrated. In this section, theeffect of MSSF is incorporated in the same experimental setup and the stabilityof the link is again investigated. The setup used in Chapter 5 included a lensto project the NFP on the output facet of the GI-MMF onto the photodiodeintegrated circuit (PDIC), as can be seen in Figure 5.1. This lens was used with thepurpose of magnifying the NFP by a factor m ≈ 2, so that two PDIC photodiodescould be used [Figure 5.4(c)]. In this section, the parameter NAlens is also exploitedto achieve MSSF.
Figure 6.4 shows the experimental setup. Figures 6.4(a) and 6.4(c) show thetransmitting side and receiving side of the 2×2 MGDM link, respectively. Furtherexplanation of this setup can be found in Chapter 5. Two thick core silica-basedGI-MMFs were used, as in Chapter 5, namely a 10 m long 185/250 µm one and a2 km long 148/200 µm one. The NA of these GI-MMFs is 0.22. Two mode groupswere excited simultaneously using two subsequent ports of the fiber concentrator(FC). In particular, a lower order modes (LOMs) group and a higher order modes(HOMs) group were excited with light launched at 0 µm and 30 µm radial offset onthe input facet of the GI-MMFs, respectively. The NFPs at the output end of theGI-MMFs were observed with a CCD camera through a microscope [Figure 6.4(b)].Similarly to the results of the previous section, the disk-like NFP of the HOMsgroup turns into a doughnut-like image when the NA of the microscope objectiveis sufficiently low. The results are shown in Figure 6.5. In particular, whenNAlens = 0.10, two MGDM channels are implemented with a very high degree ofspatial complementarity in the optical intensity domain.
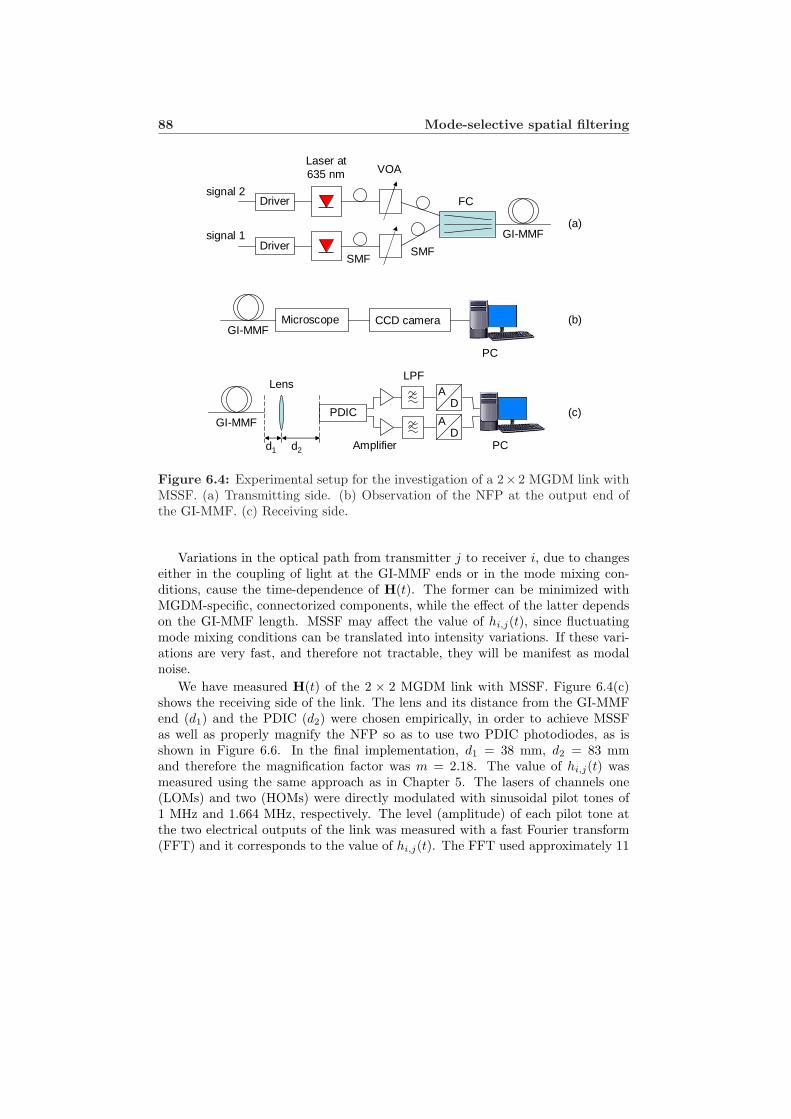
88 Mode-selective spatial filtering
FC
SMF
VOALaser at 635 nm
Driver
Driversignal 2
signal 1
SMF
GI-MMF
PDIC
d1 d2
Lens
PC
LPF
Amplifier
AD
AD
GI-MMF
GI-MMFMicroscope CCD camera
PC
(c)
(b)
(a)
Figure 6.4: Experimental setup for the investigation of a 2× 2 MGDM link withMSSF. (a) Transmitting side. (b) Observation of the NFP at the output end ofthe GI-MMF. (c) Receiving side.
Variations in the optical path from transmitter j to receiver i, due to changeseither in the coupling of light at the GI-MMF ends or in the mode mixing con-ditions, cause the time-dependence of H(t). The former can be minimized withMGDM-specific, connectorized components, while the effect of the latter dependson the GI-MMF length. MSSF may affect the value of hi,j(t), since fluctuatingmode mixing conditions can be translated into intensity variations. If these vari-ations are very fast, and therefore not tractable, they will be manifest as modalnoise.
We have measured H(t) of the 2 × 2 MGDM link with MSSF. Figure 6.4(c)shows the receiving side of the link. The lens and its distance from the GI-MMFend (d1) and the PDIC (d2) were chosen empirically, in order to achieve MSSFas well as properly magnify the NFP so as to use two PDIC photodiodes, as isshown in Figure 6.6. In the final implementation, d1 = 38 mm, d2 = 83 mmand therefore the magnification factor was m = 2.18. The value of hi,j(t) wasmeasured using the same approach as in Chapter 5. The lasers of channels one(LOMs) and two (HOMs) were directly modulated with sinusoidal pilot tones of1 MHz and 1.664 MHz, respectively. The level (amplitude) of each pilot tone atthe two electrical outputs of the link was measured with a fast Fourier transform(FFT) and it corresponds to the value of hi,j(t). The FFT used approximately 11
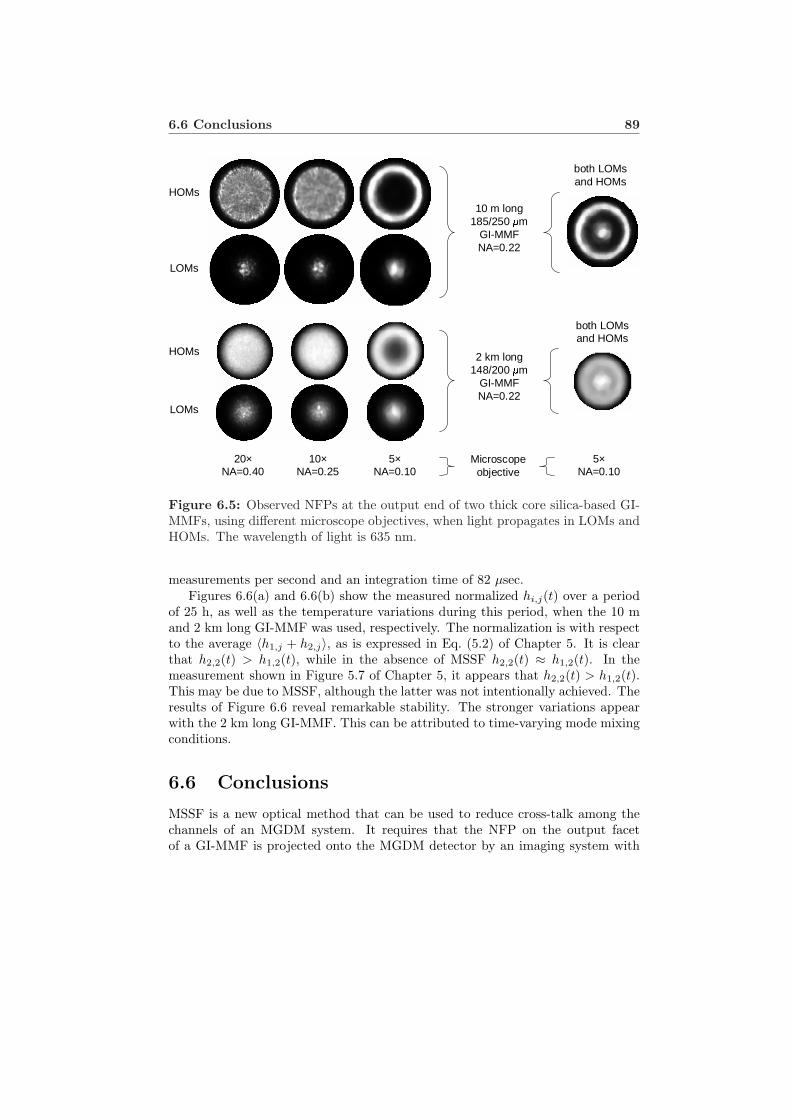
6.6 Conclusions 89
HOMs
LOMs
HOMs
LOMs
10 m long 185/250 µm
GI-MMFNA=0.22
2 km long 148/200 µm
GI-MMFNA=0.22
20×NA=0.40
10×NA=0.25
5×NA=0.10
Microscope objective
5×NA=0.10
both LOMsand HOMs
both LOMsand HOMs
Figure 6.5: Observed NFPs at the output end of two thick core silica-based GI-MMFs, using different microscope objectives, when light propagates in LOMs andHOMs. The wavelength of light is 635 nm.
measurements per second and an integration time of 82 µsec.Figures 6.6(a) and 6.6(b) show the measured normalized hi,j(t) over a period
of 25 h, as well as the temperature variations during this period, when the 10 mand 2 km long GI-MMF was used, respectively. The normalization is with respectto the average 〈h1,j + h2,j〉, as is expressed in Eq. (5.2) of Chapter 5. It is clearthat h2,2(t) > h1,2(t), while in the absence of MSSF h2,2(t) ≈ h1,2(t). In themeasurement shown in Figure 5.7 of Chapter 5, it appears that h2,2(t) > h1,2(t).This may be due to MSSF, although the latter was not intentionally achieved. Theresults of Figure 6.6 reveal remarkable stability. The stronger variations appearwith the 2 km long GI-MMF. This can be attributed to time-varying mode mixingconditions.
6.6 Conclusions
MSSF is a new optical method that can be used to reduce cross-talk among thechannels of an MGDM system. It requires that the NFP on the output facetof a GI-MMF is projected onto the MGDM detector by an imaging system with
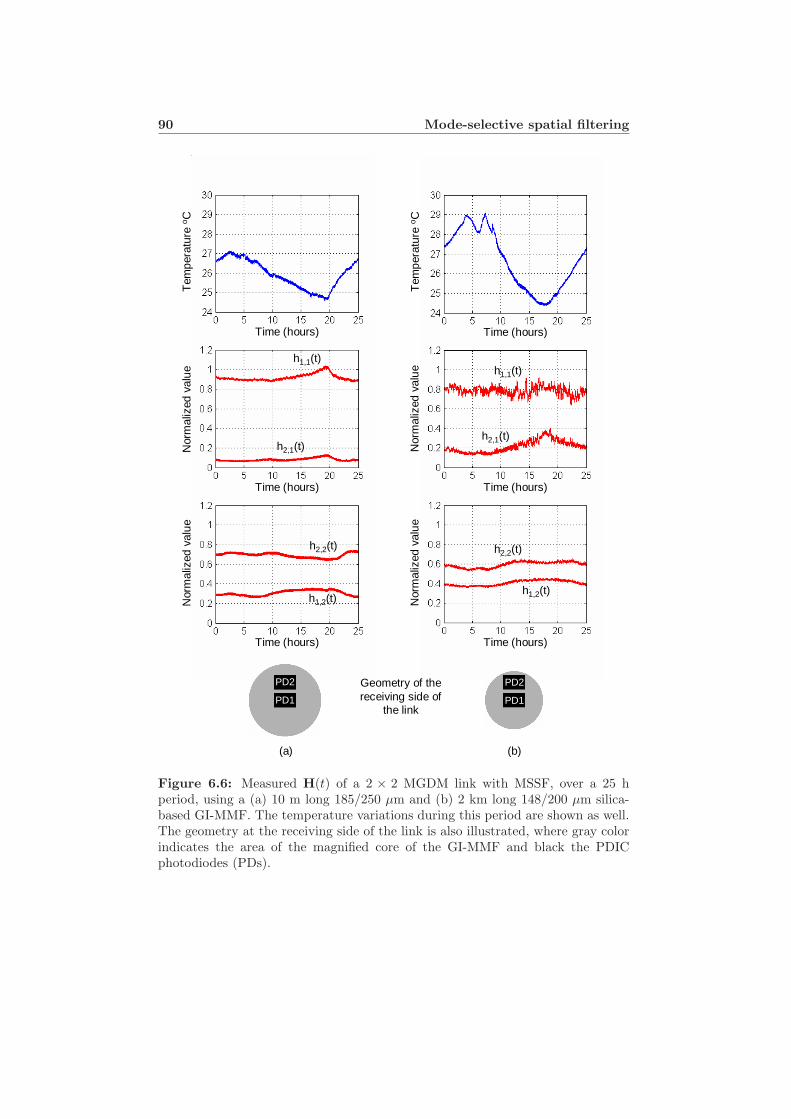
90 Mode-selective spatial filtering
PD1
PD2
PD1
PD2Geometry of the receiving side of
the link
(a) (b)
Tem
pera
ture
oC
Tem
pera
ture
oC
Nor
mal
ized
val
ue
Nor
mal
ized
val
ue
Nor
mal
ized
val
ue
Nor
mal
ized
val
ue
Time (hours) Time (hours)
Time (hours) Time (hours)
Time (hours) Time (hours)
h1,1(t)
h2,1(t)
h1,1(t)
h2,1(t)
h2,2(t)
h1,2(t)
h2,2(t)
h1,2(t)
Figure 6.6: Measured H(t) of a 2 × 2 MGDM link with MSSF, over a 25 hperiod, using a (a) 10 m long 185/250 µm and (b) 2 km long 148/200 µm silica-based GI-MMF. The temperature variations during this period are shown as well.The geometry at the receiving side of the link is also illustrated, where gray colorindicates the area of the magnified core of the GI-MMF and black the PDICphotodiodes (PDs).
6.6 Conclusions 91
a lower NA than the central NA of the GI-MMF. Such an imaging system canbe a single lens. Selective excitation of GI-MMFs with an SMF yields an NFPwhich is confined within a disk. This disk-like pattern turns into a doughnut-likepattern when MSSF is applied, therefore reducing cross-talk. This means thatsome of the optical power does not reach the MGDM detector. However, despitethis loss, this optical mitigation of cross-talk offers very significant advantages.In particular, it reduces the power penalty due to the electronic demultiplexingbased on matrix inversion, increases the robustness of the system to changes inthe value of hi,j(t) and relaxes the requirement of mutual incoherence amongthe fields of the detected mode groups. Consequently, the system admits morechannels. For a small number of channels, e.g. three, over standard 62.5/125 µmsilica-based GI-MMF, MSSF can eliminate the need for electronic demultiplexing.This greatly facilitates the combination of MGDM with WDM using a single lasersource for each wavelength. MSSF was shown to be very effective for a five-channelsystem with standard 62.5/125 µm silica-based GI-MMF. Furthermore, the 2× 2system that was demonstrated in Chapter 5 was expanded to include MSSF. Thetransmission matrix of this 2 × 2 link with MSSF was measured over a period of25 h and it was shown to be remarkably stable. All these features make MSSF avery reliable and promising technique.

Chapter 7
MGDM in GI-POF links
Polymer-based GI-MMF or GI polymer optical fiber (POF) is considered a verysuitable medium for in-building and in-house optical networks. This is due to theflexibility of GI-POF that facilitates installation in ducts. Especially polymethyl-methacrylate (PMMA)-based GI-POF has typically a large core diameter and highnumerical aperture that allow for easy coupling of light and handling. The possibil-ity of using MGDM transmission in GI-POF, mainly PMMA-based one, systemsis investigated. The basic ideas are found to apply. However, mode mixing poses astrong restriction. Furthermore, although the flexibility of the PMMA material isan advantage concerning installation, it could cause deformations of the refractiveindex profile that can seriously affect the near-field pattern at the output end of theGI-POF. This influences the transmission matrix of an MGDM system and henceits performance.
7.1 Introduction
GI-MMFs can be silica- and/or polymer-based, as has been mentioned in Chap-ter 1. However, in the investigation presented in the preceding chapters, onlysilica-based GI-MMFs were considered and used. This was mainly due to thefollowing reasons:
1. Mode mixing is very limited in silica-based GI-MMFs. In MGDM transmis-sion, mode mixing is a restricting factor. Studying MGDM over silica-basedGI-MMFs allows the investigation of the technique under almost ideal con-ditions from the mode mixing point of view.
2. Silica-based GI-MMFs are commonly used in short reach optical networksand connections. Therefore any results obtained with such fibers can bedirectly evaluated in terms of application in existing systems.
Parts of this chapter are published in Ref. [11] of Appendix B.
94 MGDM in GI-POF links
3. Previous modal multiplexing techniques have been studied using silica-basedGI-MMFs. Hence, the results obtained for MGDM can be compared withthe previous approaches.
In the present chapter, considerations for the use of graded-index polymeroptical fibers (GI-POFs) are given. GI-POFs differ from silica-based GI-MMFs,or alternatively GI glass optical fibers (GI-GOFs), in the material and thereforeabsorption and scattering of light are not the same in the two GI-MMF types.This means that attenuation and mode mixing are different. As far as MGDMtransmission is concerned, the MGDM model presented in Chapter 2 stands forboth GOFs and POFs. Therefore, the issue to be investigated is what the near-fieldpattern (NFP) at the output end of GI-POFs under selective excitation looks. Inthe following sections, characteristics of GI-POFs and relevant literature results areexplored. Polymethylmethacrylate (PMMA)-based GI-POF is suggested to be asuitable option for MGDM transmission, especially in the context of a transparentin-house network, and some experimental results are presented for this type ofGI-POF.
7.2 PMMA- and PF-based GI-POFs
POFs are most commonly based on the PMMA material. The use of step-index(SI) POFs is more widespread than that of GI-POFs, the latter being developedto meet the needs of high speed, short range optical connections. A lot of workhas been carried out on the control and optimization of the refractive index profileof PMMA-based GI-POFs [23, 111–113]. The core diameter of a PMMA-basedGI-POF is around 500 µm, although there are no standards as there are in thecase of SI-POFs with a core/cladding diameter of 980/1000 µm. Mode mixing inPMMA-based GI-POFs is much stronger compared to silica-based GI-MMFs. Inseveral experiments, the NFP at the output end of PMMA-based GI-POFs un-der selective excitation has been observed [67, 113, 114]. In those studies, selectiveexcitation was achieved using a silica-based SMF at visible light. The reportedNFPs strongly depend on the excitation conditions, even after 100 m of propa-gation, which indicates that the optical power is not equally spread among themodes. Therefore, there seems to be room for MGDM transmission over shortPMMA-based GI-POF links. This is especially interesting taking into accountthat the attenuation spectrum of this fiber does not allow for extensive use ofwavelength division multiplexing (WDM) [24].
GI-POF based on perfluorinated (PF) polymer has more recently emerged asa low loss, high bandwidth transmission medium [115, 116]. PF polymer is amore expensive material than PMMA. As is the case for PMMA-based GI-POFs,mode mixing in PF-based GI-POFs is much stronger than in silica-based GI-MMFs. Observation of the NFP at the output end of PF-based GI-POFs showsthat mode mixing is not full for a fiber length up to 108 m [117]. In Ref. [117],selective excitation with a silica-based SMF at 1300 nm wavelength was used.
7.3 Selective excitation of PMMA-based GI-POFs with an SMF 95
This supports MGDM transmission. However, when compared with the resultsreported using PMMA-based GI-POF [67, 113, 114], it seems that greater spatialseparation can be achieved among MGDM channels with PMMA-based ratherthan PF-based GI-POF. In contrast with PMMA-based GI-POF, the attenuationspectrum of PF-based GI-POF allows transmission in a very wide wavelengthrange from about 600 nm to approximately 1300 nm, with less than 100 dB/kmattenuation. Therefore, it is easier to apply WDM transmission over PF-basedthan PMMA-based GI-POF.
A significant difference between PMMA-based and PF-based GI-POF lies intheir size. As was mentioned in Chapter 1, PMMA-based GI-POF has usuallya much larger core radius and higher numerical aperture (NA). Typical valueswere shown in Table 1.2. In particular, for PMMA-based GI-POF, the core radiusis a = 250 µm and NA = 0.29, while for PF-based GI-POF, a = 60 µm andNA = 0.171. In order to facilitate the use of high speed transceivers at 1300 nm,PF-based GI-POFs with a = 25 µm, a typical value for GI-GOFs, have beenrecently used [35]. The large core radius and high NA of PMMA-based GI-POFsgive them their special advantages related to the ease of light coupling and relaxedalignment. In contrast, PF-based GI-POF appears more as a competitor of GI-GOF, and its smaller core radius and low NA, together with high mode mixingdo not make it a very appealing medium for MGDM transmission in in-housenetworks.
7.3 Selective excitation of PMMA-based GI-POFswith an SMF
In the previous section, it was suggested that PMMA-based GI-POF is a moresuitable candidate for an MGDM system than PF-based GI-POF, especially whenin-house networking is concerned. To investigate the possibility of MGDM trans-mission over PMMA-based GI-POF, an experimental investigation of the NFPat the output end of PMMA-based GI-POF has been attempted. The experi-mental setup is shown in Figure 7.1. A 635 nm continuous wave, Fabry–Perotmulti-quantum-well laser was used to selectively excite a GI-POF with core radiusa ≈ 200 µm and NA = 0.274. Perdeuterated PMMA (PMMA-d8) was used to fab-ricate this GI-POF1 [112]. The laser is pigtailed with an SMF, with a mode fielddiameter (MFD) of 4.2 µm and an NA of 0.12, at 635 nm. The level of the opticalpower was controlled with a variable optical attenuator (VOA). The MFD and NAof the SMF pigtails of the VOA match the MFD and NA of the laser pigtail. Amicroscope projected the NFP on the GI-POF output facet onto a CCD camera.An image of the projected pattern was grabbed with video processing software.Two microscope objectives were used. A 20×, 0.40-NA one gathering all light at
1This PMMA-based GI-POF sample was provided by Dr. Takaaki Ishigure (Keio University,Japan).
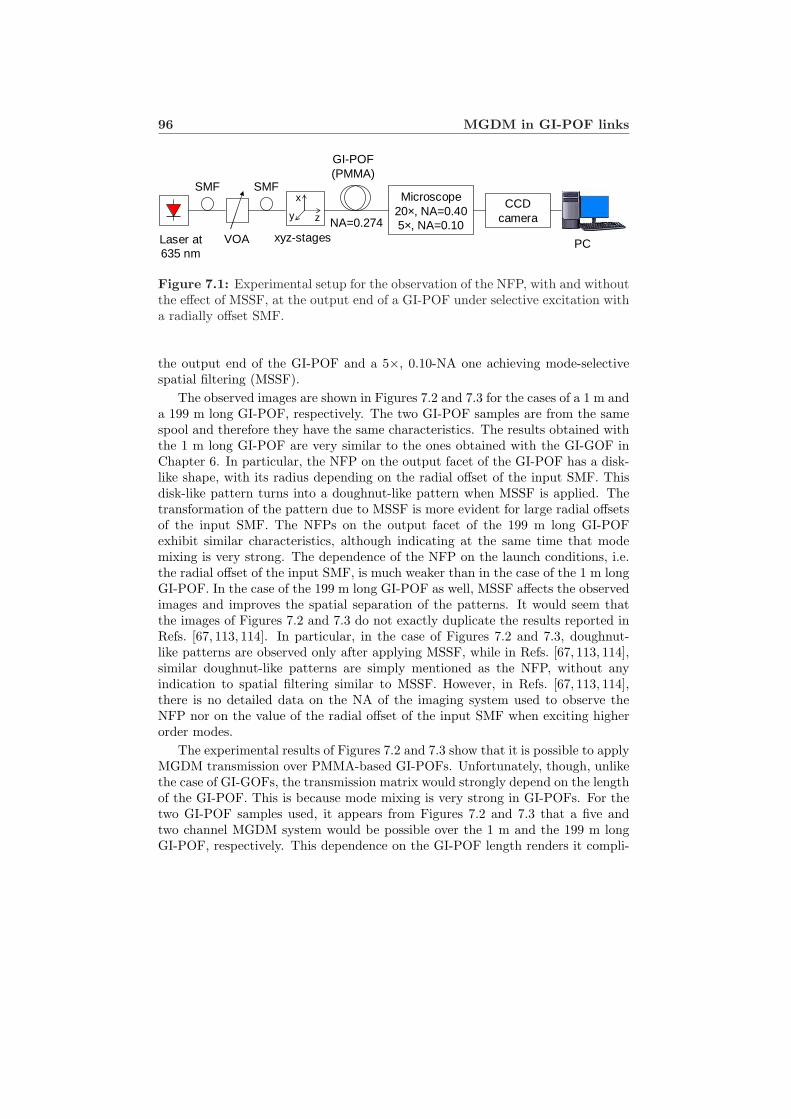
96 MGDM in GI-POF links
NA=0.274
Microscope20×, NA=0.405×, NA=0.10
CCD camera
PCLaser at 635 nm
VOA
SMFSMF
xyz-stages
x
y z
GI-POF(PMMA)
Figure 7.1: Experimental setup for the observation of the NFP, with and withoutthe effect of MSSF, at the output end of a GI-POF under selective excitation witha radially offset SMF.
the output end of the GI-POF and a 5×, 0.10-NA one achieving mode-selectivespatial filtering (MSSF).
The observed images are shown in Figures 7.2 and 7.3 for the cases of a 1 m anda 199 m long GI-POF, respectively. The two GI-POF samples are from the samespool and therefore they have the same characteristics. The results obtained withthe 1 m long GI-POF are very similar to the ones obtained with the GI-GOF inChapter 6. In particular, the NFP on the output facet of the GI-POF has a disk-like shape, with its radius depending on the radial offset of the input SMF. Thisdisk-like pattern turns into a doughnut-like pattern when MSSF is applied. Thetransformation of the pattern due to MSSF is more evident for large radial offsetsof the input SMF. The NFPs on the output facet of the 199 m long GI-POFexhibit similar characteristics, although indicating at the same time that modemixing is very strong. The dependence of the NFP on the launch conditions, i.e.the radial offset of the input SMF, is much weaker than in the case of the 1 m longGI-POF. In the case of the 199 m long GI-POF as well, MSSF affects the observedimages and improves the spatial separation of the patterns. It would seem thatthe images of Figures 7.2 and 7.3 do not exactly duplicate the results reported inRefs. [67, 113, 114]. In particular, in the case of Figures 7.2 and 7.3, doughnut-like patterns are observed only after applying MSSF, while in Refs. [67, 113, 114],similar doughnut-like patterns are simply mentioned as the NFP, without anyindication to spatial filtering similar to MSSF. However, in Refs. [67, 113, 114],there is no detailed data on the NA of the imaging system used to observe theNFP nor on the value of the radial offset of the input SMF when exciting higherorder modes.
The experimental results of Figures 7.2 and 7.3 show that it is possible to applyMGDM transmission over PMMA-based GI-POFs. Unfortunately, though, unlikethe case of GI-GOFs, the transmission matrix would strongly depend on the lengthof the GI-POF. This is because mode mixing is very strong in GI-POFs. For thetwo GI-POF samples used, it appears from Figures 7.2 and 7.3 that a five andtwo channel MGDM system would be possible over the 1 m and the 199 m longGI-POF, respectively. This dependence on the GI-POF length renders it compli-
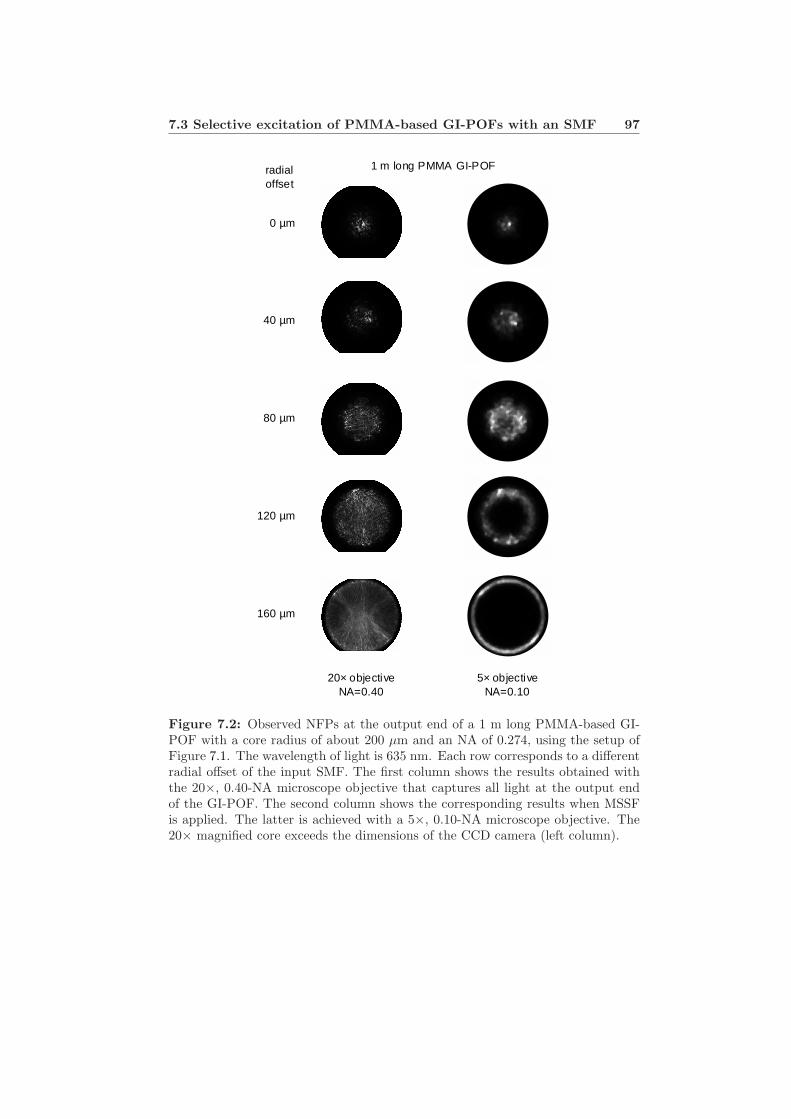
7.3 Selective excitation of PMMA-based GI-POFs with an SMF 97
0 µm
40 µm
80 µm
120 µm
160 µm
1 m long PMMA GI-POF
5× objectiveNA=0.10
20× objectiveNA=0.40
radial offset
Figure 7.2: Observed NFPs at the output end of a 1 m long PMMA-based GI-POF with a core radius of about 200 µm and an NA of 0.274, using the setup ofFigure 7.1. The wavelength of light is 635 nm. Each row corresponds to a differentradial offset of the input SMF. The first column shows the results obtained withthe 20×, 0.40-NA microscope objective that captures all light at the output endof the GI-POF. The second column shows the corresponding results when MSSFis applied. The latter is achieved with a 5×, 0.10-NA microscope objective. The20× magnified core exceeds the dimensions of the CCD camera (left column).
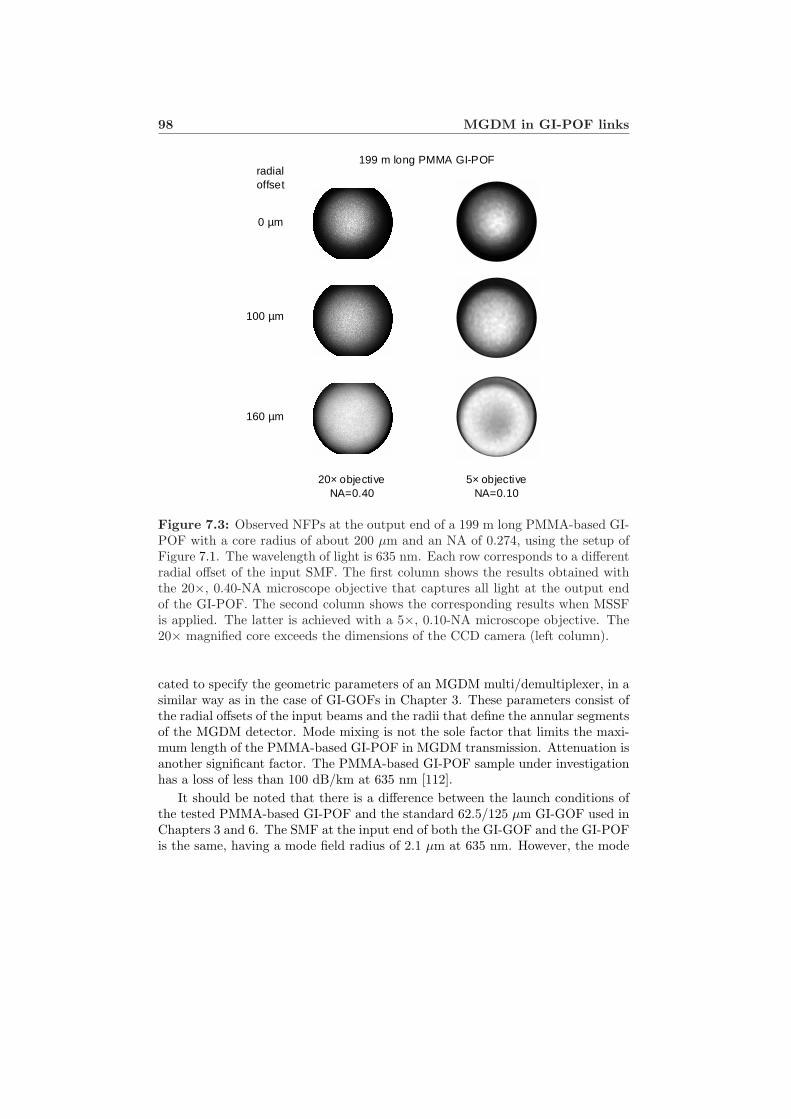
98 MGDM in GI-POF links
0 µm
100 µm
160 µm
5× objectiveNA=0.10
20× objectiveNA=0.40
199 m long PMMA GI-POF radial offset
Figure 7.3: Observed NFPs at the output end of a 199 m long PMMA-based GI-POF with a core radius of about 200 µm and an NA of 0.274, using the setup ofFigure 7.1. The wavelength of light is 635 nm. Each row corresponds to a differentradial offset of the input SMF. The first column shows the results obtained withthe 20×, 0.40-NA microscope objective that captures all light at the output endof the GI-POF. The second column shows the corresponding results when MSSFis applied. The latter is achieved with a 5×, 0.10-NA microscope objective. The20× magnified core exceeds the dimensions of the CCD camera (left column).
cated to specify the geometric parameters of an MGDM multi/demultiplexer, in asimilar way as in the case of GI-GOFs in Chapter 3. These parameters consist ofthe radial offsets of the input beams and the radii that define the annular segmentsof the MGDM detector. Mode mixing is not the sole factor that limits the maxi-mum length of the PMMA-based GI-POF in MGDM transmission. Attenuation isanother significant factor. The PMMA-based GI-POF sample under investigationhas a loss of less than 100 dB/km at 635 nm [112].
It should be noted that there is a difference between the launch conditions ofthe tested PMMA-based GI-POF and the standard 62.5/125 µm GI-GOF used inChapters 3 and 6. The SMF at the input end of both the GI-GOF and the GI-POFis the same, having a mode field radius of 2.1 µm at 635 nm. However, the mode
7.3 Selective excitation of PMMA-based GI-POFs with an SMF 99
field radius of the fundamental mode in the two GI-MMF types is different. Aswas mentioned in Chapter 3, the mode selectivity of the excitation scheme thatuses a Gaussian-like beam depends on the mode field radius of the fundamentalmode (wfm) of the GI-MMF and the mode field radius of the input beam (w0).Equation (3.2) gives the value of wfm for a parabolic index MMF. According toEq. (3.1), in order to excite as few principal mode groups as possible, the radiusof the input beam should be w0 = 0.6wfm. For the parameters of the GI-POFunder investigation, w0 ≈ 7.3 µm at 635 nm, which is much larger than thevalue of 2.1 µm of the mode field radius of the input SMF. In the case of thestandard 62.5/125 µm GI-GOF, w0 ≈ 2.9 µm at 635 nm, a value much closer tothe value of 2.1 µm. Consequently, excitation with the SMF pigtail of the 635 nmlaser is more mode selective in the case of the GI-GOF than the GI-POF. Theabove calculations assume a parabolic index profile, i.e. α = 2 in the power-lawexpression of Eq. (1.1). This is very close to the actual profile of the GI-GOF. Theprofile of the GI-POF under investigation is characterized by α = 2.3 in the regionclose to its axis, while close to the core-cladding interface α = 3. This means thatthe value of w0 for the GI-POF is underestimated in the above calculation.
The two GI-POFs under test were bare, i.e. there was no coating aroundtheir cladding, and their ends were not connectorized. The 62.5/125 µm GI-GOFsused in the investigation of Chapters 3, 4 and 6 had a thin plastic coating aroundtheir cladding. These GI-GOF samples had also no connectors at their ends,which were stripped of the coating. Unlike the case with the GI-GOF samples, astrange phenomenon was observed with the GI-POFs. Fiber displacements easilyaffected the NFP. More careful investigation showed that the effect on the NFPwas apparent when these displacements influenced the position of the end part ofthe GI-POF that was reaching the microscope stage. In particular, bending of theGI-POF at a distance of the order of 1 cm from its output end changed the overallNFP. Typical patterns, for central excitation, are shown in Figures 7.4(a), 7.4(c)and 7.4(d). When the end part of the GI-POF reaches the microscope stage in astraight position, the overall NFP is confined within a disk which is concentric withthe GI-POF core. However, bending of this end part of the GI-POF moves theoverall NFP, which does not remain concentric. This is very clear in Figure 7.4(a)that corresponds to the 1 m long GI-POF. It is also shown in Figure 7.4(c) andthe left picture of Figure 7.4(d) for the 199 m long GI-POF. For offset launch,differentiation of the NFP also occurred for similar bending close to the GI-POFoutput end. This is shown in Figure 7.4(b) for the 1 m long GI-POF. Figure 7.5shows two photographs of the GI-POF as it reaches the microscope stage in astraight and a bent position. The end part of the GI-POF in Figure 7.5(b) is notin a straight position and this kind of bending causes the changes in the NFP.
At the same time, when similar bending was forced at a larger distance fromthe GI-POF end, changes were observed only in the speckle pattern and not inthe overall NFP, which remained stable. It seems therefore reasonable to assumethat this bending does not really cause strong mode mixing. It rather causesmacroscopic deformations in the refractive index profile that change the path of
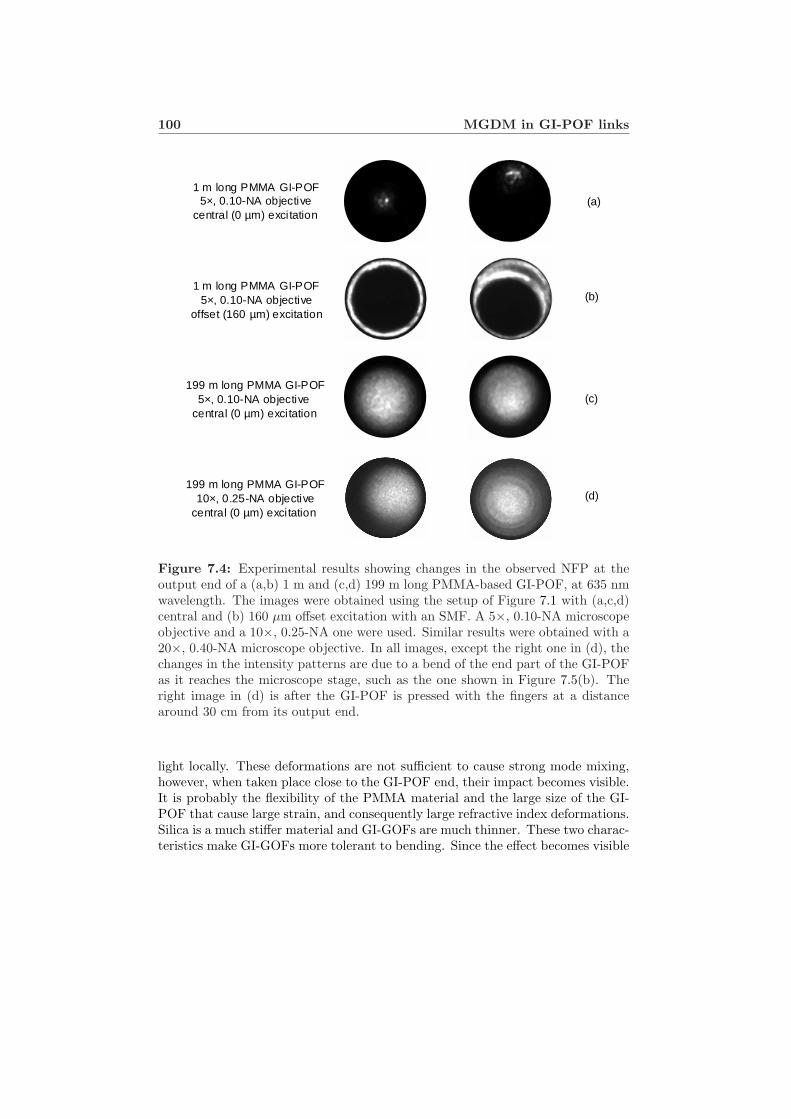
100 MGDM in GI-POF links
199 m long PMMA GI-POF5×, 0.10-NA objective
central (0 µm) excitation
1 m long PMMA GI-POF5×, 0.10-NA objective
central (0 µm) excitation
(c)
(a)
(b) 1 m long PMMA GI-POF
5×, 0.10-NA objectiveoffset (160 µm) excitation
(d) 199 m long PMMA GI-POF
10×, 0.25-NA objectivecentral (0 µm) excitation
Figure 7.4: Experimental results showing changes in the observed NFP at theoutput end of a (a,b) 1 m and (c,d) 199 m long PMMA-based GI-POF, at 635 nmwavelength. The images were obtained using the setup of Figure 7.1 with (a,c,d)central and (b) 160 µm offset excitation with an SMF. A 5×, 0.10-NA microscopeobjective and a 10×, 0.25-NA one were used. Similar results were obtained with a20×, 0.40-NA microscope objective. In all images, except the right one in (d), thechanges in the intensity patterns are due to a bend of the end part of the GI-POFas it reaches the microscope stage, such as the one shown in Figure 7.5(b). Theright image in (d) is after the GI-POF is pressed with the fingers at a distancearound 30 cm from its output end.
light locally. These deformations are not sufficient to cause strong mode mixing,however, when taken place close to the GI-POF end, their impact becomes visible.It is probably the flexibility of the PMMA material and the large size of the GI-POF that cause large strain, and consequently large refractive index deformations.Silica is a much stiffer material and GI-GOFs are much thinner. These two charac-teristics make GI-GOFs more tolerant to bending. Since the effect becomes visible
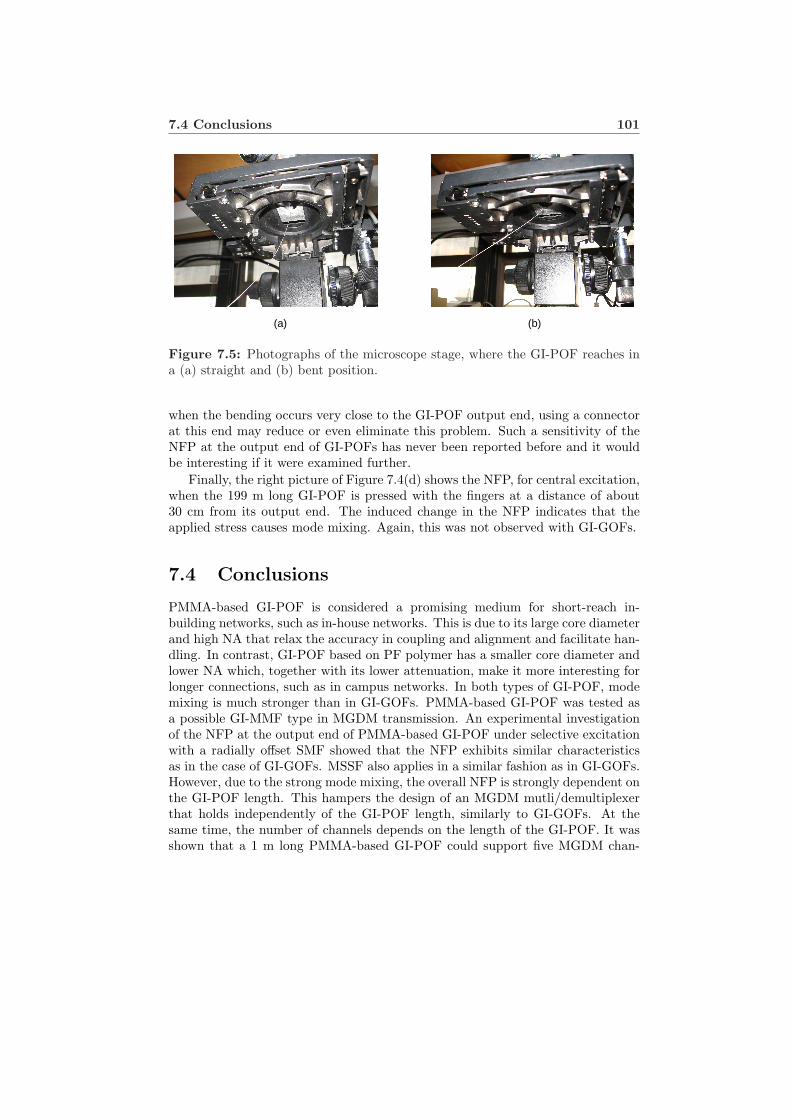
7.4 Conclusions 101
(a) (b)
Figure 7.5: Photographs of the microscope stage, where the GI-POF reaches ina (a) straight and (b) bent position.
when the bending occurs very close to the GI-POF output end, using a connectorat this end may reduce or even eliminate this problem. Such a sensitivity of theNFP at the output end of GI-POFs has never been reported before and it wouldbe interesting if it were examined further.
Finally, the right picture of Figure 7.4(d) shows the NFP, for central excitation,when the 199 m long GI-POF is pressed with the fingers at a distance of about30 cm from its output end. The induced change in the NFP indicates that theapplied stress causes mode mixing. Again, this was not observed with GI-GOFs.
7.4 Conclusions
PMMA-based GI-POF is considered a promising medium for short-reach in-building networks, such as in-house networks. This is due to its large core diameterand high NA that relax the accuracy in coupling and alignment and facilitate han-dling. In contrast, GI-POF based on PF polymer has a smaller core diameter andlower NA which, together with its lower attenuation, make it more interesting forlonger connections, such as in campus networks. In both types of GI-POF, modemixing is much stronger than in GI-GOFs. PMMA-based GI-POF was tested asa possible GI-MMF type in MGDM transmission. An experimental investigationof the NFP at the output end of PMMA-based GI-POF under selective excitationwith a radially offset SMF showed that the NFP exhibits similar characteristicsas in the case of GI-GOFs. MSSF also applies in a similar fashion as in GI-GOFs.However, due to the strong mode mixing, the overall NFP is strongly dependent onthe GI-POF length. This hampers the design of an MGDM mutli/demultiplexerthat holds independently of the GI-POF length, similarly to GI-GOFs. At thesame time, the number of channels depends on the length of the GI-POF. It wasshown that a 1 m long PMMA-based GI-POF could support five MGDM chan-

102 MGDM in GI-POF links
nels, while this number reduces to two for a 199 m long PMMA-based GI-POF.In addition, the size and flexibility of the PMMA-based GI-POF, although theyoffer advantages with respect to installation and handling, make the overall NFPsensitive to bending that occurs very close to the output end of the GI-POF. Fur-ther, putting the PMMA-based GI-POF under stress induces readily mode mixingthat alters the NFP. These effects could be minimized when connectors are usedat the GI-POF ends and coating layers protect the GI-POF. In principle, MGDMsystems with PMMA-based, as well as PF-based, GI-POF are feasible. However,the high level of mode mixing and the sensitivity of the NFP to bending thatoccurs very close to the output end of the PMMA-based GI-POF as well as toexternal stress can cause practical difficulties for a reliable MGDM system withPMMA-based GI-POF.
Chapter 8
Conclusions andrecommendations
The conclusions from the theoretical and experimental investigation of the modegroup diversity multiplexing (MGDM) technique are summarized. The significanceof mode-selective spatial filtering (MSSF) in mitigating transmission impairmentsin MGDM systems and offering scalability with the number of channels is under-lined. Having reached a point at which it is fairly clear what MGDM can achieve,a comparison with other multiplexing techniques is made. The combination ofMGDM with other techniques, such as subcarrier multiplexing and wavelength di-vision multiplexing, appears to be an interesting option. MSSF has a key role insuch combinations. Finally, it is suggested that future research on the design andmanufacture of MGDM components, both optical and electronic ones, can proceedtowards robust adaptive system solutions and thus can further explore the actualenhancement in the aggregate transmission bandwidth that can be achieved withMGDM.
8.1 Conclusions
Characteristics of MGDM
An important feature of an N -input, M -output mode group diversity multiplexing(MGDM) link with intensity-modulation and direct detection (IM-DD) is that itis described by an M × N linear system of equations, as long as the effect ofoptical beating is restricted. The matrix of this system, i.e. the transmissionmatrix H, is real-valued when the effect of dispersion can be neglected. Indeed,a real-valued H cannot account for differential delays in the system. In the mostgeneral case, irrespective of the amount of spatial overlap among the fields of the Ndetected mode groups, these N fields should be mutually incoherent. Furthermore,
104 Conclusions and recommendations
although in principle M ≥ N , it is beneficial for the SNR that M = N .Another characteristic of MGDM is that it supports signal format transparency.
The channels are demultiplexed with electronic signal processing based on matrixinversion. Matrix inversion is a zero-forcing method that cancels cross-talk, re-gardless of the performance of the system in relation to noise. Consequently, ascompared to the single-channel case, noise may be increased and hence a powerpenalty may be induced to maintain the SNR of the single-channel case. Thispower penalty depends on the spatial overlap among the intensity profiles of thedetected mode groups. The larger the overlap, the higher the power penalty and itssensitivity to changes in the value of the transmission matrix elements hi,j . Suchchanges may be due to misalignments, temperature variations and/or mechanicalfluctuations. From a mathematical viewpoint, the lower the condition number ofH, the more robust the MGDM system.
The design and implementation of an MGDM system is a non-trivial challenge.An MGDM multi/demultiplexer is required. This can be achieved by N radiallyoffset Gaussian-like beams at the input facet of the GI-MMF and an N -segmentdetector with annular segments responding to the near-field pattern (NFP) at theoutput facet of the GI-MMF. The areas of the detector segments and the radialoffsets of the input beams must be chosen such, so as to minimize, on average, theoptical cross-talk. For standard silica-based GI-MMFs, at least up to 1 km long,the choice of the radial offsets and the detector segments does not depend on thelength of the GI-MMF. This is because differential mode delay and attenuation,as well as the very limited mode mixing that occurs do not change the overallNFP, although they do affect the speckle pattern. Further, the dependence of theoverall NFP on small deviations of the refractive index profile is very weak. Thisapproach for the design of an MGDM system retains the characteristics of highcoupling efficiency, simplicity and robustness with the GI-MMF length. However,it may fail in case the refractive index profile of the GI-MMF exhibits a centraldip. Such a defect is not uncommon in legacy GI-MMFs. In this case, centralexcitation is to be avoided.
MGDM can be also applied to GI-POF systems. PMMA-based GI-POFs aremore attractive candidates for MGDM transmission than PF-based GI-POFs dueto their large core diameter and NA. However, mode mixing in GI-POFs, bothPMMA-based and PF-based ones, is very strong. This makes matrix H stronglydependent on the fiber length, as opposed to the case of GI-GOFs. The flexibilityof the PMMA material, although it facilitates the installation of in-building andin-house networks, renders PMMA-based GI-POFs sensitive to bending-inducedmacroscopic deformations of the refractive index profile. This can significantlyaffect the NFP at the output facet of a PMMA-based GI-POF. To observe suchchanges in the NFP, bending should take place close to the output end of a PMMA-based GI-POF, at a distance in the order of 1 cm. In addition, applying stresson a PMMA-based GI-POF induces mode mixing and changes the overall NFP.The use of connectors and coating around a PMMA-based GI-POF can increaseits tolerance with respect to external forces. This sensitivity, due to certain bend-
8.1 Conclusions 105
ing and stress, is not observed in GI-GOFs, and together with the strong modemixing in PMMA-based GI-POFs can cause practical problems in the applicationof MGDM over PMMA-based GI-POF connections.
An MGDM system must be adaptive, in order to accommodate changes inthe value of hi,j . Such changes may be induced due to different factors, such astemperature changes and mechanical vibrations. It is indeed possible to build asystem which is fairly stable over time, as was experimentally shown in this thesis.In such a system, adaptivity can be simply realized at the receiving side of thelink, by tracking small changes in the value of hi,j , for instance by using pilottones. No feedback is then required from the receiver to the transmitter, whichgreatly simplifies the implementation of the MGDM technique.
The significance of MSSF
The characterization of an MGDM system with a real-valued H and the demul-tiplexing of the channels based on electronic matrix inversion allow for a simplesystem design and transparency with respect to the signal format. It is ratherstraightforward to design a system with a non-singular H. However, a very im-portant parameter is the condition number of H. The lower the condition number,the more robust the system. The robustness of the system is related to the toler-ance of its performance to changes in the value of hi,j . A low condition numbermeans limited optical cross-talk, i.e. limited spatial overlap among the intensityprofiles of the detected mode groups. At the same time, when this spatial overlapis limited, the power penalty due to matrix inversion is small. Furthermore, lim-ited optical cross-talk relaxes the requirement of mutual incoherence among thefields of the detected mode groups, since these field distributions interfere onlypartially.
Mode-selective spatial filtering (MSSF) is a new optical method that can beused to reduce cross-talk among the channels of an MGDM system. A greatadvantage of MSSF is the ease of implementation. MSSF only requires an imagingsystem with a lower NA than the central NA of the GI-MMF. Such an imagingsystem can be a single lens. MSSF makes an MGDM system more robust tochanges in the value of hi,j , leads to better scalability with respect to the numberof channels and relaxes some restrictions on the spectral content of the opticalsources of the system. For all these reasons, the aggregate bandwidth of thesystem can be increased significantly and hence MGDM can be interesting formore bandwidth-demanding applications that also benefit from the signal formattransparency. The only drawback of MSSF is that some of the optical power at theoutput of the GI-MMF is lost. However, the great advantages that MSSF offers inMGDM transmission will often justify this power loss. For standard 62.5/125 µmsilica-based GI-MMFs, a robust five-channel MGDM system could be built withMSSF. Without MSSF, this number reduces to three. In addition, it would bepossible to build a three-channel MGDM system, in which MSSF fully mitigatescross-talk and therefore the need for electronic demultiplexing is eliminated.
106 Conclusions and recommendations
Comparison of MGDM with other multiplexing techniques
Multiplexing can be achieved with different methods in GI-MMF transmission.Subcarrier multiplexing (SCM) and wavelength division multiplexing (WDM) aretwo methods that are widely used in optical communications. Both SCM andWDM can support signal format transparency and use IM-DD. Therefore a com-parison of these techniques with MGDM is of great interest. WDM requires adifferent wavelength at every channel and optical filters for the demultiplexing ofthe channels. The number of channels within a certain system wavelength rangedepends on the channel spacing in the wavelength domain. Narrow spacing allowsfor a large number of channels, however it requires high wavelength selectivity ofthe related components, e.g. lasers and filters, as well as wavelength stability overtime. Dense WDM is a powerful technique that comes at the expense of relativelyhigh cost. However, when the target number of channels is small, e.g. four, coarseWDM (CWDM) may be a valid option for short-reach applications that requiresimplicity and relatively low cost. For in-house networks, the cost of the proposedsolution should be very low. This is a real challenge for optics, since typically,optical components are more costly than electronic ones. MGDM with MSSF canoffer a robust solution for a small number of channels that could meet the low-costrequirement, since a significant part of the signal processing in the system is donein the electrical domain.
SCM with IM-DD requires one laser and one photodiode. The multiplexingand demultiplexing of the channels take place in the electrical domain. ThereforeSCM can be more cost-effective than WDM. The 3-dB bandwidth of the GI-MMF should be shared among the channels. This means that each channel mustbe a narrowband one. To overcome this limitation, higher passband lobes in thetransmission spectrum of the GI-MMF could be used as well. Would such a systembe stable? As with MGDM, any changes in the distribution of the optical poweramong the guided modes will affect the frequency response of the GI-MMF. Forlow frequencies, the change may not be significant, however for high frequenciesthe same change could be destructive. Therefore transmission in the higher orderpassband regions can be sensitive and may require adaptivity based on feedbackfrom the receiver to the transmitter. By contrast, MGDM creates broadbandparallel channels which do not exceed the 3-dB bandwidth and therefore such aneed for feedback can be eliminated.
MGDM requires more complex optical components than SCM. An MGDMsystem is potentially more cost-effective than a WDM one. MGDM creates broad-band channels and the same holds for WDM. For SCM in the baseband region,the bandwidth of each channel is less broad than in MGDM and WDM. MGDMis limited to a small number of channels. The same holds for CWDM compared todense WDM, but for a relatively large system wavelength range CWDM is morescalable regarding the number of channels than MGDM. In SCM, the number ofchannels within an available frequency range depends on the bandwidth of eachchannel. What is the best option for a GI-MMF transmission system? The an-
8.2 Recommendations for further research 107
swer of course depends on the specific application and resources. The followingexample, although it only represents a single case, gives a nice perspective to theanswer of this question.
The needs of the average current residential user can be covered by a singleIM-DD channel. The easiest way to introduce more channels would be to applySCM in the baseband region, as long as the single IM-DD channel does not makeuse of the whole baseband region. The next step could be to apply MGDM.Solutions based on combination of different techniques should be also considered.A two-channel MGDM system with cross-talk being fully mitigated with MSSFcan be very easily realized and it creates two independent IM-DD optical channelswhere SCM can apply in each one. As a further step, a two-channel WDM systemcan be introduced, which is a very simple case of WDM transmission. Of course,the combination of several techniques requires suitable components and this issomething to be investigated.
8.2 Recommendations for further research
The way of exploiting research results is a very interesting issue. It is not alwaysthe case that research bears fruits that can lead to practical applications anddrive future activities. In some cases, research may reveal fundamental problemsassociated with the viability of the investigated methods. Although this does notdiminish the importance of the research work, it is not the most fortunate outcome.Happily, this is not the case for the research work presented in this dissertation.It is the hope of the author that based on the presented results, the reader sharesthe conviction that MGDM is a robust, stable and simple to implement methodthat can be useful in practical applications.
The investigation presented in this thesis is from the system point of view.However, the results on the definition of the geometric parameters of the MGDMmulti/demultiplexer can be used for the design and manufacture of MGDM com-ponents, such as a multi-segment photodetector and a multi–mode-group launcher.That would be a necessary step in order to demonstrate systems that fully exploitthe potential of the MGDM technique. To this direction, high frequency electron-ics should be also designed and manufactured. This has not been a part of thisthesis. Furthermore, research can be carried out to explore how other transmis-sion scenarios can benefit from the ideas described in this thesis. For example,MIMO schemes that are restricted with respect to the signal format in favor ofbandwidth maximization or combination of several multiplexing techniques couldbe explored. Next to this, adaptivity implementation methods need to be investi-gated. Throughout this thesis, it has been assumed that the effects of dispersioncan be neglected. This may limit the transmission bandwidth and the length ofthe GI-MMF. It would be interesting to see how to surpass this limitation posed bydispersion. Further, the possibility of a bidirectional MGDM link could be investi-gated, primarily as regards its practical implementation. In such a link, adaptivity

108 Conclusions and recommendations
based on feedback from the receiver to the transmitter can be easily incorporated.This would open new possibilities for the signal processing approach in an MGDMsystem and would also facilitate the application of MGDM in network architec-tures, such as point-to-multipoint. Undoubtedly, the spatial modes of a GI-MMFoffer extra degrees of freedom that can be exploited in very pragmatic transmissionsystems.
References
[1] F. W. Kerfoot and W. C. Marra, “Undersea Fiber Optic Networks: Past,Present, and Future,” IEEE J. Sel. Areas Commun., vol. 16, pp. 1220–1225,Sept. 1998.
[2] T. Koonen, “Fiber to the Home/Fiber to the Premises: What, Where, andWhen?,” Proc. IEEE, vol. 94, pp. 911–934, May 2006.
[3] A. Flatman, Presentation to IEEE 802.3 High-Speed Study Group. Montreal,Canada, July 1999.
[4] A. Flatman, Presentation to IEEE 802.3 10GBE over FDDI-Grade FiberStudy Group. Orlando, FL, USA, Mar. 2004.
[5] D. A. B. Miller, “Rationale and Challenges for Optical Interconnects toElectronic Chips,” Proc. IEEE, vol. 88, pp. 728–749, June 2000.
[6] A. F. J. Levi, “Optical Interconnects in Systems,” Proc. IEEE, vol. 88,pp. 750–757, June 2000.
[7] C. V. Cryan, “Two-dimensional multimode fibre array for optical intercon-nects,” Electron. Lett., vol. 34, pp. 586–587, Mar. 1998.
[8] B. E. Lemoff, M. E. Ali, G. Panotopoulos, G. M. Flower, B. Madhavan,A. F. J. Levi, and D. W. Dolfi, “MAUI: Enabling Fiber-to-the-ProcessorWith Parallel Multiwavelength Optical Interconnects,” IEEE/OSA J. Light-wave Technol., vol. 22, pp. 2043–2054, Sept. 2004.
[9] Y. Yadin and M. Orenstein, “Parallel Optical Interconnects Over MultimodeWaveguides,” IEEE/OSA J. Lightwave Technol., vol. 24, pp. 380–386, Jan.2006.
[10] J. C. Knight, J. Broeng, T. A. Birks, and P. S. J. Russell, “Photonic BandGap Guidance in Optical Fibers,” Science, vol. 282, pp. 1476–1478, Nov.1998.
[11] P. Russell, “Photonic Crystal Fibers,” Science, vol. 299, pp. 358–362, Jan.2003.
110 REFERENCES
[12] D. Hondros and P. Debye, “Elektromagnetische Wellen an dielektrischenDrahten,” Annalen der Physik (Leipzig) Ser. 4, vol. 32, pp. 465–476, 1910.
[13] A. W. Snyder and J. D. Love, Optical Waveguide Theory. Chapman andHall, London, 1983.
[14] H. A. Haus, Waves and Fields in Optoelectronics. Prentice Hall, 1984.
[15] A. H. Cherin and L. Short, An introduction to optical fibers. McGraw-Hill,New York, 1983.
[16] J. Gowar, Optical Communication Systems. Prentice Hall, London, 2nd ed.,1993.
[17] G. P. Agrawal, Fiber-Optic Communication Systems. John Wiley and Sons,Inc., New York, 3rd ed., 2002.
[18] H. P. A. van den Boom, W. Li, P. K. van Bennekom, I. T. Monroy, and G.-D.Khoe, “High-Capacity Transmission Over Polymer Optical Fiber,” IEEE J.Select. Topics in Quantum Electron., vol. 7, pp. 461–470, May/June 2001.
[19] B. J.-C. Deboux, E. Lewis, P. J. Scully, and R. Edwards, “A Novel Tech-nique for Optical Fiber pH Sensing Based on Methylene Blue Adsorption,”IEEE/OSA J. Lightwave Technol., vol. 13, pp. 1407–1414, July 1995.
[20] S. Savovic and A. Djordjevich, “Optical power flow in plastic-clad silicafibers,” OSA Appl. Opt., vol. 41, pp. 7588–7591, Dec. 2002.
[21] T. Kibler, S. Poferl, G. Bock, H.-P. Huber, and E. Zeeb, “Optical Data Busesfor Automotive Applications,” IEEE/OSA J. Lightwave Technol., vol. 22,pp. 2184–2199, Sept. 2004.
[22] T. Koonen, A. Ngoma, P. Smulders, H. van den Boom, I. T. Monroy, andG.-D. Khoe, “In-house networks using multimode polymer optical fibre forbroadband wireless services,” Photon. Network Comm., vol. 5, pp. 177–187,Mar. 2003.
[23] T. Ishigure, M. Satoh, O. Takanashi, E. Nihei, T. Nyu, S. Yamazaki, andY. Koike, “Formation of the Refractive Index Profile in the Graded IndexPolymer Optical Fiber for Gigabit Data Transmission,” IEEE/OSA J. Light-wave Technol., vol. 15, pp. 2095–2100, Nov. 1997.
[24] C. Koeppen, R. F. Shi, W. D. Chen, and A. F. Garito, “Properties of plasticoptical fibers,” J. Optic. Soc. Amer. B, vol. 15, pp. 727–739, Feb. 1998.
[25] B. E. Lemoff, L. B. Aronson, and L. A. Buckman, “Zigzag waveguide demul-tiplexer for multimode WDM LAN,” Electron. Lett., vol. 34, pp. 1014–1016,May 1998.
REFERENCES 111
[26] L. B. Aronson, B. E. Lemoff, L. A. Buckman, and D. W. Dolfi, “Low-CostMultimode WDM for Local Area Networks Up to 10 Gb/s,” IEEE Photon.Technol. Lett., vol. 10, pp. 1489–1491, Oct. 1998.
[27] L. A. Buckman, B. E. Lemoff, A. J. Schmit, R. P. Tella, and W. Gong,“Demonstration of a Small-Form-Factor WWDM Transceiver Module for 10-Gb/s Local Area Networks,” IEEE Photon. Technol. Lett., vol. 14, pp. 702–704, May 2002.
[28] P. Koutessis, T. Quinlan, E. Rochat, S. D. Walker, M. Wehster, I. H. White,R. V. Penty, and M. C. Parker, “0.6 Tb/s/km multimode fiber feasibilityexperiments using 40 channel DWDM over quadrature-subcarrier transmis-sion,” Electron. Lett., vol. 38, pp. 813–815, July 2002.
[29] R. A. Panicker, J. P. Wilde, J. M. Kahn, D. F. Welch, and I. Lyubomirsky,“10×10 Gb/s DWDM Transmission Through 2.2-km Multimode Fiber UsingAdaptive Optics,” IEEE Photon. Technol. Lett., vol. 19, pp. 1154–1156, Aug.2007.
[30] T. E. Darcie, “Subcarrier Multiplexing for Lightwave Networks and VideoDistribution Systems,” IEEE J. Sel. Areas Commun., vol. 8, pp. 1240–1248,Sept. 1990.
[31] L. Raddatz and I. H. White, “Overcoming the Modal Bandwidth Limitationof Multimode Fiber by Using Passband Modulation,” IEEE Photon. Technol.Lett., vol. 11, pp. 266–268, Feb. 1999.
[32] E. J. Tyler, M. Webster, R. V. Penty, and I. H. White, “Penalty Free Subcar-rier Modulated Multimode Fiber Links for Datacomm Applications Beyondthe Bandwidth Limit,” IEEE Photon. Technol. Lett., vol. 14, pp. 110–112,Jan. 2002.
[33] E. J. Tyler, M. Webster, R. V. Penty, I. H. White, S. Yu, and J. Rorison,“Subcarrier Modulated Transmission of 2.5 Gb/s Over 300 m of 62.5-µm-Core Diameter Multimode Fiber,” IEEE Photon. Technol. Lett., vol. 14,pp. 1743–1745, Dec. 2002.
[34] S. Kanprachar and I. Jacobs, “Diversity Coding for Subcarrier Multiplexingon Multimode Fibers,” IEEE Trans. on Comm., vol. 51, pp. 1546–1553,Sept. 2003.
[35] J. Zeng, A. Ng’oma, S. C. J. Lee, Y. Wanatabe, H. P. A. van den Boom,and A. M. J. Koonen, “1.25 Gb/s Subcarrier Modulated Transmission overGraded-index Perfluorinated Polymer Fibre,” in Proc. International PlasticOptical Fibers Conference, pp. 99–101, Seoul, South Korea, 2006.
112 REFERENCES
[36] T. Morioka, H. Takara, S. Kawanishi, O. Kamatani, K. Takiguchi,K. Uchiyama, M. Saruwatari, H. Takahashi, M. Yamada, T. Kanamori,and H. Ono, “1 Tbit/s (100 Gbit/s x 10 channel) OTDM/WDM transmis-sion using a single supercontinuum WDM source,” Electron. Lett., vol. 32,pp. 906–907, May 1996.
[37] C. Scheerer, C. Glingener, A. Farbert, J.-P. Elbers, A. Schopflin,E. Gottwald, and G. Fischer, “3.2Tbit/s (80 x 40Gbit/s) bidirectionalWDM/ETDM transmission over 40 km standard singlemode fibre,” Elec-tron. Lett., vol. 35, pp. 1752–1753, Sept. 1999.
[38] U. Feiste, R. Ludwig, C. Schubert, J. Berger, C. Schmidt, H. G. Weber,B. Schmauss, A. Munk, B. Buchold, D. Briggmann, F. Kueppers, andF. Rumpf, “16O Gbit/s transmission over 116 km field-installed fibre us-ing 16O Gbit/s OTDM and 40 Gbit/s ETDM,” Electron. Lett., vol. 37,pp. 443–445, Mar. 2001.
[39] S. Bhandare, D. Sandel, B. Milivojevic, A. Hidayat, A. A. Fauzi, H. Zhang,S. K. Ibrahim, F. Wust, and R. Noe, “5.94-Tb/s 1.49-b/s/Hz (40×2×2×40×Gb/s) RZ-DQPSK Polarization-Division Multiplex C -Band TransmissionOver 324 km,” IEEE Photon. Technol. Lett., vol. 17, pp. 914–916, Apr.2005.
[40] R. E. Wagner, R. H. Stolen, and W. Pleibel, “Polarisation preservation inmultimode fibres,” Electron. Lett., vol. 17, pp. 177–178, Mar. 1981.
[41] E. Rochat, S. D. Walker, and M. C. Parker, “C-band polarisation orthogo-nality preservation in 5Gb/s, 50µm multimode fibre links up to 3km,” OSAOpt. Express, vol. 11, pp. 508–514, Mar. 2003.
[42] J. Y. Hui, “Pattern Code Modulation and Optical Decoding-A Novel Code-Division Multiplexing Technique for Multifiber Networks,” IEEE J. Sel. Ar-eas Commun., vol. SAC-3, pp. 916–927, Nov. 1985.
[43] S. V. Maric, O. Moreno, and C. J. Corrada, “Multimedia Transmission inFiber-optic LANs Using Optical CDMA,” IEEE/OSA J. Lightwave Technol.,vol. 14, pp. 2149–2153, Oct. 1996.
[44] A. Stok and E. H. Sargent, “The Role of Optical CDMA in Access Networks,”IEEE Comm. Magazine, pp. 83–87, Sept. 2002.
[45] B. Huiszoon, L. M. Augustin, R. Hanfoug, L. Bakker, M. J. H. Sander-Jochem, E. R. Fledderus, G.-D. Khoe, J. J. G. M. van der Tol, H. de Waardt,M. K. Smit, and A. M. J. Koonen, “Integrated Parallel Spectral OCDMAEn/Decoder,” IEEE Photon. Technol. Lett., vol. 19, pp. 528–530, Apr. 2007.
REFERENCES 113
[46] G. J. Foschini, “Layered space-time architecture for wireless communicationin fading environments when using multi-element antennas,” Bell Labs Tech.J., pp. 41–59, Autumn 1996.
[47] G. J. Foschini and M. J. Gans, “On Limits of Wireless Communications ina Fading Environment when Using Multiple Antennas,” Wireless PersonalCommun.: Kluwer Academic Press, vol. 6, pp. 311–355, Mar. 1998.
[48] A. Goldsmith, S. A. Jafar, N. Jindal, and S. Vishwanath, “Capacity Limitsof MIMO Channels,” IEEE J. Sel. Areas Commun., vol. 21, pp. 684–702,June 2003.
[49] J. R. Barry, E. A. Lee, and D. G. Messerschmitt, Digital Communications.Kluwer Academic Publishers, Dordrecht, 3rd ed., 2004.
[50] M. Saffman and D. Z. Anderson, “Mode multiplexing and holographic demul-tiplexing communication channels on a multimode fiber,” OSA Opt. Lett.,vol. 16, pp. 300–302, Mar. 1991.
[51] D. Z. Anderson and M. E. Saffman, “Fiber optic communication method andapparatus providing mode multiplexing and holographic demultiplexing,”United States Patent: 5,136,666, Aug. 1992.
[52] P. L. Neo and T. D. Wilkinson, “Holographic Implementationof OpticalMultiple-Inputs Multiple-Outputs (MIMO) on a Multimode Fiber,” in Proc.Conference on Lasers and Electro-Optics/Quantum Electronics and LaserScience Conference and Photonic Applications Systems Technologies, paperCMNN2, Long Beach, CA, USA, 2006.
[53] S. Berdague and P. Facq, “Mode Division Multiplexing in Optical Fibers,”OSA Appl. Opt., vol. 21, pp. 1950–1955, June 1982.
[54] U. Levy, H. Kobrinsky, and A. A. Friesem, “Angular Multiplexing for Mul-tichannel Communication in a Single Fiber,” IEEE J. Quantum Electron.,vol. QE-17, pp. 2215–2224, Nov. 1981.
[55] R. C. Stearns, C. K. Asawa, and S.-K. Yao, “Angular Division Multiplexerfor Fiber Communication Using Graded-Index Rod Lenses,” IEEE/OSA J.Lightwave Technol., vol. LT-2, pp. 358–362, Aug. 1984.
[56] U. W. Krackhardt, R. Klug, and K.-H. Brenner, “Broadband parallel-fiberoptical link for short-distance interconnection with multimode fibers,” OSAAppl. Opt., vol. 39, pp. 690–697, Feb. 2000.
[57] H. P. A. van den Boom, A. M. J. Koonen, F. M. Huijskens, and W. van Gils,“Angular Mode Group Diversity Multiplexing for Multi-channel Communi-cation in a Single Step-Index Plastic Optical Fibre,” in Proc. IEEE/LEOSSymposium Benelux Chapter, pp. 121–124, Mons, Belgium, Dec. 2004.
114 REFERENCES
[58] P. Facq, P. Fournet, and J. Arnaud, “Observation of tubular modes in multi-mode graded-index fibres,” Electron. Lett., vol. 16, pp. 648–649, Aug. 1980.
[59] F. Dubois, P. Emplit, and . Hugon, “Selective mode excitation in graded-index multimode fiber by a computer-generated optical mask,” OSA Opt.Lett., vol. 19, pp. 433–435, Apr. 1994.
[60] H. R. Stuart, “Dispersive multiplexing in multimode fiber,” in Proc. Op-tical Fiber Communication Conference, vol. 3, pp. 305–307, paper ThV2,Baltimore, MD, USA, Mar. 2000.
[61] H. R. Stuart, “Dispersive Multiplexing in Multimode Optical Fiber,” Sci-ence, vol. 289, pp. 281–283, July 2000.
[62] R. C. J. Hsu, A. Shah, and B. Jalali, “Coherent Optical Multiple-Input Multiple-Output communication,” IEICE Electronics Express, vol. 1,pp. 392–397, Oct. 2004.
[63] A. R. Shah, R. C. J. Hsu, A. Tarighat, A. H. Sayed, and B. Jalali, “CoherentOptical MIMO (COMIMO),” IEEE/OSA J. Lightwave Technol., vol. 23,pp. 2410–2419, Aug. 2005.
[64] R. C. J. Hsu, A. Tarighat, A. Shah, A. H. Sayed, and B. Jalali, “Capac-ity Enhancement in Coherent Optical MIMO (COMIMO) Multimode FiberLinks,” IEEE Comm. Lett., vol. 10, pp. 195–197, Mar. 2006.
[65] M. Greenberg, M. Nazarathy, and M. Orenstein, “Data Parallelization byOptical MIMO Transmission Over Multimode Fiber With Intermodal Cou-pling,” IEEE/OSA J. Lightwave Technol., vol. 25, pp. 1503–1514, June 2007.
[66] T. Koonen, H. van den Boom, F. Willems, J. Bergmans, and G.-D. Khoe,“Broadband multi-service in-house networks using mode group diversity mul-tiplexing,” in Proc. International Plastic Optical Fibers Conference, Tokyo,Japan, 2002.
[67] T. Koonen, H. P. A. van den Boom, I. T. Monroy, and G.-D. Khoe, “HighCapacity Multi-service In-house Networks Using Mode Group Diversity Mul-tiplexing,” in Proc. Optical Fiber Communication Conference, vol. 2, paperFG4, Los Angeles, CA, USA, 2004.
[68] S. Schollmann and W. Rosenkranz, “Experimental Investigations of ModeCoupling as Limiting Effect Using Mode Group Diversity Multiplexing onGI-MMF,” in Proc. European Conference on Optical Communications, paperWe3.P.87, Cannes, France, 2006.
[69] S. Schollmann and W. Rosenkranz, “Experimental Equalization of Crosstalkin a 2 × 2 MIMO System Based on Mode Group Diversity Multiplexingin MMF Systems @ 10.7 Gb/s,” in Proc. European Conference on OpticalCommunications, paper 7.4.2, Berlin, Germany, 2007.
REFERENCES 115
[70] M. Webster, L. Raddatz, I. H. White, and D. G. Cunningham, “A StatisticalAnalysis of Conditioned Launch for Gigabit Ethernet Links Using MultimodeFiber,” IEEE/OSA J. Lightwave Technol., vol. 17, pp. 1532–1541, Sept.1999.
[71] P. G. Ciarlet, Introduction to numerical linear algebra and optimisation.Cambridge Univeristy Press, Cambridge, 1989.
[72] B. N. Datta, Numerical Linear Algebra and Applications. Brooks/Cole, Pa-cific Grove, 1995.
[73] G. H. Golub and C. F. van Loan, Matrix Computations. The Johns HopkinsUniveristy Press, Baltimore and London, 1996.
[74] R. Dandliker, A. Bertholds, and F. Maystre, “How Modal Noise inMultimode Fibers Depends on Source Spectrum and Fiber Dispersion,”IEEE/OSA J. Lightwave Technol., vol. LT-3, pp. 7–12, Feb. 1985.
[75] A. M. J. Koonen, “Bit-Error-Rate Degradation in a Multimode Fiber OpticTransmission Link Due to Modal Noise,” IEEE J. Sel. Areas Commun.,vol. SAC-4, pp. 1515–1522, Dec. 1986.
[76] G. C. Papen and G. M. Murphy, “Modal Noise in Multimode Fibers underRestricted Launch Conditions,” IEEE/OSA J. Lightwave Technol., vol. 17,pp. 817–822, May 1999.
[77] L. Raddatz, I. H. White, D. G. Cunningham, and M. C. Nowell, “An Ex-perimental and Theoretical Study of the Offset Launch Technique for theEnhancement of the Bandwidth of Multimode Fiber Links,” IEEE/OSA J.Lightwave Technol., vol. 16, pp. 324–331, Mar. 1998.
[78] S. S.-H. Yam and F. Achten, “Single wavelength 40 Gbit/s transmission over3.4km broad wavelength window multimode fibre,” Electron. Lett., vol. 42,pp. 592–593, May 2006.
[79] S. Randel, S. C. J. Lee, B. Spinnler, F. Breyer, H. Rohde, J. Walewski,A. M. J. Koonen, and A. Kirstadter, “1 Gbit/s Transmission with6.3 bit/s/Hz Spectral Efficiency in a 100 m Standard 1 mm Step-Index Plas-tic Optical Fibre Link Using Adaptive Multiple Sub-Carrier Modulation,” inProc. European Conference on Optical Communications, post-deadline paperTh4.4.1, Cannes, France, 2006.
[80] A. M. J. Koonen, J. Yang, M. S. Alfiad, X. Li, and H. P. A. van den Boom,“High-Capacity Data Transport via Large-Core Plastic Optical Fiber Linksusing Quadrature Amplitude Modulation,” in Proc. Optical Fiber Commu-nication Conference, paper OMR6, Anaheim, CA, USA, 2007.
116 REFERENCES
[81] P. S. Szczepanek and J. W. Berthold III, “Side launch excitation of selectedmodes in graded-index optical fibers,” OSA Appl. Opt., vol. 17, pp. 3245–3247, Oct. 1978.
[82] J. Saijonmaa, A. B. Sharma, and S. J. Halme, “Selective excitation ofparabolic-index optical fibers by Gaussian beams,” OSA Appl. Opt., vol. 19,pp. 2442–2452, July 1980.
[83] H. Roscher, M. B. Sanayeh, S. B. Thapa, and R. Michalzik, “VCSEL Arrayswith Redundant Pixel Designs for 10 Gbit/s 2-D Space-Parallel MultimodeFiber Transmission,” in Proc. European Conference on Optical Communica-tions, vol. 3, pp. 687–688, paper We4.P.093, Glasgow, UK, 2005.
[84] C. K. Asawa, “Intrusion-Alarmed Fiber Optic Communication Link Using aPlanar Waveguide Bimodal Launcher,” IEEE/OSA J. Lightwave Technol.,vol. 20, pp. 10–18, Jan. 2002.
[85] J. B. Schlager, M. J. Hackert, P. Pepeljugoski, and J. Gwinn, “Measurementsfor Enhanced Bandwidth Performance over 62.5 µm Multimode Fiber inShort-Wavelength Local Area Networks,” IEEE/OSA J. Lightwave Technol.,vol. 21, pp. 1276–1285, May 2003.
[86] M. Calzavara, R. Caponi, and F. Cisternino, “Selective Excitation of AnnularZones in Graded Index Multimode Fiber,” J. Opt. Commun., vol. 5, pp. 82–86, July 1984.
[87] At the time this investigation was carried out, Fiberdyne(http://www.fiberdyne.com/) had announced the manufacture ofsuch components.
[88] Mode Scrambler Requirements for Overfilled Launching Conditions to Mul-timode Fibers. FOTP-54, ANSI/TIA/EIA-455-54-2001, Dec. 2001.
[89] M. Wegmuller, S. Golowich, G. Giaretta, and M. Nuss, “Evolution of theBeam Diameter in a Multimode Fiber Link Through Offset Connectors,”IEEE Photon. Technol. Lett., vol. 13, pp. 574–576, June 2001.
[90] M. Duser and P. Bayvel, “2.5 Gbit/s transmission over 4.5 km of 62.5 µmmultimode fibre using centre launch technique,” Electron. Lett., vol. 36,pp. 57–58, Jan. 2000.
[91] Z. Haas and M. A. Santoro, “A Mode-Filtering Scheme for Improvement ofthe Bandwidth-Distance Product in Multimode Fiber Systems,” IEEE/OSAJ. Lightwave Technol., vol. 11, pp. 1125–1131, July 1993.
[92] A. M. J. Koonen, H. P. A. van den Boom, L. P. Bakker, J. Zeng, A. Ng’Oma,and G.-D. Khoe, “Integration of services in short-range multimode polymeroptical fibre networks by exploiting the higher-order fibre passbands,” in
REFERENCES 117
Proc. International Plastic Optical Fibers Conference, Nuremberg, Germany,2004.
[93] K. M. Patel, A. Polley, K. Balemarthy, and S. E. Ralph, “Spatially ResolvedDetection and Equalization of Modal Dispersion Limited Multimode FiberLinks,” IEEE/OSA J. Lightwave Technol., vol. 24, pp. 2629–2636, July 2006.
[94] C. K. Asawa and H. F. Taylor, “Propagation of light trapped within a set oflowest-order modes of graded-index multimode fiber undergoing bending,”IEEE/OSA J. Lightwave Technol., vol. 39, pp. 2029–2037, May 2000.
[95] D. Gloge and E. A. J. Marcatili, “Multimode Theory of Graded-CoreFibers,” Bell Syst. Tech. J., vol. 52, pp. 1563–1578, Nov. 1973.
[96] S. Kawakami and H. Tanji, “Evolution of Power Distribution in Graded-Index Fibres,” Electron. Lett., vol. 19, pp. 100–102, Feb. 1983.
[97] G. Yabre, “Comprehensive Theory of Dispersion in Graded-Index OpticalFibers,” IEEE/OSA J. Lightwave Technol., vol. 18, pp. 166–177, Feb. 2000.
[98] M. Bingle and B. P. de Hon, “Differential Mode Delay Full-wave Modelingand Various Levels of Approximations,” in Proc. of the General XXVIIthAssembly of the International Union of Radio Science, no. 2060, Maastricht,The Netherlands, 2002.
[99] J. G. Dil and H. Blok, “Propagation of Electromagnetic Surface Wavesin a Radially Inhomogeneous Optical Waveguide,” Opto-electronics, vol. 5,pp. 415–428, 1973.
[100] Y. Daido, E. Miyauchi, T. Iwama, and T. Otsuka, “Determination of modalpower distribution in graded-index optical waveguides from near-field pat-terns and its application to differential mode attenuation measurement,”OSA Appl. Opt., vol. 18, pp. 2207–2213, July 1979.
[101] O. G. Leminger and G. K. Grau, “Near-Field Intensity and Modal PowerDistribution in Multimode Graded-index Fibers,” Electron. Lett., vol. 16,pp. 678–679, July 1980.
[102] M. Rousseau and L. Jeunhomme, “Optimum index profile in multimode op-tical fiber with respect to mode coupling,” Opt. Commun., vol. 23, pp. 275–278, Nov. 1977.
[103] http://www.ieee802.org/3/aq/public/tools/.
[104] G. W. de Jong, J. R. M. Bergervoet, J. H. A. Brekelmans, and J. F. P. vanMil, “A DC-to-250MHz Current Pre-Amplifier with Integrated Photo-Diodesin Standards CBiMOS, for Optical-Storage Systems,” in Proc. of ISSCC,paper 21.8, San Francisco, CA, USA, Feb. 2002.
118 REFERENCES
[105] G. J. Meslener, “Chromatic Dispersion Induced Distortion of ModulatedMonochromatic Light Employing Direct Detection,” IEEE J. Quantum Elec-tron., vol. QE-20, pp. 1208–1216, Oct. 1984.
[106] E. E. Bergmann, C. Y. Kuo, and S. Y. Huang, “Dispersion-Induced Com-posite Second-Order Distortion at 1.5 µm,” IEEE Photon. Technol. Lett.,vol. 3, pp. 59–61, Jan. 1991.
[107] M. R. Phillips, T. E. Darcie, D. Marcuse, G. E. Bodeep, and N. J. Frigo,“Nonlinear Distortion Generated by Dispersive Transmission of ChirpedIntensity-Modulated Signals,” IEEE Photon. Technol. Lett., vol. 3, pp. 481–483, May 1991.
[108] C. Buoli, C. Esposito, and G. Mora, “AM/PM Compensation Improves Per-formances of Microwave Link Using a Multimode Optical Fibre and a Mul-timode VCSEL,” in Proc. European Microwave Conference, pp. 499–502,Amsterdam, the Netherlands, 2004.
[109] M. de Boer, Design and implementation of a Mode Group Diversity Multi-plexing optical fibre receiver system. MSc Thesis, Eindhoven University ofTechnology, the Netherlands, 2006.
[110] P. N. de la Calle, Electronic design and implementation of adaptive demulti-plexing for mode group diversity multiplexing. MSc Thesis, Eindhoven Uni-versity of Technology, the Netherlands, 2007.
[111] T. Ishigure, S. Tanaka, E. Kobayashi, and Y. Koike, “Accurate RefractiveIndex Profiling in a Graded-Index Plastic Optical Fiber Exceeding GigabitTransmission Rates,” IEEE/OSA J. Lightwave Technol., vol. 20, pp. 1125–1131, Aug. 2002.
[112] A. Kondo, T. Ishigure, and Y. Koike, “Fabrication Process and Optical Prop-erties of Perdeuterated Graded-Index Polymer Optical Fiber,” IEEE/OSAJ. Lightwave Technol., vol. 23, pp. 2443–2448, Aug. 2005.
[113] T. Ishigure, K. Ohdoko, Y. Ishiyama, and Y. Koike, “Mode-Coupling Con-trol and New Index Profile of GI POF for Restricted-Launch Condition inVery-Short-Reach Networks,” IEEE/OSA J. Lightwave Technol., vol. 23,pp. 4155–4168, Dec. 2005.
[114] K. Ohdoko, T. Ishigure, and Y. Koike, “Propagating Mode Analysis andDesign of Waveguide Parameters of GI POF for Very Short-Reach NetworkUse,” IEEE Photon. Technol. Lett., vol. 17, pp. 79–81, Jan. 2005.
[115] T. Ishigure, Y. Koike, and J. W. Fleming, “Optimum Index Profile of thePerfluorinated Polymer-Based GI Polymer Optical Fiber and Its DispersionProperties,” IEEE/OSA J. Lightwave Technol., vol. 18, pp. 178–184, Feb.2000.

REFERENCES 119
[116] G. Giaretta, W. White, M. Wegmuller, and T. Onishi, “High-Speed (11Gbit/s) Data Transmission Using Perfluorinated Graded-Index Polymer Op-tical Fibers for Short Interconnects (¡100 m),” IEEE Photon. Technol. Lett.,vol. 12, pp. 347–349, Mar. 2000.
[117] S. E. Golowich, W. White, W. A. Reed, and E. Knudsen, “QuantitativeEstimates of Mode Coupling and Differential Modal Attenuation in Per-fluorinated Graded-Index Plastic Optical Fiber,” IEEE/OSA J. LightwaveTechnol., vol. 21, pp. 111–121, Jan. 2003.


Appendix A
List of Acronyms
A/D analog-to-digitalCATV cable televisionCCD charge-coupled deviceCDM code division multiplexingCDMA code division multiple accessCWDM coarse wavelength division multiplexingDSL digital subscriber lineDWDM dense wavelength division multiplexingFC fiber concentratorFC/PC fixed-connection/physical-contactFDM frequency division multiplexingFFT fast Fourier transformFTTH fiber to the homeFTTP fiber to the premisesFWHM full width at half maximumGI-GOF graded-index glass optical fiberGI-MMF graded-index multimode fiberGI-POF graded-index polymer optical fiberGOF glass optical fiberHOMs higher order modesIM-DD intensity-modulation direct-detectionIP internet protocolLAN local area networkLED light emitting diodeLOMs lower order modesLP linearly polarizedLPF low-pass filterMFD mode field diameterMGDM mode group diversity multiplexing

122 List of Acronyms
MIMO multiple-input multiple-outputMMF multimode fiberMSSF mode-selective spatial filteringNA numerical apertureNAPF normalized annular power fluxNFP near-field patternOC optical cross-talkPCS plastic-clad silicaPD photodiodePDIC photodiode integrated circuitPDM polarization division multiplexingPF perfluorinatedPMG principal mode groupPMMA polymethylmethacrylatePOF polymer optical fiberRHS right-hand sideRIN relative intensity noiseSCM subcarrier multiplexingSI-MMF step-index multimode fiberSI-POF step-index polymer optical fiberSISO single-input single-outputSMF single-mode fiberSNR signal-to-noise ratioTDM time division multiplexingTLS tunable laser sourceVOA variable optical attenuatorWDM wavelength division multiplexing

Appendix B
List of Publications
Journal Papers
1. C. P. Tsekrekos and A. M. J. Koonen, “Mode-selective spatial filtering forincreased robustness in a mode group diversity multiplexing link,” OSA Opt.Lett., vol. 32, pp. 1041–1043, May 2007.
2. C. P. Tsekrekos, R. W. Smink, B. P. de Hon, A. G. Tijhuis, and A. M. J.Koonen, “Near-field intensity pattern at the output of silica-based graded-index multimode fibers under selective excitation with a single-mode fiber,”OSA Opt. Express, vol. 15, pp. 3656–3664, Apr. 2007.
3. C. P. Tsekrekos, M. de Boer, A. Martinez, F. M. J. Willems, and A. M. J.Koonen, “Temporal Stability of a Transparent Mode Group Diversity Mul-tiplexing Link,” IEEE Photon. Technol. Lett., vol. 18, pp. 2484–2486, Dec.2006.
4. C. P. Tsekrekos, A. Martinez, F. M. Huijskens, and A. M. J. Koonen, “De-sign Considerations for a Transparent Mode Group Diversity MultiplexingLink,” IEEE Photon. Technol. Lett., vol. 18, pp. 2359–2361, Nov. 2006.
5. T. Houbavlis, K. E. Zoiros, G. Kanellos, and C. Tsekrekos, “Performanceanalysis of ultrafast all-optical Boolean XOR gate using semiconductor op-tical amplifier-based Mach-Zehnder Interferometer,” Opt. Commun., vol. 232,pp. 179–199, 2004.
International Conferences
6. C. P. Tsekrekos and A. M. J. Koonen, “Effectiveness of mode-selective spa-tial filtering in mode group diversity multiplexing links,” in Proc. OptoElec-
124 List of Publications
tronics and Communications Conference/International Conference on Inte-grated Optics and Optical Fiber Communication, paper 12A3-2, Yokohama,Japan, 2007.
7. C. P. Tsekrekos, M. de Boer, A. Martinez, F. M. J. Willems, and A. M. J.Koonen, “Demonstration of a Transparent 2-Input 2-Output Mode GroupDiversity Multiplexing Link,” in Proc. European Conference on OpticalCommunications, paper We3.P.145, Cannes, France, 2006.
8. C. P. Tsekrekos, M. de Boer, A. Martinez, F. M. J. Willems, and A. M. J.Koonen, “Experimental Study of the Temporal Behaviour of a Mode GroupDiversity Multiplexing Link,” in Proc. Conference on Lasers and Electro-Optics/Quantum Electronics and Laser Science Conference and PhotonicApplications Systems Technologies, paper CMJ6, Long Beach, CA, USA,2006.
9. C. P. Tsekrekos, A. Martinez, F. M. Huijskens, and A. M. J. Koonen, “ModeGroup Diversity Multiplexing Transceiver Design for Graded-Index Multi-mode Fibres,” in Proc. European Conference on Optical Communications,paper We4.P.113, Glasgow, UK, 2005.
10. M. de Boer, C. P. Tsekrekos, A. Martinez, H. Kurniawan, J. W. M. Bergmans,A. M. J. Koonen, H. P. A. van den Boom, and F. M. J. Willems, “A firstdemonstrator for a mode group diversity multiplexing communication sys-tem,” in Proc. IEE Seminar on Optical Fibre Communications and Elec-tronic Signal Processing, London, UK, 2005.
Regional Conferences
11. C. P. Tsekrekos and A. M. J. Koonen, “Mode Group Diversity Multiplexingover Graded-Index Polymer Optical Fiber Links,” in Proc. IEEE/LEOSSymposium Benelux Chapter, accepted for publication, Brussels, Belgium,2007.
12. C. P. Tsekrekos and A. M. J. Koonen, “The Effect of Passive Optical Compo-nents in Multimode Fibre Links Using Mode Group Diversity Multiplexing,”in Proc. IEEE/LEOS Symposium Benelux Chapter, pp. 185–188, Eindhoven,The Netherlands, 2006.
13. C. P. Tsekrekos, M. de Boer, A. Martinez, H. Kurniawan, F. M. J. Willems,and A. M. J. Koonen, “An Experimental Investigation of the Mode Group Di-versity Multiplexing Technique,” in Proc. IEEE/LEOS Symposium BeneluxChapter, pp. 161–164, Mons, Belgium, 2004.

125
14. C. P. Tsekrekos, A. M. J. Koonen, and H. P. A. van den Boom, “Selective Ex-citation of Graded-Index Multimode Fibres Resulting in Annular Near FieldPatterns,” in Proc. IEEE/LEOS Symposium Benelux Chapter, pp. 211–214,Ghent, Belgium, 2004.
15. R. W. Smink, C. P. Tsekrekos, B. P. de Hon, A. M. J. Koonen, and A. G. Ti-jhuis, “Near Field Pattern Simulations of Graded-Index Multimode Fibres,”in Proc. IEEE/LEOS Symposium Benelux Chapter, pp. 257–260, Eindhoven,The Netherlands, 2006.

Samenvatting
Mode groep diversiteit multiplexing in multimode vezel trans-missiesystemen
Multimode vezels (multimode fibers, MMFs) met een geleidelijk veranderendebrekingsindex in de radiele richting (graded index, GI) worden veelal gebruiktin lokale netwerken op campussen en binnen gebouwen. Ook voor de wat kleinerethuisnetwerken kan de MMF in de toekomst een interessante optie zijn. Naast deop silicium gebaseerde MMF vormt de polymeer optische vezel (polymer opticalfiber, POF) ook een interessant alternatief. Dit vanwege zijn grote diameter en deflexibiliteit van het gebruikte materiaal, welke plaatsing in kabelgoten vergemakke-lijkt. Verder kan een MMF verbinding een grotere bandbreedte bieden dan eenelektronische (draadloze) verbinding. Licht in een MMF propageert in verschei-dene spatiele modi. De bandbreedte van MMF verbindingen wordt gelimiteerddoor modale dispersie, welke onstaat door de verschillende propagatiesnelhedenvan de modi. Tegelijkertijd creeren deze spatiele modi extra vrijheidsgraden, diekunnen worden gebruikt om een meer breedbandige overdracht te verkrijgen.
De meeste MMF systemen maken gebruik van licht intensiteit modulatie endirecte detectie (IM-DD). IM-DD is de meest eenvoudige manier om een op-tische communicatie verbinding tot stand te brengen. Voor de velden van depropagerende modi in een MMF bestaat een orthogonaliteitsrelatie. Echter, ietsvergelijkbaars bestaat niet voor de intensiteits profielen van de modi. OmdatMMFs veelal worden gebruikt voor korte afstanden waar eenvoud en kosten bepal-end zijn, moet iedere poging die wordt ondernomen om gebruik te maken vande spatiele modi ook simpel en pragmatisch zijn. De ontwikkeling van de zo-genaamde MIMO technieken in draadloze communicatie systemen, waar tegeli-jkertijd meerdere antennas als zender en ontvanger worden gebruikt, heeft ookvoor MMF verbindingen als inspiratiebron gediend. Tot dusver zijn er al enkeleschema’s voorgesteld. Een ervan is mode groep diversiteit multiplexing (MGDM).Met behulp van de MGDM techniek kunnen onafhankelijke kanalen worden ge-creeerd door gebruik te maken van propagerende modale groepen. MGDM ge-bruikt IM-DD, maar orthogonaliteit van de verschillende intensiteits profielen vande waargenomen modale groepen is niet vereist omdat overspraak met behulp vanelektronische signaalverwerking kan worden onderdrukt.
Naar ons inziens is dit het eerste proefschrift waarin zowel een theoretisch alseen experimenteel onderzoek wordt verricht naar de MGDM techniek. De inhoud
128 Samenvatting
van dit proefschrift gaat hoofdzakelijk over de optische aspecten van MGDM sig-naaloverdracht door GI-MMFs. Hiervoor is een mathematisch model ontwikkeld.De voorwaarden waaronder een breedbandig MGDM systeem kan worden be-schreven met een reele transmissiematrix zijn gespecificeerd. Deze matrix relateertontvangen elektrische signalen aan verzonden elektrische signalen. In het meestalgemene geval moeten de velden van de verscheidene modale groepen aan de uit-gang van de GI-MMF onderling incoherent zijn, ongeacht de hoeveelheid spatieleoverlap tussen de betreffende velden. De reele transmissiematrix drukt de spatieleoverlap tussen de intensiteitsprofielen van de ontvangen modale groepen uit enkan niet compenseren voor differentiele vertragingen in het systeem. Daarom ishet noodzakelijk dat het MGDM systeem opereert beneden de dispersie limiet.Daarnaast is het effect van ruis onderzocht waarbij matrix inversie als het demul-tiplexing algoritme wordt beschouwd. Dit is in lijn met de noodzaak om het kanaaltransparant te maken met betrekking tot de signaal modulatie.
De mogelijkheid tot het bouwen van een eenvoudig, doch stabiel MGDM sys-teem dient als een hoofddoel van dit proefschrift. Richtlijnen voor het ontwerpvan zo’n systeem worden gegeven en concrete conclusies zijn verkregen, welke ge-bruikt kunnen worden voor het ontwerpen en realiseren van een MGDM multi/de-multiplexer. Uit experimentele waarnemingen volgt dat propagatie in GI-MMFsgeen effect heeft op het ontwerp van een multi/demultiplexer voor afstanden tot1 km. Numerieke simulaties zorgen voor een onderbouwing van deze waarnemin-gen. Voor GI-POFs geldt dat de modale koppeling sterker is dan bij GI-MMFs.Dit heeft als gevolg dat de bijbehorende transmissiematrix in hoge mate beınvloedwordt door de lengte van de GI-POF. Daar komt bij dat de GI-POF gevoeliger isvoor druk en buigingen. Een stabiele 2× 2 MGDM verbinding is gerealiseerd metbehulp van een op silicium gebaseerde GI-MMF, gebruikmakend van componentendie normaliter gebruikt worden voor andere toepassingen.
Het voorgestelde ontwerpproces voor een MGDM systeem heeft profijt van deelektronische vermindering van overspraak. Toch ontbreekt er een schaalbaarheidnaar het aantal kanalen. Hoewel het mogelijk blijkt een robuust systeem bestaandeuit twee of drie kanalen te realiseren, wordt bij toepassing van nog meer kanalenhet succes negatief beınvloed door de hoge gevoeligheid van de transmissiematrix.Het meest ideale geval vormt een systeem zonder overspraak, d.w.z. een systeemdat gekarakteriseerd wordt door de eenheidsmatrix. Om de robuustheid van eenMGDM syteem te vergroten en tevens een groot aantal kanalen te realiseren, ismodale selectieve spatiele filtering (MSSF) geıntroduceerd.
MSSF is een nieuwe optische techniek, dat werd onderzocht in het kader vanhet onderzoeksplan voor dit proefschrift. Het maakt enkel gebruik van een afbeeld-ingssysteem, bijvoorbeeld een lens, om het intensiteitspatroon aan het einde vande MMF op de detectoren te projecteren. De numerieke apertuur (NA) van hetafbeeldingssysteem moet kleiner zijn dan de centrale NA van de GI-MMF. MSSFbiedt een optische manier om overspraak te reduceren. Voor een systeem bestaandeuit maximaal drie kanalen kan MSSF de noodzaak van elektronisch demultiplexenelimineren. Daarnaast kan met behulp van MSSF en partiele elektronische over-

129
spraak vermindering een robuust vijfkanaals MGDM systeem worden gerealiseerd.De noodzaak voor onderlinge incoherentie tussen de velden van de modale groepenaan de uitgang van de GI-MMF wordt door MMSF sterk gereduceerd. Een com-binatie van MGDM met golflengte divisie multiplexing is hierdoor mogelijk.
De getoonde resultaten in dit proefschrift geven inzicht in lichtpropagatie doorGI-MMFs en heeft ons een nieuwe invalshoek gegeven voor het gebruik van depropagerende modi van de GI-MMF voor transmissie doeleinden. Een stabiel,robuust en transparant vijfkanaals modaal multiplexing systeem leek aanvankelijkslechts een hersenschim. Toch laat dit proefschrift zien dat deze fantasie realiteitkan worden.

Acknowledgements
On the occasion of the completion of my doctoral thesis, I would like to take theopportunity to thank the people who helped me with their support.
First, I would like to thank my promoter Prof. Ton Koonen for offering methe opportunity to carry out my research in the Electro-optical Communication(ECO) group of the Eindhoven University of Technology (TU/e). His commentsand suggestions in the last years helped me develop my personal research approachand present my results in a clear way. Next to this, I would like to thank him forreviewing my PhD thesis.
My research work in the Mode Group Diversity Multiplexing (MGDM) projectrequired the cooperation with the Signal Processing Systems (SPS) group of theTU/e, and more specifically with Alfonso Martinez, Dr. Frans Willems and Prof.Jan Bergmans. I would like to thank Alfonso Martinez for the many discussionson several topics of optical communications and his input as co-author of severalpublications. His support on my early stage of writing scientific papers was sig-nificant. I would like to acknowledge Dr. Frans Willems and Prof. Jan Bergmansfor their contribution to the development of the MGDM demonstrator. I wouldfurther like to thank Prof. Jan Bergmans for acting as the second promoter of mythesis and for his comments on the manuscript.
During my research, I had the chance to cooperate with Dr. Bas de Hon andRutger Smink from the Electromagnetics group of the TU/e. I wish to thank themfor our cooperation in the study of the near-field pattern of silica-based graded-index multimode fibers and the several interesting discussions we had. Further,I would like to thank Dr. Bas de Hon for acting as the co-promoter of my thesisand for his comments on my work, as well as Rutger Smink for translating thesummary of my thesis into Dutch.
In the frame of the MGDM project, I was co-supervisor of three students ofthe SPS group, namely Marcel de Boer, Helmi Kurniawan and Pablo Nunez de laCalle. I wish to thank them for their contribution to the implementation of theelectronic part of the MGDM demonstrator. I would especially like to acknowledgeMarcel de Boer for his work on the data acquisition system of the laboratory thatwas used to measure the temporal stability of the MGDM system.
From the ECO group, I would like to thank Prof. Giok-Djan Khoe for hisavailability and his comments on several of my published papers, as well as Henrie
132 Acknowledgements
van den Boom for his interest in MGDM and his contribution to the MGDMproject, as well as for his comments on my work, some of my papers and mythesis. Further, I am indebted to Frans Huijskens for his support and guidancein the laboratory facilities. In addition, I would like to thank Daniel Baez Puche,Jose Machado, Jorge Caetano Alves and Pedro Filipe da Costa Teixeira for theircontribution to the development of the experimental setup for the study of thenear-field pattern of multimode fibers under selective excitation. I would also liketo thank Susan de Leeuw who together with Els Gerritsen and more recently JoseHakkens try to do their best to help the ECO group members in administrativeand other matters.
I am grateful to the Freeband Impulse Program of the Ministry of EconomicAffairs of the Netherlands for financially supporting my research. In addition, Iwould like to thank Dr. Piet Matthijsse, Dr. Frank den Hartog, Dr. Jeroen Wellen,Dr. Sel Colak, and Dr. Fred Snijders for their comments and suggestions as mem-bers of the users’ committee of the MGDM project, as well as Dr. Frank Karelse(Technology Foundation STW) for managing the project. I would also like tothank Dr. Alexander van der Lee (Philips Research Laboratories) for providingthe PDIC. I would further wish to thank Dr. Piet Matthijsse (Draka Comteq)for providing the silica-based multimode fiber samples, for his openness and in-teresting discussions, as well as for reviewing my thesis as a member of the corecommittee of my PhD promotion. I am equally grateful to Prof. Ian White andDr. Huug de Waardt for reviewing my thesis as members of my PhD core com-mittee. Further, I wish to thank Dr. Takaaki Ishigure from Keio University, forproviding the polymer optical fiber sample.
There are certainly many people who, although not directly related to mywork, have one way or another contributed so as to make my work and aca-demic life more enjoyable and often easier. I wish therefore to thank very muchDr. Jarek Turkiewicz, Dr. Juan Jose Vegas Olmos, Dr. Shaoxian Zhang, Dr. YongLiu, Dr. Hyun-Do Jung, Dr. Zhonggui Li, Dr. Oded Raz, Dr. Nicola Calabretta,Dr. Eduward Tangdiongga, Prof. Harm Dorren, Jianming Zeng, as well as Ni Yan,Jia Yang, Maria Garcıa Larrode, Jeffrey Lee, Archi Delphinanto, Bas Huiszoon,Patryk Urban, Kun Wang, Hejie Yang, Youbin Zheng, Rene Kramer, Dr. ErwinVerdurmen, Dr. Anthony Ng´oma, Arvind Mishra, Dr. Xuelin Yang, Dr. FranciscoSoares, Georgi Petkov, Dr. Javier Molina Vazquez, Dr. Kevin Williams, Prof. An-ton Tijhuis, Dr. Idelfonso Tafur Monroy, Johan van Zantvoort, Dr. HeongkyuJu, Peter van Bennekom, Dr. Javier Herrera Llorrente, Poh Ling Neo, and HansChristian Hansen Mulvad.
The completion of my PhD work would not have been possible without theconstant support of my family and friends, who throughout the years have offeredme their help and have always encouraged me to take new steps. It is because oftheir love and support that I still feel like taking risks to further explore myselfand the world.

Curriculum Vitæ
Christos P. Tsekrekos was born in Athens, Greece, in 1980. He is a graduateengineer of the Faculty of Electrical and Computer Engineering of the NationalTechnical University of Athens (2003). His graduation thesis concerned the simula-tion of an all-optical XOR gate using an SOA-MZI structure. In 2001, he spent anacademic semester at the Technical University of Denmark, supported by a scholar-ship from the European exchange program Erasmus/Socrates. In 2003, he carriedout a six-week internship at the Institute of Applied Optics, in Warsaw, Poland.This internship was organized by the International Association for the Exchangeof Students for Technical Experience. Since February 2004, he has been with theElectro-optical Communication group of the Eindhoven University of Technology,the Netherlands, working towards his PhD degree. His research has been focusedon multimode fiber communications. In particular, it involves the study of modegroup diversity multiplexing, a novel optical multiple-input multiple-output tech-nique. Christos P. Tsekrekos is the first author of four international journal papersand his research has been presented in several international and regional confer-ences. His work has been cited in at least 14 international journal/conferencepapers by other authors. He serves as a reviewer for the IEEE/OSA Journal ofLightwave Technology.


![SILICON MULTIMODE PHOTONIC INTEGRATED DE- VICES FOR …jpier.org/PIER/pier143/38.13111003.pdf · photonic multiplexing technologies [3], including wavelength-division-multiplexing](https://static.fdocuments.in/doc/165x107/5ecb1c5092fee2156248d38c/silicon-multimode-photonic-integrated-de-vices-for-jpierorgpierpier14338-.jpg)