
MOCAGE last results for AMMA
25
MOCAGE last results for AMMA Béatrice Josse,Météo-France CNRM/GMGEC/CARMA Paris Workshop, Sept 16-17 2008
-
Upload
flynn-bonner -
Category
Documents
-
view
25 -
download
0
description
MOCAGE last results for AMMA. Béatrice Josse,Météo-France CNRM/GMGEC/CARMA. Paris Workshop, Sept 16-17 2008. Plan. I Configuration and experiments II A global / integrated overview III What happens on Africa On the ground In the lower troposphere On the whole vertical - PowerPoint PPT Presentation
Transcript of MOCAGE last results for AMMA

MOCAGE last results for AMMA
Béatrice Josse,Météo-France
CNRM/GMGEC/CARMA
Paris Workshop, Sept 16-17 2008
Plan
I Configuration and experiments
II A global / integrated overview
III What happens on Africa
– On the ground– In the lower troposphere– On the whole vertical
IV Partial conclusions, future plans and questions

GLOBE 2°x2°
AMMA 0.5°x0.5° MOCAGE
47 hybrid levelsChemscheme : RACMOBUS (strato-tropo)
Subgrid parameterization :
- convection (Bechtold, 2001)
- scavenging (Mari et al, 2000 + Liu et al, 2001)
- dry deposition (Wesely, 1989)
- eddy diffusion (Louis, 1979)
Resolved-scale transport :
Semi-lagrangian (Williamson et Rasch,1989)
MOCAGE configuration for AMMA
I Config. and Exp.
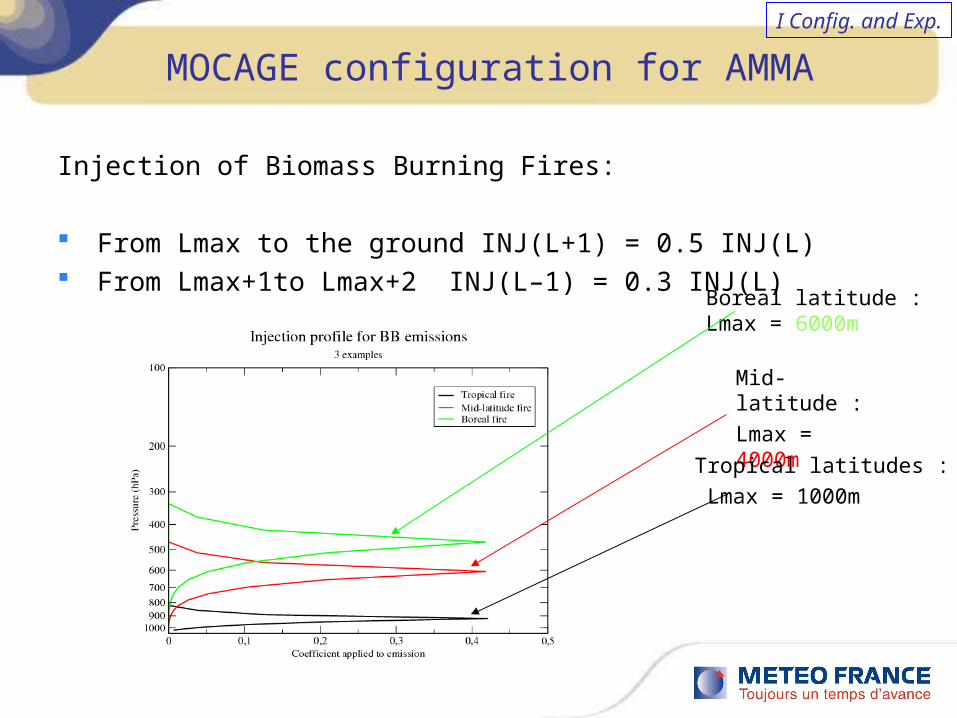
MOCAGE configuration for AMMA
Injection of Biomass Burning Fires:
From Lmax to the ground INJ(L+1) = 0.5 INJ(L) From Lmax+1to Lmax+2 INJ(L–1) = 0.3 INJ(L)
Boreal latitude : Lmax = 6000m
Mid-latitude :
Lmax = 4000m
Tropical latitudes :
Lmax = 1000m
I Config. and Exp.

Experiments
Experiment
Emissions Meteorology
A 2006 Hybrid 2000 Arpege
B 2006 Hybrid 2006Arpege Tropiques
C 2000 Hybrid 2000Arpege
Hybrid : LA emissions on Africa, RETRO-2000 + GFED elsewhere
I Config. and Exp.

Emissions
Emissions of CO and NOx for Experiment B :
Specie FFBF BB Biogen Total
CO 458.75 521.25 100.75 1080.75 Tg CO
NOx 27.82 7.86 4.99 40.67 Tg N
I Config. and Exp.

Global overview Ozone total columns
MOCAGE Observations
January
April
II Global and integrated overview.

Global overviewOzone total columns
MOCAGE Observations
August
October
The model runs stable throughout 2006
II Global and integrated overview.

Global overview Ozone tropospheric columns
Jan
Apr
MOCAGE TES Obs
II Global and integrated overview.
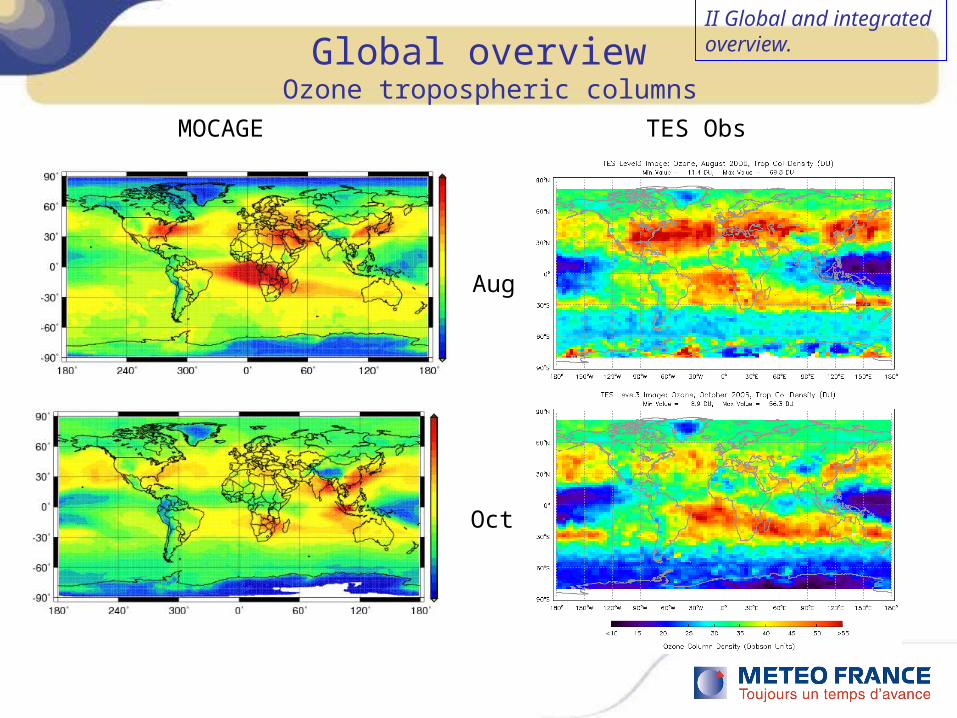
Global overview Ozone tropospheric columns
MOCAGE TES Obs
Aug
Oct
II Global and integrated overview.
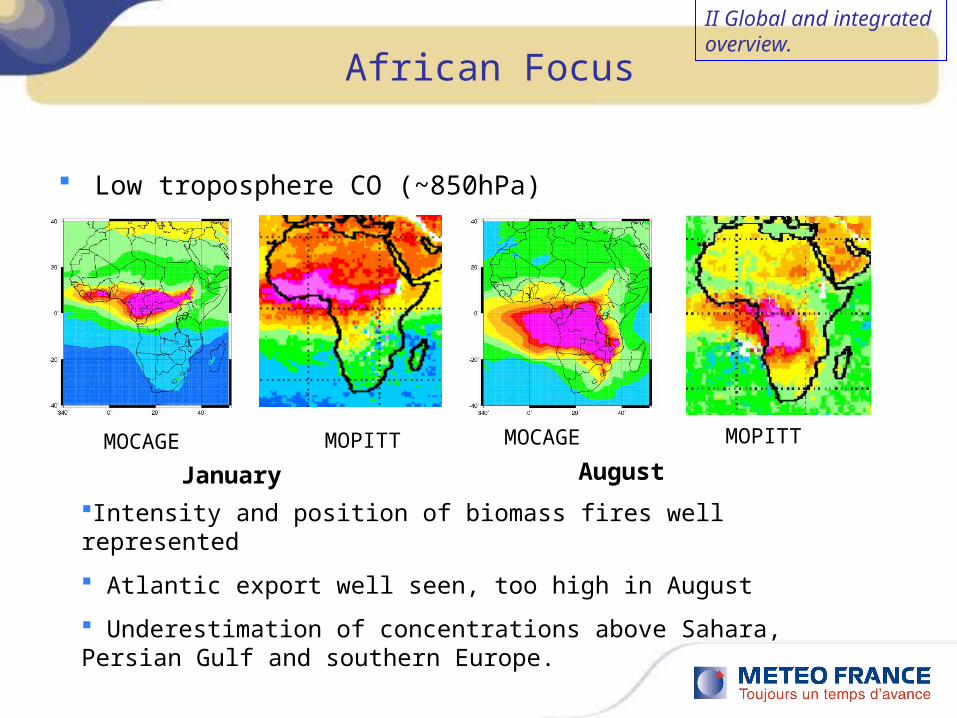
African Focus
Low troposphere CO (~850hPa)
January AugustMOCAGE MOPITT MOCAGE MOPITT
Intensity and position of biomass fires well represented
Atlantic export well seen, too high in August
Underestimation of concentrations above Sahara, Persian Gulf and southern Europe.
II Global and integrated overview.
African Focus
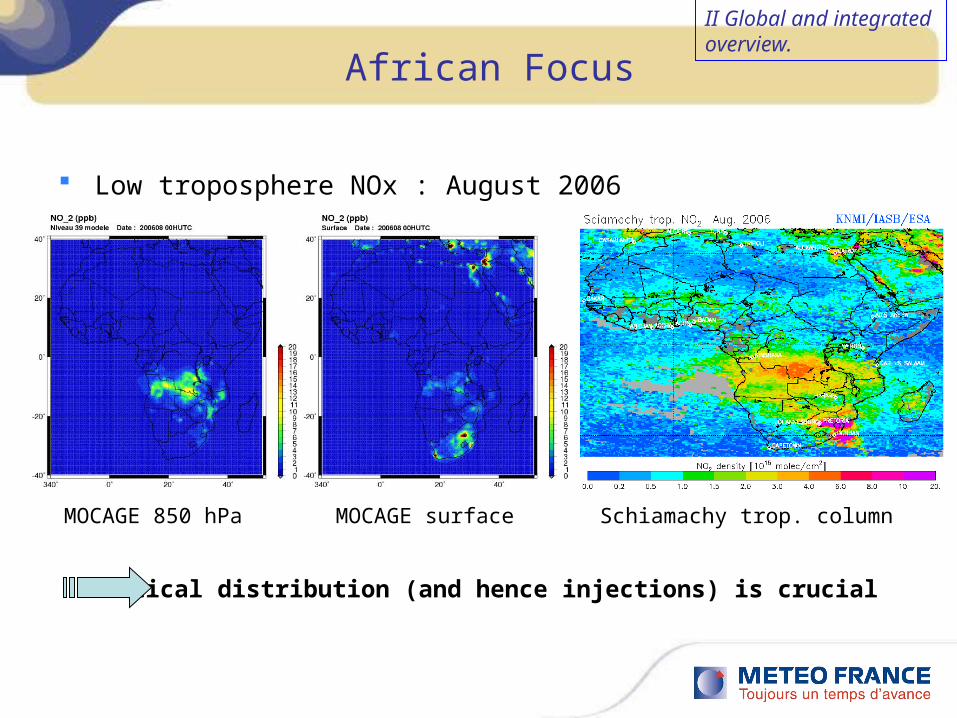
Low troposphere NOx : August 2006
MOCAGE 850 hPa MOCAGE surface Schiamachy trop. column
Vertical distribution (and hence injections) is crucial
II Global and integrated overview.

Ozone and NOx annual cyclesat Nangatchori
Ozone and NOx annual cycles well seen Evidence of a lack in NOx ground emissions Waiting for other IDAF sites observations.
IIIAfrica : at the ground

AMMA campaignCotonou August Ozone Radio-Soundings
Ozone at different levels in August 2006
surface 850 hPa 600 hPa
Cotonou
IIIAfrica : on the vertical

AMMA campaignCotonou August Ozone Radio-Soundings
•Some patterns very well reproduced, some other missed•Too much ozone at the surface•Chemical tropopause OK.
IIIAfrica : on the vertical

Amma flightsOzone data (M55 data missing)
MOCAGE Observations
IIIAfrica : on the vertical
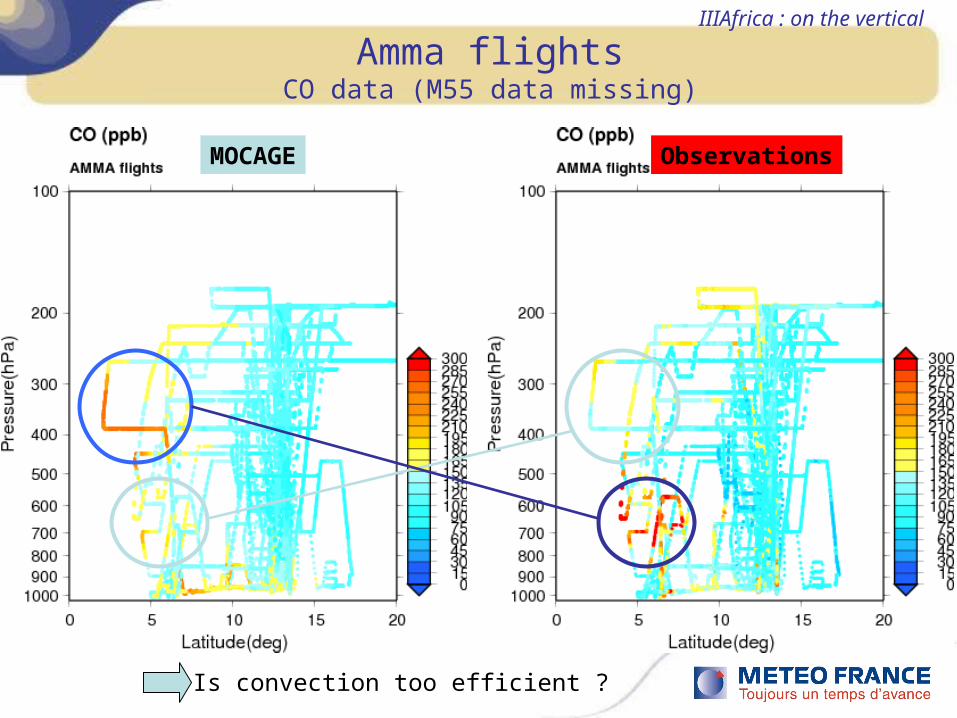
Amma flightsCO data (M55 data missing)
MOCAGE Observations
IIIAfrica : on the vertical
Is convection too efficient ?
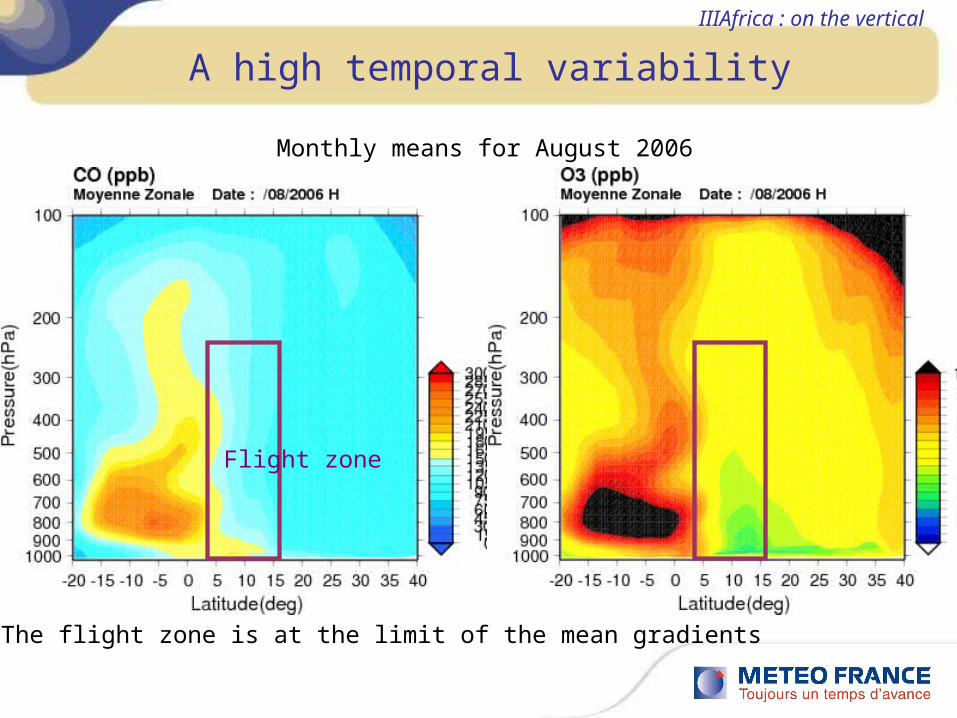
A high temporal variability
Monthly means for August 2006
IIIAfrica : on the vertical
Flight zone
The flight zone is at the limit of the mean gradients

A high temporal variability
Emissions are the same throughout the month
IIIAfrica : on the vertical

Conclusions
Correct behaviour of MOCAGE, in a global point of view, for CO and Ozone.
NOx still have to be investigated. First results seem to point out a relatively good agreement, but ground emissions are lacking. LiNOx to be systematically included.
Very high temporal variability in the model, despite constant emissions during a month. Sometimes patterns are captured, sometimes not : Emissions or meteorology?
IV Conclusions and plans

Other species have to be looked at : for instance, HCHO seems right, OH seems to be high compared to other models. PAN, HNO3 and H2O2 not yet analysed.
Tracer experiments have to be carefully used to explain models behaviour
New observations will be (hopefully) soon available, like depositions.
New experiments will be made (D, with higher frequency emissions)
Plans, questions and remarks…
IV Conclusions and plans
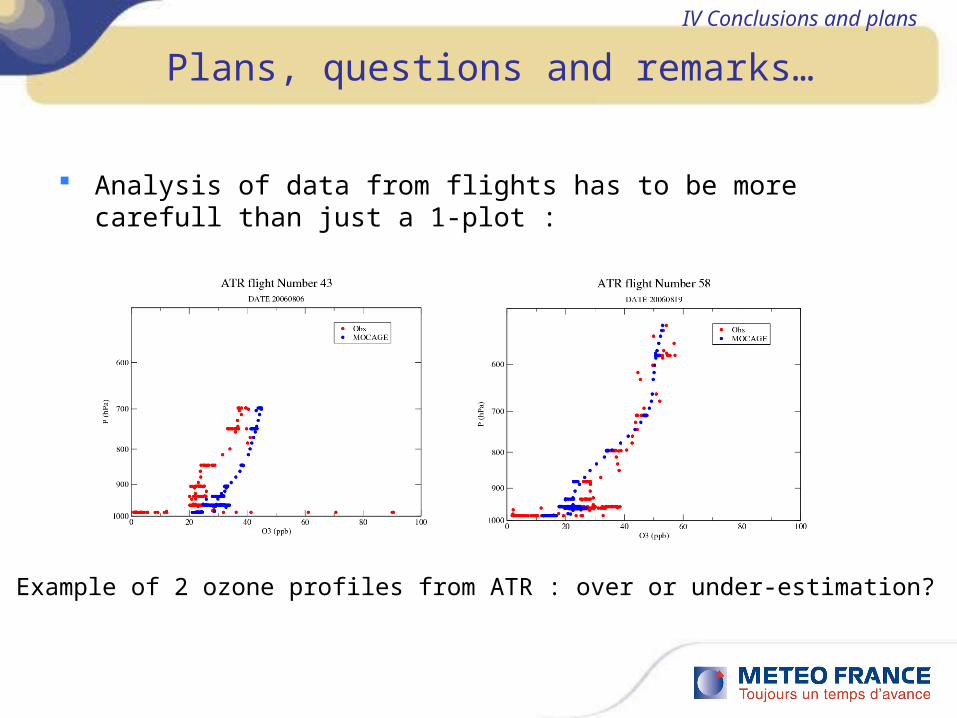
Plans, questions and remarks…
Analysis of data from flights has to be more carefull than just a 1-plot :
IV Conclusions and plans
Example of 2 ozone profiles from ATR : over or under-estimation?
Plans, questions and remarks…
New experiment (D) + baseline runs + sensitivity to meteorology = lots of experiments ! In the frame of the intercomparison, we need to find performant tests, the amount of data to is at the moment too high
The question of emissions is still important : what about biogenics?
IV Conclusions and plans


Biogenic emissions (Tg C or N)
E040S59M00IP CO 43.18523
E013S59M90IP HC3 174.6670
E014S59M90IP HC5 49.82963
E015S59M90IP HC8 9.863806
E016S59M90IP ETE 4.931903
E023S59M90IP KET 19.98766
E005S71M00IP NOx 4.999860
E025S90M90GE ISO 503
E026S00M90IP API 127
E027S00M90IP LIM 260