mobilizing our world - AT&T · mobilizing our world ... your common stock account, including stock...
80
mobilizing our world AT&T INC. 2013 ANNUAL REPORT
Transcript of mobilizing our world - AT&T · mobilizing our world ... your common stock account, including stock...

AT&T Inc.208 S. Akard St. Dallas, TX 75202
att.com
mobilizing our world AT&T Inc. 2013 AnnuAl RepoRT

STOCKHOLDER INFORMATIONToll-Free Stockholder Hotline
Call us at 1-800-351-7221 between 8 a.m. and 7 p.m. Central time, Monday through Friday (TDD 1-888-403-9700) for help with:
• Common stock account inquiries
• Requests for assistance with your common stock account, including stock transfers
• Information on The DirectSERVICETM Investment Program for Stockholders of AT&T Inc. (sponsored and administered by Computershare Trust Company, N.A.)
Written Stockholder Requests
Please mail all account inquiries and other requests for assistance regarding your stock ownership to:
AT&T Inc. c/o Computershare Trust Company, N.A. P.O. Box 43078 Providence, RI 02940-3078
You may also reach the transfer agent for AT&T Inc. at [email protected] or visit the website at www.computershare.com/att
DirectSERVICE Investment Program
The DirectSERVICE Investment Program for Stockholders of AT&T Inc. is sponsored and administered by Computershare Trust Company, N.A. The program allows current stockholders to reinvest dividends, purchase additional AT&T Inc. stock or enroll in an individual retirement account.
For more information, call 1-800-351-7221.
Stock Trading Information
AT&T Inc. is listed on the New York Stock Exchange. Ticker symbol: T
Information on the Internet
Information about AT&T Inc. is available on the Internet at www.att.com
Annual Meeting
The annual meeting of stockholders will be held at 9 a.m. local time Friday, April 25, 2014, at:
Rivermill Event Centre River View Room 3715 1st Avenue Columbus, GA 31904
SEC Filings
AT&T Inc.’s U.S. Securities and Exchange Commission filings, including the latest 10-K and proxy statement, are available on our website at www.att.com/investor.relations
Investor Relations
Securities analysts and other members of the professional financial community may contact the Investor Relations staff as listed on our website at www.att.com/investor.relations
Independent Auditor
Ernst & Young LLP 2323 Victory Ave., Suite 2000 Dallas, TX 75219
Corporate Offices and Non-Stockholder Inquiries
AT&T Inc. 208 S. Akard St. Dallas, TX 75202 210-821-4105
Annual Report printed on paper containing 30% post-consumer recycled fiber content
© 2014 AT&T Intellectual Property. All rights reserved. AT&T, the AT&T logo and all other marks contained herein are trademarks of AT&T Intellectual Property and/or AT&T affiliated companies.
All brands, product names, company names, trademarks and service marks are the properties of their respective owners.
1 Performance rankings of first in 56 cities and tied for first in 37 cities out of 125 total cities studied based on RootMetrics® RootScore® reports for each city in the second half of 2013 of 4 national mobile networks that rely on scores calculated from random samples. Your experiences may vary. The RootMetrics award is not an endorsement of AT&T. Visit rootmetrics.com for more details.
2 Gartner does not endorse any vendor, product or service depicted in the Magic Quadrant and does not advise technology users to select only those vendors with the highest ratings. Gartner research publications consist of the opinions of Gartner’s research organization and should not be construed as statements of fact. Gartner disclaims all warranties, expressed or implied, with respect to this research, including any warranties of merchantability or fitness for a particular purpose. Gartner, Inc., Magic Quadrant for Global Network Service Providers (Neil Rickard, Robert F. Mason, March 2013); Magic Quadrant for Managed Hosting, North America (Douglas Toombs, Lydia Leong, Bob Gill, Tiny Haynes, Gregor Petri, April 2013); Magic Quadrant for Communications Outsourcing and Professional Services (Eric Goodness, Christine Tenneson, October 2013).
3 PCWorld/TechHive, May 23, 2013, “AT&T clocks best overall speeds with 3G/4G combo”
4 PC Magazine, June 17, 2013; http://www.pcmag.com/article2/0,2817,2420333,00.asp
AT&T ONLINE ANNUAL REPORT Experience how we’re mobilizing our world at www.att.com/annualreport2013

AT&T Inc. 20
13 Annual Report
1
TO OUR INVESTORS
We’ve entered 2014 with our industry on the cusp of a dramatic expansion. And once again, our company is poised to lead.
Over the past few years, AT&T has been a major driver of the global, mobile Internet revolution. We have invested and executed aggressively, and today our network is best in class, reaches hundreds of millions of people and comes out on top in all sorts of third-party tests for speed and reliability. We also moved early to open our network to outside innovators and broke new ground with our AT&T Foundry innovation centers, allowing us to deliver more apps and solutions to our customers faster.
All of this has helped our company create new growth platforms. And more broadly, it has helped ignite a global wave of innovation that’s transforming how we manage our lives, connect with others
and operate our businesses. It’s hard to overstate the impact of this revolution, or our company’s role in it. Simply put, we have created the framework for the fastest, largest technology transformation in our lifetime.
But the fact is, as impressive as the past several years have been, the opportunities ahead are many times greater. This next wave is being powered by a combination of ultra-fast mobile communications with access to content located in the cloud. This means that just about everything in our world will be connected, seamless and smart. Our content will follow us no matter what device we’re using. Our homes and cars will be extensions of our smartphones

AT&T
Inc.
20
13 A
nnua
l Rep
ort
2
and tablets. The highest levels of education will be accessible to millions more people wherever they are located, and advancements in healthcare will occur in ways we haven’t yet imagined.
The impact of such a connected world, on our economy and our quality of life, will be immense. Technologists and economists are just starting to get a handle on all of the implications. But it’s clear to me that the mobile, digital economy is already at the leading edge of our overall economic growth. It’s speeding commerce and creating new business models. And it’s driving a social and economic transformation that ranks with the building of the railroads and superhighways in centuries past.
So, I believe the coming years will be the most dynamic our industry has ever seen. The pace of innovation will accelerate. Customer expectations for communications that are mobile, ultra-fast and effortless will continue to soar. Network usage will grow as well, driven by ever richer data applications and a dramatic increase in video of all kinds. And for providers, all of these will make consistent investment and relentless innovation more important than ever, as new technology replaces the old much faster.
We’ve been driving toward this future for some time. And thanks to the hard work of AT&T employees, I’m confident that our company is ready to thrive in this new world, as we did in the first wave of the mobile revolution.
STRENGTH IN REVENUE GROWTH DRIVERS AT&T’s growth drivers — wireless, wireline data and managed IT services — are transforming our revenue mix
Wireline Data/Managed IT Services
Voice/Other
54%83% 29%
17%
Wireless
of AT&T’s $128.8 billion in revenues came from our key growth drivers,
which were up nearly 5 percent

AT&T Inc. 20
13 Annual Report
3
The question is: Given all of these opportunities, what are the critical components of leadership — where do we need to excel — to grow and create value for you, our shareowners?
The first key is a premier network experience. I told you a year ago that the number one story for our company in 2013 would be our network. And that turned out to be the case; we had a breakout year — reaching industry-leading levels of network quality. It started with a major multi-year initiative, called Project VIP, to deploy high-speed connectivity on a massive scale. When we launched this effort, we committed to bring the most advanced wireless service to 300 million people across the United States. We also said we would expand our U-verse fixed-line broadband service to 57 million customer locations, while delivering even faster speeds. And we laid out plans to extend fiber connections to an additional 1 million business customer locations. I’m pleased to report that we begin 2014 with these efforts ahead of schedule. And, as our network has expanded, we’ve also accelerated the growth of the services that ride on it — including launching new services in connected cars, connected homes and advanced mobile business solutions.
Now, we’re expanding on Project VIP — pushing the envelope to bring high-speed broadband connectivity to more and more customers. For example, in Austin we’ve launched a super-fast U-verse service called GigaPower. Initial speeds go up to
300 Mbps, and this year we plan to increase that to 1 Gbps — fast enough to download 25 songs in just one second. We’re looking for opportunities to bring these types of capabilities to more communities in the future.
Video already is a large and fast-growing portion of our network traffic — for everything from entertainment to user-generated content, conferencing and business applications. So, we’re moving quickly to architect and optimize our network for video. At the same time, we’re leading the industry by taking the first steps to virtualize more and more of our network functions — putting software rather than hardware at the heart of our network infrastructure. Doing this will cut development time and help us get new products to market faster. And most important, we’ve committed to upgrading all of our customers to new technology by 2020 — to deliver better service, higher speeds and more features, and do it all faster and more efficiently. We expect to start trials this year.
Second, an effortless customer experience is fundamental. AT&T has a long history of delivering personal service. Now, we’re building on that heritage to create new customer service platforms for a high-

AT&T
Inc.
20
13 A
nnua
l Rep
ort
4
Randall Stephenson Chairman, Chief Executive Officer and President
speed digital age. We’re revolutionizing our retail experience by creating stores that are more customer-focused and interactive. And we’re taking the online and mobile customer experience to the next level — everything from purchasing to making payments to connecting with an AT&T representative — so that customers can get whatever they need more quickly.
The key to success in all of these areas is talent and organizational agility. The dynamic changes underway in our industry require new skills, particularly in data analytics and software. Our industry’s pace also means we need to rethink the way we work together, so we can deliver better service, maximize creativity, move faster and adapt to changes more quickly. To get there, we’re taking a fresh look at everything from training and compensation to smart apps and technology tools that drive more collaboration and innovation. We’re also offering our employees the opportunity to earn a master’s degree in computer technology online through our partnership with Georgia Tech and Udacity. We will accelerate these efforts in 2014 and beyond.
Another critical foundation for our industry’s continued progress is a growth-oriented public policy framework. Growth only happens when we invest, and in our industry the foundation for that is wireless spectrum. It’s the lifeblood of the mobile world because it gives us the capacity to meet rising customer demand and support new services. Spectrum is
especially critical for video. That’s why we continue to encourage regulators to create a free market for spectrum and to ensure that future spectrum auctions remain open to the entire industry, so we can put our airwaves to their highest and best use.
The importance of investment — in network coverage and capacity, new services and technologies — has never been clearer than during the mobile Internet revolution. Over the past six years, AT&T has invested more capital into the U.S. economy than any other public company — and more than $140 billion when you combine capital and spectrum-driven acquisitions. To sustain this kind of investment across our industry while driving vigorous competition, it’s important that policymakers let old regulations fall away as the technologies they support become obsolete. When

AT&T Inc. 20
13 Annual Report
5
that happens, customers win, our overall economy grows faster and the pace of innovation soars. I’m encouraged that policymakers at every level increasingly share this view.
There’s one other component that’s critical for our industry’s sustained growth — that’s our customers’ trust. The simple fact is, if customers do not have confidence that their communications and personal information are kept private and secure, in strict adherence with the law, they will be less likely to use those services. In response to these concerns, we’ve built multiple layers of security into our network, and we are committed to being clear and transparent about how we protect customer information.
The debate about government surveillance programs and protecting personal privacy while providing national security is a healthy one. It’s important that policymakers worldwide strike the right balance, so that people can continue to enjoy the benefits of technology and communications with confidence. For our part, to provide transparency, we plan to publish a report on the number of law enforcement requests for customer information. At the end of the day, all companies are compelled to comply with the law. So it’s also important that governments provide clear guidance on what the law requires companies to do when it comes to government surveillance and requests for customer information.
AT&T: THE NATION’S MOST RELIABLE 4G LTE NETWORKAnd recognized for overall call, text and data performance
77%More than half of AT&T’s postpaid smartphone customers use an LTE-capable device; 77 percent of them use a 4G-capable device
RootMetrics® ranked AT&T 1st or tied for 1st in combined (call, text, data) performance in 93 of 125 cities tested in the second half of 2013 — more markets than any other carrier 1
Plan to be essentially complete with LTE deployment by summer 2014
SUMMER2014
Nearly 280 million people covered by AT&T 4G LTE
93OF
125

AT&T
Inc.
20
13 A
nnua
l Rep
ort
6
The final key to sustained success in our industry is a sound financial foundation, which gives us the ability to continually invest and grow our business for the long term. And at AT&T, we have that foundation. In 2013, we grew revenues to $128.8 billion, increased adjusted earnings per share by 8.2%, generated $34.8 billion in cash from operations and realized $7.0 billion more from timely disposal of non-strategic assets. In addition to investing to expand and upgrade our networks, we also increased our quarterly dividend for the 30th consecutive year, and for the second consecutive year we returned nearly $23 billion directly to shareowners through dividends and share repurchases. We also ended 2013 with our pension plan funded, keeping our commitment to our retirees and employees, and with the best credit metrics among major U.S.-based telecom companies. You have my word that this kind of financial strength, which enables us to invest in our future while returning value to you, our shareowners, will continue to be a top priority.
I’ve never seen a more exciting time in our industry. We’ve never had greater potential to improve lives, empower communities and transform businesses. At AT&T, we’re determined to do everything we can to accelerate this future. And as we do that, we will never lose sight of the fact that
having great technology and capabilities is just the start. It’s what we do with these capabilities to benefit customers and society that’s important — because in the end, the purpose of communications is to make a human connection and create a world that works for people.
We all take great pride in being part of a company that plays such an important role and that is so closely connected to the communities we serve. In addition to delivering great service every day, time and again the men and women of AT&T step up when called upon — in the face of natural disasters, helping young people succeed in school, lending a hand to neighbors in need. These things go to the heart of who we are as a company, and they underscore our enduring belief in the power of communications technology to make our world better.
For all they do, I couldn’t be more proud of the entire AT&T team. On their behalf, I thank you for your continued confidence.
Sincerely,
Randall Stephenson Chairman, Chief Executive Officer and President February 10, 2014

AT&T Inc. 20
13 Annual Report
7
AT&T’s investment in capital and spectrum to expand and
enhance our networks for our customers in 2013
$22.7B
AT&T’s returns to shareowners in 2013 through dividends
and share repurchases
$25B
2013 financial highlights
2013
2012$2.31
Reported $1.25
$2.50 Reported $3.39
solid Revenue gRowth at&t’s full-year 2013 revenues grew 1.9 percent versus 2012, excluding our divested advertising solutions unit
$126.4BReported $127.4B
$128.8B2013
2012
stRong eaRnings gRowthafter adjustments, full-year 2013 ePs was up 8.2 percent — the second straight year of growth above 8 percent
investing in ouR Business
RetuRning value to ouR owneRs

AT&T
Inc.
20
13 A
nnua
l Rep
ort
8
RECOGNITION
INNOVATION
AT&T was included in Thomson Reuters Top 100 Global Innovators list for the second year in a row
Our focus on driving innovation inside and outside of the company won the gold Stevie from the American Business Awards as the Most Innovative Tech Company of the Year
INDUSTRY LEADER
Leading industry analyst firm Gartner recognized AT&T in the Leaders Quadrant for: Global Network Service Provider; Managed Hosting, North America and Communications Outsourcing and Professional Services2
AT&T received the 2014 Frost & Sullivan M2M Communications Company of the Year Award North America
SUSTAINABILITY/ SOCIAL RESPONSIBILITY
We earned the number three spot in the inaugural Civic 50 list of America’s most community-minded companies
AT&T was ranked 1st on the annual list of Best Corporate Citizens by Corporate Responsibility Magazine
For a third year, AT&T earned a spot on the Climate Disclosure Project S&P 500 Climate Disclosure Leadership Index, the world’s largest global climate data disclosure system
For the seventh year in a row, AT&T received the Presidential Volunteer Service Award, the highest award recognizing employee volunteerism
AT&T was named to the Dow Jones Sustainability Index North America for the fourth year in a row
PEOPLE
AT&T topped Chief Learning Officer Magazine’s list of companies recognized among the 2013 Learning Elite
AT&T received a perfect score on the Human Rights Campaign’s 2014 Corporate Equality Index for the 10th year in a row
U-VERSE/HOME SOLUTIONS
AT&T was the recipient of the 2013 Frost & Sullivan Video Company of the Year Award North America
AT&T U-verse received the 2013 Frost & Sullivan North American Competitive Strategy Leadership Award in Residential Video
WIRELESS
AT&T was the recipient of the 2013 Frost & Sullivan Mobile Network Strategy Award North America for the third year in a row
AT&T’s 4G LTE network delivered faster average download and upload speeds than any competitors in PCWorld/TechHive’s most recent 20-market speed tests3
PC Magazine Named AT&T’s 4G LTE network as America’s fastest … with AT&T sweeping the top rankings in all six U.S. regions, from coast to coast. AT&T ranked first in 24 of the 30 markets tested4

AT&T Inc. | 9
Selected Financial and Operating Data 10
Management’s Discussion and Analysis of Financial Condition and Results of Operations 11
Consolidated Financial Statements 39
Notes to Consolidated Financial Statements 44
Report of Management 72
Report of Independent Registered Public Accounting Firm 73
Report of Independent Registered Public Accounting Firm on Internal Control over Financial Reporting 74
Board of Directors 75
Executive Officers 76
AT&T Inc. Financial Review 2013

10 | AT&T Inc.
Selected Financial and Operating DataDollars in millions except per share amounts
At December 31 and for the year ended: 2013 2012 2011 2010 2009
Financial Data
Operating revenues $128,752 $127,434 $126,723 $124,280 $122,513
Operating expenses $ 98,273 $114,437 $117,505 $104,707 $101,513
Operating income $ 30,479 $ 12,997 $ 9,218 $ 19,573 $ 21,000
Interest expense $ 3,940 $ 3,444 $ 3,535 $ 2,994 $ 3,368
Equity in net income of affiliates $ 642 $ 752 $ 784 $ 762 $ 734
Other income – net $ 596 $ 134 $ 249 $ 897 $ 152
Income tax expense (benefit) $ 9,224 $ 2,900 $ 2,532 $ (1,162) $ 6,091
Net Income $ 18,553 $ 7,539 $ 4,184 $ 20,179 $ 12,447
Less: Net Income Attributable to Noncontrolling Interest $ (304) $ (275) $ (240) $ (315) $ (309)
Net Income Attributable to AT&T $ 18,249 $ 7,264 $ 3,944 $ 19,864 $ 12,138
Earnings Per Common Share: Net Income Attributable to AT&T $ 3.39 $ 1.25 $ 0.66 $ 3.36 $ 2.06
Earnings Per Common Share – Assuming Dilution: Net Income Attributable to AT&T $ 3.39 $ 1.25 $ 0.66 $ 3.35 $ 2.05
Total assets $277,787 $272,315 $270,442 $269,473 $268,312
Long-term debt $ 69,290 $ 66,358 $ 61,300 $ 58,971 $ 64,720
Total debt $ 74,788 $ 69,844 $ 64,753 $ 66,167 $ 72,081
Construction and capital expenditures $ 21,228 $ 19,728 $ 20,272 $ 20,302 $ 17,294
Dividends declared per common share $ 1.81 $ 1.77 $ 1.73 $ 1.69 $ 1.65
Book value per common share $ 17.50 $ 16.61 $ 17.85 $ 18.94 $ 17.28
Ratio of earnings to fixed charges1 5.98 2.96 2.23 4.57 4.46
Debt ratio 45.0% 43.0% 38.0% 37.1% 41.4%
Weighted-average common shares outstanding (000,000) 5,368 5,801 5,928 5,913 5,900
Weighted-average common shares outstanding with dilution (000,000) 5,385 5,821 5,950 5,938 5,924
End of period common shares outstanding (000,000) 5,226 5,581 5,927 5,911 5,902
Operating Data
Wireless subscribers (000)2 110,376 106,957 103,247 95,536 85,120
In-region network access lines in service (000)1 24,639 29,279 34,054 39,211 47,534
Broadband connections (000)3 16,425 16,390 16,427 16,309 15,789
Number of employees 243,360 241,810 256,420 266,590 282,7201 Prior-period amounts are restated to conform to current-period reporting methodology.2 The number presented represents 100% of AT&T Mobility wireless subscribers.3 Broadband connections include U-verse high speed Internet access, DSL lines and satellite broadband.

AT&T Inc. | 11
Management’s Discussion and Analysis of Financial Condition and Results of OperationsDollars in millions except per share amounts
Operating revenues increased $1,318, or 1.0%, in 2013 and $711, or 0.6%, in 2012. The increases in 2013 and 2012 are primarily due to growth in wireless data and equipment revenues, reflecting the increasing percentage of wireless subscribers choosing smartphones. Higher wireline data revenues from U-verse residential customers and strategic business services also contributed to revenue growth. These increases were mostly offset by continued declines in wireline voice revenues for both years. The sale of our Advertising Solutions segment lowered revenues $1,049 in 2013 and $2,244 in 2012.
The telecommunications industry is rapidly evolving from fixed location, voice-oriented services into an industry driven by customer demand for instantly available, data-based services (including video). Our products, services and plans are changing as we transition to sophisticated, high-speed, IP-based alternatives. We are also re-designing our networks to accommodate these new demands and to take advantage of related technological efficiencies.
OVERVIEW
Operating income increased $17,482 in 2013 and $3,779, or 41.0%, in 2012. Our operating margin was 23.7% in 2013, compared to 10.2% in 2012 and 7.3% in 2011. Operating income for 2013 increased $17,578 due to a noncash actuarial gain of $7,584 related to pension and postemployment benefit plans in 2013 and an actuarial loss of $9,994 in 2012. Operating income for 2013 also reflects continued growth in wireless data revenue, and increased revenues from AT&T U-verse® (U-verse) and strategic business services. Partially offsetting these increases were continued declines in our traditional voice and data services, higher wireless equipment costs and increased expenses supporting U-verse subscriber growth. Operating income for 2012 included actuarial losses of $9,994, and reflected a partial year’s results for our sold Advertising Solutions segment. Operating income for 2011 included actuarial losses of $6,280, charges of $4,181 related to our decision to terminate the acquisition of T-Mobile USA, Inc. (T-Mobile) and noncash charges of $2,910 related to impairments of directory intangible assets.
For ease of reading, AT&T Inc. is referred to as “we,” “AT&T” or the “Company” throughout this document, and the names of the particular subsidiaries and affiliates providing the services generally have been omitted. AT&T is a holding company whose subsidiaries and affiliates operate in the communications services industry in both the United States and internationally, providing wireless and wireline telecommunications services and equipment. You should read this discussion in conjunction with the consolidated financial statements and accompanying notes. A reference to a “Note” in this section refers to the accompanying Notes to Consolidated Financial Statements. In the tables throughout this section, percentage increases and decreases that are not considered meaningful are denoted with a dash.
RESULTS OF OPERATIONS
Consolidated Results Our financial results are summarized in the table below. We then discuss factors affecting our overall results for the past three years. These factors are discussed in more detail in our “Segment Results” section. We also discuss our expected revenue and expense trends for 2014 in the “Operating Environment and Trends of the Business” section.
Percent Change
2013 vs. 2012 vs. 2013 2012 2011 2012 2011
Operating Revenues $128,752 $127,434 $126,723 1.0% 0.6%
Operating expenses Cost of services and sales 51,464 55,228 54,904 (6.8) 0.6 Selling, general and administrative 28,414 41,066 41,314 (30.8) (0.6) Impairment of intangible assets — — 2,910 — — Depreciation and amortization 18,395 18,143 18,377 1.4 (1.3)
Total Operating Expenses 98,273 114,437 117,505 (14.1) (2.6)
Operating Income 30,479 12,997 9,218 — 41.0
Interest expense 3,940 3,444 3,535 14.4 (2.6)Equity in net income of affiliates 642 752 784 (14.6) (4.1)Other income (expense) – net 596 134 249 — (46.2)
Income Before Income Taxes 27,777 10,439 6,716 — 55.4Net Income 18,553 7,539 4,184 — 80.2Net Income Attributable to AT&T $ 18,249 $ 7,264 $ 3,944 — 84.2%

Management’s Discussion and Analysis of Financial Condition and Results of Operations (continued)Dollars in millions except per share amounts
12 | AT&T Inc.
Depreciation and amortization expense increased $252, or 1.4%, in 2013 and decreased $234, or 1.3%, in 2012. The 2013 expense increase was primarily due to ongoing capital spending for network upgrades and expansion, partially offset by fully depreciated assets and lower amortization of intangibles for customer lists related to acquisitions and the sale of our Advertising Solutions segment.
The 2012 expense decrease was primarily due to the sale of our Advertising Solutions segment and lower amortization of intangibles for customer lists related to acquisitions, offset by increased depreciation associated with ongoing capital spending for network upgrades and expansion.
Interest expense increased $496, or 14.4%, in 2013 and decreased $91, or 2.6%, in 2012. The increase was due to a $581 charge related to our debt tender offers in 2013, partially offset by charges associated with early debt redemptions in 2012. Lower average interest rates offset higher average debt balances.
The decrease in interest expense for 2012 was primarily due to lower average interest rates and average debt balances, partially offset by one-time charges associated with early debt redemptions.
Equity in net income of affiliates decreased $110, or 14.6%, in 2013 and $32, or 4.1%, in 2012. Decreased equity in net income of affiliates in both periods was due to lower earnings from América Móvil, S.A. de C.V. (América Móvil), and increased expenses in our mobile payment joint venture with other wireless carriers, marketed as the Isis Mobile WalletTM (ISIS). These decreases were partially offset by earnings from YP Holdings LLC (YP Holdings).
Other income (expense) – net We had other income of $596 in 2013, $134 in 2012 and $249 in 2011. Results for 2013 included a net gain on the sale of América Móvil shares and other investments of $498, interest and dividend income of $68, and leveraged lease income of $26.
Other income for 2012 included interest and dividend income of $61, leveraged lease income of $55 and net gains on the sale of investments of $74. This income was partially offset by $57 of investment impairments. Results for 2011 included interest and dividend income of $73, leveraged lease income of $80 and net gains on the sale of investments of $97.
Income tax expense increased $6,324 in 2013 and $368 in 2012. Both increases were primarily due to an increase in income before income taxes. Our effective tax rate was 33.2% in 2013, 27.8% in 2012 and 37.7% in 2011 (see Note 11).
We expect continued growth in our wireless and wireline IP-based data revenues as we bundle and price plans with greater focus on data and video services. We expect continued declines in voice revenues and our basic wireline data services as customers choose these next-generation services.
Cost of services and sales expenses decreased $3,764, or 6.8%, in 2013 and increased $324, or 0.6%, in 2012. The 2013 expense decreased by $4,822 as a result of recording actuarial gains in 2013 and actuarial losses in 2012. Lower interconnect and long-distance expenses, lower costs associated with Universal Service Fund (USF) fees and the sale of our Advertising Solutions segment also contributed to expense declines in 2013. These decreases were partially offset by increased wireless equipment costs related to device sales and increased wireline costs attributable to U-verse subscriber growth.
Expense increases in 2012 were primarily due to increased wireline costs attributable to growth in U-verse subscribers, higher wireless handset costs related to strong smartphone sales and a higher actuarial loss on benefit plans. These increases were partially offset by lower traffic compensation costs, the sale of our Advertising Solutions segment and lower other nonemployee-related charges.
Selling, general and administrative expenses decreased $12,652, or 30.8%, in 2013 and $248, or 0.6%, in 2012. The 2013 expense decreased by $12,757 as a result of recording actuarial gains in 2013 and actuarial losses in 2012. Expense reductions in 2013 also reflect lower employee related Wireline costs, gains on spectrum transactions, lower financing-related costs associated with our pension and postretirement benefits (referred to as Pension/OPEB expenses) and the sale of our Advertising Solutions segment. These decreases were partially offset by increased charges for employee separations and higher selling and advertising expenses.
The 2012 expense decrease was primarily due to $4,181 in 2011 expenses related to the termination of the T-Mobile merger and the sale of our Advertising Solutions segment, offset by a larger actuarial loss of $3,454 and higher wireless commissions and administrative costs.
Impairment of intangible assets In 2011, we recorded noncash charges for impairments in our Advertising Solutions segment, which consisted of a $2,745 goodwill impairment and a $165 impairment of a trade name.

AT&T Inc. | 13
The former Advertising Solutions segment (sold on May 8, 2012), included our directory operations, which published Yellow and White Pages directories and sold directory advertising, Internet-based advertising and local search.
The Other segment accounted for less than 1% of our 2013 and 2012 total segment operating revenues. Since segment operating expenses exceeded revenue in both years, a segment loss was incurred in both 2013 and 2012. This segment includes results from our equity investments in América Móvil and YP Holdings, and costs to support corporate-driven activities and operations. Also included in the Other segment are impacts of corporate-wide decisions for which the individual operating segments are not being evaluated, including interest costs and expected return on plan assets for our pension and postretirement benefit plans.
The following sections discuss our operating results by segment. Operations and support expenses include certain network planning and engineering expenses; information technology; our repair technicians and repair services; property taxes; bad debt expense; advertising costs; sales and marketing functions, including customer service centers; real estate costs, including maintenance and utilities on all buildings; credit and collection functions; and corporate support costs, such as finance, legal, human resources and external affairs. Pension and postretirement service costs, net of amounts capitalized as part of construction labor, are also included to the extent that they are associated with employees who perform these functions.
We discuss capital expenditures for each segment in “Liquidity and Capital Resources.”
Segment ResultsOur segments are strategic business units that offer different products and services over various technology platforms and are managed accordingly. Our operating segment results presented in Note 4 and discussed below for each segment follow our internal management reporting. We analyze our operating segments based on segment income before income taxes. We make our capital allocation decisions based on the strategic needs of the business, needs of the network (wireless or wireline) providing services and demands to provide emerging services to our customers. Actuarial gains and losses from pension and other postemployment benefits, interest expense and other income (expense) – net, are managed only on a total company basis and are, accordingly, reflected only in consolidated results. Therefore, these items are not included in each segment’s percentage of our total segment income. Each segment’s percentage of total segment operating revenue and income calculations is derived from our segment results, and income percentage may total more than 100 percent due to losses in one or more segments. We have three reportable segments: (1) Wireless, (2) Wireline and (3) Other. Our operating results prior to May 9, 2012, also included our sold Advertising Solutions segment (see Note 5).
The Wireless segment accounted for approximately 54% of our 2013 total segment operating revenues as compared to 52% in 2012 and 76% of our 2013 total segment income as compared to 70% in 2012. This segment uses our nationwide network to provide consumer and business customers with wireless data and voice communications services. This segment includes our portion of the results from our mobile payment joint venture ISIS, which is accounted for as an equity method investment.
The Wireline segment accounted for approximately 46% of our 2013 total segment operating revenues as compared to 47% in 2012 and 27% of our 2013 total segment income as compared to 31% in 2012. This segment uses our regional, national and global network to provide consumer and business customers with data and voice communications services, U-verse high-speed broadband, video, voice services and managed networking to business customers.

Management’s Discussion and Analysis of Financial Condition and Results of Operations (continued)Dollars in millions except per share amounts
14 | AT&T Inc.
devices on installment), and expect to launch additional plans during 2014. While we have focused on attracting and retaining postpaid subscribers, we have recently increased our focus on prepaid subscribers with our pending acquisition of Leap Wireless, which we expect to complete by the end of first quarter 2014.
In 2013, we continued to see an increasing number of our postpaid subscribers select smartphones rather than feature phones, which lack general Internet access. Of our total postpaid phone subscriber base, 76.6% (or 51.9 million
Wireless Subscriber RelationshipsAs the wireless industry continues to mature, we believe that future wireless growth will increasingly depend on our ability to offer innovative services, plans and devices and a wireless network that has sufficient spectrum and capacity to support these innovations on as broad a geographic basis as possible. To attract and retain subscribers in a maturing market, we have launched a wide variety of service plans, including Mobile Share and AT&T Next (our program that allows for the purchase of
WirelessSegment Results
Percent Change
2013 vs. 2012 vs. 2013 2012 2011 2012 2011
Segment operating revenues Data $21,719 $18,297 $14,861 18.7% 23.1% Voice, text and other service 39,833 40,889 41,865 (2.6) (2.3) Equipment 8,347 7,577 6,489 10.2 16.8
Total Segment Operating Revenues 69,899 66,763 63,215 4.7 5.6
Segment operating expenses Operations and support 44,508 43,296 41,282 2.8 4.9 Depreciation and amortization 7,468 6,873 6,329 8.7 8.6
Total Segment Operating Expenses 51,976 50,169 47,611 3.6 5.4
Segment Operating Income 17,923 16,594 15,604 8.0 6.3Equity in Net Income (Loss) of Affiliates (75) (62) (29) (21.0) —
Segment Income $17,848 $16,532 $15,575 8.0% 6.1%
The following table highlights other key measures of performance for the Wireless segment:
Percent Change
2013 vs. 2012 vs.(Subscribers in 000s) 2013 2012 2011 2012 2011
Wireless Subscribers1
Postpaid smartphones2 51,874 47,076 39,376 10.2% 19.6% Postpaid feature phones and data-centric devices 20,764 23,421 29,933 (11.3) (21.8)
Postpaid 72,638 70,497 69,309 3.0 1.7Prepaid 7,384 7,328 7,225 0.8 1.4Reseller 14,028 14,875 13,644 (5.7) 9.0Connected devices3 16,326 14,257 13,069 14.5 9.1
Total Wireless Subscribers 110,376 106,957 103,247 3.2 3.6
Net Additions4
Postpaid 1,776 1,438 1,429 23.5 0.6 Prepaid (13) 128 674 — (81.0) Reseller (1,074) 1,027 1,874 — (45.2) Connected devices 2,032 1,171 3,722 73.5 (68.5)
Net Subscriber Additions 2,721 3,764 7,699 (27.7)% (51.1)%
Total Churn5 1.37% 1.35% 1.37% 2 BP (2) BPPostpaid Churn5 1.06% 1.09% 1.18% (3) BP (9) BP 1 Represents 100% of AT&T Mobility wireless subscribers.2 Includes approximately 1,534 smartphones sold in 2013 under the AT&T Next program.3 Includes data-centric devices (eReaders and automobile monitoring systems). Excludes tablets, which are primarily included in postpaid.4 Excludes merger and acquisition-related additions during the period.5 Calculated by dividing the aggregate number of wireless subscribers who canceled service during a period divided by the total number of wireless subscribers at the beginning of that period. The churn rate for the period is equal to the average of the churn rate for each month of that period.

AT&T Inc. | 15
Wireless MetricsSubscriber Additions As of December 31, 2013, we served 110.4 million wireless subscribers, an increase of 3.2% from 2012. Market maturity in traditional wireless subscribers continues to limit the rate of growth in the industry’s subscriber base, contributing to a 1.4% decrease in our gross subscriber additions (gross additions) in 2013 and a decrease of 13.0% in 2012.
Net subscriber additions (net additions) in 2013 were lower primarily due to losses in low-revenue reseller accounts. Lower net additions in 2012, as compared to 2011, were primarily attributable to lower net connected device and reseller additions when compared to the prior year, which reflected higher churn rates for customers not using such devices (zero-revenue customers).
Average service revenue per user (ARPU) – Postpaid increased 1.6% in 2013 and 1.9% in 2012, driven by increases in data services ARPU of 16.9% in 2013 and 17.9% in 2012, reflecting greater use of smartphones and data-centric devices by our subscribers.
The growth in postpaid data services ARPU in 2013 and 2012 was partially offset by a 5.0% decrease in postpaid voice and other service ARPU in 2013 and a 3.7% decrease in 2012. Voice and other service ARPU declined due to lower access and airtime charges, triggered in part by postpaid subscribers on our discount plans, and lower roaming revenues.
ARPU – Total increased 0.9% in 2013, reflecting growth in data services as more subscribers are using smartphones and tablets and choosing medium- and higher-priced usage-based data plans. Total ARPU decreased 1.6% in 2012, reflecting growth in connected device, tablet and reseller subscribers, which have lower-priced data-only plans compared with our postpaid smartphone plans. We expect continued revenue growth from data services as more subscribers use smartphones and data-centric devices. While price changes may impact revenue and service ARPU, going forward we expect to increase equipment sales under our AT&T Next installment program. Data services ARPU increased 15.1% in 2013 and 16.1% in 2012, reflecting increased smartphone and data-centric device use. Voice, text and other service ARPU declined 5.5% in 2013 and 7.9% in 2012 due to voice access and usage trends and a shift toward a greater percentage of data-centric devices. We expect continued pressure on voice, text and other service ARPU.
Churn The effective management of subscriber churn is critical to our ability to maximize revenue growth and to maintain and improve margins. While the postpaid churn rate was lower in 2013, the total churn rate was up slightly in 2013, reflecting increased competition, especially for price-conscious customers. Total and postpaid churn were
subscribers) use smartphones, up from 69.6% (or 47.1 million subscribers) a year earlier and 58.5% (or 39.4 million subscribers) two years ago. As is common in the industry, most of our subscribers’ phones are designed to work only with our wireless technology, requiring subscribers who desire to move to a new carrier with a different technology to purchase a new device. Our postpaid subscribers also continued to add more tablets, reflecting the popularity of our Mobile Share plan.
Our postpaid subscribers typically sign a two-year contract, which includes discounted handsets and early termination fees. About 90% of our postpaid smartphone subscribers are on FamilyTalk® plans (family plans), Mobile Share plans or business plans, which provide for service on multiple devices at reduced rates, and such subscribers tend to have higher retention and lower churn rates. During 2013, we introduced additional programs that allow for the purchase of handsets on installments and for reduced-price service plans. We also offer data plans at different price levels (usage-based data plans) to attract a wide variety of subscribers and to differentiate us from our competitors. Our postpaid subscribers on data plans increased 10.2% year over year. A growing percentage of our postpaid smartphone subscribers are on usage-based data plans, with 72.6% (or 37.7 million subscribers) on these plans as of December 31, 2013, up from 67.4% (or 31.7 million subscribers) as of December 31, 2012, and 56.0% (or 22.1 million subscribers) as of December 31, 2011. About 80% of subscribers on usage-based data plans have chosen the medium- and higher-data plans. Such offerings are intended to encourage existing subscribers to upgrade their current services and/or add connected devices, attract subscribers from other providers and minimize subscriber churn.
As of December 31, 2013, approximately 77% of our postpaid smartphone subscribers use a 4G-capable device (i.e., a device that would operate on our HSPA+ or LTE network), and more than 50% of our postpaid smartphone subscribers use an LTE device. Due to substantial increases in the demand for wireless service in the United States, AT&T is facing significant spectrum and capacity constraints on its wireless network in certain markets. We expect such constraints to increase and expand to additional markets in the coming years. While we are continuing to invest significant capital in expanding our network capacity, our capacity constraints could affect the quality of existing data and voice services and our ability to launch new, advanced wireless broadband services, unless we are able to obtain more spectrum. Any long-term spectrum solution will require that the Federal Communications Commission (FCC) make new or existing spectrum available to the wireless industry to meet the expanding needs of our subscribers. We will continue to attempt to address spectrum and capacity constraints on a market-by-market basis.

Management’s Discussion and Analysis of Financial Condition and Results of Operations (continued)Dollars in millions except per share amounts
16 | AT&T Inc.
Operations and support expenses increased $1,212, or 2.8%, in 2013 and $2,014, or 4.9%, in 2012. The increase in 2013 was primarily due to the following:
•Equipmentcostsincreased$817,reflectingsalesofmore expensive smartphones, partially offset by the overall decline in upgrade activity and total device sales.
•Sellingexpenses(otherthancommissions)andadministrative expenses increased $712 due primarily to a $265 increase in employee-related costs, a $246 increase in advertising costs, $187 increase in information technology costs in conjunction with ongoing support systems development, and $107 increase in nonemployee-related costs, partially offset by an $84 decrease in bad debt expense.
•Networksystemcostsincreased$146primarilydue to higher network traffic, personnel-related network support costs and cell site related costs in conjunction with our network enhancement efforts.
•Commissionexpensesincreased$59duetoa year-over-year increase in smartphone sales as a percentage of total device sales, partially offset by the overall decline in handset upgrade activity and total device sales.
Partially offsetting these increases were the following:
•Interconnectandlong-distancecostsdecreased $353 due to third-party credits, lower usage costs and our ongoing network transition to more efficient Ethernet/IP-based technologies in 2013.
•USFfeesdecreased$104primarilyduetoUSFratedecreases, which are offset by lower USF revenues.
•Incollectroamingfeesdecreased$73primarilydue to rate declines and lower roaming use associated with the integration of previously acquired subscribers into our network.
The increase in 2012 was primarily due to the following:
•Commissionexpensesincreased$636duetoa year-over-year increase in smartphone sales as a percentage of total device sales, partially offset by the overall decline in handset upgrade activity and total device sales.
•Sellingexpenses(otherthancommissions)andadministrative expenses increased $526 due primarily to a $181 increase in information technology costs in conjunction with ongoing support systems development, $137 increase in employee-related costs, $99 increase in nonemployee-related costs, and $89 increase in bad debt expense, partially offset by a $57 decline in advertising costs.
down slightly in 2012, reflecting popularity of our reduced-rate family, Mobile Share, and business plans; however, the decrease was mostly offset by the disconnection of reseller low-revenue accounts.
Operating ResultsSegment operating income margin was 25.6% in 2013, compared to 24.9% in 2012 and 24.7% in 2011. Our Wireless segment operating income increased $1,329, or 8.0%, in 2013 and increased $990, or 6.3%, in 2012. The operating income and margin increase in 2013 reflected continuing data revenue growth and operating efficiencies, partially offset by the high subsidies associated with growing smartphone sales. The margin increase in 2012 reflected higher data revenues generated by our postpaid subscribers, partially offset by higher equipment and selling costs associated with higher smartphone sales and handset upgrades. While we subsidize the sales prices of various smartphones, we expect that subscriber revenues generated over time from voice and data services will exceed the cost of those subsidies. We also expect our subsidies costs to be tempered in 2014 by the growing popularity of our AT&T Next program, as discussed below.
Voice, text and other service revenues decreased $1,056, or 2.6%, in 2013 and $976, or 2.3%, in 2012. While the number of wireless subscribers increased 3.2% in 2013, and 3.6% in 2012, these revenues continued to decline due to voice access and usage declines, as noted in the ARPU and subscriber relationships discussions above.
Data service revenues increased $3,422, or 18.7%, in 2013 and $3,436, or 23.1%, in 2012. The increases were primarily due to the increased number of subscribers using smartphones and data-centric devices, such as tablets, eReaders, and mobile navigation devices. Data service revenues accounted for approximately 35.3% of our wireless service revenues in 2013, compared to 30.9% in 2012 and 26.2% in 2011.
Equipment revenues increased $770, or 10.2%, in 2013 and $1,088, or 16.8%, in 2012. The increases were primarily due to year-over-year increases in smartphone sales as a percentage of total device sales to postpaid subscribers. Equipment revenues in 2013 also included incremental revenues from devices sold under our AT&T Next program. While we expect equipment revenues to increase under this program, we expect monthly services revenues to decline for subscribers to this program. The increase in 2012 was primarily due to the launch of a new iPhone model and increased handset upgrade fees.

AT&T Inc. | 17
depreciation expense increased $865, or 13.5%, primarily due to ongoing capital spending for network upgrades and expansions partially offset by certain network assets becoming fully depreciated. Amortization expense decreased $270, or 55.3%, primarily due to lower amortization of intangibles for customer lists related to acquisitions.
Depreciation expense increased $855, or 15.5%, in 2012 primarily due to ongoing capital spending for network upgrades and expansion and the reclassification of shared information technology costs partially offset by certain network assets becoming fully depreciated. Amortization expense decreased $311, or 38.9%, in 2012 primarily due to lower amortization of intangibles for customer lists related to acquisitions.
Equity in net income (loss) of affiliates for the Wireless segment includes expenses for ISIS, our mobile payment joint venture with Verizon and T-Mobile.
•Equipmentcostsincreased$507,reflectingsalesofmore expensive smartphones, partially offset by the overall decline in upgrade activity and total device sales.
•Networksystem,interconnect,andlong-distance costs increased $202 primarily due to higher network traffic, personnel-related network support costs and cell site related costs in conjunction with our network enhancement efforts and storm costs.
•USFfeesincreased$166primarilyduetoUSFrateincreases.
•Handsetinsurancecostincreased$141duetoclaimson more expensive devices.
Partially offsetting these increases, incollect roaming fees decreased $115 primarily due to rate declines and lower roaming use associated with the integration of previously acquired subscribers into our network.
Depreciation and amortization expenses increased $595, or 8.7%, in 2013 and $544, or 8.6%, in 2012. In 2013,
WirelineSegment Results
Percent Change
2013 vs. 2012 vs. 2013 2012 2011 2012 2011
Segment operating revenues Data $33,593 $31,841 $29,548 5.5% 7.8% Voice 20,333 22,614 25,121 (10.1) (10.0) Other 4,888 5,118 5,480 (4.5) (6.6)
Total Segment Operating Revenues 58,814 59,573 60,149 (1.3) (1.0)
Segment operating expenses Operations and support 41,638 41,207 41,361 1.0 (0.4) Depreciation and amortization 10,907 11,123 11,615 (1.9) (4.2)
Total Segment Operating Expenses 52,545 52,330 52,976 0.4 (1.2)
Segment Operating Income 6,269 7,243 7,173 (13.4) 1.0Equity in Net Income (Loss) of Affiliates 2 (1) (2) — —
Segment Income $ 6,271 $ 7,242 $ 7,171 (13.4)% 1.0%
expense. The increase in operating income and margins in 2012 was driven by data revenue growth and lower depreciation and amortization expense, partially offset by lower voice revenue. As we transition from basic voice and data services to sophisticated, high-speed, IP-based alternatives, we expect continued growth in our more advanced IP data products while traditional data and DSL revenues continue to decline.
Operating ResultsOur Wireline segment operating income margin was 10.7% in 2013, compared to 12.2% in 2012 and 11.9% in 2011. Our Wireline segment operating income decreased $974, or 13.4%, in 2013 and increased $70, or 1.0%, in 2012. The decrease in operating income and margin in 2013 was driven primarily by lower voice revenue and higher operations and support expense, partially offset by data revenue growth and lower depreciation and amortization

Management’s Discussion and Analysis of Financial Condition and Results of Operations (continued)Dollars in millions except per share amounts
18 | AT&T Inc.
•Localvoicerevenuesdecreased$1,420,or10.2%, in 2013 and $1,526, or 9.9%, in 2012. The decrease in 2013 and 2012 was driven primarily by a 15.8% and 14.0% decline in switched access lines.
•Long-distancerevenuesdecreased$843,or11.0%, in 2013 and $965, or 11.2%, in 2012. Lower demand for long-distance service from our business and consumer customers decreased revenues $709 in 2013 and $801 in 2012. Additionally, expected declines in the number of national mass-market customers decreased revenues $135 in 2013 and $162 in 2012.
Other operating revenues decreased $230, or 4.5%, in 2013 and $362, or 6.6%, in 2012. Major items included in other operating revenues are integration services and customer premises equipment, government-related services and outsourcing, which account for approximately 60% of total other revenue in the years reported.
Operations and support expenses increased $431, or 1.0%, in 2013 and decreased $154, or 0.4%, in 2012. Operations and support expenses consist of costs incurred to provide our products and services, including costs of operating and maintaining our networks and personnel costs, such as compensation and benefits.
The 2013 increase was primarily due to increased cost of sales of $680, primarily related to U-verse related expenses, advertising expenses of $155 and contract services of $125. These increases were partially offset by lower employee-related expense of $437, reflecting workforce reduction initiatives, and USF fees of $116, which were offset by lower USF revenue.
The 2012 decrease was primarily due to lower employee-related expense of $470, reflecting workforce reduction initiatives, decreased traffic compensation expense of $281 and lower nonemployee-related expense of $172. These decreases were partially offset by increased cost of sales of $538, primarily related to U-verse related expenses, and increased USF fees of $254, which were offset by higher USF revenue.
Depreciation and amortization expenses decreased $216, or 1.9%, in 2013 and $492, or 4.2%, in 2012. Both decreases were primarily related to lower amortization of intangibles for customer lists associated with acquisitions.
Data revenues increased $1,752, or 5.5%, in 2013 and $2,293, or 7.8%, in 2012. Data revenues accounted for approximately 57% of wireline operating revenues in 2013, 53% in 2012 and 49% in 2011. Data revenues include IP, strategic business and traditional data services.
•IPdatarevenues(excludingstrategicbusinessservicesbelow) increased $1,662, or 11.3%, in 2013 and $1,781, or 13.8%, in 2012 primarily driven by higher U-verse penetration, customer additions, and migration from our legacy voice and DSL services. In 2013 and 2012 U-verse revenue from consumer customers increased $1,289 and $1,154 for broadband high-speed Internet access, $995 and $1,056 for video and $282 and $250 for voice, respectively. These increases were partially offset by a decrease of $777 and $628 in DSL revenue as customers continue to shift to our U-verse or competitors’ high speed Internet access offerings.
•Strategicbusinessservices,whichincludeVPN,Ethernet, hosting, IP conferencing, VoIP, Ethernet-access to Managed Internet Service (EaMIS), security services and U-verse provided to business customers, increased $1,105, or 15.0%, in 2013 and $1,029, or 16.2%, in 2012 primarily driven by migration from our legacy services. In 2013 and 2012, revenues from VPN increased $360 and $432, Ethernet increased $310 and $280, U-verse services increased $143 and $85, EaMIS increased $126 and $111 and VoIP increased $93 and $61, respectively.
•Traditionaldatarevenues,whichincludetransport(excluding Ethernet) and packet-switched data services, decreased $1,016, or 10.4%, in 2013 and $528, or 5.1%, in 2012. These decreases were primarily due to lower demand as customers continue to shift to more advanced IP-based technology such as VPN, Ethernet, U-verse high speed Internet access and managed Internet services.
Voice revenues decreased $2,281, or 10.1%, in 2013 and $2,507, or 10.0%, in 2012 primarily due to declining demand for traditional voice services by our consumer and business customers. Included in voice revenues are revenues from local voice, long distance (including international) and local wholesale services. Voice revenues do not include VoIP revenues, which are included in data revenues.

AT&T Inc. | 19
Supplemental InformationWireline Broadband, Telephone and Video Connections Summary Our broadband, switched access lines and other services provided at December 31, 2013, 2012, and 2011 are shown below and trends are addressed throughout the preceding segment discussion.
Percent Change
2013 vs. 2012 vs.(in 000s) 2013 2012 2011 2012 2011
U-verse high speed Internet 10,375 7,717 5,224 34.4% 47.7%DSL and other broadband connections 6,050 8,673 11,203 (30.2) (22.6)
Total Wireline Broadband Connections1 16,425 16,390 16,427 0.2 (0.2)
Total U-verse Video Connections 5,460 4,536 3,791 20.4 19.7
Retail consumer switched access lines 12,403 15,707 18,952 (21.0) (17.1)U-verse consumer VoIP connections 3,848 2,905 2,278 32.5 27.5
Total Retail Consumer Voice Connections2 16,251 18,612 21,230 (12.7) (12.3)
Switched Access LinesRetail consumer 12,403 15,707 18,952 (21.0) (17.1)Retail business 10,364 11,484 12,750 (9.8) (9.9)
Retail Subtotal2 22,767 27,191 31,702 (16.3) (14.2)
Wholesale Subtotal2 1,626 1,775 1,978 (8.4) (10.3)
Total Switched Access Lines2,3 24,639 29,279 34,054 (15.8)% (14.0)%1 Total wireline broadband connections include U-verse high speed Internet access, DSL lines and satellite broadband.2 Prior-period amounts are restated to conform to current-period reporting methodology.3 Total switched access lines include access lines provided to national mass markets and private payphone service providers of 246 at December 31, 2013, 313 at December 31, 2012, and 374 at December 31, 2011.
Advertising SolutionsSegment Results
Percent Change
2013 vs. 2012 vs. 2013 2012 2011 2012 2011
Total Segment Operating Revenues $ — $1,049 $ 3,293 — (68.1)%
Segment operating expenses Operations and support — 773 2,265 — (65.9) Impairment of intangible assets — — 2,910 — — Depreciation and amortization — 106 386 — (72.5)
Total Segment Operating Expenses — 879 5,561 — (84.2)
Segment Income (Loss) $ — $ 170 $(2,268) — —
On May 8, 2012, we completed the sale of our Advertising Solutions segment to an affiliate of Cerberus Capital Management, L.P. (see Note 5).
Management’s Discussion and Analysis of Financial Condition and Results of Operations (continued)Dollars in millions except per share amounts
20 | AT&T Inc.
OPERATING ENVIRONMENT AND TRENDS OF THE BUSINESS
2014 Revenue Trends We expect our operating environment in 2014 to remain challenging as current uncertain economic conditions continue and competition continues to increase, especially in the wireless area. Despite these challenges, we expect our consolidated operating revenues in 2014 to grow, driven by continuing growth in our wireless data and IP-related wireline data services, including U-verse. We expect our primary driver of growth to be wireless data services from smartphones, tablets and other services (such as wireless home services and mobile navigation, including car-based services). While price changes may impact revenue and service ARPU, we expect to increase equipment sales under our AT&T Next installment program. We expect that all our major customer categories will continue to increase their use of Internet-based broadband/data services. We expect continuing declines in traditional access lines and in traditional telephone service revenues. Where available, our U-verse services have proved effective in stemming access line losses, and we expect to continue to expand our U-verse service offerings in 2014.
2014 Expense Trends We expect a stable consolidated operating income margin in 2014 with expanding wireless margins being offset by wireline margin pressure as a result of our IP broadband and video expansion and other initiatives to enhance business offerings, including cloud services. Expenses related to growth areas of our business, including wireless data, U-verse and strategic business services, will apply some pressure to our operating income margin.
Market Conditions During 2013, ongoing slow recovery in the general economy has continued to negatively affect our customers. Our business and residential customers have continued to purchase lower levels of traditional wireline services and we expect those trends to continue. These negative trends were partially offset by continued growth in our wireless data and IP-related services. We expect further pressure on pricing and margins as we compete for both wireline and wireless customers who have less discretionary income. We also may experience difficulty purchasing equipment in a timely manner or maintaining and replacing equipment under warranty from our suppliers.
OtherSegment Results
Percent Change
2013 vs. 2012 vs. 2013 2012 2011 2012 2011
Total Segment Operating Revenues $ 39 $ 49 $ 66 (20.4)% (25.8)%
Total Segment Operating Expenses 1,336 1,065 5,077 25.4 (79.0)
Segment Operating Loss (1,297) (1,016) (5,011) (27.7) 79.7
Equity in Net Income of Affiliates 715 815 815 (12.3) —
Segment Income (Loss) $ (582) $ (201) $(4,196) — 95.2%
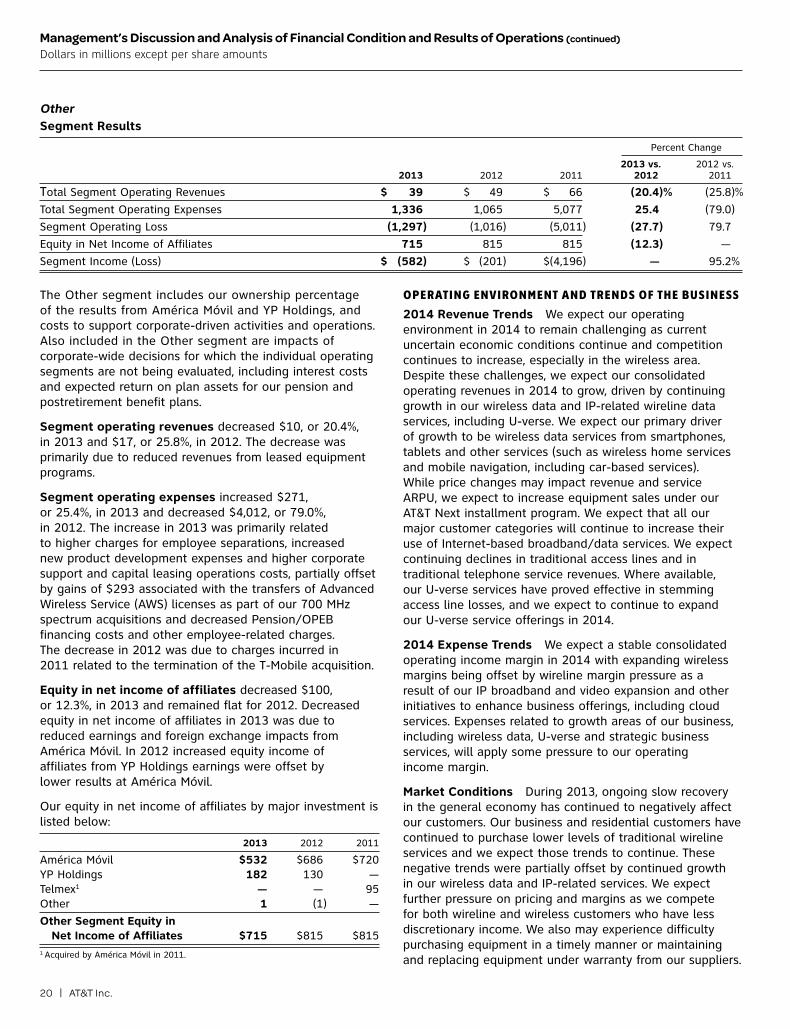
The Other segment includes our ownership percentage of the results from América Móvil and YP Holdings, and costs to support corporate-driven activities and operations. Also included in the Other segment are impacts of corporate-wide decisions for which the individual operating segments are not being evaluated, including interest costs and expected return on plan assets for our pension and postretirement benefit plans.
Segment operating revenues decreased $10, or 20.4%, in 2013 and $17, or 25.8%, in 2012. The decrease was primarily due to reduced revenues from leased equipment programs.
Segment operating expenses increased $271, or 25.4%, in 2013 and decreased $4,012, or 79.0%, in 2012. The increase in 2013 was primarily related to higher charges for employee separations, increased new product development expenses and higher corporate support and capital leasing operations costs, partially offset by gains of $293 associated with the transfers of Advanced Wireless Service (AWS) licenses as part of our 700 MHz spectrum acquisitions and decreased Pension/OPEB financing costs and other employee-related charges. The decrease in 2012 was due to charges incurred in 2011 related to the termination of the T-Mobile acquisition.
Equity in net income of affiliates decreased $100, or 12.3%, in 2013 and remained flat for 2012. Decreased equity in net income of affiliates in 2013 was due to reduced earnings and foreign exchange impacts from América Móvil. In 2012 increased equity income of affiliates from YP Holdings earnings were offset by lower results at América Móvil.
Our equity in net income of affiliates by major investment is listed below:
2013 2012 2011
América Móvil $532 $686 $720YP Holdings 182 130 —Telmex1 — — 95Other 1 (1) —
Other Segment Equity in Net Income of Affiliates $715 $815 $815 1 Acquired by América Móvil in 2011.

AT&T Inc. | 21
we also seek to ensure that legacy regulations are not extended to broadband or wireless services, which are subject to vigorous competition.
In addition, states representing a majority of our local service access lines have adopted legislation that enables new video entrants to acquire a single statewide or state-approved franchise (as opposed to the need to acquire hundreds or even thousands of municipal-approved franchises) to offer competitive video services. We also are supporting efforts to update and improve regulatory treatment for retail services. Regulatory reform and passage of legislation is uncertain and depends on many factors.
We provide wireless services in robustly competitive markets, but those services are subject to substantial and increasing governmental regulation. Wireless communications providers must obtain licenses from the FCC to provide communications services at specified spectrum frequencies within specified geographic areas and must comply with the FCC rules and policies governing the use of the spectrum. The FCC has recognized that the explosive growth of bandwidth-intensive wireless data services requires the U.S. Government to make more spectrum available. In February 2012, Congress set forth specific spectrum blocks to be auctioned and licensed by February 2015, and also authorized the FCC to conduct an “incentive auction,” to make available for wireless broadband use certain spectrum that is currently used by broadcast television licensees. The FCC has initiated proceedings to establish rules that would govern this process. It also initiated a separate proceeding to review its policies governing mobile spectrum holdings and consider whether there should be limits on the amount of spectrum a wireless service provider may possess. We seek to ensure that we have the opportunity, through the incentive auction and otherwise, to obtain the spectrum we need to provide our customers with high-quality service. While wireless communications providers’ prices and service offerings are generally not subject to state regulation, states sometimes attempt to regulate or legislate various aspects of wireless services, such as in the area of consumer protection.
On January 14, 2014, the D.C. Circuit released its decision on Verizon’s appeal of the FCC’s Net Neutrality rules. Those rules prohibited providers of fixed, mass market Internet access service from blocking access to lawful content, applications, services or non-harmful devices. The rules prohibited providers of mobile broadband Internet access service from blocking consumers from accessing lawful websites or applications that compete with the provider’s own voice or video telephony services. The rules also imposed transparency requirements on providers of both fixed and mobile broadband Internet access services, requiring public disclosure of information regarding network management practices, performance and commercial terms of their service offerings. In addition,
Included on our consolidated balance sheets are assets held by benefit plans for the payment of future benefits. Our pension plans are subject to funding requirements of the Employee Retirement Income Security Act of 1974, as amended (ERISA). In September 2013, we made a voluntary contribution of a preferred equity interest in AT&T Mobility II LLC to the trust used to pay pension benefits. The trust is entitled to receive cumulative annual cash distributions of $560, which will result in a $560 contribution during 2014. We do not have significant additional contribution requirements to our pension plans for 2014. However, a weakness in the equity, fixed income and real asset markets could require us in future years to make contributions to the pension plans in order to maintain minimum funding requirements as established by ERISA. Investment returns on these assets depend largely on trends in the U.S. securities markets and the U.S. economy. In addition, our policy of recognizing actuarial gains and losses related to our pension and other postretirement plans in the period in which they arise subjects us to earnings volatility caused by changes in market conditions. Changes in our discount rate, which are tied to changes in the bond market, and changes in the performance of equity markets, may have significant impacts on the fair value of pension and other postretirement plans at the end of 2014 (see “Accounting Policies and Estimates”).
OPERATING ENVIRONMENT OVERVIEW
AT&T subsidiaries operating within the United States are subject to federal and state regulatory authorities. AT&T subsidiaries operating outside the United States are subject to the jurisdiction of national and supranational regulatory authorities in the markets where service is provided, and regulation is generally limited to operational licensing authority for the provision of services to enterprise customers.
In the Telecommunications Act of 1996 (Telecom Act), Congress established a national policy framework intended to bring the benefits of competition and investment in advanced telecommunications facilities and services to all Americans by opening all telecommunications markets to competition and reducing or eliminating regulatory burdens that harm consumer welfare. However, since the Telecom Act was passed, the FCC and some state regulatory commissions have maintained or expanded certain regulatory requirements that were imposed decades ago on our traditional wireline subsidiaries when they operated as legal monopolies. We are pursuing, at both the state and federal levels, additional legislative and regulatory measures to reduce regulatory burdens that are no longer appropriate in a competitive telecommunications market and that inhibit our ability to compete more effectively and offer services wanted and needed by our customers, including initiatives to transition services from traditional networks to all IP-based networks. At the same time,

Management’s Discussion and Analysis of Financial Condition and Results of Operations (continued)Dollars in millions except per share amounts
22 | AT&T Inc.
services. We also participate in ISIS which has also begun its national rollout of mobile payment services.
In the United States, we now cover all major metropolitan areas and nearly 280 million people with our LTE technology. We expect to cover approximately 300 million people and to be essentially complete by the summer of 2014. We also provide 4G coverage using various other technologies (UMTS and HSPA+), and when combined with our upgraded backhaul, we are able to enhance our network capabilities and provide superior mobile broadband speeds for data and video services. Our wireless network also relies on other GSM digital transmission technologies for 3G and 2G data communications. As of December 31, 2013, we served more than 110 million subscribers. We continue to expand the number of locations, including airports and cafés, where customers can access broadband Internet connections using wireless fidelity (local radio frequency commonly referred to as Wi-Fi) technology.
As the wireless industry continues to mature, we believe that future wireless growth will increasingly depend on our ability to offer innovative data services and a wireless network that has sufficient spectrum and capacity to support these innovations. We are facing significant spectrum and capacity constraints on our wireless network in certain markets. We expect such constraints to increase and expand to additional markets in the coming years. While we are continuing to invest significant capital in expanding our network capacity, our capacity constraints could affect the quality of existing voice and data services and our ability to launch new, advanced wireless broadband services, unless we are able to obtain more spectrum. Any long-term spectrum solution will require that the FCC make new or existing spectrum available to the wireless industry to meet the expanding needs of our subscribers. We will continue to attempt to address spectrum and capacity constraints on a market-by-market basis. To that end, we closed more than 60 deals to acquire spectrum and wireless operations during 2013. Much of the recently acquired spectrum came from an innovative solution in which we obtained FCC approval to use Wireless Communication Services spectrum for mobile broadband for the first time.
U-verse Services During 2013, we continued to expand our offerings of U-verse high speed Internet and TV services. As of December 31, 2013, we are marketing U-verse services to approximately 27 million customer locations (locations eligible to receive U-verse service). As of December 31, 2013, we had 10.7 million total U-verse subscribers (high-speed Internet and video), including 10.4 million Internet and 5.5 million video subscribers (subscribers to both services are only counted once in the total). As part of Project Velocity IP (VIP), we plan to expand our IP-broadband service to approximately 57 million
the rules prohibited providers of fixed (but not mobile) broadband Internet access service from unreasonably discriminating in their transmission of lawful network traffic.
In its decision, the court found the FCC had authority under section 706 of the Act (which directs the FCC and state commissions to promote broadband deployment) to adopt rules designed to preserve the open Internet, but vacated and remanded the antidiscrimination and no-blocking rules on the ground that they impermissibly imposed common carrier regulation on broadband Internet access service. The court held that, having declared broadband Internet access services to be information services, the FCC could not regulate them as telecommunications services. The court did not vacate the transparency rules.
The invalidation of the no-blocking and antidiscrimination rules means that broadband Internet access providers have greater flexibility in their provision of mass market services. However, the court’s finding that section 706 provides the FCC independent authority to adopt rules to promote broadband deployment appears to give the FCC broad authority to regulate the Internet and, more generally, IP-based services, provided the FCC finds such regulation promotes deployment of broadband infrastructure. In addition, because section 706(a) grants authority to both the FCC and the states to adopt rules to promote broadband deployment, states could attempt to rely on that provision to regulate broadband services, although the states’ authority to do so appears to be narrower than the FCC’s. If the FCC were to reclassify broadband as a telecommunications service, or the FCC and/or the states were to impose additional regulation of the Internet or broadband services, it could have a material adverse impact on our broadband services and operating results.
Expected Growth AreasWe expect our wireless services and wireline IP-data products to remain the most significant growth portions of our business and have also discussed trends affecting the segments in which we report results for these products (see “Wireless Segment Results” and “Wireline Segment Results”). Over the next few years, we expect our growth to come from IP-based data services used by our wireless and wireline customers. Whether, or the extent to which, growth in these areas will offset declines in other areas of our business is not known.
Wireless We expect to deliver continued revenue growth in the coming years. We are in a period of rapid growth in wireless data usage and believe that there are substantial opportunities available for next-generation converged services that combine wireless, broadband, voice and video. For example, we have launched our innovative home monitoring service (Digital Life) and have announced plans for car-related security and entertainment

AT&T Inc. | 23
traffic. The order adopts rules to address immediately certain practices that artificially increase ICC payments, as well as other practices to avoid such payments. The order also establishes a new ICC regime that will result in the elimination of virtually all terminating switched access charges and reciprocal compensation payments over a six-year transition. In the order, the FCC also repurposed its high-cost universal service program to encourage providers to deploy broadband facilities in unserved areas. To accomplish this goal, the FCC is transitioning support amounts disbursed through its existing high-cost program to its new Connect America Fund (CAF). In 2013, the FCC awarded us approximately $100 in new CAF funding to deploy broadband in unserved areas. We support many aspects of the order and new rules. AT&T and other parties have filed appeals of the FCC’s rules, which are pending in the Tenth Circuit Court of Appeals. Our appeal challenges only certain, narrow aspects of the order; AT&T intervened in support of the broad framework adopted by the order. Oral argument on the appeal took place November 19, 2013. A decision is possible in 2014. We do not expect the FCC’s rules to have a material impact on our operating results.
Transition to IP-Based Network In conjunction with Project VIP, we filed a petition with the FCC asking it to open a proceeding to facilitate our transition to all IP-based networks and services to promote consumer interests and incent private investment in broadband infrastructure. On January 30, 2014, the FCC adopted an order authorizing a broad set of voluntary experiments to measure the impact on consumers of the IP transition. Among other things, the order invites providers to submit proposals for all-IP trials in discrete geographic areas. In the first quarter of 2014, AT&T expects to submit a detailed plan for two such trials. The FCC will put that detailed plan out for public comment, and expects to adopt an order regarding AT&T’s plan by the end of the second quarter of 2014. We expect this transition to take several years.
Net Neutrality On January 14, 2014, the D.C. Circuit released its decision on Verizon’s appeal of the FCC’s Net Neutrality rules. As discussed above, although the court found that the FCC generally has authority to adopt Net Neutrality rules, the court vacated and remanded the FCC’s antidiscrimination and no-blocking rules on the ground that they impermissibly imposed common carrier regulation on broadband Internet access service (the court upheld the transparency requirements). That decision means that broadband Internet access providers have greater flexibility in their provision of mass market services. But the court’s finding that the FCC has authority to adopt rules to promote broadband deployment appears to give the FCC broad authority to regulate the Internet and, more generally, IP-based services. In addition, the court’s rationale appears to give the states authority to adopt rules to promote broadband deployment, although
customer locations, including U-verse services to a total of 33 million customer locations. We expect to be substantially complete in the 2015 and 2016 timeframe.
We believe that our U-verse TV service is a “video service” under the Federal Communications Act. However, some cable providers and municipalities have claimed that certain IP services should be treated as a traditional cable service and therefore subject to the applicable state and local cable regulation. Petitions have been filed at the FCC alleging that the manner in which we provision “public, educational and governmental” (PEG) programming over our U-verse TV service conflicts with federal law, and a lawsuit has been filed in a California state superior court raising similar allegations under California law. If courts having jurisdiction where we have significant deployments of our U-verse services were to decide that federal, state and/or local cable regulation were applicable to our U-verse services, or if the FCC, state agencies or the courts were to rule that we must deliver PEG programming in a manner substantially different from the way we do today or in ways that are inconsistent with our current network architecture, it could have a material adverse effect on the cost and extent of our U-verse offerings.
REGULATORY DEVELOPMENTS
Set forth below is a summary of the most significant regulatory proceedings that directly affected our operations during 2013. Industry-wide regulatory developments are discussed above in Operating Environment Overview. While these issues may apply only to certain subsidiaries, the words “we,” “AT&T” and “our” are used to simplify the discussion. The following discussions are intended as a condensed summary of the issues rather than as a comprehensive legal analysis and description of all of these specific issues.
International Regulation Our subsidiaries operating outside the United States are subject to the jurisdiction of regulatory authorities in the market where service is provided. Our licensing, compliance and advocacy initiatives in foreign countries primarily enable the provision of enterprise (i.e., large-business) services. AT&T is engaged in multiple efforts with foreign regulators to open markets to competition, reduce network costs, foster conditions favorable to investment, and increase our scope of fully authorized network services and products.
Federal Regulation A summary of significant 2013 federal regulatory developments follows.
Intercarrier Compensation/Universal Service In October 2011, the FCC adopted an order fundamentally overhauling its high-cost universal service program, through which it disburses approximately $4,500 per year to carriers providing telephone service in high-cost areas, and its existing intercarrier compensation (ICC) rules, which govern payments between carriers for the exchange of

Management’s Discussion and Analysis of Financial Condition and Results of Operations (continued)Dollars in millions except per share amounts
24 | AT&T Inc.
WirelineOur wireline subsidiaries will face continued competitive pressure in 2014 from multiple providers, including wireless, cable and other VoIP providers, interexchange carriers and resellers. In addition, economic pressures are leading customers to terminate their traditional local wireline service and use competitive wireless and Internet-based services, intensifying a pre-existing trend toward wireless and Internet use. In most markets, we compete, often on pricing of bundled services, with large cable companies, such as Comcast Corporation, Cox Communications Inc. and Time Warner Cable Inc., for local, high-speed Internet, video and voice services customers and other smaller telecommunications companies for both long-distance and local services customers.
Our wireline subsidiaries generally remain subject to regulation for wholesale services by state regulatory commissions for intrastate services and by the FCC for interstate services. Under the Telecom Act, companies seeking to interconnect to our wireline subsidiaries’ networks and exchange local calls enter into interconnection agreements with us. Any unresolved issues in negotiating those agreements are subject to arbitration before the appropriate state commission. These agreements (whether fully agreed-upon or arbitrated) are then subject to review and approval by the appropriate state commission.
Our wireline subsidiaries operate under state-specific forms of regulation for retail services that were either legislatively enacted or authorized by the appropriate state regulatory commission. Most states deregulate the competitive services; impose price caps for some services where the prices for these services are not tied to the cost of providing the services or to rate-of-return requirements; or adopt a regulatory framework that incorporates deregulation and price caps. Some states may impose minimum customer service standards with required payments if we fail to meet the standards.
We continue to lose access lines due to competitors (e.g., wireless, cable and VoIP providers) who can provide comparable services at lower prices because they are not subject to traditional telephone industry regulation (or the extent of regulation is in dispute), utilize different technologies, or promote a different business model (such as advertising based) and consequently have lower cost structures. In response to these competitive pressures, for several years we have utilized a bundling strategy that rewards customers who consolidate their services (e.g., long-distance telephone, high-speed Internet, wireless and video) with us. We continue to focus on bundling wireline and wireless services, including combined packages
their authority to do so appears to be narrower than the FCC’s. If the FCC were to reclassify broadband as a telecommunications service, or the FCC and/or the states were to impose additional regulation of the Internet or broadband services, it could have a material adverse impact on our broadband services and operating results.
COMPETITION
Competition continues to increase for telecommunications and information services. Technological advances have expanded the types and uses of services and products available. In addition, lack of or a reduced level of regulation of comparable alternatives (e.g., cable, wireless and VoIP providers) has lowered costs for these alternative communications service providers. As a result, we face heightened competition as well as some new opportunities in significant portions of our business.
WirelessWe face substantial and increasing competition in all aspects of our wireless business. Under current FCC rules, multiple licensees, including six or more PCS licensees, two cellular licensees and one or more enhanced specialized mobile radio licensee may operate in each of our service areas, which results in the potential presence of multiple competitors. Our competitors include brands such as Verizon Wireless, Sprint, T-Mobile, Metro PCS and Cricket Wireless, a larger number of regional providers of cellular, PCS and other wireless communications services and resellers of those services (see Note 5 for a discussion of our pending acquisition of Leap). In addition, we face competition from providers who offer voice, text messaging and other services as applications on data networks. More than 97 percent of the U.S. population lives in areas with at least three mobile telephone operators, and 90 percent of the population lives in areas with at least five competing carriers. We may experience significant competition from companies that provide similar services using other communications technologies and services. While some of these technologies and services are now operational, others are being developed or may be developed. We compete for customers based principally on service/device offerings, price, call quality, coverage area and customer service.
The FCC may develop rules to auction or otherwise make available additional spectrum to the wireless industry. The FCC has indicated it plans to conduct an auction in 2014 under which up to 120 MHz of UHF TV spectrum could be reallocated for mobile wireless use. In addition, the FCC is required by law to auction up to 65 MHz of additional wireless spectrum in 2015. The FCC has yet to develop the rules under which this spectrum might be available.

AT&T Inc. | 25
Pension and Postretirement Benefits Our actuarial estimates of retiree benefit expense and the associated significant weighted-average assumptions are discussed in Note 12. Our assumed discount rate of 5.00% at December 31, 2013, reflects the hypothetical rate at which the projected benefit obligations could be effectively settled or paid out to participants. We determined our discount rate based on a range of factors, including a yield curve composed of the rates of return on several hundred high-quality, fixed income corporate bonds available at the measurement date and the related expected duration for the obligations. These bonds were all rated at least Aa3 or AA- by one of the nationally recognized statistical rating organizations, denominated in U.S. dollars, and neither callable, convertible nor index linked. For the year ended December 31, 2013, we increased our discount rate by 0.70%, resulting in a decrease in our pension plan benefit obligation of $4,533 and a decrease in our postretirement benefit obligation of $3,161. For the year ended December 31, 2012, we decreased our discount rate by 1.00%, resulting in an increase in our pension plan benefit obligation of $7,030 and an increase in our postretirement benefit obligation of $4,546.
Our expected long-term rate of return on plan assets assumption was 7.75% for the year ended December 31, 2013. Our expected return on plan assets is calculated using the actual fair value of plan assets. If all other factors were to remain unchanged, we expect that a 0.50% decrease in the expected long-term rate of return would cause 2014 combined pension and postretirement cost to increase $262, which under our accounting policy would be recognized in the current year as part of our fourth-quarter remeasurement of our retiree benefit plans. In 2013, the actual return on our combined pension and postretirement plan assets was 14.1%, resulting in an actuarial gain of $3,239.
We recognize gains and losses on pension and postretirement plan assets and obligations immediately in our operating results. These gains and losses are generally measured annually as of December 31 and accordingly will normally be recorded during the fourth quarter, unless an earlier remeasurement is required. Should actual experience differ from actuarial assumptions, the projected pension benefit obligation and net pension cost and accumulated postretirement benefit obligation and postretirement benefit cost would be affected in future years. Note 12 also discusses the effects of certain changes in assumptions related to medical trend rates on retiree healthcare costs.
of minutes and video service through our U-verse service. We will continue to develop innovative products that capitalize on our IP-based network.
Additionally, we provide local, domestic intrastate and interstate, international wholesale networking capacity, and switched services to other service providers, primarily large Internet Service Providers using the largest class of nationwide Internet networks (Internet backbone), wireless carriers, Competitive Local Exchange Carriers, regional phone Incumbent Local Exchange Carriers, cable companies and systems integrators. These services are subject to additional competitive pressures from the development of new technologies and the increased availability of domestic and international transmission capacity. The introduction of new products and service offerings and increasing satellite, wireless, fiber-optic and cable transmission capacity for services similar to those provided by us continues to provide competitive pressures. We face a number of international competitors, including Orange Business Services, British Telecom, Singapore Telecommunications Limited and Verizon Communications Inc., as well as competition from a number of large systems integrators, such as HP Enterprise Services.
ACCOUNTING POLICIES AND STANDARDS
Critical Accounting Policies and Estimates Because of the size of the financial statement line items they relate to or the extent of judgment required by our management, some of our accounting policies and estimates have a more significant impact on our consolidated financial statements than others. The following policies are presented in the order in which the topics appear in our consolidated statements of income.
Allowance for Doubtful Accounts We maintain an allowance for doubtful accounts for estimated losses that result from the failure of our customers to make required payments. When determining the allowance, we consider the probability of recoverability based on past experience, taking into account current collection trends as well as general economic factors, including bankruptcy rates. Credit risks are assessed based on historical write-offs, net of recoveries, and an analysis of the aged accounts receivable balances with reserves generally increasing as the receivable ages. Accounts receivable may be fully reserved for when specific collection issues are known to exist, such as pending bankruptcy or catastrophes. The analysis of receivables is performed monthly, and the allowances for doubtful accounts are adjusted through expense accordingly. A 10% change in the amounts estimated to be uncollectible would result in a change in the provision for uncollectible accounts of approximately $95.

Management’s Discussion and Analysis of Financial Condition and Results of Operations (continued)Dollars in millions except per share amounts
26 | AT&T Inc.
value, then no further testing is required. If the fair value is less than the book value (i.e., an indication of impairment exists), then we perform the second step.
In the second step, we determine the fair values of all of the assets and liabilities of the reporting unit, including those that may not be currently recorded. The difference between the sum of all of those fair values and the overall reporting unit’s fair value is a new implied goodwill amount, which we compare to the recorded goodwill. If implied goodwill is less than the recorded goodwill, then we record an impairment of the recorded goodwill. The amount of this impairment may be more or less than the difference between the overall fair value and book value of the reporting unit. It may even be zero if the fair values of other assets are less than their book values.
As shown in Note 7, all of our goodwill resides in the Wireless and Wireline segments. For each of those segments, we assess their fair values using an income approach (also known as a discounted cash flow) and a market multiple approach. The income approach utilizes a 10-year cash flow projection with a perpetuity value discounted using an appropriate Weighted Average Cost of Capital rate for each reporting unit. The market multiple approach uses a multiple of a company’s Earnings Before Interest, Taxes, and Depreciation and Amortization expenses (EBITDA). We determined the multiples of the publicly traded companies whose services are comparable to those offered by the segment and then calculated a weighted-average of those multiples. Using those weighted averages, we then calculated fair values for each of those segments. In 2013, the calculated fair value of the reporting unit exceeded book value in all circumstances and no additional testing was necessary. In the event of a 10% drop in the fair values of the reporting units, the fair values would have still exceeded the book values of the reporting units and additional testing would still have not been necessary. As a result of our 2011 impairment test, we recorded a goodwill impairment charge in the Advertising Solutions segment due to declines in the value of our directory business and that industry (see Note 7). We also recorded a corresponding impairment to an indefinite-lived trade name used by the former Advertising Solutions segment.
Wireless FCC licenses are tested for impairment on an aggregate basis, consistent with the management of the business on a national scope. As in prior years, we performed our test of the fair values of FCC licenses using a discounted cash flow model (the Greenfield Approach). The Greenfield Approach assumes a
Depreciation Our depreciation of assets, including use of composite group depreciation and estimates of useful lives, is described in Notes 1 and 6. We assign useful lives based on periodic studies of actual asset lives. Changes in those lives with significant impact on the financial statements must be disclosed, but no such changes have occurred in the three years ended December 31, 2013. However, if all other factors were to remain unchanged, we expect that a one-year increase in the useful lives of our plant in service would result in a decrease of approximately $2,539 in our 2013 depreciation expense and that a one-year decrease would result in an increase of approximately $3,763 in our 2013 depreciation expense.
Asset Valuations and Impairments We account for acquisitions completed after 2008 using the acquisition method. We allocate the purchase price to the assets acquired and liabilities assumed based on their estimated fair values. The estimated fair values of intangible assets acquired are based on the expected discounted cash flows of the identified customer relationships, patents, trade names and FCC licenses. In determining the future cash flows, we consider demand, competition and other economic factors.
Customer relationships, which are finite-lived intangible assets, are primarily amortized using the sum-of-the-months-digits method of amortization over the period in which those relationships are expected to contribute to our future cash flows. The sum-of-the-months-digits method is a process of allocation and reflects our belief that we expect greater revenue generation from these customer relationships during the earlier periods after acquisition. Amortization of other intangibles, including patents and certain trade names, is determined using the straight-line method of amortization over the expected remaining useful lives.
Goodwill, wireless FCC licenses and trade names are not amortized but tested annually for impairment. We conduct our impairment tests as of October 1. We test goodwill on a reporting unit basis, and our reporting units coincide with our segments. If, due to changes in how we manage the business, we move a portion of a reporting unit to another reporting unit, we determine the amount of goodwill to reallocate to the new reporting unit based on the relative fair value of the portion of the business moved and the portion of the business remaining in the reporting unit. The goodwill impairment test is a two-step process. The first step involves determining the fair value of the reporting unit and comparing that measurement to the book value. If the fair value exceeds the book

AT&T Inc. | 27
We review customer relationships and other long- lived assets for impairment whenever events or circumstances indicate that the carrying amount may not be recoverable over the remaining life of the asset or asset group. To determine that the asset is recoverable, we verify that the expected undiscounted future cash flows directly related to that asset exceed its book value.
We evaluate our investments to determine whether market declines are temporary and accordingly reflected in accumulated other comprehensive income, or other-than-temporary and recorded as an expense in other income (expense) in the consolidated income statements. This evaluation is based on the length of time and the severity of decline in the investment’s value. In 2012 and 2011, we identified an immaterial other-than-temporary decline in the value of equity method investments and various cost investments.
Income Taxes Our estimates of income taxes and the significant items giving rise to the deferred assets and liabilities are shown in Note 11 and reflect our assessment of actual future taxes to be paid on items reflected in the financial statements, giving consideration to both timing and probability of these estimates. Actual income taxes could vary from these estimates due to future changes in income tax law or the final review of our tax returns by federal, state or foreign tax authorities.
We use our judgment to determine whether it is more likely than not that we will sustain positions that we have taken on tax returns and, if so, the amount of benefit to initially recognize within our financial statements. We regularly review our uncertain tax positions and adjust our unrecognized tax benefits (UTBs) in light of changes in facts and circumstances, such as changes in tax law, interactions with taxing authorities and developments in case law. These adjustments to our UTBs may affect our income tax expense. Settlement of uncertain tax positions may require use of our cash.
OTHER BUSINESS MATTERS
Atlantic Tele-Network, Inc. Transaction In September 2013, we acquired Atlantic Tele-Network, Inc.’s U.S. retail wireless operations, operated under the Alltel brand, for $806 in cash, which included closing adjustments. Under the terms of the agreement, we acquired wireless properties, including licenses, network assets, retail stores and approximately 550,000 subscribers. We expect to complete network upgrades and migrate customers to our network in the second half of 2014.
company initially owns only the wireless FCC licenses, and then makes investments required to build an operation comparable to the one that currently utilizes the licenses. We utilized a 17-year discrete period to isolate cash flows attributable to the licenses, including modeling the hypothetical build-out. The projected cash flows are based on certain financial factors, including revenue growth rates, EBITDA margins and churn rates. For impairment testing purposes, we assumed wireless revenue growth to trend down from our 2013 growth rate of 4.7% to a long-term growth rate that reflects expected long-term inflation trends. We assumed our churn rates will decline in 2014 from our rate of 1.37% in 2013, in line with expected trends in the industry but at a rate comparable with industry-leading churn. EBITDA margins were assumed to continue to trend at least 40%.
This model then incorporates cash flow assumptions regarding investment in the network, development of distribution channels and the subscriber base, and other inputs for making the business operational. We based the assumptions, which underlie the development of the network, subscriber base and other critical inputs of the discounted cash flow model, on a combination of average marketplace participant data and our historical results, trends and business plans. We also used operating metrics such as capital investment per subscriber, acquisition costs per subscriber, minutes of use per subscriber, etc., to develop the projected cash flows. Since we included the cash flows associated with these other inputs in the annual cash flow projections, the present value of the unlevered free cash flows of the segment, after investment in the network, subscribers, etc., is attributable to the wireless FCC licenses. The terminal value of the segment, which incorporates an assumed sustainable growth rate, is also discounted and is likewise attributed to the licenses. We used a discount rate of 8.5%, based on the optimal long-term capital structure of a market participant and its associated cost of debt and equity, to calculate the present value of the projected cash flows. This discount rate is also consistent with rates we use to calculate the present value of the projected cash flows of licenses acquired from third parties.
If either the projected rate of long-term growth of cash flows or revenues declined by 1%, or if the discount rate increased by 1%, the fair values of the wireless FCC licenses, while less than currently projected, would still be higher than the book value of the licenses. The fair value of the licenses exceeded the book value by more than 25%.

Management’s Discussion and Analysis of Financial Condition and Results of Operations (continued)Dollars in millions except per share amounts
28 | AT&T Inc.
exclusive rights to lease and operate 9,048 and purchase 627 of our wireless towers for $4,827 in cash. Under the terms of the leases, Crown Castle will have exclusive rights to lease and operate the towers over various terms with an average length of approximately 28 years. As the leases expire, Crown Castle will have fixed price purchase options for these towers totaling approximately $4,200, based on their estimated fair market values at the end of the lease terms. We will sublease space on the towers from Crown Castle for a minimum of 10 years at current market rates, with options to renew. We accounted for the proceeds as a financing obligation.
Connecticut Wireline Disposition In December 2013, we agreed to sell our incumbent local exchange operations in Connecticut to Frontier Communications Corporation for $2,000 in cash. These Connecticut operations represent approximately $1,200 in annual revenues as of 2013. The transaction is subject to review by the U.S. Department of Justice, the FCC and the Connecticut Public Utilities Regulatory Authority and other state regulatory authorities. We expect the transaction to close in the second half of 2014, subject to customary closing conditions.
Environmental We are subject from time to time to judicial and administrative proceedings brought by various governmental authorities under federal, state or local environmental laws. We reference in our Forms 10-Q and 10-K certain environmental proceedings that could result in monetary sanctions (exclusive of interest and costs) of one hundred thousand dollars or more. However, we do not believe that any of those currently pending will have a material adverse effect on our results of operations.
LIQUIDIT Y AND CAPITAL RESOURCES
We had $3,339 in cash and cash equivalents available at December 31, 2013. Cash and cash equivalents included cash of $697 and money market funds and other cash equivalents of $2,642. Cash and cash equivalents decreased $1,529 since December 31, 2012. During 2013, cash inflows were primarily provided by cash receipts from operations, a net increase in our debt and cash received from our tower leasing arrangement with Crown Castle and other asset sales. These inflows were largely offset by cash used to meet the needs of the business, including but not limited to, payment of operating expenses, funding capital expenditures, dividends to stockholders, stock repurchases and the acquisition of wireless spectrum and operations. We discuss many of these factors in detail below.
Cash Provided by or Used in Operating ActivitiesDuring 2013, cash provided by operating activities was $34,796, compared to $39,176 in 2012. Lower operating cash flows in 2013 were due to higher cash tax payments and the timing of working capital payments and wireless device financing related to our AT&T Next program.
Leap Acquisition In July 2013, we announced an agreement to acquire Leap Wireless International, Inc. (Leap), a provider of prepaid wireless service under the Cricket brand name, for fifteen dollars per outstanding share of Leap’s common stock, or approximately $1,260, plus one nontransferable contingent value right (CVR) per share. The CVR will entitle each Leap stockholder to a pro rata share of the net proceeds of the future sale of the Chicago 700 MHz A-band FCC license held by Leap. As of September 30, 2013, Leap had approximately $3,100 of debt, net of cash. Under the terms of the agreement, we will acquire all of Leap’s stock and, thereby, acquire all of its wireless properties, including spectrum licenses, network assets, retail stores and approximately 4.6 million subscribers. Leap’s spectrum licenses include Personal Communications Services (PCS) and AWS bands and are largely complementary to our licenses. Leap’s network covers approximately 96 million people in 35 states and consists of a 3G CDMA network and an LTE network covering approximately 21 million people.
The agreement was approved by more than 99 percent of votes cast by Leap’s stockholders on October 30, 2013. The transaction is subject to review by the FCC and Department of Justice (DOJ). The review process is underway at both agencies. The transaction is expected to close in the first quarter of 2014. The agreement provides both parties with certain termination rights if the transaction does not close by July 11, 2014, which can be extended until January 11, 2015 if certain conditions have not been met by that date. Under certain circumstances, Leap may be required to pay a termination fee or AT&T may be required to provide Leap with a three-year roaming agreement for LTE data coverage in certain Leap markets lacking LTE coverage, if the transaction does not close. If Leap enters into the roaming agreement, AT&T will then have the option within 30 days after entry into the roaming agreement to purchase certain specified Leap spectrum assets. If AT&T does not exercise its right to purchase all of the specified Leap spectrum assets, Leap can then within 60 days after expiration of AT&T’s option require AT&T to purchase all of the specified spectrum assets.
Spectrum Acquisitions In September 2013, we acquired spectrum in the 700 MHz B band from Verizon Wireless for $1,900 in cash and an assignment of AWS spectrum licenses in five markets. The 700 MHz licenses acquired by AT&T cover 42 million people in 18 states. In January 2014, we announced an agreement to purchase 49 AWS spectrum licenses, covering nearly 50 million people in 14 states, from Aloha Partners II, L.P. The transaction is subject to regulatory approval and we expect to close the transaction in the second half of 2014.
Tower Transaction On December 16, 2013, we closed our transaction with Crown Castle International Corp. (Crown Castle) in which Crown Castle will have the

AT&T Inc. | 29
by dividend rate increases. In December 2013, our Board of Directors approved a 2.2% increase in the quarterly dividend from $0.45 to $0.46 per share. This follows a 2.3% dividend increase approved by our Board in November 2012. Dividends declared by our Board of Directors totaled $1.81 per share in 2013, $1.77 per share in 2012, and $1.73 per share in 2011. Our dividend policy considers the expectations and requirements of stockholders, internal requirements of AT&T and long-term growth opportunities. It is our intent to provide the financial flexibility to allow our Board of Directors to consider dividend growth and to recommend an increase in dividends to be paid in future periods. All dividends remain subject to declaration by our Board of Directors.
In 2013, we continued to take advantage of lower market interest rates and undertook several activities related to our long-term debt which caused our weighted average interest rate of our entire long-term debt portfolio to decrease from 4.9% at December 31, 2012 to 4.5% at December 31, 2013. We had $74,484 of total notes and debentures outstanding (see Note 9) at December 31, 2013, which included Euro, British pound sterling or Canadian dollar denominated debt of approximately $18,206.
During 2013, we received net proceeds of $12,040 from the issuance of $12,108 in long-term debt in various markets, with an average weighted maturity of approximately 10 years and an average interest rate of 2.6%. Debt issued included:
•February2013issuanceof$1,000of0.900%globalnotes due 2016 and $1,250 of floating rate notes due 2016. The floating rate is based upon the three-month London Interbank Offered Rate (LIBOR), reset quarterly, plus 38.5 basis points.
•March2013issuanceof$500of1.400%globalnotesdue 2017.
•March2013issuanceof€1,250of2.500%globalnotesdue2023(equivalentto$1,626whenissued)and€400of 3.550% global notes due 2032 (equivalent to $520 when issued).
•May2013issuanceof£1,000of4.250%globalnotesdue 2043 (equivalent to $1,560 when issued).
•November2013issuanceof€1,000of2.650%globalnotes due 2021 (equivalent to $1,349 when issued) and€1,000of3.500%globalnotesdue2025(equivalent to $1,349 when issued).
•November2013issuanceofCDN$1,000of3.825%global notes due 2020 (equivalent to $954 when issued).
•November2013issuanceof$1,600of2.375%globalnotes due 2018 and $400 of floating rate notes due 2018. The floating rate is based upon the three-month LIBOR, reset quarterly, plus 91 basis points.
We expect lower cash from operations in 2014, in part as the tax rules allowing companies to more rapidly deduct the cost of equipment have ended and our AT&T Next program continues to gain popularity with customers.
During 2012, cash provided by operating activities was $39,176 compared to $34,743 in 2011. Our higher operating cash flows in 2012 were due to nonrecurring payments made in the prior year, including a $3,000 merger breakup fee to Deutsche Telekom AG (Deutsche Telekom) and a contribution to our pension plan of $1,000, as well as improvements in inventory and working capital management during 2012.
Cash Used in or Provided by Investing ActivitiesDuring 2013, cash used in investing activities consisted primarily of:
•$20,944incapitalexpenditures,excludinginterestduring construction.
•$284ininterestduringconstruction.
•$4,050purchaseofwirelessspectrumlicensesandoperations.
During 2013, cash provided by investing activities consisted primarily of:
•$1,179fromthesaleofaportionofoursharesinAmérica Móvil.
•$712fromthesaleofvariousproperties.
•$200fromtherepaymentofadvancestoYPHoldings.
•$101fromthereturnofinvestmentinYPHoldings.
Virtually all of our capital expenditures are spent on our wireless and wireline networks, our U-verse services and support systems for our communications services. Capital expenditures, excluding interest during construction, increased $1,479 from 2012. Our Wireless segment represented 52% of our total spending and increased 3% in 2013. The Wireline segment, which includes U-verse services, represented 48% of the total capital expenditures and increased 13% in 2013, primarily reflecting our implementation of Project VIP.
We expect that our capital expenditures during 2014 will be in the $21,000 range. We expect 2014 to be our peak investment year for Project VIP and anticipate our Wireless and Wireline segments’ spend to be proportionally consistent to the previous year. Upon our completion of Project VIP, we expect capital investments to trend back to historic levels. The amount of capital investment is influenced by demand for services and products, continued growth and regulatory considerations.
Cash Used in or Provided by Financing ActivitiesWe paid dividends of $9,696 in 2013, $10,241 in 2012, and $10,172 in 2011, primarily reflecting the decline in shares outstanding due to our repurchase activity, partially offset

Management’s Discussion and Analysis of Financial Condition and Results of Operations (continued)Dollars in millions except per share amounts
30 | AT&T Inc.
$3,000 revolving credit agreement that was entered into in 2012, with a syndicate of banks that is available until December 2017 (December 2017 Facility). In the event advances are made under either agreement, those advances would be used for general corporate purposes. Advances are not conditioned on the absence of a material adverse change. All advances must be repaid no later than the date on which lenders are no longer obligated to make any advances under each agreement. Under each agreement, we can terminate, in whole or in part, amounts committed by the lenders in excess of any outstanding advances; however, we cannot reinstate any such terminated commitments. At December 31, 2013, we had no advances outstanding under either agreement and were in compliance with all covenants under each agreement.
Advances under both agreements would bear interest, at AT&T’s option, either:
•atavariableannualrateequalto(1)thehighestof:(a) the base (or prime) rate of the bank affiliate of Citibank, N.A. which is serving as administrative agent under the Agreement, (b) 0.50% per annum above the Federal funds rate, and (c) the LIBOR applicable to U.S. dollars for a period of one month plus 1.00% per annum, plus (2) an applicable margin, as set forth in the Agreement (Applicable Margin); or
•atarateequalto:(i)theLIBORforaperiodofone,two, three or six months, as applicable, plus (ii) the Applicable Margin.
The Applicable Margin for both agreements will equal 0.565%, 0.680%, or 0.910% per annum, depending on AT&T’s credit rating.
Under each agreement AT&T will pay a facility fee of 0.060%, 0.070% or 0.090% per annum, depending on AT&T’s credit rating, of the amount of lender commitments.
Both agreements require that, if at any time AT&T or a subsidiary pledges assets or otherwise permits a lien on its properties, advances under the agreement will be ratably secured, subject to specified exceptions. Both agreements also contain a financial ratio covenant that provides that AT&T will maintain, as of the last day of each fiscal quarter, a debt-to-EBITDA (earnings before interest, income taxes, depreciation and amortization, and other modifications described in the agreements) ratio of not more than 3.0 to 1, for the four quarters then ended.
Defaults under both agreements permit the lenders to accelerate required repayment and would increase the Applicable Margin by 2.00% per annum. Defaults include noncompliance with the two covenants above, other representations and warranties and the following:
•Wefailtopayprincipalorinterest,orotheramountsunder the agreement beyond any grace period.
During 2013, we redeemed $7,698 in debt, primarily consisting of the following repayments:
•March2013repaymentof€1,2504.375%notes(equivalent to $1,641 when repaid) and $147 of 6.5% notes.
•July2013earlyredemptionof$300of7.375%notesoriginally due in July 2043.
•October2013earlyredemptionof$550of6.625%notes originally due in October 2034.
•Wealsocompleteddebttenderofferscovering$5,000of various notes with stated rates of 5.20% to 8.75% for $5,556 in cash payments.
At December 31, 2013, we had $5,498 of debt maturing within one year, substantially all of which was related to long-term debt issuances. Debt maturing within one year includes the following notes that may be put back to us by the holders:
•$1,000ofannualputresetsecuritiesissuedbyBellSouth Corporation that may be put back to us each April until maturity in 2021.
•Anaccretingzero-couponnotethatmayberedeemedeach May until maturity in 2022. If the zero-coupon note (issued for principal of $500 in 2007) is held to maturity, the redemption amount will be $1,030.
In December 2010, our Board of Directors authorized the repurchase of up to 300 million shares of AT&T common stock. We began buying back stock under this program in the first quarter of 2012 and completed the authorized repurchase that year. In July 2012, the Board of Directors approved a second authorization to repurchase 300 million shares, which we completed in May 2013. In March 2013, our Board of Directors approved a third authorization to repurchase 300 million shares of our common stock, which has no expiration date. During 2013, we repurchased 366 million shares for $13,028 under the two most recent authorizations. At the end of 2013, we had approximately 163 million shares remaining on the March 2013 authorization. We expect to make future repurchases opportunistically.
The emphasis of our 2014 financing activities will be the payment of dividends, subject to approval by our Board of Directors, the repayment of debt and share repurchases. We plan to fund these activities through a combination of cash from operations, debt issuances, and asset sales. The timing and mix of debt issuance will be guided by credit market conditions and interest rate trends.
Credit FacilitiesOn December 11, 2013, we amended and extended for an additional two-year term our existing $5,000 revolving credit agreement with a syndicate of banks until December 2018 (December 2018 Facility). We also have an existing

AT&T Inc. | 31
and $19,224. These taxes include income, franchise, property, sales, excise, payroll, gross receipts and various other taxes and fees. Total health and welfare benefits provided to certain active and retired employees and their dependents totaled $5,167 in 2013, with $1,682 paid from plan assets. Of those benefits, $4,254 related to medical and prescription drug benefits. During 2013, we paid $3,966 of pension benefits out of plan assets.
During 2013, we also received approximately $7,000 from monetization of various nonstrategic assets. A majority of that cash was attributable to the towers transaction (see Note 16) as well as sales of investments and real estate holdings. We plan to continue to explore similar opportunities in 2014.
In September 2013, we made a voluntary contribution of a preferred equity interest in AT&T Mobility II LLC (Mobility), the holding company for our wireless business, to the trust used to pay pension benefits under our qualified pension plans. The preferred equity interest had a value of $9,104 on the contribution date, does not have any voting rights and has a liquidation value of $8,000. The trust is entitled to receive cumulative cash distributions of $560 per annum, which will be distributed quarterly in equal amounts. So long as we make the distributions, we will have no limitations on our ability to declare a dividend, or repurchase shares. At the time of the contribution of the preferred equity interest, we made an additional cash contribution of $175 and have agreed to annual cash contributions of $175 no later than the due date for our federal income tax return for each of 2014, 2015 and 2016. These contributions, combined with our existing pension assets, are essentially equivalent to the pension obligation at December 31, 2013.
The preferred equity interest is not transferable by the trust except through its put and call features. After a period of five years from the contribution or, if earlier, the date upon which the pension plan trust is fully funded as determined under U.S. generally accepted accounting principles (GAAP), AT&T has a right to purchase from the pension plan trust some or all the preferred equity interest at the greater of their fair market value or minimum liquidation value plus any unpaid cumulative dividends. In addition, AT&T will have the right to purchase the preferred equity interest in the event AT&T’s ownership of Mobility is less than 50% or there is a transaction that results in the transfer of 50% or more of the pension plan trust’s assets to an entity not under common control with AT&T (collectively, a change of control). The pension plan trust has the right to require AT&T to purchase the preferred equity interest at the greater of their fair market value or minimum liquidation value plus any unpaid cumulative dividends, and in installments, as specified in the contribution agreement upon the occurrence of any of the following: (1) at any time if the ratio of debt to total capitalization of Mobility exceeds
•Wefailtopaywhendueotherdebtof$400ormorethat results in acceleration of that debt (commonly referred to as cross-acceleration) or a creditor commences enforcement proceedings within a specified period after a money judgment of $400 or more has become final.
•Apersonacquiresbeneficialownershipofmorethan50% of AT&T common shares or more than a majority of AT&T’s directors change in any 24-month period other than as elected by the remaining directors.
•Wefailtomakecertainminimumfundingpaymentsunder the Employee Retirement Income Security Act of 1974, as amended (ERISA).
•Ourbankruptcyorinsolvency.
Both agreements contain provisions permitting subsidiaries to be added as additional borrowers, with or without a guarantee by AT&T. The terms of the guarantee are set forth in the agreements.
The obligations of the lenders under the December 2017 Facility to provide advances will terminate on December 11, 2017, unless prior to that date either: (i) AT&T, and if applicable, a Co-Borrower, reduce to $0 the commitments of the lenders, or (ii) certain events of default occur. We and lenders representing more than 50% of the facility amount may agree to extend their commitments for two one-year periods beyond the December 11, 2017, termination date, under certain circumstances. We also can request the lenders to further increase their commitments (i.e., raise the available credit) up to an additional $2,000 provided no event of default has occurred. The same provisions apply to the December 2018 Facility except that the applicable date is December 11, 2018.
OtherOur total capital consists of debt (long-term debt and debt maturing within one year) and stockholders’ equity. Our capital structure does not include debt issued by América Móvil or YP Holdings. At December 31, 2013, our debt ratio was 45.0%, compared to 43.0% at December 31, 2012, and 38.0% at December 31, 2011. The debt ratio is affected by the same factors that affect total capital, and reflects our recent debt issuances and stock repurchases. Total capital increased $3,731 in 2013 compared to a decrease of $8,011 in 2012. The 2013 capital increase was primarily due to increases in net income due to actuarial gains on our pension and postretirement benefit plans, increases in accumulated other comprehensive income related to prior service credits resulting from amendments to our postretirement benefit plans and increases in debt balances partially offset by share repurchases.
A significant amount of our cash outflows are related to tax items and benefits paid for current and former employees. Total taxes incurred, collected and remitted by AT&T during 2013, 2012, and 2011 were $21,004, $19,703

Management’s Discussion and Analysis of Financial Condition and Results of Operations (continued)Dollars in millions except per share amounts
32 | AT&T Inc.
Contractual Obligations
Payments Due By Period
Less than 1-3 3-5 More than Total 1 Year Years Years 5 Years
Long-term debt obligations1 $ 75,500 $ 5,472 $ 13,181 $ 11,057 $ 45,790Interest payments on long-term debt 53,219 3,350 6,035 5,328 38,506Finance obligations2 3,945 221 454 473 2,797Operating lease obligations 24,952 3,003 5,551 4,691 11,707Unrecognized tax benefits3 2,332 265 — — 2,067Purchase obligations4 14,320 5,749 5,182 2,570 819
Total Contractual Obligations $174,268 $ 18,060 $ 30,403 $ 24,119 $101,686 1 Represents principal or payoff amounts of notes and debentures at maturity or, for putable debt, the next put opportunity.2 Represents future minimum payments under the sublease arrangement for our tower transactions (see Note 16).3 The noncurrent portion of the UTBs is included in the “More than 5 Years” column, as we cannot reasonably estimate the timing or amounts of additional cash payments, if any, at this time. See Note 11 for additional information.
4 We calculated the minimum obligation for certain agreements to purchase goods or services based on termination fees that can be paid to exit the contract. If we elect to exit these contracts, termination fees for all such contracts in the year of termination could be approximately $489 in 2014, $567 in the aggregate for 2015 and 2016, $174 in the aggregate for 2017 and 2018, and $8 in the aggregate thereafter. Certain termination fees are excluded from the above table, as the fees would not be paid every year and the timing of such payments, if any, is uncertain.
that the commitments will have a material effect on our financial condition, results of operations or cash flows.
Our contractual obligations as of December 31, 2013, are in the following table. The purchase obligations that follow are those for which we have guaranteed funds and will be funded with cash provided by operations or through incremental borrowings. The minimum commitment for certain obligations is based on termination penalties that could be paid to exit the contract. Other long-term liabilities are included in the table based on the year of required payment or an estimate of the year of payment. Such estimate of payment is based on a review of past trends for these items, as well as a forecast of future activities. Certain items were excluded from the following table, as the year of payment is unknown and could not be reliably estimated since past trends were not deemed to be an indicator of future payment.
Substantially all of our purchase obligations are in our Wireline and Wireless segments. The table does not include the fair value of our interest rate swaps. Our capital lease obligations and bank borrowings have been excluded from the table due to the insignificant amounts of such obligations at December 31, 2013. Many of our other noncurrent liabilities have been excluded from the following table due to the uncertainty of the timing of payments, combined with the absence of historical trending to be used as a predictor of such payments. Additionally, certain other long-term liabilities have been excluded since settlement of such liabilities will not require the use of cash. However, we have included, in the following table, obligations that primarily relate to benefit funding due to the certainty of the timing of these future payments. Our other long-term liabilities are: deferred income taxes (see Note 11) of $36,308; postemployment benefit obligations of $29,946; and other noncurrent liabilities of $15,766.
that of AT&T, (2) the date on which AT&T is rated below investment grade for two consecutive calendar quarters, (3) upon a change of control if AT&T does not exercise its purchase option, or (4) at any time after a seven-year period from the contribution date. In the event AT&T elects or is required to purchase the preferred equity interest, AT&T may elect to settle the purchase price in cash or shares of AT&T common stock or a combination thereof.
On September 9, 2013, the Department of Labor (DOL) published a proposed exemption that authorizes retroactive approval of this voluntary contribution. The proposal was open for public comment and we are currently awaiting a final decision by the DOL. Our retirement benefit plans, including required contributions, are subject to the provisions of ERISA.
CONTRACTUAL OBLIGATIONS, COMMITMENTS AND CONTINGENCIES
Current accounting standards require us to disclose our material obligations and commitments to making future payments under contracts, such as debt and lease agreements, and under contingent commitments, such as debt guarantees. We occasionally enter into third-party debt guarantees, but they are not, nor are they reasonably likely to become, material. We disclose our contractual long-term debt repayment obligations in Note 9 and our operating lease payments in Note 6. Our contractual obligations do not include contributions associated with our voluntary contribution of the Mobility preferred equity interest, or expected pension and postretirement payments (we maintain pension funds and Voluntary Employee Beneficiary Association trusts to fully or partially fund these benefits) (see Note 12). In the ordinary course of business, we routinely enter into commercial commitments for various aspects of our operations, such as plant additions, inventory and office supplies. However, we do not believe

AT&T Inc. | 33
established interest rate risk limits that we closely monitor by measuring interest rate sensitivities in our debt and interest rate derivatives portfolios.
All our foreign-denominated long-term debt has been swapped from fixed-rate foreign currencies to fixed-rate U.S. dollars at issuance through cross-currency swaps, removing interest rate risk and foreign currency exchange risk associated with the underlying interest and principal payments. Likewise, periodically we enter into interest rate locks to partially hedge the risk of increases in the benchmark interest rate during the period leading up to the probable issuance of fixed-rate debt. We expect gains or losses in our cross-currency swaps and interest rate locks to offset the losses and gains in the financial instruments they hedge.
Following are our interest rate derivatives subject to material interest rate risk as of December 31, 2013. The interest rates illustrated below refer to the average rates we expect to pay based on current and implied forward rates and the average rates we expect to receive based on derivative contracts. The notional amount is the principal amount of the debt subject to the interest rate swap contracts. The fair value asset (liability) represents the amount we would receive (pay) if we had exited the contracts as of December 31, 2013.
MARKET RISKWe are exposed to market risks primarily from changes in interest rates and foreign currency exchange rates. These risks, along with other business risks, impact our cost of capital. It is our policy to manage our debt structure and foreign exchange exposure in order to manage capital costs, control financial risks and maintain financial flexibility over the long term. In managing market risks, we employ derivatives according to documented policies and procedures, including interest rate swaps, interest rate locks, foreign currency exchange contracts and combined interest rate foreign currency contracts (cross-currency swaps). We do not use derivatives for trading or speculative purposes. We do not foresee significant changes in the strategies we use to manage market risk in the near future.
Interest Rate RiskThe majority of our financial instruments are medium- and long-term fixed-rate notes and debentures. Changes in interest rates can lead to significant fluctuations in the fair value of these instruments. The principal amounts by expected maturity, average interest rate and fair value of our liabilities that are exposed to interest rate risk are described in Notes 9 and 10. In managing interest expense, we control our mix of fixed and floating rate debt, principally through the use of interest rate swaps. We have
Maturity
Fair Value 2014 2015 2016 2017 2018 Thereafter Total 12/31/13
Interest Rate Derivatives
Interest Rate Swaps:Receive Fixed/Pay Variable Notional Amount Maturing $ 500 $1,500 $ — $ — $1,000 $1,750 $4,750 $184Weighted-Average Variable Rate Payable1 2.3% 3.2% 4.8% 5.9% 7.3% 7.9%Weighted-Average Fixed Rate Receivable 4.6% 5.1% 5.7% 5.7% 5.8% 5.8% 1 Interest payable based on current and implied forward rates for One, Three, or Six Month LIBOR plus a spread ranging between approximately 4 and 425 basis points.
Through cross-currency swaps, all our foreign-denominated debt has been swapped from fixed-rate foreign currencies to fixed-rate U.S. dollars at issuance, removing interest rate risk and foreign currency exchange risk associated with the underlying interest and principal payments. We expect gains or losses in our cross-currency swaps to offset the losses and gains in the financial instruments they hedge.
Foreign Exchange RiskWe are exposed to foreign currency exchange risk through our foreign affiliates and equity investments in foreign companies. We do not hedge foreign currency translation risk in the net assets and income we report from these sources. However, we do hedge a portion of the exchange risk involved in anticipation of highly probable foreign currency-denominated transactions and cash flow streams, such as those related to issuing foreign-denominated debt, receiving dividends from foreign investments, and other receipts and disbursements.

Management’s Discussion and Analysis of Financial Condition and Results of Operations (continued)Dollars in millions except per share amounts
34 | AT&T Inc.
For the purpose of assessing specific risks, we use a sensitivity analysis to determine the effects that market risk exposures may have on the fair value of our financial instruments and results of operations. To perform the sensitivity analysis, we assess the risk of loss in fair values from the effect of a hypothetical 10% depreciation of the U.S. dollar against foreign currencies from the prevailing foreign currency exchange rates, assuming no change in interest rates. We had no foreign exchange forward contracts outstanding at December 31, 2013.
In anticipation of other foreign currency-denominated transactions, we often enter into foreign exchange forward contracts to provide currency at a fixed rate. Our policy is to measure the risk of adverse currency fluctuations by calculating the potential dollar losses resulting from changes in exchange rates that have a reasonable probability of occurring. We cover the exposure that results from changes that exceed acceptable amounts.
STOCK PERFORMANCE GRAPH
Comparison of Five Year Cumulative Total ReturnAT&T Inc., S&P 500 Index, and S&P 500 Integrated Telecom Index
240
220
200
180
160
140
120
100
80
12/08 12/09 12/10 12/11 12/12 12/13
S&P 500 IntegratedTelecom Index
AT&T Inc. S&P 500 Index
126
128
165
117
150
105
157
174
S&P 500 IntegratedTelecom Index
AT&T Inc.
S&P 500 Index
137
106
126
145149
172
228
The comparison above assumes $100 invested on December 31, 2008, in AT&T common stock, Standard & Poor’s 500 Index (S&P 500), and Standard & Poor’s 500 Integrated Telecom Index (S&P 500 Integrated Telecom). Total return equals stock price appreciation plus reinvestment of dividends.
The current U.S. economy has changed our customers’ buying habits and a failure to adequately respond could materially adversely affect our business.We provide services and products to consumers and large and small businesses in the United States and to larger businesses throughout the world. The current slow economic recovery in the United States continues to pressure our customers’ demand for and ability to pay for existing services, especially local landline service, and their interest in purchasing new services. Customers are changing their buying habits in response to both ongoing
RISK FACTORS
In addition to the other information set forth in this document, including the matters contained under the caption “Cautionary Language Concerning Forward- Looking Statements,” you should carefully read the matters described below. We believe that each of these matters could materially affect our business. We recognize that most of these factors are beyond our ability to control and therefore we cannot predict an outcome. Accordingly, we have organized them by first addressing general factors, then industry factors and, finally, items specifically applicable to us.

AT&T Inc. | 35
funding of credit lines and other short-term debt obligations, including commercial paper. These financial institutions also face new capital-related and other regulations in the United States and Europe, as well as ongoing legal and financial issues concerning their loan portfolios, which may hamper their ability to provide credit or raise the cost of providing such credit. A company’s cost of borrowing is also affected by evaluations given by various credit rating agencies and these agencies have been applying tighter credit standards when evaluating a company’s debt levels and future growth prospects. While we have been successful in continuing to access the credit and fixed income markets when needed, adverse changes in the financial markets could render us either unable to access these markets or able to access these markets only at higher interest costs and with restrictive financial or other conditions, severely affecting our business operations.
Changes in available technology could increase competition and our capital costs.The telecommunications industry has experienced rapid changes in the past several years. The development of wireless, cable and IP technologies has significantly increased the commercial viability of alternatives to traditional wireline telephone service and enhanced the capabilities of wireless networks. In addition, our customers continue to demand services that can be accessed on mobile devices, especially video services. In order to remain competitive, we are deploying a more sophisticated wireline network and continue to deploy a more sophisticated wireless network, as well as research other new technologies. We expect our plans to significantly expand and enhance our wireless and wireline IP broadband networks will result in increased capital expenditures and increased debt levels as these plans are implemented. If the new technologies we have adopted or on which we have focused our research efforts fail to be cost-effective and accepted by customers, our ability to remain competitive could be materially adversely affected.
Changes to federal, state and foreign government regulations and decisions in regulatory proceedings could further increase our operating costs and/or alter customer perceptions of our operations, which could materially adversely affect us.Our wireline subsidiaries are subject to significant federal and state regulation while many of our competitors are not. In addition, our subsidiaries and affiliates operating outside the United States are also subject to the jurisdiction of national and supranational regulatory authorities in the market where service is provided. Our wireless subsidiaries are regulated to varying degrees by the FCC and some state and local agencies. Adverse rulings by the FCC relating to broadband issues could impede our ability to manage
anemic economic conditions and technological advances. Should we fail to respond promptly to address these changes in customer demands, we are likely to experience greater pressure on pricing and margins as we continue to compete for customers who would have even less discretionary income.
Adverse changes in medical costs and the U.S. securities markets and a further decline in interest rates could materially increase our benefit plan costs.Our costs to provide current benefits and funding for future benefits are subject to increases, primarily due to continuing increases in medical and prescription drug costs, and can be affected by lower returns on funds held by our pension and other benefit plans, which are reflected in our financial statements for that year. Investment returns on these funds depend largely on trends in the U.S. securities markets and the U.S. economy. We have experienced historically low interest rates during the last several years. While rates have increased recently, we expect relatively stable rates to continue for the next several years. Recent increases in the rates have led to better than assumed investment returns on our plan assets and to lower funding obligations. In calculating the costs included on our financial statements of providing benefits under our plans, we have made certain assumptions regarding future investment returns, medical costs and interest rates. If actual investment returns, medical costs and interest rates are worse than those previously assumed, our costs will increase.
The Financial Accounting Standards Board requires companies to recognize the funded status of defined benefit pension and postretirement plans as an asset or liability in our statement of financial position and to recognize changes in that funded status in the year in which the changes occur. We have elected to reflect the annual adjustments to the funded status in our consolidated statement of income. Therefore, an increase in our costs or adverse market conditions will have a negative effect on our operating results.
Adverse changes in global financial markets could limit our ability and our larger customers’ ability to access capital or increase the cost of capital needed to fund business operations.While the global financial markets were stable during 2013, a continuing uncertainty surrounding global growth rates has resulted in periodic volatility in the credit, currency, equity and fixed income markets. Volatility in some areas, such as in emerging markets, may affect companies’ access to the credit markets, leading to higher borrowing costs for companies or, in some cases, the inability of these companies to fund their ongoing operations. In addition, we contract with large financial institutions to support our own treasury operations, including contracts to hedge our exposure on interest rates and foreign exchange and the

Management’s Discussion and Analysis of Financial Condition and Results of Operations (continued)Dollars in millions except per share amounts
36 | AT&T Inc.
Increasing competition for wireless customers could adversely affect our operating results.We have multiple wireless competitors in each of our service areas and compete for customers based principally on service/device offerings, price, call quality, coverage area and customer service. In addition, we are facing growing competition from providers offering services using alternative wireless technologies and IP-based networks as well as traditional wireline networks. We expect market saturation to continue to cause the wireless industry’s customer growth rate to moderate in comparison with historical growth rates, leading to increased competition for customers. We also expect that our customers’ growing demand for data services will place constraints on our network capacity. This competition and our capacity issues will continue to put pressure on pricing and margins as companies compete for potential customers. Our ability to respond will depend, among other things, on continued improvement in network quality and customer service and effective marketing of attractive products and services, and cost management. These efforts will involve significant expenses and require strategic management decisions on, and timely implementation of, equipment choices, network deployment and management, and service offerings.
Increasing costs in our wireline operations could adversely affect wireline operating margins.We expect our operating costs, including customer acquisition and retention costs will continue to put pressure on pricing, margins and customer retention levels. A number of our competitors that rely on alternative technologies (e.g., wireless, cable and VoIP) and business models (e.g., advertising-supported) are typically subject to less (or no) regulation than our wireline subsidiaries and therefore are able to operate with lower costs. These competitors also have cost advantages compared to us, due in part to operating on newer, more technically advanced and lower-cost networks and a nonunionized workforce, lower employee benefits and fewer retirees (as most of the competitors are relatively new companies). Over time these cost disparities could require us to evaluate the strategic worth of various wireline operations. To this end, we have begun initiatives at both the state and federal levels to obtain regulatory approvals, where needed, to transition services from our older copper-based network to an advanced IP-based network. If we do not obtain regulatory approvals for this transition or obtain approvals with onerous conditions attached, we could experience significant cost and competitive disadvantages.
our networks and recover costs and lessen incentives to invest in our networks. The development of new technologies, such as IP-based services, also has created or potentially could create conflicting regulation between the FCC and various state and local authorities, which may involve lengthy litigation to resolve and may result in outcomes unfavorable to us. In addition, increased public focus on a variety of issues related to our operations, such as privacy issues, government requests or orders for customer data, and potential global climate changes, have led to proposals at state, federal and foreign government levels to change or increase regulation on our operations. Should customers decide that our competitors operate in a more customer-friendly environment, we could be materially adversely affected.
Continuing growth in our wireless services will depend on continuing access to adequate spectrum, deployment of new technology and offering attractive services to customers.The wireless industry is undergoing rapid and significant technological changes and a dramatic increase in usage, in particular demand for and usage of data, video and other non-voice services. We must continually invest in our wireless network in order to continually improve our wireless service to meet this increasing demand and remain competitive. Improvements in our service depend on many factors, including continued access to and deployment of adequate spectrum. We must maintain and expand our network capacity and coverage as well as the associated wireline network needed to transport voice and data between cell sites. To this end, we continue to deploy technology advancements in order to further improve network quality and the efficient use of our spectrum.
Network service enhancements and product launches may not occur as scheduled or at the cost expected due to many factors, including delays in determining equipment and handset operating standards, supplier delays, increases in network equipment and handset component costs, regulatory permitting delays for tower sites or enhancements or labor-related delays. Deployment of new technology also may adversely affect the performance of the network for existing services. If the FCC does not fairly allocate sufficient spectrum to allow the wireless industry in general, and the Company in particular, to increase its capacity or if we cannot acquire needed spectrum or deploy the services customers desire on a timely basis without burdensome conditions or at adequate cost while maintaining network quality levels, then our ability to attract and retain customers, and therefore maintain and improve our operating margins, could be materially adversely affected.

AT&T Inc. | 37
Equipment failures, natural disasters, computer hacking and terrorist acts may materially adversely affect our operations.Major equipment failures or natural disasters, including severe weather, computer hacking, terrorist acts or other breaches of network or IT security that affect our wireline and wireless networks, including telephone switching offices, microwave links, third-party-owned local and long-distance networks on which we rely, our cell sites or other equipment, or our customer account support and information systems, could have a material adverse effect on our operations. While we have been subject to security breaches or cyber attacks, these did not result in a material adverse effect on our operations. Our inability to operate our wireline, wireless or customer-related support systems as a result of such events, even for a limited time period, could result in significant expenses, potential legal liability or a loss of customers or impair our ability to attract new customers, any of which could have a material adverse effect on our business, results of operations and financial condition.
The continued success of Project VIP will depend on the development of our U-verse services and wireless initiatives; attractive and profitable broadband and video service offerings; the extent to which regulatory, franchise fees and build-out requirements apply to this initiative; the availability of content on reasonable terms and conditions, including price, and the availability and reliability of the various technologies required to provide such offerings.Telecommunications technology has shifted from the traditional circuit- and wire-based technology to IP-based technology. IP-based technology can transport voice and data, as well as video, from both wired and wireless networks. IP-based networks also potentially cost less to operate than traditional networks. Our competitors, many of which are newer companies, are deploying this IP-based technology. In order to continue to offer attractive and competitively priced services, we have deployed a new broadband network to offer IP-based voice, data and video services. Should regulatory requirements change, our deployment could be limited to only those geographical areas where regulation is not burdensome. In addition, should the delivery of services expected to be deployed on our network be delayed due to technological or regulatory constraints, performance of suppliers, or other reasons, or the cost of providing such services, including the availability and cost of content for our video offerings, becomes higher than expected, customers may decide to purchase services from our competitors, which would adversely affect our revenues and margins, and such effects could be material.
Unfavorable litigation or governmental investigation results could require us to pay significant amounts or lead to onerous operating procedures.We are subject to a number of lawsuits both in the United States and in foreign countries, including, at any particular time, claims relating to antitrust; patent infringement; wage and hour; personal injury; customer privacy violations; and our advertising, sales and billing and collection practices. We also spend substantial resources complying with various government standards, which may entail related investigations. As we deploy newer technologies, especially in the wireless area, we also face current and potential litigation relating to alleged adverse health effects on customers or employees who use such technologies including, for example, wireless handsets. We may incur significant expenses defending such suits or government charges and may be required to pay amounts or otherwise change our operations in ways that could materially adversely affect our operations or financial results.

Management’s Discussion and Analysis of Financial Condition and Results of Operations (continued)Dollars in millions except per share amounts
38 | AT&T Inc.
•Theabilityofourcompetitorstoofferproduct/serviceofferingsatlowerpricesduetolowercoststructuresandregulatoryandlegislativeactionsadversetous,includingstateregulatoryproceedingsrelatingtounbundlednetworkelementsandnonregulationofcomparablealternativetechnologies(e.g.,VoIP).
•ThecontinueddevelopmentofattractiveandprofitableU-verseserviceofferings;theextenttowhichregulatory,franchisefeesandbuild-outrequirementsapplytothisinitiative;andtheavailability,costand/orreliabilityofthevarioustechnologiesand/orcontentrequiredtoprovidesuchofferings.
•Ourcontinuedabilitytoattractandofferadiverseportfolioofwirelessdevices,someonanexclusivebasis.
•Theavailabilityandcostofadditionalwirelessspectrumandregulationsandconditionsrelatingtospectrumuse,licensing,obtainingadditionalspectrum,technicalstandardsanddeploymentandusage,includingnetworkmanagementrules.
•Ourabilitytomanagegrowthinwirelessdataservices,includingnetworkqualityandacquisitionofadequatespectrumatreasonablecostsandterms.
•Theoutcomeofpending,threatenedorpotentiallitigation,includingpatentandproductsafetyclaimsbyoragainst thirdparties.
•Theimpactonournetworksandbusinessfrommajorequipmentfailures;securitybreachesrelatedtothenetwork orcustomerinformation;ourinabilitytoobtainhandsets,equipment/softwareorhavehandsets,equipment/softwareservicedinatimelyandcost-effectivemannerfromsuppliers;orsevereweatherconditions,naturaldisasters,pandemics,energyshortages,warsorterroristattacks.
•TheissuancebytheFinancialAccountingStandardsBoard orotheraccountingoversightbodiesofnewaccountingstandardsorchangestoexistingstandards.
•TheissuancebytheInternalRevenueServiceand/orstatetaxauthoritiesofnewtaxregulationsorchangestoexistingstandardsandactionsbyfederal,stateorlocaltaxagenciesandjudicialauthoritieswithrespecttoapplyingapplicabletaxlawsandregulationsandtheresolutionofdisputeswithanytaxingjurisdictions.
•Ourabilitytoadequatelyfundourwirelessoperations,includingpaymentforadditionalspectrum,networkupgradesandtechnologicaladvancements.
•Changesinourcorporatestrategies,suchaschangingnetworkrequirementsoracquisitionsanddispositions,whichmayrequiresignificantamountsofcashorstock,torespondtocompetitionandregulatory,legislativeandtechnologicaldevelopments.
•Theuncertaintysurroundingfurthercongressionalactiontoaddressspendingreductions,whichmayresultinasignificantreductioningovernmentspendingandreluctanceofbusinessesandconsumerstospendingeneralandonourproductsandservicesspecifically,duetothisfiscaluncertainty.
Readersarecautionedthatotherfactorsdiscussedinthisreport,althoughnotenumeratedhere,alsocouldmateriallyaffectourfutureearnings.
CAUTIONARY LANGUAGE CONCERNING FORWARD-LOOKING STATEMENTS
Informationsetforthinthisreportcontainsforward-lookingstatementsthataresubjecttorisksanduncertainties,andactualresultscoulddiffermaterially.Manyofthesefactorsarediscussed inmoredetailinthe“RiskFactors”section.Weclaimtheprotectionofthesafeharborforforward-lookingstatementsprovidedbythePrivateSecuritiesLitigationReformActof1995.
Thefollowingfactorscouldcauseourfutureresultstodiffermateriallyfromthoseexpressedintheforward-lookingstatements:
•Adverseeconomicand/orcapitalaccesschangesinthemarketsservedbyusorincountriesinwhichwehavesignificantinvestments,includingtheimpactoncustomerdemandandourabilityandoursuppliers’abilitytoaccessfinancialmarketsatfavorableratesandterms.
•Changesinavailabletechnologyandtheeffectsofsuchchanges,includingproductsubstitutionsanddeploymentcosts.
•Increasesinourbenefitplans’costs,includingincreasesduetoadversechangesintheUnitedStatesandforeignsecuritiesmarkets,resultinginworse-than-assumedinvestmentreturnsanddiscountrates;adversemedicalcosttrends,unfavorableordelayedimplementationofhealthcarelegislation,regulationsorrelatedcourtdecisions;andourinabilitytoreceiveretroactiveapprovalfromtheDOLofourvoluntarycontributionofapreferredinterestinourwirelessbusiness.
•ThefinaloutcomeofFCCandotherfederalorstateagencyproceedings(includingjudicialreview,ifany,ofsuchproceedings)involvingissuesthatareimportanttoourbusiness,including,withoutlimit,intercarriercompensation,interconnectionobligations,thetransitionfromlegacytechnologiestoIP-basedinfrastructure,universalservice,broadbanddeployment,E911services,competitionpolicy,netneutrality,unbundlednetworkelementsandotherwholesaleobligations,availabilityofnewspectrumfromtheFCConfairandbalancedterms,andwirelesslicenseawardsandrenewals.
•Thefinaloutcomeofstateandfederallegislativeeffortsinvolvingissuesthatareimportanttoourbusiness,includingderegulationofIP-basedservices,relieffromCarrierofLastResortobligations,andeliminationofstatecommissionreviewofthewithdrawalofservices.
•Enactmentofadditionalstate,federaland/orforeignregulatoryandtaxlawsandregulationspertainingtooursubsidiariesandforeigninvestments,includinglawsandregulationsthatreduceourincentivetoinvestinournetworks,resultinginlowerrevenuegrowthand/orhigheroperatingcosts.
•Ourabilitytoabsorbrevenuelossescausedbyincreasingcompetition,includingofferingsthatusealternativetechnologies(e.g.,cable,wirelessandVoIP)andourabilitytomaintaincapitalexpenditures.
•Theextentofcompetitionandtheresultingpressureoncustomerandaccesslinetotalsandwirelineandwirelessoperatingmargins.
•Ourabilitytodevelopattractiveandprofitableproduct/serviceofferingstooffsetincreasingcompetitioninourwirelessandwirelinemarkets.

AT&T Inc. | 39
Consolidated Statements of IncomeDollars in millions except per share amounts
2013 2012 2011
Operating Revenues $128,752 $127,434 $126,723
Operating ExpensesCost of services and sales (exclusive of depreciation and amortization shown separately below) 51,464 55,228 54,904Selling, general and administrative 28,414 41,066 41,314Impairment of intangible assets — — 2,910Depreciation and amortization 18,395 18,143 18,377
Total operating expenses 98,273 114,437 117,505
Operating Income 30,479 12,997 9,218
Other Income (Expense)Interest expense (3,940) (3,444) (3,535)Equity in net income of affiliates 642 752 784Other income (expense) – net 596 134 249
Total other income (expense) (2,702) (2,558) (2,502)
Income Before Income Taxes 27,777 10,439 6,716Income tax expense 9,224 2,900 2,532
Net Income 18,553 7,539 4,184
Less: Net Income Attributable to Noncontrolling Interest (304) (275) (240)
Net Income Attributable to AT&T $ 18,249 $ 7,264 $ 3,944
Basic Earnings Per Share Attributable to AT&T $ 3.39 $ 1.25 $ 0.66Diluted Earnings Per Share Attributable to AT&T $ 3.39 $ 1.25 $ 0.66
The accompanying notes are an integral part of the consolidated financial statements.

40 | AT&T Inc.
2013 2012 2011
Net income $18,553 $7,539 $4,184Other comprehensive income, net of tax:Foreign Currency: Foreign currency translation adjustments (includes $(2), $0 and $(1) attributable to noncontrolling interest), net of taxes of $(78), $48 and $(117) (140) 87 (219) Reclassification adjustment included in net income, net of taxes of $30, $0 and $183 55 — 341 Available-for-sale securities: Net unrealized gains (losses), net of taxes of $137, $64, and $(21) 257 118 (41) Reclassification adjustment included in net income, net of taxes of $(42), $(36) and $(29) (79) (68) (54)Cash flow hedges: Net unrealized gains (losses), net of taxes of $286, $154 and $(140) 525 283 (256) Reclassification adjustment included in net income, net of taxes of $16, $15 and $8 30 28 15Defined benefit postretirement plans: Net actuarial loss from equity method investees arising during period, net of taxes of $0, $(32) and $0 — (53) — Reclassification adjustment included in net income, net of taxes of $7, $0 and $0 11 — — Net prior service credit arising during period, net of taxes of $1,695, $1,378 and $699 2,765 2,249 1,140 Amortization of net prior service credit included in net income, net of taxes of $(480), $(361) and $(282) (782) (588) (460) Other — — 1
Other comprehensive income 2,642 2,056 467
Total comprehensive income 21,195 9,595 4,651Less: Total comprehensive income attributable to noncontrolling interest (302) (275) (239)
Total Comprehensive Income Attributable to AT&T $20,893 $9,320 $4,412
The accompanying notes are an integral part of the consolidated financial statements.
Consolidated Statements of Comprehensive IncomeDollars in millions

AT&T Inc. | 41
Consolidated Balance SheetsDollars in millions except per share amounts
December 31,
2013 2012
AssetsCurrent AssetsCash and cash equivalents $ 3,339 $ 4,868Accounts receivable – net of allowances for doubtful accounts of $483 and $547 12,918 12,657Prepaid expenses 960 1,035Deferred income taxes 1,199 1,036Other current assets 4,780 3,110
Total current assets 23,196 22,706
Property, Plant and Equipment – Net 110,968 109,767Goodwill 69,273 69,773Licenses 56,433 52,352Customer Lists and Relationships – Net 763 1,391Other Intangible Assets – Net 5,016 5,032Investments in and Advances to Equity Affiliates 3,860 4,581Other Assets 8,278 6,713
Total Assets $277,787 $272,315
Liabilities and Stockholders’ EquityCurrent LiabilitiesDebt maturing within one year $ 5,498 $ 3,486Accounts payable and accrued liabilities 21,107 20,494Advanced billings and customer deposits 4,212 4,225Accrued taxes 1,774 1,026Dividends payable 2,404 2,556
Total current liabilities 34,995 31,787
Long-Term Debt 69,290 66,358
Deferred Credits and Other Noncurrent LiabilitiesDeferred income taxes 36,308 28,491Postemployment benefit obligation 29,946 41,392Other noncurrent liabilities 15,766 11,592
Total deferred credits and other noncurrent liabilities 82,020 81,475
Stockholders’ EquityCommon stock ($1 par value, 14,000,000,000 authorized at December 31, 2013 and 2012: issued 6,495,231,088 at December 31, 2013 and 2012) 6,495 6,495Additional paid-in capital 91,091 91,038Retained earnings 31,141 22,481Treasury stock (1,268,914,913 at December 31, 2013 and 913,836,325 at December 31, 2012, at cost) (45,619) (32,888)Accumulated other comprehensive income 7,880 5,236Noncontrolling interest 494 333
Total stockholders’ equity 91,482 92,695
Total Liabilities and Stockholders’ Equity $277,787 $272,315
The accompanying notes are an integral part of the consolidated financial statements.

42 | AT&T Inc.
Consolidated Statements of Cash FlowsDollars in millions
2013 2012 2011
Operating ActivitiesNet income $ 18,553 $ 7,539 $ 4,184Adjustments to reconcile net income to net cash provided by operating activities: Depreciation and amortization 18,395 18,143 18,377 Undistributed earnings from investments in equity affiliates (324) (615) (623) Provision for uncollectible accounts 954 1,117 1,136 Deferred income tax expense 6,242 1,747 2,929 Net (gain) loss from sale of investments, net of impairments (492) (19) (89) Impairment of intangible assets — — 2,910 Actuarial (gain) loss on pension and postretirement benefits (7,584) 9,994 6,280Changes in operating assets and liabilities: Accounts receivable (1,329) (1,365) (1,164) Other current assets 412 1,017 (397) Accounts payable and accrued liabilities (152) 1,798 (341)Retirement benefit funding (209) — (1,000)Other − net 330 (180) 2,541
Total adjustments 16,243 31,637 30,559
Net Cash Provided by Operating Activities 34,796 39,176 34,743
Investing ActivitiesConstruction and capital expenditures: Capital expenditures (20,944) (19,465) (20,110) Interest during construction (284) (263) (162)Acquisitions, net of cash acquired (4,113) (828) (2,368)Dispositions 1,923 812 1,301Sales (purchases) of securities, net — 65 62Return of advances to and investments in equity affiliates 301 — —Other (7) (1) 27
Net Cash Used in Investing Activities (23,124) (19,680) (21,250)
Financing ActivitiesNet change in short-term borrowings with original maturities of three months or less 20 1 (1,625)Issuance of other short-term borrowings 1,476 — —Repayment of other short-term borrowings (1,476) — (28)Issuance of long-term debt 12,040 13,486 7,936Repayment of long-term debt (7,698) (8,733) (7,574)Issuance of other long-term financing obligations 4,796 — —Purchase of treasury stock (13,028) (12,752) —Issuance of treasury stock 114 477 237Dividends paid (9,696) (10,241) (10,172)Other 251 89 (423)
Net Cash Used in Financing Activities (13,201) (17,673) (11,649)
Net (decrease) increase in cash and cash equivalents (1,529) 1,823 1,844Cash and cash equivalents beginning of year 4,868 3,045 1,201
Cash and Cash Equivalents End of Year $ 3,339 $ 4,868 $ 3,045
The accompanying notes are an integral part of the consolidated financial statements.

AT&T Inc. | 43
2013 2012 2011
Shares Amount Shares Amount Shares Amount
Common StockBalance at beginning of year 6,495 $ 6,495 6,495 $ 6,495 6,495 $ 6,495Issuance of stock — — — — — —
Balance at end of year 6,495 $ 6,495 6,495 $ 6,495 6,495 $ 6,495
Additional Paid-In CapitalBalance at beginning of year $ 91,038 $ 91,156 $ 91,731Issuance of treasury stock (8) 120 132Share-based payments 62 (78) (118)Share of equity method investee capital transactions — (160) (290)Change related to acquisition of interests held by noncontrolling owners (1) — (299)
Balance at end of year $ 91,091 $ 91,038 $ 91,156
Retained EarningsBalance at beginning of year $ 22,481 $ 25,453 $ 31,792Net income attributable to AT&T ($3.39, $1.25 and $0.66 per diluted share) 18,249 7,264 3,944Dividends to stockholders ($1.81, $1.77 and $1.73 per share) (9,589) (10,236) (10,283)
Balance at end of year $ 31,141 $ 22,481 $ 25,453
Treasury StockBalance at beginning of year (914) $(32,888) (568) $ (20,750) (584) $ (21,083)Repurchase of common stock (366) (13,028) (371) (12,752) — —Issuance of treasury stock 11 297 25 614 16 333
Balance at end of year (1,269) $(45,619) (914) $ (32,888) (568) $ (20,750)
Accumulated Other Comprehensive Income Attributable to AT&T, net of tax:Balance at beginning of year $ 5,236 $ 3,180 $ 2,712Other comprehensive income attributable to AT&T 2,644 2,056 468
Balance at end of year $ 7,880 $ 5,236 $ 3,180
Noncontrolling Interest:Balance at beginning of year $ 333 $ 263 $ 303Net income attributable to noncontrolling interest 304 275 240Distributions (231) (205) (220)Contributions 51 — —Acquisitions of noncontrolling interests 44 — —Acquisition of interests held by noncontrolling owners (5) — (59)Translation adjustments attributable to noncontrolling interest, net of taxes (2) — (1)
Balance at end of year $ 494 $ 333 $ 263
Total Stockholders’ Equity at beginning of year $ 92,695 $105,797 $111,950
Total Stockholders’ Equity at end of year $ 91,482 $ 92,695 $105,797
The accompanying notes are an integral part of the consolidated financial statements.
Consolidated Statements of Changes in Stockholders’ EquityDollars and shares in millions except per share amounts

44 | AT&T Inc.
Notes to Consolidated Financial StatementsDollars in millions except per share amounts
upon either usage (e.g., minutes of traffic/bytes of data processed), period of time (e.g., monthly service fees) or other established fee schedules. Our service revenues are billed either in advance, arrears or are prepaid.
We record revenue reductions for estimated future adjustments to customer accounts, other than bad debt expense, at the time revenue is recognized based on historical experience. Service revenues also include billings to our customers for various regulatory fees imposed on us by governmental authorities. Cash incentives given to customers are recorded as a reduction of revenue. When required as part of providing service, revenues and associated expenses related to nonrefundable, upfront service activation and setup fees are deferred and recognized over the associated service contract period or customer life. Associated expenses are deferred only to the extent of such deferred revenue. For contracts that involve the bundling of services, revenue is allocated to the services based on their relative selling price, subject to the requirement that revenue recognized is limited to the amounts received from the customer that are not contingent upon the delivery of additional products or services to the customer in the future. We record the sale of equipment to customers as gross revenue when we are the principal in the arrangement, when title is passed and when the products are accepted by customers. For agreements involving the resale of third-party services in which we are not considered the principal in the arrangement, we record the revenue net of the associated costs incurred.
We offer to our customers the option to purchase certain devices in installments over a period of up to 26 months, with the right to trade in for a new device after a specified period of time and have the remaining unpaid balance waived for the original device. For customers that elect these trade-in programs, we recognize revenue for the entire amount of the customer receivable, net of the fair value of the trade-in right guarantee and imputed interest. As of December 31, 2013, total equipment installment plan receivables of $863 were recorded in “Accounts receivable” or “Other assets” on our consolidated balance sheets.
Allowance for Doubtful Accounts We record expense to maintain an allowance for doubtful accounts for estimated losses that result from the failure or inability of our customers to make required payments deemed collectable from the customer when the service was provided or product was delivered. When determining the allowance, we consider the probability of recoverability of accounts receivable based on past experience, taking into account current collection trends as well as general economic factors, including bankruptcy rates. Credit risks are assessed based on historical
NOTE 1. SUMMARY OF SIGNIFICANT ACCOUNTING POLICIES
Basis of Presentation Throughout this document, AT&T Inc. is referred to as “AT&T,” “we” or the “Company.” The consolidated financial statements include the accounts of the Company and our majority-owned subsidiaries and affiliates. Our subsidiaries and affiliates operate in the communications services industry both domestically and internationally, providing wireless communications services, traditional wireline voice services, data/broadband and Internet services, video services, telecommunications equipment, managed networking and wholesale services.
All significant intercompany transactions are eliminated in the consolidation process. Investments in partnerships and less than majority-owned subsidiaries where we have significant influence are accounted for under the equity method. Earnings from certain foreign equity investments accounted for using the equity method are included for periods ended within up to one month of our year end (see Note 8). We also record our proportionate share of our equity method investees’ other comprehensive income (OCI) items, including actuarial gains and losses on pension and other postretirement benefit obligations.
The preparation of financial statements in conformity with U.S. generally accepted accounting principles (GAAP) requires management to make estimates and assumptions that affect the amounts reported in the financial statements and accompanying notes, including estimates of probable losses and expenses. Actual results could differ from those estimates. Certain amounts have been reclassified to conform to the current period’s presentation.
Income Taxes We provide deferred income taxes for temporary differences between the carrying amounts of assets and liabilities for financial reporting purposes and the computed tax basis of those assets and liabilities. We provide valuation allowances against the deferred tax assets for which the realization is uncertain. We review these items regularly in light of changes in federal and state tax laws and changes in our business.
We report revenues from transactions between us and our customers net of taxes imposed by government authorities in our consolidated statements of income.
Cash and Cash Equivalents Cash and cash equivalents include all highly liquid investments with original maturities of three months or less. The carrying amounts approximate fair value. At December 31, 2013, we held $697 in cash and $2,642 in money market funds and other cash equivalents.
Revenue Recognition Revenues derived from wireless, local telephone, long distance, data and video services are recognized when services are provided. This is based

AT&T Inc. | 45
Software Costs It is our policy to capitalize certain costs incurred in connection with developing or obtaining internal-use software. Capitalized software costs are included in “Property, Plant and Equipment” on our consolidated balance sheets and are primarily amortized over a three-year period. In addition, there is certain network software that allows the equipment to provide the features and functions unique to the AT&T network, which we include in the cost of the equipment categories for financial reporting purposes.
Goodwill and Other Intangible Assets AT&T has four major classes of intangible assets: goodwill, Federal Communications Commission (FCC) licenses, other indefinite-lived intangible assets, made up predominately of the AT&T brand, and various other finite-lived intangible assets (see Note 7).
Goodwill represents the excess of consideration paid over the fair value of net assets acquired in business combinations. FCC licenses provide us with the exclusive right to utilize certain radio frequency spectrum to provide wireless communications services. While FCC licenses are issued for a fixed period of time (generally 10 years), renewals of FCC licenses have occurred routinely and at nominal cost. Moreover, we have determined that there are currently no legal, regulatory, contractual, competitive, economic or other factors that limit the useful lives of our FCC licenses. We acquired the rights to the AT&T and other brand names in previous acquisitions. We have the effective ability to retain these exclusive rights permanently at a nominal cost.
Goodwill, FCC licenses and other indefinite-lived intangible assets are not amortized but are tested at least annually for impairment. The testing is performed on the value as of October 1 each year, and compares the book value of the assets to their fair value. Goodwill is tested by comparing the book value of each reporting unit, deemed to be our principal operating segments (Wireless and Wireline), to the fair value of those reporting units calculated under a discounted cash flow approach as well as a market multiple approach. FCC licenses are tested for impairment on an aggregate basis, consistent with the management of the business on a national scope. We perform our test of the fair values of FCC licenses using a discounted cash flow approach. Brand names are tested by comparing the book value to a fair value calculated using a discounted cash flow approach on a presumed royalty rate derived from the revenues related to the brand name. The fair value measurements used are considered Level 3 under the Fair Value Measurement and Disclosure framework (see Note 10).
Intangible assets that have finite useful lives are amortized over their useful lives (see Note 7). Customer lists and relationships are amortized using primarily the
write-offs, net of recoveries, as well as an analysis of the aged accounts receivable balances with allowances generally increasing as the receivable ages. Accounts receivable may be fully reserved for when specific collection issues are known to exist, such as pending bankruptcy or catastrophes.
Inventory Inventories, which are included in “Other current assets” on our consolidated balance sheets, were $1,148 at December 31, 2013, and $1,036 at December 31, 2012. Wireless devices and accessories, which are valued at the lower of cost or market (determined using current replacement cost) were $1,031 at December 31, 2013, and $888 at December 31, 2012.
Property, Plant and Equipment Property, plant and equipment is stated at cost, except for assets acquired using acquisition accounting, which are initially recorded at fair value (see Note 6). The balance as of December 31, 2013, excluded amounts classified as held for sale (see Note 5). The cost of additions and substantial improvements to property, plant and equipment is capitalized, and includes internal compensation costs for these projects; however, noncash actuarial gains or losses included in compensation costs are excluded from our capital expenditures reported on the consolidated statements of cash flows. The cost of maintenance and repairs of property, plant and equipment is charged to operating expenses. Property, plant and equipment costs are depreciated using straight-line methods over their estimated economic lives. Certain subsidiaries follow composite group depreciation methodology. Accordingly, when a portion of their depreciable property, plant and equipment is retired in the ordinary course of business, the gross book value is reclassified to accumulated depreciation, and no gain or loss is recognized on the disposition of these assets.
Property, plant and equipment is reviewed for recoverability whenever events or changes in circumstances indicate that the carrying amount may not be recoverable. We recognize an impairment loss when the carrying amount of a long-lived asset is not recoverable. The carrying amount of a long-lived asset is not recoverable if it exceeds the sum of the undiscounted cash flows expected to result from the use and eventual disposition of the asset.
The fair value of a liability for an asset retirement obligation is recorded in the period in which it is incurred if a reasonable estimate of fair value can be made. In periods subsequent to initial measurement, we recognize period-to-period changes in the liability resulting from the passage of time and revisions to either the timing or the amount of the original estimate. The increase in the carrying value of the associated long-lived asset is depreciated over the corresponding estimated economic life.

Notes to Consolidated Financial Statements (continued)Dollars in millions except per share amounts
46 | AT&T Inc.
Pension and Other Postretirement Benefits See Note 12 for a comprehensive discussion of our pension and postretirement benefit expense, including a discussion of the actuarial assumptions and our policy for recognizing the associated gains and losses.
NOTE 2. EARNINGS PER SHARE
A reconciliation of the numerators and denominators of basic earnings per share and diluted earnings per share for net income for the years ended December 31, 2013, 2012 and 2011, is shown in the table below:
Year Ended December 31, 2013 2012 2011
NumeratorsNumerator for basic earnings per share: Net income $18,553 $7,539 $4,184 Net income attributable to noncontrolling interest (304) (275) (240)
Net income attributable to AT&T 18,249 7,264 3,944 Dilutive potential common shares: Share-based payment 12 12 11
Numerator for diluted earnings per share $18,261 $7,276 $3,955
Denominators (000,000)Denominator for basic earnings per share: Weighted-average number of common shares outstanding 5,368 5,801 5,928 Dilutive potential common shares: Share-based payment (in shares) 17 20 22
Denominator for diluted earnings per share 5,385 5,821 5,950
Basic earnings per share attributable to AT&T $ 3.39 $ 1.25 $ 0.66
Diluted earnings per share attributable to AT&T $ 3.39 $ 1.25 $ 0.66
At December 31, 2013, 2012 and 2011, we had issued and outstanding options to purchase approximately 12 million, 17 million, and 66 million shares of AT&T common stock. The exercise prices of 3 million, 3 million, and 40 million shares in 2013, 2012, and 2011 were above the average market price of AT&T stock for the respective periods. Accordingly, we did not include these amounts in determining the dilutive potential common shares.
sum-of-the-months-digits method of amortization over the period in which those relationships are expected to contribute to our future cash flows. The remaining finite-lived intangible assets are generally amortized using the straight-line method.
Advertising Costs We expense advertising costs for advertising products and services or for promoting our corporate image as we incur them (see Note 15).
Traffic Compensation Expense We use various estimates and assumptions to determine the amount of traffic compensation expense recognized during any reporting period. Switched traffic compensation costs are accrued utilizing estimated rates and volumes by product, formulated from historical data and adjusted for known rate changes. Such estimates are adjusted monthly to reflect newly available information, such as rate changes and new contractual agreements. Bills reflecting actual incurred information are generally not received within three months subsequent to the end of the reporting period, at which point a final adjustment is made to the accrued switched traffic compensation expense. Dedicated traffic compensation costs are estimated based on the number of circuits and the average projected circuit costs.
Foreign Currency Translation We are exposed to foreign currency exchange risk through our foreign affiliates and equity investments in foreign companies. Our foreign subsidiaries and foreign investments generally report their earnings in their local currencies. We translate our share of their foreign assets and liabilities at exchange rates in effect at the balance sheet dates. We translate our share of their revenues and expenses using average rates during the year. The resulting foreign currency translation adjustments are recorded as a separate component of accumulated other comprehensive income (accumulated OCI) in the accompanying consolidated balance sheets. We do not hedge foreign currency translation risk in the net assets and income we report from these sources. However, we do hedge a portion of the foreign currency exchange risk involved in anticipation of highly probable foreign currency-denominated transactions, which we explain further in our discussion of our methods of managing our foreign currency risk (see Note 10).
Employee Separations We established obligations for expected termination benefits provided under existing plans to former or inactive employees after employment but before retirement. These benefits include severance payments, workers’ compensation, disability, medical continuation coverage and other benefits. During 2013, due to initiatives to streamline the business, we accrued $251 of anticipated employee separation costs. At December 31, 2013, we have severance accruals of $349, and at December 31, 2012, we had severance accruals of $120.

AT&T Inc. | 47
NOTE 3. OTHER COMPREHENSIVE INCOME
Changes in the balances of each component included in accumulated OCI for the year ended December 31, 2013, are presented below. All amounts are net of tax and exclude noncontrolling interest.
Foreign Net Unrealized Net Unrealized Defined Accumulated Currency Gains (Losses) on Gains (Losses) Benefit Other Translation Available-for- on Cash Flow Postretirement Comprehensive Adjustment5 Sale Securities5 Hedges5 Plans5 Income5
Balance as of December 31, 2012 $ (284) $ 272 $(110) $ 5,358 $ 5,236Other comprehensive income (loss) before reclassifications (138) 257 525 2,765 3,409Amounts reclassified from accumulated OCI 551 (79)2 303 (771)4 (765)
Net other comprehensive income (loss) (83) 178 555 1,994 2,644
Balance as of December 31, 2013 $(367) $450 $445 $7,352 $7,880 1 Pre-tax translation loss reclassifications are included in Other income (expense) – net in the consolidated statements of income.2 Realized gains are included in Other income (expense) – net in the consolidated statements of income.3 Realized (gains) losses are included in interest expense in the consolidated statements of income. See Note 10 for additional information.4 The amortization of prior service credits associated with postretirement benefits, net of amounts capitalized as part of construction labor, are included in Cost of services and sales and Selling, general and administrative in the consolidated statements of income (see Note 12). Actuarial loss reclassifications related to our equity method investees are included in Other income (expense) – net in the consolidated statements of income.
5 The balance at December 31, 2011 for each component of accumulated OCI, respectively, was $(371), $222, $(421), and $3,750, for a total of $3,180.
The Wireless segment uses our nationwide network to provide consumer and business customers with wireless data and voice communications services. This segment includes our portion of the results from our mobile payment joint venture marketed as the Isis Mobile WalletTM (ISIS), which is accounted for as an equity method investment.
The Wireline segment uses our regional, national and global network to provide consumer and business customers with data and voice communications services, AT&T U-verse® high-speed broadband, video and voice services and managed networking to business customers.
The Other segment includes our portion of the results from equity method investments in América Móvil, S.A. de C.V. (América Móvil), and YP Holdings LLC (YP Holdings), and costs to support corporate-driven activities and operations. Also included in the Other segment are impacts of corporate-wide decisions for which the individual operating segments are not being evaluated, including interest costs and expected return on plan assets for our pension and postretirement benefit plans.
NOTE 4. SEGMENT INFORMATION
Our segments are strategic business units that offer different products and services over various technology platforms and are managed accordingly. We analyze our operating segments based on segment income before income taxes. We make our capital allocation decisions based on the strategic needs of the business, needs of the network (wireless or wireline) providing services and demands to provide emerging services to our customers. Actuarial gains and losses from pension and other postretirement benefits, interest expense and other income (expense) – net, are managed only on a total company basis and are, accordingly, reflected only in consolidated results. Therefore, these items are not included in each reportable segment’s results. The customers and long-lived assets of our reportable segments are predominantly in the United States. We have three reportable segments: (1) Wireless, (2) Wireline and (3) Other. Our operating results prior to May 9, 2012, also included our sold Advertising Solutions segment.

Notes to Consolidated Financial Statements (continued)Dollars in millions except per share amounts
48 | AT&T Inc.
Segment Results, including a reconciliation to AT&T consolidated results, for 2013, 2012, and 2011 are as follows:
Advertising Consolidated At December 31, 2013 and for the year ended Wireless Wireline Solutions Other Consolidations Results
Data $ 21,719 $ 33,593 $ — $ — $ — $ 55,312
Voice, text and other 39,833 20,333 — — — 60,166
Equipment and other 8,347 4,888 — 39 — 13,274
Total segment operating revenues 69,899 58,814 — 39 — 128,752
Operations and support expenses 44,508 41,638 — 1,316 (7,584) 79,878Depreciation and amortization expenses 7,468 10,907 — 20 — 18,395
Total segment operating expenses 51,976 52,545 — 1,336 (7,584) 98,273
Segment operating income (loss) 17,923 6,269 — (1,297) 7,584 30,479Interest expense — — — — 3,940 3,940Equity in net income (loss) of affiliates (75) 2 — 715 — 642Other income (expense) – net — — — — 596 596
Segment income (loss) before income taxes $ 17,848 $ 6,271 $ — $ (582) $ 4,240 $ 27,777
Segment Assets $141,196 $123,714 $ — $12,875 $ 2 $277,787Investments in and advances to equity method affiliates 61 — — 3,799 — 3,860Expenditures for additions to long-lived assets 11,191 10,036 — 1 — 21,228
Advertising Consolidated At December 31, 2012 and for the year ended Wireless Wireline Solutions Other Consolidations Results
Data $ 18,297 $ 31,841 $ — $ — $ — $ 50,138
Voice, text and other 40,889 22,614 — — — 63,503
Equipment and other 7,577 5,118 1,049 49 — 13,793
Total segment operating revenues 66,763 59,573 1,049 49 — 127,434
Operations and support expenses 43,296 41,207 773 1,024 9,994 96,294Depreciation and amortization expenses 6,873 11,123 106 41 — 18,143
Total segment operating expenses 50,169 52,330 879 1,065 9,994 114,437
Segment operating income (loss) 16,594 7,243 170 (1,016) (9,994) 12,997Interest expense — — — — 3,444 3,444Equity in net income (loss) of affiliates (62) (1) — 815 — 752Other income (expense) – net — — — — 134 134
Segment income (loss) before income taxes $ 16,532 $ 7,242 $ 170 $ (201) $(13,304) $ 10,439
Segment Assets $ 132,556 $ 125,340 $ — $ 14,416 $ 3 $ 272,315Investments in and advances to equity method affiliates 41 — — 4,540 — 4,581Expenditures for additions to long-lived assets 10,795 8,914 13 6 — 19,728
Advertising Consolidated For the year ended December 31, 2011 Wireless Wireline Solutions Other Consolidations Results
Data $ 14,861 $ 29,548 $ — $ — $ — $ 44,409
Voice, text and other 41,865 25,121 — — — 66,986
Equipment and other 6,489 5,480 3,293 66 — 15,328
Total segment operating revenues 63,215 60,149 3,293 66 — 126,723
Operations and support expenses 41,282 41,361 5,175 5,030 6,280 99,128Depreciation and amortization expenses 6,329 11,615 386 47 — 18,377
Total segment operating expenses 47,611 52,976 5,561 5,077 6,280 117,505
Segment operating income (loss) 15,604 7,173 (2,268) (5,011) (6,280) 9,218Interest expense — — — — 3,535 3,535Equity in net income (loss) of affiliates (29) (2) — 815 — 784Other income (expense) – net — — — — 249 249
Segment income (loss) before income taxes $ 15,575 $ 7,171 $(2,268) $ (4,196) $ (9,566) $ 6,716

AT&T Inc. | 49
NOTE 5. ACQUISITIONS, DISPOSITIONS AND OTHER ADJUSTMENTS
AcquisitionsSpectrum Acquisitions During 2013, we acquired $895 of wireless spectrum and operations from various companies, not including the 700 MHz, Atlantic Tele-Network Inc. (ATNI), and NextWave purchases discussed below. During 2012, we acquired $855 of wireless spectrum from various companies. During 2011, we acquired $33 of wireless spectrum from various companies, not including the Qualcomm spectrum purchase discussed below.
700 MHz Spectrum In September 2013, we acquired spectrum in the 700 MHz B band from Verizon Wireless for $1,900 in cash and an assignment of Advanced Wireless Service (AWS) spectrum licenses in five markets. The 700 MHz licenses acquired by AT&T cover 42 million people in 18 states. We recognized a gain of approximately $293 on this and other spectrum transactions.
Atlantic Tele-Network In September 2013, we acquired ATNI’s U.S. retail wireless operations, operated under the Alltel brand, for $806 in cash, which included closing adjustments. Under the terms of the agreement, we acquired wireless properties, with a value of $322 in licenses and $296 of goodwill.
NextWave In January 2013, we completed the acquisition of NextWave Wireless Inc. (NextWave), which held wireless licenses in the Wireless Communication Services and AWS bands. We acquired all the equity and purchased a portion of the debt of NextWave for $605. The transaction was accounted for as an asset acquisition of spectrum.
Qualcomm Spectrum Purchase In December 2011, we completed our purchase of spectrum licenses in the Lower 700 MHz frequency band from Qualcomm Incorporated for approximately $1,925 in cash. The spectrum covers more than 300 million people total nationwide, including 12 MHz of Lower 700 MHz D and E block spectrum covering more than 70 million people in five of the top 15 metropolitan areas and 6 MHz of Lower 700 MHz D block spectrum covering more than 230 million people across the rest of the United States.
Purchase of Wireless Partnership Minority Interest In July 2011, we completed the acquisition of Convergys Corporation’s minority interest in the Cincinnati SMSA Limited Partnership and an associated cell tower holding company for approximately $320 in cash.
Pending AcquisitionsLeap In July 2013, we announced an agreement to acquire Leap Wireless International, Inc. (Leap), a provider of prepaid wireless service, for fifteen dollars per outstanding share of Leap’s common stock, or approximately $1,260, plus one nontransferable
contingent value right (CVR) per share. The CVR will entitle each Leap stockholder to a pro rata share of the net proceeds of the future sale of the Chicago 700 MHz A-band FCC license held by Leap. As of September 30, 2013, Leap had approximately $3,100 of debt, net of cash. Under the terms of the agreement, we will acquire all of Leap’s stock and, thereby, acquire all of its wireless properties, including spectrum licenses, network assets, retail stores and subscribers.
The agreement was approved by Leap’s stockholders on October 30, 2013. The transaction is subject to review by the FCC and Department of Justice (DOJ). The review process is underway at both agencies. The transaction is expected to close in the first quarter of 2014. The agreement provides both parties with certain termination rights if the transaction does not close by July 11, 2014, which can be extended until January 11, 2015, if certain conditions have not been met by that date. Under certain circumstances, Leap may be required to pay a termination fee or AT&T may be required to provide Leap with a three-year roaming agreement for LTE data coverage in certain Leap markets lacking LTE coverage, if the transaction does not close. If Leap enters into the roaming agreement, AT&T will then have the option within 30 days after entry into the roaming agreement to purchase certain specified Leap spectrum assets. If AT&T does not exercise its right to purchase all of the specified Leap spectrum assets, Leap can then within 60 days after expiration of AT&T’s option require AT&T to purchase all of the specified spectrum assets.
DispositionsAmérica Móvil In 2013, we sold a portion of our shares in América Móvil for approximately $1,179. We sold the shares to maintain our historical ownership percentage in conjunction with América Móvil’s repurchase activity. (See Note 8)
Advertising Solutions On May 8, 2012, we completed the sale of our Advertising Solutions segment to an affiliate of Cerberus Capital Management, L.P. for approximately $740 in cash after closing adjustments, a $200 advance, which was repaid in 2013, and a 47 percent equity interest in the new entity, YP Holdings. Our operating results include the results of the Advertising Solutions segment through May 8, 2012.
Tender of Telmex Shares In August 2011, the Board of Directors of América Móvil approved a tender offer for the remaining outstanding shares of Télefonos de México, S.A. de C.V. (Telmex) that were not already owned by América Móvil. We tendered all of our shares of Telmex for $1,197 of cash. Telmex was accounted for as an equity method investment (see Note 8).

Notes to Consolidated Financial Statements (continued)Dollars in millions except per share amounts
50 | AT&T Inc.
agreement, we paid a breakup fee of $3,000, entered into a broadband roaming agreement and transferred certain wireless spectrum with a book value of $962. These agreement termination charges were included in “Selling, general and administrative” expenses in our Other segment.
NOTE 6. PROPERTY, PLANT AND EQUIPMENT
Property, plant and equipment is summarized as follows at December 31:
Lives (years) 2013 2012
Land — $ 1,523 $ 1,689Buildings and improvements 10-44 31,485 28,939Central office equipment1 3-10 86,370 86,185Cable, wiring and conduit 15-50 76,107 80,338Other equipment 3-15 67,887 61,387Software 3 8,150 7,957Under construction — 3,276 4,412
274,798 270,907
Accumulated depreciation and amortization 163,830 161,140
Property, plant and equipment – net $110,968 $109,7671 Includes certain network software.
Our depreciation expense was $17,722 in 2013, $16,933 in 2012 and $16,368 in 2011. Depreciation expense included amortization of software totaling $2,142 in 2013, $2,130 in 2012 and $2,243 in 2011.
Certain facilities and equipment used in operations are leased under operating or capital leases. Rental expenses under operating leases were $3,683 for 2013, $3,507 for 2012, and $3,414 for 2011. At December 31, 2013, the future minimum rental payments under noncancelable operating leases for the years 2014 through 2018 were $3,003, $2,857, $2,694, $2,458, and $2,233, with $11,707 due thereafter. Certain real estate operating leases contain renewal options that may be exercised. Capital leases are not significant.
Pending DispositionConnecticut Wireline In December 2013, we entered into an agreement to sell our incumbent local exchange operations in Connecticut for $2,000 in cash. The transaction is subject to review by the DOJ, the FCC and the Connecticut Public Utilities Regulatory Authority and other state regulatory authorities. We expect the deal to close in the second half of 2014, subject to customary closing conditions.
These Connecticut operations represent approximately $1,200 in annual revenues as of 2013. We applied held-for-sale treatment to the assets and liabilities of the Connecticut operations, and, accordingly, included the assets in “Other current assets,” and the related liabilities in “Accounts payable and accrued liabilities,” on our consolidated balance sheets. However, the business will not qualify as discontinued operations as we expect significant continuing direct cash flows related to the disposed operations. Assets and liabilities of the Connecticut operations included the following as of December 31, 2013:
Assets held for sale:Current assets $ 155Property, plant and equipment – net 1,289Goodwill 799Other assets 17
Total assets $2,260
Liabilities related to assets held for sale:Current liabilities $ 128Noncurrent liabilities 480
Total liabilities $ 608
OtherT-Mobile In March 2011, we agreed to acquire from Deutsche Telekom AG (Deutsche Telekom) all shares of T-Mobile USA, Inc. (T-Mobile) for approximately $39,000, subject to certain adjustments. In December 2011, in light of opposition to the merger from the DOJ and FCC, we and Deutsche Telekom agreed to terminate the transaction. Pursuant to the purchase
NOTE 7. GOODWILL AND OTHER INTANGIBLE ASSETS
Changes in the carrying amounts of goodwill, by segment (which is the same as the reporting unit for Wireless, Wireline and Advertising Solutions), for the years ended December 31, 2013 and 2012, were as follows:
Advertising Wireless Wireline Solutions Other Total
Balance as of January 1, 2012 $ 35,755 $ 33,638 $ 1,059 $ 390 $ 70,842Goodwill acquired 13 5 — — 18Other 35 327 (1,059) (390) (1,087)
Balance as of December 31, 2012 35,803 33,970 — — 69,773Goodwill acquired 305 — — — 305Held for sale — (799) — — (799)Other (2) (4) — — (6)
Balance as of December 31, 2013 $36,106 $33,167 $ — $ — $69,273

AT&T Inc. | 51
also included a reclassification of goodwill due to segment reclassification to better align goodwill with operations.
In 2011, we recorded a $2,745 goodwill impairment in the Advertising Solutions segment, triggered by declining revenues in our directory business and the directory industry as a whole, and we also recorded a $165 impairment for a trade name.
The held for sale adjustment to goodwill in 2013 was the result of a goodwill allocation in conjunction with our pending sale of our Connecticut operations. Our goodwill acquired during 2013 primarily related to our acquisition of ATNI (see Note 5). Changes to goodwill during 2012 primarily resulted from the sale of the Advertising Solutions segment (see Note 5). Changes in goodwill during 2012
Our other intangible assets are summarized as follows:
December 31, 2013 December 31, 2012
Gross Carrying Accumulated Gross Carrying Accumulated Other Intangible Assets Amount Amortization Amount Amortization
Amortized intangible assets: Customer lists and relationships: AT&T Mobility LLC $ 982 $ 771 $ 6,760 $ 6,335 BellSouth Corporation 5,825 5,317 5,825 4,994 AT&T Corp. 2,482 2,438 2,490 2,356 Other — — 351 350
Subtotal 9,289 8,526 15,426 14,035 Other 284 169 304 174
Total $ 9,573 $8,695 $15,730 $14,209
Indefinite-lived intangible assets not subject to amortization: Licenses $56,433 $52,352 Trade names 4,901 4,902
Total $61,334 $57,254
We review indefinite-lived intangible assets for impairment annually (see Note 1). Licenses include wireless FCC licenses of $56,399 at December 31, 2013 and $52,318 at December 31, 2012, that provide us with the exclusive right to utilize certain radio frequency spectrum to provide wireless communications services.
NOTE 8. EQUITY METHOD INVESTMENTS
Investments in partnerships, joint ventures and less than majority-owned subsidiaries in which we have significant influence are accounted for under the equity method.
Our investments in equity affiliates primarily include our international equity investment, América Móvil, and our interest in YP Holdings. Investments in equity affiliates also include our investment in our mobile payment joint venture, marketed as ISIS.
As discussed in Note 5, most of our license additions in 2013 were related to a spectrum swap and various business acquisitions, with the remainder originating from various spectrum license purchases.
Amortized intangible assets are definite-life assets, and as such, we record amortization expense based on a method that most appropriately reflects our expected cash flows from these assets, over a weighted-average of 9.8 years (9.7 years for customer lists and relationships and 12.2 years for other). Amortization expense for definite-life intangible assets was $672 for the year ended December 31, 2013, $1,210 for the year ended December 31, 2012, and $2,009 for the year ended December 31, 2011. Amortization expense is estimated to be $364 in 2014, $224 in 2015, $127 in 2016, $60 in 2017, and $34 in 2018. In 2013, we wrote off approximately $6,217 of fully amortized intangible assets (primarily customer lists). In 2012, we wrote off approximately $191 in fully amortized intangible assets (primarily patents) and $3,187 of customer lists due to the sale of our Advertising Solutions segment (see Note 5). We review other amortizing intangible assets for impairment whenever events or circumstances indicate that the carrying amount may not be recoverable over the remaining life of the asset or asset group.

Notes to Consolidated Financial Statements (continued)Dollars in millions except per share amounts
52 | AT&T Inc.
NOTE 9. DEBT
Long-term debt of AT&T and its subsidiaries, including interest rates and maturities, is summarized as follows at December 31:
2013 2012
Notes and debentures Interest Rates Maturities1
0.60% – 2.99% 2015 – 2022 $18,774 $13,969 3.00% – 4.99% 2013 – 2045 22,327 14,590 5.00% – 6.99% 2013 – 2095 28,513 35,226 7.00% – 9.10% 2013 – 2097 6,268 7,059Other 1 2Fair value of interest rate swaps recorded in debt 154 267
76,037 71,113Unamortized (discount) premium – net (1,553) (1,535)
Total notes and debentures 74,484 69,578Capitalized leases 283 265
Total long-term debt, including current maturities 74,767 69,843Current maturities of long-term debt (5,477) (3,485)
Total long-term debt $69,290 $66,358 1 Maturities assume putable debt is redeemed by the holders at the next opportunity.
We had outstanding Euro, British pound sterling or Canadian dollar denominated debt of approximately $18,206 and $11,951 at December 31, 2013 and 2012. The weighted average interest rate of our entire long-term debt portfolio decreased from 4.9% at December 31, 2012 to 4.5% at December 31, 2013.
Current maturities of long-term debt include debt that may be put back to us by the holders in 2014. We have $1,000 of annual put reset securities that may be put each April until maturity in 2021. If the holders do not require us to repurchase the securities, the interest rate will be reset based on current market conditions. Likewise, we have an accreting zero-coupon note that may be redeemed each May, until maturity in 2022. If the zero-coupon note (issued for principal of $500 in 2007) is held to maturity, the redemption amount will be $1,030.
Debt maturing within one year consisted of the following at December 31:
2013 2012
Current maturities of long-term debt $5,477 $3,485Commercial paper 20 —Bank borrowings1 1 1
Total $5,498 $3,486 1 Outstanding balance of short-term credit facility of a foreign subsidiary.
YP Holdings We hold a 47% interest in YP Holdings, an online advertising company and directory publisher. During 2013, we received $200 from the repayment of advances to YP Holdings and $101 from the return of investment in YP Holdings.
América Móvil América Móvil is primarily a wireless provider in Mexico with telecommunications investments in the United States, Latin America and Europe. We are a member of a consortium that holds all of the class AA shares of América Móvil stock, representing voting control of the company. Another member of the consortium has the right to appoint a majority of the directors of América Móvil. During 2013, we sold a portion of our shares in América Móvil, to maintain our historical ownership percentage in conjunction with América Móvil’s repurchase activity. At December 31, 2013, the fair value of our 8.7% investment in América Móvil, based on the equivalent value of América Móvil L shares, was $7,166.
Telmex Transaction During 2011, the Board of Directors of América Móvil approved and completed a tender offer for the remaining outstanding shares of Telmex that were not already owned by América Móvil. In conjunction with the tender of our shares, we have recorded our portion of América Móvil’s resulting equity adjustments.
The following table is a reconciliation of our investments in equity affiliates as presented on our consolidated balance sheets:
2013 2012
Beginning of year $4,581 $3,718Additional investments 111 405Equity in net income of affiliates 642 752Dividends and Distributions received (318) (137)Currency translation adjustments 61 95Sale of América Móvil shares (781) —Return of advances to and investments in YP Holdings (301) —América Móvil equity adjustments (124) (260)Other adjustments (11) 8
End of year $3,860 $4,581
Undistributed earnings from equity affiliates were $6,699 and $6,375 at December 31, 2013 and 2012.

AT&T Inc. | 53
Advances under both agreements would bear interest, at AT&T’s option, either:
•atavariableannualrateequalto(1)thehighestof: (a) the base (or prime) rate of the bank affiliate of Citibank, N.A. which is serving as administrative agent under the Agreement, (b) 0.50% per annum above the Federal funds rate, and (c) the London Interbank Offered Rate (LIBOR) applicable to U.S. dollars for a period of one month plus 1.00% per annum, plus (2) an applicable margin, as set forth in the Agreement (Applicable Margin); or
•atarateequalto:(i)theLIBORforaperiodofone,two, three or six months, as applicable, plus (ii) the Applicable Margin.
The Applicable Margin for both agreements will equal 0.565%, 0.680%, or 0.910% per annum, depending on AT&T’s credit rating.
Under each agreement AT&T will pay a facility fee of 0.060%, 0.070% or 0.090% per annum, depending on AT&T’s credit rating, of the amount of lender commitments.
Both agreements require that, if at any time AT&T or a subsidiary pledges assets or otherwise permits a lien on its properties, advances under the agreement will be ratably secured, subject to specified exceptions. Both agreements also contain a financial ratio covenant that provides that AT&T will maintain, as of the last day of each fiscal quarter, a debt-to-EBITDA (earnings before interest, income taxes, depreciation and amortization, and other modifications described in the agreements) ratio of not more than 3.0 to 1, for the four quarters then ended.
Defaults under both agreements permit the lenders to accelerate required repayment and would increase the Applicable Margin by 2.00% per annum. Defaults include noncompliance with the two covenants above, other representations and warranties and the following:
•Wefailtopayprincipalorinterest,orotheramountsunder the agreement beyond any grace period.
•Wefailtopaywhendueotherdebtof$400ormorethat results in acceleration of that debt (commonly referred to as cross-acceleration) or a creditor commences enforcement proceedings within a specified period after a money judgment of $400 or more has become final.
•Apersonacquiresbeneficialownershipofmorethan50% of AT&T common shares or more than a majority of AT&T’s directors change in any 24-month period other than as elected by the remaining directors.
Debt RefinancingDuring 2013, we received net proceeds of $12,040, from the issuance of $12,108 in long-term debt in various markets, with an average weighted maturity of approximately 10 years and an average interest rate of 2.6%. We redeemed $7,698 in borrowings, including debt tender offers covering $5,000 of various notes with stated rates of 5.20% to 8.75% for $5,556 in cash payments and early redemptions of $300 and $550 with stated rates of 7.375% and 6.625%, respectively.
As of December 31, 2013 and 2012, we were in compliance with all covenants and conditions of instruments governing our debt. Substantially all of our outstanding long-term debt is unsecured. Maturities of outstanding long-term notes and debentures, as of December 31, 2013, and the corresponding weighted-average interest rate scheduled for repayment are as follows:
There- 2014 2015 2016 2017 2018 after
Debt repayments1 $5,472 $6,514 $6,667 $5,257 $5,800 $45,790Weighted- average interest rate 4.9% 3.2% 2.7% 2.4% 4.6% 5.1% 1 Debt repayments assume putable debt is redeemed by the holders at the next opportunity.
Credit FacilitiesOn December 11, 2013, we amended and extended for an additional two-year term our existing $5,000 revolving credit agreement with a syndicate of banks until December 2018 (December 2018 Facility). We also have an existing $3,000 revolving credit agreement that was entered into in 2012, with a syndicate of banks that is available until December 2017 (December 2017 Facility). In the event advances are made under either agreement, those advances would be used for general corporate purposes. Advances are not conditioned on the absence of a material adverse change. All advances must be repaid no later than the date on which lenders are no longer obligated to make any advances under each agreement. Under each agreement, we can terminate, in whole or in part, amounts committed by the lenders in excess of any outstanding advances; however, we cannot reinstate any such terminated commitments. At December 31, 2013, we had no advances outstanding under either agreement and were in compliance with all covenants under each agreement.

Notes to Consolidated Financial Statements (continued)Dollars in millions except per share amounts
54 | AT&T Inc.
applicable, a Co-Borrower, reduce to $0 the commitments of the lenders, or (ii) certain events of default occur. We and lenders representing more than 50% of the facility amount may agree to extend their commitments for two one-year periods beyond the December 11, 2017, termination date, under certain circumstances. We also can request the lenders to further increase their commitments (i.e., raise the available credit) up to an additional $2,000 provided no event of default has occurred. The same provisions apply to the December 2018 Facility except that the applicable date is December 11, 2018.
•Wefailtomakecertainminimumfundingpaymentsunder ERISA.
•Ourbankruptcyorinsolvency.
Both agreements permit subsidiaries to be added as additional borrowers, with or without a guarantee by AT&T. The terms of the guarantee are set forth in the agreements.
The obligations of the lenders under the December 2017 Facility to provide advances will terminate on December 11, 2017, unless prior to that date either: (i) AT&T, and if
NOTE 10. FAIR VALUE MEASUREMENTS AND DISCLOSURE
The Fair Value Measurement and Disclosure framework provides a three-tiered fair value hierarchy that gives highest priority to unadjusted quoted prices in active markets for identical assets or liabilities (Level 1 measurements) and the lowest priority to unobservable inputs (Level 3 measurements). The three levels of the fair value hierarchy are described below:
LEVEL 1 Inputs to the valuation methodology are unadjusted quoted prices for identical assets or liabilities in active markets that we have the ability to access.
LEVEL 2 Inputs to the valuation methodology include: •Quotedpricesforsimilarassetsandliabilitiesinactivemarkets.•Quotedpricesforidenticalorsimilarassetsorliabilitiesininactivemarkets.•Inputsotherthanquotedmarketpricesthatareobservablefortheassetorliability.•Inputsthatarederivedprincipallyfromorcorroboratedbyobservablemarketdatabycorrelationor
other means.
LEVEL 3 Inputs to the valuation methodology are unobservable and significant to the fair value measurement. •Fairvalueisoftenbasedondevelopedmodelsinwhichtherearefew,ifany,externalobservations.
Long-Term Debt and Other Financial InstrumentsThe carrying amounts and estimated fair values of our long-term debt, including current maturities and other financial instruments, are summarized as follows:
December 31, 2013 December 31, 2012
Carrying Fair Carrying Fair Amount Value Amount Value
Notes and debentures $74,484 $79,309 $69,578 $81,310Commercial paper 20 20 — —Bank borrowings 1 1 1 1Investment securities 2,450 2,450 2,218 2,218
The carrying value of debt with an original maturity of less than one year approximates market value. The fair value measurements used for notes and debentures are considered Level 2 and are determined using various methods, including quoted prices for identical or similar securities in both active and inactive markets.
The fair value measurements level of an asset or liability within the fair value hierarchy is based on the lowest level of any input that is significant to the fair value measurement. Valuation techniques used should maximize the use of observable inputs and minimize the use of unobservable inputs.
The valuation methodologies described above may produce a fair value calculation that may not be indicative of future net realizable value or reflective of future fair values. We believe our valuation methods are appropriate and consistent with other market participants. The use of different methodologies or assumptions to determine the fair value of certain financial instruments could result in a different fair value measurement at the reporting date. There have been no changes in the methodologies used since December 31, 2012.

AT&T Inc. | 55
are recorded in accumulated OCI. Unrealized losses that are considered other than temporary are recorded in “Other income (expense) – net” with the corresponding reduction to the carrying basis of the investment. Fixed income investments of $106 have maturities of less than one year, $279 within one to three years, $109 within three to five years, and $265 for five or more years.
Our short-term investments (including money market securities) and customer deposits are recorded at amortized cost, and the respective carrying amounts approximate fair values. Our investment securities are recorded in “Other Assets” on the consolidated balance sheets.
Investment SecuritiesOur investment securities include equities, fixed income bonds and other securities. A substantial portion of the fair values of our available-for-sale securities was estimated based on quoted market prices. Investments in securities not traded on a national securities exchange are valued using pricing models, quoted prices of securities with similar characteristics or discounted cash flows. Realized gains and losses on securities are included in “Other income (expense) – net” in the consolidated statements of income using the specific identification method. Unrealized gains and losses, net of tax, on available-for-sale securities
Following is the fair value leveling for available-for-sale securities and derivatives as of December 31, 2013, and December 31, 2012:
December 31, 2013
Level 1 Level 2 Level 3 Total
Available-for-Sale Securities Domestic equities $1,049 $ — $ — $1,049 International equities 563 — — 563 Fixed income bonds — 759 — 759Asset Derivatives1
Interest rate swaps — 191 — 191 Cross-currency swaps — 1,951 — 1,951Liability Derivatives1
Interest rate swaps — (7) — (7) Cross-currency swaps — (519) — (519)
December 31, 2012
Level 1 Level 2 Level 3 Total
Available-for-Sale Securities Domestic equities $ 873 $ — $ — $ 873 International equities 469 — — 469 Fixed income bonds — 837 — 837Asset Derivatives1
Interest rate swaps — 287 — 287 Cross-currency swaps — 752 — 752 Foreign exchange contracts — 1 — 1Liability Derivatives1
Cross-currency swaps — (672) — (672) 1 Derivatives designated as hedging instruments are reflected as “Other Assets,” “Other noncurrent liabilities” and, for a portion of interest rate swaps, “Other current assets” in our consolidated balance sheets.
The majority of our derivatives are designated either as a hedge of the fair value of a recognized asset or liability or of an unrecognized firm commitment (fair value hedge), or as a hedge of a forecasted transaction or of the variability of cash flows to be received or paid related to a recognized asset or liability (cash flow hedge).
Fair Value Hedging We designate our fixed-to-floating interest rate swaps as fair value hedges. The purpose of these swaps is to manage interest rate risk by managing our mix of fixed-rate and floating-rate debt. These swaps involve the receipt of fixed-rate amounts for floating interest rate payments over the life of the swaps without
Derivative Financial InstrumentsWe employ derivatives to manage certain market risks, primarily interest rate risk and foreign currency exchange risk. This includes the use of interest rate swaps, interest rate locks, foreign exchange forward contracts and combined interest rate foreign exchange contracts (cross-currency swaps). We do not use derivatives for trading or speculative purposes. We record derivatives on our consolidated balance sheets at fair value that is derived from observable market data, including yield curves and foreign exchange rates (all of our derivatives are Level 2). Cash flows associated with derivative instruments are presented in the same category on the consolidated statements of cash flows as the item being hedged.

Notes to Consolidated Financial Statements (continued)Dollars in millions except per share amounts
56 | AT&T Inc.
We hedge a portion of the exchange risk involved in anticipation of highly probable foreign currency-denominated transactions. In anticipation of these transactions, we often enter into foreign exchange contracts to provide currency at a fixed rate. Some of these instruments are designated as cash flow hedges while others remain nondesignated, largely based on size and duration. Gains and losses at the time we settle or take delivery on our designated foreign exchange contracts are amortized into income in the same period the hedged transaction affects earnings, except where an amount is deemed to be ineffective, which would be immediately reclassified to other income (expense) in the consolidated income statement. In the years ended December 31, 2013, and December 31, 2012, no ineffectiveness was measured.
Collateral and Credit-Risk Contingency We have entered into agreements with our derivative counterparties establishing collateral thresholds based on respective credit ratings and netting agreements. At December 31, 2013, we had posted collateral of $8 (a deposit asset) and held collateral of $1,600 (a receipt liability). Under the agreements, if our credit rating had been downgraded one rating level by Moody’s Investor Service and Standards & Poor’s and two rating levels by Fitch, Inc. before the final collateral exchange in December, we would have been required to post additional collateral of $54. At December 31, 2012, we had posted collateral of $22 (a deposit asset) and held collateral of $543 (a receipt liability). We do not offset the fair value of collateral, whether the right to reclaim cash collateral (a receivable) or the obligation to return cash collateral (a payable), against the fair value of the derivative instruments.
Following is the notional amount of our outstanding derivative positions at December 31:
2013 2012
Interest rate swaps $ 4,750 $ 3,000Cross-currency swaps 17,787 12,071Foreign exchange contracts — 51
Total $22,537 $15,122
Following is the related hedged items affecting our financial position and performance:
Effect of Derivatives in the Consolidated Statements of Income
Fair Value Hedging Relationships For the years ended December 31, 2013 2012 2011
Interest rate swaps (Interest expense): Gain (Loss) on interest rate swaps $(113) $(179) $ 10 Gain (Loss) on long-term debt 113 179 (10)
exchange of the underlying principal amount. Accrued and realized gains or losses from interest rate swaps impact interest expense in the consolidated statements of income. Unrealized gains on interest rate swaps are recorded at fair market value as assets, and unrealized losses on interest rate swaps are recorded at fair market value as liabilities. Changes in the fair values of the interest rate swaps are exactly offset by changes in the fair value of the underlying debt. Gains or losses realized upon early termination of our fair value hedges are recognized in interest expense. In the years ended December 31, 2013, and December 31, 2012, no ineffectiveness was measured on interest rate swaps designated as fair value hedges.
Cash Flow Hedging We designate our cross-currency swaps as cash flow hedges. We have entered into multiple cross-currency swaps to hedge our exposure to variability in expected future cash flows that are attributable to foreign currency risk generated from the issuance of our Euro, British pound sterling and Canadian dollar denominated debt. These agreements include initial and final exchanges of principal from fixed foreign denominations to fixed U.S. denominated amounts, to be exchanged at a specified rate, which was determined by the market spot rate upon issuance. They also include an interest rate swap of a fixed foreign-denominated rate to a fixed U.S. denominated interest rate.
Unrealized gains on derivatives designated as cash flow hedges are recorded at fair value as assets, and unrealized losses on derivatives designated as cash flow hedges are recorded at fair value as liabilities, both for the period they are outstanding. For derivative instruments designated as cash flow hedges, the effective portion is reported as a component of accumulated OCI until reclassified into interest expense in the same period the hedged transaction affects earnings. The gain or loss on the ineffective portion is recognized as other income or expense in each period. We evaluate the effectiveness of our cross-currency swaps each quarter. In the years ended December 31, 2013, and December 31, 2012, no ineffectiveness was measured.
Periodically, we enter into and designate interest rate locks to partially hedge the risk of changes in interest payments attributable to increases in the benchmark interest rate during the period leading up to the probable issuance of fixed-rate debt. We designate our interest rate locks as cash flow hedges. Gains and losses when we settle our interest rate locks are amortized into income over the life of the related debt, except where a material amount is deemed to be ineffective, which would be immediately reclassified to “Other income (expense) – net” in the consolidated statements of income. Over the next 12 months, we expect to reclassify $44 from accumulated OCI to interest expense due to the amortization of net losses on historical interest rate locks.
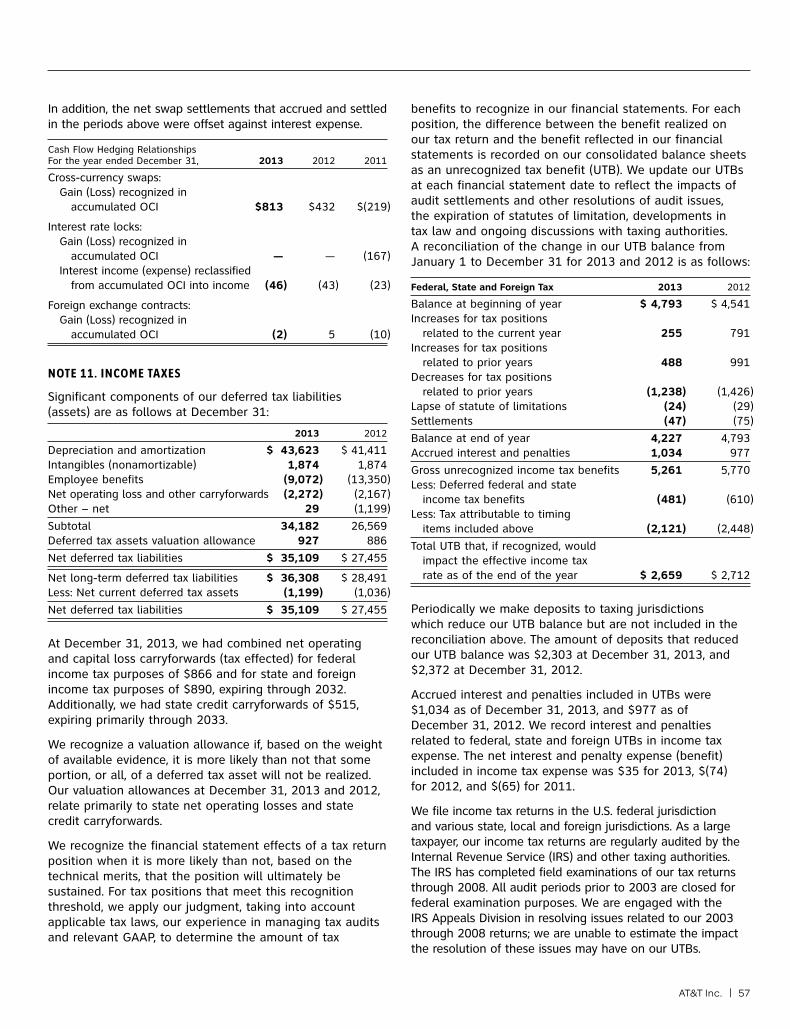
AT&T Inc. | 57
benefits to recognize in our financial statements. For each position, the difference between the benefit realized on our tax return and the benefit reflected in our financial statements is recorded on our consolidated balance sheets as an unrecognized tax benefit (UTB). We update our UTBs at each financial statement date to reflect the impacts of audit settlements and other resolutions of audit issues, the expiration of statutes of limitation, developments in tax law and ongoing discussions with taxing authorities. A reconciliation of the change in our UTB balance from January 1 to December 31 for 2013 and 2012 is as follows:
Federal, State and Foreign Tax 2013 2012
Balance at beginning of year $ 4,793 $ 4,541Increases for tax positions related to the current year 255 791Increases for tax positions related to prior years 488 991Decreases for tax positions related to prior years (1,238) (1,426)Lapse of statute of limitations (24) (29)Settlements (47) (75)
Balance at end of year 4,227 4,793Accrued interest and penalties 1,034 977
Gross unrecognized income tax benefits 5,261 5,770Less: Deferred federal and state income tax benefits (481) (610)Less: Tax attributable to timing items included above (2,121) (2,448)
Total UTB that, if recognized, would impact the effective income tax rate as of the end of the year $ 2,659 $ 2,712
Periodically we make deposits to taxing jurisdictions which reduce our UTB balance but are not included in the reconciliation above. The amount of deposits that reduced our UTB balance was $2,303 at December 31, 2013, and $2,372 at December 31, 2012.
Accrued interest and penalties included in UTBs were $1,034 as of December 31, 2013, and $977 as of December 31, 2012. We record interest and penalties related to federal, state and foreign UTBs in income tax expense. The net interest and penalty expense (benefit) included in income tax expense was $35 for 2013, $(74) for 2012, and $(65) for 2011.
We file income tax returns in the U.S. federal jurisdiction and various state, local and foreign jurisdictions. As a large taxpayer, our income tax returns are regularly audited by the Internal Revenue Service (IRS) and other taxing authorities. The IRS has completed field examinations of our tax returns through 2008. All audit periods prior to 2003 are closed for federal examination purposes. We are engaged with the IRS Appeals Division in resolving issues related to our 2003 through 2008 returns; we are unable to estimate the impact the resolution of these issues may have on our UTBs.
In addition, the net swap settlements that accrued and settled in the periods above were offset against interest expense.
Cash Flow Hedging Relationships For the year ended December 31, 2013 2012 2011
Cross-currency swaps: Gain (Loss) recognized in accumulated OCI $813 $432 $(219)
Interest rate locks: Gain (Loss) recognized in accumulated OCI — — (167) Interest income (expense) reclassified from accumulated OCI into income (46) (43) (23)
Foreign exchange contracts: Gain (Loss) recognized in accumulated OCI (2) 5 (10)
NOTE 11. INCOME TAXES
Significant components of our deferred tax liabilities (assets) are as follows at December 31:
2013 2012
Depreciation and amortization $ 43,623 $ 41,411Intangibles (nonamortizable) 1,874 1,874Employee benefits (9,072) (13,350)Net operating loss and other carryforwards (2,272) (2,167)Other – net 29 (1,199)
Subtotal 34,182 26,569Deferred tax assets valuation allowance 927 886
Net deferred tax liabilities $ 35,109 $ 27,455
Net long-term deferred tax liabilities $ 36,308 $ 28,491Less: Net current deferred tax assets (1,199) (1,036)
Net deferred tax liabilities $ 35,109 $ 27,455
At December 31, 2013, we had combined net operating and capital loss carryforwards (tax effected) for federal income tax purposes of $866 and for state and foreign income tax purposes of $890, expiring through 2032. Additionally, we had state credit carryforwards of $515, expiring primarily through 2033.
We recognize a valuation allowance if, based on the weight of available evidence, it is more likely than not that some portion, or all, of a deferred tax asset will not be realized. Our valuation allowances at December 31, 2013 and 2012, relate primarily to state net operating losses and state credit carryforwards.
We recognize the financial statement effects of a tax return position when it is more likely than not, based on the technical merits, that the position will ultimately be sustained. For tax positions that meet this recognition threshold, we apply our judgment, taking into account applicable tax laws, our experience in managing tax audits and relevant GAAP, to determine the amount of tax

Notes to Consolidated Financial Statements (continued)Dollars in millions except per share amounts
58 | AT&T Inc.
In October 2013, we offered a one-time opportunity for certain retirement-eligible employees to elect a full lump sum payment of their accrued pension if they retired as of December 30, 2013. The lump sum value was calculated using the August 2012 discount rates for some pension programs and was equal to the cash balance amount for the management new hire pension program. The lump sum value totaled approximately $2,700, which will be distributed in the first quarter of 2014. We recorded special termination benefits of $250 as a result of this offer.
In October 2013, as part of our 2014 annual benefits enrollment process, we communicated an amendment to our Medicare-eligible retirees that beginning in 2015 AT&T will provide access to retiree health insurance coverage that supplements government-sponsored Medicare through a private insurance marketplace. This new approach will allow retirees to choose insurance with the terms, cost and coverage that best fits their needs, while still receiving financial support as determined by AT&T. We expect that the cost to AT&T for retiree medical coverage in 2015 will be comparable to 2014. Future changes in support, if any, will be based on a number of factors such as business conditions, government actions, marketplace changes and the general consumer inflation rate.
During 2012, approximately 90,000 collectively bargained employees ratified new agreements. For the vast majority of covered employees, the agreements provided for a pension band increase of 1 percent for each year of the agreement. These agreements also provide for continued healthcare coverage with a modest increase to employee costs over the agreement term. There were also modest increases to retiree costs for continued healthcare coverage for retirees.
During 2012, we transferred the funding of the payment of postretirement death benefits not already in the Voluntary Employee Benefit Association (VEBA) trust from the pension trust to the postretirement VEBA trust.
Obligations and Funded StatusFor defined benefit pension plans, the benefit obligation is the “projected benefit obligation,” the actuarial present value, as of our December 31 measurement date, of all benefits attributed by the pension benefit formula to employee service rendered to that date. The amount of benefit to be paid depends on a number of future events incorporated into the pension benefit formula, including estimates of the average life of employees/survivors and average years of service rendered. It is measured based on assumptions concerning future interest rates and future employee compensation levels.
For postretirement benefit plans, the benefit obligation is the “accumulated postretirement benefit obligation,” the actuarial present value as of a date of all future benefits attributed under the terms of the postretirement benefit plan to employee service rendered to the valuation date.
The components of income tax (benefit) expense are as follows:
2013 2012 2011
Federal: Current $3,043 $ 451 $ (420) Deferred – net 5,692 2,256 2,555
8,735 2,707 2,135
State, local and foreign: Current (61) 702 23 Deferred – net 550 (509) 374
489 193 397
Total $9,224 $2,900 $2,532
A reconciliation of income tax expense (benefit) and the amount computed by applying the statutory federal income tax rate (35%) to income from continuing operations before income taxes is as follows:
2013 2012 2011
Taxes computed at federal statutory rate $9,722 $3,654 $2,351Increases (decreases) in income taxes resulting from: State and local income taxes – net of federal income tax benefit 294 85 210 Goodwill Impairment — — 961 Other – net (792) (839) (990)
Total $9,224 $2,900 $2,532
Effective Tax Rate 33.2% 27.8% 37.7%
NOTE 12. PENSION AND POSTRETIREMENT BENEFITS
Pension Benefits and Postretirement BenefitsSubstantially all of our U.S. employees are covered by one of our noncontributory pension plans. The majority of our newly hired employees, longer-service management and some nonmanagement employees participate in cash balance pension programs that include annual or monthly credits based on salary as well as an interest credit. Other longer-service management employees participate in pension programs that have a traditional pension formula (i.e., a stated percentage of employees’ adjusted career income). Other longer-service nonmanagement employees’ pension benefits are generally calculated using one of two formulas: a flat dollar amount applied to years of service according to job classification or a cash balance plan with negotiated annual pension band credits as well as interest credits. Most nonmanagement employees can elect to receive their pension benefits in either a lump sum payment or an annuity.
We also provide a variety of medical, dental and life insurance benefits to certain retired employees under various plans and accrue actuarially determined postretirement benefit costs as active employees earn these benefits.

AT&T Inc. | 59
The following table presents this reconciliation and shows the change in the projected benefit obligation for the years ended December 31:
Pension Benefits Postretirement Benefits
2013 2012 2013 2012
Benefit obligation at beginning of year $58,911 $56,110 $37,431 $34,953Service cost – benefits earned during the period 1,321 1,216 352 336Interest cost on projected benefit obligation 2,429 2,800 1,532 1,725Amendments — (905) (4,460) (2,768)Actuarial (gain) loss (2,390) 6,707 (2,098) 4,844Special termination benefits 255 12 1 5Benefits paid (3,966) (5,729) (2,473) (2,608)Transfer for sale of Advertising Solutions segment — (149) — (207)Plan transfers — (1,151) — 1,151
Benefit obligation at end of year $56,560 $58,911 $30,285 $37,431
The following table presents the change in the value of plan assets for the years ended December 31 and the plans’ funded status at December 31:
Pension Benefits Postretirement Benefits
2013 2012 2013 2012
Fair value of plan assets at beginning of year $45,060 $ 45,907 $ 9,295 $ 9,890Actual return on plan assets 5,935 5,041 1,347 1,266Benefits paid1 (3,966) (5,729) (1,682) (1,842)Contributions 209 3 — —Transfer for sale of Advertising Solutions segment — (165) — (19)Other — 3 — —
Fair value of plan assets at end of year3 47,238 45,060 8,960 9,295
Unfunded status at end of year2 $ (9,322) $(13,851) $(21,325) $(28,136) 1 At our discretion, certain postretirement benefits may be paid from AT&T cash accounts, which does not reduce VEBA assets. Future benefit payments may be made from VEBA trusts and thus reduce those asset balances.
2 Funded status is not indicative of our ability to pay ongoing pension benefits or of our obligation to fund retirement trusts. Required pension funding is determined in accordance with ERISA regulations.
3 Net assets available for benefits at December 31, 2013 were $56,447 and include a $9,209 preferred equity interest in AT&T Mobility II LLC, as discussed below.
existing pension assets are essentially equivalent to the pension obligation at December 31, 2013.
On September 9, 2013, the Department of Labor (DOL) published a proposed exemption that authorized retroactive approval of this voluntary contribution. The proposal was open for public comment and we are currently awaiting a final decision by the DOL. Our retirement benefit plans, including required contributions, are subject to the provisions of ERISA.
As noted above, this preferred equity interest represents a plan asset of our pension trust, which is recognized in the separate financial statements of our pension plan as a qualified plan asset for funding purposes. The following table presents a reconciliation of our pension plan assets recognized in the consolidated financial statements of the Company with the net assets available for benefits included in the separate financial statements of the pension plan at December 31:
2013 2012
Plan assets recognized in the consolidated financial statements $47,238 $45,060Preferred equity interest in Mobility 9,209 —
Net assets available for benefits $56,447 $45,060
On September 9, 2013, we made a voluntary contribution of a preferred equity interest in AT&T Mobility II LLC (Mobility), the holding company for our wireless business, to the trust used to pay pension benefits under our qualified pension plans. The preferred equity interest had a value of $9,104 on the contribution date and was valued at $9,209 at December 31, 2013. The trust is entitled to receive cumulative cash distributions of $560 per annum, which will be distributed quarterly in equal amounts and will be accounted for as contributions. So long as we make the distributions, we will have no limitations on our ability to declare a dividend, or repurchase shares. This preferred equity interest is a plan asset under ERISA and is recognized as such in the plan’s separate financial statements. However, because the preferred equity interest is not unconditionally transferable to an unrelated party, it is not reflected in plan assets in our consolidated financial statements and instead has been eliminated in consolidation. At the time of the contribution of the preferred equity interest, we made an additional cash contribution of $175 and have agreed to annual cash contributions of $175 no later than the due date for our federal income tax return for each of 2014, 2015 and 2016. These contributions combined with our

Notes to Consolidated Financial Statements (continued)Dollars in millions except per share amounts
60 | AT&T Inc.
Net Periodic Benefit Cost and Other Amounts Recognized in Other Comprehensive IncomePeriodic Benefit CostsOur combined net pension and postretirement (credit) cost recognized in our consolidated statements of income was $(7,390), $10,257 and $7,288 for the years ended December 31, 2013, 2012 and 2011. A portion of pension and postretirement benefit costs is capitalized as part of the benefit load on internal construction and capital expenditures, providing a small reduction in the net expense recorded. The following table presents the components of net periodic benefit cost.
Pension Benefits Postretirement Benefits
2013 2012 2011 2013 2012 2011
Service cost – benefits earned during the period $ 1,321 $ 1,216 $ 1,186 $ 352 $ 336 $ 362Interest cost on projected benefit obligation 2,429 2,800 2,958 1,532 1,725 2,051Expected return on assets (3,312) (3,520) (3,690) (706) (811) (1,040)Amortization of prior service credit (94) (15) (15) (1,161) (927) (694)Actuarial (gain) loss (5,013) 5,206 4,498 (2,738) 4,247 1,672
Net pension and postretirement (credit) cost $(4,669) $ 5,687 $ 4,937 $(2,721) $4,570 $ 2,351
Other Changes in Benefit Obligations Recognized in Other Comprehensive IncomeThe following table presents the after-tax changes in benefit obligations recognized in OCI and the after-tax prior service credits that were amortized from OCI into net periodic benefit costs:
Pension Benefits Postretirement Benefits
2013 2012 2011 2013 2012 2011
Balance at beginning of year $641 $ 92 $102 $4,766 $3,655 $2,951
Prior service (cost) credit — 559 — 2,765 1,686 1,134Amortization of prior service credit (58) (10) (10) (719) (575) (430)
Total recognized in other comprehensive (income) loss (58) 549 (10) 2,046 1,111 704
Balance at end of year $583 $641 $ 92 $6,812 $4,766 $3,655
The accumulated benefit obligation for our pension plans represents the actuarial present value of benefits based on employee service and compensation as of a certain date and does not include an assumption about future compensation levels. The accumulated benefit obligation for our pension plans was $55,077 at December 31, 2013, and $57,010 at December 31, 2012.
Amounts recognized on our consolidated balance sheets at December 31 are listed below:
Pension Benefits Postretirement Benefits
2013 2012 2013 2012
Current portion of employee benefit obligation1 $ — $ — $ (1,949) $ (2,116)Employee benefit obligation2 (9,322) (13,851) (19,376) (26,020)
Net amount recognized $(9,322) $(13,851) $(21,325) $(28,136) 1 Included in “Accounts payable and accrued liabilities.”2 Included in “Postemployment benefit obligation.”

AT&T Inc. | 61
The estimated prior service credits that will be amortized from accumulated OCI into net periodic benefit cost over the next fiscal year is $94 ($58 net of tax) for pension and $1,448 ($898 net of tax) for postretirement benefits.
AssumptionsIn determining the projected benefit obligation and the net pension and postemployment benefit cost, we used the following significant weighted-average assumptions:
2013 2012 2011
Discount rate for determining projected benefit obligation at December 31 5.00% 4.30% 5.30%Discount rate in effect for determining net cost 4.30% 5.30% 5.80%Long-term rate of return on plan assets 7.75% 8.25% 8.25%Composite rate of compensation increase for determining projected benefit obligation 3.00% 3.00% 4.00%Composite rate of compensation increase for determining net pension cost (benefit) 3.00% 4.00% 4.00%
We recognize gains and losses on pension and postretirement plan assets and obligations immediately in our operating results. These gains and losses are measured annually as of December 31 and accordingly will be recorded during the fourth quarter, unless earlier remeasurements are required.
Discount Rate Our assumed discount rate of 5.00% at December 31, 2013, reflects the hypothetical rate at which the projected benefit obligations could be effectively settled or paid out to participants. We determined our discount rate based on a range of factors, including a yield curve composed of the rates of return on several hundred high-quality, fixed income corporate bonds available at the measurement date and the related expected duration for the obligations. These bonds were all rated at least Aa3 or AA- by one of the nationally recognized statistical rating organizations, denominated in U.S. dollars, and neither callable, convertible nor index linked. For the year ended December 31, 2013, we increased our discount rate by 0.70%, resulting in a decrease in our pension plan benefit obligation of $4,533 and a decrease in our postretirement benefit obligation of $3,161. For the year ended December 31, 2012, we decreased our discount rate by 1.00%, resulting in an increase in our pension plan benefit obligation of $7,030 and an increase in our postretirement benefit obligation of $4,546.
Expected Long-Term Rate of Return Our expected long-term rate of return on plan assets of 7.75% for 2014 and 2013 reflects the average rate of earnings expected on the funds invested, or to be invested, to provide for the benefits included in the projected benefit obligations. In setting the long-term assumed rate of return, management considers capital markets future expectations and the asset mix of the plans’ investments. Actual long-term return can, in relatively stable markets, also serve as a factor in determining future expectations. We consider many factors that include, but are not limited to, historical returns on plan assets, current market information on long-term returns (e.g., long-term bond rates) and current and target asset allocations between asset categories. The target asset allocation is determined based on consultations with external investment advisers. If all other factors were to remain unchanged, we expect that a 0.50% decrease in the expected long-term rate of return would cause 2014 combined pension and postretirement cost to increase $262. However, any differences in the rate and actual returns will be included with the actuarial gain or loss recorded in the fourth quarter when our plans are remeasured.
Composite Rate of Compensation Increase Our expected composite rate of compensation increase cost of 3.00% in 2014 and 2013 reflects the long-term average rate of salary increases.
Mortality Tables At December 31, 2013 we updated our assumed mortality rates to better predict future mortality improvements, creating an increase of $1,986 in our pension obligation and $679 in our postretirement obligations.
Healthcare Cost Trend Our healthcare cost trend assumptions are developed based on historical cost data, the near-term outlook and an assessment of likely long-term trends. In addition to the healthcare cost trend in 2013, we assumed an annual 2.50% growth in administrative expenses and an annual 3.00% growth in dental claims. Our assumed annual healthcare cost trend rate for 2014 and 2013 is 5.00% and our ultimate trend rate is 5.00%.
A one percentage-point change in the assumed combined medical and dental cost trend rate would have the following effects:
One Percentage- One Percentage- Point Increase Point Decrease
Increase (decrease) in total of service and interest cost components $ 207 $(179)Increase (decrease) in accumulated postretirement benefit obligation 1,010 (878)

Notes to Consolidated Financial Statements (continued)Dollars in millions except per share amounts
62 | AT&T Inc.
future economic scenarios, to maximize long-term investment return with an acceptable level of risk based on our pension and postretirement obligations, and to be broadly diversified across and within the capital markets to insulate asset values against adverse experience in any one market. Each asset class has broadly diversified characteristics. Substantial biases toward any particular investing style or type of security are sought to be avoided by managing the aggregation of all accounts with portfolio benchmarks. Asset and benefit obligation forecasting studies are conducted periodically, generally every two to three years, or when significant changes have occurred in market conditions, benefits, participant demographics or funded status. Decisions regarding investment policy are made with an understanding of the effect of asset allocation on funded status, future contributions and projected expenses. The current asset allocation policy and risk level for the pension plan and VEBA assets is based on a study completed and approved during 2013 and is reflected in the table below.
Plan AssetsPlan assets consist primarily of private and public equity, government and corporate bonds, and real assets (real estate and natural resources). The asset allocations of the pension plans are maintained to meet ERISA requirements. Any plan contributions, as determined by ERISA regulations, are made to a pension trust for the benefit of plan participants. As part of our voluntary contribution of the Mobility preferred equity interest, we will contribute $560 of cash distributions during 2014. We do not have additional significant required contributions to our pension plans for 2014.
We maintain VEBA trusts to partially fund postretirement benefits; however, there are no ERISA or regulatory requirements that these postretirement benefit plans be funded annually.
The principal investment objectives are to ensure the availability of funds to pay pension and postretirement benefits as they become due under a broad range of
The plans’ weighted-average asset targets and actual allocations as a percentage of plan assets, including the notional exposure of future contracts by asset categories at December 31, are as follows:
Pension Assets Postretirement (VEBA) Assets
Target 2013 2012 Target 2013 2012
Equity securities: Domestic 25% – 35% 25% 26% 20% – 30% 25% 37% International 10% – 20% 16 16 15% – 25% 20 33Fixed income securities 30% – 40% 33 34 19% – 29% 24 24Real assets 6% – 16% 11 11 0% – 6% 1 1Private equity 4% – 14% 12 13 0% – 9% 4 4Other 0% – 5% 3 — 21% – 31% 26 1
Total 100% 100% 100% 100%
Investments in securities not traded on a national securities exchange are valued using pricing models, quoted prices of securities with similar characteristics or discounted cash flows. Shares of registered investment companies are valued based on quoted market prices, which represent the net asset value of shares held at year-end. Over-the-counter (OTC) securities and government obligations are valued at the bid price or the average of the bid and asked price on the last business day of the year from published sources where available and, if not available, from other sources considered reliable. Depending on the types and contractual terms of OTC derivatives, fair value is measured using valuation techniques, such as the Black-Scholes option pricing model, simulation models or a combination of various models.
At December 31, 2013, AT&T securities represented less than 0.5% of assets held by our pension plans and VEBA trusts included in these financial statements.
Investment Valuation Investments are stated at fair value. Fair value is the price that would be received to sell an asset or paid to transfer a liability in an orderly transaction between market participants at the measurement date. See “Fair Value Measurements” for further discussion.
Investments in securities traded on a national securities exchange are valued at the last reported sales price on the last business day of the year. If no sale was reported on that date, they are valued at the last reported bid price.

AT&T Inc. | 63
investment manager, which have been agreed to by an external valuation consultant. Fixed income securities valuation is based upon pricing provided by an external pricing service when such pricing is available. In the event a security is too thinly traded or narrowly held to be priced by such a pricing service, or the price furnished by such external pricing services is deemed inaccurate, the managers will then solicit broker/dealer quotes (spreads or prices). In cases where such quotes are available, fair value will be determined based solely upon such quotes provided. Managers will typically use a pricing matrix for determining fair value in cases where an approved pricing service or a broker/dealer is unable to provide a fair valuation for specific fixed-rate securities such as many private placements. New fixed-rate securities will be initially valued at cost at the time of purchase. Thereafter, each bond will be assigned a spread from a pricing matrix that will be added to current Treasury rates. The pricing matrix derives spreads for each bond based on external market data, including the current credit rating for the bonds, credit spreads to Treasuries for each credit rating, sector add-ons or credits, issue specific add-ons or credits as well as call or other options.
Purchases and sales of securities are recorded as of the trade date. Realized gains and losses on sales of securities are determined on the basis of average cost. Interest income is recognized on the accrual basis. Dividend income is recognized on the ex-dividend date.
Non-interest bearing cash and overdrafts are valued at cost, which approximates fair value.
Fair Value MeasurementsSee Note 10 for a discussion of fair value hierarchy that prioritizes the inputs to valuation techniques used to measure fair value.
Common/collective trust funds, pooled separate accounts and other commingled (103-12) investment entities are valued at quoted redemption values that represent the net asset values of units held at year-end which management has determined approximates fair value.
Alternative investments, including investments in private equity, real estate, natural resources (included in real assets), mezzanine and distressed debt (included in partnerships/joint ventures), limited partnership interest, fixed income securities and hedge funds do not have readily available market values. These estimated fair values may differ significantly from the values that would have been used had a ready market for these investments existed, and such differences could be material. Alternative investments not having an established market are valued at fair value as determined by the investment managers. Private equity, mezzanine and distressed investments are often valued initially by the investment managers based upon cost. Thereafter, investment managers may use available market data to determine adjustments to carrying value based upon observations of the trading multiples of public companies considered comparable to the private companies being valued. Such market data used to determine adjustments to accounts for cash flows and company-specified issues include current operating performance and future expectations of the investments, changes in market outlook, and the third-party financing environment. Private equity partnership holdings may also include publicly held equity investments in liquid markets that are marked-to-market at quoted public values, subject to adjustments for large positions held. Real estate and natural resource direct investments are valued either at amounts based upon appraisal reports prepared by independent third-party appraisers or at amounts as determined by internal appraisals performed by the

Notes to Consolidated Financial Statements (continued)Dollars in millions except per share amounts
64 | AT&T Inc.
The following table sets forth by level, within the fair value hierarchy, the pension and postretirement assets and liabilities at fair value as of December 31, 2013:
Pension Assets and Liabilities at Fair Value as of December 31, 2013 Level 1 Level 2 Level 3 Total
Non-interest bearing cash $ 65 $ — $ — $ 65Interest bearing cash — 324 — 324Foreign currency contracts — 3 — 3Equity securities: Domestic equities 9,841 3 — 9,844 International equities 6,431 7 — 6,438Fixed income securities: Asset-backed securities — 553 3 556 Mortgage-backed securities — 2,470 — 2,470 Collateralized mortgage-backed securities — 364 — 364 Collateralized mortgage obligations/REMICS — 514 — 514 Other Corporate and other bonds and notes 154 5,147 540 5,841 Government and municipal bonds 15 4,566 — 4,581Private equity funds — — 5,724 5,724Real estate and real assets — — 5,194 5,194Commingled funds — 6,358 4 6,362Securities lending collateral 390 3,074 — 3,464Receivable for variation margin 12 — — 12
Assets at fair value 16,908 23,383 11,465 51,756
Investments sold short and other liabilities at fair value (619) (5) — (624)
Total plan net assets at fair value $16,289 $23,378 $11,465 $ 51,132
Other assets (liabilities)1 (3,894)
Total Plan Net Assets $47,238 1 Other assets (liabilities) include amounts receivable, accounts payable and net adjustment for securities lending payable.
Postretirement Assets and Liabilities at Fair Value as of December 31, 2013 Level 1 Level 2 Level 3 Total
Interest bearing cash $ 405 $2,073 $ — $ 2,478Equity securities: Domestic equities 1,609 — — 1,609 International equities 1,527 — — 1,527Fixed income securities: Asset-backed securities — 35 2 37 Collateralized mortgage-backed securities — 110 — 110 Collateralized mortgage obligations — 53 3 56 Other Corporate and other bonds and notes — 367 18 385 Government and municipal bonds — 558 1 559Commingled funds — 1,899 2 1,901Private equity assets — — 309 309Real assets — — 111 111Securities lending collateral 19 372 — 391Foreign exchange contracts receivable 3 — — 3
Assets at fair value 3,563 5,467 446 9,476
Foreign exchange contracts payable 3 — — 3
Liabilities at fair value 3 — — 3
Total plan net assets at fair value $3,560 $5,467 $446 $ 9,473
Other assets (liabilities)1 (513)
Total Plan Net Assets $8,960 1 Other assets (liabilities) include amounts receivable, accounts payable and net adjustment for securities lending payable.

AT&T Inc. | 65
The tables below set forth a summary of changes in the fair value of the Level 3 pension and postretirement assets for the year ended December 31, 2013:
Fixed Private Real Estate Income Equity and Pension Assets Equities Funds Funds Real Assets Total
Balance at beginning of year $ — $1,042 $ 5,797 $ 4,766 $ 11,605Realized gains (losses) (3) 53 390 122 562Unrealized gains (losses) 3 (8) 546 525 1,066Transfers in — 5 — — 5Transfers out — (442) — — (442)Purchases — 75 1,214 354 1,643Sales — (178) (2,223) (573) (2,974)
Balance at end of year $ — $ 547 $5,724 $5,194 $11,465
Fixed Private Income Equity Postretirement Assets Funds Funds Real Assets Total
Balance at beginning of year $21 $ 343 $ 110 $ 474Realized gains (losses) — 2 12 14Unrealized gains (losses) 1 58 4 63Transfers in 1 — — 1Transfers out (1) — — (1)Purchases 5 89 27 121Sales (1) (183) (42) (226)
Balance at end of year $26 $ 309 $ 111 $ 446

Notes to Consolidated Financial Statements (continued)Dollars in millions except per share amounts
66 | AT&T Inc.
The following tables set forth by level, within the fair value hierarchy, the pension and postretirement assets and liabilities at fair value as of December 31, 2012:
Pension Assets and Liabilities at Fair Value as of December 31, 2012 Level 1 Level 2 Level 3 Total
Non-interest bearing cash $ 144 $ — $ — $ 144Interest bearing cash 56 235 — 291Foreign currency contracts — 1 — 1Equity securities: Domestic equities 8,291 — — 8,291 International equities 6,361 29 — 6,390Fixed income securities: Asset-backed securities — 543 14 557 Mortgage-backed securities — 2,324 — 2,324 Collateralized mortgage-backed securities — 311 — 311 Collateralized mortgage obligations/REMICS — 523 1 524 Other Corporate and other bonds and notes 140 4,903 600 5,643 Government and municipal bonds 50 5,301 — 5,351Private equity funds — — 5,797 5,797Real estate and real assets — — 4,766 4,766Commingled funds — 4,927 426 5,353Securities lending collateral 868 1,930 1 2,799Receivable for variation margin 72 — — 72
Assets at fair value 15,982 21,027 11,605 48,614
Investments sold short and other liabilities at fair value (563) (7) — (570)
Total plan net assets at fair value $15,419 $21,020 $11,605 $48,044
Other assets (liabilities)1 (2,984)
Total Plan Net Assets $45,060 1 Other assets (liabilities) include amounts receivable, accounts payable and net adjustment for securities lending payable.
Postretirement Assets and Liabilities at Fair Value as of December 31, 2012 Level 1 Level 2 Level 3 Total
Interest bearing cash $ 169 $ 243 $ — $ 412Equity securities: Domestic equities 2,575 — — 2,575 International equities 2,685 1 — 2,686Fixed income securities: Asset-backed securities — 29 — 29 Collateralized mortgage-backed securities — 79 — 79 Collateralized mortgage obligations — 46 — 46 Other Corporate and other bonds and notes 1 383 17 401 Government and municipal bonds 22 598 — 620Commingled funds 82 2,038 4 2,124Private equity assets — — 343 343Real assets — — 110 110Securities lending collateral 544 81 — 625
Assets at fair value 6,078 3,498 474 10,050
Total plan net assets at fair value $ 6,078 $ 3,498 $ 474 $10,050
Other assets (liabilities)1 (755)
Total Plan Net Assets $ 9,295 1 Other assets (liabilities) include amounts receivable, accounts payable and net adjustment for securities lending payable.

AT&T Inc. | 67
The tables below set forth a summary of changes in the fair value of the Level 3 pension and postretirement assets for the year ended December 31, 2012:
Fixed Private Real Estate Income Equity and Pension Assets Equities Funds Funds Real Assets Total
Balance at beginning of year $ 4 $ 824 $ 5,931 $ 5,213 $11,972Realized gains (losses) (1) 16 459 165 639Unrealized gains (losses) 1 33 32 10 76Transfers in — 120 12 24 156Transfers out — (2) — — (2)Purchases — 142 610 918 1,670Sales (4) (91) (1,247) (1,564) (2,906)
Balance at end of year $ — $1,042 $ 5,797 $ 4,766 $11,605
Fixed Private Income Equity Postretirement Assets Funds Funds Real Assets Total
Balance at beginning of year $24 $ 437 $ 124 $ 585Realized gains (losses) — 58 16 74Unrealized gains (losses) — (39) (5) (44)Purchases — 20 33 53Sales (3) (133) (58) (194)
Balance at end of year $21 $ 343 $ 110 $ 474
Supplemental Retirement PlansWe also provide certain senior- and middle-management employees with nonqualified, unfunded supplemental retirement and savings plans. While these plans are unfunded, we have assets in a designated nonbankruptcy remote trust that are independently managed and used to provide for these benefits. These plans include supplemental pension benefits as well as compensation-deferral plans, some of which include a corresponding match by us based on a percentage of the compensation deferral.
We use the same significant assumptions for the discount rate and composite rate of compensation increase used in determining the projected benefit obligation and the net pension and postemployment benefit cost. The following tables provide the plans’ benefit obligations and fair value of assets at December 31 and the components of the supplemental retirement pension benefit cost. The net amounts are recorded as “Other noncurrent liabilities” on our consolidated balance sheets.
Estimated Future Benefit PaymentsExpected benefit payments are estimated using the same assumptions used in determining our benefit obligation at December 31, 2013. Because benefit payments will depend on future employment and compensation levels, average years employed, average life spans, and payment elections, among other factors, changes in any of these factors could significantly affect these expected amounts. Due to our move to a group prescription drug provider plan in 2013 for certain of our Medicare eligible retirees and the move to a private exchange market for all remaining Medicare eligible retirees receiving subsidized drug coverage in 2015, AT&T does not expect to be receiving any direct Medicare Part D subsidies for years 2015 and beyond. The following table provides expected benefit payments under our pension and postretirement plans:
Medicare Pension Postretirement Subsidy Benefits Benefits Receipts
2014 $ 7,376 $2,265 $(19)2015 4,294 2,271 —2016 4,197 2,222 —2017 4,115 2,171 —2018 4,029 2,129 —Years 2019 – 2023 19,589 9,921 —

Notes to Consolidated Financial Statements (continued)Dollars in millions except per share amounts
68 | AT&T Inc.
NOTE 13. SHARE-BASED PAYMENTS
Under our various plans, senior and other management employees and nonemployee directors have received nonvested stock and stock units. We grant performance stock units, which are nonvested stock units, based upon our stock price at the date of grant and award them in the form of AT&T common stock and cash at the end of a three-year period, subject to the achievement of certain performance goals. We treat the cash portion of these awards as a liability. We grant forfeitable restricted stock and stock units, which are valued at the market price of our common stock at the date of grant and vest typically over a two- to seven-year period. We also grant other nonvested stock units and award them in cash at the end of a three-year period, subject to the achievement of certain market based conditions. As of December 31, 2013, we were authorized to issue up to 128 million shares of common stock (in addition to shares that may be issued upon exercise of outstanding options or upon vesting of performance stock units or other nonvested stock units) to officers, employees and directors pursuant to these various plans.
We account for our share-based payment arrangements based on the fair value of the awards on their respective grant date, which may affect our ability to fully realize the value shown on our consolidated balance sheets of deferred tax assets associated with compensation expense. We record a valuation allowance when our future taxable income is not expected to be sufficient to recover the asset. Accordingly, there can be no assurance that the current stock price of our common shares will rise to levels sufficient to realize the entire tax benefit currently reflected on our consolidated balance sheets. However, to the extent we generate excess tax benefits (i.e., that additional tax benefits in excess of the deferred taxes associated with compensation expense previously recognized) the potential future impact on income would be reduced.
The compensation cost recognized for those plans was included in operating expenses in our consolidated statements of income, as reflected in the table below. The total income tax benefit recognized in the consolidated statements of income for share-based payment arrangements was $175 for 2013, compared to $195 for 2012 and $187 for 2011.
2013 2012 2011
Performance stock units $381 $397 $388Restricted stock and stock units 80 102 91Other nonvested stock units (3) 12 4Other — — 6
Total $458 $511 $489
The following table provides information for our supplemental retirement plans with accumulated benefit obligations in excess of plan assets at December 31:
2013 2012
Projected benefit obligation $(2,280) $(2,456)Accumulated benefit obligation (2,227) (2,392)Fair value of plan assets — —
The following tables present the components of net periodic benefit cost and other changes in plan assets and benefit obligations recognized in OCI:
Net Periodic Benefit Cost 2013 2012 2011
Service cost – benefits earned during the period $ 9 $ 10 $ 14Interest cost on projected benefit obligation 101 116 126Amortization of prior service cost (credit) — — 2Actuarial (gain) loss (106) 230 81
Net supplemental retirement pension cost $ 4 $356 $223
Other Changes Recognized in Other Comprehensive Income 2013 2012 2011
Prior service (cost) credit $ (1) $ (1) $ 6Amortization of prior service cost (credit) — — 1
Total recognized in other comprehensive (income) loss (net of tax) $ (1) $ (1) $ 7
The estimated prior service credit for our supplemental retirement plan benefits that will be amortized from accumulated OCI into net periodic benefit cost over the next fiscal year is $1.
Deferred compensation expense was $122 in 2013, $118 in 2012 and $96 in 2011. Our deferred compensation liability, included in “Other noncurrent liabilities,” was $1,118 at December 31, 2013, and $1,061 at December 31, 2012.
Contributory Savings PlansWe maintain contributory savings plans that cover substantially all employees. Under the savings plans, we match in cash or company stock a stated percentage of eligible employee contributions, subject to a specified ceiling. There are no debt-financed shares held by the Employee Stock Ownership Plans, allocated or unallocated.
Our match of employee contributions to the savings plans is fulfilled with purchases of our stock on the open market or company cash. Benefit cost is based on the cost of shares or units allocated to participating employees’ accounts and was $654, $634 and $636 for the years ended December 31, 2013, 2012 and 2011.

AT&T Inc. | 69
A summary of the status of our nonvested stock units as of December 31, 2013, and changes during the year then ended is presented as follows (shares in millions):
Weighted-Average Nonvested Stock Units Shares Grant-Date Fair Value
Nonvested at January 1, 2013 26 $ 28.55Granted 11 35.36Vested (12) 27.99Forfeited (1) 31.10
Nonvested at December 31, 2013 24 $31.93
As of December 31, 2013, there was $348 of total unrecognized compensation cost related to nonvested share-based payment arrangements granted. That cost is expected to be recognized over a weighted-average period of 1.95 years. The total fair value of shares vested during the year was $336 for 2013, compared to $333 for 2012 and $360 for 2011.
It is our policy to satisfy share option exercises using our treasury stock. Cash received from stock option exercises was $135 for 2013, $517 for 2012 and $250 for 2011.
NOTE 14. STOCKHOLDERS’ EQUITY
Stock Repurchase Program From time to time, we repurchase shares of common stock for distribution through our employee benefit plans or in connection with certain acquisitions. In December 2010, our Board of Directors authorized the repurchase of 300 million shares of our common stock. We began buying back stock under this program in 2012 and completed the purchase of authorized shares that year. In July 2012, our Board of Directors approved a second authorization to repurchase 300 million shares and we completed that program in May 2013. In March 2013, our Board of Directors approved a third authorization to repurchase 300 million shares, under which we are currently purchasing shares. For the year ended December 31, 2013, we had repurchased approximately 366 million shares totaling $13,028 under these authorizations. For the year ended December 31, 2012, we had repurchased approximately 371 million shares totaling $12,752 under these authorizations. We expect to make future repurchases opportunistically.
To implement these authorizations, we use open market repurchase programs, relying on Rule 10b5-1 of the Securities Exchange Act of 1934 where feasible. We also use accelerated share repurchase programs with large financial institutions to repurchase our stock.
Authorized Shares There are 14 billion authorized common shares of AT&T stock and 10 million authorized preferred shares of AT&T stock. As of December 31, 2013 and 2012, no preferred shares were outstanding.
Dividend Declarations In December 2013, the Company declared an increase in its quarterly dividend to $0.46 per share of common stock. In November 2012, the Company declared a quarterly dividend of $0.45 per share of common stock, which reflected an increase from the $0.44 quarterly dividend declared in December 2011.
Preferred Equity Interest The preferred equity interest discussed in Note 12 is not transferable by the trust except through its put and call features, and therefore has been eliminated in consolidation. After a period of five years from the contribution or, if earlier, the date upon which the pension plan trust is fully funded as determined under GAAP, AT&T has a right to purchase from the pension plan trust some or all of the preferred equity interest at the greater of their fair market value or minimum liquidation value plus any unpaid cumulative dividends. In addition, AT&T will have the right to purchase the preferred equity interest in the event AT&T’s ownership of Mobility is less than 50% or there is a transaction that results in the transfer of 50% or more of the pension plan trust’s assets to an entity not under common control with AT&T (collectively, a change of control). The pension plan trust has the right to require AT&T to purchase the preferred equity interest at the greater of their fair market value or minimum liquidation value plus any unpaid cumulative dividends, and in installments, as specified in the contribution agreement upon the occurrence of any of the following: (1) at any time if the ratio of debt to total capitalization of Mobility exceeds that of AT&T, (2) the date on which AT&T Inc. is rated below investment grade for two consecutive calendar quarters, (3) upon a change of control if AT&T does not exercise its purchase option, or (4) at any time after a seven-year period from the contribution date. In the event AT&T elects or is required to purchase the preferred equity interest, AT&T may elect to settle the purchase price in cash or shares of AT&T common stock or a combination thereof. Because the preferred equity interest was not considered outstanding for accounting purposes at year-end, it did not affect the calculation of earnings per share.

Notes to Consolidated Financial Statements (continued)Dollars in millions except per share amounts
70 | AT&T Inc.
NOTE 15. ADDITIONAL FINANCIAL INFORMATION
December 31,
Consolidated Balance Sheets 2013 2012
Accounts payable and accrued liabilities: Accounts payable $11,561 $12,076 Accrued payroll and commissions 1,985 2,332 Current portion of employee benefit obligation 1,949 2,116 Accrued interest 1,559 1,588 Other 4,053 2,382
Total accounts payable and accrued liabilities $21,107 $20,494
Consolidated Statements of Income 2013 2012 2011
Advertising expense $3,268 $2,910 $3,135
Interest expense incurred $4,224 $3,707 $3,697Capitalized interest (284) (263) (162)
Total interest expense $3,940 $3,444 $3,535
Consolidated Statements of Cash Flows 2013 2012 2011
Cash paid during the year for: Interest $4,302 $3,714 $3,691 Income taxes, net of refunds 1,985 458 32
No customer accounted for more than 10% of consolidated revenues in 2013, 2012 or 2011.
A majority of our employees are represented by labor unions as of year-end 2013.
NOTE 16. TOWER TRANSACTION
On December 16, 2013, we closed our transaction with Crown Castle International Corp. (Crown Castle) in which Crown Castle gained the exclusive rights to lease and operate 9,048 wireless towers and purchased 627 of our wireless towers for $4,827 in cash. Under the terms of the leases, Crown Castle has exclusive rights to lease and operate the towers over various terms with an average length of approximately 28 years. As the leases expire, Crown Castle will have fixed price purchase options for these towers totaling approximately $4,200, based on their estimated fair market values at the end of the lease terms. We sublease space on the towers from Crown Castle for an initial term of 10 years at current market rates, subject to optional renewals in the future.
We determined our continuing involvement with the tower assets prevented us from achieving sale-leaseback accounting for the transaction, and we accounted for the cash proceeds from Crown Castle as a financing obligation on our consolidated balance sheet. We record interest on the financing obligation using the effective interest method at a rate of approximately 3.90%. The financing obligation is increased by interest expense and estimated future net cash flows generated and retained by Crown Castle from operation of the tower sites, and reduced by our contractual payments. We continue to include the tower assets in Property, plant and equipment in our consolidated balance sheets and depreciate them accordingly. At December 31, 2013, the tower assets had a balance of $1,039. The impact of the transaction on our operating results for the year ended December 31, 2013, was not material.
The future minimum payments under the sublease arrangement are $221 for 2014, $225 for 2015, $229 for 2016, $234 for 2017, $239 for 2018, and $2,797 thereafter.
NOTE 17. CONTINGENT LIABILITIES
We are party to numerous lawsuits, regulatory proceedings and other matters arising in the ordinary course of business. In evaluating these matters on an ongoing basis, we take into account amounts already accrued on the balance sheet. In our opinion, although the outcomes of these proceedings are uncertain, they should not have a material adverse effect on our financial position, results of operations or cash flows.
We have contractual obligations to purchase certain goods or services from various other parties. Our purchase obligations are expected to be approximately $5,749 in 2014, $5,182 in total for 2015 and 2016, $2,570 in total for 2017 and 2018 and $819 in total for years thereafter.
See Note 10 for a discussion of collateral and credit- risk contingencies.

AT&T Inc. | 71
NOTE 18. QUARTERLY FINANCIAL INFORMATION (UNAUDITED)
The following tables represent our quarterly financial results:
2013 Calendar Quarter
First Second Third Fourth2 Annual
Total Operating Revenues $31,356 $32,075 $32,158 $33,163 $128,752Operating Income 5,940 6,113 6,188 12,238 30,479Net Income 3,773 3,880 3,905 6,995 18,553Net Income Attributable to AT&T 3,700 3,822 3,814 6,913 18,249
Basic Earnings Per Share Attributable to AT&T1 $ 0.67 $ 0.71 $ 0.72 $ 1.31 $ 3.39
Diluted Earnings Per Share Attributable to AT&T1 $ 0.67 $ 0.71 $ 0.72 $ 1.31 $ 3.39
Stock PriceHigh $ 36.87 $ 39.00 $ 36.31 $ 36.80Low 32.76 34.10 33.19 33.09Close 36.69 35.40 33.82 35.16 1 Quarterly earnings per share impacts may not add to full-year earnings per share impacts due to the difference in weighted-average common shares for the quarters versus the weighted-average common shares for the year.
2 Includes an actuarial gain on pension and postretirement benefit plans (Note 12), special termination charges (Note 12) and charges for employee separations (Note 1).
2012 Calendar Quarter
First Second Third Fourth2 Annual
Total Operating Revenues $31,822 $31,575 $31,459 $32,578 $127,434Operating Income (Loss) 6,101 6,817 6,037 (5,958) 12,997Net Income (Loss) 3,652 3,965 3,701 (3,779) 7,539Net Income (Loss) Attributable to AT&T 3,584 3,902 3,635 (3,857) 7,264
Basic Earnings (Loss) Per Share Attributable to AT&T1 $ 0.60 $ 0.67 $ 0.63 $ (0.68) $ 1.25
Diluted Earnings (Loss) Per Share Attributable to AT&T1 $ 0.60 $ 0.66 $ 0.63 $ (0.68) $ 1.25
Stock PriceHigh $ 31.97 $ 36.00 $ 38.58 $ 38.43Low 29.02 29.95 34.24 32.71Close 31.23 35.66 37.70 33.71 1 Quarterly earnings per share impacts may not add to full-year earnings per share impacts due to the difference in weighted-average common shares for the quarters versus the weighted-average common shares for the year.
2 Includes an actuarial loss on pension and postretirement benefit plans (Note 12).

72 | AT&T Inc.
Report of Management
The consolidated financial statements have been prepared in conformity with U.S. generally accepted accounting principles. The integrity and objectivity of the data in these financial statements, including estimates and judgments relating to matters not concluded by year end, are the responsibility of management, as is all other information included in the Annual Report, unless otherwise indicated.
The financial statements of AT&T Inc. (AT&T) have been audited by Ernst & Young LLP, Independent Registered Public Accounting Firm. Management has made available to Ernst & Young LLP all of AT&T’s financial records and related data, as well as the minutes of stockholders’ and directors’ meetings. Furthermore, management believes that all representations made to Ernst & Young LLP during its audit were valid and appropriate.
Management maintains disclosure controls and procedures that are designed to ensure that information required to be disclosed by AT&T is recorded, processed, summarized, accumulated and communicated to its management, including its principal executive and principal financial officers, to allow timely decisions regarding required disclosure, and reported within the time periods specified by the Securities and Exchange Commission’s rules and forms.
Management also seeks to ensure the objectivity and integrity of its financial data by the careful selection of its managers, by organizational arrangements that provide an appropriate division of responsibility and by communication programs aimed at ensuring that its policies, standards and managerial authorities are understood throughout the organization.
The Audit Committee of the Board of Directors meets periodically with management, the internal auditors and the independent auditors to review the manner in which they are performing their respective responsibilities and to discuss auditing, internal accounting controls and financial reporting matters. Both the internal auditors and the independent auditors periodically meet alone with the Audit Committee and have access to the Audit Committee at any time.
Assessment of Internal ControlThe management of AT&T is responsible for establishing and maintaining adequate internal control over financial reporting, as defined in Rule 13a-15(f) or 15d-15(f) under the Securities Exchange Act of 1934. AT&T’s internal control system was designed to provide reasonable assurance to the company’s management and Board of Directors regarding the preparation and fair presentation of published financial statements.
AT&T management assessed the effectiveness of the company’s internal control over financial reporting as of December 31, 2013. In making this assessment, it used the criteria set forth by the Committee of Sponsoring Organizations of the Treadway Commission (COSO) in Internal Control – Integrated Framework (1992 framework). Based on its assessment, AT&T management believes that, as of December 31, 2013, the Company’s internal control over financial reporting is effective based on those criteria.
Ernst & Young LLP, the independent registered public accounting firm that audited the financial statements included in this Annual Report, has issued an attestation report on the company’s internal control over financial reporting.
Randall Stephenson John J. Stephens Chairman of the Board, Senior Executive Vice President and Chief Executive Officer and President Chief Financial Officer

AT&T Inc. | 73
Report of Independent Registered Public Accounting Firm
The Board of Directors and Stockholders of AT&T Inc.
We have audited the accompanying consolidated balance sheets of AT&T Inc. (the Company) as of December 31, 2013 and 2012, and the related consolidated statements of income and comprehensive income, changes in stockholders’ equity, and cash flows for each of the three years in the period ended December 31, 2013. These financial statements are the responsibility of the Company’s management. Our responsibility is to express an opinion on these financial statements based on our audits.
We conducted our audits in accordance with the standards of the Public Company Accounting Oversight Board (United States). Those standards require that we plan and perform the audit to obtain reasonable assurance about whether the financial statements are free of material misstatement. An audit includes examining, on a test basis, evidence supporting the amounts and disclosures in the financial statements. An audit also includes assessing the accounting principles used and significant estimates made by management, as well as evaluating the overall financial statement presentation. We believe that our audits provide a reasonable basis for our opinion.
In our opinion, the financial statements referred to above present fairly, in all material respects, the consolidated financial position of the Company at December 31, 2013 and 2012, and the consolidated results of its operations and its cash flows for each of the three years in the period ended December 31, 2013, in conformity with U.S. generally accepted accounting principles.
We also have audited, in accordance with the standards of the Public Company Accounting Oversight Board (United States), the Company’s internal control over financial reporting as of December 31, 2013, based on criteria established in Internal Control-Integrated Framework (1992 framework) issued by the Committee of Sponsoring Organizations of the Treadway Commission and our report dated February 21, 2014 expressed an unqualified opinion thereon.
Dallas, Texas February 21, 2014

74 | AT&T Inc.
Report of Independent Registered Public Accounting Firm on Internal Control over Financial Reporting
The Board of Directors and Stockholders of AT&T Inc.
We have audited AT&T Inc.’s (the Company) internal control over financial reporting as of December 31, 2013, based on criteria established in Internal Control—Integrated Framework (1992 framework) issued by the Committee of Sponsoring Organizations of the Treadway Commission (the COSO criteria). The Company’s management is responsible for maintaining effective internal control over financial reporting, and for its assessment of the effectiveness of internal control over financial reporting included in the accompanying Report of Management. Our responsibility is to express an opinion on the Company’s internal control over financial reporting based on our audit.
We conducted our audit in accordance with the standards of the Public Company Accounting Oversight Board (United States). Those standards require that we plan and perform the audit to obtain reasonable assurance about whether effective internal control over financial reporting was maintained in all material respects. Our audit included obtaining an understanding of internal control over financial reporting, assessing the risk that a material weakness exists, testing and evaluating the design and operating effectiveness of internal control based on the assessed risk, and performing such other procedures as we considered necessary in the circumstances. We believe that our audit provides a reasonable basis for our opinion.
A company’s internal control over financial reporting is a process designed to provide reasonable assurance regarding the reliability of financial reporting and the preparation of financial statements for external purposes in accordance with generally accepted accounting principles. A company’s internal control over financial reporting includes those policies and procedures that (1) pertain to the maintenance of records that, in reasonable detail, accurately and fairly reflect the transactions and dispositions of the assets of the company; (2) provide reasonable assurance that transactions are recorded as necessary to permit preparation of financial statements in accordance with generally accepted accounting principles, and that receipts and expenditures of the company are being made only in accordance with authorizations of management and directors of the company; and (3) provide reasonable assurance regarding prevention or timely detection of unauthorized acquisition, use or disposition of the company’s assets that could have a material effect on the financial statements.
Because of its inherent limitations, internal control over financial reporting may not prevent or detect misstatements. Also, projections of any evaluation of effectiveness to future periods are subject to the risk that controls may become inadequate because of changes in conditions, or that the degree of compliance with the policies or procedures may deteriorate.
In our opinion, the Company maintained, in all material respects, effective internal control over financial reporting as of December 31, 2013, based on the COSO criteria.
We also have audited, in accordance with the standards of the Public Company Accounting Oversight Board (United States), the consolidated balance sheets of the Company as of December 31, 2013 and 2012, and the related consolidated statements of income and comprehensive income, changes in stockholders’ equity, and cash flows for each of the three years in the period ended December 31, 2013 and our report dated February 21, 2014 expressed an unqualified opinion thereon.
Dallas, Texas February 21, 2014

AT&T Inc. | 75
AT&T Inc. Board of Directors
Randall L. Stephenson, 53 (4)
Chairman of the Board,
Chief Executive Officer and President
AT&T Inc.
Dallas, Texas
Director since 2005
Background: Telecommunications
Reuben V. Anderson, 71 (3,4,6)
Lead Director
Senior Partner
Phelps Dunbar, LLP
Director since 2006
BellSouth Corporation
Director 1994–2006
Background: Law
James H. Blanchard*, 72 (2,4,5)
Chairman of the Board
and Partner
Jordan-Blanchard Capital, LLC
Director since 2006
BellSouth Corporation Director 1994–2006
BellSouth Telecommunications
Director 1988–1994
Background: Financial services
Jaime Chico Pardo, 64 (1,2)
Founder and Chief Executive Officer
ENESA
Director since 2008
Background: Telecommunications,
banking
Scott T. Ford, 51 (2,6)
Member and Chief Executive Officer
Westrock Group, LLC
Director since 2012
Background: Telecommunications
James P. Kelly, 70 (1,3)
Retired Chairman of the Board
and Chief Executive Officer
United Parcel Service, Inc.
Director since 2006
BellSouth Corporation Director 2000–2006
Background: Air delivery and freight services
Jon C. Madonna, 70 (1,3,4)
Retired Chairman and
Chief Executive Officer
KPMG
Director since 2005
AT&T Corp. Director 2002–2005
Background: Public accounting
Michael B. McCallister, 61 (1,6)
Retired Chairman of the Board
and Chief Executive Officer
Humana Inc.
Director since February 2013
Background: Health care
John B. McCoy, 70 (3,4,5)
Retired Chairman and
Chief Executive Officer
Bank One Corporation
Director since 1999
Ameritech Director 1991–1999
Background: Banking
Beth E. Mooney, 59 (2)
Chairman and Chief Executive Officer
KeyCorp
Director since September 2013
Background: Banking
Joyce M. Roché, 66 (3,4,5)
Author and Retired President and
Chief Executive Officer
Girls Incorporated
Director since 1998
Southern New England Telecommunications
Director 1997–1998
Background: Marketing
Matthew K. Rose, 54 (2,5)
Chairman of the Board
Burlington Northern Santa Fe, LLC
Director since 2010
Background: Freight transport
Cynthia B. Taylor, 52 (1)
President and Chief Executive Officer
Oil States International, Inc.
Director since June 2013
Background: Public accounting,
oil and gas
Laura D’Andrea Tyson, Ph.D., 66 (1,6)
Professor of Business Administration
and Economics
Haas School of Business
University of California at Berkeley
Director since 1999
Ameritech Director 1997–1999
Background: Economics, education
Committees of the Board:
(1) Audit
(2) Corporate Development and Finance
(3) Corporate Governance and Nominating
(4) Executive
(5) Human Resources
(6) Public Policy and Corporate Reputation
(Information is provided
as of March 11, 2014.)
*Retiring April 25, 2014

76 | AT&T Inc.
(Information is provided as
of February 21, 2014.)
Executive Officers of AT&T Inc. and Its Affiliates
Randall Stephenson, 53
Chairman, Chief Executive Officer
and President
Bill Blase Jr., 58
Senior Executive Vice President-
Human Resources
Jim Cicconi, 61
Senior Executive Vice President-
External and Legislative Affairs,
AT&T Services, Inc.
Cathy Coughlin, 56
Senior Executive Vice President
and Global Marketing Officer
Ralph de la Vega, 62
President and Chief Executive Officer,
AT&T Mobility
John Donovan, 53
Senior Executive Vice President-
AT&T Technology and
Network Operations
Andy Geisse, 57
Chief Executive Officer-
AT&T Business Solutions
Lori Lee, 48
Senior Executive Vice President-
Home Solutions
John Stankey, 51
Group President and
Chief Strategy Officer
John Stephens, 54
Senior Executive Vice President
and Chief Financial Officer
Wayne Watts, 60
Senior Executive Vice President
and General Counsel

STOCKHOLDER INFORMATIONToll-Free Stockholder Hotline
Call us at 1-800-351-7221 between 8 a.m. and 7 p.m. Central time, Monday through Friday (TDD 1-888-403-9700) for help with:
• Common stock account inquiries
• Requests for assistance with your common stock account, including stock transfers
• Information on The DirectSERVICETM Investment Program for Stockholders of AT&T Inc. (sponsored and administered by Computershare Trust Company, N.A.)
Written Stockholder Requests
Please mail all account inquiries and other requests for assistance regarding your stock ownership to:
AT&T Inc. c/o Computershare Trust Company, N.A. P.O. Box 43078 Providence, RI 02940-3078
You may also reach the transfer agent for AT&T Inc. at [email protected] or visit the website at www.computershare.com/att
DirectSERVICE Investment Program
The DirectSERVICE Investment Program for Stockholders of AT&T Inc. is sponsored and administered by Computershare Trust Company, N.A. The program allows current stockholders to reinvest dividends, purchase additional AT&T Inc. stock or enroll in an individual retirement account.
For more information, call 1-800-351-7221.
Stock Trading Information
AT&T Inc. is listed on the New York Stock Exchange. Ticker symbol: T
Information on the Internet
Information about AT&T Inc. is available on the Internet at www.att.com
Annual Meeting
The annual meeting of stockholders will be held at 9 a.m. local time Friday, April 25, 2014, at:
Rivermill Event Centre River View Room 3715 1st Avenue Columbus, GA 31904
SEC Filings
AT&T Inc.’s U.S. Securities and Exchange Commission filings, including the latest 10-K and proxy statement, are available on our website at www.att.com/investor.relations
Investor Relations
Securities analysts and other members of the professional financial community may contact the Investor Relations staff as listed on our website at www.att.com/investor.relations
Independent Auditor
Ernst & Young LLP 2323 Victory Ave., Suite 2000 Dallas, TX 75219
Corporate Offices and Non-Stockholder Inquiries
AT&T Inc. 208 S. Akard St. Dallas, TX 75202 210-821-4105
Annual Report printed on paper containing 30% post-consumer recycled fiber content
© 2014 AT&T Intellectual Property. All rights reserved. AT&T, the AT&T logo and all other marks contained herein are trademarks of AT&T Intellectual Property and/or AT&T affiliated companies.
All brands, product names, company names, trademarks and service marks are the properties of their respective owners.
1 Performance rankings of first in 56 cities and tied for first in 37 cities out of 125 total cities studied based on RootMetrics® RootScore® reports for each city in the second half of 2013 of 4 national mobile networks that rely on scores calculated from random samples. Your experiences may vary. The RootMetrics award is not an endorsement of AT&T. Visit rootmetrics.com for more details.
2 Gartner does not endorse any vendor, product or service depicted in the Magic Quadrant and does not advise technology users to select only those vendors with the highest ratings. Gartner research publications consist of the opinions of Gartner’s research organization and should not be construed as statements of fact. Gartner disclaims all warranties, expressed or implied, with respect to this research, including any warranties of merchantability or fitness for a particular purpose. Gartner, Inc., Magic Quadrant for Global Network Service Providers (Neil Rickard, Robert F. Mason, March 2013); Magic Quadrant for Managed Hosting, North America (Douglas Toombs, Lydia Leong, Bob Gill, Tiny Haynes, Gregor Petri, April 2013); Magic Quadrant for Communications Outsourcing and Professional Services (Eric Goodness, Christine Tenneson, October 2013).
3 PCWorld/TechHive, May 23, 2013, “AT&T clocks best overall speeds with 3G/4G combo”
4 PC Magazine, June 17, 2013; http://www.pcmag.com/article2/0,2817,2420333,00.asp
AT&T ONLINE ANNUAL REPORT Experience how we’re mobilizing our world at www.att.com/annualreport2013

AT&T Inc.208 S. Akard St. Dallas, TX 75202
att.com
mobilizing our world AT&T Inc. 2013 AnnuAl RepoRT