Mobility Performance Report 2011 - videos.dot.ca.gov..... xxii EXECUTIVE SUMMARY ... .76 . vi...
242
Mobility Performance Report 2011 The Joe A. Gonsalves Memorial Interchange, Photo by Lynn G. Harrison 2014
Transcript of Mobility Performance Report 2011 - videos.dot.ca.gov..... xxii EXECUTIVE SUMMARY ... .76 . vi...

Mobility Performance Report 2011
The Joe A. Gonsalves Memorial Interchange, Photo by Lynn G. Harrison
2014

ii
California Department of Transportation Mobility Performance Report 2011
PAGE INTENTIONALLY LEFT BLANK

iii
California Department of Transportation Mobility Performance Report 2011
CALIFORNIA DEPARTMENT OF TRANSPORTATION
MOBILITY PERFORMANCE REPORT 2011
Prepared by the
Division of Traffic Operations
Prepared for
California State Transportation Agency
2014
iv
California Department of Transportation Mobility Performance Report 2011
PAGE INTENTIONALLY LEFT BLANK

v
California Department of Transportation Mobility Performance Report 2011
CONTENTS
LIST OF TABLES ........................................................................................................... viii
LIST OF FIGURES ......................................................................................................... xiii
ACKNOWLEDGEMENTS ............................................................................................ xxii
EXECUTIVE SUMMARY ........................................................................................... xxiii
1. INTRODUCTION ...................................................................................................... 1
1.1. Background .................................................................................................. 1 1.2. Format of This Report ................................................................................. 2 1.3. Performance Measures in This Report ........................................................ 3
2. STATEWIDE FINDINGS .......................................................................................... 7
2.1. Travel Demand ............................................................................................ 8 2.2. Traffic Congestion ..................................................................................... 16 2.3. Cost of Congestion .................................................................................... 37 2.4. Lost Productivity ....................................................................................... 38 2.5. Detection Health and Data Quality ............................................................ 40
3. DISTRICT 3: SACRAMENTO AREA ................................................................... 43
3.1. Summary Analysis ..................................................................................... 43 3.2. Descriptive Statistics ................................................................................. 45 3.3. Travel Demand .......................................................................................... 48 3.4. Traffic Congestion ..................................................................................... 49 3.5. Detector Health and Data Quality .............................................................. 56 3.6. Congested Freeways and Top Bottleneck Locations ................................. 57
4. DISTRICT 4: SAN FRANCISCO BAY AREA ..................................................... 61
4.1. Summary Analysis ..................................................................................... 61 4.2. Descriptive Statistics ................................................................................. 63 4.3. Travel Demand .......................................................................................... 66 4.4. Traffic Congestion ..................................................................................... 67 4.5. Detector Health and Data Quality .............................................................. 75 4.6. Congested Freeways and Top Bottleneck Locations ................................. 76

vi
California Department of Transportation Mobility Performance Report 2011
5. DISTRICT 6: CENTRAL VALLEY ........................................................................81
5.1. Summary Analysis .....................................................................................81 5.2. Descriptive Statistics ..................................................................................82 5.3. Travel Demand...........................................................................................85 5.4. Traffic Congestion .....................................................................................86 5.5. Detector Health and Data Quality ..............................................................94 5.6. Congested Freeways and Top Bottleneck Locations .................................95
6. DISTRICT 7: LOS ANGELES AREA .....................................................97 6.1. Summary Analysis .....................................................................................97 6.2. Descriptive Statistics ..................................................................................99 6.3. Travel Demand.........................................................................................101 6.4. Traffic Congestion ...................................................................................102 6.5. Detector Health and Data Quality ............................................................110 6.6. Congested Freeways and Top Bottleneck Locations ...............................111
7. DISTRICT 8: INLAND EMPIRE ..........................................................117
7.1. Summary Analysis ...................................................................................117 7.2. Descriptive Statistics ................................................................................119 7.3. Travel Demand.........................................................................................121 7.4. Traffic Congestion ...................................................................................122 7.5. Detector Health and Data Quality ............................................................130 7.6. Congested Freeways and Top Bottleneck Locations ...............................131
8. DISTRICT 10: STOCKTON AREA ......................................................135
8.1. Summary Analysis ...................................................................................135 8.2. Descriptive Statistics ................................................................................137 8.3. Travel Demand.........................................................................................140 8.4. Traffic Congestion ...................................................................................141 8.5. Detector Health and Data Quality ............................................................148 8.6. Congested Freeways and Top Bottleneck Locations ...............................149
9. DISTRICT 11: SAN DIEGO AREA ......................................................153
9.1. Summary Analysis ...................................................................................153 9.2. Descriptive Statistics ................................................................................155 9.3. Travel Demand.........................................................................................157 9.4. Traffic Congestion ...................................................................................158 9.5. Detector Health and Data Quality ............................................................166 9.6. Congested Freeways and Top Bottleneck Locations ...............................167

vii
California Department of Transportation Mobility Performance Report 2011
10. DISTRICT 12: ORANGE COUNTY ..................................................... 171 10.1. Summary Analysis ................................................................................... 171 10.2. Descriptive Statistics ............................................................................... 173 10.3. Travel Demand ........................................................................................ 175 10.4. Traffic Congestion ................................................................................... 176 10.5. Detector Health and Data Quality ............................................................ 184 10.6. Congested Freeways and Top Bottleneck Locations ............................... 185
APPENDIX A. DATA TABLES ................................................................................. 189
APPENDIX B. METHODOLOGY ............................................................................. 209
APPENDIX C. GLOSSARY ....................................................................................... 213
APPENDIX D. STATEWIDE MAP OF CALTRANS DISTRICTS .......................... 217
APPENDIX E. DISTRICT CONTACTS .................................................................... 218

viii
California Department of Transportation Mobility Performance Report 2011
LIST OF TABLES
Table 2–1. Population Estimates, Statewide Total, Percent of Statewide Total, and Absolute and Percent Change, by Caltrans District, 2010–2011... ....9
Table 2–2. Employment, Statewide Total, Percent of Statewide Total, and Absolute and Percent Change, by Caltrans District, 2010–2011 ............11
Table 2–3. Vehicle Miles of Travel (VMT), Statewide Total on Monitored Freeways, Percent of Statewide Total on Monitored Freeways, and Absolute and Percent Change, by District, 2010–2011 ...................13
Table 2–4. Vehicle Hours of Delay (VHD) at 35 Miles per Hour (MPH), Statewide Total, Percent of Statewide Total, and Absolute and Percent Change, by District, 2010–2011 ................................................16
Table 2–5. Vehicle Hours of Delay (VHD) at 60 Miles per Hour (MPH), Statewide Total, Percent of Statewide Total, and Absolute and Percent Change, by District, 2010–2011 ................................................19
Table 2–6. Vehicle Hours of Delay (VHD) at 35 Miles per Hour (MPH), Statewide Non-Holiday Weekday Average, Percent of Statewide Average, and Absolute and Percent Change, by District, 2010–2011 ....23
Table 2–7. Vehicle Hours of Delay (VHD) at 60 Miles per Hour (MPH), Statewide Non-Holiday Weekday Average, Percent of Statewide Average, and Absolute and Percent Change, by District, 2010–2011 ....24
Table 2–8. Vehicle Hours of Delay (VHD) at 60 Miles per Hour (MPH), Statewide Daily Average, Percent of Total, and Absolute and Percent Change, by Day of Week, 2010–2011 .......................................26
Table 2–9(A). Vehicle Hours of Delay (VHD) at 35 Miles per Hour (MPH), Statewide Weekday Average, Percent of Total, And Absolute And Percent Change, by Hour Of Day, 2010–2011 .......................................28
Table 2–9(B). Vehicle Hours of Delay (VHD) at 35 Miles per Hour (MPH), Statewide Saturday Average, Percent of Total, and Absolute and Percent Change, by Hour of Day, 2010–2011 ........................................29
Table 2–9(C). Vehicle Hours of Delay (VHD) at 35 Miles per Hour (MPH), Statewide Sunday/Holiday Average, Percent of Total, and Absolute And Percent Change, By Hour of Day, 2010–2011 ...............................30

ix
California Department of Transportation Mobility Performance Report 2011
Table 2–10(A). Vehicle Hours of Delay (VHD) at 60 Miles per Hour (MPH), Statewide Weekday Average, Percent of Total, and Absolute and Percent Change, by Hour of Day, 2010–2011 ........................................ 31
Table 2–10(B). Vehicle Hours of Delay (VHD) at 60 Miles per Hour (MPH), Statewide Saturday Average, Percent Of Total, and Absolute and Percent Change, By Hour of Day, 2010–2011 ....................................... 32
Table 2–10(C). Vehicle Hours of Delay (VHD) at 60 Miles per Hour (MPH), Statewide Sunday/Holiday Average, Percent Of Total, and Absolute and Percent Change, By Hour of Day, 2010–2011 ................................ 33
Table 2–11. Statewide Costs of Congestion for Delay at 35 Miles per Hour (MPH) and Delay at 60 MPH, in Terms of Extra Cost of Fuel Burned, Cost in Lost Time, and Vehicle Emissions of Carbon Dioxide, by District, 2011.......................................................... 37
Table 2–12. Equivalent Lost Lane Miles (LLM) at 35 Miles per Hour (MPH), Statewide Non-Holiday Weekday Average, Percent of Non-Holiday Weekday Average, and Absolute and Percent Change, by Time Period, 2010–2011 ..................................................... 38
Table 2–13. Detector Health, Statewide Total, Percent of Statewide Total, And Absolute and Percent Change, 2010–2011 ............................................. 41
Table 3–1. District 3 Population Estimates and Absolute and Percent Change, 2010–2011 .............................................................................................. 45
Table 3–2. District 3 Employment, Unemployment, and Percent Change, by County, 2010–2011 ................................................................................ 46
Table 3–3. District 3 Top Congested Freeways, 2010–2011 .................................... 57
Table 3–4(A). District 3 Top Bottlenecks, AM Peak Period, 2011 ............................... 58
Table 3–4(B). District 3 Top Bottlenecks, PM Peak Period, 2011 ................................ 58
Table 4–1. District 4 Population Estimates and Absolute and Percent Change, 2010–2011 .............................................................................................. 63
Table 4–2. District 4 Employment, Unemployment, and Percent Change, by County, 2010–2011 ................................................................................ 65
Table 4–3. District 4 Top Congested Freeways, 2010–2011 .................................... 76
Table 4–4(A). District 4 Top Bottlenecks, AM Peak Period, 2011 ............................... 77
Table 4–4(B). District 4 Top Bottlenecks, PM Peak Period, 2011 ................................ 77
x
California Department of Transportation Mobility Performance Report 2011
Table 5–1. District 6 Population Estimates and Absolute and Percent Change, 2010–2011 ..............................................................................................82 Table 5–2. District 6 Employment, Unemployment, And Percent Change, by
County, 2010–2011 .................................................................................83
Table 5–3. District 6 Top Congested Freeways, 2010–2011 ....................................95
Table 6–1. District 7 Population Estimates and Absolute and Percent Change, 2010–2011 ..............................................................................................99 Table 6–2. District 7 Employment, Unemployment, and Percent Change, By
County, 2010–2011 ...............................................................................100
Table 6–3. District 7 Top Congested Freeways, 2010–2011 ..................................111
Table 6–4(A). District 7 Top Bottlenecks, AM Peak Period, 2011 .............................112
Table 6–4(B). District 7 Top Bottlenecks, PM Peak Period, 2011 ..............................112
Table 7–1. District 8 Population Estimates and Absolute and Percent Change, 2010–2011 ............................................................................................119 Table 7–2. District 8 Employment, Unemployment, and Percent Change, by
County, 2010–2011 ...............................................................................120
Table 7–3. District 8 Top Congested Freeways, 2010–2011 ..................................131
Table 7–4(A). District 8 Top Bottlenecks, AM Peak Period, 2011 .............................132
Table 7–4(B). District 8 Top Bottlenecks, PM Peak Period, 2011 ..............................132
Table 8–1. District 10 Population Estimates and Absolute and Percent Change, 2010–2011 ............................................................................................137

xi
California Department of Transportation Mobility Performance Report 2011
Table 8–2. District 10 Employment, Unemployment, and Percent Change, by County, 2010–2011 .............................................................................. 139
Table 8–3. District 10 Top Congested Freeways, 2010–2011 ................................ 149
Table 8–4 . District 10 Top Bottlenecks, AM Peak Period, 2011 ........................... 150
Table 9–1. District 11 Population Estimates and Absolute and Percent Change, 2010–2011 ............................................................................................ 155
Table 9–2. District 11 Employment, Unemployment, and Percent Change, by County, 2010–2011 .............................................................................. 156
Table 9–3. District 11 Top Congested Freeways, 2010–2011 ................................ 167
Table 9–4(A). District 11 Top Bottlenecks, AM Peak Period, 2011 ........................... 168
Table 9–4(B). District 11 Top Bottlenecks, PM Peak Period, 2011 ............................ 168
Table 10–1. District 12 Population Estimates and Absolute and Percent Change, 2010–2011 ............................................................................................ 173
Table 10–2. District 12 Employment, Unemployment, and Percent Change, by County, 2010–2011 .............................................................................. 174
Table 10–3. District 12 Top Congested Freeways, 2010–2011 ................................ 185
Table 10–4(A). District 12 Top Bottlenecks, AM Peak Period, 2011 ........................... 186
Table 10–4(B). District 12 Top Bottlenecks, PM Peak Period, 2011 ............................ 186
Table A–1. Vehicle Miles of Travel, Statewide Total, by District by Month, 2010–2011 ............................................................................................ 190
Table A–2. Historical Vehicle Hours of Delay (VHD) at 35 Miles per Hour (MPH), Statewide and District Totals, Percent of Statewide Total, by District, 2005–2011 .............................................. 191
Table A–3. Historical Vehicle Hours of Delay (VHD) at 60 Miles per Hour (MPH), Statewide and District Totals, Percent of Statewide Total, by District, 2005–2011 .............................................. 192
Table A–4. Vehicle Hours of Delay at 35 Miles per Hour, Statewide and District Totals, by District by Month, 2010–2011................................ 193
Table A–5. Vehicle Hours of Delay at 35 Miles Per Hour, Statewide and District Non-Holiday Weekday Averages, by District by Month, 2010–2011..194

xii
California Department of Transportation Mobility Performance Report 2011
Table A–6. Vehicle Hours of Delay at 60 Miles Per Hour, Statewide and District Totals, by District by Month, 2010–2011 .............................................195
Table A–7. Vehicle Hours of Delay at 60 Miles Per Hour, Statewide and District Non-Holiday Weekday Averages, by District by Month, 2010–2011 ............................................................................................196
Table A–8. Vehicle Hours of Delay At 60 Miles Per Hour, Statewide and District Averages, by District by Day of Week, 2010–2011 .............................197
Table A–9(A). Vehicle Hours of Delay at 35 Miles per Hour, Statewide and District Non-Holiday Weekday Averages, by District by Hour, 2010–2011 ............................................................................................198
Table A–9(B). Vehicle Hours of Delay at 35 Miles per Hour, Statewide and District Saturday Averages, by District by Hour, 2010–2011 ..............199
Table A–9(C). Vehicle Hours of Delay at 35 Miles per Hour, Statewide and District Sunday and Holiday Averages, by District by Hour, 2010–2011 ............................................................................................200
Table A–10(A). Vehicle Hours of Delay at 60 Miles per Hour, Statewide and District Non-Holiday Weekday Averages, by District by Hour, 2010–2011 ............................................................................................201
Table A–10(B). Vehicle Hours of Delay at 60 Miles per Hour, Statewide and District Saturday Averages, by District by Hour, 2010–2011 ..............202
Table A–10(C). Vehicle Hours of Delay at 60 Miles per Hour, Statewide and District Sunday and Holiday Averages, by District by Hour, 2010–2011 ............................................................................................203
Table A–11. Vehicle Hours of Delay (VHD) At 35 Miles Per Hour (MPH), Statewide And District Totals, Percent of District Totals, and Absolute and Percent Change, By District and County, 2010–2011 ...................204
Table A–12. Vehicle Hours of Delay (VHD) At 60 Miles Per Hour (MPH), Statewide And District Totals, Percent of District Totals, And Absolute and Percent Change, By District and County, 2010–2011 ...................205
Table A–13. Equivalent Lost Lane-Miles at 35 Miles Per Hour, Non-Holiday Weekday Average, By District By Time Period, 2010-2011 ...............206
Table A–14. Detector Health, By District by Quarter, 2010-2011 ............................207

xiii
California Department of Transportation Mobility Performance Report 2011
LIST OF FIGURES
Figure 2–1. State of California with Caltrans District Boundaries ....................... 7
Figure 2–2. California Population, by Caltrans District, 2010–2011 ................. 10
Figure 2–3. California Employment and Unemployment, by Caltrans District, 2010–2011 ....................................................................................... 12
Figure 2–4. Statewide Total Vehicle Miles of Travel on Monitored Freeways, by District, 2010–2011 .................................................................... 14
Figure 2–5. Statewide Total Vehicle Miles of Travel on Monitored Freeways, by Month, 2010–2011 ..................................................................... 15
Figure 2–6. Historical Statewide Total Vehicle Hours of Delay at 35 Miles per Hour, by Year, 2005–2011 .............................................................. 17
Figure 2–7. Historical Statewide Total Vehicle Hours of Delay at 35 Miles per Hour, by Year by District, 2005–2011 ............................................ 18
Figure 2–8. Historical Statewide Total Vehicle Hours of Delay at 60 Miles per Hour, by Year, 2005–2011 .............................................................. 20
Figure 2–9. Historical Statewide Total Vehicle Hours of Delay at 60 Miles per Hour, by Year by District, 2005–2011 ............................................ 21
Figure 2–10. Statewide Total Vehicle Hours of Delay at 35 Miles per Hour, by Month, 2010–2011 .......................................................................... 22
Figure 2–11. Statewide Total Vehicle Hours of Delay at 60 Miles per Hour, by Month, 2010–2011 .......................................................................... 22
Figure 2–12. Statewide Average Non-Holiday Weekday Vehicle Hours of Delay at 35 Miles per Hour, by Month, 2010–2011 .................................. 25
Figure 2–13. Statewide Average Non-Holiday Weekday Vehicle Hours of Delay at60 Miles per Hour, by Month, 2010–2011 ................................... 25
Figure 2–14. Statewide Average Vehicle Hours of Delay at 60 Miles per Hour, by Day of Week, 2010–2011 ............................................................ 27
Figure 2–15. Statewide Average Vehicle Hours of Delay at 35 Miles per Hour, by Hour of Day, 2010–2011 ............................................................. 34

xiv
California Department of Transportation Mobility Performance Report 2011
Figure 2–16. Statewide Average Vehicle Hours of Delay at 60 Miles per Hour, by Day of Week, 2010–2011 ............................................................35
Figure 2–17. Statewide Total Vehicle Hours of Delay at 35 Miles per Hour, by County, 2010–2011 ...........................................................................36
Figure 2–18. Statewide Equivalent Lost Lane Miles at 35 Miles per Hour, Non-Holiday Weekday Average, 2010–2011 ...................................39
Figure 2–19. Statewide Detector Health, by Month, 2010–2011.. .........................41
Figure 3–1. District 3 Population, by County, 2010–2011 ..................................46
Figure 3–2. District 3 Employment and Unemployment, by County, 2010–2011.........................................................................................47
Figure 3–3. District 3 Total Vehicle Miles of Travel,by Month, 2010–2011 ......48
Figure 3–4. District 3 Total Vehicle Miles of Travel, by County, 2010–2011 ....48
Figure 3–5. District 3 Total Vehicle Hours of Delay at 35 Miles Per Hour, by Month, 2010–2011 ............................................................................49
Figure 3–6. District 3 Average Non-Holiday Weekday Vehicle Hours of Delay at 35 Miles Per Hour, by Month, 2010–2011 ...................................50
Figure 3–7. District 3 Total Vehicle Hours of Delay at 60 Miles Per Hour, by Month, 2010–2011 ............................................................................50
Figure 3–8. District 3 Average Non-Holiday Weekday Vehicle Hours of Delay at 60 Miles Per Hour, by Month, 2010–2011 ...................................51
Figure 3–9. District 3 Average Vehicle Hours of Delay at 60 Miles Per Hour, by Day of Week, 2010–2011 .................................................................51
Figure 3–10. District 3 Average Vehicle Hours of Delay at 35 Miles Per Hour, by Hour of Day, 2010–2011 ..................................................................52
Figure 3–11. District 3 Average Vehicle Hours of Delay at 60 Miles Per Hour, by Hour of Day, 2010–2011 ..................................................................53
Figure 3–12. District 3 Total Annual Vehicle Hours of Delay at 60 Miles Per Hour, by County, 2010–2011............................................................54
Figure 3–13. District 3 Average Non-Holiday Weekday Equivalent Lost Lane Miles .................................................................................................55

xv
California Department of Transportation Mobility Performance Report 2011
Figure 3–14. District 3 Detector Health by Day, 2010–2011 ................................ 56
Figure 3–15 (A). District 3 Bottlenecks and Congested Segments, Am Peak Period, 2011 .................................................................................................. 59
Figure 3–15 (B). District 3 Bottlenecks and Congested Segments, Pm Peak Period, 2011 .................................................................................................. 60
Figure 4–1. District 4 Population, by County, 2010–2011 .................................. 64
Figure 4–2. District 4 Employment and Unemployment, by County, 2010–2011 ........................................................................................ 65
Figure 4–3. District 4 Total Vehicle Miles of Travel,by Month, 2010–2011 ...... 66
Figure 4–4. District 4 Total Vehicle Miles of Travel, by County, 2010–2011 .... 66
Figure 4–5. District 4 Total Vehicle Hours of Delay at 35 Miles Per Hour, by Month, 2010–2011 ............................................................................ 67
Figure 4–6. District 4 Average Non-Holiday Weekday Vehicle Hours of Delay at 35 Miles Per Hour, by Month, 2010–2011 ................................... 68
Figure 4–7. District 4 Total Vehicle Hours of Delay at 60 Miles Per Hour, by Month, 2010–2011 ............................................................................ 69
Figure 4–8. District 4 Average Non-Holiday Weekday Vehicle Hours of Delay at 60 Miles Per Hour, by Month, 2010–2011 ................................... 69
Figure 4–9. District 4 Average Vehicle Hours of Delay at 60 Miles Per Hour, by Day of Week, 2010–2011 ................................................................. 70
Figure 4–10. District 4 Average Vehicle Hours of Delay at 35 Miles Per Hour, by Hour of Day, 2010–2011 .................................................................. 71
Figure 4–11. District 4 Average Vehicle Hours of Delay at 60 Miles Per Hour, by Hour of Day, 2010–2011 .................................................................. 72
Figure 4–12. District 4 Total Annual Vehicle Hours of Delay at 60 Miles Per Hour, by County, 2010–2011 .......................................................... .73
Figure 4–13. District 4 Average Non-Holiday Weekday Equivalent Lost Lane Miles ................................................................................................. 74
Figure 4–14. District 4 Detector Health by Day, 2010–2011 ................................ 75

xvi
California Department of Transportation Mobility Performance Report 2011
Figure 4–15 (A). District 4 Bottlenecks and Congested Segments, AM Peak Period, 2011...................................................................................................78
Figure 4–15 (B). District 4 Bottlenecks and Congested Segments, PM Peak Period, 2011...................................................................................................79
Figure 5–1. District 6 Population, by County, 2010–2011 ..................................83
Figure 5–2. District 6 Employment and Unemployment, by County, 2010–2011.........................................................................................84
Figure 5–3. District 6 Total Vehicle Miles of Travel,by Month, 2010–2011 ......85
Figure 5–4. District 6 Total Vehicle Miles of Travel, by County, 2010–2011 ....85
Figure 5–5. District 6 Total Vehicle Hours of Delay at 35 Miles Per Hour, by Month, 2010–2011 ............................................................................86
Figure 5–6. District 6 Average Non-Holiday Weekday Vehicle Hours of Delay at 35 Miles Per Hour, by Month, 2010–2011 ...................................87
Figure 5–7. District 6 Total Vehicle Hours of Delay at 60 Miles Per Hour, by Month, 2010–2011 ............................................................................87
Figure 5–8. District 6 Average Non-Holiday Weekday Vehicle Hours of Delay at 60 Miles Per Hour, by Month, 2010–2011 ...................................88
Figure 5–9. District 6 Average Vehicle Hours of Delay at 60 Miles Per Hour, by Day of Week, 2010–2011 .................................................................89
Figure 5–10. District 6 Average Vehicle Hours of Delay at 35 Miles Per Hour, by Hour of Day, 2010–2011 ..................................................................90
Figure 5–11. District 6 Average Vehicle Hours of Delay at 60 Miles Per Hour, by Hour of Day, 2010–2011 ..................................................................91
Figure 5–12. District 6 Total Annual Vehicle Hours of Delay at 60 Miles Per Hour, by County, 2010–2011............................................................92
Figure 5–13. District 6 Average Non-Holiday Weekday Equivalent Lost Lane Miles .................................................................................................93
Figure 5–14. District 6 Detector Health by Day, 2010–2011 ................................94
Figure 6–1. District 7 Population, by County, 2010–2011 ..................................99
xvii
California Department of Transportation Mobility Performance Report 2011
Figure 6–2. District 7 Employment and Unemployment, by County, 2010–2011 ...................................................................................... 100
Figure 6–3. District 7 Total Vehicle Miles of Travel,by Month, 2010–2011 .... 101
Figure 6–4. District 7 Total Vehicle Miles of Travel, by County, 2010–2011 ...................................................................................... 101
Figure 6–5. District 7 Total Vehicle Hours of Delay at 35 Miles Per Hour, by Month, 2010–2011 .......................................................................... 102
Figure 6–6. District 7 Average Non-Holiday Weekday Vehicle Hours of Delay at 35 Miles Per Hour, by Month, 2010–2011 ................................. 103
Figure 6–7. District 7 Total Vehicle Hours of Delay at 60 Miles Per Hour, by Month, 2010–2011 .......................................................................... 103
Figure 6–8. District 7 Average Non-Holiday Weekday Vehicle Hours of Delay at 60 Miles Per Hour, by Month, 2010–2011 ................................. 104
Figure 6–9. District 7 Average Vehicle Hours of Delay at 60 Miles Per Hour, by Day of Week, 2010–2011 ............................................................... 105
Figure 6–10. District 7 Average Vehicle Hours of Delay at 35 Miles Per Hour, by Hour of Day, 2010–2011 ................................................................ 106
Figure 6–11. District 7 Average Vehicle Hours of Delay at 60 Miles Per Hour, by Hour of Day, 2010–2011 ................................................................ 107
Figure 6–12. District 7 Total Annual Vehicle Hours of Delay at 60 Miles Per Hour, by County, 2010–2011 ......................................................... 108
Figure 6–13. District 7 Average Non-Holiday Weekday Equivalent Lost Lane Miles ............................................................................................... 109
Figure 6–14. District 7 Detector Health by Day, 2010–2011 .............................. 110
Figure 6–15 (A)(1). District 7 Bottlenecks and Congested Segments, AM Peak Period, 2011 ................................................................................................ 113
Figure 6–15 (A)(2). District 7 Bottlenecks and Congested Segments, AM Peak Period, 2011 ................................................................................................ 114
Figure 6–15 (B)(1). District 7 Bottlenecks and Congested Segments, PM Peak Period, 2011 ................................................................................................ 115

xviii
California Department of Transportation Mobility Performance Report 2011
Figure 6–15 (B)(2). District 7 Bottlenecks and Congested Segments, PM Peak Period, 2011.................................................................................................116
Figure 7–1. District 8 Population, by County, 2010–2011 ................................119
Figure 7–2. District 8 Employment and Unemployment, by County, 2010–2011.......................................................................................120
Figure 7–3. District 8 Total Vehicle Miles of Travel,by Month, 2010–2011 ....121
Figure 7–4. District 8 Total Vehicle Miles of Travel, by County, 2010–2011.......................................................................................121
Figure 7–5. District 8 Total Vehicle Hours of Delay at 35 Miles Per Hour, by Month, 2010–2011 ..........................................................................122
Figure 7–6. District 8 Average Non-Holiday Weekday Vehicle Hours of Delay at 35 Miles Per Hour, by Month, 2010–2011 .................................123
Figure 7–7. District 8 Total Vehicle Hours of Delay at 60 Miles Per Hour, by Month, 2010–2011 ..........................................................................123
Figure 7–8. District 8 Average Non-Holiday Weekday Vehicle Hours of Delay at 60 Miles Per Hour, by Month, 2010–2011 .................................124
Figure 7–9. District 8 Average Vehicle Hours of Delay at 60 Miles Per Hour, by Day of Week, 2010–2011 ...............................................................125
Figure 7–10. District 8 Average Vehicle Hours of Delay at 35 Miles Per Hour, by Hour of Day, 2010–2011 ................................................................126
Figure 7–11. District 8 Average Vehicle Hours of Delay at 60 Miles Per Hour, by Hour of Day, 2010–2011 ................................................................127
Figure 7–12. District 8 Total Annual Vehicle Hours of Delay at 60 Miles Per Hour, by County, 2010–2011..........................................................128
Figure 7–13. District 8 Average Non-Holiday Weekday Equivalent Lost Lane Miles ...............................................................................................129
Figure 7–14. District 8 Detector Health by Day, 2010–2011 ..............................130
Figure 7–15 (A). District 8 Bottlenecks and Congested Segments, AM Peak Period, 2011.................................................................................................133
Figure 7–15 (B). District 8 Bottlenecks and Congested Segments, PM Peak Period, 2011.................................................................................................134

xix
California Department of Transportation Mobility Performance Report 2011
Figure 8–1. District 10 Population, by County, 2010–2011 .............................. 138
Figure 8–2. District 10 Employment and Unemployment, by County, 2010–2011 ...................................................................................... 139
Figure 8–3. District 10 Total Vehicle Miles of Travel,by Month, 2010–2011 ...................................................................................... 140
Figure 8–4. District 10 Total Vehicle Miles of Travel, by County, 2010–2011 ...................................................................................... 140
Figure 8–5. District 10 Total Vehicle Hours of Delay at 35 Miles Per Hour, by Month, 2010–2011 .......................................................................... 141
Figure 8–6. District 10 Average Non-Holiday Weekday Vehicle Hours of Delay at 35 Miles Per Hour, by Month, 2010–2011 ................................. 141
Figure 8–7. District 10 Total Vehicle Hours of Delay at 60 Miles Per Hour, by Month, 2010–2011 .......................................................................... 142
Figure 8–8. District 10 Average Non-Holiday Weekday Vehicle Hours of Delay at 60 Miles Per Hour, by Month, 2010–2011 ................................. 142
Figure 8–9. District 10 Average Vehicle Hours of Delay at 60 Miles Per Hour, by Day of Week, 2010–2011 .......................................................... 143
Figure 8–10. District 10 Average Vehicle Hours of Delay at 35 Miles Per Hour, by Hour of Day, 2010–2011 ........................................................... 144
Figure 8–11. District 10 Average Vehicle Hours of Delay at 60 Miles Per Hour, by Hour of Day, 2010–2011 ........................................................... 145
Figure 8–12. District 10 Total Annual Vehicle Hours of Delay at 60 Miles Per Hour, by County, 2010–2011 ......................................................... 146
Figure 8–13. District 10 Average Non-Holiday Weekday Equivalent Lost Lane Miles ............................................................................................... 147
Figure 8–14. District 10 Detector Health by Day, 2010–2011 ............................ 148
Figure 8–15 (A). District 10 Bottlenecks and Congested Segments, AM Peak Period, 2011 ................................................................................................ 151
Figure 9–1. District 11 Population, by County, 2010–2011 .............................. 155
Figure 9–2. District 11 Employment and Unemployment, by County, 2010–2011 ...................................................................................... 156

xx
California Department of Transportation Mobility Performance Report 2011
Figure 9–3. District 11 Total Vehicle Miles of Travel,by Month, 2010–2011.......................................................................................157
Figure 9–4. District 11 Total Vehicle Miles of Travel, by County, 2010–2011.......................................................................................157
Figure 9–5. District 11 Total Vehicle Hours of Delay at 35 Miles Per Hour, by Month, 2010–2011 ..........................................................................158
Figure 9–6. District 11 Average Non-Holiday Weekday Vehicle Hours of Delay at 35 Miles Per Hour, by Month, 2010–2011 .................................159
Figure 9–7. District 11 Total Vehicle Hours of Delay at 60 Miles Per Hour, by Month, 2010–2011 ..........................................................................160
Figure 9–8. District 11 Average Non-Holiday Weekday Vehicle Hours of Delay at 60 Miles Per Hour, by Month, 2010–2011 .................................160
Figure 9–9. District 11 Average Vehicle Hours of Delay at 60 Miles Per Hour, by Day of Week, 2010–2011 ..........................................................161
Figure 9–10. District 11 Average Vehicle Hours of Delay at 35 Miles Per Hour, by Hour of Day, 2010–2011 ...........................................................162
Figure 9–11. District 11 Average Vehicle Hours of Delay at 60 Miles Per Hour, by Hour of Day, 2010–2011 ...........................................................163
Figure 9–12. District 11 Total Annual Vehicle Hours of Delay at 60 Miles Per Hour, by County, 2010–2011..........................................................164
Figure 9–13. District 11 Average Non-Holiday Weekday Equivalent Lost Lane Miles ...............................................................................................165
Figure 9–14. District 11 Detector Health by Day, 2010–2011 ............................166
Figure 9–15 (A). District 11 Bottlenecks and Congested Segments, AM Peak Period, 2011.............................................................................................…169
Figure 9–15 (B). District 11 Bottlenecks and Congested Segments, PM Peak Period, 2011.................................................................................................170
Figure 10–1. District 12 Population, by County, 2010–2011 ..............................173
Figure 10–2. District 12 Employment and Unemployment, by County, 2010–2011.......................................................................................174

xxi
California Department of Transportation Mobility Performance Report 2011
Figure 10–3. District 12 Total Vehicle Miles of Travel,by Month, 2010–2011 ...................................................................................... 175
Figure 10–4. District 12 Total Vehicle Miles of Travel, by County, 2010–2011 ...................................................................................... 175
Figure 10–5. District 12 Total Vehicle Hours of Delay at 35 Miles Per Hour, by Month, 2010–2011 .......................................................................... 176
Figure 10–6. District 12 Average Non-Holiday Weekday Vehicle Hours of Delay at 35 Miles Per Hour, by Month, 2010–2011 ................................. 177
Figure 10–7. District 12 Total Vehicle Hours of Delay at 60 Miles Per Hour, by Month, 2010–2011 .......................................................................... 178
Figure 10–8. District 12 Average Non-Holiday Weekday Vehicle Hours of Delay at 60 Miles Per Hour, by Month, 2010–2011 ................................. 178
Figure 10–9. District 12 Average Vehicle Hours of Delay at 60 Miles Per Hour, by Day of Week, 2010–2011 .......................................................... 179
Figure 10–10. District 12 Average Vehicle Hours of Delay at 35 Miles Per Hour, by Hour of Day, 2010–2011 ........................................................... 180
Figure 10–11. District 12 Average Vehicle Hours of Delay at 60 Miles Per Hour, by Hour of Day, 2010–2011 ........................................................... 181
Figure 10–12. District 12 Total Annual Vehicle Hours of Delay at 60 Miles Per Hour, by County, 2010–2011 ......................................................... 182
Figure 10–13. District 12 Average Non-Holiday Weekday Equivalent Lost Lane Miles ............................................................................................... 183
Figure 10–14. District 12 Detector Health by Day, 2010–2011 ............................ 184
Figure 10–15 (A). District 12 Bottleneck and Congested Segments, AM Peak Period, 2011 ................................................................................................ 187
Figure 10–15(B). District 12 Bottlenecks and Congested Segments, PM Peak Period, 2011 ................................................................................................ 188

xxii
California Department of Transportation Mobility Performance Report 2011
EXECUTIVE SUMMARY
The Mobility Performance Report (MPR) is the annual traffic congestion report prepared by the California Department of Transportation (Caltrans). The MPR provides system performance information that is useful to Caltrans and other transportation agencies in terms of setting priorities and directing resources to improve mobility in the State’s urban areas. It also satisfies Caltrans’ statutory obligation to report congestion data per Government Code section 14032.6: “The department shall… collect, analyze, and summarize highway congestion data and make it available upon request.”
The MPR 2011 compares information for calendar years 2010 and 2011 in the following system performance areas:
• Travel demand (population, employment, vehicle miles of travel).
• Traffic congestion (vehicle hours of delay, bottleneck locations).
• Lost productivity (equivalent lost lane miles).
This report’s traffic congestion information is based on data collected every day of the year, twenty–four hours a day, by automated vehicle detector stations deployed on urban-area freeways where congestion is regularly experienced. The complete set of data that was analyzed for this report is presented in Appendix A. The methodology for collecting data and calculating performance measures is explained in Appendix B.
The MPR presents congestion information at two speed thresholds: delay from vehicles traveling below 35 miles per hour (mph), and delay from vehicles traveling below 60 mph. The delay at the 35 mph threshold represents severe congestion while delay at 60 mph represents all congestion, both light and heavy. These thresholds are set by Caltrans and are based upon engineering experience and District input.
The MPR methodology found that, in 2011, total statewide delay equaled 86.5 million vehicle hours of delay (VHD) at the 35 mph speed threshold, and 204 million VHD at the 60 mph threshold. The statewide average weekday delay experienced in 2011 was 303,000 VHD at 35 mph, and 711,000 VHD at 60 mph. The total annual statewide delay at 35 mph equates to an opportunity cost (or the cost of lost time in terms of salaries and wages) of $1.5 billion, or $4.1 million a day. The total annual statewide delay at 60 mph equates to an opportunity cost of $3.5 billion, or $9.7 million a day.
Approximately 45 percent of the State’s delay is experienced in Los Angeles County (in Caltrans District 7) and another 27 percent is from the San Francisco Bay Area (District 4). Most urban areas in the State saw a decrease in delay from 2010 to 2011, a reverse in trend from 2010.

xxiii
California Department of Transportation Mobility Performance Report 2011
PAGE INTENTIONALLY LEFT BLANK


1
California Department of Transportation Mobility Performance Report 2011
Chapter 1
Introduction
SECTION 1.1. BACKGROUND
The Mobility Performance Report (MPR) 2011 is a report prepared by the California Department of Transportation (Caltrans) that provides transportation system performance information at a statewide level and by Caltrans district. Each participating district researched, analyzed, and prepared mobility performance data for calendar years 2010 and 2011 as part of this statewide reporting effort. Calendar year 2010 is included because it is most consistent with the 2011 format and data and provides a convenient frame of reference.
The MPR 2011 provides information useful to transportation system managers in setting priorities, determining effective strategies, and directing resources to improve mobility where it is needed most. MPR 2011 also satisfies Caltrans’ statutory obligation to report congestion data, as described in Government Code Section 14032.6:
The department shall, within existing resources, collect, analyze, and summarize highway congestion data and make it available upon request to California regional transportation planning agencies, congestion management agencies, and transit agencies.
The MPR 2011 reports congestion information based on traffic volume and occupancy data collected 24 hours a day, 365 days a year, by automated vehicle detector stations (VDS). These VDS cover the State’s urban-area freeways and other areas where congestion is regularly experienced. Certainly, traffic congestion is experienced in places on the State Highway System where these VDS are not present: in rural areas, on conventional highways, or in urban areas where there is a gap in coverage. However, these VDS are widely deployed, covering over 90 percent of freeways where recurrent congestion occurs. With confidence that these VDS are capturing the vast majority of both recurrent and non-recurrent delay experienced on the State Highway System, the MPR reports delay as the “total” or “average” experienced by freeway, district, and statewide. Please note that the delay reported in the MPR 2011 does not include delay experienced on local roads.
The traffic data collected by VDS is sent every 30 seconds, in real-time, from the field to a centralized database called the Caltrans Performance Measurement System (PeMS). The methodology used for collecting this data and calculating performance measures is explained in Appendix B.
The MPR 2011 builds on the MPR 2010, which was the second edition of the MPR. A number of improvements have been made to the 2011 report that were not in the original MPR 2009 report. For example, the MPR 2011 includes analysis of

2
California Department of Transportation Mobility Performance Report 2011
mobility trends and significant changes over the previous year in the district chapters. The MPR 2011 also presents district data in a more streamlined, clear way and improves the process of mapping bottlenecks by fine-tuning the data and making major and minor improvements in the appearance of the maps.
The MPR is expected to continue to evolve over time as Caltrans’ congestion reporting capabilities expand and as reader feedback suggests new ideas for improvement. The report’s geographical coverage will also grow over time. For example, beginning in 2013, District 5 (including San Luis Obispo, Santa Barbara, Santa Cruz, and the Monterey Bay Area) will have a full year of data from newly installed detectors. In addition, opportunities for integrating the MPR with other system performance reporting processes are being explored. A long-term goal is to integrate reporting on Managed Lanes (including High Occupancy Vehicle Lanes and Express Lanes) into the MPR. Furthermore, the federal transportation authorization legislation, Moving Ahead for Progress in the 21st Century (MAP–21), was signed into law on July 6, 2012 and established national performance goals including congestion reduction and system reliability. This report's performance measurement strategies may influence and be influenced by future MAP–21 rulemaking on performance measurement.
Prior to 2009, Caltrans prepared a congestion report called the State Highway Congestion Monitoring Program (HICOMP) Annual Data Compilation that used a different methodology that included manual data collection. Due to the substantial methodological changes between the HICOMP Annual Data Compilation and the MPR, comparing the data in the two reports is not recommended as findings may be misleading.
SECTION 1.2. FORMAT OF THIS REPORT
Each chapter in the MPR 2011 presents transportation system performance information at a different geographical level for calendar year 2011. In most cases, the 2011 data is compared to the 2010 data.
Chapter 2 presents data at the statewide level, compiling data from all of the Caltrans districts that are included in this report. This chapter presents the following statewide information:
• Travel demand (population, employment, vehicle miles of travel).
• Traffic congestion (delay trend from 2005–2011; total statewide delay; average weekday delay; and average delay by day of week, by hour of day, and by county).
• Cost of congestion (costs in terms of lost time, gasoline, and emissions).
• Lost productivity (equivalent lost lane miles).
• Detector health.

3
California Department of Transportation Mobility Performance Report 2011
Chapters 3 through 10 present transportation system information by Caltrans district for the districts included in this report. The following district-wide information is presented:
• Summary analysis.
• Descriptive statistics (population, and employment).
• Travel demand (vehicle miles of travel).
• Traffic congestion (total district delay; average weekday delay; and average delay by day of week, by hour of day, and by county).
• Detector health.
• Most congested freeways and top bottleneck locations.
Appendix A contains data tables corresponding to the information and figures presented in this report. Appendix B describes the methodology used in this report.
SECTION 1.3. PERFORMANCE MEASURES IN THIS REPORT
The automated VDS deployed around the State send data every 30 seconds to the Performance Measurement System (PeMS). Most types of VDS collect traffic volume (also called flow) and occupancy data. Volume or flow refers to the number of vehicles passing over each detector in each lane. Occupancy refers to how long the vehicles are over each detector. The volume and occupancy data are used to calculate speed. In a few places, VDS report speed directly. PeMS calculates and reports several performance measures from this raw data.
1.3.1. Vehicle Hours of Delay
The main measure of congestion is vehicle hours of delay (VHD), or the extra time spent in traffic beyond what people would experience if they were traveling at a given benchmark speed. In this report, delay is determined by calculating the difference between the observed travel time on the segment (as calculated from speed) and the travel time at two benchmark speeds: 35 mph and 60 mph. The hours of delay are then multiplied by the vehicle flow on the facility to produce VHD, per the following formula:
VHD = actual volume × (Travel Time at actual speed − Travel Time at threshold speed)
The threshold speeds of 35 mph and 60 mph were chosen as benchmarks because they distinguish heavy congestion from light congestion. Delay at 35 mph is a subset of the delay at 60 mph. Delay at 35 mph represents the delay experienced by vehicles

4
California Department of Transportation Mobility Performance Report 2011
traveling between zero and 35 mph. Delay at 60 mph represents the delay experienced by vehicles traveling between zero and 60 mph.
The MPR presents delay information in a number of ways. It presents the total VHD experienced in the year, which is a summation of the VHD recorded on each day of the year. It also presents the average weekday VHD experienced during the year, which is a daily value calculated by taking the average of the VHD recorded on each non-holiday weekday of the year. Average VHD is also calculated for each day of week and hour of day. In many of the figures in this report, delay trends are shown by month, so that seasonal differences can be analyzed.
1.3.2. Vehicle Miles of Travel
The MPR 2011 presents vehicle miles of travel (VMT). It should be noted that the VMT numbers presented in this report are not true district-wide or statewide numbers, in that they only reflect travel being done on the segments of freeway with automated VDS. The flow recorded at each VDS is multiplied by the length of freeway assigned to that respective VDS to determine the distance, expressed in miles that vehicles are traveling. VMT was added to the report this year in order to provide context for the congestion analysis. VMT provides a measure of the amount of vehicle travel. If the amount of travel increases, the probability of travel demand exceeding freeway capacity increases, and the likelihood of delay is greater.
1.3.3. Lost Productivity
The MPR also presents information about lost productivity. Lost productivity is the cumulative difference between the maximum traffic capacity at a location and the observed flow during congestion. When the average speed drops below the speed threshold of 35 mph, fewer vehicles pass by any fixed point on the freeway than would under free-flow conditions, per unit of time. The reduced flow on the facility is then divided by the capacity (the highest sustainable hourly flow as calculated by PeMS) to achieve lost-lane-mile hours. The MPR 2011 presents lost productivity in terms of lost lane miles (LLM). LLM is calculated by dividing the lost-lane-mile hours by the number of hours in the given time period (e.g., AM Peak) to determine the average LLM per hour.
1.3.4. Detector Health
More detailed detector health information is presented in MPR 2011 than was shown in the MPR 2010. PeMS runs diagnostics on each detector’s data to determine if the data is “good” or “bad.” Ranges of data values are established for each detector, and if the data falls outside those ranges, PeMS identifies the detector as bad. Maintaining good detector health is of key importance to Caltrans’ congestion monitoring and reporting activities. The information presented in the MPR is not based on observed data from bad detectors, but it does include information based on imputed data for these detectors (estimated volume and occupancy data based on historical values and neighboring good detectors).

5
California Department of Transportation Mobility Performance Report 2011
The detector health sections of this report also provide information about the change in the overall number of detectors from year to year. The deployment of new detectors has slowed in recent years as many districts have reached the point at which their urban freeway systems are fully covered by detectors. However, there are still new detectors being installed and activated in locations where there are gaps in coverage, in new lanes if facilities are widened, in areas near the edges where congestion begins and ends, and in smaller urban areas where congestion is not as severe but monitoring is desired. Failed detectors are also replaced as necessary. Changes in the detection system create a challenge for analyzing trends over time. In general, with the number of detectors still growing by a small factor, there is a slight upward pressure on many performance measures, particularly VMT. Therefore, it should be noted that a small percentage of growth in performance measures is likely attributable to the growth in the number of detectors reporting data.
1.3.5. Bottleneck Locations
The MPR provides lists of the top bottlenecks identified in each district during the AM Peak and PM Peak periods for the year. A bottleneck is defined as a persistent and significant drop in speed between two locations on a freeway. Bottlenecks are determined by the Bottleneck Identification Algorithm in PeMS. This algorithm looks at speeds along a facility and declares a bottleneck at a location where there has been a drop in speed of at least 20 mph between the current detector and the detector immediately downstream. This speed drop must persist for at least five out of any seven contiguous five-minute data points, and the speed at the detector in question must be below 40 mph. While PeMS identifies the detector locations where these conditions are met, these bottleneck locations are only approximate (based on the locations where detectors are present). District staff compiling this report use their engineering judgment and local knowledge to adjust the locations, as necessary.
The bottlenecks identified through the PeMS Bottleneck Identification Algorithm are filtered by a number of factors; collectively called ‘bottleneck criteria.’ This filtering creates a consistent bottleneck analysis process for all districts, and reports only bottlenecks that are recurrent and causing large amounts of delay. The bottleneck lists in the MPR 2011 include bottleneck locations that were active on at least 20 percent of all weekdays during the year, persisted for at least 15 minutes on average, and caused more than 100 VHD per weekday. This filtering means that some rural districts had less than 10 bottlenecks to report in the AM Peak and PM Peak periods. In the MPR 2011, these top bottleneck locations are shown on district maps, along with lines depicting the congestion queue length resulting from these bottlenecks. If a district had more than 10 bottlenecks that met the criteria described above, those additional bottlenecks and their congestion queues are shown on the district’s map.
1.3.6. Cost of Congestion
The MPR 2011 discusses the cost of congestion in Chapter 2. These costs are presented in three categories: (1) extra fuel burned, (2) the cost of lost time (opportunity cost in terms of wages and salaries), and (3) extra vehicle emissions of carbon dioxide

6
California Department of Transportation Mobility Performance Report 2011
(CO2). These calculations assume an average gasoline price of $3.71 a gallon during 2011 based on figures from Caltrans’ Division of Transportation Planning’s Economic Analysis Branch. The opportunity cost is priced at $17.35 for each vehicle hour of delay, which assumes an average vehicle occupancy of 1.30 and a 0.9 percent truck volume. The amount of extra fuel burned is assumed as 1.719 gallons of fuel for each vehicle hour of delay. The amount of extra vehicle emissions of CO2 is derived from the figure of 8,887 grams of CO2 produced for each gallon of gasoline burned. Note that the metric ton is the unit of measure for CO2 emissions used in this report, a change from the U.S. (short) ton in the MPR 2010. This change is consistent with the California Air Resources Board and other agencies that commonly report emissions in terms of metric tons. See Appendix B for more details regarding these calculations, including source information.

7
California Department of Transportation Mobility Performance Report 2011
Chapter 2
STATEWIDE FINDINGS
This chapter reports statewide system performance information. Caltrans maintains and operates the State Highway System that is comprised of approximately 30,600 directional miles of roadway. Caltrans divides the State into 12 districts, and eight of those districts provide data for this report via automated detectors. Districts 1 and 2 in the largely rural northern part of the State and District 9 on the eastern side of the Sierra Nevada mountain range do not collect traffic data from automated VDS. District 5 along the central coast has just begun collecting data from VDS and will have a full year of data in 2013 to include in the MPR. The districts that contribute to this report are District 3 (Sacramento Area), District 4 (San Francisco Bay Area), District 6 (Central Valley), District 7 (Los Angeles Area), District 8 (Inland Empire), District 10 (Stockton Area), District 11 (San Diego Area), and District 12 (Orange County). Figure 2–1 is a California map with the Caltrans district boundaries.
Figure 2–1
STATE OF CALIFORNIA WITH CALTRANS DISTRICT BOUNDARIES

8
California Department of Transportation Mobility Performance Report 2011
This chapter presents the following information:
• Section 2.1 presents travel demand data by district, including population and employment statistics and vehicle miles of travel (VMT).
• Section 2.2 presents statewide traffic congestion trends in terms of vehicle hours of delay (VHD) at the benchmark speeds of 35 mph and 60 mph, respectively. The tables and figures in this section illustrate delay in several ways: statewide total VHD by district and county, statewide average weekday VHD, and statewide average VHD by day of the week and by hour of day. Delay is compared between the 2010 and 2011 calendar years in most cases, but longer-term trends dating back to 2005 are also presented.
• Section 2.3 identifies the costs associated with congestion statewide and by district.
• Section 2.4 reports statewide information on lost freeway productivity in equivalent lost lane miles (LLM) by period of day.
• Section 2.5 reports detection health and data quality of all the detectors in the State.
SECTION 2.1. TRAVEL DEMAND
The eight Caltrans districts that contribute to this report have automated detectors reporting data across approximately 19,000 lane miles of freeway. This section discusses the travel demand on these roads, as well as two factors that influence demand: population and employment.
In 2011, California’s population reached 37.7 million residents, as summarized in Table 2–1. This represents an increase of 241,000 residents (or 0.6%) from 2010. Removing the districts that do not participate in this report, the population of the remaining districts was just over 35 million residents in 2011, 94% of the statewide total. District 7 (Los Angeles Area) was the most populous district with over 10.7 million residents, followed by District 4 in the San Francisco Bay Area (7.2 million), and District 8 in the Inland Empire (4.3 million). Combined, these three districts housed almost 60% of the State’s total population.

9
California Department of Transportation Mobility Performance Report 2011
As shown in Table 2–1, most districts experienced a small increase in population from 2010 to 2011.
Table 2–1
POPULATION ESTIMATES, STATEWIDE TOTAL, PERCENT OF STATEWIDE TOTAL, ABSOLUTE, AND PERCENT CHANGE, BY CALTRANS DISTRICT, 2010–2011
District
2010 Revised † 2011 ‡ Change 2011 - 2010 Revised
Population % of Total Population % of
Total Absolute %
1 315,227 0.8 315,632 0.8 405 0.1 2 363,473 1.0 363,104 1.0 -369 -0.1 3 2,699,162 7.2 2,713,432 7.2 14,270 0.5 4 7,188,284 19.2 7,249,144 19.2 60,860 0.8 5 1,431,433 3.8 1,438,926 3.8 7,493 0.5 6 2,529,943 6.7 2,549,109 6.8 19,166 0.8 7 10,675,586 28.7 10,718,585 28.6 42,999 0.4 8 4,252,350 11.3 4,293,892 11.3 41,542 1.0 9 32,837 0.1 32,961 0.1 124 0.4
10 1,619,283 4.3 1,628,268 4.3 8,985 0.6 11 3,291,522 8.8 3,307,872 8.8 16,350 0.5 12 3,028,846 8.1 3,057,879 8.1 29,033 1.0
Total 37,427,946 100 37,668,804 100 240,858 0.6 Districts 1, 2, 5, and 9 do not participate in mobility performance reporting. Sources: †: State of California, Department of Finance, E-1 Population Estimates for Cities, Counties, and the State with Annual Percent Change — January 1, 2011 and 2012. Sacramento, California, May 2012. ‡: State of California, Department of Finance, E-1 Population Estimates for Cities, Counties, and the State with Annual Percent Change — January 1, 2012 and 2013. Sacramento, California, May 2013.

10
California Department of Transportation Mobility Performance Report 2011
Figure 2–2 displays the population by each Caltrans district. This figure shows District 7 as the most populated district.
Figure 2–2
CALIFORNIA POPULATION, BY CALTRANS DISTRICT, 2010–2011
0
1
2
3
4
5
6
7
8
9
10
11
12
1 2 3 4 5 6 7 8 9 10 11 12
Population (Millions)
District
2010 Revised 2011

11
California Department of Transportation Mobility Performance Report 2011
Table 2–2 EMPLOYMENT, STATEWIDE TOTAL, PERCENT OF STATEWIDE TOTAL, ABSOLUTE, AND
PERCENT CHANGE, BY CALTRANS DISTRICT, 2010–2011
District
2010 Revised 2011 Change 2011 - 2010
Employment % of Total
Unemploy-ment Rate
Employment % of Total
Unemploy-ment Rate
Absolute %
1
124,165 0.8% 12.7% 123,110 0.8% 12.4% -1,055 -0.8%
2
137,457 0.9% 15.8% 135,758 0.8% 15.2% -1,699 -1.2%
3
1,132,198 7.0% 13.0% 1,133,106 7.0% 12.5% 908 0.1%
4
3,291,325 20.5% 10.6% 3,362,567 20.7% 9.6% 71,242 2.2%
5
672,175 4.2% 11.3% 679,208 4.2% 11.0% 7,033 1.0%
6
962,208 6.0% 16.5% 980,283 6.0% 15.9% 18,075 1.9%
7
4,682,317 29.1% 12.4% 4,715,267 29.0% 12.1% 32,950 0.7%
8
1,541,675 9.6% 14.3% 1,551,500 9.6% 13.6% 9,825 0.6%
9
16,572 0.1% 10.2% 16,425 0.1% 10.0% -147 -0.9%
10
599,587 3.7% 17.2% 601,624 3.7% 16.7% 2,038 0.3%
11
1,462,350 9.1% 11.4% 1,478,392 9.1% 11.0% 16,042 1.1%
12
1,441,500 9.0% 9.5% 1,460,042 9.0% 8.8% 18,542 1.3%
Total 16,063,528 100% 12.4% 16,237,281 100% 11.8% 173,753 1.1%
Districts 1, 2, 5, and 9 do not participate in mobility performance reporting. Data not seasonally adjusted. Data revised by source. Source: State of California, Employment Development Department (EDD), Labor Market Information Division, downloaded Sept. 9, 2013.
Numbers may not sum to total due to rounding

12
California Department of Transportation Mobility Performance Report 2011
0
1
2
3
4
5
6
1 2 3 4 5 6 7 8 9 10 11 12
Labor Force (Millions)
Year and District
UnemploymentEmployment
The State provided over 16.2 million civilian jobs on average during 2011, compared to approximately 16.1 million in 2010 – an increase of 1.1%. Table 2–3 shows employment figures by Caltrans district. Approximately 900,000 of these jobs were located in the Caltrans districts excluded from this report. The average unemployment rate in the State was 11.8% in 2011, down from 12.4% in 2010. Comparing the State’s population and employment data, it is evident that job growth kept up with population growth in 2011.
Figure 2–3
CALIFORNIA EMPLOYMENT AND UNEMPLOYMENT, BY CALTRANS DISTRICT, 2010–2011

13
California Department of Transportation Mobility Performance Report 2011
In 2011, PeMS reported just under 112 billion total annual vehicle miles of travel (VMT) on monitored freeways throughout the State1 as shown in Table 2–3. This was an increase of approximately 434 million VMT, or 0.4%, from the previous year. Percent growth in VMT was largest in District 10 (Stockton Area) and District 4 (San Francisco Bay Area).
Table 2–3 VEHICLE MILES OF TRAVEL (VMT), STATEWIDE TOTAL ON MONITORED FREEWAYS, PERCENT OF STATEWIDE TOTAL ON MONITORED FREEWAYS, AND ABSOLUTE AND
PERCENT CHANGE, BY DISTRICT, 2010–2011
2010 Revised 2011 Change 2011 - 2010
District VMT Percent of Total VMT Percent
of Total Absolute Percent
3 8,053,497,650 7.2% 8,061,663,080 7.2% 8,165,429 0.1% 4 25,981,125,565 23.3% 26,189,275,110 23.4% 208,149,545 0.8% 6 2,263,533,910 2.0% 2,275,517,750 2.0% 11,983,840 0.5% 7 34,910,360,928 31.3% 34,781,845,328 31.1% -128,515,601 -0.4% 8 12,594,201,000 11.3% 12,664,247,922 11.3% 70,046,922 0.6%
10 4,296,130,822 3.9% 4,739,692,447 4.2% 443,561,625 10.3% 11 11,661,246,825 10.5% 11,479,665,596 10.3% -181,581,230 -1.6% 12 11,719,848,048 10.5% 11,722,366,394 10.5% 2,518,345 0.0%
Total 111,479,944,750 100% 111,914,273,625 100% 434,328,876 0.4% Note: District 10’s data have been reduced by approximately 60 million VMT from what was published in the 2010 MPR to correct for a data processing inconsistency in PeMS. Additional, though slight, adjustments have been made to other districts' data because PeMS now reports VMT data to the nearest integer. Numbers may not sum to total due to rounding.
1 Note that the VMT values presented in the MPR are not representative of total district or statewide VMT. These values represent only the VMT recorded by automated vehicle detectors deployed on urban freeways. This distinction is made because, while the vast majority of delay occurs on the freeways that are monitored by detectors, travel is done throughout the State, and detectors do not record all of it.

14
California Department of Transportation Mobility Performance Report 2011
Figure 2–4 displays the values presented in Table 2–3 in graphic form. On the State’s monitored freeways, District 7 (Los Angeles Area) represents over 31 percent of total VMT, with District 4 (San Francisco Bay Area) representing over 23 percent.
Figure 2–4
STATEWIDE TOTAL VEHICLE MILES OF TRAVEL ON MONITORED FREEWAYS, BY DISTRICT, 2010–2011
0
5
10
15
20
25
30
35
40
3 4 6 7 8 10 11 12
Miles (Billions)
District
2010 2011

15
California Department of Transportation Mobility Performance Report 2011
Figure 2–5 displays monthly VMT values for monitored freeways in 2010 and 2011. The annual pattern is remarkably similar between the two years, with almost identical figures for VMT in each month.
FIGURE 2–5
Statewide Total Vehicle Miles of Travel on Monitored Freeways, by Month, 2010–2011
0
2
4
6
8
10
12
Jan Feb Mar Apr May Jun Jul Aug Sep Oct Nov Dec
Miles (Billions)
2010 2011
16
California Department of Transportation Mobility Performance Report 2011
SECTION 2.2. TRAFFIC CONGESTION
This section of the MPR 2011 reports traffic congestion in terms of vehicle hours of delay (VHD), or the extra time spent in traffic beyond what people would experience if they were traveling at a given benchmark speed. In this report, delay is determined by calculating the difference between the observed travel time on the segment (as calculated from speed) and the travel time at two benchmark speeds: 35 mph and 60 mph. These speeds are benchmarks because they separate heavy congestion (delay at 35 mph) from all congestion below free-flow speed (delay at 60 mph). The delay measured by vehicle detectors is then multiplied by vehicle flow on the facility to produce VHD.
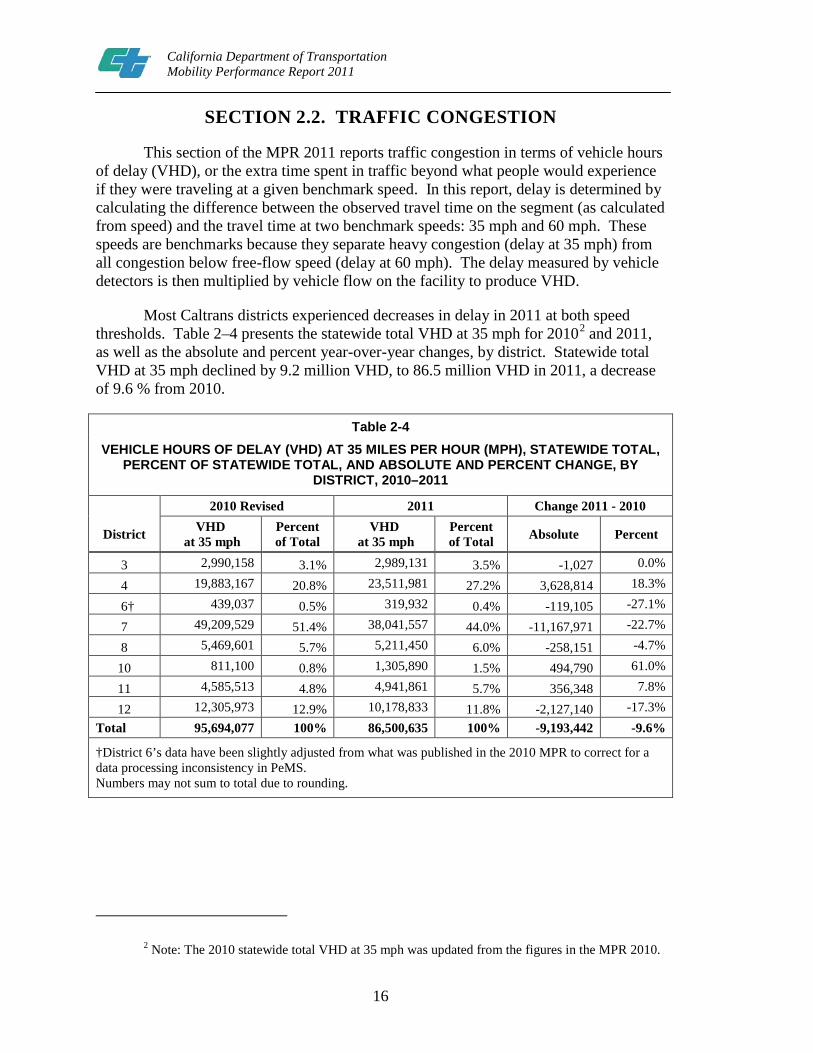
Most Caltrans districts experienced decreases in delay in 2011 at both speed thresholds. Table 2–4 presents the statewide total VHD at 35 mph for 20102 and 2011, as well as the absolute and percent year-over-year changes, by district. Statewide total VHD at 35 mph declined by 9.2 million VHD, to 86.5 million VHD in 2011, a decrease of 9.6 % from 2010.
Table 2-4 VEHICLE HOURS OF DELAY (VHD) AT 35 MILES PER HOUR (MPH), STATEWIDE TOTAL,
PERCENT OF STATEWIDE TOTAL, AND ABSOLUTE AND PERCENT CHANGE, BY DISTRICT, 2010–2011
2010 Revised 2011 Change 2011 - 2010
District VHD at 35 mph
Percent of Total
VHD at 35 mph
Percent of Total Absolute Percent
3 2,990,158 3.1% 2,989,131 3.5% -1,027 0.0%
4 19,883,167 20.8% 23,511,981 27.2% 3,628,814 18.3%
6† 439,037 0.5% 319,932 0.4% -119,105 -27.1%
7 49,209,529 51.4% 38,041,557 44.0% -11,167,971 -22.7%
8 5,469,601 5.7% 5,211,450 6.0% -258,151 -4.7%
10 811,100 0.8% 1,305,890 1.5% 494,790 61.0%
11 4,585,513 4.8% 4,941,861 5.7% 356,348 7.8%
12 12,305,973 12.9% 10,178,833 11.8% -2,127,140 -17.3% Total 95,694,077 100% 86,500,635 100% -9,193,442 -9.6%
†District 6’s data have been slightly adjusted from what was published in the 2010 MPR to correct for a data processing inconsistency in PeMS. Numbers may not sum to total due to rounding.
2 Note: The 2010 statewide total VHD at 35 mph was updated from the figures in the MPR 2010.

17
California Department of Transportation Mobility Performance Report 2011
Figure 2–6 presents a longer-term statewide total VHD at 35 mph trend. This figure demonstrates that, while delay decreased in 2011 to 86.5 million VHD, it is still below the level of delay experienced prior to the economic recession. In 2006, delay peaked at approximately 106 million VHD at 35 mph.
Figure 2–6
HISTORICAL STATEWIDE TOTAL VEHICLE HOURS OF DELAY AT 35 MILES PER HOUR, BY YEAR, 2005–2011
0
20
40
60
80
100
120
2005 2006 2007 2008 2009 2010 2011
Hours (Millions)
Year
Statewide Total

18
California Department of Transportation Mobility Performance Report 2011
With the Los Angeles Area accounting for approximately 45 percent of the total statewide delay, District 7 has a large influence over the statewide trend. Figure 2–7 demonstrates the relative magnitude of delay experienced in each district over the past six years.
Figure 2–7
HISTORICAL STATEWIDE TOTAL VEHICLE HOURS OF DELAY AT 35 MILES PER HOUR, BY YEAR BY DISTRICT, 2005–2011
0
10
20
30
40
50
60
2005 2006 2007 2008 2009 2010 2011
Hours (Millions)
Year
District 3 District 4 District 6 District 7 District 8 District 10 District 11 District 12
19
California Department of Transportation Mobility Performance Report 2011
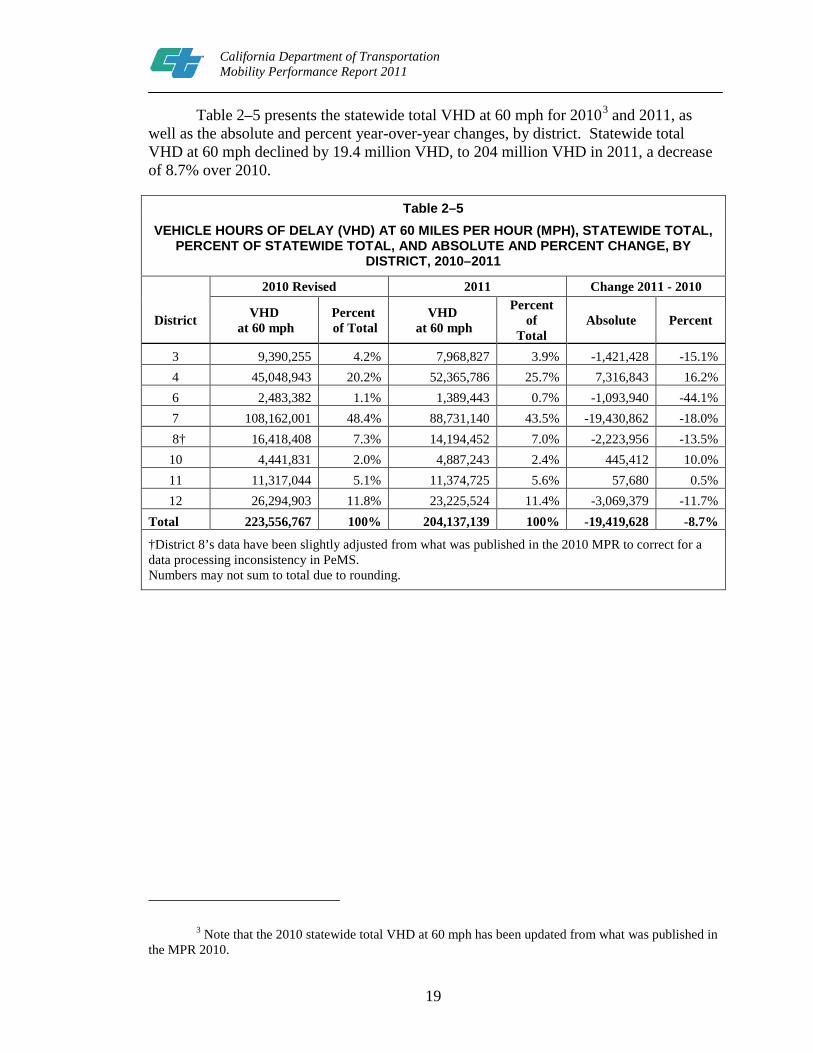
Table 2–5 presents the statewide total VHD at 60 mph for 20103 and 2011, as well as the absolute and percent year-over-year changes, by district. Statewide total VHD at 60 mph declined by 19.4 million VHD, to 204 million VHD in 2011, a decrease of 8.7% over 2010.
Table 2–5 VEHICLE HOURS OF DELAY (VHD) AT 60 MILES PER HOUR (MPH), STATEWIDE TOTAL,
PERCENT OF STATEWIDE TOTAL, AND ABSOLUTE AND PERCENT CHANGE, BY DISTRICT, 2010–2011
2010 Revised 2011 Change 2011 - 2010
District VHD at 60 mph
Percent of Total
VHD at 60 mph
Percent of
Total Absolute Percent
3 9,390,255 4.2% 7,968,827 3.9% -1,421,428 -15.1% 4 45,048,943 20.2% 52,365,786 25.7% 7,316,843 16.2% 6 2,483,382 1.1% 1,389,443 0.7% -1,093,940 -44.1% 7 108,162,001 48.4% 88,731,140 43.5% -19,430,862 -18.0%
8† 16,418,408 7.3% 14,194,452 7.0% -2,223,956 -13.5% 10 4,441,831 2.0% 4,887,243 2.4% 445,412 10.0% 11 11,317,044 5.1% 11,374,725 5.6% 57,680 0.5% 12 26,294,903 11.8% 23,225,524 11.4% -3,069,379 -11.7%
Total 223,556,767 100% 204,137,139 100% -19,419,628 -8.7%
†District 8’s data have been slightly adjusted from what was published in the 2010 MPR to correct for a data processing inconsistency in PeMS. Numbers may not sum to total due to rounding.
3 Note that the 2010 statewide total VHD at 60 mph has been updated from what was published in the MPR 2010.
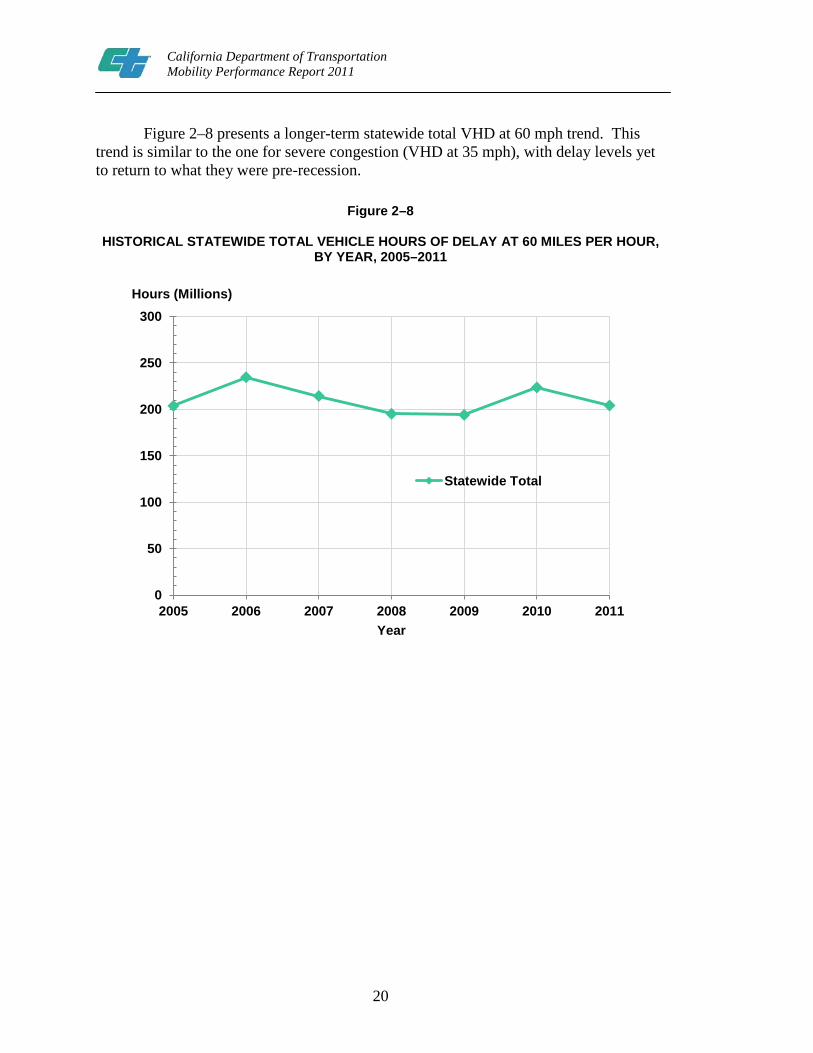
20
California Department of Transportation Mobility Performance Report 2011
Figure 2–8 presents a longer-term statewide total VHD at 60 mph trend. This
trend is similar to the one for severe congestion (VHD at 35 mph), with delay levels yet to return to what they were pre-recession.
Figure 2–8
HISTORICAL STATEWIDE TOTAL VEHICLE HOURS OF DELAY AT 60 MILES PER HOUR, BY YEAR, 2005–2011
0
50
100
150
200
250
300
2005 2006 2007 2008 2009 2010 2011
Hours (Millions)
Year
Statewide Total

21
California Department of Transportation Mobility Performance Report 2011
Figure 2–9 presents a longer-term statewide total VHD at 60 mph trend. This trend is similar to the one for severe congestion (VHD at 35 mph), with delay levels yet to return to what they were pre-recession.
Figure 2–9
HISTORICAL STATEWIDE TOTAL VEHICLE HOURS OF DELAY AT 60 MILES PER HOUR, BY YEAR BY DISTRICT, 2005–2011
Tables 2–4 and 2–5, as well as the Figures 2–7 and 2–9, demonstrate that there has been little change in the relative share of delay between districts over time, particularly between 2010 and 2011. District 7 (Los Angeles Area) contributes approximately 45 percent of the total statewide delay. District 4 (San Francisco Bay Area) accounts for roughly 27 percent of statewide delay, followed by District 12 (Orange County) with 11 – 12 percent. The districts with relatively small amounts of delay have relatively larger shares of statewide delay at 60 mph than they do at 35 mph. This finding demonstrates that the large urban areas of Los Angeles-Orange County and the San Francisco Bay Area not only have a large amount of overall delay, but also that their delay is more likely to be severe in nature (below 35 mph). While a few districts did see their VHD decrease in 2011, their relatively small shares of statewide delay meant that they had little influence in the statewide trend.
0
20
40
60
80
100
120
140
2005 2006 2007 2008 2009 2010 2011
Hours (Millions)
Year
District 3 District 4 District 6 District 7 District 8 District 10 District 11 District 12
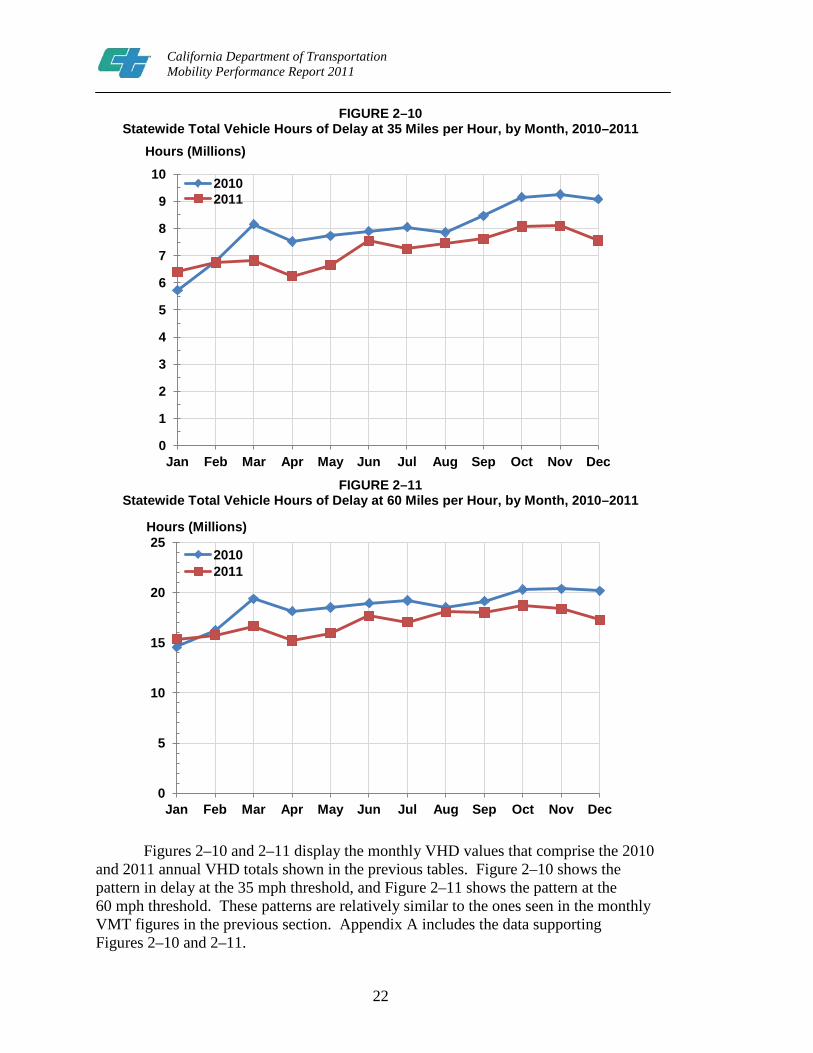
22
California Department of Transportation Mobility Performance Report 2011
0
5
10
15
20
25
Jan Feb Mar Apr May Jun Jul Aug Sep Oct Nov Dec
Hours (Millions)
2010 2011
FIGURE 2–10 Statewide Total Vehicle Hours of Delay at 35 Miles per Hour, by Month, 2010–2011
FIGURE 2–11 Statewide Total Vehicle Hours of Delay at 60 Miles per Hour, by Month, 2010–2011
Figures 2–10 and 2–11 display the monthly VHD values that comprise the 2010 and 2011 annual VHD totals shown in the previous tables. Figure 2–10 shows the pattern in delay at the 35 mph threshold, and Figure 2–11 shows the pattern at the 60 mph threshold. These patterns are relatively similar to the ones seen in the monthly VMT figures in the previous section. Appendix A includes the data supporting Figures 2–10 and 2–11.
0
1
2
3
4
5
6
7
8
9
10
Jan Feb Mar Apr May Jun Jul Aug Sep Oct Nov Dec
Hours (Millions)
2010 2011

23
California Department of Transportation Mobility Performance Report 2011
Beyond total delay, the MPR 2011 also presents average daily VHD. Because Caltrans collected speed data manually until a few years ago, Caltrans has a history of reporting delay as a daily average because that was the metric that could be most readily calculated. Data was not often available for each month, so it was difficult to produce figures similar to the ones shown above, nor was it possible to produce a true annual delay total, as the amount of delay on weekends was not typically measured. However, average daily delay is still a desirable metric to calculate, as the amount of delay is often more relatable in terms of one day’s worth of delay as opposed to one year’s worth. The average daily VHD presented here is the average of all non-holiday weekdays throughout the year. Weekends and federal holidays are excluded from the computation. This method of calculation keeps the values relatively similar to the old daily VHD calculations, which were derived exclusively from weekday data.
Table 2–6 presents the statewide average non-holiday weekday VHD at the 35 mph threshold for both 2010 and 2011, by district. The absolute and percent year-over-year changes are also shown. The average weekday delay experienced in 2011 was approximately 303,000 VHD, down from 332,000 in 2011.
Table 2–6
VEHICLE HOURS OF DELAY (VHD) AT 35 MILES PER HOUR (MPH), STATEWIDE NON–HOLIDAY WEEKDAY AVERAGE, PERCENT OF STATEWIDE AVERAGE, ABSOLUTE, AND
PERCENT CHANGE, BY DISTRICT, 2010–2011 2010 2011 Change 2011 - 2010
District
Average Non-Holiday
Weekday VHD
at 35 mph
Percent of Total
Average Non-Holiday
Weekday VHD
at 35 mph
Percent of Total Absolute Percent
3 9,605 2.9% 9,887 3.3% 282 2.9% 4 67,771 20.4% 81,002 26.7% 13,232 19.5% 6 1,548 0.5% 1,004 0.3% -545 -35.2% 7 171,320 51.7% 134,455 44.4% -36,865 -21.5% 8 18,576 5.6% 17,915 5.9% -661 -3.6%
10 2,996 0.9% 4,470 1.5% 1,474 49.2% 11 17,026 5.1% 18,588 6.1% 1,561 9.2% 12 42,738 12.9% 35,699 11.8% -7,039 -16.5%
Statewide Average 331,580 100% 303,019 100% -28,561 -9%
Numbers may not sum to total due to rounding

24
California Department of Transportation Mobility Performance Report 2011
Table 2–7 presents the statewide average non-holiday weekday VHD at the 60 mph threshold for both 2010 and 2011, by district. The absolute and percent year-over-year changes are also shown. The average weekday delay experienced in 2011 was approximately 711,000 VHD, down from 770,000 in 2010. The year-over-year percentage changes in average weekday VHD are very similar to the year-over-year changes in total VHD.
Table 2–7 VEHICLE HOURS OF DELAY (VHD) AT 60 MILES PER HOUR (MPH), STATEWIDE NON–
HOLIDAY WEEKDAY AVERAGE, PERCENT OF STATEWIDE AVERAGE, AND ABSOLUTE AND PERCENT CHANGE, BY DISTRICT, 2010–2011
2010 2011 Change 2011 - 2010
District
Average Non-Holiday
Weekday VHD
at 60 mph
Percent of Total
Average Non-Holiday
Weekday VHD
at 60 mph
Percent of Total Absolute Percent
3 29,875 3.9% 26,130 3.7% -3,745 -12.5% 4 155,342 20.2% 181,017 25.5% 25,675 16.5% 6 8,175 1.1% 4,543 0.6% -3,632 -44.4% 7 373,312 48.5% 310,862 43.7% -62,450 -16.7% 8 54,566 7.1% 48,622 6.8% -5,945 -10.9%
10 16,227 2.1% 16,860 2.4% 633 3.9% 11 41,121 5.3% 41,596 5.9% 475 1.2% 12 91,438 11.9% 81,144 11.4% -10,294 -11.3%
Statewide Average 770,056 100% 710,773 100% -59,282 -7.7% Numbers may not sum to total due to rounding

25
California Department of Transportation Mobility Performance Report 2011
0 100 200 300 400 500 600 700 800 900
1,000
Jan Feb Mar Apr May Jun Jul Aug Sep Oct Nov Dec
Hours (Thousands)
2010 2011
Figures 2–12 and 2–13 show the average weekday VHD values by month. As with VMT and total VHD, the 2011 values are consistently lower than the 2010 values, and the two annual trend lines are almost parallel. Appendix A includes the data supporting these figures.
FIGURE 2–12
Statewide Average Non-Holiday Weekday Vehicle Hours of Delay at 35 Miles per Hour, by Month, 2010–2011
FIGURE 2–13
Statewide Average Non-Holiday Weekday Vehicle Hours of Delay at 60 Miles per Hour, by Month, 2010–2011
0
50
100
150
200
250
300
350
400
450
Jan Feb Mar Apr May Jun Jul Aug Sep Oct Nov Dec
Hours (Thousands)
2010 2011
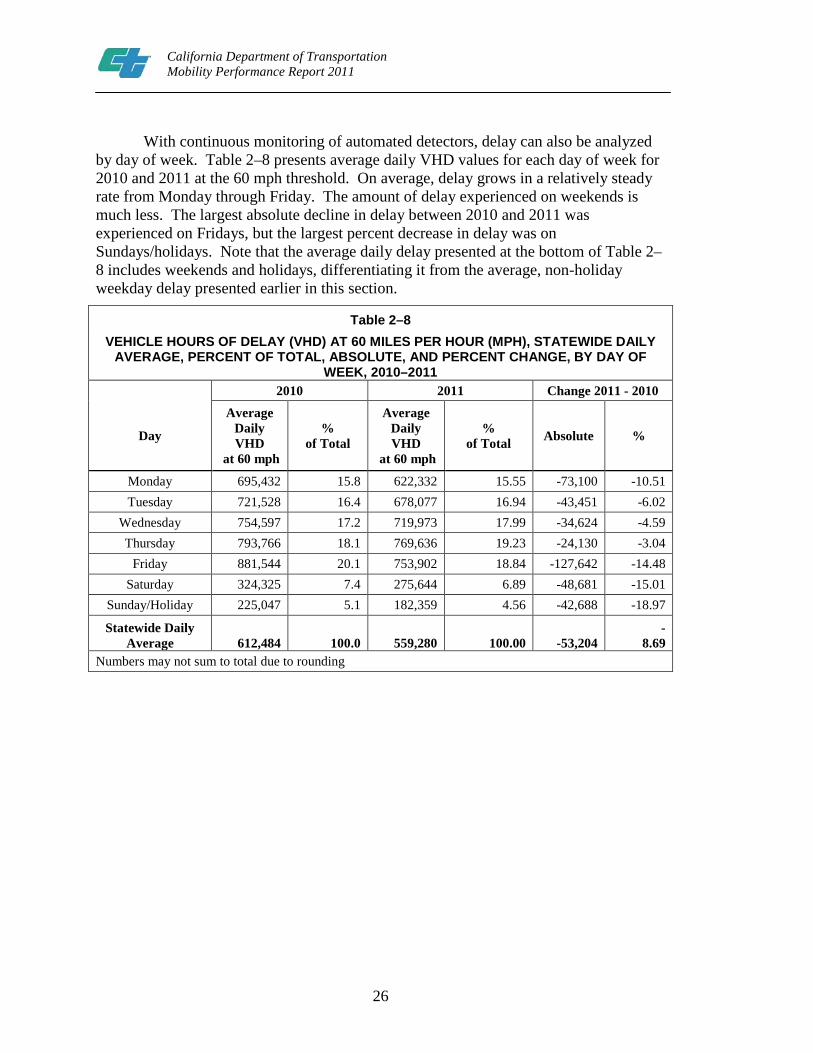
26
California Department of Transportation Mobility Performance Report 2011
With continuous monitoring of automated detectors, delay can also be analyzed by day of week. Table 2–8 presents average daily VHD values for each day of week for 2010 and 2011 at the 60 mph threshold. On average, delay grows in a relatively steady rate from Monday through Friday. The amount of delay experienced on weekends is much less. The largest absolute decline in delay between 2010 and 2011 was experienced on Fridays, but the largest percent decrease in delay was on Sundays/holidays. Note that the average daily delay presented at the bottom of Table 2–8 includes weekends and holidays, differentiating it from the average, non-holiday weekday delay presented earlier in this section.
Table 2–8 VEHICLE HOURS OF DELAY (VHD) AT 60 MILES PER HOUR (MPH), STATEWIDE DAILY
AVERAGE, PERCENT OF TOTAL, ABSOLUTE, AND PERCENT CHANGE, BY DAY OF WEEK, 2010–2011
2010 2011 Change 2011 - 2010
Day
Average Daily VHD
at 60 mph
% of Total
Average Daily VHD
at 60 mph
% of Total Absolute %
Monday 695,432 15.8 622,332 15.55 -73,100 -10.51 Tuesday 721,528 16.4 678,077 16.94 -43,451 -6.02
Wednesday 754,597 17.2 719,973 17.99 -34,624 -4.59 Thursday 793,766 18.1 769,636 19.23 -24,130 -3.04
Friday 881,544 20.1 753,902 18.84 -127,642 -14.48 Saturday 324,325 7.4 275,644 6.89 -48,681 -15.01
Sunday/Holiday 225,047 5.1 182,359 4.56 -42,688 -18.97
Statewide Daily Average 612,484 100.0 559,280 100.00 -53,204
-8.69
Numbers may not sum to total due to rounding

27
California Department of Transportation Mobility Performance Report 2011
Figure 2–14 presents the day of week delay values in graphic form.
Figure 2–14
STATEWIDE AVERAGE VEHICLE HOURS OF DELAY AT 60 MILES PER HOUR, BY DAY OF WEEK, 2010–2011
Mon Tue Wed Thu Fri Sat Sun/Hol
Hours (Thousands) 2010 2011

28
California Department of Transportation Mobility Performance Report 2011
Table 2–9 (A—C) presents the average VHD by hour of day at 35 MPH. This shows that the hour of 5:00PM has the highest Average Daily VHD of 50,068, at speeds of 35 MPH.
Table 2–9 (A) VEHICLE HOURS OF DELAY (VHD) AT 35 MILES PER HOUR (MPH), STATEWIDE
WEEKDAY AVERAGE, PERCENT OF TOTAL, ABSOLUTE, AND PERCENT CHANGE, BY HOUR OF DAY, 2010–2011
Weekdays 2010 2011 Change 2011 - 2010
Time Average Daily
VHD at 35 mph
% of Total
Average Daily VHD
at 35 mph
% of Total Absolute %
12:00 AM 596 0.2 501 0.2 -95 -15.9 1:00 AM 768 0.2 627 0.2 -140 -18.3 2:00 AM 819 0.2 668 0.2 -151 -18.5 3:00 AM 913 0.3 734 0.2 -178 -19.5 4:00 AM 1,145 0.3 942 0.3 -203 -17.7 5:00 AM 1,951 0.6 1,994 0.7 42 2.2 6:00 AM 7,387 2.2 8,213 2.7 826 11.2 7:00 AM 27,115 8.2 27,482 9.1 367 1.4 8:00 AM 35,087 10.6 34,119 11.3 -969 -2.8 9:00 AM 18,870 5.7 18,535 6.1 -336 -1.8
10:00 AM 10,734 3.2 10,982 3.6 248 2.3 11:00 AM 9,461 2.9 9,572 3.2 111 1.2 12:00 PM 10,038 3.0 9,747 3.2 -291 -2.9
1:00 PM 10,912 3.3 9,939 3.3 -973 -8.9 2:00 PM 15,268 4.6 12,619 4.2 -2,649 -17.4 3:00 PM 26,834 8.1 21,857 7.2 -4,977 -18.5 4:00 PM 40,382 12.2 35,327 11.7 -5,055 -12.5 5:00 PM 55,404 16.7 50,608 16.7 -4,796 -8.7 6:00 PM 36,361 11.0 31,502 10.4 -4,859 -13.4 7:00 PM 11,422 3.4 8,869 2.9 -2,553 -22.3 8:00 PM 3,808 1.1 2,925 1.0 -883 -23.2 9:00 PM 2,434 0.7 2,051 0.7 -382 -15.7
10:00 PM 2,177 0.7 1,809 0.6 -368 -16.9 11:00 PM 1,694 0.5 1,397 0.5 -298 -17.6
Statewide Daily Average 331,580 100.0 303,019 100.0 -28,561 -8.6 Numbers may not sum to total due to rounding.
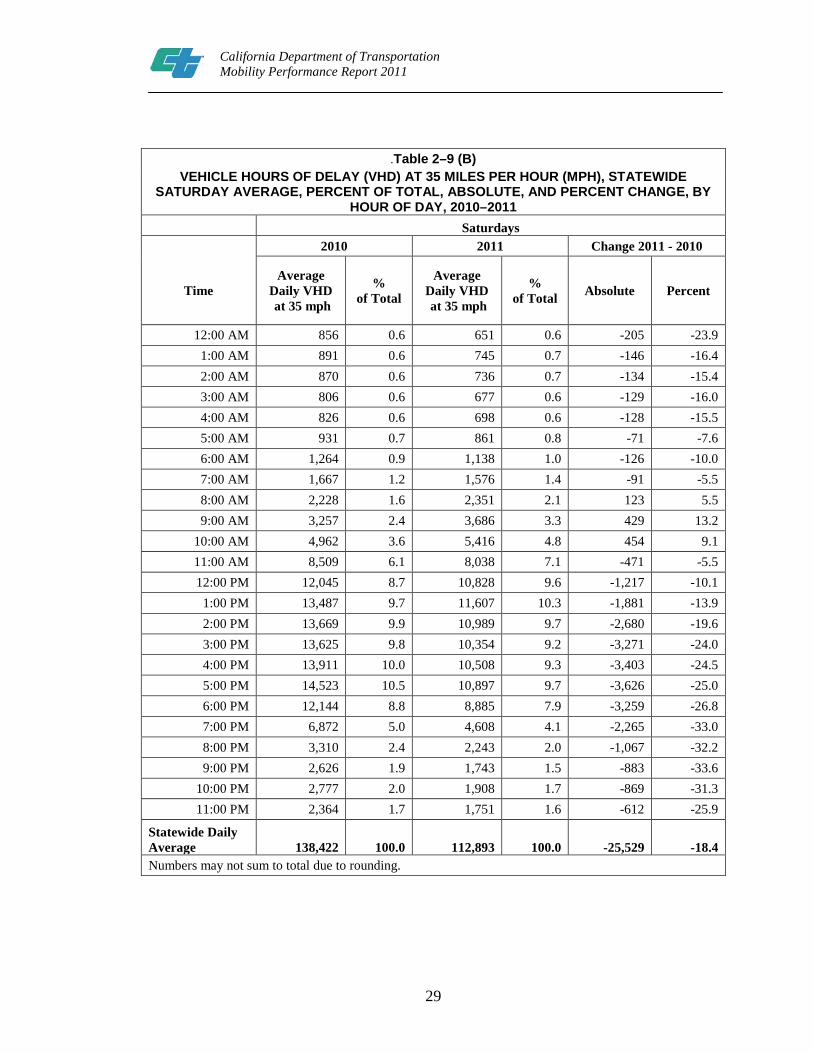
29
California Department of Transportation Mobility Performance Report 2011
.Table 2–9 (B) VEHICLE HOURS OF DELAY (VHD) AT 35 MILES PER HOUR (MPH), STATEWIDE
SATURDAY AVERAGE, PERCENT OF TOTAL, ABSOLUTE, AND PERCENT CHANGE, BY HOUR OF DAY, 2010–2011
Saturdays 2010 2011 Change 2011 - 2010
Time Average
Daily VHD at 35 mph
% of Total
Average Daily VHD at 35 mph
% of Total Absolute Percent
12:00 AM 856 0.6 651 0.6 -205 -23.9 1:00 AM 891 0.6 745 0.7 -146 -16.4 2:00 AM 870 0.6 736 0.7 -134 -15.4 3:00 AM 806 0.6 677 0.6 -129 -16.0 4:00 AM 826 0.6 698 0.6 -128 -15.5 5:00 AM 931 0.7 861 0.8 -71 -7.6 6:00 AM 1,264 0.9 1,138 1.0 -126 -10.0 7:00 AM 1,667 1.2 1,576 1.4 -91 -5.5 8:00 AM 2,228 1.6 2,351 2.1 123 5.5 9:00 AM 3,257 2.4 3,686 3.3 429 13.2
10:00 AM 4,962 3.6 5,416 4.8 454 9.1 11:00 AM 8,509 6.1 8,038 7.1 -471 -5.5 12:00 PM 12,045 8.7 10,828 9.6 -1,217 -10.1
1:00 PM 13,487 9.7 11,607 10.3 -1,881 -13.9 2:00 PM 13,669 9.9 10,989 9.7 -2,680 -19.6 3:00 PM 13,625 9.8 10,354 9.2 -3,271 -24.0 4:00 PM 13,911 10.0 10,508 9.3 -3,403 -24.5 5:00 PM 14,523 10.5 10,897 9.7 -3,626 -25.0 6:00 PM 12,144 8.8 8,885 7.9 -3,259 -26.8 7:00 PM 6,872 5.0 4,608 4.1 -2,265 -33.0 8:00 PM 3,310 2.4 2,243 2.0 -1,067 -32.2 9:00 PM 2,626 1.9 1,743 1.5 -883 -33.6
10:00 PM 2,777 2.0 1,908 1.7 -869 -31.3 11:00 PM 2,364 1.7 1,751 1.6 -612 -25.9
Statewide Daily Average 138,422 100.0 112,893 100.0 -25,529 -18.4 Numbers may not sum to total due to rounding.

30
California Department of Transportation Mobility Performance Report 2011
Table 2–9 (C) VEHICLE HOURS OF DELAY (VHD) AT 35 MILES PER HOUR (MPH), STATEWIDE
SUNDAY/HOLIDAY AVERAGE, PERCENT OF TOTAL, ABSOLUTE, AND PERCENT CHANGE, BY HOUR OF DAY, 2010–2011
Sundays/Holidays 2010 2011 Change 2011 - 2010
Time Average
Daily VHD at 35 mph
Percent of Total
Average Daily VHD at 35 mph
Percent of Total Absolute Percent
12:00 AM 1,051 1.2 749 1.0 -301 -28.7 1:00 AM 961 1.1 812 1.1 -149 -15.5 2:00 AM 921 1.0 739 1.0 -183 -19.8 3:00 AM 786 0.9 627 0.9 -159 -20.2 4:00 AM 736 0.8 556 0.8 -180 -24.4 5:00 AM 836 0.9 645 0.9 -190 -22.8 6:00 AM 1,180 1.3 962 1.3 -217 -18.4 7:00 AM 1,832 2.1 1,447 2.0 -385 -21.0 8:00 AM 2,137 2.4 1,642 2.2 -495 -23.2 9:00 AM 2,168 2.4 1,843 2.5 -324 -15.0
10:00 AM 2,759 3.1 2,605 3.6 -153 -5.6 11:00 AM 4,356 4.9 3,944 5.4 -412 -9.5 12:00 PM 6,323 7.1 5,505 7.5 -818 -12.9
1:00 PM 7,937 8.9 6,447 8.8 -1,490 -18.8 2:00 PM 8,601 9.7 6,702 9.2 -1,898 -22.1 3:00 PM 8,770 9.9 6,650 9.1 -2,121 -24.2 4:00 PM 8,878 10.0 6,867 9.4 -2,011 -22.7 5:00 PM 8,830 9.9 7,294 10.0 -1,536 -17.4 6:00 PM 6,575 7.4 5,634 7.7 -941 -14.3 7:00 PM 4,152 4.7 3,351 4.6 -801 -19.3 8:00 PM 3,108 3.5 2,674 3.7 -434 -14.0 9:00 PM 2,557 2.9 2,192 3.0 -365 -14.3
10:00 PM 1,946 2.2 1,803 2.5 -143 -7.4 11:00 PM 1,508 1.7 1,416 1.9 -91 -6.1
Statewide Daily Average 88,905 100.0 73,107 100.0 -15,799 -17.8 Numbers may not sum to total due to rounding.
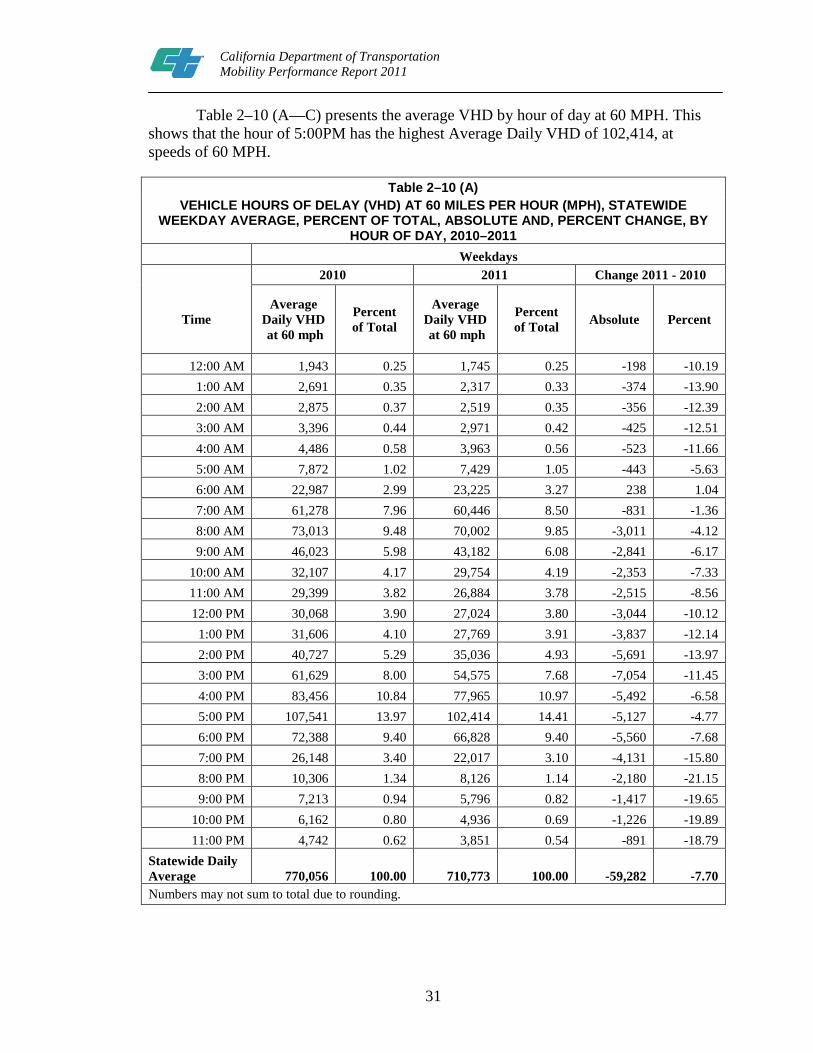
31
California Department of Transportation Mobility Performance Report 2011
Table 2–10 (A—C) presents the average VHD by hour of day at 60 MPH. This shows that the hour of 5:00PM has the highest Average Daily VHD of 102,414, at speeds of 60 MPH.
Table 2–10 (A) VEHICLE HOURS OF DELAY (VHD) AT 60 MILES PER HOUR (MPH), STATEWIDE
WEEKDAY AVERAGE, PERCENT OF TOTAL, ABSOLUTE AND, PERCENT CHANGE, BY HOUR OF DAY, 2010–2011
Weekdays 2010 2011 Change 2011 - 2010
Time Average
Daily VHD at 60 mph
Percent of Total
Average Daily VHD at 60 mph
Percent of Total Absolute Percent
12:00 AM 1,943 0.25 1,745 0.25 -198 -10.19 1:00 AM 2,691 0.35 2,317 0.33 -374 -13.90 2:00 AM 2,875 0.37 2,519 0.35 -356 -12.39 3:00 AM 3,396 0.44 2,971 0.42 -425 -12.51 4:00 AM 4,486 0.58 3,963 0.56 -523 -11.66 5:00 AM 7,872 1.02 7,429 1.05 -443 -5.63 6:00 AM 22,987 2.99 23,225 3.27 238 1.04 7:00 AM 61,278 7.96 60,446 8.50 -831 -1.36 8:00 AM 73,013 9.48 70,002 9.85 -3,011 -4.12 9:00 AM 46,023 5.98 43,182 6.08 -2,841 -6.17
10:00 AM 32,107 4.17 29,754 4.19 -2,353 -7.33 11:00 AM 29,399 3.82 26,884 3.78 -2,515 -8.56 12:00 PM 30,068 3.90 27,024 3.80 -3,044 -10.12
1:00 PM 31,606 4.10 27,769 3.91 -3,837 -12.14 2:00 PM 40,727 5.29 35,036 4.93 -5,691 -13.97 3:00 PM 61,629 8.00 54,575 7.68 -7,054 -11.45 4:00 PM 83,456 10.84 77,965 10.97 -5,492 -6.58 5:00 PM 107,541 13.97 102,414 14.41 -5,127 -4.77 6:00 PM 72,388 9.40 66,828 9.40 -5,560 -7.68 7:00 PM 26,148 3.40 22,017 3.10 -4,131 -15.80 8:00 PM 10,306 1.34 8,126 1.14 -2,180 -21.15 9:00 PM 7,213 0.94 5,796 0.82 -1,417 -19.65
10:00 PM 6,162 0.80 4,936 0.69 -1,226 -19.89 11:00 PM 4,742 0.62 3,851 0.54 -891 -18.79
Statewide Daily Average 770,056 100.00 710,773 100.00 -59,282 -7.70 Numbers may not sum to total due to rounding.

32
California Department of Transportation Mobility Performance Report 2011
Table 2–10 (B) VEHICLE HOURS OF DELAY (VHD) AT 60 MILES PER HOUR (MPH), STATEWIDE
SATURDAY AVERAGE, PERCENT OF TOTAL, ABSOLUTE, AND PERCENT CHANGE, BY HOUR OF DAY, 2010–2011
Saturdays 2010 2011 Change 2011 - 2010
Time Average
Daily VHD at 60 mph
Percent of Total
Average Daily VHD at 60 mph
Percent of Total Absolute Percent
12:00 AM 2,288 0.7 1,858 0.7 -430 -18.8 1:00 AM 2,330 0.7 1,933 0.7 -397 -17.0 2:00 AM 2,147 0.7 1,821 0.7 -325 -15.2 3:00 AM 1,968 0.6 1,723 0.6 -245 -12.5 4:00 AM 2,133 0.7 1,929 0.7 -204 -9.6 5:00 AM 2,642 0.8 2,460 0.9 -182 -6.9 6:00 AM 3,642 1.1 3,223 1.2 -418 -11.5 7:00 AM 4,925 1.5 4,469 1.6 -456 -9.3 8:00 AM 6,570 2.0 6,387 2.3 -183 -2.8 9:00 AM 9,270 2.9 9,423 3.4 152 1.6
10:00 AM 13,662 4.2 13,543 4.9 -119 -0.9 11:00 AM 20,870 6.4 19,159 7.0 -1,712 -8.2 12:00 PM 27,568 8.5 24,821 9.0 -2,748 -10.0
1:00 PM 30,350 9.4 26,582 9.6 -3,768 -12.4 2:00 PM 30,726 9.5 25,866 9.4 -4,860 -15.8 3:00 PM 30,714 9.5 25,533 9.3 -5,181 -16.9 4:00 PM 30,854 9.5 25,992 9.4 -4,862 -15.8 5:00 PM 31,891 9.8 26,846 9.7 -5,045 -15.8 6:00 PM 26,347 8.1 21,348 7.7 -4,999 -19.0 7:00 PM 15,536 4.8 11,298 4.1 -4,238 -27.3 8:00 PM 8,557 2.6 5,917 2.1 -2,640 -30.9 9:00 PM 7,015 2.2 4,739 1.7 -2,275 -32.4
10:00 PM 6,883 2.1 4,833 1.8 -2,049 -29.8 11:00 PM 5,440 1.7 3,943 1.4 -1,497 -27.5
Statewide Daily Average 324,325 100.0 275,644 100.0 -48,681 -15.0 Numbers may not sum to total due to rounding.

33
California Department of Transportation Mobility Performance Report 2011
Table 2–10 (C) VEHICLE HOURS OF DELAY (VHD) AT 60 MILES PER HOUR (MPH), STATEWIDE
SUNDAY/HOLIDAY AVERAGE, PERCENT OF TOTAL, ABSOLUTE, AND PERCENT CHANGE, BY HOUR OF DAY, 2010–2011
Sundays/Holidays 2010 2011 Change 2011 - 2010
Time Average
Daily VHD at 60 mph
Percent of Total
Average Daily VHD at 60 mph
Percent of Total Absolute Percent
12:00 AM 2,530 1.1 1,881 1.0 -648 -25.6 1:00 AM 2,226 1.0 1,821 1.0 -405 -18.2 2:00 AM 2,042 0.9 1,638 0.9 -405 -19.8 3:00 AM 1,775 0.8 1,463 0.8 -312 -17.6 4:00 AM 1,793 0.8 1,480 0.8 -312 -17.4 5:00 AM 2,244 1.0 1,851 1.0 -393 -17.5 6:00 AM 3,364 1.5 2,731 1.5 -634 -18.8 7:00 AM 5,012 2.2 3,989 2.2 -1,023 -20.4 8:00 AM 6,018 2.7 4,735 2.6 -1,283 -21.3 9:00 AM 6,710 3.0 5,442 3.0 -1,268 -18.9
10:00 AM 8,542 3.8 7,280 4.0 -1,262 -14.8 11:00 AM 12,039 5.3 10,110 5.5 -1,929 -16.0 12:00 PM 16,049 7.1 13,236 7.3 -2,813 -17.5
1:00 PM 19,293 8.6 15,330 8.4 -3,963 -20.5 2:00 PM 20,700 9.2 16,224 8.9 -4,475 -21.6 3:00 PM 20,883 9.3 16,283 8.9 -4,600 -22.0 4:00 PM 20,668 9.2 16,564 9.1 -4,104 -19.9 5:00 PM 20,742 9.2 17,373 9.5 -3,370 -16.2 6:00 PM 15,850 7.0 13,497 7.4 -2,353 -14.8 7:00 PM 10,717 4.8 8,618 4.7 -2,099 -19.6 8:00 PM 8,742 3.9 6,961 3.8 -1,781 -20.4 9:00 PM 7,282 3.2 5,702 3.1 -1,580 -21.7
10:00 PM 5,537 2.5 4,574 2.5 -963 -17.4 11:00 PM 4,287 1.9 3,574 2.0 -714 -16.6
Statewide Daily Average 225,047 100.0 182,359 100.0 -42,688 -19.0 Numbers may not sum to total due to rounding.

34
California Department of Transportation Mobility Performance Report 2011
The MPR 2011 includes congestion analysis that analyzes the delay pattern by hour of day. Figure 2–15 shows the average hourly VHD at 35 mph for weekdays, Saturdays, and Sundays/holidays. Figure 2–16 shows the average hourly VHD at 60 mph for weekdays, Saturdays, and Sundays/holidays. This figure depicts the AM and PM Peak periods, when increased demand results in congested conditions. Note that each hour represents the starting point of data collection. In other words, the VHD reported at 6 AM represents the delay experienced from 6 AM until 6:59 AM. In 2011, the statewide PM Peak hour was the hour starting at 5 PM, when average congestion was 102,000 VHD. The AM Peak hour began at 8 AM, with an average of 70,000 VHD. The weekends and holidays did not experience peaking in 2011, but rather had relatively consistent levels of delay from late morning until early evening. Appendix A includes the data supporting Figure 2–15 and 2-16.
Figure 2–15
STATEWIDE AVERAGE VEHICLE HOURS OF DELAY AT 35 MILES PER HOUR, BY HOUR OF DAY, 2010–2011
0
10
20
30
40
50
60 Hours (Thousands)
Weekdays 2010 Weekdays 2011 Saturdays 2010 Saturdays 2011 Sundays/Holidays 2010 Sundays/Holidays 2011

35
California Department of Transportation Mobility Performance Report 2011
Figure 2–16
STATEWIDE AVERAGE VEHICLE HOURS OF DELAY AT 60 MILES PER HOUR, BY HOUR OF DAY, 2010–2011
0
20
40
60
80
100
120
Hours (Thousands)
Weekdays 2010 Weekdays 2011 Saturdays 2010 Saturdays 2011 Sundays/Holidays 2010 Sundays/Holidays 2011

36
California Department of Transportation Mobility Performance Report 2011
Finally, beyond the Caltrans district boundaries, delay is analyzed by county. Figure 2–17 again demonstrates how much delay is experienced in Los Angeles County. After Los Angeles County, the counties with the most delay are Orange, Alameda, and San Diego.
FIGURE 2–17
Statewide Total Vehicle Hours of Delay at 35 Miles per Hour, by County, 2010–2011
Numbers may not sum to total due to rounding
0 10 20 30 40 50 60
Butte El Dorado
Nevada Placer
Sacramento Sierra Sutter
Yolo Yuba
Alameda Contra Costa
Marin Napa
San Francisco San Mateo
Santa Clara Solano
Sonoma
Fresno Kern
Madera Tulare
Los Angeles Ventura
Riverside San Bernardino
Amador Calaveras Mariposa
Merced San Joaquin
Stanislaus Tuolumne
San Diego
Orange
Hours (Millions) District and
County
2010 2011
12 11 10 8 7 6 4 3

37
California Department of Transportation Mobility Performance Report 2011
SECTION 2.3. COSTS OF CONGESTION
The costs of congestion in 2011 are presented in three categories: (1) extra fuel burned, (2) the cost of lost time (opportunity cost in terms of wages and salaries), and (3) extra vehicle emissions of carbon dioxide (CO2). These values are calculated for delay at two speed benchmarks: 35 mph (representing severe congestion) and 60 mph (representing total congestion). Note that the costs of the two speed thresholds should not be added together – the costs of delay at 35 mph are essentially a subset of the costs of delay at 60 mph. Appendix C includes details about the calculations and source materials used to determine the costs of congestion presented here.
Overall, the total statewide annual cost of delay in terms of lost time at the 35 mph threshold was $1.5 billion in 2011. The total annual cost of delay in terms of lost time at the 60 mph threshold was $3.5 billion. In terms of daily costs, these annual values equal $4.1 million and $9.7 million, respectively.
There is also a cost associated with the extra fuel consumed because of delay. These annual costs totaled $552 million for delay at 35 mph and $1.3 billion for delay at 60 mph in 2011.
Finally, vehicles emit more CO2 because of congestion, contributing to climate change. The extra amount of CO2 emitted in 2011 is estimated at 1.4 million metric tons due to delay at 35 mph and 3.4 million metric tons due to delay at 60 mph.
Table 2–11 STATEWIDE COSTS OF CONGESTION FOR DELAY AT 35 MILES PER HOUR (MPH) AND DELAY AT 60 MPH, IN TERMS OF EXTRA COST OF FUEL BURNED, COST IN LOST TIME,
AND VEHICLE EMISSIONS OF CARBON DIOXIDE, BY DISTRICT, 2011
District
Cost in Extra Fuel Burned (Dollars) Cost in Time Lost (Dollars)
CO2 Vehicle Emissions (Metric
Tons)
Delay at 35 mph
Delay at 60 mph
Delay at 35 mph
Delay at 60 mph
Delay at 35 mph
Delay at 60 mph
3 $19,063,153 $50,821,115 $51,861,423 $138,259,148 50,336 134,193 4 $149,947,424 $333,962,277 $407,932,870 $908,546,387 395,936 881,826 6 $2,040,363 $8,861,159 $5,550,820 $24,106,836 5,388 23,398 7 $242,609,649 $565,881,958 $660,021,014 $1,539,485,279 640,610 1,494,209 8 $33,235,970 $90,524,976 $90,418,658 $246,273,742 87,759 239,031
10 $8,328,300 $31,168,343 $22,657,192 $84,793,666 21,991 82,300 11 $31,516,669 $72,542,195 $85,741,288 $197,351,479 83,220 191,547 12 $64,915,406 $148,120,547 $176,602,753 $402,962,841 171,409 391,112
Total $551,656,934 $1,301,882,570 $1,500,786,018 $3,541,779,378 1,456,649 3,437,616

38
California Department of Transportation Mobility Performance Report 2011
SECTION 2.4. LOST PRODUCTIVITY
The congestion reported in Section 2.2 results in lost productivity. As traffic volumes increase beyond the capacity of a roadway, speeds decline and throughput drops. This loss in throughput is the lost productivity of the system. A critical goal of system management is to maximize transportation productivity and person throughput.
One approach used to present lost productivity is to convert lost vehicle throughput where speeds drop below 35 mph into “equivalent lost lane miles.” These lost lane miles (LLM) represent a theoretical level of capacity that would be needed to achieve maximum throughput during the most congested time periods.
Table 2–12 shows how congestion affects theoretical lane capacity during different periods of the day. A total of over one thousand lane miles was theoretically lost during severely congested periods (delay due to speeds below 35 mph) in 2011. This was a decrease in over 21 lane miles from 2010. About half of the system’s productivity was lost in the PM Peak period from 3 PM to 7 PM.
Table 2–12
EQUIVALENT LOST LANE–MILES (LLM) AT 35 MILES PER HOUR (MPH), STATEWIDE NON–HOLIDAY WEEKDAY AVERAGE, PERCENT OF NON–HOLIDAY WEEKDAY
AVERAGE, ABSOLUTE, AND PERCENT CHANGE, BY DISTRICT, 2010–2011 2010 2011 Change 2011 - 2010
Period
Total Non-Holiday
Weekday LLM at 35 mph
Percent of Total
Total Non-Holiday
Weekday LLM at 35 mph
Percent of Total Absolute Percent
AM Peak (6 AM to 10 AM) 310 28.6% 316 29.7% 5 1.8% Off-Peak
Day (10 AM to
3 PM) 154 14.2% 149 14.0% -5 -3.3%
PM Peak (3 PM to 7
PM) 547 50.5% 533 50.2% -14 -2.6%
Off-Peak Night
(7 PM to 6 AM) 72 6.7% 65 6.1% -8 -10.4%
Statewide Daily Total 1,083 100% 1,062 100% -21 -2.0% Numbers may not sum to total due to rounding.

39
California Department of Transportation Mobility Performance Report 2011
Figure 2–18 depicts the data shown in Table 2–12 in graphic form.
Figure 2–18
STATEWIDE EQUIVALENT LOST LANE MILES AT 35 MILES PER HOUR, NON-HOLIDAY WEEKDAY AVERAGE, 2010–2011
0
100
200
300
400
500
600
700
AM Peak (6 AM to 10 AM)
Off-Peak Day (10 AM to 3 PM)
PM Peak (3 PM to 7 PM)
Off-Peak Night (7 PM to 6 AM)
Miles
2010 2011

40
California Department of Transportation Mobility Performance Report 2011
SECTION 2.5. DETECTION HEALTH AND DATA QUALITY
The travel demand and mobility data in this report originates exclusively from automated detection. There are two main factors to consider regarding detection: the magnitude of change in the size of the detection system (i.e., by how much the number of detectors has increased or decreased) over time, and the relative health of the detectors.
It is important to note changes in the number and placement of detectors on the urban freeway system, as these changes can be a factor in the observed performance trends. By the end of 2011, the State had 33,272 detectors in place, an increase from 31,594 at the end of 2010. This represents a 5 percent increase in detection from the end of 2010 to the end of 2011. This growth in the number of detectors can explain some of the growth in VMT and delay between these years because new detectors can measure VMT and delay in places that were previously unmonitored. Conversely, new detectors may just be “infill” detectors, placed in between existing detectors, so it is not always the case that new detectors will necessarily record more VMT or delay. However, it is advisable to note that the growth trends presented in this report may be slightly inflated because detectors may have recorded travel and delay in places not recorded in previous years.
Deficiencies in detection health and data quality can affect the results contained in this report. Regular monitoring of detector data quality and effective detector maintenance are necessary to provide reliable and accurate results. Barriers to good detector health include construction activities, which often require the deactivation of detectors, and copper wire theft, a growing problem in recent years. Figure 2–19 shows the statewide average number of detectors for each month in 2010 and 2011. These numbers are separated into good, working detectors and bad detectors (for which data are imputed, or estimated). On average, the percentage of good detectors was 68 percent in 2011, down from 72% in 2010.
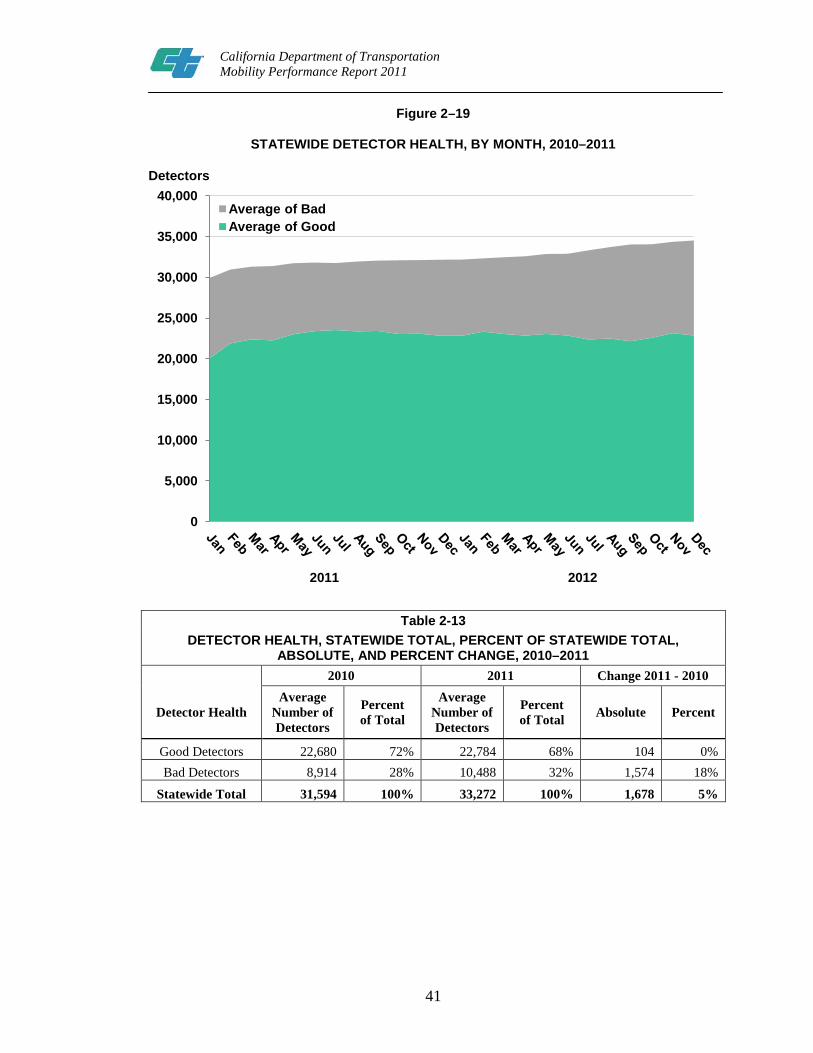
41
California Department of Transportation Mobility Performance Report 2011
Figure 2–19
STATEWIDE DETECTOR HEALTH, BY MONTH, 2010–2011
Table 2-13 DETECTOR HEALTH, STATEWIDE TOTAL, PERCENT OF STATEWIDE TOTAL,
ABSOLUTE, AND PERCENT CHANGE, 2010–2011 2010 2011 Change 2011 - 2010
Detector Health Average
Number of Detectors
Percent of Total
Average Number of Detectors
Percent of Total Absolute Percent
Good Detectors 22,680 72% 22,784 68% 104 0% Bad Detectors 8,914 28% 10,488 32% 1,574 18%
Statewide Total 31,594 100% 33,272 100% 1,678 5%
0
5,000
10,000
15,000
20,000
25,000
30,000
35,000
40,000 Average of Bad Average of Good
Detectors
2011 2012
42
California Department of Transportation Mobility Performance Report 2011
PAGE INTENTIONALLY LEFT BLANK

43
California Department of Transportation Mobility Performance Report 2011
Chapter 3
3.1 SUMMARY ANALYSIS Caltrans District 3 is composed of eleven counties including Butte, Colusa, El
Dorado, Glenn, Nevada, Placer, Sacramento, Sierra, Sutter, Yolo, and Yuba. Located in Central and Northern California, most of these counties could be considered rural and did not experience reportable congestion. Urban counties in District 3 supply the majority of mobility statistics. Those counties are El Dorado, Placer, Sacramento, Yolo, and Yuba. Total population for all counties in District 3 in 2011 was 2,713,432. This figure represents 7.2% of the total State population. The most populous county was Sacramento County. District 3 saw a population increase of 0.5% from 2010 to 2011. This growth rate is lower than historical growth rates. Business and residential growth in the urban counties combined to drive the increase in population.
In District 3, the 2011 monthly employment average was 1,133,106. The monthly
unemployment average was 12.5%, a drop of 0.5%. The unemployment rate was highest in Colusa County at 20.5%. The unemployment rate was lowest in Nevada County at 10.6%.
District 3’s Vehicle Miles Traveled (VMT) for 2011 was 8.1 billion miles. This represented an increase of 8.2 million miles in 2011, a 0.1% increase from 2010. Placer and Sacramento counties had the highest VMT in District 3. August was the peak travel month with 717 million VMT in 2011.
In 2011, District 3 maintained and operated 3,005 directional mainline miles on four major corridors including I-5, I-80, Rte-50 and Rte-99. 632 miles had detection in urban areas that experience congestion. The number of detectors reported increased 8% from the previous year. However, detector health declined. Detectors in good condition totaled 1,636 in 2011, a 2.1% decrease from the previous year.
In 2011, District 3 identified approximately 3 million Vehicle Hours of Delay
(VHD) at 35 mph (VHD35), a decrease of 0.3% from the previous year. District 3 contributed 3.5% of the VHD35 in the state, a 0.4% increase from 3.1% in 2010. District 3 also identified approximately 8 million Vehicle Hours of Delay at 60 mph (VHD60), a decrease of 15.1% from 2010. District 3 contributed 3.9% of the VHD60 in the state. The average annual non-holiday weekday VHD was 9,887 at 35 mph and 26,130 at 60 mph, an increase of 2.9 % and 12.5 %, respectively, from 2010. Friday contained the highest delay with 29,957 VHD at 60 mph.
Identifying the location, direction, duration, and VHD for freeway bottlenecks is
an important tool to manage congestion and initiate projects in District 3. There were seven mainline freeway bottlenecks reported during the morning (AM) commute hours in 2011. Northbound Rte-99 contained three bottlenecks, including the top AM bottleneck. AM bottlenecks accounted for 116,676 VHD60 annually. There were 16
44
California Department of Transportation Mobility Performance Report 2011
bottlenecks locations reported on various freeway segments during the afternoon (PM) commute period. The top PM bottleneck was located on eastbound I-80. PM bottlenecks accounted for 724,539 VHD60 annually. To alleviate some of the congestion and bottlenecks in District 3, several projects were started or finished in 2011. One project aimed to alleviate congestion in 2011 was the construction of the Rte-50 median high occupancy vehicle (HOV) lanes from El Dorado Hills Blvd to Cambridge Road. Another project that created HOV lanes on I-80 from the Sacramento County line to Rte-65 was completed in 2011. District 3 was also able to extend an existing auxiliary lane from Florin Road to Calvine Road.

45
California Department of Transportation Mobility Performance Report 2011
3.2 DESCRIPTIVE STATISTICS
District Headquarters: Marysville Counties: Butte, El Dorado, Nevada, Placer,
Sacramento, Sierra, Sutter, Yolo, Yuba Counties without Detection: Glen, Colusa
Population: 2,713,432, a0.5% increase over 2010
Population as a Percentage of Statewide: 7.2%
Table 3–1 DISTRICT 3 POPULATION ESTIMATES AND ABSOLUTE AND PERCENT CHANGE, 2010–
2011
County
2010 Revised† 2011‡ Difference
(2011 - 2010 Revised)
Population Population Absolute Percent Butte 220,465 220,263 -202 -0.1 Colusa 21,552 21,598 46 0.2 El Dorado 180,483 181,711 1,228 0.7 Glenn 28,105 28,226 121 0.4 Nevada 97,944 97,366 -578 -0.6 Placer 351,463 355,455 3,992 1.1 Sacramento 1,427,961 1,433,525 5,564 0.4 Sierra 3,182 3,178 -4 -0.1 Sutter 94,620 95,119 499 0.5 Yolo 201,071 204,349 3,278 1.6 Yuba 72,316 72,642 326 0.5
Total 2,699,162 2,713,432 14,270 0.5 Colusa and Glenn Counties do not participate in mobility performance reporting. ‡: State of California, Department of Finance, E-1 Population Estimates for Cities, Counties, and the State with Annual Percent Change — January 1, 2012 and 2013. Sacramento, California, May 2013. Numbers may not sum to total due to rounding.

46
California Department of Transportation Mobility Performance Report 2011
Figure 3–1
DISTRICT 3 POPULATION, BY COUNTY, 2010–2011
Employment, 2011 Monthly Average: 1,133,106
Unemployment Rate, 2011 Monthly Average: 12.5%, a 0.6% decrease over 2010
Table 3–2 DISTRICT 3 EMPLOYMENT, UNEMPLOYMENT, AND PERCENT CHANGE, BY
COUNTY, 2010–2011
County
Unemployment Rate (%),
2010 Revised
Unemployment Rate(%),
2011
Percent Change in Rate of Unemployment
(2011 - 2010) Butte 13.9% 13.6% -0.3% Colusa 20.2% 20.5% 0.2% El Dorado 12.5% 11.9% -0.6% Glenn 15.9% 15.9% -0.1% Nevada 11.4% 10.6% -0.8% Placer 11.5% 10.8% -0.7% Sacramento 12.7% 12.1% -0.7% Sierra 15.4% 14.8% -0.7% Sutter 19.5% 19.0% -0.4% Yolo 12.7% 12.5% -0.2% Yuba 19.2% 18.4% -0.9% District Total 13.0% 12.5% -0.6%
Colusa and Glenn Counties do not participate in mobility performance reporting. Data not seasonally adjusted. Data revised by source. Source: State of California, Employment Development Department (EDD), Labor Market Information Division, downloaded Sept. 9, 2013. Numbers may not sum to total due to rounding.
0.0
0.3
0.6
0.9
1.2
1.5 2010 Revised 2011
Millions

47
California Department of Transportation Mobility Performance Report 2011
FIGURE 3—2
EMPLOYMENT AND UNEMPLOYMENT, BY COUNTY, 2010—21011

48
California Department of Transportation Mobility Performance Report 2011
3.3 TRAVEL DEMAND
Vehicle Miles of Travel, 2011: 8.1 billion miles Absolute and Percentage Change over
2010: 8.2 million VMT increase; a 0.1% increase over 2010
Peak Travel Month, Percentage Change over 2010:
August, 716.7 million miles, a 0.2% increase over 2010
Monthly Trend Figure 3-3
TOTAL VEHICLE MILES OF TRAVEL,BY MONTH, 2010–2011
County Trend
Figure 3-4 TOTAL VEHICLE MILES OF TRAVEL, BY COUNTY, 2010–2011
0
100
200
300
400
500
600
700
800
900
Jan Feb Mar Apr May Jun Jul Aug Sep Oct Nov Dec
2010 2011
Miles (Millions)
0
1
2
3
4
5 2010 2011
Miles (Billions)

49
California Department of Transportation Mobility Performance Report 2011
3.4 TRAFFIC CONGESTION
3.4.1. Total and Average Vehicle Hours of Delay at 35 and 60 Miles per Hour
3.4.1.1 Delay at 35 Miles per Hour
Vehicle Hours of Delay, 35 miles per hour:
3 million hours, a 0.3% decrease over 2010
Average Non-Holiday Weekday Delay, 35:
9,887 hours, a 2.9% increase over 2010
Percentage of Statewide VHD at 35mph:
3.5%, a 0.4% increase over 2010
Figure 3-5
TOTAL VEHICLE HOURS OF DELAY AT 35 MILES PER HOUR, BY MONTH, 1010—2011
0
50
100
150
200
250
300
350
400
Jan Feb Mar Apr May Jun Jul Aug Sep Oct Nov Dec
2010 2011
Hours (Thousands)

50
California Department of Transportation Mobility Performance Report 2011
Figure 3-6 AVERAGE NON-HOLIDAY WEEKDAY VEHICLE HOURS OF DELAY AT 35
MILES PER HOUR, BY MONTH, 2010–2011
3.4.1.2 Delay at 60 Miles per Hour
Vehicle Hours of Delay, 60 miles per hour:
8 million hours, a 15.1% decrease over 2010
Average Non-Holiday Weekday Delay, 60:
26,130 hours, a 12.5% decrease over 2010
Percentage of Statewide VHD at 60mph: 3.9%, a 0.3% decrease over 2010
Figure 3-7 TOTAL VEHICLE HOURS OF DELAY AT 60 MILES PER HOUR,
BY MONTH, 2010–2011
0
3
6
9
12
15
Jan Feb Mar Apr May Jun Jul Aug Sep Oct Nov Dec
2010 2011
Hours (Thousands)
0.0
0.2
0.4
0.6
0.8
1.0
1.2
Jan Feb Mar Apr May Jun Jul Aug Sep Oct Nov Dec
2010 2011
Hours (Millions)

51
California Department of Transportation Mobility Performance Report 2011
Figure 3-8 AVERAGE NON-HOLIDAY WEEKDAY VEHICLE HOURS OF DELAY AT
60 MILES PER HOUR, BY MONTH, 2010–2011
3.4.2. Average Vehicle Hours of Delay by Day of Week
Most Congested Day of the Week, 60 mph: Friday, 29,957 hours, a 19% decrease over 2010
Highest Absolute Change in Delay, 60mph: Friday, 7,018 VHD decrease, a 19% decrease over 2010
Highest Percentage Change in Delay Sunday/Holiday,5,903 VHD decrease, a 35% decrease over 2010
Delay at 60 miles per hour Figure 3-9
AVERAGE VEHICLE HOURS OF DELAY AT 60 MILES PER HOUR, BY DAY OF WEEK, 2010–2011
0
10
20
30
40
50
Jan Feb Mar Apr May Jun Jul Aug Sep Oct Nov Dec
2010 2011
Hours (Thousands)
0
5
10
15
20
25
30
35
40
Mon Tue Wed Thu Fri Sat Sun/Hol
2010 2011
Hours (Thousands)
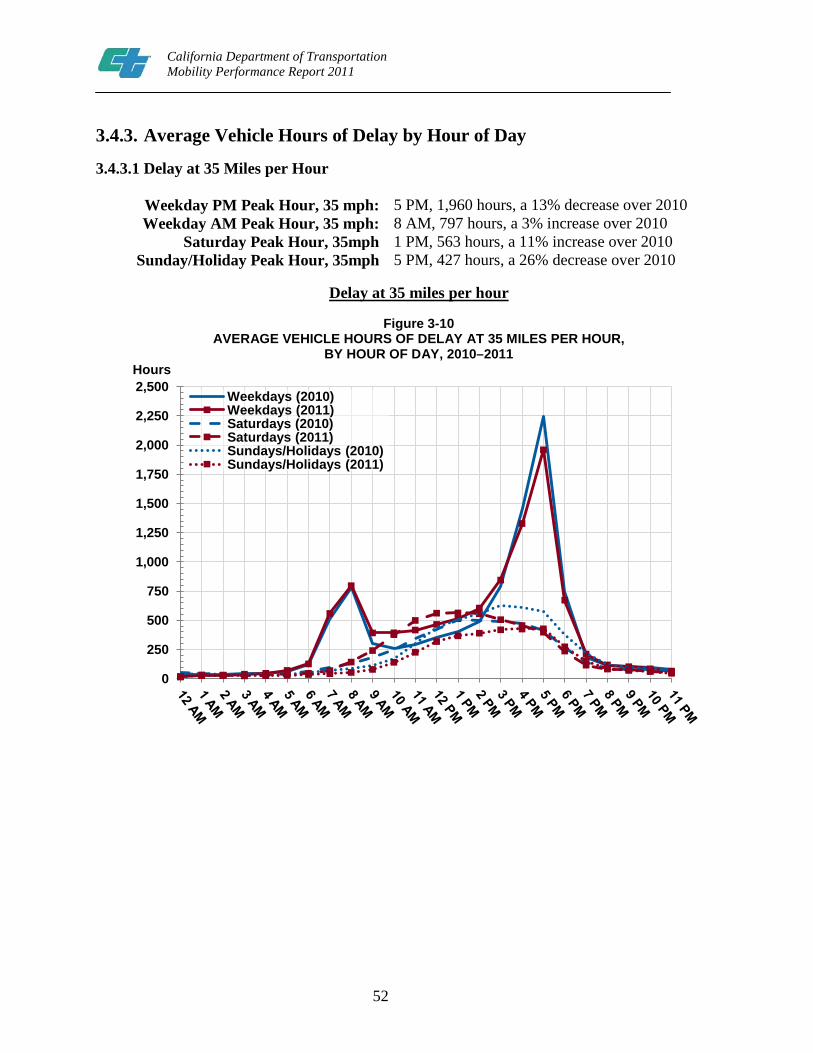
52
California Department of Transportation Mobility Performance Report 2011
3.4.3. Average Vehicle Hours of Delay by Hour of Day
3.4.3.1 Delay at 35 Miles per Hour
Weekday PM Peak Hour, 35 mph: 5 PM, 1,960 hours, a 13% decrease over 2010 Weekday AM Peak Hour, 35 mph: 8 AM, 797 hours, a 3% increase over 2010
Saturday Peak Hour, 35mph 1 PM, 563 hours, a 11% increase over 2010 Sunday/Holiday Peak Hour, 35mph 5 PM, 427 hours, a 26% decrease over 2010
Delay at 35 miles per hour
Figure 3-10 AVERAGE VEHICLE HOURS OF DELAY AT 35 MILES PER HOUR,
BY HOUR OF DAY, 2010–2011
0
250
500
750
1,000
1,250
1,500
1,750
2,000
2,250
2,500 Weekdays (2010) Weekdays (2011) Saturdays (2010) Saturdays (2011) Sundays/Holidays (2010) Sundays/Holidays (2011)
Hours

53
California Department of Transportation Mobility Performance Report 2011
3.4.3.2 Delay at 60 Miles per Hour
Weekday PM Peak Hour, 60 mph 5 PM, 4,238 hours, a 15% decrease over 2010 Weekday AM Peak Hour, 60 mph 8AM, 2,095 hours, a 11% decrease over 2010
Saturday Peak Hour, 60mph 1 PM, 1,340 hours, a 11% decrease over 2010 Sunday/Holiday Peak Hour, 60mph 3 PM, 1,072 hours, a 36% decrease over 2010
Delay at 60 miles per hour
Figure 3-11 AVERAGE VEHICLE HOURS OF DELAY AT 60 MILES PER HOUR,
BY HOUR OF DAY, 2010–2011
0
1,000
2,000
3,000
4,000
5,000
6,000 Hours
Weekdays (2010) Weekdays (2011) Saturdays (2010) Saturdays (2011) Sundays/Holidays (2010) Sundays/Holidays (2011)
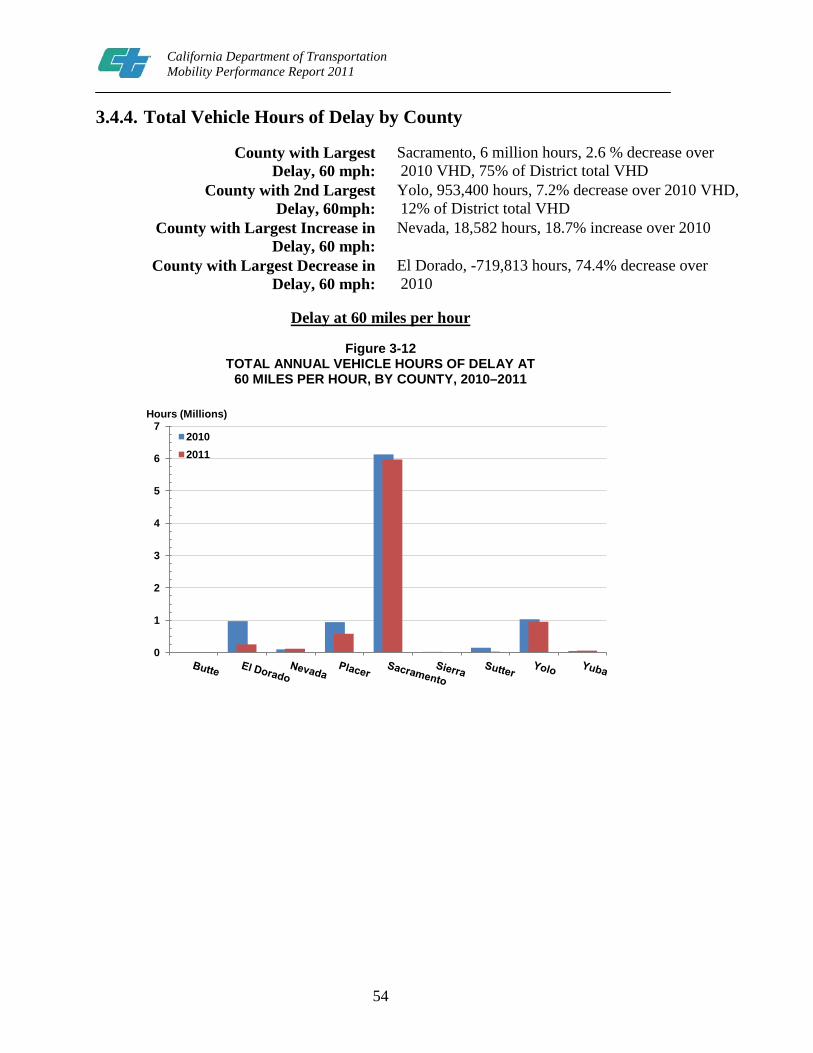
54
California Department of Transportation Mobility Performance Report 2011
3.4.4. Total Vehicle Hours of Delay by County
County with Largest Delay, 60 mph:
Sacramento, 6 million hours, 2.6 % decrease over 2010 VHD, 75% of District total VHD
County with 2nd Largest Delay, 60mph:
Yolo, 953,400 hours, 7.2% decrease over 2010 VHD, 12% of District total VHD
County with Largest Increase in Delay, 60 mph:
Nevada, 18,582 hours, 18.7% increase over 2010
County with Largest Decrease in Delay, 60 mph:
El Dorado, -719,813 hours, 74.4% decrease over 2010
Delay at 60 miles per hour
Figure 3-12 TOTAL ANNUAL VEHICLE HOURS OF DELAY AT
60 MILES PER HOUR, BY COUNTY, 2010–2011
0
1
2
3
4
5
6
7 Hours (Millions)
2010 2011

55
California Department of Transportation Mobility Performance Report 2011
3.4.5. Lost Productivity
AM Peak: 6.5 miles, 49% decrease over 2010
Off-Peak Day: 6.8 miles, 49.8% decrease over 2010
PM Peak: 17.6 miles, 37.4% decrease over 2010
Off-Peak Night: 5.1 miles, 47.8% decrease over 2010
Lost Lane Miles at 35 miles per hour
Figure 3-13 AVERAGE NON-HOLIDAY WEEKDAY EQUIVALENT LOST LANE MILES
0
5
10
15
20
25
30
AM Peak (6 AM to 10 AM)
Off-Peak Day (10 AM to 3 PM)
PM Peak (3 PM to 7 PM)
Off-Peak Night (7 PM to 6 AM)
Miles
2010
2011
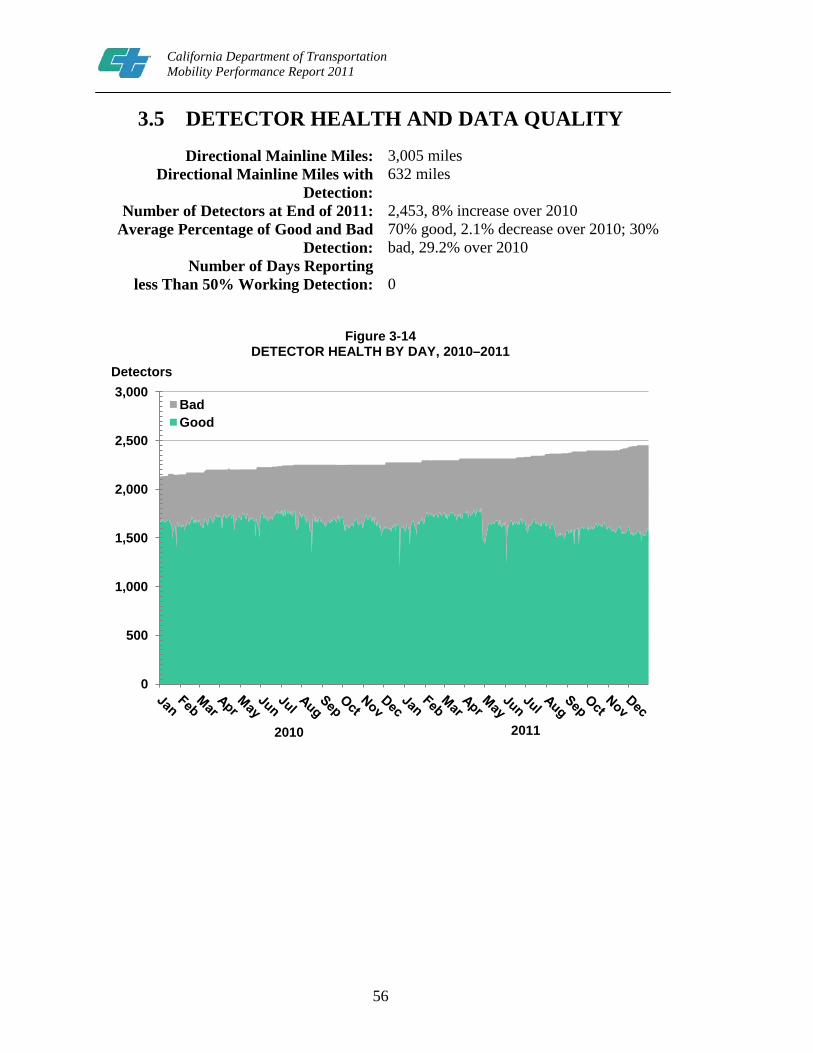
56
California Department of Transportation Mobility Performance Report 2011
3.5 DETECTOR HEALTH AND DATA QUALITY
Directional Mainline Miles: 3,005 miles Directional Mainline Miles with
Detection: 632 miles
Number of Detectors at End of 2011: 2,453, 8% increase over 2010 Average Percentage of Good and Bad
Detection: 70% good, 2.1% decrease over 2010; 30% bad, 29.2% over 2010
Number of Days Reporting less Than 50% Working Detection:
0
Figure 3-14
DETECTOR HEALTH BY DAY, 2010–2011
0
500
1,000
1,500
2,000
2,500
3,000 Bad Good
2011 2010
Detectors

57
California Department of Transportation Mobility Performance Report 2011
3.6 FREEWAY CONGESTION AND BOTTLENECK LOCATIONS
3.6.1. Congestion by Freeway
Congestion Contributed by Top Congested Freeways:
7,582,622 hours, 95% of total VHD in 2011
Table 3–3 DISTRICT 3 TOP CONGESTED FREEWAYS, 2010–2011
Route County Vehicle Hours of Delay
at 60 mph Difference
(2011 - 2010) Rank
2010 2011 Absolute % 2010 2011 SR–99 Sacramento 2,012,401 1,710,595 -301,807 -15.0 1 1 I–5 Sacramento 1,060,060 1,131,991 71,931 6.8 3 2 US–50 Sacramento 1,198,593 1,121,970 -76,623 -6.4 2 3 I–80 Sacramento 954,786 1,042,897 88,111 9.2 5 4 SR–51 Sacramento 898,803 959,693 60,890 6.8 6 5 I–80 Yolo 649,350 550,135 -99,215 -15.3 7 6 I–80 Placer 527,435 446,213 -81,222 -15.4 8 7 US–50 El Dorado 966,972 247,159 -719,813 -74.4 4 8 I–5 Yolo 214,344 240,054 25,710 12.0 10 9 I–80 Nevada 99,336 117,917 18,581 18.7 13 10
TOTALS 8,582,080 7,568,622 -1,013,458 -11.8 Numbers may not sum to total due to rounding.

58
California Department of Transportation Mobility Performance Report 2011
3.6.2. Bottleneck Locations
Total Delay, All AM Bottlenecks, 2011: 116,676 hours Top Bottleneck Delay, AM, 2011: 116,676 hours
Percentage Top Bottleneck Delay of Total Bottleneck Delay, AM, 2011: 100%
Table 3–4 (A) DISTRICT 3 TOP BOTTLENECKS, AM PEAK PERIOD, 2011
Rank County City Freeway CA Postmile
Approximate Location
Average Extent (miles)
Total Delay
(hours)
Average Daily Delay
(hours)
Average Duration (hours)
% of Days
Active
1 Sacramento Sacramento SR99–N 23.42 8th Ave. Ped Overcrossing 1.22 24,541 186 0.9 53%
2 Sacramento Sacramento SR99–N 21 47th Ave. 1.20 22,691 109 1.1 83%
3 Sacramento Sacramento SR51–S 7.569 Auburn Blvd. 1.42 17,355 155 1.2 45%
4 Sacramento Elk Grove SR99–N 16.293 Calvine Rd. 1.72 15,610 112 1.1 55%
5 Sacramento Sacramento US50–W R3.8 Howe Ave. 1.43 13,720 137 0.9 40%
6 Sacramento Sacramento I80–W 16.5 Antelope Rd. 0.81 12,479 109 1.5 45%
7 Sacramento Sacramento I80–E M2.8 San Juan Rd. Overcrossing 0.90 10,281 161 5.0 25%
Total Delay, All PM Bottlenecks, 2011: 724,539 hours Top Bottleneck Delay, PM, 2011: 568,846 hours
Percentage Top Bottleneck Delay of Total Bottleneck Delay, PM, 2011: 79%
Table 3–4 (B) DISTRICT 3 TOP BOTTLENECKS, PM PEAK PERIOD, 2011
Rank County City Freeway CA Postmile
Approximate Location
Average Extent (miles)
Total Delay
(hours)
Average Daily Delay
(hours)
Average Duration (hours)
% of Days
Active
1 Sacramento Sacramento I80-E M5 Northgate Blvd. 2.45 122,30
2 520 1.3 94%
2 Sacramento Sacramento SR99-S 18.3 North of Mack Rd 2.09 75,137 485 2.5 62%
3 Sacramento Sacramento SR51-N 5.1 North of El
Camino Ave 1.75 70,192 319 1.5 88%
4 Sacramento Sacramento SR51-N 2 North of A St. 1.43 60,387 263 1.3 92%
5 Sacramento Sacramento SR99-S 18.61 South of Florin Rd 3.50 58,098 880 2.7 26%
6 Sacramento Sacramento SR99-S 18.944 South of Florin Rd 1.93 41,764 227 1.4 73%
7 Sacramento Sacramento US50-W R.595 Stockton Blvd. 1.35 40,981 238 1.2 59%
8 Sacramento Sacramento SR51-N 1.5 30th & E St. 0.99 33,520 148 0.9 90%
9 Sacramento Sacramento US50-E R1.453 48th St. 1.85 33,390 290 1.1 46%
10 Sacramento Sacramento SR51-S 3.32 Exposition Blvd. 0.94 33,075 180 1.9 73%

59
California Department of Transportation Mobility Performance Report 2011
Figure 3-15 (A). BOTTLENECKS AND CONGESTED SEGMENTS, AM PEAK PERIOD, 2011

60
California Department of Transportation Mobility Performance Report 2011
Figure 3-15 (B). BOTTLENECKS AND CONGESTED SEGMENTS, PM PEAK PERIOD, 2011

61
California Department of Transportation Mobility Performance Report 2011
Chapter 4
4.1 SUMMARY ANALYSIS Caltrans District 4 is comprised of nine different counties including Alameda,
Contra Costa, Marin, Napa, San Francisco, San Mateo, Santa Clara, Solano, and Sonoma. Located in the San Francisco Bay Area, District 4 is home to the second largest metropolitan area in California. This district has a population of 7.25 million people and represents 19% of California’s overall population. Between 2010 and 2011, District 4 has seen a population increase of 0.8%. The amount of roadway congestion has noticeably increased due to a decline in the unemployment rate.
In 2011, two out of every five jobs created in California were created in District 4, the Bay Area; with 71,000 more jobs than in 2010. The District-wide unemployment rate dropped from 10.6% in 2010 to 9.6% in 2011. The unemployment rate was lower in counties in the Western Bay Area which consist of San Francisco County at 8.6%, San Mateo County at 7.9% and Marin County at 7.4%.
District 4’s Vehicle Miles Traveled (VMT) increased by 208.1 million in 2011.The most noticeable increases in VMT came from San Francisco County which increased by 5.9%, San Mateo County by 2.3%, and Marin by 1.8%. All other counties∗ show a small decrease in VMT. VMT increased 0.8% District-wide.
The economic recovery from the Great Recession of 2008-2009 is the greatest factor contributing to District-wide traffic congestion. Vehicle Hours of Delay (VHD) at 35 miles per hour (VHD35), a measure of severe congestion, increased by 18.3% in 2011. Vehicle Hours of Delay at 60 miles per hour (VHD60), a measure of moderate congestion, increased by 16.5%. District-wide VHD60 measured in 2011 accounts for 26% of California’s total VHD60. The three counties with the largest VHD60 include Alameda, Santa Clara, and Contra Costa Counties. These counties account for 69% of District 4’s VHD.
In 2011, District 4 maintained and operated 2,872 directional mainline miles. 1,243 of those miles had detection. The number of detectors for 2011 was 7,301, representing an increase of 11% from the previous year. Of those detectors, 54% operated in good condition, an decrease of 6.3% from the previous year. The number of individual detectors reporting less than 50% working detection was 61. The increase in detection for District 4 can be attributed to the addition of freeway lanes and new detector deployments.
∗ Napa County is excluded from our analysis due to insufficient detection.

62
California Department of Transportation Mobility Performance Report 2011
The counties that contribute to bottlenecks are Alameda, Santa Clara, and Contra Costa counties. Nine of the Top 10 morning (AM) bottlenecks are within Alameda, Santa Clara, and Contra Costa Counties. Six of the Top 10 afternoon (PM) bottlenecks are within Alameda, Santa Clara, and Contra Costa Counties. Despite major contributors to bottlenecks and congestion, District 4 has made significant progress in projects to alleviate congestion.
One of the more notable projects is the High Occupancy Vehicle (HOV) lane from Hacienda Avenue to Greenville Road on Eastbound I-580 that opened on November 10, 2010. Traffic congestion relieved during the PM peak was significant. This stretch of roadway had the Top 4th, 6th, and 14th PM peak bottlenecks in the District in 2010. Since the completion of the project, these bottlenecks are not on the Top 20 spots on the 2011 PM bottleneck list. While the traffic flow from I-680 to Greenville Road is much improved, a new bottleneck has emerged downstream which includes the incline to Altamont Pass east of Greenville Rd, the 23rd top bottleneck in 2011.
Another project that brought congestion relief to a heavily traveled corridor is an US 101 auxiliary lane between 3rd Avenue in the City of San Mateo and Millbrae Avenue in the City of Millbrae. Opened on July 22, 2010, auxiliary lanes are an effective tool to reduce traffic congestion from merging and weaving conflicts.
To alleviate traffic congestion, the I-680 Express Lane was also created. This project uses dynamic pricing to maximize the efficiency of I-680. This project also encourages the use of buses and carpools, and added an HOV/high occupancy toll (HOT) lane to increase throughput on the facility. During peak periods, when there is more traffic in the Express Lane, the toll is higher. The minimum toll during the morning commute is $1. During off-peak periods, when fewer vehicles are using the lane, the toll is lower. By changing the toll in response to the level of demand, the Express Lane keeps traffic flowing smoothly. Toll revenue will pay for operating and maintaining the lane, transit service on the I-680 corridor, and building additional carpool lanes or Express Lanes on the I-680 corridor. Opened on September 20, 2010, the Express Lane has eliminated the majority of traffic congestion along the 14-mile stretch of southbound I-680 between Rte 84 and Rte 237 during the morning peak hour in 2011.

63
California Department of Transportation Mobility Performance Report 2011
4.2 DESCRIPTIVE STATISTICS
District Headquarters: Oakland
Counties: Alameda, Contra Costa, Marin, Napa, San Francisco, San Mateo, Santa Clara, Solano, Sonoma
Counties without Detection: Napa has limited detection
Population: 7,249,144, a 0.8% increase over 2010 Population as a Percentage of Statewide: 19.2%
Table 4-1
POPULATION ESTIMATES, ABSOLUTE, AND PERCENT CHANGE, 2010–2011
County 2010 Revised† 2011‡
Difference (2011 - 2010 Revised)
Population Population Absolute % Alameda 1,517,756 1,530,176 12,420 0.8% Contra Costa 1,056,306 1,066,602 10,296 1.0% Marin 253,040 253,374 334 0.1% Napa 137,232 137,731 499 0.4% San Francisco 808,768 816,311 7,543 0.9% San Mateo 722,372 727,795 5,423 0.8% Santa Clara 1,794,337 1,813,696 19,359 1.1% Solano 413,391 415,787 2,396 0.6% Sonoma 485,082 487,672 2,590 0.5%
Total 7,188,284 7,249,144 60,860 0.8% Sources †: State of California, Department of Finance, E-1 Population Estimates for Cities, Counties, and the State with Annual Percent Change — January 1, 2011 and 2012. Sacramento, California, May 2012. ‡: State of California, Department of Finance, E-1 Population Estimates for Cities, Counties, and the State with Annual Percent Change — January 1, 2012 and 2013. Sacramento, California, May 2013. Numbers may not sum to total due to rounding.

64
California Department of Transportation Mobility Performance Report 2011
Figure 4-1 DISTRICT 4 POPULATION, BY COUNTY, 2010–2011
0.0
0.5
1.0
1.5
2.0 2010 Revised 2011
Millions

65
California Department of Transportation Mobility Performance Report 2011
Employment, 2011 Monthly Average: 3,362,567 Unemployment Rate, 2011 Monthly Average: 9.6%, 0.9% decrease over 2010
Table 4-2
EMPLOYMENT, UNEMPLOYMENT, AND PERCENT CHANGE, BY COUNTY, 2010–2011
County
Unemployment Rate (%) , 2010
Revised
Unemployment Rate (%), 2011
Percent Change in Rate of Unemployment
(2011 - 2010)
Alameda 11.3% 10.4% -0.9% Contra Costa 11.1% 10.4% -0.7% Marin 8.0% 7.4% -0.6% Napa 9.7% 9.1% -0.6% San Francisco 9.6% 8.6% -1.0% San Mateo 8.8% 7.9% -0.9% Santa Clara 11.0% 9.8% -1.2% Solano 12.0% 11.5% -0.6% Sonoma 10.5% 9.8% -0.6% District Total 10.6% 9.6% -0.9%
Data not seasonally adjusted. Data revised by source. Source: State of California, Employment Development Department (EDD), Labor Market Information Division, downloaded Sept. 9, 2013. Numbers may not sum to total due to rounding.
Figure 4-2
DISTRICT 4 EMPLOYMENT AND UNEMPLOYMENT, BY COUNTY, 2010–2011
0
200
400
600
800
1,000
Alameda Contra Costa Marin Napa San Francisco San Mateo Santa Clara Solano Sonoma
UnemploymentEmployment
Thousands

66
California Department of Transportation Mobility Performance Report 2011
4.3 TRAVEL DEMAND Vehicle Miles of Travel, 2011: 26.2 billion miles
Absolute and Percentage Change over 2010: 208.1 million VMT increase; a 0.8% over 2010
Peak Travel Month, Percentage Change over 2010:
August, 2.3 billion miles, a 2.3% increase over 2010
Monthly Trend Figure 4-3
TOTAL VEHICLE MILES OF TRAVEL,BY MONTH, 2010–2011
County Trend
Figure 4-4 TOTAL VEHICLE MILES OF TRAVEL, BY COUNTY, 2010–2011
0.0
0.5
1.0
1.5
2.0
2.5
3.0
Jan Feb Mar Apr May Jun Jul Aug Sep Oct Nov Dec
2010 2011
Miles (Billions)
0
2
4
6
8
10 2010 2011
Miles (Millions)

67
California Department of Transportation Mobility Performance Report 2011
4.4 TRAFFIC CONGESTION
4.4.1. TOTAL AND AVERAGE VEHICLE HOURS OF DELAY AT 35 AND 60 MILES PER HOUR
4.4.1.1 Delay at 35 Miles per Hour
Vehicle Hours of Delay, 35 miles per hour: 23.5 million hours, 18.3% increase over 2010
Average Non-Holiday Weekday Delay, 35: 81,002 hours, 19.5% increase over 2010 Percentage of Statewide VHD at 35mph: 27.2%, 6.4% increase over 2010
Figure 4-5
TOTAL VEHICLE HOURS OF DELAY AT 35 MILES PER HOUR, BY MONTH, 2010–2011
0.0
0.5
1.0
1.5
2.0
2.5
3.0
Jan Feb Mar Apr May Jun Jul Aug Sep Oct Nov Dec
2010 2011
Hours (Millions)

68
California Department of Transportation Mobility Performance Report 2011
Figure 4-6
AVERAGE NON-HOLIDAY WEEKDAY VEHICLE HOURS OF DELAY AT 35 MILES PER HOUR, BY MONTH, 2010–2011
0
20
40
60
80
100
Jan Feb Mar Apr May Jun Jul Aug Sep Oct Nov Dec
2010 2011
Hours (Thousands)

69
California Department of Transportation Mobility Performance Report 2011
4.4.1.2 Delay at 60 Miles per Hour
Vehicle Hours of Delay, 60 miles per hour: 52.4 million hours, a 16.2% increase over 2010
Average Non-Holiday Weekday Delay, 60: 181,017 hours, a 16.5% increase over 2010 Percentage of Statewide VHD at 60mph: 25.7%, a 5.5% increase over 2010
Figure 4-7
TOTAL VEHICLE HOURS OF DELAY AT 60 MILES PER HOUR, BY MONTH, 2010–2011
Figure 4-8 AVERAGE NON-HOLIDAY WEEKDAY VEHICLE HOURS
OF DELAY AT 60 MILES PER HOUR, BY MONTH, 2010–2011
0
1
2
3
4
5
6
Jan Feb Mar Apr May Jun Jul Aug Sep Oct Nov Dec
2010 2011
Hours (Millions)
0
50
100
150
200
250
Jan Feb Mar Apr May Jun Jul Aug Sep Oct Nov Dec
2010 2011
Hours (Thousands)

70
California Department of Transportation Mobility Performance Report 2011
4.4.2. AVERAGE VEHICLE HOURS OF DELAY BY DAY OF WEEK
Most Congested Day of the Week, 60 mph: Thursday, 209,881 hours, a 23% increase over 2010
Highest Absolute Change in Delay, 60mph: Thursday, 39,890 VHD increase, a 23% increase over 2010
Highest Percentage Change in Delay Thursday, 39,890 VHD increase, a 23% increase over 2010
Delay at 60 miles per hour
Figure 4-9 AVERAGE VEHICLE HOURS OF DELAY AT 60 MILES PER
HOUR, BY DAY OF WEEK, 2010–2011
0
50
100
150
200
250
Mon Tue Wed Thu Fri Sat Sun/Hol
2010 2011
Hours (Thousands)

71
California Department of Transportation Mobility Performance Report 2011
4.4.3. AVERAGE VEHICLE HOURS OF DELAY BY HOUR OF DAY
4.4.3.1 Delay at 35 Miles per Hour
Weekday PM Peak Hour, 35 mph: 5 PM, 13,596 hours, a 13% increase over 2010 Weekday AM Peak Hour, 35 mph: 8 AM, 9,824 hours, a 21% increase over 2010
Saturday Peak Hour, 35mph 5 PM, 3,489 hours, a 6% increase over 2010 Sunday/Holiday Peak Hour, 35mph 5 PM, 2,708 hours, a 14% increase over 2010
Delay at 35 miles per hour
Figure 4-10 AVERAGE VEHICLE HOURS OF DELAY AT 35 MILES PER
HOUR, BY HOUR OF DAY, 2010–2011
0
2
4
6
8
10
12
14
16 Weekdays (2010) Weekdays (2011) Saturdays (2010) Saturdays (2011) Sundays/Holidays (2010) Sundays/Holidays (2011)
Hours (Thousands)

72
California Department of Transportation Mobility Performance Report 2011
4.4.3.2 Delay at 60 Miles per Hour
Weekday PM Peak Hour, 60 mph: 5 PM, 25,797 hours, a 11% increase over 2010 Weekday AM Peak Hour, 60 mph: 8 AM, 20,063 hours, a 14% increase over 2010
Saturday Peak Hour, 60mph 3 PM, 7,096 hours, a 15% increase over 2010 Sunday/Holiday Peak Hour, 60mph 5 PM, 5,451 hours, a 10% increase over 2010
Delay at 60 miles per hour
Figure 4-11 AVERAGE VEHICLE HOURS OF DELAY AT 60 MILES PER HOUR,
BY HOUR OF DAY, 2010–2011
0
5
10
15
20
25
30 Weekdays (2010) Weekdays (2011) Saturdays (2010) Saturdays (2011) Sundays/Holidays (2010) Sundays/Holidays (2011)
Hours (Thousands)

73
California Department of Transportation Mobility Performance Report 2011
4.4.4. TOTAL VEHICLE HOURS OF DELAY BY COUNTY
County with Largest Delay, 60 mph:
Alameda, 18.3 million hours, a 22.7 increase over 2010 VHD, 35% of District total VHD
County with 2nd Largest Delay, 60mph:
Santa Clara, 11 million hours, a 23.4% increase over 2010 VHD, 21% of District total VHD
County with Largest Increase in Delay, 60 mph:
Alameda, 3.4 million hours, a 22.7% increase over 2010
County with Largest Decrease in Delay, 60 mph:
San Mateo, -397,251 hours, a 7.5% decrease over 2010
Delay at 60 miles per hour
Figure 4-12 TOTAL ANNUAL VEHICLE HOURS OF DELAY AT 60 MILES PER HOUR, BY COUNTY, 2010–2011
0
5
10
15
20 2010 2011
Hours (Millions)

74
California Department of Transportation Mobility Performance Report 2011
4.4.5. LOST PRODUCTIVITY
AM Peak: 70.8 miles, a 14.3% increase over 2010
Off-Peak Day: 30.9 miles, a 6.3% increase over 2010
PM Peak: 122.5 miles, a 9.3% increase over 2010
Off-Peak Night: 9.7 miles, a 1% decrease over 2010
Lost Lane Miles at 35 miles per hour
Figure 4-13 AVERAGE NON-HOLIDAY WEEKDAY EQUIVALENT LOST LANE MILES
0
20
40
60
80
100
120
140
AM Peak (6 AM to 10 AM)
Off-Peak Day (10 AM to 3 PM)
PM Peak (3 PM to 7 PM)
Off-Peak Night (7 PM to 6 AM)
Miles
2010 2011

75
California Department of Transportation Mobility Performance Report 2011
4.5 DETECTOR HEALTH AND DATA QUALITY
Directional Mainline Miles: 2,872 miles Directional Mainline Miles with
Detection: 1,243 miles
Number of Detectors at End of 2011: 7,301, an 11% increase over 2010 Average Percentage of Good and Bad
Detection: 54% good, a 6.3% decrease over 2010; 46.3% bad, a 28.% increase over 2010
Number of Days Reporting less Than 50% Working Detection:
61
Figure 4-14 DETECTOR HEALTH BY DAY, 2010–2011
0
1,000
2,000
3,000
4,000
5,000
6,000
7,000
8,000 Bad Good
Detectors
2011 2010 2011 2010 2011 2010 2011 2010

76
California Department of Transportation Mobility Performance Report 2011
4.6 FREEWAY CONGESTION AND BOTTLENECK LOCATIONS
4.6.1. CONGESTION BY FREEWAY
Congestion Contributed by Top Ten Congested Freeways:
34,787,215 hours, 66% of total VHD in 2011
Table 4-3
TOP CONGESTED FREEWAYS, 2010–2011
Route County Vehicle Hours of Delay
at 60 mph Difference
(2011 - 2010) Rank
2010 2011 Absolute % 2010 2011
I–580 Alameda 5,045,324 6,175,539 1,130,215 22% 1 1 I–880 Alameda 4,606,503 5,065,271 458,768 10% 2 2 SR–101 Santa Clara 3,516,435 5,050,585 1,534,149 44% 3 3 SR–101 San Mateo 3,132,949 4,029,135 896,186 29% 4 4 I–80 Solano 2,494,442 3,399,152 904,710 36% 6 5 I–80 Alameda 2,628,544 2,804,222 175,678 7% 5 6 I–680 Contra Costa 1,663,894 2,201,998 538,104 32% 8 7 I–80 San Francisco 1,337,088 2,037,020 699,932 52% 13 8 SR–4 Contra Costa 1,801,767 2,027,503 225,736 13% 7 9 SR–101 Marin 1,396,731 2,000,121 603,390 43% 12 10 TOTALS 27,623,676 34,790,544 7,166,868 26%
Numbers may not sum to total due to rounding.

77
California Department of Transportation Mobility Performance Report 2011
4.6.2. BOTTLENECK LOCATIONS
Total Delay, All AM Bottlenecks, 2011: 3,856,013 hours Top Bottleneck Delay, AM, 2011: 1,242,292 hours Percentage Top Bottleneck Delay of Total Bottleneck Delay, AM,
2011: 32%
Table 4–4 (A) DISTRICT 4 TOP BOTTLENECKS, AM PEAK PERIOD, 2011
Rank County City Freeway
CA Post-mile
Approximate Location
Average Extent (miles)
Total Delay
(hours)
Average Daily Delay
(hours)
Average Duration (hours)
% of Days
Active
1 Santa Clara San Jose SR237–W 8.03 Zanker Rd. 1.10 178,564 794 3.0 89%
2 Alameda Berkeley I80–W 6.60 Gilman St. 3.04 171,518 1,151 1.8 59%
3 Alameda unincorporated SR238–N 15.41 E. 14th St. 1.11 140,332 731 2.1 76%
4 San Mateo San Mateo SR101–S 11.06 E. Hillsdale Blvd. 2.51 134,092 621 1.5 87%
5 Alameda Livermore I580–W 10.75 First St. 2.48 122,335 691 2.1 71%
6 Santa Clara San Jose SR101–N 40.81 W. Trimble Rd. 1.85 106,146 485 2.2 87%
7 Contra Costa Antioch SR4–W 26.44 Somersville Rd. 1.44 105,160 474 4.2 89%
8 Alameda Livermore I580–W 12.57 Livermore Ave. 1.75 100,642 521 2.3 76%
9 Alameda Fremont I880–S 11.42 Alvarado Blvd / Fremont Blvd. 2.03 93,314 432 2.0 87%
10 Santa Clara Los Gatos SR85–N 11.16 S. Winchester Blvd. 2.02 90,189 472 1.9 77%
Total Delay, All PM Bottlenecks, 2011: 7,615,201 hours Top Bottleneck Delay, PM, 2011: 2,204,150 hours Percentage Top Bottleneck Delay of Total Bottleneck Delay, PM,
2011: 29%
Table 4–4 (B) DISTRICT 4 TOP BOTTLENECKS, PM PEAK PERIOD, 2011
Rank County City Freeway
CA Post-mile
Approximate Location
Average Extent (miles)
Total Delay
(hours)
Average Daily Delay
(hours)
Average Duration (hours)
% of Days
Active
1 Contra Costa Pittsburg SR4–E 24.32 Loveridge Rd. 2.37 387,805 1,576 4.4 98%
2 Alameda Hayward I880–N 15.80 W. Tennyson Rd. 4.48 312,977 1,338 2.4 93%
3 Alameda Oakland SR24–E R5.75 Caldecott Tunnel 2.50 312,149 1,269 2.6 98%
4 Santa Clara Mountain
View SR101–S 49.50 Rengstoff Ave. 3.00 233,683 1,062 3.1 88%
5 Contra Costa Orinda SR24–W 1.11 Wilder Rd. 1.15 188,890 930 2.9 81%
6 San
Francisco San Francisco I80–E 7.84 Treasure Island 2.53 167,410 946 2.2 71%
7 Marin Corte Madera SR101–N 7.35 Tamalpais Dr. 1.95 166,718 712 2.4 93%
8 San Mateo San Mateo SR101–N 11.20 E. Hillsdale Blvd. 3.07 148,059 755 1.7 78%
9 San
Francisco San Francisco SR101–N 3.80 Mariposa St. 1.76 145,983 960 3.1 61%
10 Alameda Oakland I880–S 24.60 98th Ave. 2.31 140,478 611 2.3 92%

78
California Department of Transportation Mobility Performance Report 2011
Figure 4-15 (A)
BOTTLENECKS AND CONGESTED SEGMENTS, AM PEAK PERIOD, 2011

79
California Department of Transportation Mobility Performance Report 2011
Figure 4-15 (B) BOTTLENECKS AND CONGESTED SEGMENTS, PM PEAK PERIOD, 2011
80
California Department of Transportation Mobility Performance Report 2011
PAGE INTENTIONALLY LEFT BLANK

81
California Department of Transportation Mobility Performance Report 2011
Chapter 5
5.1 SUMMARY ANALYSIS Caltrans District 6 is composed of five different counties: Fresno, Kern, Kings*,
Madera, and Tulare. Fresno County, located in the heart of the San Joaquin Valley, is the 10th most populated county in the State with a 2011 population of 943,493. Kern County is number 11, with a 2011 population of 849,977. The district has a 2011 population of 2,549,109, which represents 6.8% of the State’s population. District 6 has seen a population increase of 0.8% between 2010 and 2011.
In District 6, the 2011 monthly employment average was 980,283. District-wide the unemployment rate dropped by 0.5%. The unemployment rate monthly average was 15.9%. The unemployment rate was highest in Tulare County at 16.7%; and was lowest in Kern County at 14.9%. The gain in population, along with a 0.5% decrease in unemployment are factors that contributed to a small (0.5%) increase in congestion, measured in Vehicle Miles of Travel (VMT) in the district.
In 2011, District 6 had a VMT of 2.3 billion miles. This was a VMT increase of 12 million. The most noticeable increases in VMT came from Fresno and Tulare counties. All other counties* show a small decrease in VMT. VMT increased 0.5% District-wide.
Vehicle Hours of Delay at 35 miles per hour (VHD35), a measure of severe congestion, decreased by 27.1% in 2011. Vehicle Hours of Delay at 60 miles per hour (VHD60), a measure of moderate congestion, decreased by 44.1%. District-wide VHD60 measured in 2011 accounts for 0.7% of California’s total VHD60. The county with the largest VHD60 was Fresno County. This county accounted for 46% of District 6’s VHD.
In 2011, District 6 maintained and operated 4,073 directional mainline miles. 195 of those miles had detection. The number of detectors in 2011 (646) remained the same as the previous year. Of those detectors, 86% operated in good condition, a decrease of 1.1% from 2010. In 2011, District 6 experienced copper wire theft at detection stations, causing the decrease in detection. In 2011, new detection stations were constructed that should have increased the number of directional mainline miles detected; however, a shortage of maintenance staff prevented these stations from coming online in 2011.
Most of the congestion in District 6 occurs on State Route (SR) 99 in Fresno and Kern counties, the two most populous counties in the district. SR-99 is the primary thoroughfare through the major cities in District 6. In 2011, several construction projects restricted capacity on SR-99 through Madera County; making this section of SR-99 the 2nd most congested freeway in the district, up from 7th in 2010. Also, a change in delay calculations in PeMS may have skewed data in the report. When the calculation change went online in August of 2011, there was a significant drop in delay.

82
California Department of Transportation Mobility Performance Report 2011
Although District 6 has recurring congestion, particularly on SR-99 and on local freeways in the cities of Fresno and Bakersfield, the district did not experience any bottleneck locations that meet the bottleneck criteria. Based on observations, the segments of roadway that had recurring congestion were small segments and during short periods of time during the AM and PM commutes, all within the cities of Fresno and Bakersfield.
*Kings County is excluded from District 6’s analysis due to lack of detection on State Highways in that county.
5.2. DESCRIPTIVE STATISTICS
District Headquarters: Fresno Counties: Fresno, Kern, Kings, Madera, Tulare
Counties without Detection: Kings
Population: 2,549,109, a 0.8% increase over 2010 Population as a Percentage of Statewide: 6.8%
Table 5-1
POPULATION ESTIMATES AND ABSOLUTE AND PERCENT CHANGE, 2010-2011
County 2010 Revised† 2011‡
Difference (2011 - 2010 Revised)
Population Population Absolute Percent Fresno 936,089 943,493 7,404 0.8% Kern 844,480 849,977 5,497 0.7% Kings 152,533 151,774 -759 -0.5% Madera 151,658 152,325 667 0.4% Tulare 445,183 451,540 6,357 1.4%
Total 2,529,943 2,549,109 19,166 0.8% Kings County does not participate in mobility performance reporting. Sources †: State of California, Department of Finance, E-1 Population Estimates for Cities, Counties, and the State with Annual Percent Change — January 1, 2011 and 2012. Sacramento, California, May 2012. ‡: State of California, Department of Finance, E-1 Population Estimates for Cities, Counties, and the State with Annual Percent Change — January 1, 2012 and 2013. Sacramento, California, May 2013. Numbers may not sum to total due to rounding.
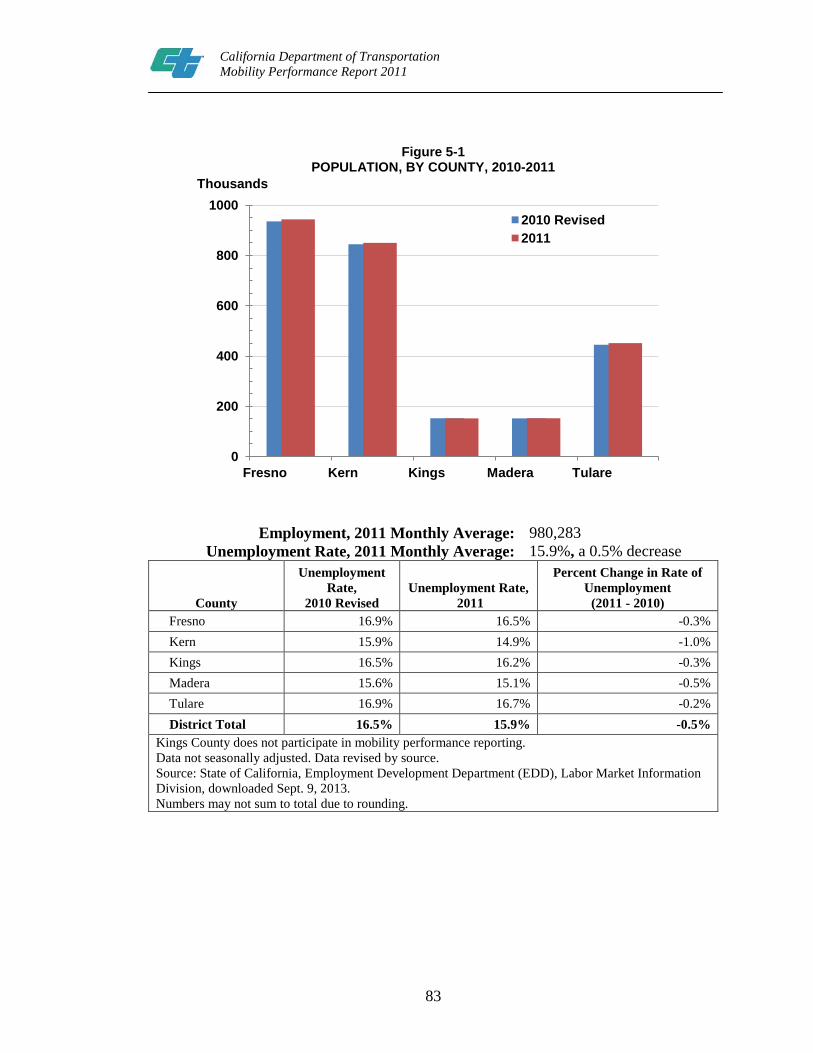
83
California Department of Transportation Mobility Performance Report 2011
Figure 5-1
POPULATION, BY COUNTY, 2010-2011
Employment, 2011 Monthly Average: 980,283 Unemployment Rate, 2011 Monthly Average: 15.9%, a 0.5% decrease
County
Unemployment Rate,
2010 Revised Unemployment Rate,
2011
Percent Change in Rate of Unemployment
(2011 - 2010) Fresno 16.9% 16.5% -0.3% Kern 15.9% 14.9% -1.0% Kings 16.5% 16.2% -0.3% Madera 15.6% 15.1% -0.5% Tulare 16.9% 16.7% -0.2% District Total 16.5% 15.9% -0.5%
Kings County does not participate in mobility performance reporting. Data not seasonally adjusted. Data revised by source. Source: State of California, Employment Development Department (EDD), Labor Market Information Division, downloaded Sept. 9, 2013. Numbers may not sum to total due to rounding.
0
200
400
600
800
1000
Fresno Kern Kings Madera Tulare
2010 Revised 2011
Thousands

84
California Department of Transportation Mobility Performance Report 2011
Figure 5-2
EMPLOYMENT AND UNEMPLOYMENT, BY COUNTY, 2010-2011
0
100
200
300
400
500
2010 2011 2010 2011 2010 2011 2010 2011 2010 2011
Fresno Kern Kings Madera TulareCounty
UnemploymentEmployment
Thousands

85
California Department of Transportation Mobility Performance Report 2011
5.3 TRAVEL DEMAND
Vehicle Miles of Travel, 2011: 2.3 billion miles Absolute and Percentage Change over 2010: 12 million VMT increase; a 0.5%
increase over 2010 Peak Travel Month, Percentage Change over
2010: August, 202.9 million miles, a 0.02% increase over 2010
Monthly Trend
Figure 5-3 TOTAL VEHICLE MILES OF TRAVEL,BY MONTH, 2010-2011
County Trend
Figure 5-4 TOTAL VEHICLE MILES OF TRAVEL, BY COUNTY, 2010-2011
0
50
100
150
200
250
Jan Feb Mar Apr May Jun Jul Aug Sep Oct Nov Dec
2010 2011
Miles (Millions)
0.0
0.5
1.0
1.5
Fresno Kern Madera Tulare
2010 2011
Miles (Billions) Miles (Billions)

86
California Department of Transportation Mobility Performance Report 2011
5.4 TRAFFIC CONGESTION
5.4.1. Total and Average Vehicle Hours of Delay
5.4.1.1 Delay at 35 Miles per Hour Vehicle Hours of Delay, 35 miles per hour: 319,932 hours, a 27.1% decrease over
2010 Average Non-Holiday Weekday Delay, 35: 1,004 hours, a 35.2% decrease over 2010
Percentage of Statewide VHD at 35mph: 0.4%, a0.1% decrease over 2010
Figure 5-5 TOTAL VEHICLE HOURS OF DELAY AT 35 MILES PER HOUR, BY MONTH, 2010-2011
0
10
20
30
40
50
60
70
Jan Feb Mar Apr May Jun Jul Aug Sep Oct Nov Dec
2010 2011
Hours (Thousands)

87
California Department of Transportation Mobility Performance Report 2011
Figure 5-6
AVERAGE NON-HOLIDAY WEEKDAY VEHICLE HOURS OF DELAY AT 35 MILES PER HOUR, BY MONTH, 2010-2011
5.4.1.2 Delay at 60 Miles per Hour Vehicle Hours of Delay, 60 miles per hour: 1.4 million hours, a 44.1% decrease over
2010 Average Non-Holiday Weekday Delay, 60: 4,543 hours, a 44.4% decrease over 2010
Percentage of Statewide VHD at 60mph: 0.7%, a 0.4% decrease over 2010
Figure 5-7 TOTAL VEHICLE HOURS OF DELAY AT 60 MILES PER HOUR, BY MONTH, 2010-2011
0.0
0.5
1.0
1.5
2.0
2.5
3.0
3.5
Jan Feb Mar Apr May Jun Jul Aug Sep Oct Nov Dec
2010 2011
Hours (Thousands)
0
100
200
300
400
Jan Feb Mar Apr May Jun Jul Aug Sep Oct Nov Dec
2010 2011
Hours (Thousands)

88
California Department of Transportation Mobility Performance Report 2011
Figure 5-8
AVERAGE NON-HOLIDAY WEEKDAY VEHICLE HOURS OF DELAY AT 60 MILES PER HOUR, BY MONTH, 2010-2011
0
3
6
9
12
15
Jan Feb Mar Apr May Jun Jul Aug Sep Oct Nov Dec
2010 2011
Hours (Thousands)
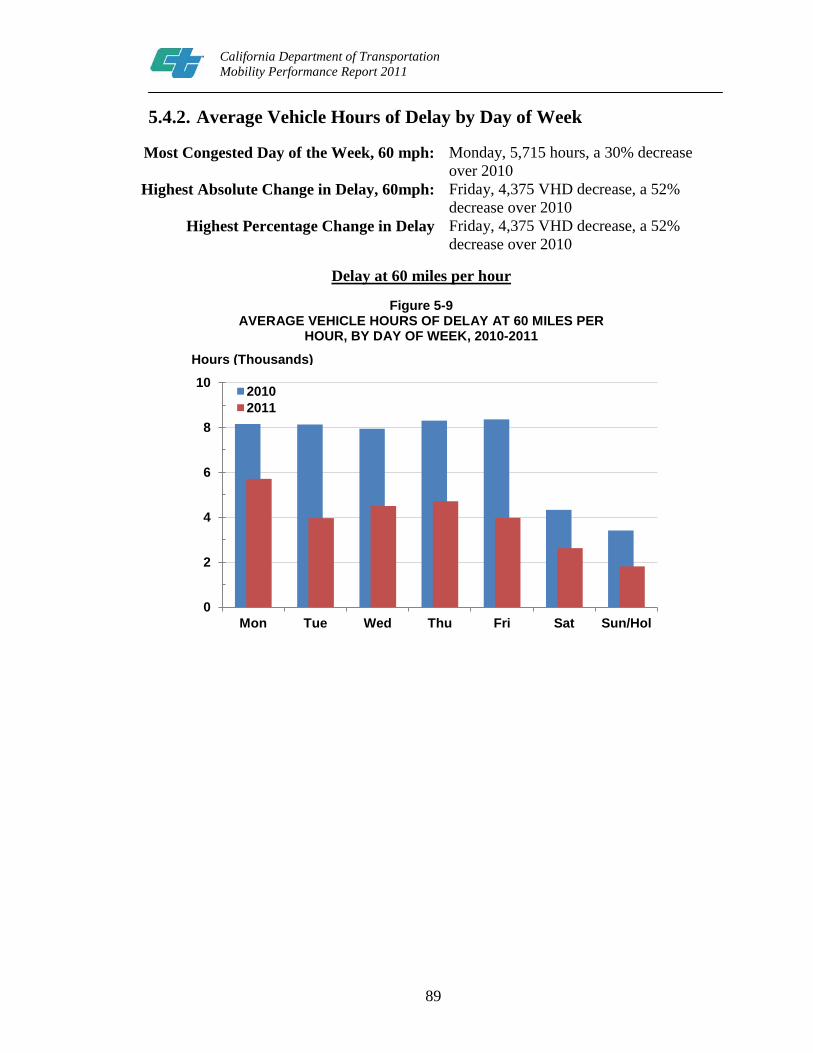
89
California Department of Transportation Mobility Performance Report 2011
5.4.2. Average Vehicle Hours of Delay by Day of Week
Most Congested Day of the Week, 60 mph: Monday, 5,715 hours, a 30% decrease over 2010
Highest Absolute Change in Delay, 60mph: Friday, 4,375 VHD decrease, a 52% decrease over 2010
Highest Percentage Change in Delay Friday, 4,375 VHD decrease, a 52% decrease over 2010
Delay at 60 miles per hour
Figure 5-9 AVERAGE VEHICLE HOURS OF DELAY AT 60 MILES PER
HOUR, BY DAY OF WEEK, 2010-2011
0
2
4
6
8
10
Mon Tue Wed Thu Fri Sat Sun/Hol
2010 2011
Hours (Thousands)

90
California Department of Transportation Mobility Performance Report 2011
5.4.3. Average Vehicle Hours of Delay by Hour of Day
5.4.3.1 Delay at 35 Miles per Hour
Weekday PM Peak Hour, 35 mph: 5 PM, 111 hours, a 27% decrease over 2010 Weekday AM Peak Hour, 35 mph: 8 AM, 47 hours, an 11% decrease over 2010
Saturday Peak Hour, 35mph 1 PM, 216 hours, a 260% increase over 2010 Sunday/Holiday Peak Hour, 35mph 8 PM, 43 hours, a 72% increase over 2010
Delay at 35 miles per hour
Figure 5-10 AVERAGE VEHICLE HOURS OF DELAY AT 35 MILES PER HOUR,
BY HOUR OF DAY, 2010-2011
0
50
100
150
200
250 Weekdays (2010) Weekdays (2011) Saturdays (2010) Saturdays (2011) Sundays/Holidays (2010) Sundays/Holidays (2011)
Hours

91
California Department of Transportation Mobility Performance Report 2011
5.4.3.2 Delay at 60 Miles per Hour
Weekday PM Peak Hour, 60 mph: 5 PM, 468 hours, a 34% decrease over 2010 Weekday AM Peak Hour, 60 mph: 7 AM, 246 hours, a 40% decrease over 2010
Saturday Peak Hour, 60mph 1 PM, 352 hours, a 6% increase over 2010 Sunday/Holiday Peak Hour, 60mph 5 PM, 119 hours, a 50% decrease over 2010
Delay at 60 miles per hour
Figure 5-11 AVERAGE VEHICLE HOURS OF DELAY AT 60 MILES PER HOUR,
BY HOUR OF DAY, 2010-2011
0
100
200
300
400
500
600
700
800 Hours
Weekdays (2010) Weekdays (2011) Saturdays (2010) Saturdays (2011) Sundays/Holidays (2010) Sundays/Holidays (2011)

92
California Department of Transportation Mobility Performance Report 2011
5.4.4. Total Vehicle Hours of Delay by County
County with Largest Delay, 60 mph:
Fresno, 640,815 hours, a 49.1% decrease over 2010 VHD, 46% of District total VHD
County with 2nd Largest Delay, 60mph:
Kern, 359,963 hours, a 62.3% decrease over 2010 VHD, 26% of District total VHD
County with Largest Increase in Delay, 60 mph:
Madera, 123,082 hours, a 94.6% increase over 2010
County with Largest Decrease in Delay, 60 mph:
Fresno, -617,752 hours, a 49.1% decrease over 2010
Delay at 60 miles per hour
Figure 5-12 TOTAL ANNUAL VEHICLE HOURS OF DELAY AT 60
MILES PER HOUR, BY COUNTY, 2010-2011
0.0
0.5
1.0
1.5
Fresno Kern Madera Tulare
2010 2011
Hours (Millions)

93
California Department of Transportation Mobility Performance Report 2011
5.4.5. Lost Productivity
AM Peak: 0.2 mile, a 95% decrease over 2010
Off-Peak Day: 0.3 mile, a 87.4% decrease over 2010
PM Peak: 0.6 mile, a 74.1% decrease over 2010
Off-Peak Night: 1.4 miles, a 84.2% decrease over 2010
Lost Lane Miles at 35 miles per hour
Figure 5-13 AVERAGE NON-HOLIDAY WEEKDAY EQUIVALENT LOST LANE MILES
0
2
4
6
8
10
AM Peak (6 AM to 10 AM)
Off-Peak Day (10 AM to 3 PM)
PM Peak (3 PM to 7 PM)
Off-Peak Night (7 PM to 6 AM)
Miles
2010 2011

94
California Department of Transportation Mobility Performance Report 2011
5.5 DETECTOR HEALTH AND DATA QUALITY
Directional Mainline Miles: 4,073 miles Directional Mainline Miles with Detection: 195 miles
Number of Detectors at End of 2011: 646, 0% increase over 2010 Average Percentage of Good and Bad
Detection: 86% good, 1.1% decrease over 2010; 14% bad, 57.3% increase over 2010
Number of Days Reporting less Than 50% Working Detection:
17
Figure 5-14 DETECTOR HEALTH BY DAY, 2010-2011
0
200
400
600
800
1,000
1,200
1,400 Bad Good
Detectors
2011 2010

95
California Department of Transportation Mobility Performance Report 2011
5.6 FREEWAY CONGESTION AND BOTTLENECK LOCATIONS
5.6.1. Congestion by Freeway
Congestion Contributed by Top Ten Congested Freeways:
1,389,443 hours, 100% of total VHD in 2011
Table 5-3
TOP CONGESTED FREEWAYS, 2010-2011
Route County Vehicle Hours of Delay
at 60 mph Difference
(2011 - 2010) Rank
2010 2011 Absolute % 2010 2011
SR–99 Kern 763,232 359,963 -403,269 -52.8 1 1 SR–99 Madera 129,514 251,998 122,484 94.6 7 2 SR–41 Fresno 314,726 184,538 -130,188 -41.4 4 3 SR–99 Fresno 399,700 183,645 -216,055 -54.1 3 4 SR–99 Tulare 140,788 135,441 -5,348 -3.8 6 5 SR–180 Fresno 53,653 129,553 75,900 141.5 8 6 I–5 Fresno 471,669 117,293 -354,376 -75.1 2 7 SR–168S Fresno 18,750 25,785 7,035 37.5 9 8 SR–41 Madera 630 1,227 597 94.7 10 9
I–5 Kern 190,617 - -190,617 -
100.0 5 10 TOTALS 2,483,279 1,389,443 -1,093,837 -44.0
Detection was removed from I-5 in Kern County during 2010, so delay figures are not available at that location in 2011. Numbers may not sum to total due to rounding.

96
California Department of Transportation Mobility Performance Report 2011
5.6.2. Bottleneck Locations
No congested segments met the standard criteria for a bottleneck.

97
California Department of Transportation Mobility Performance Report 2011
Chapter 6
6.1 SUMMARY ANALYSIS Caltrans District 7 is composed of two counties, Los Angeles and Ventura.
Located in Southern California, District 7 is home to the largest metropolitan area in California. This district has a population of 10.72 million people and represents 28.5% of California’s population. Between 2010 and 2011 District 7 has seen a population increase of 0.4%.
In District 7, the 2011 monthly employment average was 4,715,267. District-wide unemployment rate declined from 12.4% in 2010 to 12.1% in 2011. This represented a decrease in unemployment of 0.3%. The unemployment rate was lower in Ventura County at 10.1%
In 2011, District 7’s automated detectors identified a total of 34.8 billion Vehicle Miles Traveled (VMT); a decrease of 128.5 million VMT from 2010, or a 0.4% reduction in VMT. August is the peak travel month in both 2010 and 2011, with 3 billion VMT in 2011. The decrease in VMT can likely be attributed to significant changes to travel behavior among motorists by utilizing specific routes and switching to alternate routes due to constant lengthy delays on their original routes.
In 2011, District 7 identified 38 million Vehicle Hours of Delay (VHD) at 35 mph (VHD35), a decrease of 22.7% from 2010. District 7 contributed 44% of state-wide VHD35, down 7.4% from 2010. District 7 identified 88.7 million Vehicle Hours of Delay at 60 mph (VHD60), a decrease of 18% from 2010. District 7 contributed 43.5% of state-wide VHD60, down 4.9% from 2010. In 2011, District 7 identified Friday as the most congested day of the week (VHD60) with a total of 341,964 hours, down 20% from 2010.
In 2011, District 7 maintained and operated 2,318 directional mainline miles. 1,104 of those miles had automated detection. The number of detectors in 2011 was 10,409, an increase of 5% from 2010. Of those detectors, 61% operated in good condition, a decrease of 0.3% from 2010. The number of individual detectors reporting less than 50% working detection was 1. The increase in detection for District 7 can be attributed to the addition of detectors in high occupancy vehicle (HOV) and high occupancy toll (HOT) lanes.
All of District 7’s Top 10 bottlenecks are within Los Angeles County. Eight of the Top 10 AM bottlenecks are within the city of Los Angeles, but only one of the Top 10 PM bottlenecks is within the city of Los Angeles. In District 7 the congestion contributed by the top ten congested freeways was 76,357,552 hours, 86% of the district’s VHD in 2011. Out of the top ten congested freeways in 2011 for District 7, Interstate 5 was the highest with 14,860,558 VHD and State Route 91 was the lowest

98
California Department of Transportation Mobility Performance Report 2011
with 3,154,442 VHD. Bottlenecks, exceptional changes in traffic patterns, and congestion are most visible during major construction projects. Traffic congestion increases if the project requires a few years to complete. One example is the Sepulveda Pass Project on northbound I-405 between the I-10 and the US-101 for a distance of 10 miles. This project has a significant impact on the traffic patterns on I-405 in both directions within the project limits and beyond. In addition, this project also has a significant impact on I-10 and US-101 upstream and downstream of the connectors with I-405 and for several miles in both directions. This critical change in traffic patterns has led to an increase in travel delays along the route under construction in addition to the neighboring routes. This increase is particularly noticed during off-peak hours when these routes would normally operate at an acceptable level-of-service (LOS).
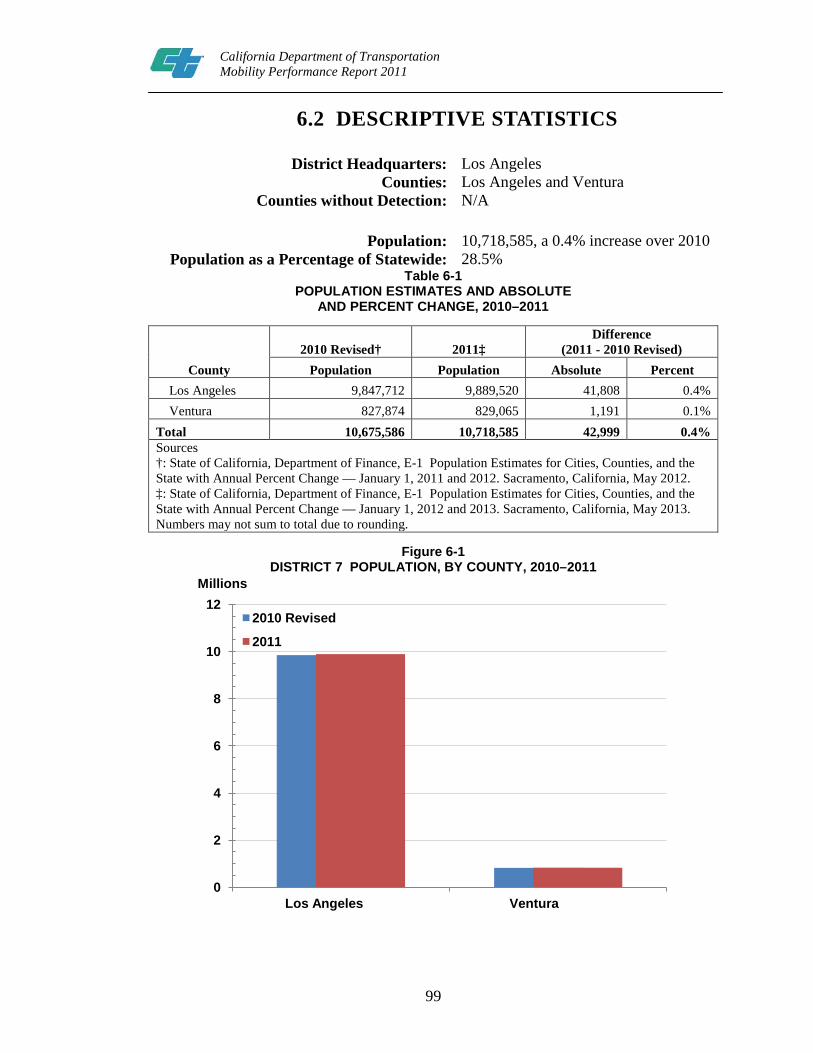
99
California Department of Transportation Mobility Performance Report 2011
6.2 DESCRIPTIVE STATISTICS
District Headquarters: Los Angeles Counties: Los Angeles and Ventura
Counties without Detection: N/A
Population: 10,718,585, a 0.4% increase over 2010 Population as a Percentage of Statewide: 28.5%
Table 6-1 POPULATION ESTIMATES AND ABSOLUTE
AND PERCENT CHANGE, 2010–2011
County 2010 Revised† 2011‡
Difference (2011 - 2010 Revised)
Population Population Absolute Percent Los Angeles 9,847,712 9,889,520 41,808 0.4% Ventura 827,874 829,065 1,191 0.1%
Total 10,675,586 10,718,585 42,999 0.4% Sources †: State of California, Department of Finance, E-1 Population Estimates for Cities, Counties, and the State with Annual Percent Change — January 1, 2011 and 2012. Sacramento, California, May 2012. ‡: State of California, Department of Finance, E-1 Population Estimates for Cities, Counties, and the State with Annual Percent Change — January 1, 2012 and 2013. Sacramento, California, May 2013. Numbers may not sum to total due to rounding.
Figure 6-1 DISTRICT 7 POPULATION, BY COUNTY, 2010–2011
0
2
4
6
8
10
12
Los Angeles Ventura
2010 Revised
2011
Millions

100
California Department of Transportation Mobility Performance Report 2011
Employment, 2011 Monthly Average: 4,715,267 Unemployment Rate, 2011 Monthly Average: 12.1%, a 0.3% decrease over 2010
Table 6-2
EMPLOYMENT, UNEMPLOYMENT, AND PERCENT CHANGE, BY COUNTY, 2010–2011
County
Unemployment Rate (%),
2010 Revised
Unemployment Rate (%),
2011
% Change in Rate of Unemployment
(2011 - 2010) Los Angeles 12.6 12.3 -0.3
Ventura 10.8 10.1 -0.7 District
Total 12.4 12.1 -0.3 Data not seasonally adjusted. Data revised by source. Source: State of California, Employment Development Department (EDD), Labor Market Information Division, downloaded Sept. 9, 2013.
Figure 6-2 DISTRICT 7 EMPLOYMENT AND UNEMPLOYMENT, BY COUNTY, 2010–2011
0
1
2
3
4
5
6
2010 2011 2010 2011
Los Angeles VenturaCounty
UnemploymentEmployment
Millions

101
California Department of Transportation Mobility Performance Report 2011
6.3 TRAVEL DEMAND
Vehicle Miles of Travel, 2011: 34.8 billion miles Absolute and Percentage Change over
2010: 128.5 million VMT decrease; a 0.4% decrease over 2010
Peak Travel Month, Percentage Change over 2010:
August, 3 billion miles, a 1.2% decrease over 2010
Monthly Trend Figure 6-3
TOTAL VEHICLE MILES OF TRAVEL, BY MONTH, 2010–2011
County Trend
Figure 6-4 TOTAL VEHICLE MILES OF TRAVEL, BY COUNTY, 2010–2011
0
1
2
3
4
Jan Feb Mar Apr May Jun Jul Aug Sep Oct Nov Dec
2010 2011
Miles (Billions)
0
10
20
30
40
Los Angeles Ventura
2010 2011
Miles (Billions)

102
California Department of Transportation Mobility Performance Report 2011
6.4 TRAFFIC CONGESTION
6.4.1. Total And Average Vehicle Hours Of Delay At 35 And 60 Miles Per Hour
6.4.1.1 Delay at 35 Miles per Hour
Vehicle Hours of Delay, 35 miles per hour: 38 million hours, a 22.7% decrease over 2010
Average Non-Holiday Weekday Delay, 35: 134,455 hours, a 21.5% decrease over 2010
Percentage of Statewide VHD at 35mph: 44%, a 7.4% decrease over 2010
Figure 6-5 TOTAL VEHICLE HOURS OF DELAY AT 35 MILES PER HOUR, BY MONTH, 2010–2011
0
1
2
3
4
5
6
Jan Feb Mar Apr May Jun Jul Aug Sep Oct Nov Dec
2010 2011
Hours (Millions)
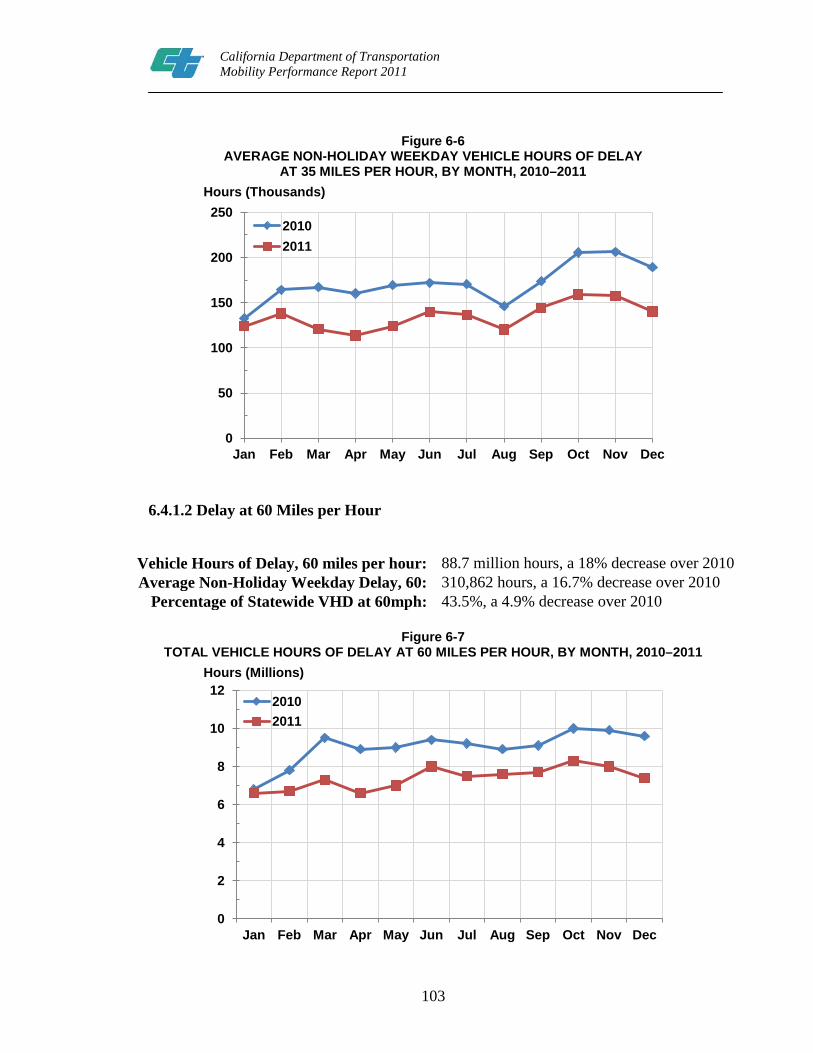
103
California Department of Transportation Mobility Performance Report 2011
Figure 6-6
AVERAGE NON-HOLIDAY WEEKDAY VEHICLE HOURS OF DELAY AT 35 MILES PER HOUR, BY MONTH, 2010–2011
6.4.1.2 Delay at 60 Miles per Hour
Vehicle Hours of Delay, 60 miles per hour: 88.7 million hours, a 18% decrease over 2010 Average Non-Holiday Weekday Delay, 60: 310,862 hours, a 16.7% decrease over 2010
Percentage of Statewide VHD at 60mph: 43.5%, a 4.9% decrease over 2010
Figure 6-7 TOTAL VEHICLE HOURS OF DELAY AT 60 MILES PER HOUR, BY MONTH, 2010–2011
0
50
100
150
200
250
Jan Feb Mar Apr May Jun Jul Aug Sep Oct Nov Dec
2010 2011
Hours (Thousands)
0
2
4
6
8
10
12
Jan Feb Mar Apr May Jun Jul Aug Sep Oct Nov Dec
2010 2011
Hours (Millions)

104
California Department of Transportation Mobility Performance Report 2011
Figure 6-8
AVERAGE NON-HOLIDAY WEEKDAY VEHICLE HOURS OF DELAY AT 60 MILES PER HOUR, BY MONTH, 2010–2011
6.4.2. AVERAGE VEHICLE HOURS OF DELAY BY DAY OF WEEK
Most Congested Day of the Week, 60 mph: Friday, 341,964 hours, a 20% decrease over 2010
Highest Absolute Change in Delay, 60mph: Friday, 83,614 VHD decrease, a 20% decrease over 2010
Highest Percentage Change in Delay Sunday/Holiday, 32,827 VHD decrease, a 32% decrease over 2010
0
100
200
300
400
500
Jan Feb Mar Apr May Jun Jul Aug Sep Oct Nov Dec
2010 2011
Hours (Thousands)
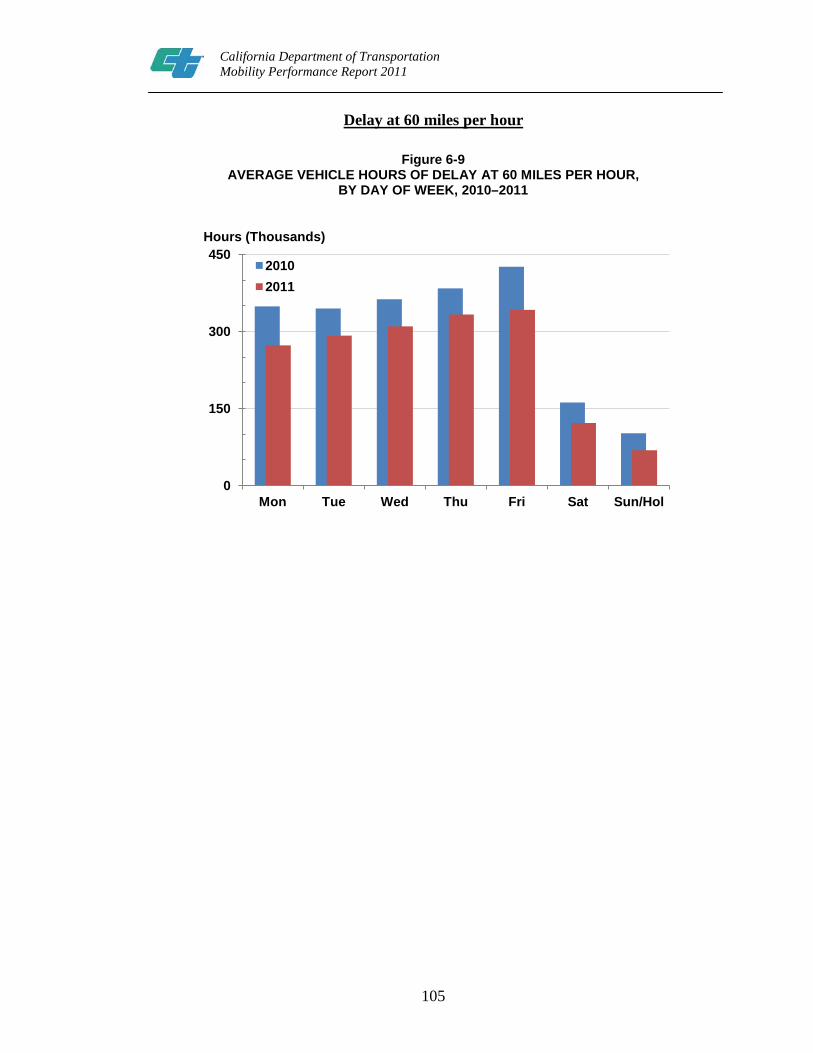
105
California Department of Transportation Mobility Performance Report 2011
Delay at 60 miles per hour
Figure 6-9 AVERAGE VEHICLE HOURS OF DELAY AT 60 MILES PER HOUR,
BY DAY OF WEEK, 2010–2011
0
150
300
450
Mon Tue Wed Thu Fri Sat Sun/Hol
2010 2011
Hours (Thousands)
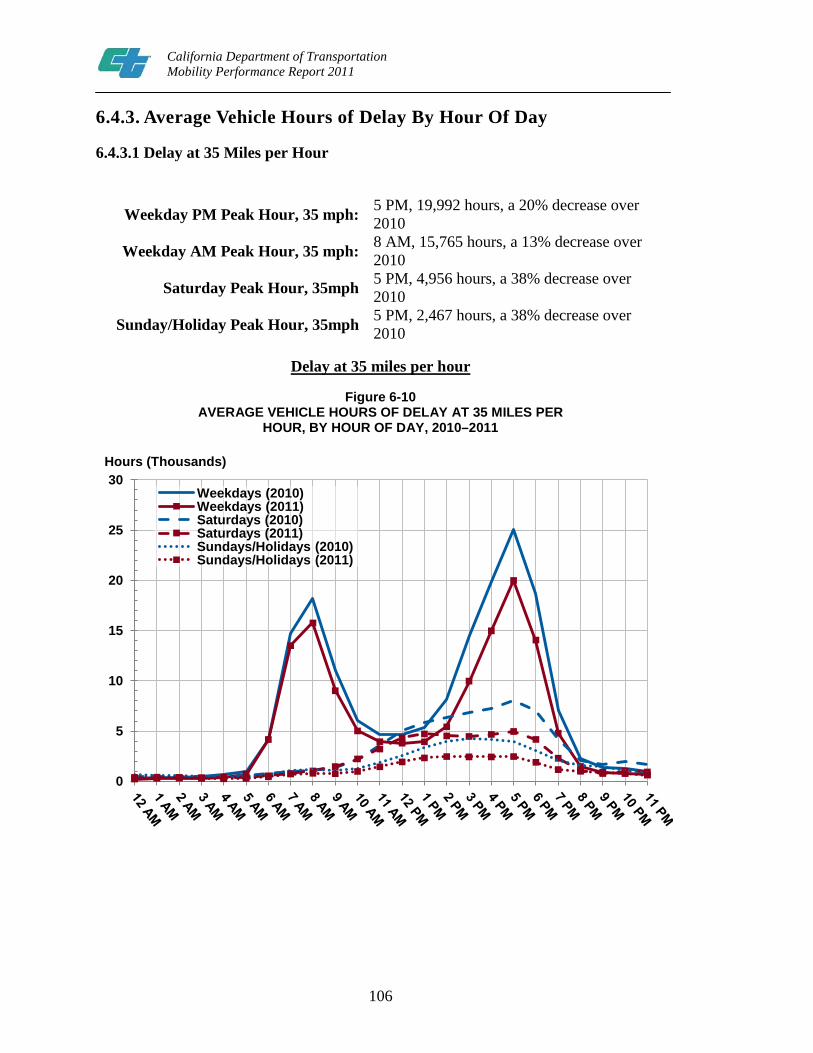
106
California Department of Transportation Mobility Performance Report 2011
6.4.3. Average Vehicle Hours of Delay By Hour Of Day
6.4.3.1 Delay at 35 Miles per Hour
Weekday PM Peak Hour, 35 mph: 5 PM, 19,992 hours, a 20% decrease over 2010
Weekday AM Peak Hour, 35 mph: 8 AM, 15,765 hours, a 13% decrease over 2010
Saturday Peak Hour, 35mph 5 PM, 4,956 hours, a 38% decrease over 2010
Sunday/Holiday Peak Hour, 35mph 5 PM, 2,467 hours, a 38% decrease over 2010
Delay at 35 miles per hour
Figure 6-10 AVERAGE VEHICLE HOURS OF DELAY AT 35 MILES PER
HOUR, BY HOUR OF DAY, 2010–2011
0
5
10
15
20
25
30 Weekdays (2010) Weekdays (2011) Saturdays (2010) Saturdays (2011) Sundays/Holidays (2010) Sundays/Holidays (2011)
Hours (Thousands)

107
California Department of Transportation Mobility Performance Report 2011
6.4.3.2 Delay at 60 Miles per Hour
Weekday PM Peak Hour, 60 mph: 5 PM, 41,321 hours, a 12% decrease over 2010 Weekday AM Peak Hour, 60 mph: 8 AM, 30,871 hours, a 11% decrease over 2010
Saturday Peak Hour, 60mph: 5 PM, 13,151 hours, a 24% decrease over 2010 Sunday/Holiday Peak Hour, 60mph: 5 PM, 6,471 hours, a 30% decrease over 2010
Delay at 60 miles per hour
Figure 6-11 AVERAGE VEHICLE HOURS OF DELAY AT 60 MILES PER HOUR,
BY HOUR OF DAY, 2010–2011
0
10
20
30
40
50 Weekdays (2010) Weekdays (2011) Saturdays (2010) Saturdays (2011) Sundays/Holidays (2010) Sundays/Holidays (2011)
Hours (Thousands)

108
California Department of Transportation Mobility Performance Report 2011
6.4.3.3. Total Vehicle Hours Of Delay By County
County with Largest Delay, 60 mph: Los Angeles, 86.5 million hours, a 18.6% decrease over 2010 VHD, 98% of District total VHD
County with 2nd Largest Delay, 60mph: Ventura, 2.2 million hours, a 16.9% increase over 2010 VHD, 2% of District total VHD
County with Largest Increase in Delay, 60 mph:
Ventura, 316,422 hours, a 16.9% increase over 2010
County with Largest Decrease in Delay, 60 mph:
Los Angeles, -19.7 million hours, a 18.6% decrease over 2010
Delay at 60 miles per hour
Figure 6-12 TOTAL ANNUAL VEHICLE HOURS OF DELAY AT 60 MILES PER HOUR,
BY COUNTY, 2010–2011
0
30
60
90
120
Los Angeles Ventura
2010 2011
Hours (Millions)

109
California Department of Transportation Mobility Performance Report 2011
6.4.3.4. Lost Productivity
AM Peak: 144.8 miles, a 8.1% decrease over 2010
Off-Peak Day: 58.1 miles, a 24.5% decrease over 2010
PM Peak: 235.1 miles, a 11.2% decrease over 2010
Off-Peak Night: 21.3, a 29% decrease over 2010
Lost Lane Miles at 35 miles per hour
Figure 6-13 AVERAGE NON-HOLIDAY WEEKDAY EQUIVALENT LOST LANE MILES
0
50
100
150
200
250
300
AM Peak (6 AM to 10 AM)
Off-Peak Day (10 AM to 3 PM)
PM Peak (3 PM to 7 PM)
Off-Peak Night (7 PM to 6 AM)
Miles
2010 2011

110
California Department of Transportation Mobility Performance Report 2011
6.5 DETECTOR HEALTH AND DATA QUALITY
Directional Mainline Miles: 2,318 miles Directional Mainline Miles with
Detection: 1,104 miles
Number of Detectors at End of 2011: 10,409, a 5% increase over 2010 Average Percentage of Good and Bad
Detection: 61% good, a a0.3% decrease over 2010; 39% bad, a 9.7% increase over 2010
Number of Days Reporting less Than 50% Working Detection:
1
Figure 6-14 DETECTOR HEALTH BY DAY, 2010–2011
0
2,000
4,000
6,000
8,000
10,000
12,000 Bad Good
Detectors
2011 2010

111
California Department of Transportation Mobility Performance Report 2011
6.6 FREEWAY CONGESTION AND BOTTLENECK LOCATIONS
6.6.1. Congestion by Freeway
Congestion Contributed by Top Ten Congested Freeways:
76,357,552 hours, 86% of total VHD in 2011
Table 6-3
TOP CONGESTED FREEWAYS, 2010–2011
Route County Vehicle Hours of Delay
at 60 mph Difference
(2011 - 2010) Rank
2010 2011 Absolute % 2010 2011 I–5 Los Angeles 15,886,570 14,860,558 -1,026,013 -7% 1 1 I–405 Los Angeles 14,587,235 11,519,515 -3,067,720 -21% 2 2 SR–101 Los Angeles 13,002,193 9,918,324 -3,083,868 -24% 3 3 SR–60 Los Angeles 7,595,894 9,428,050 1,832,156 24% 7 4 I–10 Los Angeles 10,831,424 7,082,866 -3,748,558 -35% 4 5 I–210 Los Angeles 8,879,467 6,962,310 -1,917,157 -21% 5 6 I–110 Los Angeles 7,772,802 5,478,239 -2,294,563 -29% 6 7 I–605 Los Angeles 7,238,790 4,156,413 -3,082,377 -42% 8 8 I–105 Los Angeles 4,429,145 3,796,836 -632,310 -15% 9 9 SR–91 Los Angeles 4,398,634 3,154,442 -1,244,192 -29% 10 10
TOTALS 94,622,154 76,357,552 -18,264,602 -19% Numbers may not sum to total due to rounding.

112
California Department of Transportation Mobility Performance Report 2011
6.6.2. Bottleneck Locations
Total Delay, All AM Bottlenecks, 2011: 10,397,472 hours Top Bottleneck Delay, AM, 2011: 2,814,595 hours Percentage Top Bottleneck Delay of Total Bottleneck Delay, AM,
2011: 27%
Table 6–4 (A) DISTRICT 7 TOP BOTTLENECKS, AM PEAK PERIOD, 2011
Rank County City Freeway CA Post-
mile Approximate
Location
Average Extent (miles)
Total Delay
(hours)
Average Daily Delay
(hours)
Average Duration (hours)
% of Days Active
1 Los Angeles Los Angeles SR170–S R15.26 Magnolia Blvd 3.70 519,070 2,392 2.8 86.5 2 Los Angeles Los Angeles SR101–S 19.8 Louise Ave 3.74 439,487 1,878 2.3 93.2 3 Los Angeles Los Angeles I110–N 21.36 Washington Blvd 2.50 381,271 1,525 3.2 99.6 4 Los Angeles Los Angeles I10–W R7.22 Manning 5.17 318,307 1,337 1.7 94.8 5 Los Angeles Los Angeles I405–S 33.04 Sunset Blvd 7.23 284,557 1,599 1.8 70.9
6 Los Angeles South
Elmonte SR60–W 12.1 Workman M 4.99 259,567 1,500 1.8 68.9 7 Los Angeles Los Angeles I405–N 29.16 National 3.96 234,431 1,711 2.3 54.6 8 Los Angeles Downey I5–N 8.86 Paramount Blvd 5.01 205,686 1,044 1.5 78.5
9 Los Angeles Downey I5–N 8.41 Lakewood 3.39 190,739 848 1.3 89.6 10 Los Angeles Los Angeles SR60–W 0.45 Soto St 2.20 186,214 955 2.7 77.7
Total Delay, All PM Bottlenecks, 2011: 17,137,442 hours Top Bottleneck Delay, PM, 2011: 3,621,511 hours Percentage Top Bottleneck Delay of Total Bottleneck Delay, PM,
2011: 21%
Table 6–4 (B) DISTRICT 7 TOP BOTTLENECKS, PM PEAK PERIOD, 2011
Rank County City Freeway CA Post-
mile Approximate
Location
Average Extent (miles)
Total Delay
(hours)
Average Daily Delay
(hours)
Average Duration (hours)
% of Days Active
1 Los Angeles Commerce I5–S 11.3 Malt Ave 5.79 589,317 2,357 3.1 99.6 2 Los Angeles Montebello SR60–E R7.91 Paramount 6.04 419,810 1,786 3.4 93.6 3 Los Angeles Diamond Bar SR60–E R22.94 Brea Canyon Rd 5.49 401,878 1,999 3.2 80.1 4 Los Angeles Diamond Bar SR57–N R3.4 Pathfinder Rd 3.11 395,745 1,609 3.8 98.0 5 Los Angeles La Puente I605–N R19.502 Valley Blvd 3.35 339,297 1,374 3.6 98.4 6 Los Angeles Long Beach I405–S 0.11 North of I–605 3.44 319,421 1,353 2.6 94.0 7 Los Angeles Los Angeles I405–N 29.16 National Blvd 2.05 301,549 1,861 4.0 64.5 8 Los Angeles El Monte I10–E 30.69 Durfee 5.70 291,520 1,225 2.2 94.8
9 Los Angeles Carson I405–S 11.82 South of Del Amo Blvd 2.39 287,839 1,246 2.6 92.0
10 Los Angeles Downey I605–S R9.75 North of I–5 2.52 275,136 1,101 3.5 99.6

113
California Department of Transportation Mobility Performance Report 2011
Figure 6-15 (A)(1)
BOTTLENECKS AND CONGESTED SEGMENTS, AM PEAK PERIOD, 2011

114
California Department of Transportation Mobility Performance Report 2011
Figure 6-15 (A)(2)
BOTTLENECKS AND CONGESTED SEGMENTS, AM PEAK PERIOD, 2011
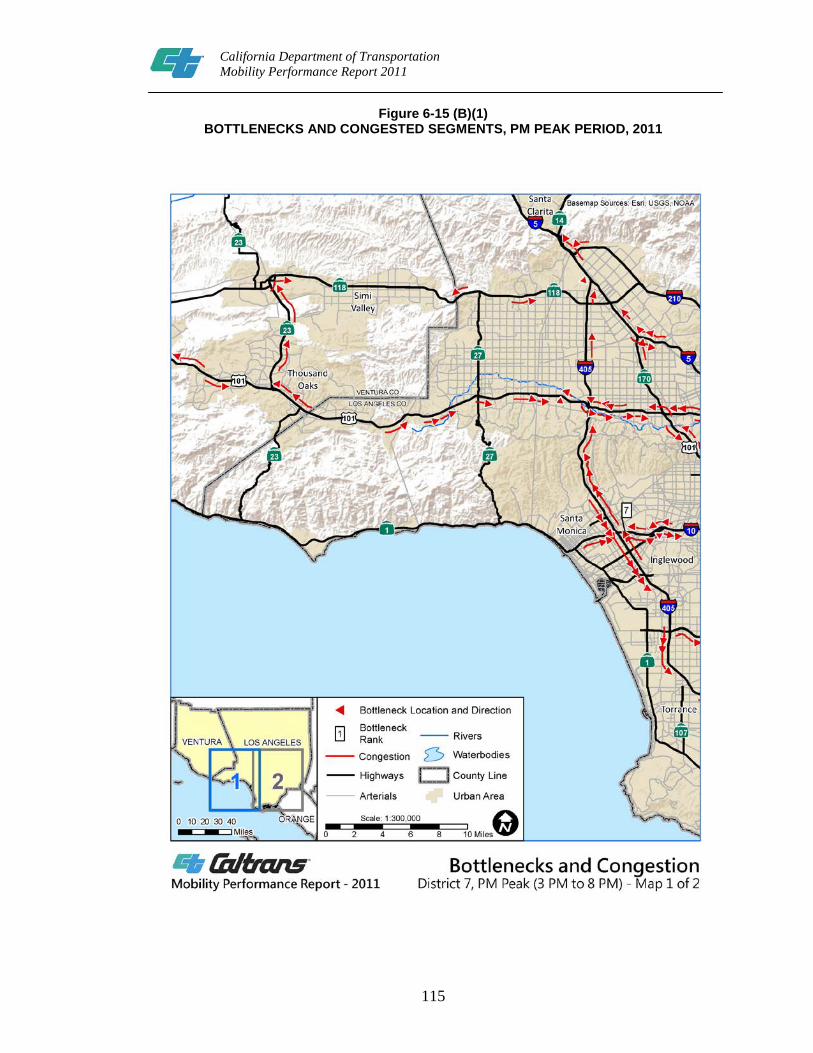
115
California Department of Transportation Mobility Performance Report 2011
Figure 6-15 (B)(1) BOTTLENECKS AND CONGESTED SEGMENTS, PM PEAK PERIOD, 2011

116
California Department of Transportation Mobility Performance Report 2011
Figure 6-15 (B)(2) BOTTLENECKS AND CONGESTED SEGMENTS, PM PEAK PERIOD, 2011

117
California Department of Transportation Mobility Performance Report 2011
Chapter 7
7.1 SUMMARY ANALYSIS Caltrans District 8 is composed of two counties, Riverside and San Bernardino.
Within the Inland Empire, District 8 is home to the third largest metropolitan area in California, with a population of 4.29 million people and representing 11.4% of California’s overall population. Between 2010 and 2011 District 8 has seen a population increase of 1%. The amount of roadway congestion has noticeably increased due to a decline in the unemployment rate.
In District 8, the 2011 monthly employment average was 1,551,500. District-wide the unemployment rate dropped by 0.8%. The unemployment rate was lower in San Bernardino County at 13.4%, compared to 13.7% in Riverside County.
District 8’s Vehicle Miles Traveled (VMT) increased by 70 million. In 2011, District 8’s automated detectors identified a total of 12.7 billion VMT and identified August as the peak travel month for both 2010 and 2011; with 1.1 billion VMT for 2011. The peak month VMT decreased by 0.6%.
In 2011, District 8 identified 5.2 million vehicle hours of delay (VHD) at 35 mph, a decrease of 4.7% from the previous year. When compared to the entire state VHD at 35 mph, District 8 contributed 6% of the whole with an increase of 0.3% from the previous year. The average non-holiday weekday delay at 35 mph was 17,915 hours for District 8, a decrease of 3.6% from the previous year. At 60 mph, District 8 identified 14.2 million hours of VHD, a decrease of 13.5% from the previous year. When compared to the entire state VHD at 60 mph, District 8 contributed 7% of the whole with a decrease of 0.3% from the previous year. In regard to the average non-holiday weekday delay at 60 mph, District 8 identified 48,622 hours, a decrease of 10.9% from the previous year. For 2011, District 8 identified Friday as the most congested day of the week at 60 mph with a total of 56,247 hours, a decrease of 16% from the previous year. The highest absolute change in delay was identified as Friday, with 10,709 VHD, a decrease of 16% from the previous year. The highest percentage change in delay was identified as Saturday with 8,155 VHD, a decrease of 31% from the previous year. Riverside reported the largest Delay at 60 mph in District 8, with 8.3 million hours, a decrease of 17.5% from the previous year.
There are several contributing factors to the congestion and VHD Increases for District 8. District 8 had 65,586 incidents in 2011, including accidents, breakdowns, congestion, hazards, police, weather, and other causes. 37,106 of the incidents occurred in San Bernardino County, with Riverside County accounting for 28,480. District 8 also recorded 22,786 approved closure requests in 2011 for bridge work, road work, roadway construction, paving, and guardrail work. Freeway mainline closures accounted for

118
California Department of Transportation Mobility Performance Report 2011
56.4% of the total closures, followed by Off-Ramp closures at 16.2%, and On-Ramp closures at 14%.
District 8 maintained and operated 3,852 directional mainline miles in 2011. 518 of those miles had detection. The number of detectors for 2011 was 3,353, representing an increase of 8% from the previous year. Of those detectors, 74% operated in good condition, an increase of 2.4% from the previous year. 26% of the detectors did not operate in good condition, a decrease of 2.7% from the previous year. The number of detectors reporting less than 50% working detection was 3. The increase in bad detectors for District 8 can be attributed to ongoing construction projects, vandalism, wire theft, equipment theft, and knockdowns of cabinets. Equipment malfunction, configuration issues, and fiber optic cuts can also impact the detection health percentage.
In District 8, congestion contributed by the top ten bottlenecks accounted for 14,018,259 VHD. In 2011, the District 8 trend shows AM Bottlenecks in the westbound and northbound directions; and PM Bottlenecks in the eastbound and southbound directions. The worst bottleneck during the AM and PM peak periods is State Route 91 in Riverside County. The GIS maps show District 8’s bottlenecks are mainly centered on freeway-to-freeway interchanges. Examples include the 15/91 interchange during AM peak, and the 91/60/215 interchange during PM peak.
Despite major contributors to bottlenecks and congestion, District 8 has made significant progress in projects to alleviate congestion. One of the most notable construction projects was on Route I-215 in Riverside County. This was a widening project that added one mixed flow lane in each direction; which resulted in a 29% decrease in congestion compared to 2010.

119
California Department of Transportation Mobility Performance Report 2011
7.2 DESCRIPTIVE STATISTICS
District Headquarters: San Bernardino Counties: Riverside, San Bernardino
Counties without Detection: None
Population: 4,293,892, a 1% increase over 2010 Population as a Percentage of Statewide: 11.4%
Table 7-1
POPULATION ESTIMATES, ABSOLUTE, AND PERCENT CHANGE, 2010–2011
County 2010 Revised† 2011‡
Difference (2011 - 2010 Revised)
Population Population Absolute Percent Riverside 2,205,731 2,234,193 28,462 1.3% San Bernardino 2,046,619 2,059,699 13,080 0.6%
Total 4,252,350 4,293,892 41,542 1.0% Sources: †: State of California, Department of Finance, E-1 Population Estimates for Cities, Counties, and the State with Annual Percent Change — January 1, 2011 and 2012. Sacramento, California, May 2012. ‡: State of California, Department of Finance, E-1 Population Estimates for Cities, Counties, and the State with Annual Percent Change — January 1, 2012 and 2013. Sacramento, California, May 2013. Numbers may not sum to total due to rounding.
Figure 7-1
POPULATION, BY COUNTY, 2010–2011
0.0
0.5
1.0
1.5
2.0
2.5
Riverside San Bernardino County
2010 Revised 2011
Millions

120
California Department of Transportation Mobility Performance Report 2011
Employment, 2011 Monthly Average: 1,551,500 Unemployment Rate, 2011 Monthly Average: 13.6%, a 0.8% decrease over 2010
Table 7-2
EMPLOYMENT, UNEMPLOYMENT, AND PERCENT CHANGE, BY COUNTY, 2010–2011
County
Unemployment Rate,
2010 Revised
Unemployment Rate, 2011
Percent Change in Rate of Unemployment
(2011 - 2010) Riverside 14.5% 13.7% -0.8%
San Bernardino 14.2% 13.4% -0.8% District Total 14.3% 13.6% -0.8% Data not seasonally adjusted. Data revised by source. Source: State of California, Employment Development Department, Labor Market Information Division, downloaded Sept. 9, 2013.
Figure 7-2
EMPLOYMENT AND UNEMPLOYMENT, BY COUNTY, 2010–2011
0
200
400
600
800
1,000
2010 2011 2010 2011
Riverside San BernardinoCounty
UnemploymentEmployment
Thousands

121
California Department of Transportation Mobility Performance Report 2011
7.3 TRAVEL DEMAND
Vehicle Miles of Travel, 2011: 12.7 billion miles Absolute and Percentage Change over 2010: 70 million VMT increase; 0.6% increase
over 2010 Peak Travel Month, Percentage Change over 2010: August, 1.1 billion miles, 0.6% decrease
over 2010
Monthly Trend Figure 7-3
TOTAL VEHICLE MILES OF TRAVEL, BY MONTH, 2010–2011
County Trend
Figure 7-4 TOTAL VEHICLE MILES OF TRAVEL, BY COUNTY, 2010–2011
0.0
0.2
0.4
0.6
0.8
1.0
1.2
1.4
Jan Feb Mar Apr May Jun Jul Aug Sep Oct Nov Dec
2010 2011
Miles (Billions)
0
2
4
6
8
Riverside San Bernardino
2010 2011
Miles (Billions)

122
California Department of Transportation Mobility Performance Report 2011
7.4 TRAFFIC CONGESTION
7.4.1. Total and Average Vehicle Hours of Delay at 35 and 60 Miles per Hour
7.4.1.1 Delay at 35 Miles per Hour
Vehicle Hours of Delay, 35 miles per hour: 5.2 million hours, a 4.7% decrease over 2010
Average Non-Holiday Weekday Delay, 35: 17,915 hours, a 3.6% decrease over 2010 Percentage of Statewide VHD at 35mph: 6%, a 0.3% increase over 2010
Figure 7-5
TOTAL VEHICLE HOURS OF DELAY AT 35 MILES PER HOUR, BY MONTH, 2010–2011
0
200
400
600
800
Jan Feb Mar Apr May Jun Jul Aug Sep Oct Nov Dec
2010 2011
Hours (Thousands)

123
California Department of Transportation Mobility Performance Report 2011
Figure 7-6
AVERAGE NON-HOLIDAY WEEKDAY VEHICLE HOURS OF DELAY AT 35 MILES PER HOUR, BY MONTH, 2010–2011
7.4.1.2 Delay at 60 Miles per Hour
Vehicle Hours of Delay, 60 miles per hour: 14.2 million hours, a 13.5% decrease over 2010
Average Non-Holiday Weekday Delay, 60: 48,622 hours, a 10.9% decrease over 2010 Percentage of Statewide VHD at 60mph: 7%, a 0.3% decrease over 2010
Figure 7-7
TOTAL VEHICLE HOURS OF DELAY AT 60 MILES PER HOUR, BY MONTH, 2010–2011
0
5
10
15
20
25
30
35
Jan Feb Mar Apr May Jun Jul Aug Sep Oct Nov Dec
2010 2011
Hours (Thousands)
0.0
0.5
1.0
1.5
2.0
Jan Feb Mar Apr May Jun Jul Aug Sep Oct Nov Dec
2010 2011
Hours (Millions)

124
California Department of Transportation Mobility Performance Report 2011
Figure 7-8 AVERAGE NON-HOLIDAY WEEKDAY VEHICLE HOURS OF DELAY AT 60 MILES PER HOUR, BY MONTH, 2010–2011
0
10
20
30
40
50
60
70
80
Jan Feb Mar Apr May Jun Jul Aug Sep Oct Nov Dec
2010 2011
Hours (Thousands)

125
California Department of Transportation Mobility Performance Report 2011
7.4.2. Average Vehicle Hours of Delay by Day of Week
Most Congested Day of the Week, 60 mph: Friday, 56,247 hours, a 16% decrease over 2010
Highest Absolute Change in Delay, 60mph: Friday, 10,709 VHD decrease, a 16% decrease over 2010
Highest Percentage Change in Delay: Saturday, 8,155 VHD decrease, a 31% decrease over 2010
Delay at 60 miles per hour
Figure 7-9 AVERAGE VEHICLE HOURS OF DELAY AT 60 MILES PER HOUR,
BY DAY OF WEEK, 2010–2011
0
10
20
30
40
50
60
70
80
Mon Tue Wed Thu Fri Sat Sun/Hol
2010 2011
Hours (Thousands)

126
California Department of Transportation Mobility Performance Report 2011
7.4.3. Average Vehicle Hours of Delay by Hour of Day
7.4.3.1 Delay at 35 Miles per Hour
Weekday PM Peak Hour, 35 mph: 5 PM, 2,754 hours, a 7% increase over 2010 Weekday AM Peak Hour, 35 mph: 7 AM, 1,643 hours, a 18% decrease over 2010
Saturday Peak Hour, 35mph: 5 PM, 656 hours, a 3% decrease over 2010 Sunday/Holiday Peak Hour, 35mph: 2 PM, 663 hours, a 12% decrease over 2010
Figure 7-10 AVERAGE VEHICLE HOURS OF DELAY AT 35 MILES PER HOUR, BY HOUR OF DAY, 2010–2011
0
500
1,000
1,500
2,000
2,500
3,000 Weekdays (2010) Weekdays (2011) Saturdays (2010) Saturdays (2011) Sundays/Holidays (2010) Sundays/Holidays (2011)
Hours

127
California Department of Transportation Mobility Performance Report 2011
7.4.3.2 Delay at 60 Miles per Hour Weekday PM Peak Hour, 60 mph: 5 PM, 6,832 hours, a 1% increase over 2010 Weekday AM Peak Hour, 60 mph: 7 AM, 3,763 hours, a 20% decrease over 2010
Saturday Peak Hour, 60mph: 5 PM, 1,828 hours, a 18% decrease over 2010 Sunday/Holiday Peak Hour, 60mph: 5 PM, 1,571 hours, a 24% decrease over 2010
Figure 7-11 AVERAGE VEHICLE HOURS OF DELAY AT 60 MILES PER HOUR, BY HOUR OF DAY, 2010–2011
0
1,000
2,000
3,000
4,000
5,000
6,000
7,000
8,000 Hours
Weekdays (2010) Weekdays (2011) Saturdays (2010) Saturdays (2011) Sundays/Holidays (2010) Sundays/Holidays (2011)
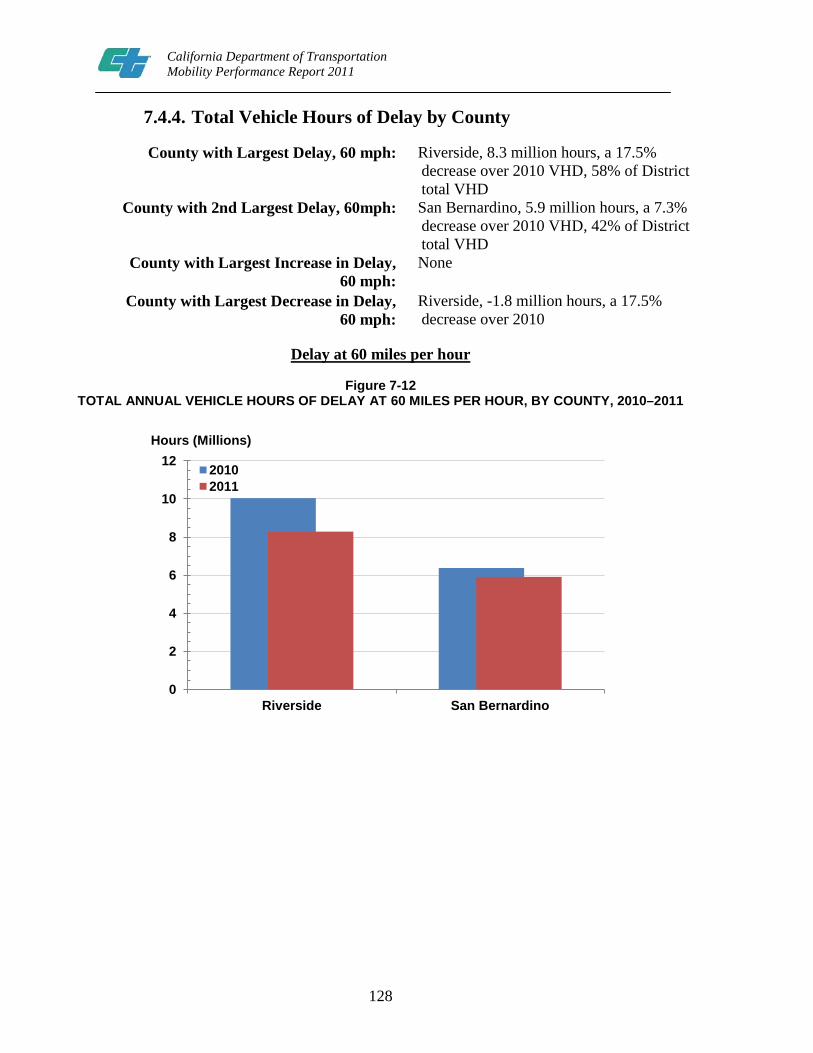
128
California Department of Transportation Mobility Performance Report 2011
7.4.4. Total Vehicle Hours of Delay by County
County with Largest Delay, 60 mph: Riverside, 8.3 million hours, a 17.5% decrease over 2010 VHD, 58% of District total VHD
County with 2nd Largest Delay, 60mph: San Bernardino, 5.9 million hours, a 7.3% decrease over 2010 VHD, 42% of District total VHD
County with Largest Increase in Delay, 60 mph:
None
County with Largest Decrease in Delay, 60 mph:
Riverside, -1.8 million hours, a 17.5% decrease over 2010
Delay at 60 miles per hour
Figure 7-12 TOTAL ANNUAL VEHICLE HOURS OF DELAY AT 60 MILES PER HOUR, BY COUNTY, 2010–2011
0
2
4
6
8
10
12
Riverside San Bernardino
2010 2011
Hours (Millions)
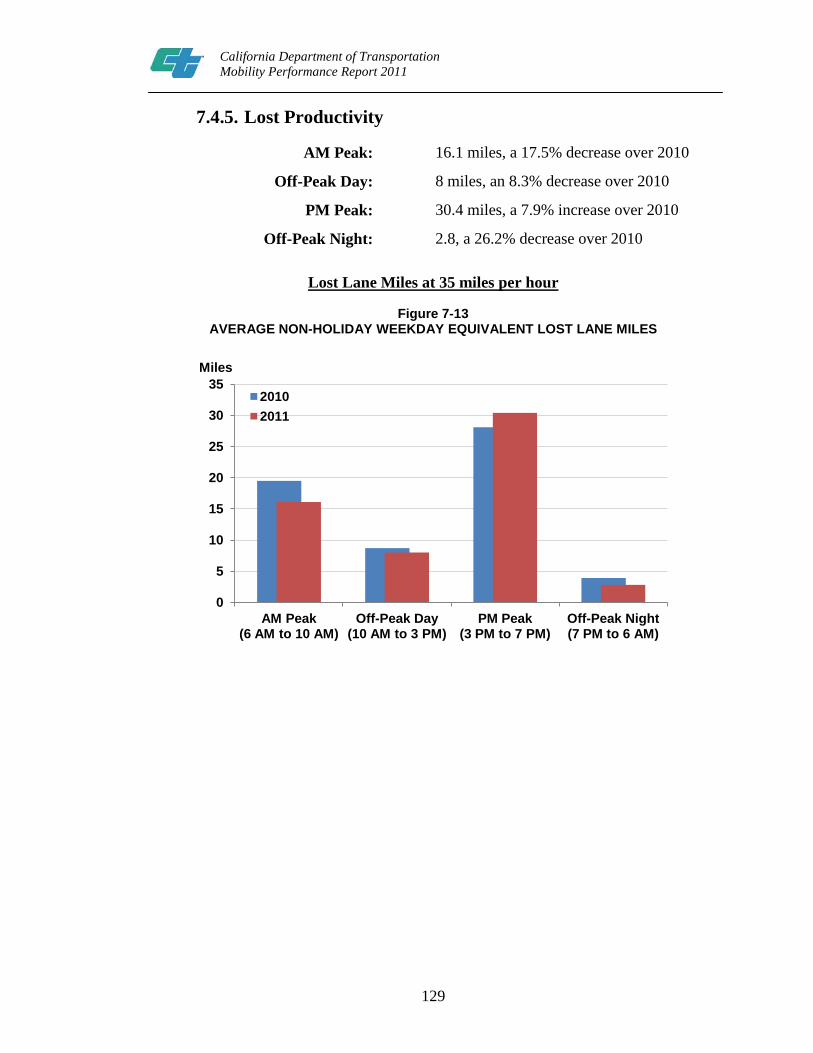
129
California Department of Transportation Mobility Performance Report 2011
7.4.5. Lost Productivity
AM Peak: 16.1 miles, a 17.5% decrease over 2010
Off-Peak Day: 8 miles, an 8.3% decrease over 2010
PM Peak: 30.4 miles, a 7.9% increase over 2010
Off-Peak Night: 2.8, a 26.2% decrease over 2010
Lost Lane Miles at 35 miles per hour
Figure 7-13 AVERAGE NON-HOLIDAY WEEKDAY EQUIVALENT LOST LANE MILES
0
5
10
15
20
25
30
35
AM Peak (6 AM to 10 AM)
Off-Peak Day (10 AM to 3 PM)
PM Peak (3 PM to 7 PM)
Off-Peak Night (7 PM to 6 AM)
Miles
2010 2011

130
California Department of Transportation Mobility Performance Report 2011
7.5 DETECTOR HEALTH AND DATA QUALITY
Directional Mainline Miles: 3,852 miles Directional Mainline Miles with Detection: 518 miles
Number of Detectors at End of 2011: 3,353, an 8% increase over 2010 Average Percentage of Good and Bad
Detection: 74% good, a 2.4% increase over 2010; 26% bad, a 28.7% increase over 2010
Number of Days Reporting less than 50% Working Detection:
3
Figure 7-14 DETECTOR HEALTH BY DAY, 2010–2011
0
1,000
2,000
3,000
4,000 Bad Good
Detectors
2011 2010

131
California Department of Transportation Mobility Performance Report 2011
7.6 FREEWAY CONGESTION AND BOTTLENECK LOCATIONS
7.6.1. Congestion by Freeway
Congestion Contributed by Top Ten Congested Freeways:
14,018,259 hours, 98.8% of total VHD in 2011
Table 7-3
TOP TEN CONGESTED FREEWAYS, 2010–2011
Route County
Vehicle Hours of Delay at 60 mph
Difference (2011 - 2010 Revised) Rank
2010 Revised† 2011 Absolute Percent 2010 Revised 2011
SR–91 Riverside 3,647,276 3,595,668 -51,609 -1% 1 1 I–10 San Bernardino 2,153,583 2,426,202 272,620 13% 3 2 I–215 Riverside 2,858,380 2,025,724 -832,656 -29% 2 3 I–15 Riverside 2,032,836 1,602,800 -430,036 -21% 4 4 SR–60 San Bernardino 1,498,081 1,297,909 -200,172 -13% 5 5 I–15 San Bernardino 1,293,754 1,119,114 -174,641 -13% 7 6 SR–60 Riverside 1,318,877 888,458 -430,419 -33% 6 7 I–210 San Bernardino 593,320 563,406 -29,915 -5% 9 8 I–215 San Bernardino 609,112 376,842 -232,270 -38% 8 9 SR–71 San Bernardino 194,921 122,138 -72,783 -37% 10 10 TOTALS 16,200,140 14,018,259 -2,181,880 -13% †District 8’s data have been slightly adjusted from what was published in the 2010 MPR to correct for a data processing inconsistency in PeMS. Numbers may not sum to total due to rounding.

132
California Department of Transportation Mobility Performance Report 2011
7.6.2. Bottleneck Locations
Total Delay, All AM Bottlenecks, 2011: 784,896 hours Top Bottleneck Delay, AM, 2011: 632,588 hours Percentage Top Bottleneck Delay of Total Bottleneck Delay, AM, 2011: 81%
Table 7–4 (A) DISTRICT 8 TOP BOTTLENECKS, AM PEAK PERIOD, 2011
Rank County City Freeway CA Post-
mile Approximate Location
Average Extent (miles)
Total Delay
(hours)
Average Daily Delay
(hours)
Average Duration (hours)
% of Days
Active
1 Riverside Corona SR91–W 5.28 Lincoln Ave 2.18 299,923 1,287 3.2 93%
2 Riverside Riverside SR91–E 18.522 Central Ave 2.43 82,918 430 1.5 77%
3 Riverside Corona SR91–W R2.8 1.7 mile east of Green River Rd 4.19 67,743 484 1.3 56%
4 San Bernardino Chino SR60–W R1.169 Ramona Ave 2.43 55,445 402 1.4 55%
5 San Bernardino Yucaipa I10–W 36.3 West of 16th St 2.42 40,492 309 1.1 52%
6 Riverside Riverside I215–N 40.929 Martin Luther King Blvd 0.86 30,111 519 3.4 23%
7 Riverside Riverside SR60–W 13.392 Day St 1.66 29,488 156 1.4 75%
8 Riverside Morena Valley I215–N R37.6 North of Eucalyptus Ave 0.60 26,468 126 1.8 84%
9 Riverside Temecula I15–S 4.7 Rancho California Rd 2.23 24,315 219 1.0 44%
10 Riverside Riverside I215–N R36.5 Alessandro Blvd 0.72 22,995 136 1.5 67%
Total Delay, All PM Bottlenecks, 2011: 1,757,381 hours Top Bottleneck Delay, PM, 2011: 951,099 hours Percentage Top Bottleneck Delay of Total Bottleneck Delay, PM, 2011: 54%
Table 7–4 (B) DISTRICT 8 TOP BOTTLENECKS, PM PEAK PERIOD, 2011
Rank County City Freeway CA Post-
mile Approximate Location
Average Extent (miles)
Total Delay
(hours)
Average Daily Delay
(hours)
Average Duration (hours)
% of Days
Active
1 Riverside Corona SR91–E 4.731 100 feet east of Smith Ave 1.85 178,194 727 3.0 98%
2 Riverside Riverside SR91–W 19.899 14th St 1.44 137,617 557 3.2 98%
3 Riverside Corona SR91–E 9.23 McKinley St 1.72 117,051 472 3.1 99%
4 Riverside Riverside I215–S 42.144 Blaine St 1.20 99,231 422 3.6 94%
5 San Bernardino Unincorporated I15–N 13.7 1.0 mile south of Glen Helen Pkwy 2.06 86,952 1,425 3.8 24%
6 Riverside Temecula I15–N 6.8 Winchester Rd 1.74 77,789 499 1.7 62%
7 San Bernardino Ontario I10–E 11.79 0.88 mile east of Etiwanda Ave 1.41 66,566 340 1.9 78%
8 Riverside Corona I15–S 39.239 0.4 mile north of Ontario Ave 0.98 63,232 310 2.4 81%
9 Riverside Riverside SR60–E 11.815 Main St 0.95 62,902 338 2.8 74%
10 Riverside Corona SR91–E 4.241 Maple St 2.25 61,567 261 1.2 94%

133
California Department of Transportation Mobility Performance Report 2011
Figure 7-15 (A)
BOTTLENECKS AND CONGESTED SEGMENTS, AM PEAK PERIOD, 2011
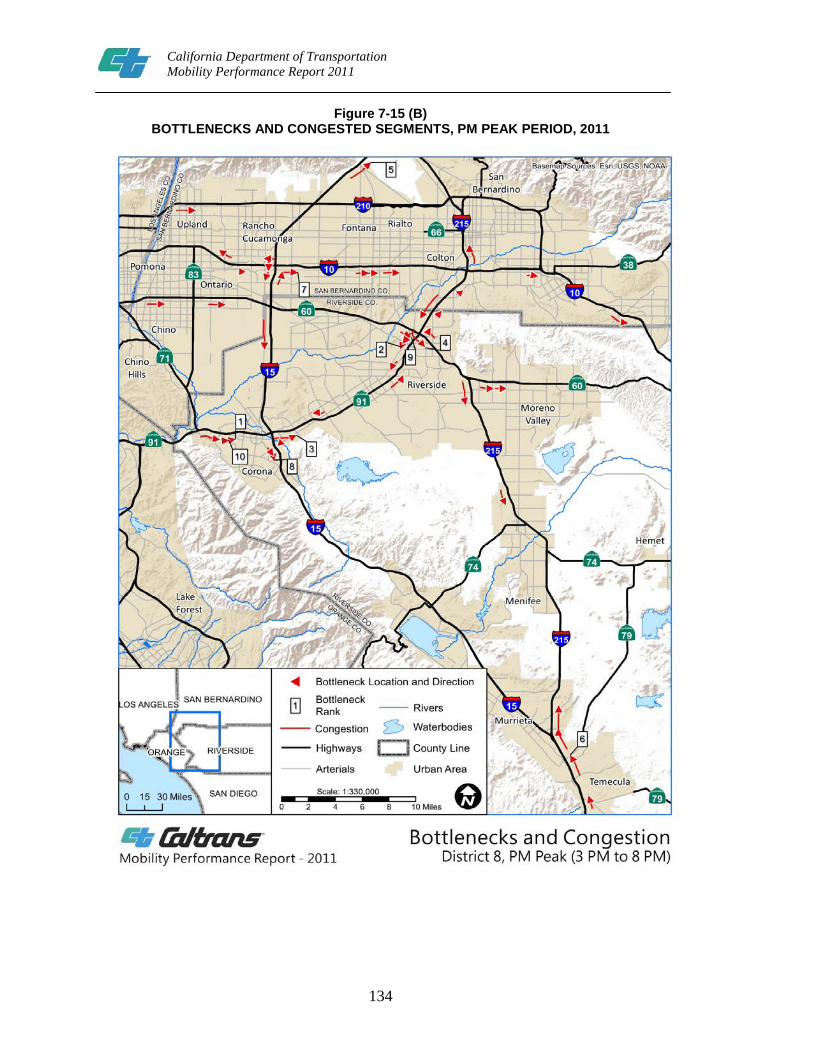
134
California Department of Transportation Mobility Performance Report 2011
Figure 7-15 (B) BOTTLENECKS AND CONGESTED SEGMENTS, PM PEAK PERIOD, 2011

135
California Department of Transportation Mobility Performance Report 2011
Chapter 8
8.1 SUMMARY ANALYSIS Caltrans District 10 is composed of eight counties including Alpine, Amador,
Calaveras, Mariposa, Merced, San Joaquin, Stanislaus, and Tuolumne.* Of those eight counties only Alpine county has no detection. Five of District 10’s counties are classified as rural and are predominantly located in the mountainous region; those counties include Alpine, Amador, Calaveras, Mariposa, and Tuolumne. The remaining three counties are classified as urban and are predominantly located in the central valley. These counties include Merced, San Joaquin, and Stanislaus. District 10’s 2011 population is estimated at 1,628,268, a 0.6% growth in population from 2010. District 10’s population represents 4.3% of California’s population in 2011.
In District 10, the 2011 monthly employment average was 601,624. The district-wide unemployment rate declined from 17.2% in 2010 to 16.7% in 2011, a decrease of 0.5%. The unemployment rate was highest in Merced County at 18.3%. The unemployment rate was the lowest in Mariposa County at 11.9%. All District 10 counties experienced a decrease in unemployment between 2010 and 2011, except for Mariposa which remained unchanged.
In 2011, District 10’s automated detectors logged a total of 4.7 billion Vehicle Miles Traveled (VMT). This is an increase of 443.6 million VMT, or 10.3% from 2010. August was the highest peak travel month at 427.7 million miles, an increase of 11.7% from 2010. Contributing factors include population growth and the higher employment rate in District 10 in 2011.
In 2011, District 10 identified 1.3 million vehicle hours of delay at 35 mph (VHD35), an increase of 61% from 2010. District 11 VHD35 contributed 1.5% of the state VHD35, an increase of 0.7% from 2010. The Vehicle Hours of Delay at 60 MPH (VHD60) for District 10 in 2011 was 16,860 hours. The county with the largest VHD60 in District 10 is San Joaquin County, with 66% of the district VHD60. Merced County showed a 50.4% decrease from 2010 in 2011; however, this decrease may be attributed to bad detection caused by construction projects along SR-99 in the county.
In 2011, District 10 operated and maintained 2,653 directional mainline miles. 719 of those miles had detection and were located in the Merced, San Joaquin, and Stanislaus counties. At the end of 2011 the number of detectors in District 10 was 1,321, a 79% increase from 2010. Of these detectors, 94% operated in good condition. The number of detectors reporting less than 50% working detection was 0. The high percentage in good detection and the decrease in bad detection can be attributed to the fact that more detectors reporting to the Performance Measurement System (PeMS) have been installed and maintained well enough to prevent copper wire theft and tampering.

136
California Department of Transportation Mobility Performance Report 2011
The top ten congested freeways in District 10 accounted for 88% of the total congestion and were located in Merced, San Joaquin, and Stanislaus Counties. Travel to other counties contributes to a majority of the congestion and bottlenecks for District 10. State Route 99 and Interstate 5 run through all three counties and I-205 / SR-120 / SR-4 all run through San Joaquin County. I-205 is a regional route in San Joaquin County that connects the Central Valley to the Bay Area. The most congested day of the week for VHD60 is Monday with 21,813 hours, a 16% increase from 2010. The 2011 bottleneck delay was 56,349 hours in District 10. The bottleneck delay for District 10 is composed of the only two bottlenecks. Both bottlenecks occurred in the morning (AM) Peak Period along westbound I-205 in the City of Tracy. This supports the trend of commuters from the central valley traveling to the Bay Area for work on a daily basis.
*Alpine County is excluded from District 10’s analysis due to lack of detection on State Highways in that county.
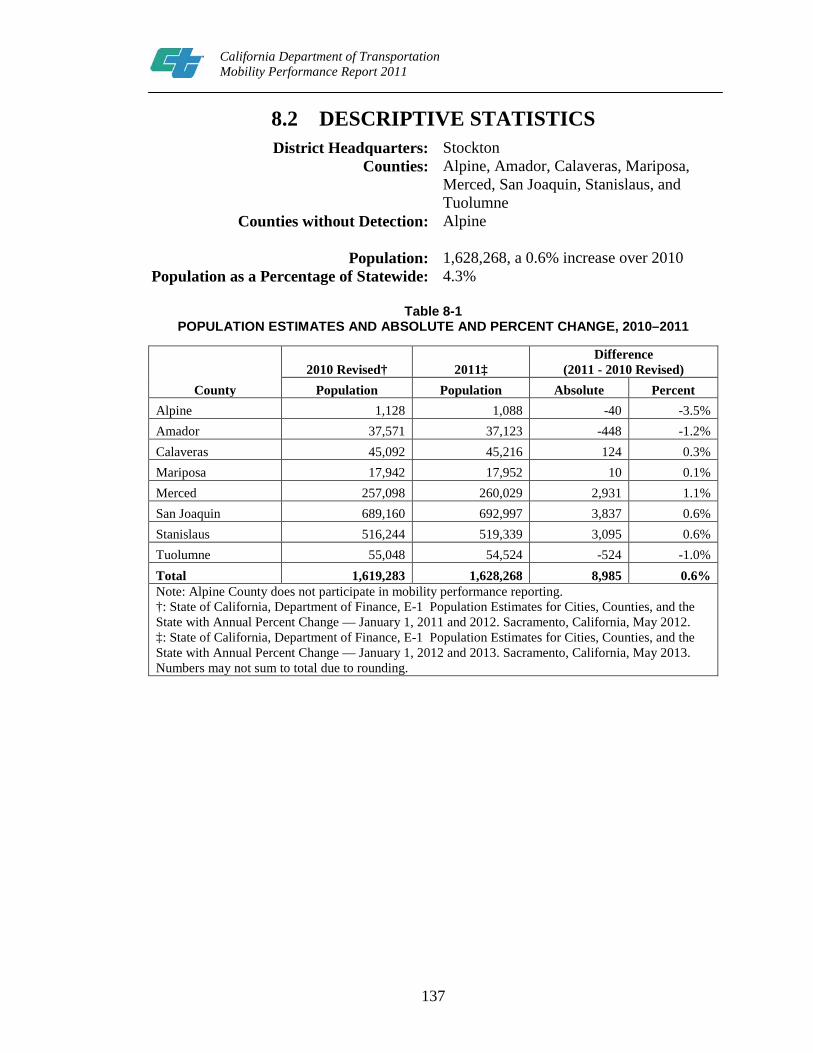
137
California Department of Transportation Mobility Performance Report 2011
8.2 DESCRIPTIVE STATISTICS District Headquarters: Stockton
Counties: Alpine, Amador, Calaveras, Mariposa, Merced, San Joaquin, Stanislaus, and Tuolumne
Counties without Detection: Alpine
Population: 1,628,268, a 0.6% increase over 2010 Population as a Percentage of Statewide: 4.3%
Table 8-1
POPULATION ESTIMATES AND ABSOLUTE AND PERCENT CHANGE, 2010–2011
County 2010 Revised† 2011‡
Difference (2011 - 2010 Revised)
Population Population Absolute Percent Alpine 1,128 1,088 -40 -3.5% Amador 37,571 37,123 -448 -1.2% Calaveras 45,092 45,216 124 0.3% Mariposa 17,942 17,952 10 0.1% Merced 257,098 260,029 2,931 1.1% San Joaquin 689,160 692,997 3,837 0.6% Stanislaus 516,244 519,339 3,095 0.6% Tuolumne 55,048 54,524 -524 -1.0% Total 1,619,283 1,628,268 8,985 0.6% Note: Alpine County does not participate in mobility performance reporting. †: State of California, Department of Finance, E-1 Population Estimates for Cities, Counties, and the State with Annual Percent Change — January 1, 2011 and 2012. Sacramento, California, May 2012. ‡: State of California, Department of Finance, E-1 Population Estimates for Cities, Counties, and the State with Annual Percent Change — January 1, 2012 and 2013. Sacramento, California, May 2013. Numbers may not sum to total due to rounding.

138
California Department of Transportation Mobility Performance Report 2011
Figure 8-1 POPULATION, BY COUNTY, 2010–2011
0
100
200
300
400
500
600
700
800 2010 Revised 2011
Thousands

139
California Department of Transportation Mobility Performance Report 2011
Employment, 2011 Monthly Average: 601,624 Unemployment Rate, 2011 Monthly Average: 16.7%, a 0.5% decrease over 2010
Table 8-2
EMPLOYMENT, UNEMPLOYMENT, AND PERCENT CHANGE, BY COUNTY, 2010–2011
County Unemployment
Rate(%), 2010 Revised Unemployment Rate (%), 2011
% Change in Rate of Unemployment
(2011 - 2010) Alpine 15.5% 14.9% -0.6% Amador 13.3% 12.8% -0.5% Calaveras 15.3% 14.6% -0.6% Mariposa 11.9% 11.9% 0.0% Merced 18.8% 18.3% -0.5% San Joaquin 17.3% 16.8% -0.5% Stanislaus 17.3% 16.7% -0.6% Tuolumne 13.8% 13.0% -0.9% District Total 17.2% 16.7% -0.5%
Note: Alpine County does not participate in mobility performance reporting. Data not seasonally adjusted. Data revised by source. Source: State of California, Employment Development Department (EDD), Labor Market Information Division, downloaded Sept. 9, 2013. Numbers may not sum to total due to rounding.
Figure 8-2
EMPLOYMENT AND UNEMPLOYMENT, BY COUNTY, 2010–2011
0
50
100
150
200
250
300
350
Alpine Amador Calaveras Mariposa Merced San Joaquin StanislausTuolumne
UnemploymentEmployment
Thousands

140
California Department of Transportation Mobility Performance Report 2011
8.3 TRAVEL DEMAND
Vehicle Miles of Travel, 2011: 4.7 billion miles Absolute and Percentage Change over
2010: 383.4 million VMT increase; a 8.8% increase over 2010
Peak Travel Month, Percentage Change over 2010:
August, 427.7 million miles, a 11.7% increase over 2010
Monthly Trend Figure 8-3
TOTAL VEHICLE MILES OF TRAVEL, BY MONTH, 2010–2011
County Trend
Figure 8-4 TOTAL VEHICLE MILES OF TRAVEL, BY COUNTY, 2010–2011
0
100
200
300
400
500
Jan Feb Mar Apr May Jun Jul Aug Sep Oct Nov Dec
2010 2011
Miles (Millions)
0
1
2
3
4 2010 2011
Miles (Millions)

141
California Department of Transportation Mobility Performance Report 2011
8.4 TRAFFIC CONGESTION 8.4.1. Total and Average Vehicle Hours of Delay at 35 and 60 Miles per Hour 8.4.1.1 Delay at 35 Miles per Hour
Vehicle Hours of Delay, 35 miles per hour: 1.3 million hours, a 61% increase over 2010 Average Non-Holiday Weekday Delay, 35: 4,470 hours, a 49.2% increase over 2010
Percentage of Statewide VHD at 35mph: 1.5%, a 0.7% increase over 2010
Figure 8-5 TOTAL VEHICLE HOURS OF DELAY AT 35 MILES PER HOUR, BY MONTH, 2010–2011
Figure 8-6 AVERAGE NON-HOLIDAY WEEKDAY VEHICLE HOURS OF DELAY
AT 35 MILES PER HOUR, BY MONTH, 2010–2011
0
50
100
150
200
250
Jan Feb Mar Apr May Jun Jul Aug Sep Oct Nov Dec
2010 2011
Hours (Thousands)
0
2
4
6
8
10
Jan Feb Mar Apr May Jun Jul Aug Sep Oct Nov Dec
2010 2011
Hours (Thousands)

142
California Department of Transportation Mobility Performance Report 2011
8.4.1.2 Delay at 60 Miles per Hour
Vehicle Hours of Delay, 60 miles per hour: 4.9 million hours, a 10% increase over 2010 Average Non-Holiday Weekday Delay, 60: 16,860 hours, a 3.9% increase 2010
Percentage of Statewide VHD at 60mph: 2.4%, a 0.4% increase over 2010
Figure 8-7 TOTAL VEHICLE HOURS OF DELAY AT 60 MILES PER HOUR, BY MONTH, 2010–2011
Figure 8-8 AVERAGE NON-HOLIDAY WEEKDAY VEHICLE HOURS OF DELAY
AT 60 MILES PER HOUR, BY MONTH, 2010–2011
0
200
400
600
800
Jan Feb Mar Apr May Jun Jul Aug Sep Oct Nov Dec
2010 2011
Hours (Thousands)
0
5
10
15
20
25
30
Jan Feb Mar Apr May Jun Jul Aug Sep Oct Nov Dec
2010 2011
Hours (Thousands)

143
California Department of Transportation Mobility Performance Report 2011
8.4.2. Average Vehicle Hours of Delay by Day of Week
Most Congested Day of the Week, 60 mph: Monday, 21,813 hours, a 16% increase over 2010
Highest Absolute Change in Delay, 60mph: Monday, 3,045 VHD increase, a 16% increase 2010
Highest Percentage Change in Delay: Saturday, 2,396 VHD increase, an 88% increase over 2010
Delay at 60 miles per hour
Figure 8-9 AVERAGE VEHICLE HOURS OF DELAY AT 60 MILES PER HOUR, BY DAY OF WEEK, 2010–2011
0
5
10
15
20
25
Mon Tue Wed Thu Fri Sat Sun/Hol
2010 2011
Hours (Thousands)

144
California Department of Transportation Mobility Performance Report 2011
8.4.3. Average Vehicle Hours of Delay by Hour of Day
8.4.3.1 Delay at 35 Miles per Hour
Weekday PM Peak Hour, 35 mph: 4 PM, 527 hours, a 121% increase over 2010 Weekday AM Peak Hour, 35 mph: 9 AM, 207 hours, a 78% increase over 2010
Saturday Peak Hour, 35 mph: 6 PM, 118 hours, a 372% increase over 2010 Sunday/Holiday Peak Hour, 35 mph: 5 PM, 182 hours, a 208% increase over 2010
Delay at 35 miles per hour
Figure 8-10 AVERAGE VEHICLE HOURS OF DELAY AT 35 MILES PER HOUR, BY HOUR OF DAY, 2010–2011
0
100
200
300
400
500
600 Weekdays (2010) Weekdays (2011) Saturdays (2010) Saturdays (2011) Sundays/Holidays (2010) Sundays/Holidays (2011)
Hours
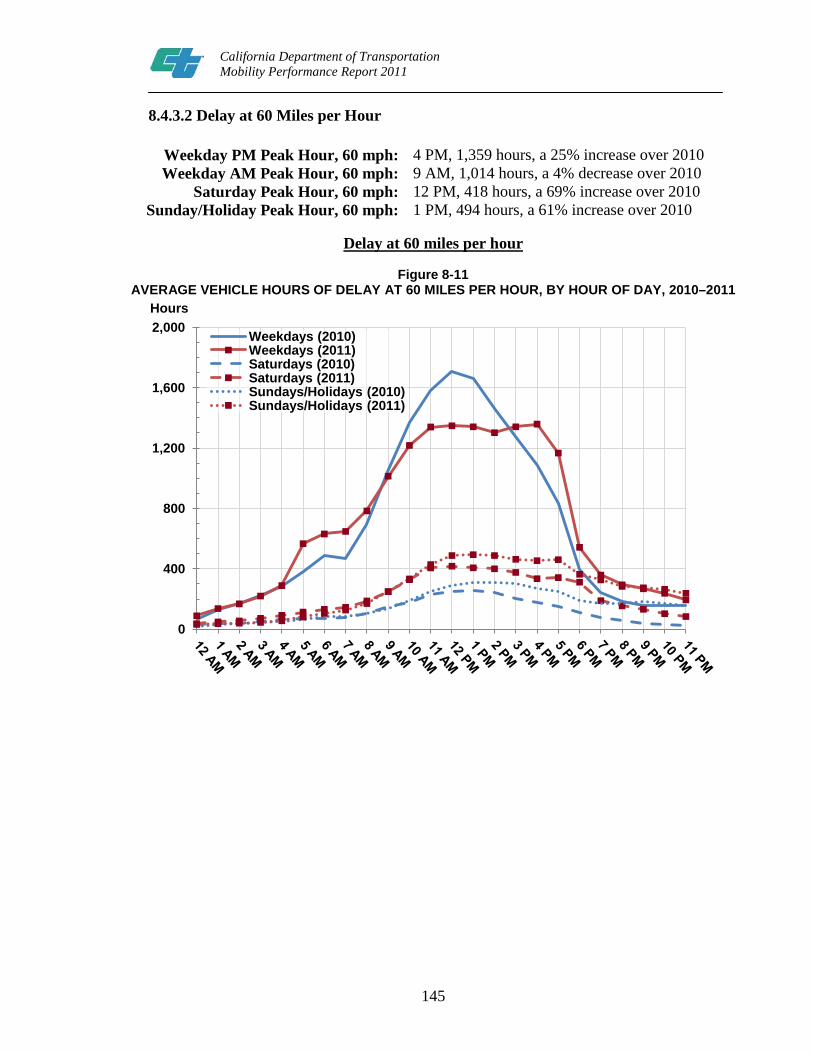
145
California Department of Transportation Mobility Performance Report 2011
8.4.3.2 Delay at 60 Miles per Hour
Weekday PM Peak Hour, 60 mph: 4 PM, 1,359 hours, a 25% increase over 2010 Weekday AM Peak Hour, 60 mph: 9 AM, 1,014 hours, a 4% decrease over 2010
Saturday Peak Hour, 60 mph: 12 PM, 418 hours, a 69% increase over 2010 Sunday/Holiday Peak Hour, 60 mph: 1 PM, 494 hours, a 61% increase over 2010
Delay at 60 miles per hour
Figure 8-11 AVERAGE VEHICLE HOURS OF DELAY AT 60 MILES PER HOUR, BY HOUR OF DAY, 2010–2011
0
400
800
1,200
1,600
2,000 Hours
Weekdays (2010) Weekdays (2011) Saturdays (2010) Saturdays (2011) Sundays/Holidays (2010) Sundays/Holidays (2011)

146
California Department of Transportation Mobility Performance Report 2011
8.4.4. Total Vehicle Hours of Delay by County
County with Largest Delay, 60 mph: San Joaquin, 3.2 million, a 35.5% increase over 2010 VHD, 66% of District total VHD
County with 2nd Largest Delay, 60mph: Stanislaus, 756,222 hours, a 10.6% increase over 2010 VHD, 15% of District total VHD
County with Largest Increase in Delay, 60 mph:
San Joaquin, 849,788 hours, a 35.5% increase over 2010
County with Largest Decrease in Delay, 60 mph:
Merced, -637,184 hours, a 50.4% decrease over 2010
Delay at 60 miles per hour
Figure 8-12 TOTAL ANNUAL VEHICLE HOURS OF DELAY AT 60 MILES PER HOUR, BY COUNTY, 2010–2011
0
1
2
3
4
Amador Calaveras Mariposa Merced San Joaquin
Stanislaus Tuolumne
Hours (Millions)
2010 2011

147
California Department of Transportation Mobility Performance Report 2011
8.4.5. Lost Productivity
AM Peak: 19.7 miles, a 512% increase over 2010
Off-Peak Day: 28.3 miles, a 333% increase over 2010
PM Peak: 27 miles, a 541% increase over 2010
Off-Peak Night: 13.9 miles, a 590% decrease over 2010
Lost Lane Miles at 35 miles per hour
Figure 8-13 AVERAGE NON-HOLIDAY WEEKDAY EQUIVALENT LOST LANE MILES
0
10
20
30
AM Peak (6 AM to 10 AM)
Off-Peak Day (10 AM to 3 PM)
PM Peak (3 PM to 7 PM)
Off-Peak Night (7 PM to 6 AM)
Miles
2010 2011

148
California Department of Transportation Mobility Performance Report 2011
8.5 DETECTOR HEALTH AND DATA QUALITY
Directional Mainline Miles: 2,653 miles Directional Mainline Miles with Detection: 719 miles
Number of Detectors at End of 2011: 1,321, a 79% increase over 2010 Average Percentage of Good and Bad
Detection: 94% good, a 74.2% increase over 2010; 6% bad, a 64.9% decrease over 2010
Number of Days Reporting less than 50% Working Detection:
0
Figure 8-14 DETECTOR HEALTH BY DAY, 2010–2011
0
200
400
600
800
1,000
1,200
1,400 Bad Good
Detectors
2011 2010

149
California Department of Transportation Mobility Performance Report 2011
8.6 FREEWAY CONGESTION AND BOTTLENECK LOCATIONS
8.6.1. Congestion by Freeway
Congestion Contributed by Top Ten Congested Freeways:
4,287,498 hours, 88% of total VHD in 2011
Table 8-3
TOP CONGESTED FREEWAYS, 2010–2011
Route County Vehicle Hours of Delay
at 60 mph Difference
(2011 - 2010) Rank
2010 2011 Absolute % 2010 2011
SR–99 San Joaquin 1,139,595 1,332,827 193,232 17% 1 1 SR–99 Stanislaus 553,053 617,949 64,896 12% 3 2 I–5 San Joaquin 469,340 506,570 37,231 8% 4 3 SR–120 San Joaquin 283,830 395,991 112,161 40% 5 4 I–205 San Joaquin 131,562 381,296 249,734 190% 7 5 SR–4 San Joaquin 206,239 310,486 104,247 51% 6 6 SR–99 Merced 1,127,024 262,609 -864,415 -77% 2 7 SR–12 San Joaquin 110,728 193,893 83,165 75% 9 8 SR–152 Merced 103,755 143,636 39,881 38% 10 9 SR–140 Merced - 142,241 142,241 10
TOTALS 4,125,126 4,287,498 162,372 4% Numbers may not sum to total due to rounding.

150
California Department of Transportation Mobility Performance Report 2011
8.6.2. Bottleneck Locations
Total Delay, All AM Bottlenecks, 2011: 56,349 hours Top Bottleneck Delay, AM, 2011: 56,349 hours Percentage Top Bottleneck Delay of Total Bottleneck Delay,
AM, 2011: 100%
Table 8–4 (A) DISTRICT 10 TOP BOTTLENECKS, AM PEAK PERIOD, 2011
Rank County City Freeway CA Post-
mile Approximate Location
Average Extent (miles)
Total Delay
(hours)
Average Daily Delay
(hours)
Average Duration (hours)
% of Days
Active
1 San Joaquin Tracy I205–W 0.76 West of Mountain House
Parkway Overcrossing 3.12 38,725 281
1.2 55%
2 San Joaquin Tracy I205–W R3.332 West of 11th St.
Overcrossing 2.45 17,624 117
0.7 60%
Total Delay, All PM Bottlenecks, 2011: None Top Bottleneck Delay, PM, 2011: N/A Percentage Top Bottleneck Delay of Total Bottleneck Delay,
PM, 2011: N/A

151
California Department of Transportation Mobility Performance Report 2011
Figure 8-15 (A) BOTTLENECKS AND CONGESTED SEGMENTS, AM PEAK PERIOD, 2011

152
California Department of Transportation Mobility Performance Report 2011
Figure 8-15 (B) BOTTLENECKS AND CONGESTED SEGMENTS, PM PEAK PERIOD, 2011
No congested segments met the standard criteria for a bottleneck during the PM peak period.

153
California Department of Transportation Mobility Performance Report 2011
Chapter 9
9.1 SUMMARY ANALYSIS Caltrans District 11 is composed of Imperial and San Diego counties. The 2011
population was 3,307,872, an increase of 0.5% from 2010. Of the 3,307,872 District 11 residents, 3,128,734 lived in San Diego County. District 11 represents 8.8% of California’s total state population.
In 2011, over 1,478,392 people were employed in District 11; a 0.5% increase in employment. Imperial County had a 29.7% unemployment rate in 2011. Unemployment for San Diego County for 2011 was 11%, less than the California state average.
In 2011, District 11’s automated detectors identified a total of 11.5 billion Vehicle Miles of Travel (VMT). This is a decrease of 1.6%, or 181.6 million VMT from 2010. The detectors also identified August as the peak travel month in both 2010 and 2011. With the reduction in total VMT, peak month VMT also decreased by 1.9% or 1 billion VMT. The decrease in VMT appears counterintuitive since congestion and population increased in 2011. Possible causes for this could include increased gas prices, construction project delays and accidents.
In 2011, District 11 identified 4.9 million Vehicle Hours of Delay at 35 mph (VHD35), an increase of 7.8% from the previous year. District 11 contributed 5.7% of the state VHD35, an increase of 0.92% from 2010. The non-holiday, weekday VHD35 was 18,588 hours for District 11, an increase of 9.2% from 2010. District 11 identified 11.4 million hours of VHD at 60 mph (VHD 60), an increase of 0.5% from 2010. District 11 contributed 5.6% of the state VHD60, also an increase of 0.5% from 2010. District 11 identified 41,596 hours of non-holiday weekday VHD60, an increase of 1.2% from 2010. In 2011, District 11 identified Friday as the most congested day of the week for VHD60 with 45,268 hours, a decrease of 5% from 2010. The highest absolute change in delay was Thursday, with 4,240 VHD60, a decrease of 9% from the previous year. The highest percentage change in delay was Saturday with 1,604 VHD60, a decrease of 14% from the previous year. In 2011, San Diego was the county with the largest VHD60 with 11.4 million hours, an increase of 0.5% from 2010, this being solely the whole 100% of the district VHD. The county with the largest increase in delay at 60 mph was also San Diego with 57,680 hours, an increase of 0.5% from the previous year. The congestion and AVHD increases for District 11 are partially attributed to new constructions projects and population growth.
In the year 2011, District 11 maintained and operated 2,058 directional mainline miles. 481 miles had detection. The number of detectors for 2011 was 3,778, an increase of 4% from 2010. Of those detectors, 88% operated in good condition, an increase of 3.1% from 2010. The number of detectors reporting less than 50% working detection was 0. The increase in detection for District 11 is the result of additional

154
California Department of Transportation Mobility Performance Report 2011
freeway lanes and new detector deployments in areas of freeway where the detection had not been deployed.
In District 11 the congestion contributed by the top ten congested freeways was 11,347,291 hours, 99.8% of total VHD in 2011. Out of the top ten congested freeways in 2011, I-5 was the highest with 3,920,871 VHD; and Rte-125 was the lowest with 127,142 VHD. Rte-125 is the least congested because it is a toll route. In 2011, the total delay of all morning (AM) bottlenecks was 1,008,757 hours. Out of the total hours, 872,822 hours of delay occurred in the top ten bottlenecks (87% of the total AM bottleneck delay for 2011). In the afternoon (PM), the total delay for all bottlenecks was 2,531,669 hours. The top ten PM bottlenecks contributed 1,344,618 hours (53% of the total PM bottleneck delay for 2011).

155
California Department of Transportation Mobility Performance Report 2011
9.2 DESCRIPTIVE STATISTICS
District Headquarters: San Diego Counties: San Diego
Counties without Detection: Imperial
Population: 3,307,872, a 0.5% increase over 2010 Population as a Percentage of Statewide: 8.8%
Table 9-1
POPULATION ESTIMATES, ABSOLUTE, AND PERCENT CHANGE, 2010-2011
County 2010 Revised† 2011‡
Difference (2011 - 2010 Revised)
Population Population Absolute Percent Imperial 175,712 179,138 3,426 1.9% San Diego 3,115,810 3,128,734 12,924 0.4%
Total 3,291,522 3,307,872 16,350 0.5% Note: Imperial County does not participate in mobility performance reporting. Sources: †: State of California, Department of Finance, E-1 Population Estimates for Cities, Counties, and the State with Annual Percent Change — January 1, 2011 and 2012. Sacramento, California, May 2012. ‡: State of California, Department of Finance, E-1 Population Estimates for Cities, Counties, and the State with Annual Percent Change — January 1, 2012 and 2013. Sacramento, California, May 2013. Numbers may not sum to total due to rounding.
Figure 9-1 POPULATION, BY COUNTY, 2010-2011
0
1
2
3
4
Imperial San Diego County
2010 Revised 2011
Millions
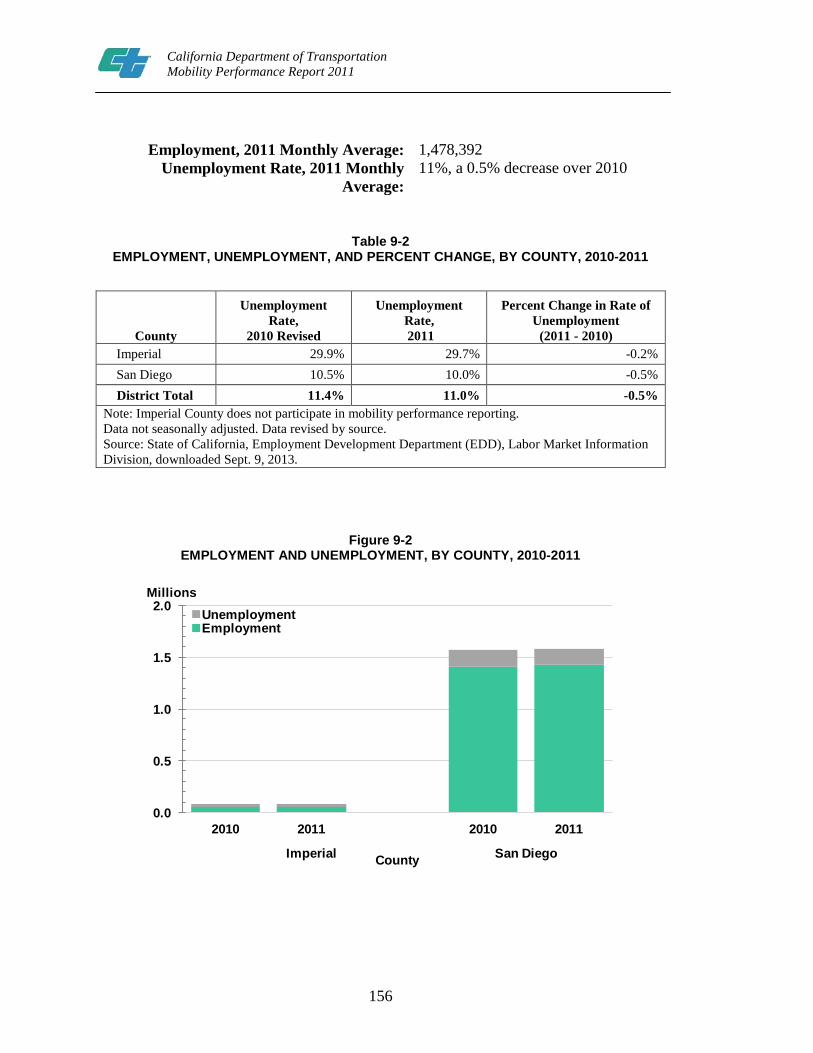
156
California Department of Transportation Mobility Performance Report 2011
Employment, 2011 Monthly Average: 1,478,392 Unemployment Rate, 2011 Monthly
Average: 11%, a 0.5% decrease over 2010
Table 9-2 EMPLOYMENT, UNEMPLOYMENT, AND PERCENT CHANGE, BY COUNTY, 2010-2011
County
Unemployment Rate,
2010 Revised
Unemployment Rate, 2011
Percent Change in Rate of Unemployment
(2011 - 2010) Imperial 29.9% 29.7% -0.2% San Diego 10.5% 10.0% -0.5% District Total 11.4% 11.0% -0.5%
Note: Imperial County does not participate in mobility performance reporting. Data not seasonally adjusted. Data revised by source. Source: State of California, Employment Development Department (EDD), Labor Market Information Division, downloaded Sept. 9, 2013.
Figure 9-2
EMPLOYMENT AND UNEMPLOYMENT, BY COUNTY, 2010-2011
0.0
0.5
1.0
1.5
2.0
2010 2011 2010 2011
Imperial San DiegoCounty
UnemploymentEmployment
Millions

157
California Department of Transportation Mobility Performance Report 2011
9.3 TRAVEL DEMAND
Vehicle Miles of Travel, 2011: 11.5 billion miles Absolute and Percentage Change over 2010: 181.6 million VMT decrease; a 1.6%
decrease over 2010 Peak Travel Month, Percentage Change over 2010: August, 1 billion miles, a 1.9%
decrease over 2010 Monthly Trend
Figure 9-3 TOTAL VEHICLE MILES OF TRAVEL,BY MONTH, 2010-2011
County Trend
Figure 9-4 TOTAL VEHICLE MILES OF TRAVEL, BY COUNTY, 2010-2011
0.0
0.2
0.4
0.6
0.8
1.0
1.2
Jan Feb Mar Apr May Jun Jul Aug Sep Oct Nov Dec
2010 2011
Miles (Billions)
0
3
6
9
12
15
San Diego
2010 2011
Miles (Billions)
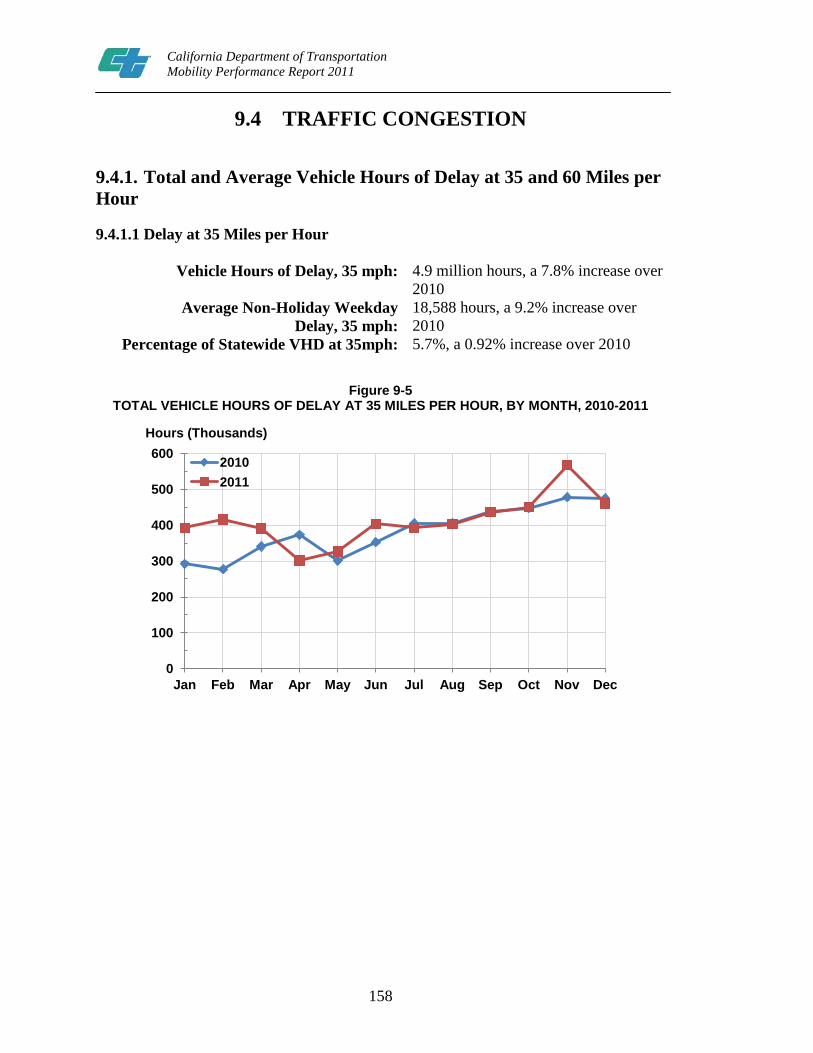
158
California Department of Transportation Mobility Performance Report 2011
9.4 TRAFFIC CONGESTION
9.4.1. Total and Average Vehicle Hours of Delay at 35 and 60 Miles per Hour
9.4.1.1 Delay at 35 Miles per Hour
Vehicle Hours of Delay, 35 mph: 4.9 million hours, a 7.8% increase over 2010
Average Non-Holiday Weekday Delay, 35 mph:
18,588 hours, a 9.2% increase over 2010
Percentage of Statewide VHD at 35mph: 5.7%, a 0.92% increase over 2010
Figure 9-5 TOTAL VEHICLE HOURS OF DELAY AT 35 MILES PER HOUR, BY MONTH, 2010-2011
0
100
200
300
400
500
600
Jan Feb Mar Apr May Jun Jul Aug Sep Oct Nov Dec
2010 2011
Hours (Thousands)

159
California Department of Transportation Mobility Performance Report 2011
Figure 9-6
AVERAGE NON-HOLIDAY WEEKDAY VEHICLE HOURS OF DELAY AT 35 MILES PER HOUR, BY MONTH, 2010-2011
0
5
10
15
20
25
30
Jan Feb Mar Apr May Jun Jul Aug Sep Oct Nov Dec
2010 2011
Hours (Thousands)
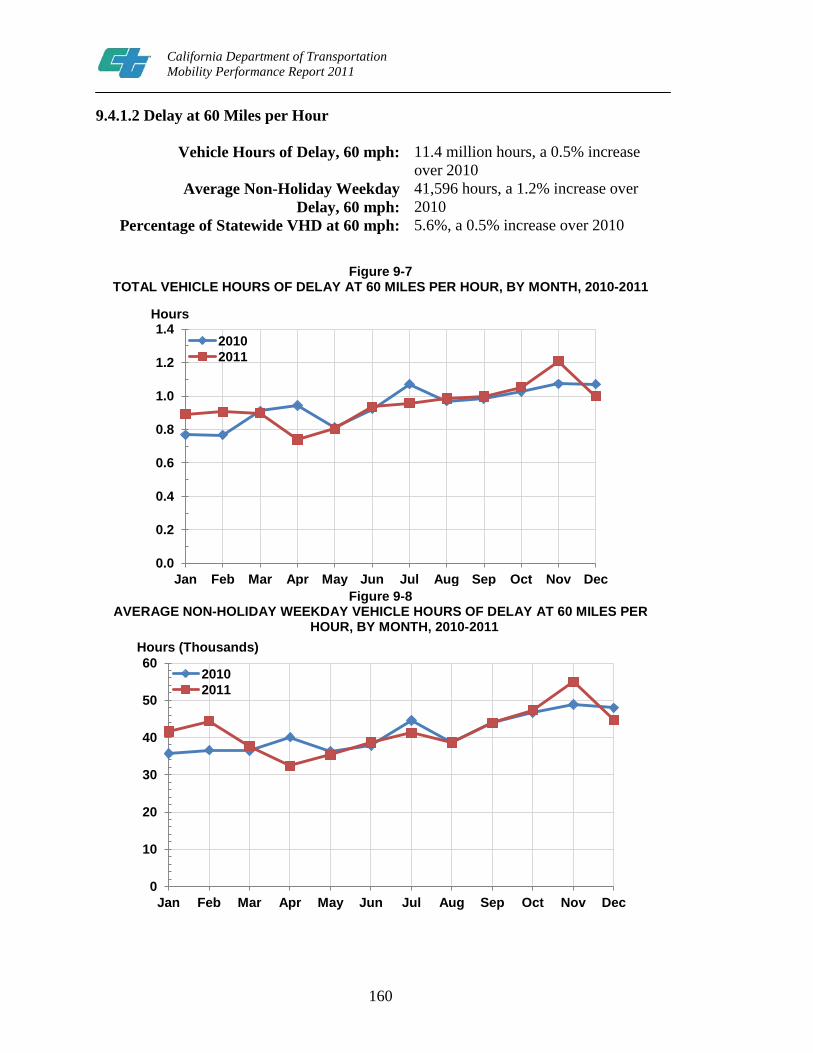
160
California Department of Transportation Mobility Performance Report 2011
9.4.1.2 Delay at 60 Miles per Hour
Vehicle Hours of Delay, 60 mph: 11.4 million hours, a 0.5% increase over 2010
Average Non-Holiday Weekday Delay, 60 mph:
41,596 hours, a 1.2% increase over 2010
Percentage of Statewide VHD at 60 mph: 5.6%, a 0.5% increase over 2010
Figure 9-7 TOTAL VEHICLE HOURS OF DELAY AT 60 MILES PER HOUR, BY MONTH, 2010-2011
Figure 9-8
AVERAGE NON-HOLIDAY WEEKDAY VEHICLE HOURS OF DELAY AT 60 MILES PER HOUR, BY MONTH, 2010-2011
0.0
0.2
0.4
0.6
0.8
1.0
1.2
1.4
Jan Feb Mar Apr May Jun Jul Aug Sep Oct Nov Dec
2010 2011
Hours
0
10
20
30
40
50
60
Jan Feb Mar Apr May Jun Jul Aug Sep Oct Nov Dec
2010 2011
Hours (Thousands)
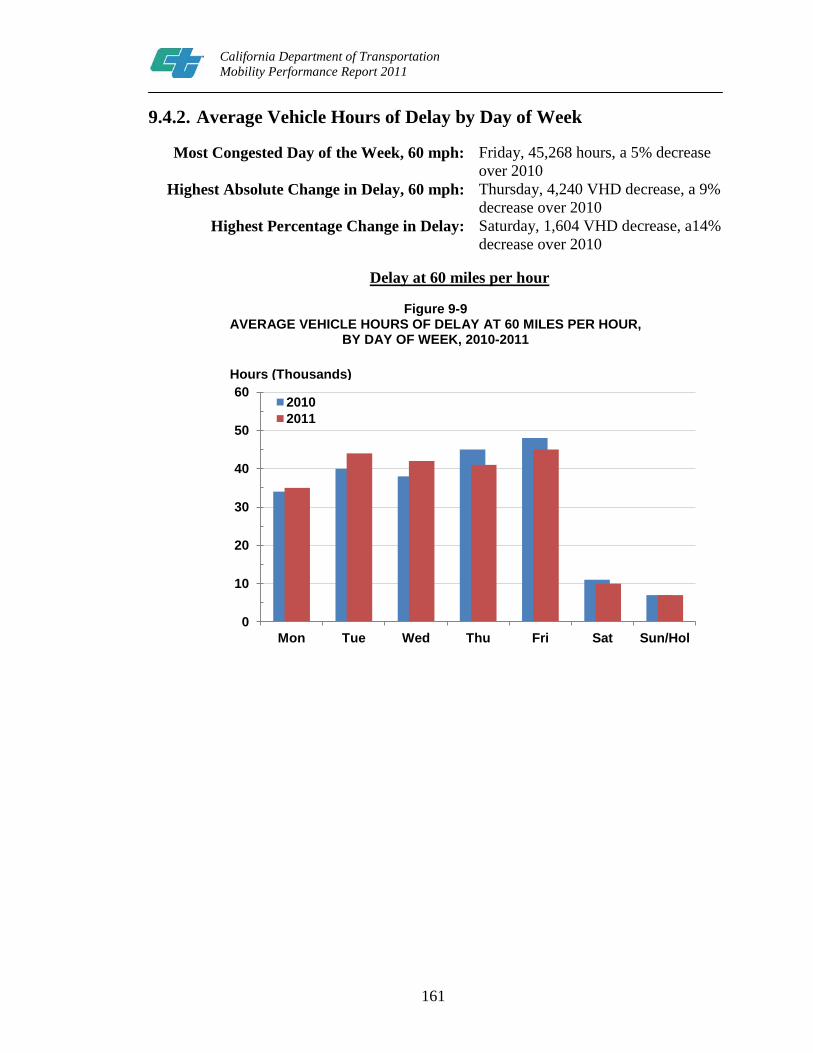
161
California Department of Transportation Mobility Performance Report 2011
9.4.2. Average Vehicle Hours of Delay by Day of Week
Most Congested Day of the Week, 60 mph: Friday, 45,268 hours, a 5% decrease over 2010
Highest Absolute Change in Delay, 60 mph: Thursday, 4,240 VHD decrease, a 9% decrease over 2010
Highest Percentage Change in Delay: Saturday, 1,604 VHD decrease, a14% decrease over 2010
Delay at 60 miles per hour
Figure 9-9 AVERAGE VEHICLE HOURS OF DELAY AT 60 MILES PER HOUR,
BY DAY OF WEEK, 2010-2011
0
10
20
30
40
50
60
Mon Tue Wed Thu Fri Sat Sun/Hol
2010 2011
Hours (Thousands)

162
California Department of Transportation Mobility Performance Report 2011
9.4.3. Average Vehicle Hours of Delay by Hour of Day
9.4.3.1 Delay at 35 Miles per Hour
Weekday PM Peak Hour, 35 mph: 5 PM, 4,404 hours, a 1% increase over 2010 Weekday AM Peak Hour, 35 mph: 8 AM, 2,196 hours, a 10% increase over 2010
Saturday Peak Hour, 35 mph: 12 PM, 467 hours, a 15% decrease over 2010 Sunday/Holiday Peak Hour, 35 mph: 1 PM, 228 hours, a 3% increase over 2010
Figure 9-10 AVERAGE VEHICLE HOURS OF DELAY AT 35 MILES PER HOUR,
BY HOUR OF DAY, 2010-2011
0.0
0.5
1.0
1.5
2.0
2.5
3.0
3.5
4.0
4.5
5.0 Weekdays (2010) Weekdays (2011) Saturdays (2010) Saturdays (2011) Sundays/Holidays (2010) Sundays/Holidays (2011)
Hours (Thousands)

163
California Department of Transportation Mobility Performance Report 2011
9.4.3.2 Delay at 35 Miles per Hour
Weekday PM Peak Hour, 60 mph: 5 PM, 8,602 hours, a 2% decrease over 2010 Weekday AM Peak Hour, 60 mph: 7 AM, 4,667 hours, a 9% increase over 2010
Saturday Peak Hour, 60 mph: 1 PM, 1,357 hours, a 9% decrease over 2010 Sunday/Holiday Peak Hour,
60mph: 1 PM, 698 hours, a 1% increase over 2010
Figure 9-11 AVERAGE VEHICLE HOURS OF DELAY AT 60 MILES PER HOUR,
BY HOUR OF DAY, 2010-2011
0
1
2
3
4
5
6
7
8
9
10 Weekdays (2010) Weekdays (2011) Saturdays (2010) Saturdays (2011) Sundays/Holidays (2010) Sundays/Holidays (2011)
Hours (Thousands)

164
California Department of Transportation Mobility Performance Report 2011
9.4.4. Total Vehicle Hours of Delay by County
County with Largest Delay, 60 mph: San Diego, 11.4 million hours, a 0.5% increase over 2010 VHD, 100% of District total VHD
County with Largest Increase in Delay, 60 mph:
San Diego, 57,680 hours, a 0.5% increase over 2010
Delay at 60 miles per hour
Figure 9-12 TOTAL ANNUAL VEHICLE HOURS OF DELAY AT 60 MILES PER HOUR,
BY COUNTY, 2010-2011
0
3
6
9
12
15
San Diego County
2010 2011
Hours (Millions)
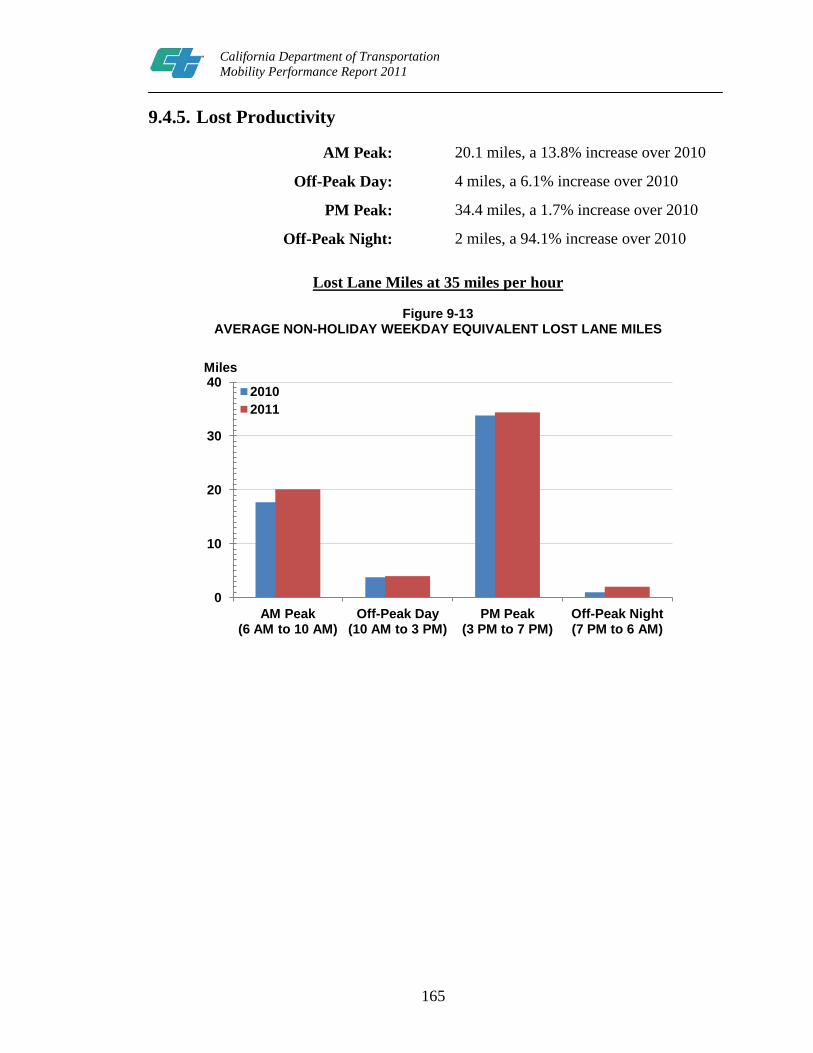
165
California Department of Transportation Mobility Performance Report 2011
9.4.5. Lost Productivity
AM Peak: 20.1 miles, a 13.8% increase over 2010
Off-Peak Day: 4 miles, a 6.1% increase over 2010
PM Peak: 34.4 miles, a 1.7% increase over 2010
Off-Peak Night: 2 miles, a 94.1% increase over 2010
Lost Lane Miles at 35 miles per hour
Figure 9-13 AVERAGE NON-HOLIDAY WEEKDAY EQUIVALENT LOST LANE MILES
0
10
20
30
40
AM Peak (6 AM to 10 AM)
Off-Peak Day (10 AM to 3 PM)
PM Peak (3 PM to 7 PM)
Off-Peak Night (7 PM to 6 AM)
Miles
2010 2011
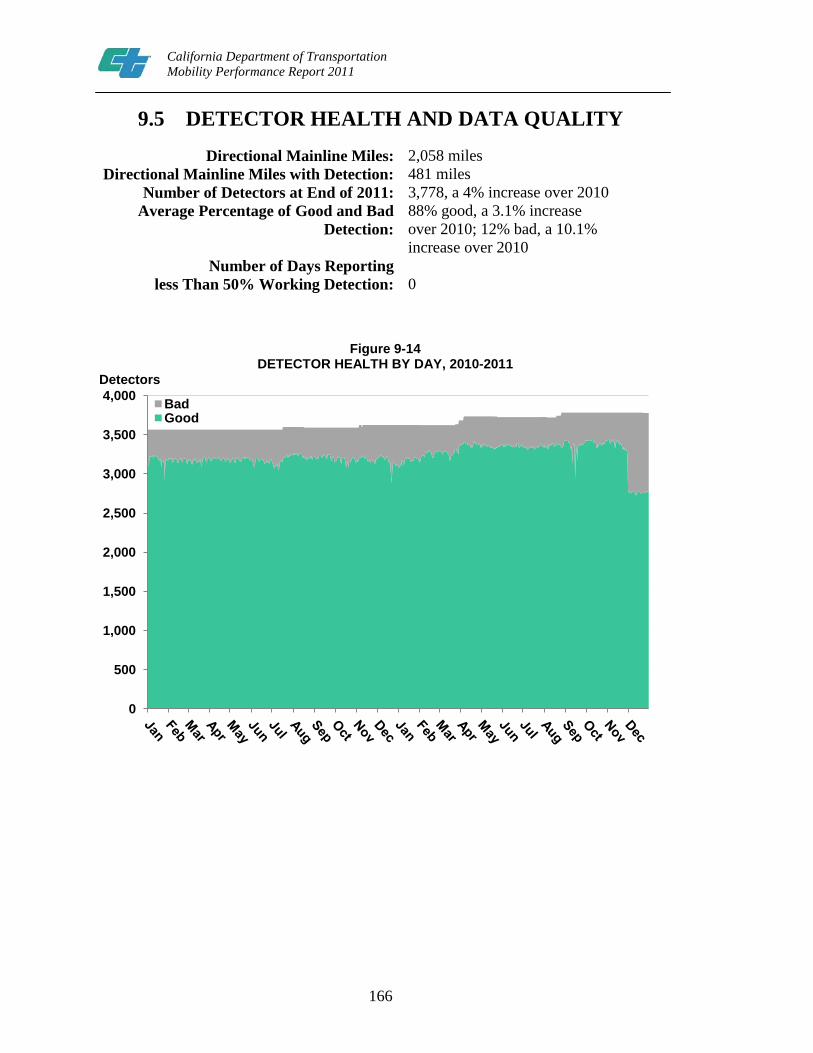
166
California Department of Transportation Mobility Performance Report 2011
9.5 DETECTOR HEALTH AND DATA QUALITY
Directional Mainline Miles: 2,058 miles Directional Mainline Miles with Detection: 481 miles
Number of Detectors at End of 2011: 3,778, a 4% increase over 2010 Average Percentage of Good and Bad
Detection: 88% good, a 3.1% increase over 2010; 12% bad, a 10.1% increase over 2010
Number of Days Reporting less Than 50% Working Detection:
0
Figure 9-14 DETECTOR HEALTH BY DAY, 2010-2011
0
500
1,000
1,500
2,000
2,500
3,000
3,500
4,000 Bad Good
Detectors

167
California Department of Transportation Mobility Performance Report 2011
9.6 FREEWAY CONGESTION AND BOTTLENECK LOCATIONS
9.6.1. Congestion by Freeway
Congestion Contributed by Top Ten Congested Freeways:
11,347,291 hours, 99.8% of total VHD in 2011
Table 9-3
TOP TEN CONGESTED FREEWAYS, 2010-2011 Top Congested Freeways
Route County Vehicle Hours of Delay
at 60 mph Difference
(2011 - 2010) Rank
2010 2011 Absolute % 2010 2011
I–5 San Diego 3,741,796 3,920,871 179,075 5% 1 1 I–15 San Diego 2,634,179 2,013,483 -620,696 -24% 2 2 I–805 San Diego 1,735,572 1,659,154 -76,418 -4% 3 3 SR–163 San Diego 351,858 1,259,653 907,796 258% 6 4 SR–78 San Diego 1,335,425 1,021,650 -313,775 -23% 4 5 I–8 San Diego 696,858 540,344 -156,514 -22% 5 6 SR–52 San Diego 190,362 370,371 180,009 95% 8 7 SR–56 San Diego 249,614 229,686 -19,928 -8% 7 8 SR–94 San Diego 189,905 204,937 15,032 8% 9 9 SR–125 San Diego 154,528 127,142 -27,386 -18% 10 10
TOTALS 11,280,096 11,347,291 67,195 0.6% Numbers may not sum to total due to rounding.

168
California Department of Transportation Mobility Performance Report 2011
9.6.2. Bottleneck Locations Total Delay, All AM Bottlenecks, 2011: 1,008,757 hours
Top Bottleneck Delay, AM, 2011: 872,822 hours Percentage Top Bottleneck Delay of Total Bottleneck Delay,
AM, 2011: 87%
Table 9–4 (A) DISTRICT 11 TOP BOTTLENECKS, AM PEAK PERIOD, 2011
Rank County City Freeway CA Post-
mile Approximate Location
Average Extent (miles)
Total Delay
(hours)
Average Daily Delay
(hours)
Average Duration (hours)
% of Days
Active
1 San Diego San Diego I805-N 22.458 Eastbound Clairemont
Mesa Blvd 2.43 198,937 869 1.9 91%
2 San Diego Encinitas I5-S R38.832 North of Manchester
Ave 6.70 183,367 1,054 0.9 69%
3 San Diego Escondido I15-S R29.97 9th Ave 2.34 166,673 700 2.0 95%
4 San Diego San Diego SR163-S 2.49 Robinson Ave 2.35 70,686 498 2.5 57%
5 San Diego San Diego I15-S M17.241 Mercy Rd 1.44 67,740 474 2.6 57%
6 San Diego Escondido I15-S R28.621 Citricado Pkwy 3.76 56,980 570 1.2 40%
7 San Diego National City I5-N R11.282 North of 8th St 2.53 47,331 305 0.6 62%
8 San Diego San Diego SR94-W 1.571 F St at I–5 1.59 32,947 329 0.9 40%
9 San Diego Carlsbad I5-N R50.451 South of Las Flores Dr 0.70 28,729 338 5.0 34%
10 San Diego La Mesa I8-W 10.517 Westbound Fletcher
Pkwy 1.30 19,432 162 0.7 48%
Total Delay, All PM Bottlenecks, 2011: 2,531,669 hours Top Bottleneck Delay, PM, 2011: 1,344,618 hours Percentage Top Bottleneck Delay of Total Bottleneck Delay, PM,
2011: 53%
Table 9–4 (B) DISTRICT 11 TOP BOTTLENECKS, PM PEAK PERIOD, 2011
Rank County City Freeway CA Post-
mile Approximate Location
Average Extent (miles)
Total Delay
(hours)
Average Daily Delay
(hours)
Average Duration (hours)
% of Days
Active
1 San Diego San Marcos SR78-E 14.86 Barham Dr 4.48 354,016 1,451 2.8 97%
2 San Diego San Diego I5-N R37.37 Lomas Santa Fe Dr
Eastbound 4.03 175,131 854 1.6 82%
3 San Diego San Diego I805-S 25.249 Nobel Dr 1.60 169,886 691 2.9 98%
4 San Diego San Diego SR56-E 1.89 Carmel Country Rd 2.40 132,529 616 1.9 86%
5 San Diego San Diego I805-S 26.95 Sorrento Valley Rd 2.15 124,226 722 2.6 69%
6 San Diego San Diego SR163-S 2.49 Robinson Ave 2.48 117,033 693 3.3 67%
7 San Diego San Diego I5-S R25.848 La Jolla Pkwy/SR–52 3.76 69,365 694 1.4 40%
8 San Diego San Diego SR52-E 10.05 East of Santo Rd 3.35 69,018 397 1.4 69%
9 San Diego Encinitas I5-N R38.54 Manchester Ave 5.01 67,287 821 0.8 33%
10 San Diego Carlsbad I5-N R50.451 South of Las Flores Dr 0.74 66,127 472 4.6 56%

169
California Department of Transportation Mobility Performance Report 2011
Figure 9-15(A)
BOTTLENECKS AND CONGESTED SEGMENTS, AM PEAK PERIOD

170
California Department of Transportation Mobility Performance Report 2011
Figure 9-15(B) BOTTLENECKS AND CONGESTED SEGMENTS, PM PEAK PERIOD
171
California Department of Transportation Mobility Performance Report 2011
Chapter 10
10.1 SUMMARY ANALYSIS Caltrans District 12 is composed of Orange County. This district has a population of
3.05 million people and represents 8.1% of California’s total population. Between 2010 and 2011 District 12 saw a population increase of 1%. While this is not a substantial increase in population, the amount of roadway congestion has noticeably increased due to a decline in the unemployment rate.
In 2011, the employment monthly average was 1,460,042. The unemployment
rate of 8.8% indicates that job growth turned positive in 2011 with a 0.7% increase in employment.
District 12’s Vehicle Miles Traveled (VMT) increased by 2.5 million. The overall increase in VMT can be attributed to an increase in population. Also, economic revitalization and reorganization play important roles in the demand increase. Economic revitalization has produced job growth, economic reorganization has increased school enrollment. More people are returning to school; for specialized training, degree completion and graduate education. The I-405 corridor is the main access for many universities such as University of California Irvine and California State University of Long Beach.
Traffic congestion decreased for District 12 in 2011. This is partially attributed to the completion of the SR-91 widening between SR-55 and SR-241 and the Southbound SR-55 between Edinger Ave to Dyer Road. Vehicle Hours of Delay (VHD) at 35 miles per hour (VHD35), a measure of severe congestion, decreased by 17.3% in 2011. Vehicle Hours of Delay at 60 miles per hour (VHD60), a measure of moderate congestion, decreased by 11.7% in 2011. District 12 VHD60 accounted for 11.4% of California’s total VHD60.
In 2011, District 12 maintained and operated 578 directional mainline miles. 383 miles had detection. The number of detectors for 2011 remained the same as 2010. Of those detectors, 76% operated in good condition, a decrease of 3.8% from 2010. This reduction was partially caused by construction on the SR-91 between SR-55 and SR-241, and the Southbound SR-55 between Edinger Ave to Dyer Road. Hardware and software failure, and normal wear also contribute to reduced detector operation. The number of detectors reporting less than 50% working detection was 0.
Most of the congestion and bottlenecks in District 12 is attributed to freeways Rte 55, I-405, I-5 and Rte 57. The worst bottleneck in District 12 in 2010 was eliminated by the completion of the Rte-91 widening between Rte-55 and Rte-241.
In both the 2010 and 2011 AM period, the bottleneck along Southbound Rte-57 at Chapman Ave is a significant issue. This interchange serves high volume traffic generated by California State University of Fullerton, which is adjacent to the

172
California Department of Transportation Mobility Performance Report 2011
interchange and is upstream of SR-91. This bottleneck has dropped from 2nd worst bottleneck in 2010, to 10th in 2011. The average daily delay fell from 707 VHD in 2010 to 572 VHD in 2011.
The AM bottleneck along Southbound Rte-57 at Rte-22/I-5 is new in 2011. This location is a major weave area with consecutive on-ramps and major connectors to both Southbound I-5 and Rte-22. During the AM period there is congestion along Southbound I-5 that stretches up to the Southbound Rte-57 mainline.
Heavy congestion has produced a bottleneck on Southbound I-405 . The lack of capacity of the 4 lane freeway facility to serve the heavy demand of 9500 vehicles per hour in this specific segment results in an AM bottleneck at Southbound I-405 at Bushard Street. The average demand per lane is approximately 2330 vehicles per hour per lane. This number exceeds the maximum average lane capacity of 2200 vehicle per hour per lane. This has produced a level-of-service F in the segment and a bottleneck.
The PM bottleneck at Northbound Rte-57 at Tonner Canyon has dropped from 2nd worst PM bottleneck in 2010, to 6th worst in 2011. The average daily delay reported fell from 2,434 to 1,004. There is an ongoing project to widen Northbound Rte-57 started in late 2010 that has affected the traffic patterns and systems for data detection. This location is a bottleneck because of the vertical grade; and a proposed (but unfunded) truck climbing lane may alleviate this congestion.
Heavy congestion has produced a bottleneck on Northbound I-405 at Brookhurst Street. The lack of capacity of this 4 lane freeway segment fails to serve the demand of 8600 vehicle per hour. This results in the PM Bottleneck at Northbound I-405 at Brookhurst Street. There is also an auxiliary lane that ends at this segment, increasing congestion as auxiliary lane users attempt to merge. The lack of capacity and auxiliary lane merging combines to cause a level-of-service F and a bottleneck.
Heavy congestion has produced a PM bottleneck on Northbound I-405 at Magnolia St. The lack of capacity of the 4 through lanes and one auxiliary lane freeway segment to serve a demand of 8500 vehicle per hour result the PM Bottleneck at Northbound I-405 at Magnolia St. There is also a mandatory lane drop at the northern off-ramp at Beach Blvd. increasing congestion as drivers merge. The lack of capacity and lane drop off produces a level-of-service F in the segment and a bottleneck.

173
California Department of Transportation Mobility Performance Report 2011
10.2 DESCRIPTIVE STATISTICS
District Headquarters: Irvine Counties: Orange
Counties without Detection: none
Population: 3,057,879; a 1.0% increase Population as a Percentage of Statewide: 8.1%
Table 10-1. POPULATION ESTIMATES, ABSOLUTE, AND PERCENT CHANGE, 2010–2011
County 2010 Revised† 2011‡
Difference (2011 - 2010 Revised)
Population Population Absolute Percent Orange 3,028,846 3,057,879 29,033 1.0%
Total 3,028,846 3,057,879 29,033 1.0% Sources †: State of California, Department of Finance, E-1 Population Estimates for Cities, Counties, and the State with Annual Percent Change — January 1, 2011 and 2012. Sacramento, California, May 2012. ‡: State of California, Department of Finance, E-1 Population Estimates for Cities, Counties, and the State with Annual Percent Change — January 1, 2012 and 2013. Sacramento, California, May 2013. Numbers may not sum to total due to rounding.
Figure 10-1 POPULATION, BY COUNTY, 2010–2011
0.0
0.5
1.0
1.5
2.0
2.5
3.0
3.5
4.0
Orange
2010 Revised
2011
Millions
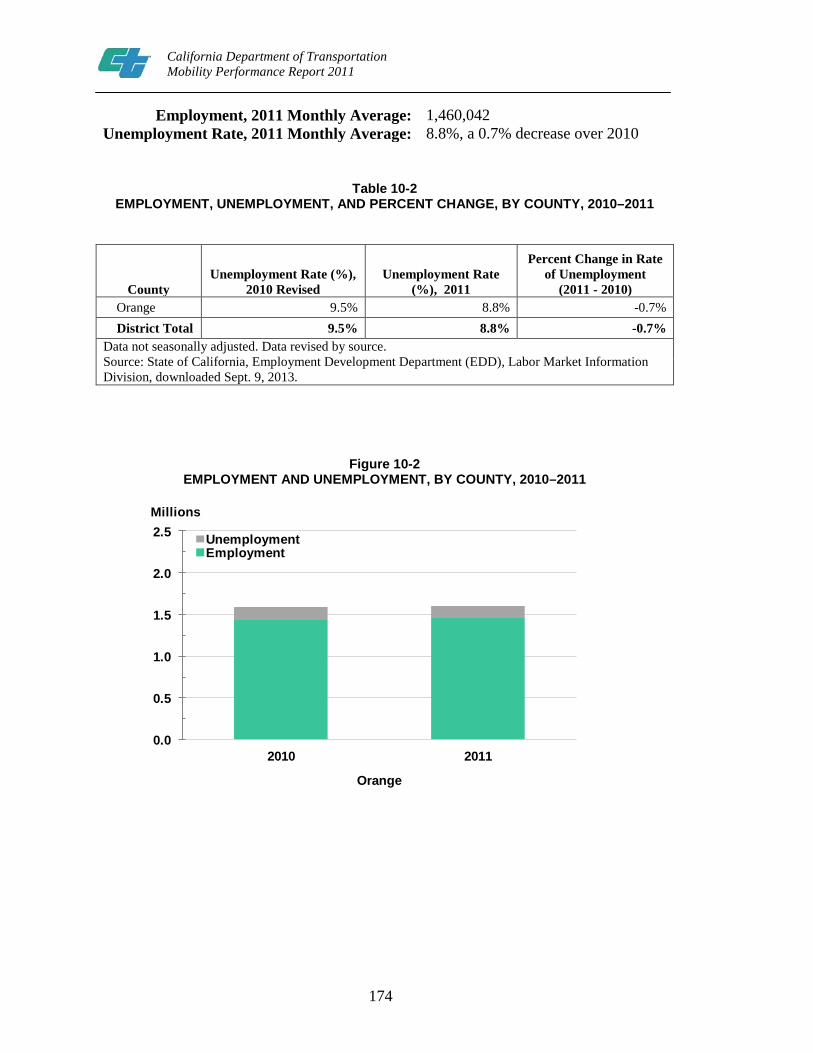
174
California Department of Transportation Mobility Performance Report 2011
Employment, 2011 Monthly Average: 1,460,042 Unemployment Rate, 2011 Monthly Average: 8.8%, a 0.7% decrease over 2010
Table 10-2
EMPLOYMENT, UNEMPLOYMENT, AND PERCENT CHANGE, BY COUNTY, 2010–2011
County Unemployment Rate (%),
2010 Revised Unemployment Rate
(%), 2011
Percent Change in Rate of Unemployment
(2011 - 2010) Orange 9.5% 8.8% -0.7% District Total 9.5% 8.8% -0.7%
Data not seasonally adjusted. Data revised by source. Source: State of California, Employment Development Department (EDD), Labor Market Information Division, downloaded Sept. 9, 2013.
Figure 10-2
EMPLOYMENT AND UNEMPLOYMENT, BY COUNTY, 2010–2011
0.0
0.5
1.0
1.5
2.0
2.5
2010 2011
Orange
UnemploymentEmployment
Millions

175
California Department of Transportation Mobility Performance Report 2011
10.3 TRAVEL DEMAND
Vehicle Miles of Travel, 2011: 11.7 billion miles Absolute and Percentage Change over 2010: 2.5 million VMT increase; a 0.02% increase
over 2010 Peak Travel Month, Percentage Change over
2010: August, 1 billion miles, a 0.1% decrease over 2010
Monthly Trend Figure 10-3
TOTAL VEHICLE MILES OF TRAVEL, BY MONTH, 2010–2011
County Trend
Figure 10-4 TOTAL VEHICLE MILES OF TRAVEL, BY COUNTY, 2010–2011
0
0.4
0.8
1.2
Jan Feb Mar Apr May Jun Jul Aug Sep Oct Nov Dec
2010 2011
Miles (Billions)
0
5
10
15
Orange County
2010 2011
Miles (Billions)

176
California Department of Transportation Mobility Performance Report 2011
10.4 TRAFFIC CONGESTION
10.4.1. Total and Average Vehicle Hours of Delay at 35 and 60 Miles per Hour
10.4.1.1 Delay at 35 Miles per Hour
Vehicle Hours of Delay, 35 mph: 10.2 million hours, a 17.3% decrease over 2010
Average Non-Holiday Weekday Delay, 35 mph:
35,699 hours, a 16.5% decrease over 2010
Percentage of Statewide VHD at 35 mph: 11.8%, a 1.1% decrease over 2010
Figure 10-5 TOTAL VEHICLE HOURS OF DELAY AT 35 MILES PER HOUR, BY MONTH, 2010–2011
0.0
0.2
0.4
0.6
0.8
1.0
1.2
1.4
Jan Feb Mar Apr May Jun Jul Aug Sep Oct Nov Dec
2010 2011
Hours (Millions)

177
California Department of Transportation Mobility Performance Report 2011
Figure 10-6
AVERAGE NON-HOLIDAY WEEKDAY VEHICLE HOURS OF DELAY AT 35 MILES PER HOUR, BY MONTH, 2010–2011
0
10
20
30
40
50
60
Jan Feb Mar Apr May Jun Jul Aug Sep Oct Nov Dec
2010 2011
Hours (Thousands)
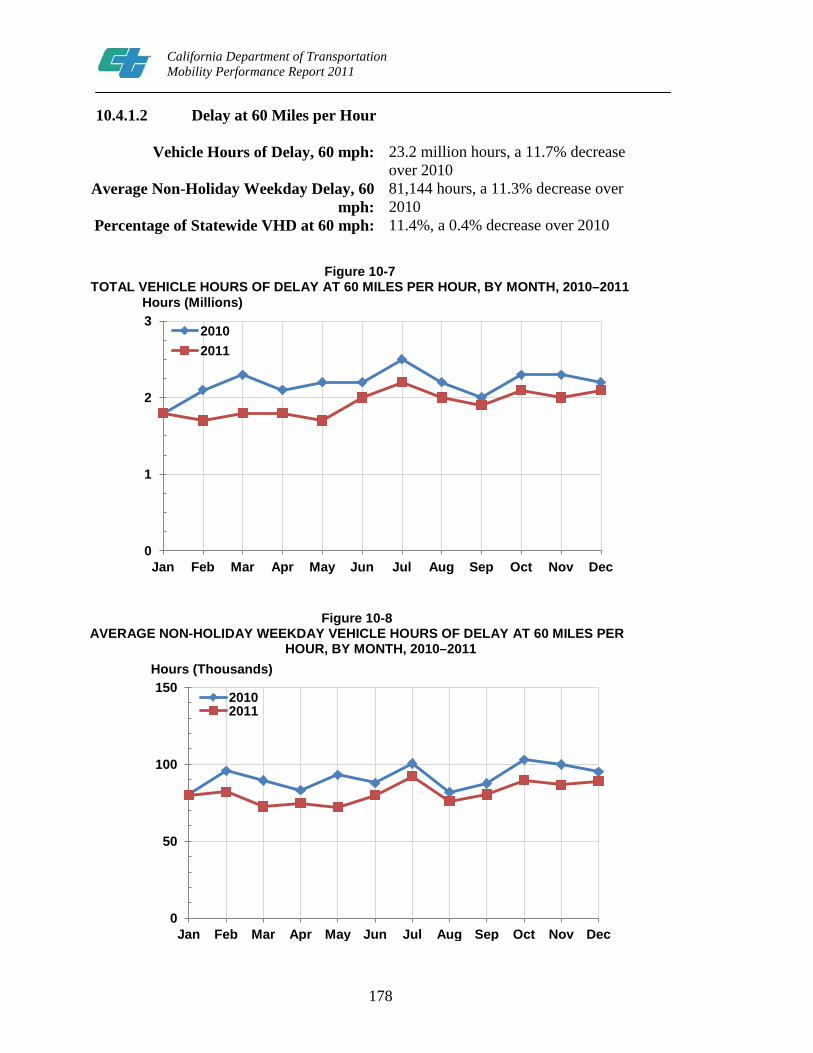
178
California Department of Transportation Mobility Performance Report 2011
10.4.1.2 Delay at 60 Miles per Hour
Vehicle Hours of Delay, 60 mph: 23.2 million hours, a 11.7% decrease over 2010
Average Non-Holiday Weekday Delay, 60 mph:
81,144 hours, a 11.3% decrease over 2010
Percentage of Statewide VHD at 60 mph: 11.4%, a 0.4% decrease over 2010
Figure 10-7 TOTAL VEHICLE HOURS OF DELAY AT 60 MILES PER HOUR, BY MONTH, 2010–2011
Figure 10-8 AVERAGE NON-HOLIDAY WEEKDAY VEHICLE HOURS OF DELAY AT 60 MILES PER
HOUR, BY MONTH, 2010–2011
0
1
2
3
Jan Feb Mar Apr May Jun Jul Aug Sep Oct Nov Dec
2010 2011
Hours (Millions)
0
50
100
150
Jan Feb Mar Apr May Jun Jul Aug Sep Oct Nov Dec
2010 2011
Hours (Thousands)

179
California Department of Transportation Mobility Performance Report 2011
10.4.2. Average Vehicle Hours of Delay by Day of Week
Most Congested Day of the Week, 60 mph: Thursday, 90,458 hours, a 5% decrease over 2010
Highest Absolute Change in Delay, 60 mph: Friday, 23,736 VHD decrease, a 22% decrease over 2010
Highest Percentage Change in Delay: Friday, 23,736 VHD decrease, a 22% decrease over 2010
Delay at 60 miles per hour
Figure 10-9 AVERAGE VEHICLE HOURS OF DELAY AT 60 MILES
PER HOUR, BY DAY OF WEEK, 2010–2011
0
20
40
60
80
100
120
Mon Tue Wed Thu Fri Sat Sun/Hol
2010 2011
Hours (Thousands)

180
California Department of Transportation Mobility Performance Report 2011
10.4.3. Average Vehicle Hours of Delay by Hour of Day
10.4.3.1 Delay at 35 Miles per Hour
Weekday PM Peak Hour, 35 mph: 5 PM, 7,336 hours, a 16% decrease over 2010 Weekday AM Peak Hour, 35 mph: 8 AM, 4,093 hours, a 5% decrease over 2010
Saturday Peak Hour, 35 mph: 1 PM, 1,589 hours, a 31% decrease over 2010 Sunday/Holiday Peak Hour, 35 mph: 1 PM, 766 hours, a 24% decrease over 2010
Delay at 35 miles per hour
Figure 10-10 AVERAGE VEHICLE HOURS OF DELAY AT 35 MILES
PER HOUR, BY HOUR OF DAY, 2010–2011
0
2
4
6
8
10 Weekdays (2010) Weekdays (2011) Saturdays (2010) Saturdays (2011) Sundays/Holidays (2010) Sundays/Holidays (2011)
Hours (Thousands)

181
California Department of Transportation Mobility Performance Report 2011
10.4.3.2 Delay at 60 Miles per Hour
Weekday PM Peak Hour, 60 mph: 5 PM, 13,988 hours, a 10% decrease over 2010 Weekday AM Peak Hour, 60 mph: 8 AM, 8,441 hours, a 6% decrease over 2010
Saturday Peak Hour, 60 mph: 1 PM, 3,252 hours, a 25% decrease over 2010 Sunday/Holiday Peak Hour, 60
mph: 1 PM, 1,675 hours, a 21% decrease over 2010
Delay at 60 miles per hour
Figure 10-11 AVERAGE VEHICLE HOURS OF DELAY AT 60 MILES
PER HOUR, BY HOUR OF DAY, 2010–2011
0
5
10
15
20 Weekdays (2010) Weekdays (2011) Saturdays (2010) Saturdays (2011) Sundays/Holidays (2010) Sundays/Holidays (2011)
Hours (Thousands)

182
California Department of Transportation Mobility Performance Report 2011
10.4.4 Total Vehicle Hours of Delay by County
County with Largest Delay, 60 mph: Orange, 23.2 million hours, a 11.7% decrease over 2010 VHD, 100% of District total VHD
Delay at 60 miles per hour
Figure 10-12 TOTAL ANNUAL VEHICLE HOURS OF DELAY AT 60 MILES
PER HOUR, BY COUNTY, 2010–2011
0
10
20
30
Orange County
2010 2011
Hours (Millions)

183
California Department of Transportation Mobility Performance Report 2011
10.4.5 Lost Productivity
AM Peak: 37.5 miles, a 13.1% increase over 2010
Off-Peak Day: 12.4 miles, a 5.2% decrease over 2010
PM Peak: 65.4 miles, a 11.2% decrease over 2010
Off-Peak Night: 8.4 miles, a 20.9% increase over 2010
Lost Lane Miles at 35 miles per hour
Figure 10-13 AVERAGE NON-HOLIDAY WEEKDAY EQUIVALENT LOST LANE MILES
0
20
40
60
80
AM Peak (6 AM to 10 AM)
Off-Peak Day (10 AM to 3 PM)
PM Peak (3 PM to 7 PM)
Off-Peak Night (7 PM to 6 AM)
Miles
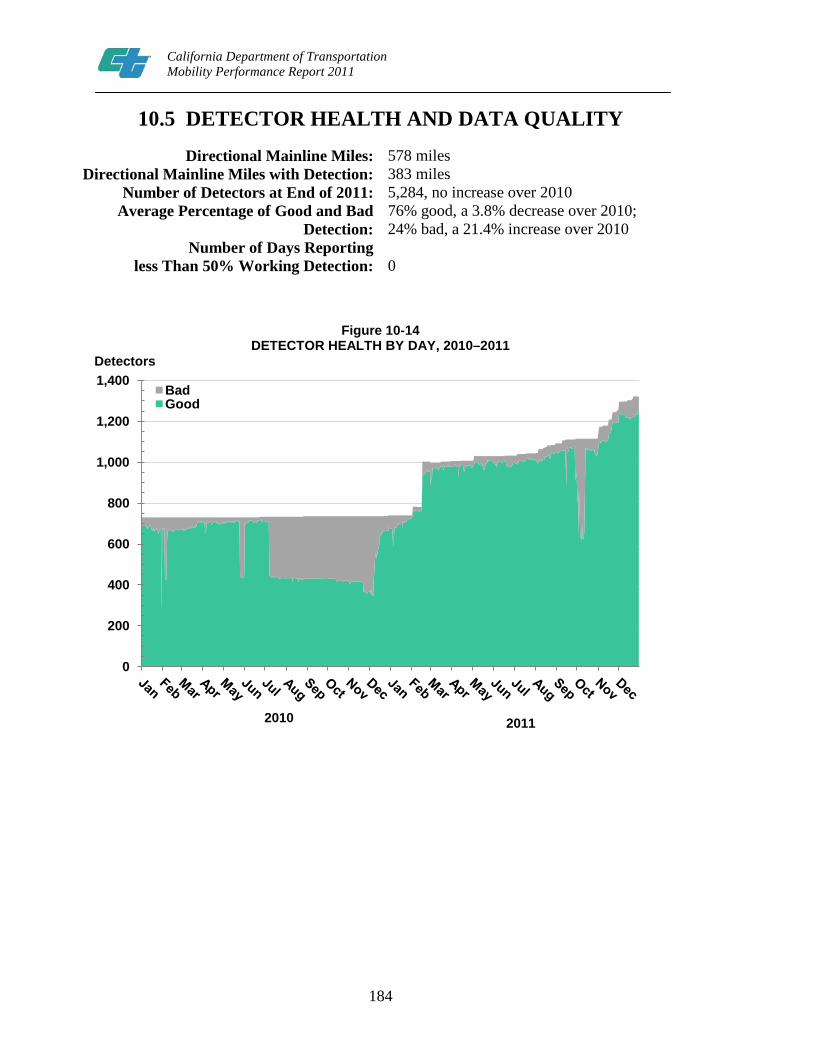
184
California Department of Transportation Mobility Performance Report 2011
10.5 DETECTOR HEALTH AND DATA QUALITY
Directional Mainline Miles: 578 miles Directional Mainline Miles with Detection: 383 miles
Number of Detectors at End of 2011: 5,284, no increase over 2010 Average Percentage of Good and Bad
Detection: 76% good, a 3.8% decrease over 2010; 24% bad, a 21.4% increase over 2010
Number of Days Reporting less Than 50% Working Detection:
0
Figure 10-14 DETECTOR HEALTH BY DAY, 2010–2011
0
200
400
600
800
1,000
1,200
1,400 Bad Good
Detectors
2011 2010

185
California Department of Transportation Mobility Performance Report 2011
10.6 FREEWAY CONGESTION AND BOTTLENECK LOCATIONS
10.6.1. Congestion by Freeway
Congestion Contributed by Top Ten Congested Freeways:
23,193,993 hours, 99.9% of total VHD in 2011
Table 10-3
TOP CONGESTED FREEWAYS, 2010–2011
Route County Vehicle Hours of Delay
at 60 mph Difference
(2011 -2010) Rank
2010 2011 Absolute % 2010 2011
I–5 Orange 8,151,568 7,728,734 -422,835 -5% 1 1 I–405 Orange 5,466,763 5,436,501 -30,262 -1% 2 2 SR–91 Orange 5,169,147 3,657,120 -1,512,028 -29% 3 3 SR–55 Orange 2,587,346 2,356,787 -230,559 -9% 5 4 SR–57 Orange 3,167,448 2,165,512 -1,001,937 -32% 4 5 SR–22 Orange 1,027,541 1,069,336 41,795 4% 6 6 SR–73 Orange 285,296 358,253 72,957 26% 7 7 SR–241 Orange 166,113 202,343 36,230 22% 9 8 I–605 Orange 241,665 174,457 -67,207 -27.8% 8 9 SR–261 Orange 21,703 44,951 23,248 107% 10 10 TOTALS 26,284,590 23,193,993 -3,090,597 -11.8% Numbers may not sum to total due to rounding.

186
California Department of Transportation Mobility Performance Report 2011
10.6.2. Bottleneck Locations
Total Delay, All AM Bottlenecks, 2011: 2,272,756 hours Top Bottleneck Delay, AM, 2011: 1,088,696 hours Percentage Top Bottleneck Delay of Total Bottleneck Delay,
AM, 2011: 48%
Table 10–4 (A) DISTRICT 12 TOP BOTTLENECKS, AM PEAK PERIOD, 2011
Rank County City Freeway
CA Post-mile
Approximate Location
Average Extent (miles)
Total Delay
(hours)
Average Daily Delay
(hours)
Average Duration (hours)
% of Days
Active 1 Orange Orange SR55–S 13.20 La Veta Ave 1.96 163,787 700 2.3 93% 2 Orange Orange SR57–S 10.80 Rte SR–22 & I–5 2.18 135,036 575 1.9 94% 3 Orange Tustin SR55–S 10.40 South of I–5 1.98 122,645 499 1.9 98%
4 Orange Huntington
Beach I405–S 16.26 Edinger Ave 2.77 116,557 694 1.8 67% 5 Orange Irvine I405–N 4.03 Jeffrey Rd 2 2.55 112,226 534 1.7 84%
6 Orange Mission
Viejo I5–N 15.35 Oso Parkway 1.41 98,794 426 1.8 92%
7 Orange Huntington
Beach I405–S 16.60 Beach Blvd 3.31 91,943 730 1.4 50%
8 Orange Fountain Valley I405–S 14.54 Bushard St 1.42
83,743 349 1.8 96%
9 Orange Santa Ana I5–S 30.90 1st St 1.53 82,718 378 1.3 87% 10 Orange Orange SR57–S 17.18 Chapman Ave 2.45 81,247 572 2.0 57%
Total Delay, All PM Bottlenecks, 2011: 4,631,523 hours Top Bottleneck Delay, PM, 2011: 2,448,437 hours Percentage Top Bottleneck Delay of Total Bottleneck Delay,
PM, 2011: 53%
Table 10–4 (B) DISTRICT 12 TOP BOTTLENECKS, PM PEAK PERIOD, 2011
Rank County City Freeway
CA Post-mile
Approximate Location
Average Extent (miles)
Total Delay
(hours)
Average Daily Delay
(hours)
Average Duration (hours)
% of Days
Active
1 Orange Fountain Valley I405–N 13.97 Brookhurst St 4.16 530,277
2,121 3.3 100%
2 Orange Santa Ana I5–N 32.60 17th St 3 1.99 279,382 1,118 3.2 100% 3 Orange Tustin I5–N 29.24 Red Hills Ave 3.39 245,844 1,112 1.8 88%
4 Orange Laguna
Hills I5–S 18.70 El Toro Rd 2.79
243,781
1,007 2.0 96% 5 Orange Anaheim SR91–E R16.6 Gypsum Canyon 2.44 231,369 1,107 2.3 83% 6 Orange Brea SR57–N 22.00 Tonner Canyon 3.25 199,825 1,004 2.1 79% 7 Orange Irvine I405–S 3.84 Jeffrey Rd 3.13 194,992 851 2.0 91% 8 Orange Santa Ana SR55–N R8.12 Dyer Rd 2 1.73 189,536 898 2.8 84%
9 Orange Fountain Valley I405–N 15.39 Magnolia Ave 4.45
174,699
998 1.3 70%
10 Orange Anaheim SR91–E R18.43
5 East of Coal
Canyon 2.87 158,733 810 1.6 78%

187
California Department of Transportation Mobility Performance Report 2011
Figure 10-15 (A). BOTTLENECKS AND CONGESTED SEGMENTS, AM PEAK PERIOD, 2011

188
California Department of Transportation Mobility Performance Report 2011
Figure 10-15 (B). BOTTLENECKS AND CONGESTED SEGMENTS, PM PEAK PERIOD, 2011

189
California Department of Transportation Mobility Performance Report 2011
APPENDIX A
DATA TABLES

California D
epartment of Transportation
Mobility Perform
ance Report 2011
190
TABLE A-1 VEHICLE MILES OF TRAVEL, STATEWIDE TOTAL, BY DISTRICT, BY MONTH, 2010--2011
(Numbers in thousands)
District Year Jan Feb Mar Apr May Jun Jul Aug Sep Oct Nov Dec Annual Total
3 2010 629,666 602,836 686,430 663,568 680,981 683,604 708,864 715,295 682,104 690,604 644,096 665,450 8,053,498
2011 657,646 602,424 664,608 662,263 676,053 673,734 713,896 716,652 681,042 689,535 649,370 674,440 8,061,663
4 2010 1,953,285 1,921,170 2,209,457 2,160,550 2,237,443 2,227,887 2,268,960 2,288,056 2,176,028 2,237,719 2,127,653 2,172,918 25,981,126
2011 2,153,058 1,995,764 2,218,055 2,205,312 2,271,400 2,254,589 2,307,162 2,339,669 2,199,506 2,086,317 2,027,856 2,130,588 26,189,275
6 2010 164,681 162,169 177,766 175,841 208,124 206,250 201,792 202,883 193,874 196,837 186,917 186,400 2,263,534
2011 178,539 170,812 190,015 189,437 195,620 192,650 199,574 202,933 191,742 194,559 184,562 185,075 2,275,518
7 2010 2,793,068 2,643,548 3,012,318 2,932,929 3,003,887 2,943,554 3,012,858 3,036,136 2,890,508 2,960,326 2,828,350 2,852,880 34,910,361
2011 2,844,990 2,622,012 2,952,018 2,888,202 2,962,264 2,937,780 2,958,072 3,000,299 2,890,407 2,967,227 2,838,016 2,920,557 34,781,845
8 2010 917,383 902,926 1,086,857 1,061,164 1,075,628 1,074,087 1,079,621 1,103,571 1,066,679 1,103,594 1,054,607 1,068,084 12,594,201
2011 1,045,584 963,917 1,079,612 1,056,603 1,072,278 1,067,149 1,085,029 1,096,443 1,046,006 1,071,026 1,024,323 1,056,279 12,664,248
10 2010 322,093 312,468 361,722 352,910 368,736 368,499 380,689 383,049 365,685 370,919 355,445 353,916 4,296,131
2011 331,174 327,517 376,249 388,900 397,628 399,714 418,623 427,675 417,321 417,804 410,066 427,023 4,739,692
11 2010 914,149 881,884 1,010,543 976,756 1,000,947 991,622 1,025,657 1,029,777 970,406 981,289 933,348 944,869 11,661,247
2011 943,059 873,561 988,528 948,773 966,780 973,770 997,140 1,010,394 951,041 971,023 914,305 941,291 11,479,666
12 2010 925,966 880,400 1,005,705 979,966 1,001,143 997,026 1,029,122 1,031,514 973,506 990,686 943,262 961,552 11,719,848
2011 951,350 887,977 1,006,568 981,903 995,567 994,796 1,017,861 1,030,184 968,697 986,351 931,731 969,381 11,722,366
Total 2010 8,620,290 8,307,401 9,550,797 9,303,685 9,576,889 9,492,528 9,707,562 9,790,280 9,318,790 9,531,975 9,073,678 9,206,069 111,479,945
Total 2011 9,105,400 8,443,984 9,475,653 9,321,392 9,537,590 9,494,182 9,697,356 9,824,248 9,345,762 9,383,842 8,980,229 9,304,633 111,914,274

California D
epartment of Transportation
Mobility Perform
ance Report 2011 191
TABLE A-2 HISTORICAL VEHICLE HOURS OF DELAY (VHD) AT 35 MILES PER HOUR (MPH), STATEWIDE
AND DISTRICT TOTALS, PERCENT OF STATEWIDE TOTAL, BY DISTRICT, 2005-2011 (Numbers in thousands)
2005 2006 2007 2008 2009 2010 2011
District VHD at 35 mph
% of Total
VHD at 35 mph
% of Total
VHD at 35 mph
% of Total
VHD at 35 mph
% of Total
VHD at 35 mph
% of Total
VHD at 35 mph
% of Total
VHD at 35 mph
% of Total
3 5,399 6.1% 5,095 4.8% 4,178 4.5%
3,448 4.1%
3,227 4.1%
2,990 3.1%
2,989 3.5%
4 14,751 16.7% 20,361 19.2% 17,566 18.9%
16,721 19.7%
16,911 21.4%
19,883 20.8%
23,512 27.2%
6 2 0.0% 183 0.2% 55 0.1%
555 0.7%
720 0.9%
439 0.5%
320 0.4%
7 44,290 50.2% 47,620 44.9% 37,097 39.9%
38,865 45.8%
39,442 50.0%
49,210 51.4%
38,042 44.0%
8 5,055 5.7% 9,399 8.9% 8,801 9.5%
4,740 5.6%
4,547 5.8%
5,470 5.7%
5,211 6.0%
10 - 0.0% 523 0.5% 1,044 1.1%
1,152 1.4%
662 0.8%
811 0.8%
1,306 1.5%
11 8,098 9.2% 8,889 8.4% 7,866 8.5%
4,208 5.0%
3,613 4.6%
4,586 4.8%
4,942 5.7%
12 10,595 12.0% 13,932 13.1% 16,263 17.5%
15,212 17.9%
9,736 12.3%
12,306 12.9%
10,179 11.8% State-wide Total 88,190 100% 106,002 100% 92,870 100%
84,900 100%
78,858 100%
95,694 100%
86,501 100%

192
California D
epartment of Transportation
Mobility Perform
ance Report 2011
192
TABLE A-3 HISTORICAL VEHICLE HOURS OF DELAY (VHD) AT 60 MILES PER HOUR (MPH), STATEWIDE
AND DISTRICT TOTALS, PERCENT OF STATEWIDE TOTAL, BY DISTRICT, 2005–2011 (Numbers in thousands)
2005 2006 2007 2008 2009 2010 2011
District VHD at 60 mph
% of Total
VHD at 60 mph
% of Total
VHD at 60 mph
% of Total
VHD at 60 mph
% of Total
VHD at 60 mph
% of Total
VHD at 60 mph
% of Total
VHD at 60 mph
% of Total
3 11,870 5.8 11,646 5.0 12,195 5.7 8,211 4.2 9,296 4.8 9,390 4.2 7,969 3.9
4 36,088 17.7 45,001 19.2 40,499 18.9 37,345 19.0 40,102 21.0 45,049 20.0 52,366 25.7
6 12 0.0 364 0.2 247 0.1 2,143 1.1 3,537 1.8 2,483 1.1 1,389 0.7
7 101,648 49.9 107,900 46.0 86,593 40.4 89,337 46.0 90,244 47.0 108,162 48.0 88,731 43.5
8 13,280 6.5 20,369 8.7 18,702 8.7 11,480 5.9 15,499 8.0 16,418 7.3 14,194 7.0
10 - 0.0 2,093 0.9 5,898 2.8 5,762 3.0 4,336 2.0 4,442 2.0 4,887 2.4
11 17,416 8.5 18,209 7.8 16,657 7.8 10,577 5.4 9,193 4.7 11,317 5.1 11,375 5.6
12 23,383 11.5 28,971 12.4 33,555 15.7 30,311 16.0 21,792 11.0 26,295 12.0 23,226 11.4 State-wide Total 203,696 100.0 234,552 100.0 214,346 100.0 195,167 100.0 193,998 100.0 223,557 100.0 204,137 100.0

California D
epartment of Transportation
Mobility Perform
ance Report 2011 193
TABLE A-4 VEHICLE HOURS OF DELAY AT 35 MILES PER HOUR, STATEWIDE AND DISTRICT TOTALS, BY DISTRICT, BY MONTH, 2010–2011
(Numbers in thousands)
District Year Jan Feb Mar Apr May Jun Jul Aug Sep Oct Nov Dec Annual
Total
3 2010 202 223 262 234 227 207 279 264 294 251 270 277 2,990
2011 216 264 293 244 310 206 241 269 264 218 253 211 2,989
4 2010 991 1,211 1,468 1,367 1,556 1,536 1,637 1,934 2,199 2,024 2,001 1,958 19,883
2011 1,603 1,731 1,769 1,699 1,936 2,154 1,925 2,201 2,209 2,231 2,112 1,942 23,512
6 2010 64 53 61 42 35 45 46 16 12 11 15 37 439
2011 30 38 29 36 17 27 20 34 21 24 18 26 320
7 2010 2,945 3,556 4,330 4,001 4,056 4,283 4,146 3,798 4,122 4,766 4,703 4,503 49,210
2011 2,816 2,943 3,053 2,710 2,917 3,434 3,185 3,139 3,337 3,676 3,564 3,268 38,042
8 2010 379 381 469 438 447 393 313 385 442 483 626 714 5,470
2011 503 553 477 432 363 350 323 373 377 393 539 529 5,211
10 2010 68 70 137 107 59 56 60 34 36 52 52 79 811
2011 55 62 55 44 71 88 99 187 190 195 144 117 1,306
11 2010 292 277 341 373 301 353 405 406 437 448 478 475 4,586
2011 393 416 391 302 327 404 393 403 436 450 568 461 4,942
12 2010 783 1,006 1,089 958 1,044 1,027 1,170 1,023 928 1,125 1,112 1,041 12,306
2011 792 741 759 777 711 891 1,062 854 794 892 897 1,009 10,179 Statewide
Total 2010 5,724 6,777 8,157 7,520 7,727 7,900 8,055 7,860 8,471 9,161 9,258 9,084 95,694
Statewide Total 2011 6,408 6,748 6,826 6,245 6,652 7,553 7,248 7,459 7,627 8,079 8,095 7,562 86,501

194
California D
epartment of Transportation
Mobility Perform
ance Report 2011
194
District Year Jan Feb Mar Apr May Jun Jul Aug Sep Oct Nov Dec Annual Average
3 2010 7,928 8,165 9,255 8,856 9,056 7,865 9,770 9,535 11,648 10,509 11,324 11,312 9,605
2011 8,596 11,405 10,607 9,598 12,796 8,045 9,549 9,375 10,681 9,091 10,630 8,403 9,887
4 2010 45,975 55,014 57,233 55,143 63,038 61,066 62,704 71,208 91,862 84,136 83,924 81,737 67,771
2011 69,516 78,611 69,527 69,294 77,703 85,855 80,545 82,630 92,564 94,839 91,166 80,832 81,002
6 2010 2,950 2,554 2,445 1,728 1,686 1,974 1,942 626 556 486 615 1,087 1,548
2011 944 1,402 937 1,283 767 1,093 885 1,205 844 995 757 930 1,004
7 2010 132,653 164,174 167,279 160,350 169,466 171,803 170,638 146,006 173,749 205,449 206,066 189,128 171,320
2011 124,218 137,944 120,517 113,516 124,238 139,951 136,597 120,162 144,231 159,067 157,531 140,134 134,455
8 2010 16,012 15,827 17,093 16,843 18,628 14,577 12,570 15,280 19,363 21,821 26,619 28,881 18,576
2011 21,746 25,140 17,828 17,951 15,181 13,683 13,486 14,322 16,372 17,146 22,458 21,056 17,915
10 2010 3,373 3,557 5,883 4,753 2,654 2,431 2,607 1,383 1,441 2,209 2,412 3,001 2,996
2011 2,625 3,059 2,293 1,999 3,155 3,572 4,156 6,999 7,603 7,927 5,740 4,506 4,470
11 2010 14,002 13,823 13,909 16,192 13,831 14,585 17,296 16,571 19,846 20,814 22,179 21,426 17,026
2011 18,827 20,650 16,628 13,566 14,925 16,976 17,481 16,269 19,840 20,924 26,951 21,164 18,588
12 2010 35,493 45,198 40,990 37,590 43,727 41,015 47,994 37,677 40,112 50,820 48,661 44,570 42,738
2011 35,197 35,724 30,481 33,100 29,966 35,385 43,463 31,600 34,078 39,507 39,107 42,369 35,699 Statewide Average 2010 258,387 308,312 314,087 301,454 322,085 315,315 325,520 298,286 358,576 396,243 401,801 381,143 331,580
Statewide Average 2011 281,669 313,934 268,819 260,308 278,731 304,562 306,161 282,562 326,214 349,495 354,340 319,395 303,019
TABLE A-5 VEHICLE HOURS OF DELAY AT 35 MILES PER HOUR, STATEWIDE AND DISTRICT
NON–HOLIDAY WEEKDAY AVERAGES, BY DISTRICT, BY MONTH, 2010–2011 (Numbers in thousands)

California D
epartment of Transportation
Mobility Perform
ance Report 2011 195
TABLE A-6 VEHICLE HOURS OF DELAY AT 60 MILES PER HOUR, STATEWIDE AND DISTRICT TOTALS, BY DISTRICT, BY MONTH, 2010–2011
(Numbers in thousands)
District Year Jan Feb Mar Apr May Jun Jul Aug Sep Oct Nov Dec Annual
Total
3 2010 769 781 913 867 857 834 949 678 696 662 695 688 9,390
2011 558 651 748 638 682 591 680 750 743 662 674 592 7,969
4 2010 2,524 2,837 3,422 3,182 3,484 3,492 3,589 4,350 4,743 4,547 4,502 4,377 45,049
2011 3,783 3,991 4,223 3,924 4,313 4,687 4,278 4,866 4,818 4,732 4,526 4,225 52,366
6 2010 304 287 265 250 294 311 279 96 88 87 97 126 2,483
2011 102 117 116 130 120 109 99 138 121 125 106 107 1,389
7 2010 6,810 7,843 9,493 8,888 8,984 9,361 9,211 8,882 9,128 10,046 9,871 9,644 108,162
2011 6,615 6,738 7,302 6,636 6,970 7,973 7,488 7,633 7,721 8,254 7,952 7,449 88,731
8 2010 1,257 1,276 1,552 1,484 1,456 1,389 1,236 1,085 1,162 1,274 1,524 1,722 16,418
2011 1,322 1,383 1,268 1,148 1,034 1,028 955 1,103 1,069 1,135 1,393 1,356 14,194
10 2010 352 348 483 444 405 419 416 314 317 345 307 291 4,442
2011 259 249 271 253 312 344 368 558 647 666 526 434 4,887
11 2010 768 767 911 943 812 923 1,071 969 983 1,027 1,073 1,071 11,317
2011 891 906 899 739 804 936 958 985 997 1,052 1,209 999 11,375
12 2010 1,792 2,111 2,343 2,087 2,218 2,207 2,460 2,179 2,034 2,323 2,292 2,249 26,295
2011 1,818 1,724 1,819 1,763 1,713 2,008 2,235 2,040 1,891 2,076 2,002 2,136 23,226
Statewide Total 2010 14,576 16,251 19,382 18,146 18,510 18,937 19,211 18,552 19,151 20,312 20,363 20,166 223,557
Statewide Total 2011 15,346 15,758 16,646 15,231 15,949 17,675 17,061 18,073 18,007 18,702 18,389 17,299 204,137

196
California D
epartment of Transportation
Mobility Perform
ance Report 2011
196
District Year Jan Feb Mar Apr May Jun Jul Aug Sep Oct Nov Dec Annual
Average
3 2010 30 30 32 32 33 31 34 25 28 27 29 27 30
2011 22 28 27 25 27 23 27 27 30 27 28 24 26
4 2010 116 131 135 130 144 141 142 165 200 189 190 182 155
2011 163 182 166 162 176 188 180 185 202 200 194 175 181
6 2010 12 12 10 10 12 12 11 4 4 4 4 5 8
2011 4 5 4 5 5 4 4 5 5 5 4 4 5
7 2010 303 358 365 355 373 374 376 343 381 426 427 398 373
2011 288 312 287 277 294 323 320 293 331 352 346 315 311
8 2010 52 53 56 56 58 52 48 43 50 55 64 69 55
2011 56 62 48 47 43 41 40 42 46 48 58 55 49
10 2010 16 17 20 19 18 18 18 13 14 15 14 12 16
2011 12 12 11 11 14 14 16 21 26 27 22 17 17
11 2010 36 37 36 40 36 38 45 39 44 47 49 48 41
2011 42 44 38 32 35 39 41 39 44 47 55 45 42
12 2010 80 96 90 83 93 88 101 82 88 103 100 95 91
2011 80 82 73 75 72 80 92 76 80 90 87 89 81 Statewide
Average 2010 644 733 745 726 768 753 774 714 808 865 876 837 770 Statewide
Average 2011 666 727 653 635 666 712 720 688 763 796 794 724 711
TABLE A-7 VEHICLE HOURS OF DELAY AT 60 MILES PER HOUR, STATEWIDE AND DISTRICT
NON–HOLIDAY WEEKDAY AVERAGES, BY DISTRICT, BY MONTH, 2010–2011 (Numbers in thousands)

California D
epartment of Transportation
Mobility Perform
ance Report 2011 197
TABLE A-8 VEHICLE HOURS OF DELAY AT 60 MILES PER HOUR, STATEWIDE AND DISTRICT
AVERAGES, BY DISTRICT, BY DAY OF WEEK, 2010–2011
District Year Monday Tuesday Wednesday Thursday Friday Saturday Sunday Weekly
Average
3 2010 24,516 28,318 29,245 29,977 36,975 16,482 16,898 25,727
2011 19,504 25,300 27,289 27,811 29,957 13,955 10,995 21,832
4 2010 126,113 149,736 160,574 169,991 167,973 61,928 47,511 123,422
2011 143,996 178,698 192,672 209,881 175,300 72,616 50,521 143,468
6 2010 8,153 8,133 7,939 8,302 8,357 4,327 3,406 6,804
2011 5,715 3,961 4,499 4,710 3,981 2,622 1,806 3,807
7 2010 349,077 344,904 363,063 383,544 425,578 161,712 101,985 296,334
2011 272,915 292,424 309,570 333,358 341,964 122,382 69,157 243,099
8 2010 56,426 51,515 51,525 46,802 66,957 26,581 22,136 44,982
2011 49,992 44,291 45,743 47,138 56,247 18,426 16,620 38,889
10 2010 18,767 13,750 15,697 14,214 19,030 2,719 3,869 12,169
2011 21,813 16,157 15,821 15,125 16,002 5,116 6,298 13,390
11 2010 33,984 39,624 38,441 45,395 47,757 11,442 7,013 31,006
2011 34,956 43,519 42,248 41,155 45,268 9,839 6,766 31,164
12 2010 78,397 85,548 88,114 95,540 108,917 39,133 22,229 72,041
2011 73,442 73,727 82,131 90,458 85,181 30,688 20,195 63,632
Statewide Average 2010 695,432 721,528 754,597 793,766 881,544 324,325 225,047 612,484
Statewide Average 2011 622,332 678,077 719,973 769,636 753,902 275,644 182,359 559,280

198
California D
epartment of Transportation
Mobility Perform
ance Report 2011
198
District
Hour 2010 2011 2010 2011 2010 2011 2010 2011 2010 2011 2010 2011 2010 2011 2010 2011 2010 201112:00 AM 33 15 84 85 7 3 290 222 22 23 4 17 5 10 151 127 596 501 1:00 AM 39 26 91 93 36 11 396 301 36 36 11 17 7 11 152 133 768 627 2:00 AM 40 32 97 98 46 18 423 309 40 49 18 22 8 10 146 131 819 668 3:00 AM 42 39 98 117 52 23 484 320 57 66 23 26 11 10 145 134 913 734 4:00 AM 48 47 124 170 52 25 650 399 82 106 25 34 13 13 150 147 1,145 942 5:00 AM 66 71 251 359 41 26 1,003 728 339 449 37 144 33 33 181 184 1,951 1,994 6:00 AM 119 127 950 1,531 40 25 4,134 4,160 1,166 1,194 67 166 345 394 567 616 7,387 8,213 7:00 AM 507 559 4,539 6,044 58 44 14,718 13,500 2,010 1,643 46 158 1,892 2,162 3,344 3,372 27,115 27,482
8:00 AM 777 797 8,132 9,824 53 47 18,198 15,765 1,568 1,218 56 178 1,994 2,196 4,309 4,093 35,087 34,119 9:00 AM 305 392 4,646 6,082 40 40 11,010 9,014 742 649 116 207 510 614 1,501 1,536 18,870 18,535 10:00 AM 262 393 2,355 3,533 48 50 6,094 5,016 641 585 237 269 265 369 834 767 10,734 10,982 11:00 AM 294 417 2,130 3,095 55 55 4,688 3,941 706 588 347 316 275 407 967 753 9,461 9,572 12:00 PM 353 465 2,203 3,115 68 57 4,683 3,796 816 669 451 310 294 444 1,170 891 10,038 9,747 1:00 PM 409 514 2,279 2,954 83 51 5,323 3,932 838 751 412 320 317 480 1,251 939 10,912 9,939 2:00 PM 489 605 3,013 3,315 94 56 8,098 5,421 1,019 972 301 325 439 589 1,815 1,336 15,268 12,619 3:00 PM 792 845 4,822 5,051 100 51 14,523 9,971 1,570 1,599 231 419 1,290 1,345 3,506 2,576 26,834 21,857 4:00 PM 1,460 1,329 7,771 8,599 115 62 19,937 14,973 2,084 2,225 239 527 2,972 3,038 5,805 4,573 40,382 35,327 5:00 PM 2,240 1,960 12,081 13,596 152 111 25,063 19,992 2,571 2,754 185 455 4,360 4,404 8,751 7,336 55,404 50,608 6:00 PM 750 673 8,437 9,374 81 42 18,703 14,055 1,248 1,320 58 157 1,658 1,605 5,426 4,275 36,361 31,502 7:00 PM 184 211 2,191 2,280 70 34 7,033 4,792 359 366 25 89 181 222 1,379 875 11,422 8,869 8:00 PM 113 118 595 648 69 48 2,317 1,479 214 203 21 80 58 72 422 277 3,808 2,925 9:00 PM 108 103 379 430 67 55 1,355 909 188 181 21 88 41 72 274 215 2,434 2,051 10:00 PM 96 85 300 345 63 47 1,243 813 155 166 31 82 33 58 255 213 2,177 1,809
11:00 PM 80 66 203 266 59 23 953 647 105 104 32 61 25 30 238 201 1,694 1,397
District Daily Average 9,605 9,887 67,771 81,002 1,548 1,004 171,320 134,455 18,576 17,915 2,996 4,470 17,026 18,588 42,738 35,699 331,580 303,019
11 12 Statewide Average
Note: Data bars indicate magnitude of delay among districts (red and blue) and within the State (orange).
3 4 6 7 8 10
TABLE A-9 (A) VEHICLE HOURS OF DELAY AT 35 MILES PER HOUR, STATEWIDE AND DISTRICT
NON–HOLIDAY WEEKDAY AVERAGES, BY DISTRICT, BY HOUR, 2010–2011
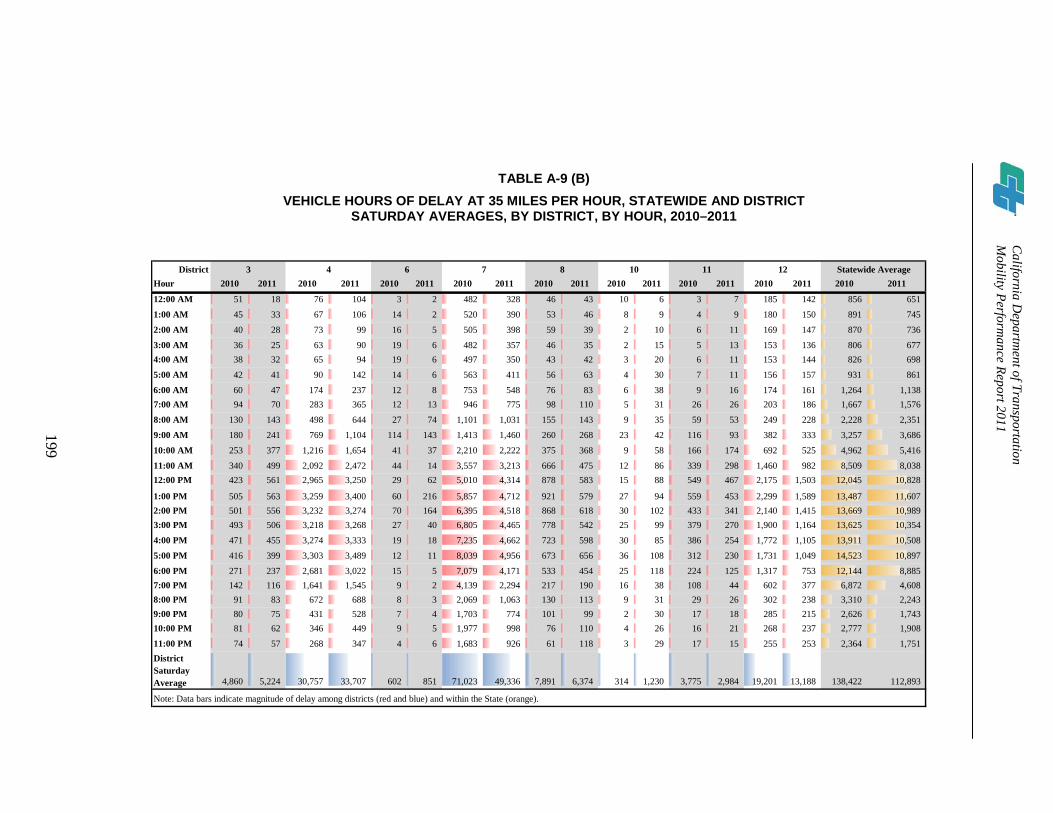
California D
epartment of Transportation
Mobility Perform
ance Report 2011 199
DistrictHour 2010 2011 2010 2011 2010 2011 2010 2011 2010 2011 2010 2011 2010 2011 2010 2011 2010 2011
12:00 AM 51 18 76 104 3 2 482 328 46 43 10 6 3 7 185 142 856 651
1:00 AM 45 33 67 106 14 2 520 390 53 46 8 9 4 9 180 150 891 745
2:00 AM 40 28 73 99 16 5 505 398 59 39 2 10 6 11 169 147 870 736
3:00 AM 36 25 63 90 19 6 482 357 46 35 2 15 5 13 153 136 806 677 4:00 AM 38 32 65 94 19 6 497 350 43 42 3 20 6 11 153 144 826 698
5:00 AM 42 41 90 142 14 6 563 411 56 63 4 30 7 11 156 157 931 861
6:00 AM 60 47 174 237 12 8 753 548 76 83 6 38 9 16 174 161 1,264 1,138 7:00 AM 94 70 283 365 12 13 946 775 98 110 5 31 26 26 203 186 1,667 1,576
8:00 AM 130 143 498 644 27 74 1,101 1,031 155 143 9 35 59 53 249 228 2,228 2,351
9:00 AM 180 241 769 1,104 114 143 1,413 1,460 260 268 23 42 116 93 382 333 3,257 3,686
10:00 AM 253 377 1,216 1,654 41 37 2,210 2,222 375 368 9 58 166 174 692 525 4,962 5,416
11:00 AM 340 499 2,092 2,472 44 14 3,557 3,213 666 475 12 86 339 298 1,460 982 8,509 8,038 12:00 PM 423 561 2,965 3,250 29 62 5,010 4,314 878 583 15 88 549 467 2,175 1,503 12,045 10,828
1:00 PM 505 563 3,259 3,400 60 216 5,857 4,712 921 579 27 94 559 453 2,299 1,589 13,487 11,607 2:00 PM 501 556 3,232 3,274 70 164 6,395 4,518 868 618 30 102 433 341 2,140 1,415 13,669 10,989 3:00 PM 493 506 3,218 3,268 27 40 6,805 4,465 778 542 25 99 379 270 1,900 1,164 13,625 10,354
4:00 PM 471 455 3,274 3,333 19 18 7,235 4,662 723 598 30 85 386 254 1,772 1,105 13,911 10,508
5:00 PM 416 399 3,303 3,489 12 11 8,039 4,956 673 656 36 108 312 230 1,731 1,049 14,523 10,897
6:00 PM 271 237 2,681 3,022 15 5 7,079 4,171 533 454 25 118 224 125 1,317 753 12,144 8,885 7:00 PM 142 116 1,641 1,545 9 2 4,139 2,294 217 190 16 38 108 44 602 377 6,872 4,608 8:00 PM 91 83 672 688 8 3 2,069 1,063 130 113 9 31 29 26 302 238 3,310 2,243 9:00 PM 80 75 431 528 7 4 1,703 774 101 99 2 30 17 18 285 215 2,626 1,743 10:00 PM 81 62 346 449 9 5 1,977 998 76 110 4 26 16 21 268 237 2,777 1,908
11:00 PM 74 57 268 347 4 6 1,683 926 61 118 3 29 17 15 255 253 2,364 1,751 District Saturday Average 4,860 5,224 30,757 33,707 602 851 71,023 49,336 7,891 6,374 314 1,230 3,775 2,984 19,201 13,188 138,422 112,893
11 12 Statewide Average
Note: Data bars indicate magnitude of delay among districts (red and blue) and within the State (orange).
3 4 6 7 8 10
TABLE A-9 (B) VEHICLE HOURS OF DELAY AT 35 MILES PER HOUR, STATEWIDE AND DISTRICT
SATURDAY AVERAGES, BY DISTRICT, BY HOUR, 2010–2011

200
California D
epartment of Transportation
Mobility Perform
ance Report 2011
200
DistrictHour 2010 2011 2010 2011 2010 2011 2010 2011 2010 2011 2010 2011 2010 2011 2010 2011 2010 2011
12:00 AM 38 18 121 104 1 3 633 385 45 58 2 7 12 4 199 171 1,051 749
1:00 AM 46 28 111 114 2 5 542 411 62 56 4 6 8 3 185 189 961 812 2:00 AM 40 29 111 105 3 4 533 370 62 50 5 8 7 4 175 180 921 739 3:00 AM 37 25 101 95 3 5 448 302 33 40 7 9 5 3 152 147 786 627 4:00 AM 34 26 92 96 4 5 422 244 23 38 7 9 4 3 149 137 736 556 5:00 AM 39 29 107 109 5 6 478 287 39 49 8 13 5 6 156 147 836 645 6:00 AM 55 36 162 181 5 8 700 450 67 74 10 20 10 12 172 182 1,180 962 7:00 AM 71 44 326 306 4 10 1,067 726 72 78 9 20 40 27 242 236 1,832 1,447 8:00 AM 91 54 515 392 5 13 1,150 794 84 89 8 26 27 19 257 254 2,137 1,642
9:00 AM 113 80 590 528 7 19 1,104 763 98 127 11 50 27 33 218 243 2,168 1,843 10:00 AM 173 141 738 804 9 19 1,280 983 177 222 20 78 63 67 298 291 2,759 2,605 11:00 AM 301 227 1,180 1,252 8 18 1,883 1,445 297 328 40 118 137 138 509 419 4,356 3,944 12:00 PM 436 319 1,661 1,735 14 18 2,594 1,930 486 491 55 149 235 209 842 655 6,323 5,505 1:00 PM 510 368 2,019 1,980 18 14 3,398 2,326 695 612 63 152 222 228 1,012 766 7,937 6,447 2:00 PM 560 390 2,132 2,145 23 17 3,960 2,465 751 663 69 157 165 193 940 674 8,601 6,702 3:00 PM 625 419 2,186 2,250 25 15 4,223 2,431 683 611 70 150 173 156 785 619 8,770 6,650 4:00 PM 614 426 2,274 2,432 22 18 4,120 2,422 770 567 59 157 241 181 777 664 8,878 6,867 5:00 PM 579 427 2,378 2,708 29 21 3,959 2,467 734 610 59 182 300 216 793 663 8,830 7,294 6:00 PM 382 273 1,781 2,193 26 19 3,073 1,886 526 454 38 122 218 161 531 525 6,575 5,634 7:00 PM 217 151 1,009 1,200 29 21 2,060 1,162 320 279 34 105 96 92 385 339 4,152 3,351 8:00 PM 123 89 674 831 25 43 1,604 998 238 255 39 87 57 59 349 312 3,108 2,674 9:00 PM 94 72 478 613 24 34 1,420 882 171 197 47 107 26 41 298 247 2,557 2,192 10:00 PM 87 65 343 405 22 26 1,116 770 93 136 39 114 17 49 230 239 1,946 1,803 11:00 PM 72 47 201 278 18 16 880 621 68 98 24 102 10 34 235 221 1,508 1,416
District Sunday and Holiday Total Average 5,335 3,781 21,288 22,851 329 376 42,639 27,516 6,593 6,180 727 1,947 2,105 1,938 9,890 8,517 88,905 73,107
11 12 y
Total Average
Note: Data bars indicate magnitude of delay among districts (red and blue) and within the State (orange).
3 4 6 7 8 10
TABLE A-9 (C) VEHICLE HOURS OF DELAY AT 35 MILES PER HOUR, STATEWIDE AND DISTRICT,
SUNDAY AND HOLIDAY AVERAGES, BY DISTRICT, BY HOUR, 2010–2011

California D
epartment of Transportation
Mobility Perform
ance Report 2011 201
DistrictHour 2010 2011 2010 2011 2010 2011 2010 2011 2010 2011 2010 2011 2010 2011 2010 2011 2010 2011
12:00 AM 105 77 261 297 63 37 958 799 161 130 64 89 30 34 302 283 1,943 1,745
1:00 AM 150 120 356 363 130 64 1,283 1,059 257 211 131 137 50 45 334 318 2,691 2,317 2:00 AM 158 135 402 402 142 78 1,329 1,105 279 255 169 168 63 54 333 322 2,875 2,519
3:00 AM 181 166 492 505 160 91 1,528 1,243 357 322 226 220 90 74 361 351 3,396 2,971
4:00 AM 231 220 709 742 185 102 2,036 1,601 490 468 283 289 131 109 420 431 4,486 3,963
5:00 AM 345 318 1,295 1,435 208 118 3,469 2,799 1,305 1,334 379 567 230 193 642 664 7,872 7,429 6:00 AM 631 561 3,426 4,572 260 145 12,217 11,425 2,855 2,554 491 631 1,016 1,080 2,092 2,258 22,987 23,225
7:00 AM 1,871 1,744 11,312 13,797 412 246 30,546 27,864 4,683 3,763 469 648 4,269 4,667 7,715 7,716 61,278 60,446
8:00 AM 2,349 2,095 17,673 20,063 375 217 34,814 30,871 3,788 2,948 694 784 4,384 4,584 8,936 8,441 73,013 70,002 9:00 AM 1,234 1,131 11,448 13,743 344 188 23,927 19,669 2,366 1,908 1,055 1,014 1,561 1,582 4,088 3,946 46,023 43,182
10:00 AM 1,150 1,111 6,925 8,954 373 210 16,314 12,908 2,220 1,812 1,367 1,218 1,044 1,083 2,713 2,458 32,107 29,754 11:00 AM 1,254 1,188 6,219 8,026 411 229 13,631 10,753 2,385 1,878 1,583 1,340 1,089 1,165 2,828 2,305 29,399 26,884
12:00 PM 1,387 1,274 6,204 7,972 449 245 13,433 10,391 2,655 2,102 1,711 1,348 1,140 1,239 3,089 2,453 30,068 27,024
1:00 PM 1,518 1,367 6,210 7,696 488 259 14,467 10,852 2,803 2,361 1,659 1,341 1,190 1,287 3,270 2,607 31,606 27,769 2:00 PM 1,742 1,580 7,514 8,685 545 287 20,010 14,904 3,348 3,003 1,461 1,302 1,537 1,570 4,569 3,704 40,727 35,036
3:00 PM 2,456 2,130 10,671 11,987 598 319 31,009 24,881 4,639 4,406 1,278 1,341 3,346 3,208 7,632 6,303 61,629 54,575
4:00 PM 3,798 3,153 15,660 17,778 634 359 38,888 33,496 5,709 5,669 1,084 1,359 6,505 6,436 11,178 9,714 83,456 77,965 5:00 PM 5,011 4,238 23,171 25,797 711 468 46,701 41,321 6,777 6,832 832 1,167 8,745 8,602 15,592 13,988 107,541 102,414
6:00 PM 2,053 1,657 16,467 18,323 392 203 36,111 30,778 3,551 3,498 394 543 3,548 3,380 9,872 8,446 72,388 66,828
7:00 PM 693 611 4,862 5,320 310 152 15,405 11,794 1,350 1,171 245 359 518 532 2,766 2,078 26,148 22,017
8:00 PM 484 403 1,532 1,715 287 154 5,779 3,912 870 675 181 294 218 219 954 754 10,306 8,126 9:00 PM 435 351 1,065 1,193 267 152 3,741 2,513 704 526 158 268 178 201 664 593 7,213 5,796
10:00 PM 358 280 850 940 232 129 3,254 2,181 578 460 158 238 137 156 595 551 6,162 4,936
11:00 PM 280 219 616 715 197 91 2,464 1,744 436 333 154 194 101 94 494 462 4,742 3,851
District Daily Average 29,875 26,130 155,342 181,017 8,175 4,543 373,312 310,862 54,566 48,622 16,227 16,860 41,121 41,596 91,438 81,144 770,056 710,773
11 12 Statewide Average
Note: Data bars indicate magnitude of delay among districts (red and blue) and within the State (orange).
3 4 6 7 8 10
TABLE A-10 (A) VEHICLE HOURS OF DELAY AT 60 MILES PER HOUR, STATEWIDE AND DISTRICT,
NON–HOLIDAY WEEKDAY AVERAGES, BY DISTRICT, BY HOUR, 2010–2011

202
California D
epartment of Transportation
Mobility Perform
ance Report 2011
202
DistrictHour 2010 2011 2010 2011 2010 2011 2010 2011 2010 2011 2010 2011 2010 2011 2010 2011 2010 2011
12:00 AM 148 86 258 324 55 28 1,227 916 195 126 29 37 26 29 349 312 2,288 1,858 1:00 AM 163 114 245 309 92 35 1,214 950 219 140 40 48 32 30 325 307 2,330 1,933 2:00 AM 143 103 237 279 87 41 1,103 902 207 125 39 55 32 30 298 287 2,147 1,821 3:00 AM 128 101 211 261 90 42 1,003 828 183 123 51 72 30 31 272 266 1,968 1,723 4:00 AM 132 122 239 292 98 44 1,079 904 197 149 65 92 38 38 283 288 2,133 1,929 5:00 AM 156 153 316 415 106 54 1,350 1,126 264 205 68 114 55 51 326 343 2,642 2,460 6:00 AM 223 197 502 653 122 63 1,850 1,429 389 275 71 132 87 79 397 397 3,642 3,223 7:00 AM 349 290 804 1,051 148 80 2,368 1,935 531 357 78 145 151 123 496 486 4,925 4,469 8:00 AM 506 452 1,317 1,774 192 156 2,843 2,515 726 469 101 187 245 196 640 638 6,570 6,387 9:00 AM 704 662 1,957 2,799 309 246 3,824 3,519 978 713 149 249 388 310 961 925 9,270 9,423 10:00 AM 951 953 2,911 4,007 271 159 5,828 5,188 1,256 954 180 328 598 553 1,667 1,403 13,662 13,543 11:00 AM 1,176 1,198 4,447 5,523 302 148 8,818 7,399 1,874 1,278 231 406 1,019 941 3,002 2,265 20,870 19,159 12:00 PM 1,353 1,323 5,831 6,770 296 201 11,829 10,041 2,410 1,597 247 418 1,476 1,341 4,126 3,130 27,568 24,821 1:00 PM 1,512 1,340 6,254 6,956 331 352 13,670 11,261 2,530 1,657 256 407 1,485 1,357 4,311 3,252 30,350 26,582 2:00 PM 1,493 1,303 6,159 6,704 332 293 14,761 11,307 2,487 1,751 242 400 1,234 1,103 4,017 3,005 30,726 25,866 3:00 PM 1,471 1,228 6,159 7,096 267 155 15,443 11,361 2,358 1,675 201 376 1,098 961 3,716 2,681 30,714 25,533 4:00 PM 1,421 1,152 6,106 7,078 232 119 15,831 11,893 2,328 1,786 177 335 1,094 893 3,665 2,736 30,854 25,992 5:00 PM 1,297 1,038 6,130 6,901 203 98 17,233 13,151 2,241 1,828 152 342 953 760 3,681 2,727 31,891 26,846 6:00 PM 965 718 4,901 5,634 182 78 15,014 10,894 1,787 1,312 113 312 643 426 2,742 1,975 26,347 21,348 7:00 PM 622 433 2,915 2,989 146 59 9,104 5,842 1,087 628 75 189 297 199 1,288 960 15,536 11,298 8:00 PM 471 323 1,430 1,592 138 50 4,805 2,676 788 373 55 154 157 138 714 612 8,557 5,917 9:00 PM 430 277 1,055 1,289 130 46 3,904 2,001 649 322 40 132 116 104 690 568 7,015 4,739 10:00 PM 376 221 896 1,119 114 41 4,199 2,357 525 312 33 103 104 90 635 591 6,883 4,833 11:00 PM 290 168 645 801 83 36 3,412 1,987 369 274 25 84 84 58 532 535 5,440 3,943 District Saturday Average 16,482 13,955 61,928 72,616 4,327 2,622 ##### 122,382 26,581 18,426 2,719 5,116 11,442 9,839 39,133 30,688 324,325 275,644
11 12 Statewide Average
Note: Data bars indicate magnitude of delay among districts (red and blue) and within the State (orange).
3 4 6 7 8 10
TABLE A-10 (B) VEHICLE HOURS OF DELAY AT 60 MILES PER HOUR, STATEWIDE AND DISTRICT,
SATURDAY AVERAGES, BY DISTRICT, BY HOUR, 2010–2011

California D
epartment of Transportation
Mobility Perform
ance Report 2011 203
DistrictHour 2010 2011 2010 2011 2010 2011 2010 2011 2010 2011 2010 2011 2010 2011 2010 2011 2010 2011
12:00 AM 118 70 305 342 27 22 1,446 894 194 145 21 32 38 22 380 355 2,530 1,881
1:00 AM 151 88 280 325 44 26 1,137 830 215 138 31 37 36 23 333 353 2,226 1,821
2:00 AM 135 87 273 295 44 26 1,059 746 191 124 36 40 30 22 306 324 2,042 1,638 3:00 AM 123 81 255 277 42 27 873 627 135 110 45 45 26 18 276 279 1,775 1,463
4:00 AM 127 92 273 295 47 28 858 591 126 120 54 56 30 25 277 275 1,793 1,480 5:00 AM 151 110 353 369 57 34 1,050 730 213 167 67 81 40 39 312 322 2,244 1,851
6:00 AM 202 143 539 580 68 43 1,691 1,137 306 224 83 105 73 72 402 425 3,364 2,731
7:00 AM 291 188 982 891 78 50 2,475 1,778 384 262 86 127 143 122 573 571 5,012 3,989
8:00 AM 397 242 1,416 1,179 97 59 2,760 1,992 476 319 104 170 141 135 627 638 6,018 4,735 9:00 AM 540 342 1,568 1,496 128 78 2,910 1,986 616 434 139 249 171 188 638 669 6,710 5,442 10:00 AM 783 510 1,939 2,075 158 88 3,492 2,502 851 636 188 333 274 303 858 835 8,542 7,280
11:00 AM 1,101 709 2,756 2,913 181 94 4,829 3,482 1,153 895 248 428 451 477 1,318 1,113 12,039 10,110
12:00 PM 1,391 884 3,611 3,734 209 100 6,469 4,634 1,549 1,223 289 488 677 670 1,854 1,504 16,049 13,236 1:00 PM 1,555 991 4,208 4,165 228 97 8,214 5,728 1,962 1,482 306 494 693 698 2,127 1,675 19,293 15,330
2:00 PM 1,628 1,038 4,425 4,459 237 100 9,402 6,399 2,107 1,563 310 488 589 620 2,002 1,557 20,700 16,224 3:00 PM 1,677 1,072 4,466 4,601 239 103 9,764 6,466 2,015 1,540 302 463 639 554 1,780 1,484 20,883 16,283 4:00 PM 1,628 1,062 4,612 4,894 239 112 9,292 6,360 2,120 1,491 270 454 758 591 1,749 1,600 20,668 16,564 5:00 PM 1,491 1,031 4,945 5,451 240 119 9,188 6,471 2,055 1,571 248 461 843 669 1,732 1,600 20,742 17,373 6:00 PM 1,084 732 3,742 4,481 221 109 7,256 4,835 1,569 1,232 193 364 561 497 1,224 1,247 15,850 13,497 7:00 PM 729 492 2,242 2,659 205 101 5,012 2,968 1,168 853 169 327 294 329 897 888 10,717 8,618
8:00 PM 550 350 1,611 1,908 188 118 4,187 2,521 1,003 752 170 284 205 236 828 793 8,742 6,961
9:00 PM 433 279 1,218 1,433 170 106 3,679 2,206 768 582 182 274 135 186 697 636 7,282 5,702
10:00 PM 345 229 885 985 143 93 2,818 1,844 537 425 170 264 96 160 544 574 5,537 4,574
11:00 PM 270 174 611 721 118 71 2,140 1,442 426 334 156 238 70 109 498 485 4,287 3,574
District Sunday and Holiday Total Average
16,898 10,995 47,511 50,521 3,406 1,806 101,985 69,157 22,136 16,620 3,869 6,298 7,013 6,766 22,229 20,195 225,047 182,359
11 12
Note: Data bars indicate magnitude of delay among districts (red and blue) and within the State (orange).
Statewide Hourly Total Average3 4 6 7 8 10
TABLE A-10 (C) VEHICLE HOURS OF DELAY AT 60 MILES PER HOUR, STATEWIDE AND DISTRICT,
SUNDAY AND HOLIDAY AVERAGES, BY DISTRICT, BY HOUR, 2010–2011
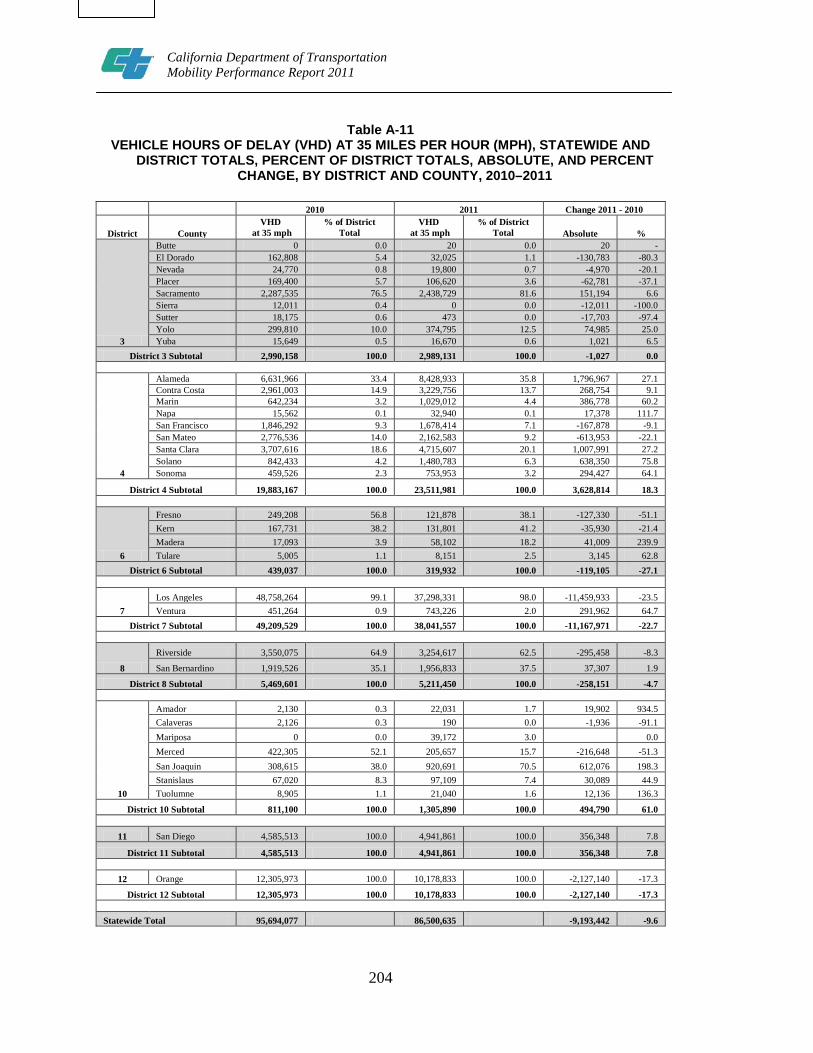
204
California Department of Transportation Mobility Performance Report 2011
Table A-11 VEHICLE HOURS OF DELAY (VHD) AT 35 MILES PER HOUR (MPH), STATEWIDE AND
DISTRICT TOTALS, PERCENT OF DISTRICT TOTALS, ABSOLUTE, AND PERCENT CHANGE, BY DISTRICT AND COUNTY, 2010–2011
2010 2011 Change 2011 - 2010
District County VHD
at 35 mph % of District
Total VHD
at 35 mph % of District
Total Absolute %
3
Butte 0 0.0 20 0.0 20 - El Dorado 162,808 5.4 32,025 1.1 -130,783 -80.3 Nevada 24,770 0.8 19,800 0.7 -4,970 -20.1 Placer 169,400 5.7 106,620 3.6 -62,781 -37.1 Sacramento 2,287,535 76.5 2,438,729 81.6 151,194 6.6 Sierra 12,011 0.4 0 0.0 -12,011 -100.0 Sutter 18,175 0.6 473 0.0 -17,703 -97.4 Yolo 299,810 10.0 374,795 12.5 74,985 25.0 Yuba 15,649 0.5 16,670 0.6 1,021 6.5
District 3 Subtotal 2,990,158 100.0 2,989,131 100.0 -1,027 0.0
4
Alameda 6,631,966 33.4 8,428,933 35.8 1,796,967 27.1 Contra Costa 2,961,003 14.9 3,229,756 13.7 268,754 9.1 Marin 642,234 3.2 1,029,012 4.4 386,778 60.2 Napa 15,562 0.1 32,940 0.1 17,378 111.7 San Francisco 1,846,292 9.3 1,678,414 7.1 -167,878 -9.1 San Mateo 2,776,536 14.0 2,162,583 9.2 -613,953 -22.1 Santa Clara 3,707,616 18.6 4,715,607 20.1 1,007,991 27.2 Solano 842,433 4.2 1,480,783 6.3 638,350 75.8 Sonoma 459,526 2.3 753,953 3.2 294,427 64.1
District 4 Subtotal 19,883,167 100.0 23,511,981 100.0 3,628,814 18.3
6
Fresno 249,208 56.8 121,878 38.1 -127,330 -51.1 Kern 167,731 38.2 131,801 41.2 -35,930 -21.4 Madera 17,093 3.9 58,102 18.2 41,009 239.9 Tulare 5,005 1.1 8,151 2.5 3,145 62.8
District 6 Subtotal 439,037 100.0 319,932 100.0 -119,105 -27.1
7 Los Angeles 48,758,264 99.1 37,298,331 98.0 -11,459,933 -23.5 Ventura 451,264 0.9 743,226 2.0 291,962 64.7
District 7 Subtotal 49,209,529 100.0 38,041,557 100.0 -11,167,971 -22.7
8
Riverside 3,550,075 64.9 3,254,617 62.5 -295,458 -8.3
San Bernardino 1,919,526 35.1 1,956,833 37.5 37,307 1.9
District 8 Subtotal 5,469,601 100.0 5,211,450 100.0 -258,151 -4.7 Amador 2,130 0.3 22,031 1.7 19,902 934.5 Calaveras 2,126 0.3 190 0.0 -1,936 -91.1 Mariposa 0 0.0 39,172 3.0 0.0 Merced 422,305 52.1 205,657 15.7 -216,648 -51.3 San Joaquin 308,615 38.0 920,691 70.5 612,076 198.3 Stanislaus 67,020 8.3 97,109 7.4 30,089 44.9
10 Tuolumne 8,905 1.1 21,040 1.6 12,136 136.3
District 10 Subtotal 811,100 100.0 1,305,890 100.0 494,790 61.0
11 San Diego 4,585,513 100.0 4,941,861 100.0 356,348 7.8
District 11 Subtotal 4,585,513 100.0 4,941,861 100.0 356,348 7.8
12 Orange 12,305,973 100.0 10,178,833 100.0 -2,127,140 -17.3
District 12 Subtotal 12,305,973 100.0 10,178,833 100.0 -2,127,140 -17.3
Statewide Total 95,694,077 86,500,635 -9,193,442 -9.6

205
California Department of Transportation Mobility Performance Report 2011
Table A-12
VEHICLE HOURS OF DELAY (VHD) AT 60 MILES PER HOUR (MPH), STATEWIDE AND DISTRICT TOTALS, PERCENT OF DISTRICT TOTALS, ABSOLUTE, AND PERCENT
CHANGE, BY DISTRICT AND COUNTY, 2010–2011
2010 2011 Change 2011 - 2010
District County VHD
at 60 mph % of District
Total VHD
at 60 mph % of District
Total Absolute %
3
Butte 0 0.0 3,213 0.0 3,213 - El Dorado 966,971 10.3 247,159 3.1 -719,813 -74.4 Nevada 99,336 1.1 117,917 1.5 18,582 18.7 Placer 941,819 10.0 584,709 7.3 -357,110 -37.9 Sacramento 6,131,643 65.3 5,974,728 75.0 -156,915 -2.6 Sierra 16,804 0.2 1,626 0.0 -15,178 -90.3 Sutter 151,855 1.6 29,960 0.4 -121,895 -80.3 Yolo 1,027,180 10.9 953,400 12.0 -73,780 -7.2 Yuba 54,649 0.6 56,115 0.7 1,467 2.7
District 3 Subtotal 9,390,255 100.0 7,968,827 100.0 -1,421,428 -15.1
4
Alameda 14,890,517 33.1 18,275,702 34.9 3,385,184 22.7 Contra Costa 6,447,500 14.3 6,942,316 13.3 494,816 7.7 Marin 1,413,993 3.1 2,013,578 3.8 599,586 42.4 Napa 71,302 0.2 116,046 0.2 44,745 62.8 San Francisco 3,745,379 8.3 3,459,596 6.6 -285,783 -7.6 San Mateo 5,285,109 11.7 4,887,858 9.3 -397,251 -7.5 Santa Clara 8,882,127 19.7 10,959,660 20.9 2,077,533 23.4 Solano 2,767,704 6.1 3,643,402 7.0 875,698 31.6 Sonoma 1,545,311 3.4 2,067,628 3.9 522,316 33.8
District 4 Subtotal 45,048,943 100.0 52,365,786 100.0 7,316,843 16.2
6
Fresno 1,258,566 50.7 640,815 46.1 -617,752 -49.1 Kern 953,885 38.4 359,963 25.9 -593,923 -62.3 Madera 130,143 5.2 253,225 18.2 123,082 94.6
Tulare 140,788 5.7 135,441 9.7 -5,347 -3.8 District 6 Subtotal 2,483,382 100.0 1,389,443 100.0 -1,093,940 -44.1
7 Los Angeles 106,289,715 98.3 86,542,431 97.5 -19,747,283 -18.6 Ventura 1,872,287 1.7 2,188,708 2.5 316,422 16.9
District 7 Subtotal 108,162,001 100.0 88,731,140 100.0 -19,430,862 -18.0
8 Riverside 10,045,198 61.2 8,288,842 58.4 -1,756,357 -17.5
San Bernardino 6,373,210 38.8 5,905,610 41.6 -467,599 -7.3
District 8 Subtotal 16,418,408 100.0 14,194,452 100.0 -2,223,956 -13.5 Amador 57,635 1.3 78,730 1.6 21,095 36.6 Calaveras 8,280 0.2 2,246 0.0 -6,034 -72.9 Mariposa 0 0.0 84,561 1.7 0.0 Merced 1,265,291 28.5 628,117 12.9 -637,174 -50.4 San Joaquin 2,392,171 53.9 3,241,959 66.3 849,788 35.5 Stanislaus 683,543 15.4 756,222 15.5 72,679 10.6
10 Tuolumne 34,911 0.8 95,408 2.0 60,497 173.3 District 10 Subtotal 4,441,831 100.0 4,887,243 100.0 445,412 10.0
11 San Diego 11,317,044 100.0 11,374,725 100.0 57,680 0.5
District 11 Subtotal 11,317,044 100.0 11,374,725 100.0 57,680 0.5
12 Orange 26,294,903 100.0 23,225,524 100.0 -3,069,379 -11.7
District 12 Subtotal 26,294,903 100.0 23,225,524 100.0 -3,069,379 -11.7
Statewide Total 223,556,767 204,137,139 -19,419,628 -8.7

California D
epartment of Transportation
Mobility Perform
ance Report 2011
206
Table A-13
EQUIVALENT LOST LANE-MILES AT 35 MILES PER HOUR, NON-HOLIDAY WEEKDAY AVERAGE, BY DISTRICT BY TIME PERIOD, 2010–2011
District Year AM Peak Off-Peak Day PM Peak Off-Peak Night District Daily Total
Average
3 2010 12.7 13.6 28.1 9.8 64.2 2011 6.5 6.8 17.6 5.1 36.0
4 2010 62.0 29.1 112.1 9.8 212.9 2011 70.8 30.9 122.5 9.7 233.8
6 2010 4.4 2.1 2.5 8.6 17.5 2011 0.2 0.3 0.6 1.4 2.5
7 2010 157.5 76.9 264.6 30.1 529.2 2011 144.8 58.1 235.1 21.3 459.3
8 2010 19.5 8.7 28.1 3.9 60.2 2011 16.1 8.0 30.4 2.8 57.3
10 2010 3.2 6.6 4.3 2.1 16.2 2011 19.5 28.3 27.0 13.9 88.8
11 2010 17.7 3.8 33.8 1.0 56.3 2011 20.1 4.0 34.4 2.0 60.5
12 2010 33.2 13.0 73.7 6.9 126.9 2011 37.5 12.4 65.4 8.4 123.7
Statewide Daily Average 2010 310.1 153.7 547.3 72.1 1,083.3
Statewide Daily Average 2011 315.6 148.7 533.0 64.6 1,062.0
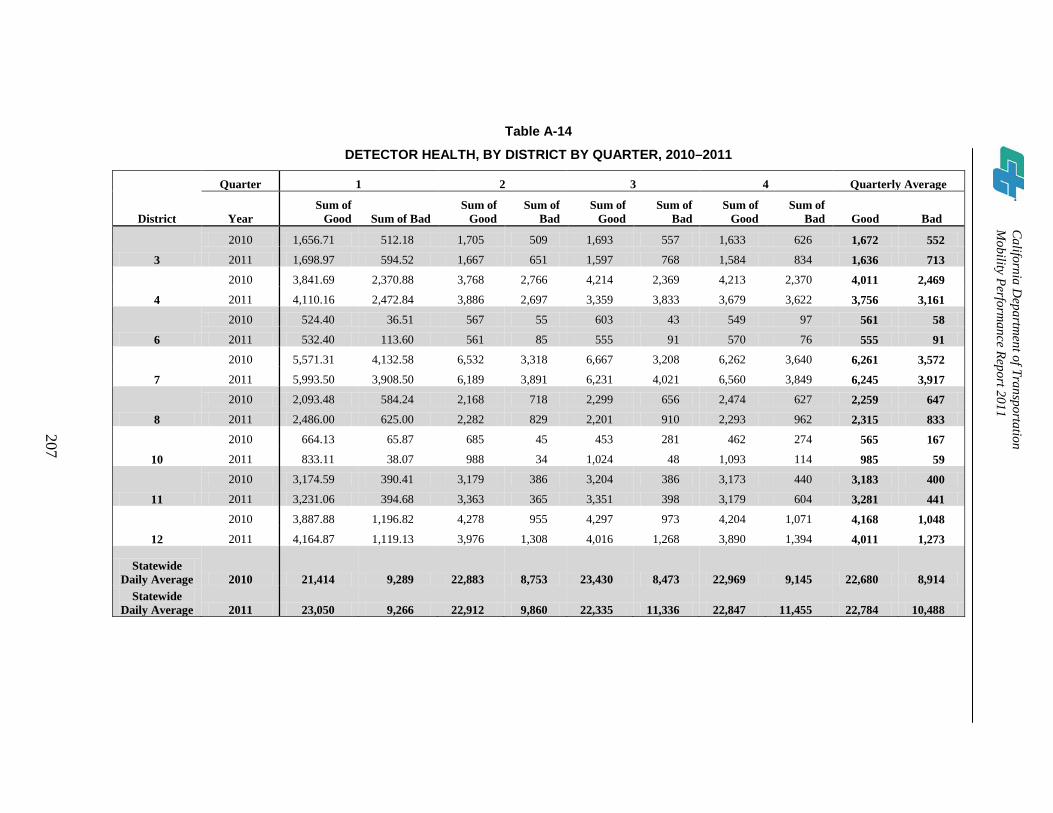
California D
epartment of Transportation
Mobility Perform
ance Report 2011
207
Table A-14
DETECTOR HEALTH, BY DISTRICT BY QUARTER, 2010–2011
Quarter 1 2 3 4 Quarterly Average
District Year Sum of
Good Sum of Bad Sum of
Good Sum of
Bad Sum of
Good Sum of
Bad Sum of
Good Sum of
Bad Good Bad
3
2010 1,656.71 512.18 1,705 509 1,693 557 1,633 626 1,672 552 2011 1,698.97 594.52 1,667 651 1,597 768 1,584 834 1,636 713
4
2010 3,841.69 2,370.88 3,768 2,766 4,214 2,369 4,213 2,370 4,011 2,469 2011 4,110.16 2,472.84 3,886 2,697 3,359 3,833 3,679 3,622 3,756 3,161
6
2010 524.40 36.51 567 55 603 43 549 97 561 58 2011 532.40 113.60 561 85 555 91 570 76 555 91
7
2010 5,571.31 4,132.58 6,532 3,318 6,667 3,208 6,262 3,640 6,261 3,572 2011 5,993.50 3,908.50 6,189 3,891 6,231 4,021 6,560 3,849 6,245 3,917
8
2010 2,093.48 584.24 2,168 718 2,299 656 2,474 627 2,259 647 2011 2,486.00 625.00 2,282 829 2,201 910 2,293 962 2,315 833
10
2010 664.13 65.87 685 45 453 281 462 274 565 167 2011 833.11 38.07 988 34 1,024 48 1,093 114 985 59
11
2010 3,174.59 390.41 3,179 386 3,204 386 3,173 440 3,183 400 2011 3,231.06 394.68 3,363 365 3,351 398 3,179 604 3,281 441
12
2010 3,887.88 1,196.82 4,278 955 4,297 973 4,204 1,071 4,168 1,048 2011 4,164.87 1,119.13 3,976 1,308 4,016 1,268 3,890 1,394 4,011 1,273
Statewide Daily Average 2010 21,414 9,289 22,883 8,753 23,430 8,473 22,969 9,145 22,680 8,914
Statewide Daily Average 2011 23,050 9,266 22,912 9,860 22,335 11,336 22,847 11,455 22,784 10,488

208
California Department of Transportation Mobility Performance Report 2011
PAGE INTENTIONALLY LEFT BLANK

209
California Department of Transportation Mobility Performance Report 2011
APPENDIX B
METHODOLOGY
In 2010, Caltrans used a standardized statewide methodology for measuring freeway traffic congestion using automatically collected traffic data from vehicle detector stations (VDS). Caltrans collects data from VDS on major freeway corridors throughout California’s major urban areas. VDS collects traffic data over all lanes, 24 hours a day, 365 days a year.
Traffic activates the VDS devices embedded in or placed alongside freeways. Communication equipment transmits occupancy (occupancy means the amount of time a vehicle is physically above a detection device) and volume data from the roadside controllers to the regional Transportation Management Centers (TMCs) every 30 seconds. The data is then sent to the Caltrans Performance Measurement System (PeMS), which runs diagnostics on the data and stores the data in five minute bins. The stored data is used by engineers, planners, designers, consultants, commercial navigation firms, traffic media companies, and others interested in traffic conditions and performance. The data can be analyzed to calculate a number of performance measures.
Automated detection reduces data collection costs, improves self-reliance for congestion monitoring, allows a statewide standardized methodology for measuring traffic performance, and establishes a reliable trend line for future monitoring. However, until Caltrans has full (100 percent) detection coverage on its congested urban freeways, using VDS data presents two challenges: (1) congestion will not be reported for the small percentage (currently less than 10 percent) of congested freeway locations without VDS, and (2) when new VDS are activated, data will be reported for new locations and this expansion of coverage will distort trends over time.
The following pages in Appendix B present information on the calculations used in this report.
Calculating Vehicle Miles of Travel
For a given unit of time and a given section of the freeway, vehicle miles of travel (VMT) is the sum of the miles of freeway driven by each vehicle. For a section of fixed length, called L, the number of freeway miles driven is the flow for a period of time multiplied by the length L. In this report, VMT is calculated by summing the flow for all the lengths of all of the VDS deployed in each district, for all time periods within calendar year 2010 and 2011.

210
California Department of Transportation Mobility Performance Report 2011
Calculating Delay
The MPR 2011 uses the following calculation, computed in PeMS using the VDS data, to determine the vehicle hours of delay (VHD):
Delay = actual volume x [(length ÷ actual speed) – (length ÷ threshold speed)]
This calculation is the equivalent of:
Actual volume x [Travel Time at actual speed – Travel Time at threshold speed]
The actual volume (the number of vehicles in each lane) is known because Caltrans’ VDS provides vehicle counts. The summation is over all five minute periods where the average travel time is greater than the threshold travel time as derived from speed. Length refers to the freeway segment assigned to a particular VDS (determined by the distance to the neighboring upstream and downstream VDS). This methodology is standardized across all districts, promoting consistency and equity.
Delay is expressed in the units of VHD. Two threshold speeds are used in this report: 35 mph, representing severe congestion, and 60 mph, presenting total congestion. VHD at 35 mph is a subset of the VHD at 60 mph. VHD at 35 mph represents the delay experienced by vehicles traveling between zero and 35 mph. VHD at 60 mph represents the delay experienced by vehicles traveling between zero and 60 mph.
Calculating Cost of Congestion
Cost of lost time = total delay x $17.35, representing the cost of an hour of a traveler’s time. This figure represents the opportunity cost of travel time in terms of wages and salaries. An average vehicle occupancy of 1.30 is assumed in the $17.35 cost figure, as is a nine percent truck volume and a four percent real discount rate. This figure comes from the Caltrans Division of Transportation Planning, Office of State Planning, Economic Analysis Branch.
Cost of lost time a day = cost of lost time (see above) ÷ 365. This figure thus represents the average for all days of the year, not just weekdays.
Wasted fuel (gallons) = total delay in VHD x 1.719 gallons for each vehicle hour of delay. This formula has been used in the HICOMP Annual Date Compilation since the 1990s.
Cost of extra fuel = wasted fuel (gallons) x $3.71 a gallon. This figure is based on the observed average unleaded gasoline price in 2011, provided by the Caltrans Economic Analysis Branch.
Emissions of CO2 in tons (metric) = wasted fuel (gallons) x 8,887 grams of CO2 produced for each gallon of burned gasoline ÷ 1,000,000 grams in a metric ton. The formula of 8,887 grams of CO2 emissions from a gallon of gasoline is from the

211
California Department of Transportation Mobility Performance Report 2011
U.S. Environmental Protection Agency, “Questions & Answers: Greenhouse Gas Emissions from a Typical Passenger Vehicle” (EPA–420–F–11–041), December 2011, <http://www.epa.gov/otaq/climate/documents/420f11041.pdf>, accessed on October 10, 2013.
Calculating Lost Productivity
PeMS calculates the number of lane-mile-hours on a freeway that are lost due to operating under congested conditions instead of under free-flow conditions. When a freeway is congested (i.e., when speeds are below the 35 mph threshold used in this report for calculating Lost Productivity), PeMS calculates the ratio between the measured flow and the maximum sustainable capacity for the location. This drop in capacity is observed when the freeway is operating in congested conditions instead of in free-flow, and fewer vehicles can pass a given point in a given time period because speeds have dropped. PeMS then multiplies one minus this ratio by the length of the segment to determine the number of equivalent lane-miles-hours of freeway that this represents. To determine the maximum sustainable capacity at a given location, historical measured data for each location are analyzed to determine the maximum observed 15 minute flow. The minimum five-minute flow within that maximum fifteen minute flow is used as the maximum sustainable flow, or maximum sustainable capacity.
In this report, the equivalent lost lane-mile-hours for each defined time period (AM Peak, PM Peak, etc.) is calculated using PeMS. These lost lane-mile-hours are divided by the number of hours within the period (e.g., the AM Peak, from 6 AM to 10 AM, has four hours) to calculate lost lane miles (LLM).
Determining Bottleneck Locations
This report uses the Bottleneck Identification Algorithm in PeMS as a starting point for determining bottleneck locations. PeMS uses the following criteria in calculating bottlenecks:
• There must be a drop in speed of at least 20 mph between the current detector and its nearest downstream detector.
• The speed at the current detector must be less than 40 mph.
• The space between detectors must be less than three miles apart.
• The speed drop must persist for at least five out of any seven contiguous five–minute data points.
PeMS reports the amount of delay, expressed in VHD, associated with each bottleneck, as well as the average extent (or queue length) of the bottleneck and the average duration that the bottleneck persists, in minutes. It also reports on the number of
212
California Department of Transportation Mobility Performance Report 2011
days in the given period that the bottleneck was active – a bottleneck is active when it meets all of the criteria listed above.
From the initial list generated by PeMS, the results were filtered to report bottlenecks that met the following additional criteria:
• The bottleneck must be active at least 20 percent of all weekdays within the period, which was 251 days in 2011.
• The bottleneck must cause at least 100 VHD per weekday.
• The bottleneck must persist for at least 15 minutes per weekday.
Some districts did not have 10 bottlenecks that met this additional criteria within either the AM or PM Peak periods.
When mapping the bottlenecks, the average extent of each bottleneck, as calculated by PeMS, was used to show the freeway segments that are congested when the bottlenecks are active.
In listing their bottlenecks, each district used their local knowledge and engineering judgment to modify locations of bottlenecks as deemed appropriate. PeMS calculates bottlenecks based on the location of detector stations, but the true cause of the bottleneck may exist somewhere between two detector stations.

213
California Department of Transportation Mobility Performance Report 2011
APPENDIX C
GLOSSARY
Absolute Postmile:
The true measure of linear distance, in miles, from the beginning of a route to its terminus. Postmiles are measured from South to North on odd numbered routes and from West to East on even numbered routes. PeMS uses Absolute Postmiles to calculate many of the performance measures, like vehicle miles of travel and vehicle hours of delay, which require knowing the length of the route in order to compute them. The Absolute Postmile does not reset to zero at each county line, as does the County-Route-Postmile system that Caltrans uses as its standard mileage measurement system. Bottleneck:
A bottleneck is a persistent drop in speed between two locations on a freeway. A bottleneck can have a number of causes, including a change in capacity (like a reduction of the number of lanes), a visual distraction, an incident, a weaving section, etc. Caltrans Performance Measurement System (PeMS):
A traffic data collection, processing, and analysis tool for assessing the performance of the transportation system. PeMS obtains 30-second detector count and occupancy data from Caltrans detectors in real-time from the district Transportation Management Centers (TMCs). PeMS can be accessed at <http://pems.dot.ca.gov>. County-Route-Postmile:
California uses a postmile system on all of its State highways, including U.S. Routes and Interstate Highways. The postmile markers indicate the distance a route travels through individual counties. In general, even numbered routes are measure from West to East and odd numbered routes are measured from South to North. The postmiles begin at zero at each county line; therefore, it is necessary to include the county with the postmile to understand its location. If a route alignment changes, prefixes and equations are used so that not all of the postmiles from the realignment point to the end of the route need to be recalculated. Because of this system, it is necessary to understand what the prefixes mean – and what the equations are behind them – to understand the true linear distance of the route. PeMS refers to the county-route postmile as the California Postmile.

214
California Department of Transportation Mobility Performance Report 2011
Directional Mile:
A one–mile length of freeway has two directional miles, regardless of the number of lanes. Floating Vehicle or Probe Vehicle:
A vehicle equipped with either a fixed transmission sensor mounted in the engine compartment or a global positioning system device. Computer software is used to identify the freeway, direction of travel, and average speed of the vehicle – data that can be used to calculate travel time. Caltrans often refers to collecting data using one of these vehicles as doing a Tachometer or "tach" run. Highway Congestion Monitoring Program (HICOMP):
The MPR replaces the HICOMP Annual Data Compilation as the report that satisfies Caltrans’ statutory obligation to report congestion data, as described in Government Code section 14032.6. Nonrecurrent Congestion:
Congestion caused by events that occur irregularly, such as accidents, sporting events, maintenance, or construction. Occupancy:
In this report, when “occupancy” is mentioned as a data element collected by VDS, occupancy means the amount of time a vehicle is physically above a detection device (usually an in-ground loop). Occupancy is used to derive the speed of traffic. A secondary usage is in terms of "vehicle occupancy" and refers to the number of people traveling in a vehicle. This secondary usage is not used in this report. Maximum Sustainable Flow:
Refers to the capacity of a roadway and is the maximum number of vehicles that can reasonably be expected to traverse it during a specified time period under given roadway, geometric, traffic, environment, and control condition. It is used in the calculation of Lost Productivity. PeMS estimates the capacity for each station as the maximum five–minute sustainable flow over 15 minutes. To compute this value, a few weeks of weekday, peak period (both AM and PM), five–minute observed flow data aggregated across all lanes are used to find the maximum for any 15–minute period. Then, the minimum five–minute flow of that 15–minute maximum is used. Only values that have more than 50 percent "good" detector health are used. The resulting value is the maximum sustainable flow, or the capacity, of that location.

215
California Department of Transportation Mobility Performance Report 2011
Recurrent Congestion:
Congestion caused by traffic demand exceeding roadway capacity, regularly resulting in delay during peak periods. Travel Time:
The time, typically expressed in minutes, that it takes to go from one end of a defined corridor to the other. Vehicle Detector Station (VDS):
A VDS is a logical grouping of automated detectors, usually referring to a set of detectors spanning a freeway at a particular location in one direction. Vehicle Hours of Delay (VHD):
The metric used to express the amount of additional time caused by congestion that vehicles spend on a section of road. This is the difference between the travel time at a threshold speed and the current speed (only calculated when the current speed is below the threshold speed). A threshold speed must be set to determine the VHD. In this report, 35 mph and 60 mph are the threshold speeds and delay is expressed as both total delay and average delay over a given time period. Vehicle Miles of Travel (VMT):
The metric used to express the total miles that are driven in a certain area. PeMS takes the number of cars that drove over a detector during a period (flow) and multiplies it by the segment length. It then does that for each detector in a given area, such as a district, facility, or the entire State, and adds the miles up to get the total VMT.

216
California Department of Transportation Mobility Performance Report 2011
PAGE INTENTIONALLY LEFT BLANK

217
California Department of Transportation Mobility Performance Report 2011
APPENDIX D
STATEWIDE MAP OF CALTRANS DISTRICTS
2
8
6 9
3
5
1
4
7
10
1112
SBD
INY
RIV
KER
SIS
LA
SD
FRE
TUL
IMP
LASTRI
SB
SHA
MOD
SLO
MEN
HUM
TEH
MON
MNO
PLU
ED
SJ TUO
MAD
VEN
MER
BUT
KIN
PLA
STA
SON
SBT
LAK
DN
MPASCL
GLE SIE
COL
CAL
YOL
CC
SACSOL
ALP
ORA
YUB
SM
MRNSF
NAP
N
EW
S
CaltransDistrict Numberin BLUE
0 100 200 Miles
Department
2
8
6 9
3
5
1
4
7
10
1112
SBD
INY
RIV
KER
SIS
LA
SD
FRE
TUL
IMP
LASTRI
SB
SHA
MOD
SLO
MEN
HUM
TEH
MON
MNO
PLU
ED
SJ TUO
MAD
VEN
MER
BUT
KIN
PLA
STA
SON
SBT
LAK
DN
MPASCL
GLE SIE
COL
CAL
YOL
CC
SACSOL
ALP
ORA
YUB
SM
MRNSF
NAP
N
EW
S
CaltransDistrict Numberin BLUE
0 100 200 Miles
Department

218
California Department of Transportation Mobility Performance Report 2011
APPENDIX E
DISTRICT CONTACTS
District Contact Person Phone Number E-mail Address
3 Matt Taghipour (916) 859–7950 [email protected]
4 Ron Kyutoku (510) 286–4640 [email protected]
5 Roger D. Barnes (805) 748–2635 [email protected]
6 Tyler Laing (559) 351–1877 [email protected]
7 Ashraf Armanious (213) 897–6504 [email protected]
8 Ramin Ghodsi (909) 383–6474 [email protected]
10 Arlene Cordero (209) 948–3869 [email protected]
11 Carlos Mendoza (858) 467–3013 [email protected]
12 Calvin La (949) 724–2049 [email protected]
HQ Drucilla Dunton (916) 653–4310 [email protected]
For more information or additional copies of the “Mobility Performance Report 2011,” please contact Drucilla Dunton at (916) 653–4310 or by e–mail sent to [email protected].