Mobility and Patent Productivity of Korean Inventors - WIPO
37
Mobility and Patent Productivity of Korean Inventors of Korean Inventors Jinyoung Kim Korea University Korea University WIPO Seminar Series October 29, 2012
Transcript of Mobility and Patent Productivity of Korean Inventors - WIPO
Mobility and Patent Productivity of Korean Inventorsof Korean Inventors
Jinyoung Kim
Korea UniversityKorea University
WIPO Seminar SeriesOctober 29, 2012
IntroductionIntroduction
• Most researches that study patent data from patent offices• Most researches that study patent data from patent offices around the world have been conducted at patent or firm level.
• Important piece of information not utilized so far is the identity• Important piece of information not utilized so far is the identity of inventors. Inventor-level studies were not carried out because unique inventors cannot be identified.
• Lately we are witnessing a wave of new research at inventor level owing to numerous projects on matching inventor names, or disambiguation (e g Trajtenberg Shiff Melamed 2006; Laidisambiguation (e.g. Trajtenberg, Shiff, Melamed, 2006; Lai, D'Amour, Fleming, 2009)
• One caveat: accuracy in name matching• One caveat: accuracy in name matching– Under-matching error (Type I): more likely for prolific inventors– Over-matching error (Type II): more likely for popular names (the “John Smith”
problem)problem)
IntroductionIntroduction
• Korean Intellectual Property Office (KIPO): collecting inventors’• Korean Intellectual Property Office (KIPO): collecting inventors resident registration information (similar to social security number in US) since 1991, which is not for public use
• We were able to acquire from KIPO unique ID’s for inventors along with information on birth year and gender.
• Unique advantages of our Korean inventor data: (i) measuring patent productivity of inventors accurately at diff d b ddifferent age, and by gender(ii) identifying job turnover accurately since name matching utilizes firm affiliation shown on patent assignee fieldp g
IntroductionIntroduction
• In this study, we investigate determinants of inventor productivity, including the effects of labor mobility and the age effect.
• Labor mobility and technology transfer− Arrow (1962), Stephan (1996): Inter-firm mobility of scientists transmits technological know-how across firms.
• Theoretical explanations for the age effect on productivity in the labor literature
(a) Physical capacity( ) y p y(b) Cognitive (mental) abilities
− Evidence shows decline in cognitive abilities with age (across countries and ability groups by gender)and ability groups, by gender).− Reasoning, perceptual speed decline sharply with age while verbal abilities remain rather unchanged.
( ) E i(c) Experience
Preliminary FindingsPreliminary Findings
• Patent productivity jumps up after a move and then gradually• Patent productivity jumps up after a move, and then gradually converges to the average.
• More incoming inventors to a firm in the past enhances• More incoming inventors to a firm in the past enhances productivities of co-workers in the firm.
• Patent productivity declines with age in terms of annual patent• Patent productivity declines with age in terms of annual patent counts per inventor as well as the weighted number of patents.
• We observe a rising productivity over time Productivity is higherWe observe a rising productivity over time. Productivity is higher for younger cohorts.
• There is trade-off between claims and patent counts BiggerThere is trade off between claims and patent counts. Bigger teams produce more patents.

OutlineOutline
1 Literature Review1. Literature Review
2 Data Description2. Data Description
3 D i ti St ti ti3. Descriptive Statistics
4 E i i l A l i M h d l d Fi di4. Empirical Analysis: Methodology and Findings
5. Concluding Remarks
Literature on Researcher MobilityLiterature on Researcher Mobility
• Numerous studies on technology transfer via inter-firm mobility of researchers
• Levin, Klevoric, Nelson, Winter (1987): survey evidence that firms count the hiring of R&D employees from innovating firms as acount the hiring of R&D employees from innovating firms as a means of learning about new technologies
• Almeida, Kogut (1999): scientific references that firms cite in their t t fl t th l t hi t i f th i i ti t ipatents reflect the employment histories of their scientists in
semiconductor industry, suggesting that ideas in this industry are spread by the movement of key engineers among firms
• Kerstetter (2000), Hibbard (1998): high profile examples of employee raids designed to gain access to competitors’ technologiestechnologies
• Cohen, Nelson, Walsh (2002): firms access externally-located technology through the hiring of researchers from the outside
Literature on Age effect on ProductivityLiterature on Age effect on Productivity
(a) Income of independent workers: objective and easy to estimate(a) Income of independent workers: objective and easy to estimate, but applicable only to limited occupations
− Oliviera, Cohn, Kiker (1989): self-employed in 1983 PSID, inverted U-shaped
(b) S i ’ l i bj i d b i i h f(b) Supervisor’s evaluation: subjective and may be given in the form of rewards for past performances− Medoff, Abraham (1981): white-collar employees in large US firms, seniority not or negatively related with performances
(c) Output per person: objective indicator, but possible only when individual production can be easily monitored (Artistic works, p y ( ,publications, patents)− Galenson, Weinberg (2000): artists; peak at 51 for those born before 1920, 29 for those born after 1920− Levin, Stephan (1988): US academic scientists; negative age effect in physics, earth science, physiology, biochemistry− Oster, Hammermesh (1998): economists; publications declining sharply with age− Weinberg, Galenson (2007): Nobel laureates in economics; peak at the mid-50’s for experimental laureates while age 25 for conceptual laureates
Data DescriptionData Description
• We merge the Korean patent data to firm data from Korea• We merge the Korean patent data to firm data from Korea Investors Service (KIS value data).
• Korean patent data: - Years 1991-2005 (earlier years available but inventor id information not available)information not available)- Annual patent number grew from 9,970 in 1991 to 82,898 in 2005- About 100,000 unique inventors (female: less than 2%)
KIS value data:• KIS value data:- Equivalent to Compustat data (for US corporations)- Annual data on capital, sales, employment, R&DAnnual data on capital, sales, employment, R&D
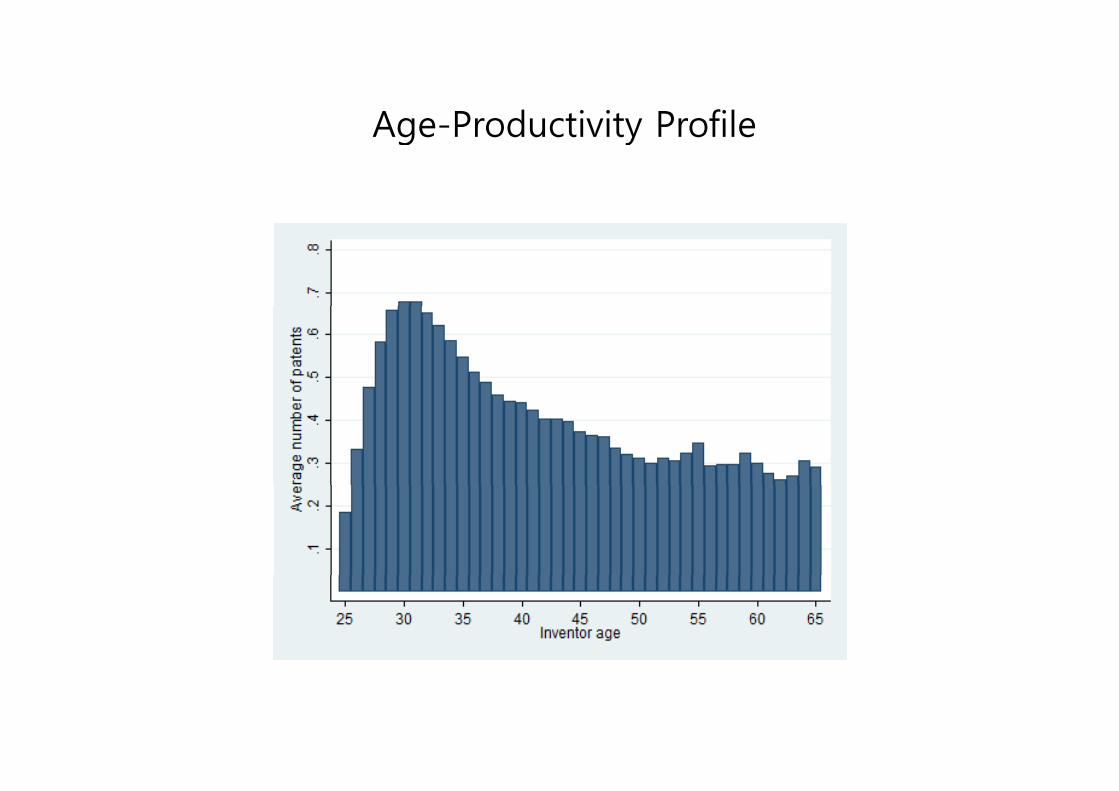
Age-Productivity ProfileAge-Productivity Profile
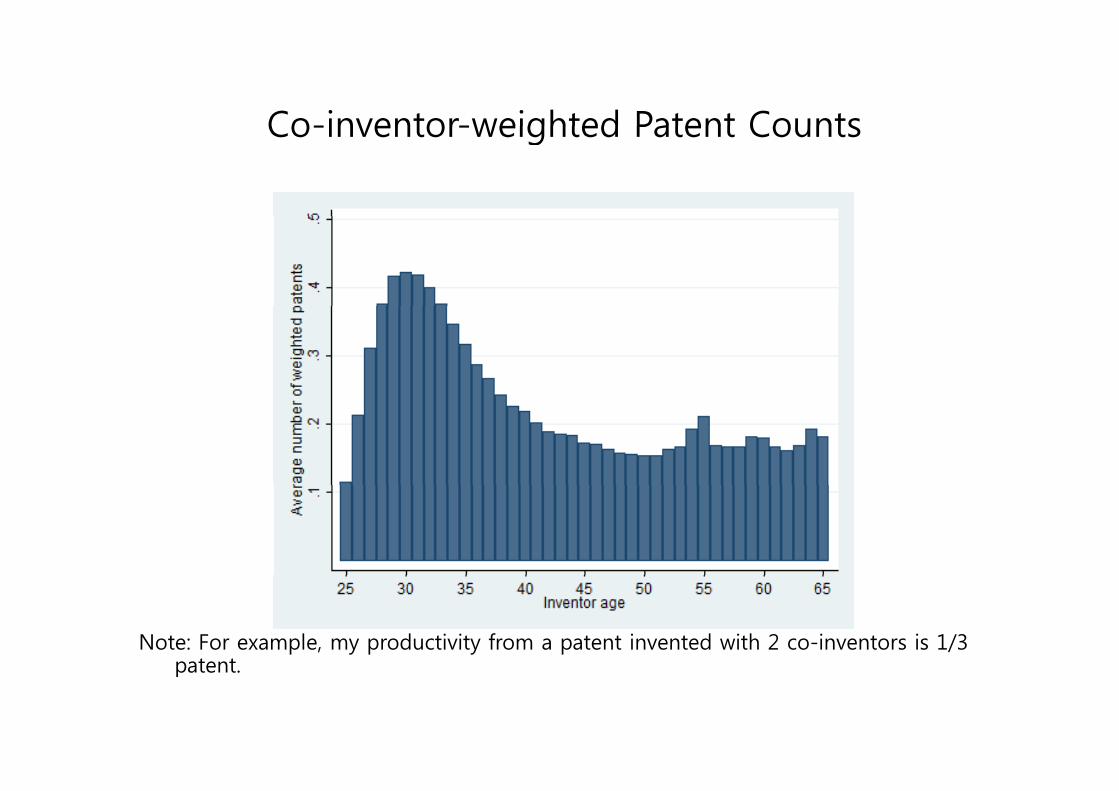
Co-inventor-weighted Patent CountsCo-inventor-weighted Patent Counts
Note: For example, my productivity from a patent invented with 2 co-inventors is 1/3 patentpatent.
Regression Analysis
• Dependent variable = annual number of patents of an inventor ( i t i ht d b f t t )(or, co-inventor-weighted number of patents)
• We use a panel-data negative binomial model with inventor-We use a panel data negative binomial model with inventorspecific fixed effects to estimate the determinants of patent productivity. (Or, a fixed-effects linear regression model for weighted number of patents)weighted number of patents)
Strategies for EmpiricsStrategies for Empirics
• In order to sort out the age effect from the cohort and time effects, we postulate that the time (or calendar year) effect is dueeffects, we postulate that the time (or calendar year) effect is due to changes in the overall propensity of patenting, and the time effect is proxied by the total annual number of patent applications and that of inventors:applications and that of inventors:
Y_EFFt = f(TPATt, TINVt)
≅ β1 TPATt + β2 TPAT2t + β3 TPAT3
t
+ β4 TINVt + β5 TINV2t + β6 TINV3
t
(approximated by Taylor expansion)
• We include linear, quadratic, and cubic terms of the age variable because we see an inverted-U shaped profile with a long tail on the right hand sidethe right-hand side.
Model SpecificationModel Specification
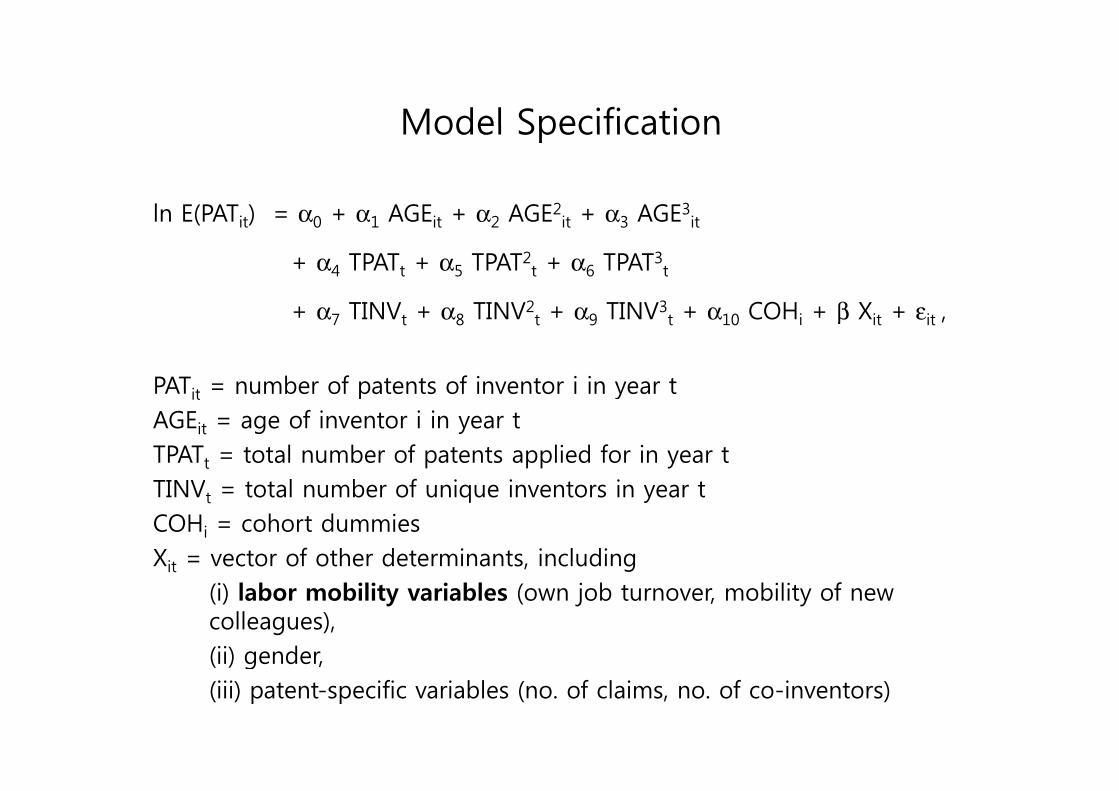
ln E(PATi ) = α0 + α1 AGEi + α2 AGE2i + α3 AGE3
iln E(PATit) = α0 + α1 AGEit + α2 AGE it + α3 AGE it
+ α4 TPATt + α5 TPAT2t + α6 TPAT3
t
TINV TINV2 TINV3 COH β X+ α7 TINVt + α8 TINV2t + α9 TINV3
t + α10 COHi + β Xit + εit ,
PATit = number of patents of inventor i in year tit p yAGEit = age of inventor i in year tTPATt = total number of patents applied for in year tTINV total number of unique inventors in year tTINVt = total number of unique inventors in year tCOHi = cohort dummiesXit = vector of other determinants, including
(i) labor mobility variables (own job turnover, mobility of new colleagues),(ii) gender,( ) g ,(iii) patent-specific variables (no. of claims, no. of co-inventors)
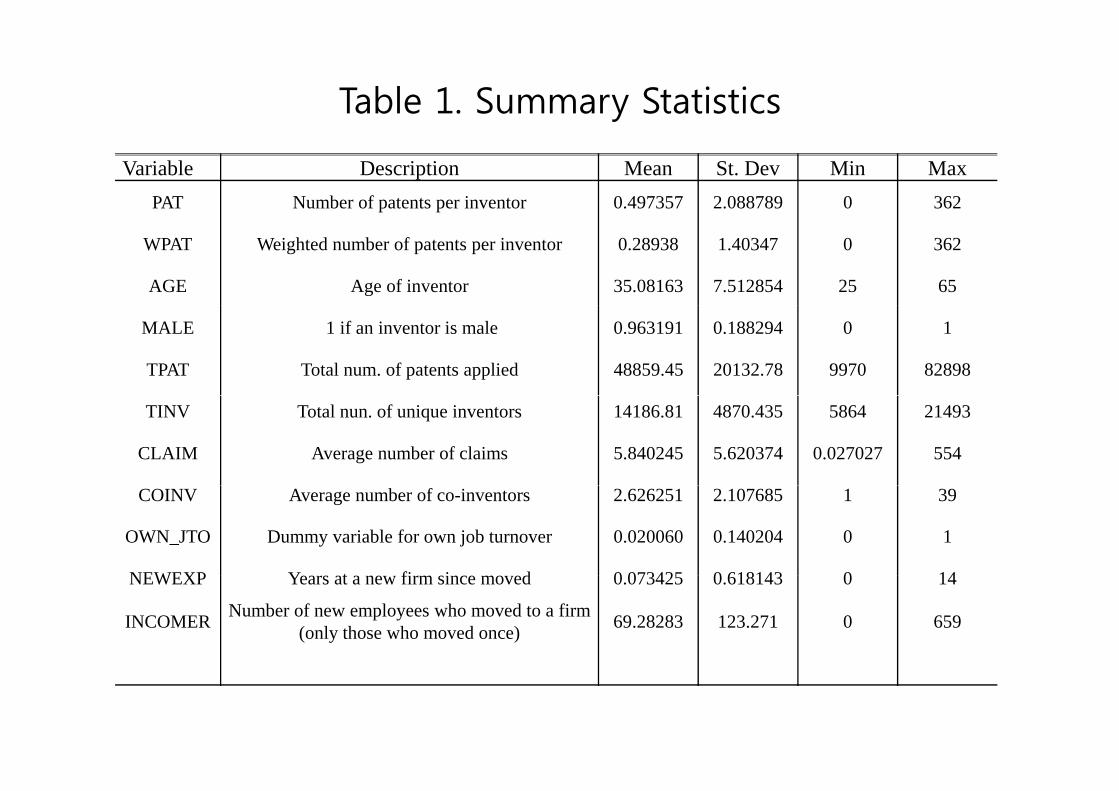
Table 1. Summary Statistics
Variable Description Mean St. Dev Min MaxPAT Number of patents per inventor 0.497357 2.088789 0 362
WPAT Weighted number of patents per inventor 0.28938 1.40347 0 362
AGE Age of inventor 35.08163 7.512854 25 65
MALE 1 if an inventor is male 0.963191 0.188294 0 1
TPAT Total num. of patents applied 48859.45 20132.78 9970 82898
TINV Total nun. of unique inventors 14186.81 4870.435 5864 21493
CLAIM Average number of claims 5.840245 5.620374 0.027027 554
COINV Average number of co-inventors 2.626251 2.107685 1 39
OWN_JTO Dummy variable for own job turnover 0.020060 0.140204 0 1
NEWEXP Y t fi i d 0 073425 0 618143 0 14NEWEXP Years at a new firm since moved 0.073425 0.618143 0 14
INCOMER Number of new employees who moved to a firm (only those who moved once) 69.28283 123.271 0 659

Table 2. Patents Counts
(1) All inventors (2) All inventorsCoef. z Coef. z
AGE 1.35042 119.48 0.189555 12.14
AGE2 -0.03298 -114.62 -0.005 -12.35
AGE3 0.000257 108.09 3.95E-05 11.51
MALE 0.165033 8.53 -0.16092 -3.30
TPAT 5.88E-05 23.04 2.05E-06 0.80
TPAT2 -8.43E-10 -14.33 1.26E-10 2.15
TPAT3 4.47E-15 10.33 -8.71E-16 -2.03TPAT3 4.47E 15 10.33 8.71E 16 2.03
TINV -9.2E-05 -4.59 0.000104 5.33
TINV2 5.95E-09 3.97 -8.37E-09 -5.68
TINV3 1 01E 13 2 72 1 98E 13 5 43TINV3 -1.01E-13 -2.72 1.98E-13 5.43
lnCLAIM -0.02278 -9.47
D_CLAIM0 -0.40002 -25.30
l COINV 0 256473 69 85lnCOINV 0.256473 69.85
D_COINV0 -26.3746 -0.04
Obs. 2,293,235 2,293,235
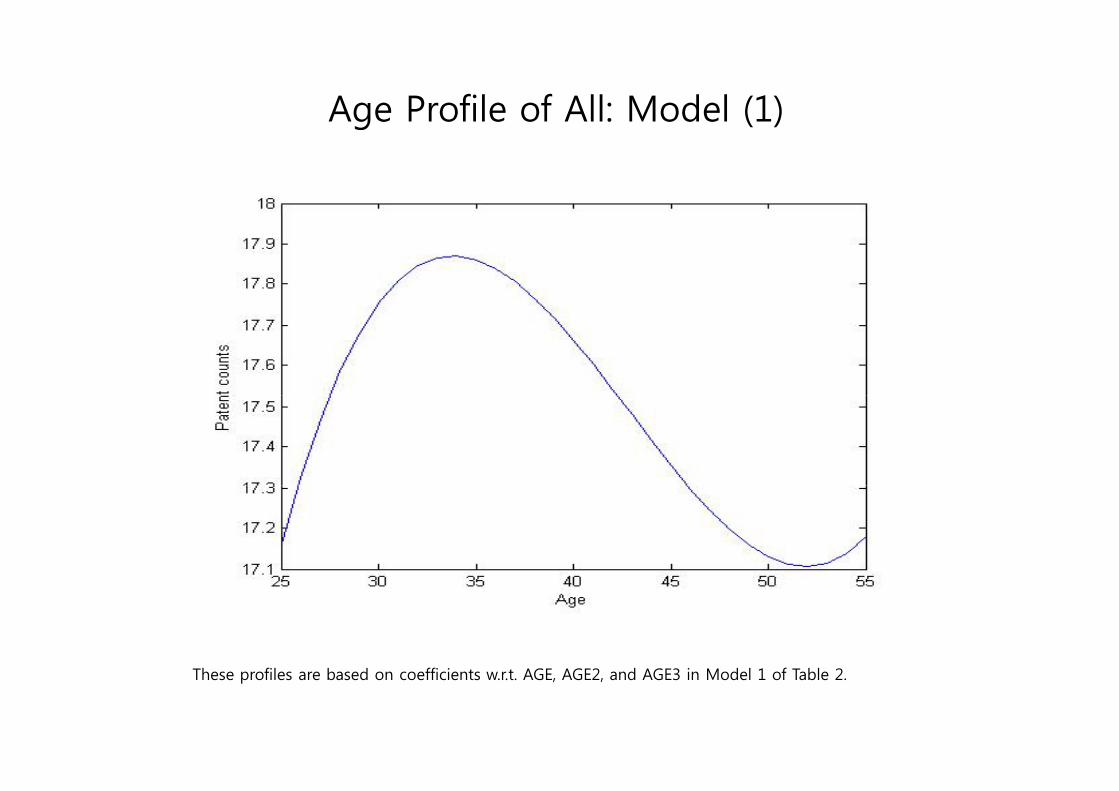
Age Profile of All: Model (1)g ( )
These profiles are based on coefficients w.r.t. AGE, AGE2, and AGE3 in Model 1 of Table 2.
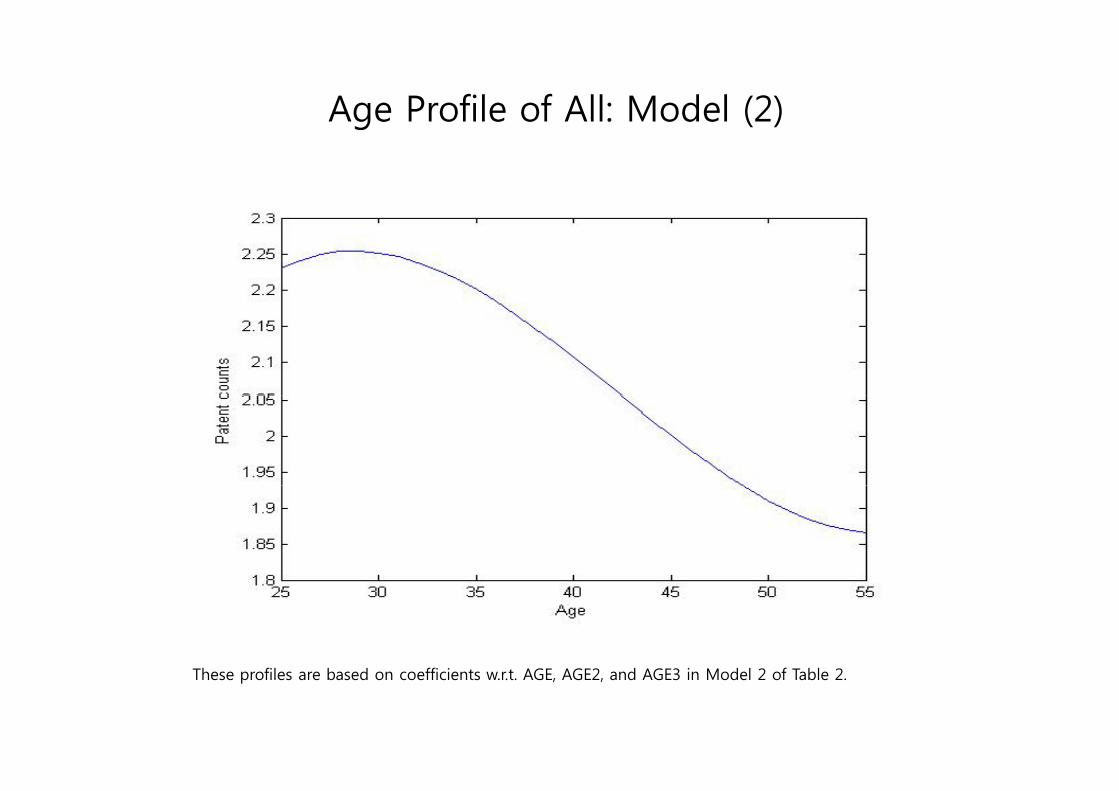
Age Profile of All: Model (2)g ( )
These profiles are based on coefficients w.r.t. AGE, AGE2, and AGE3 in Model 2 of Table 2.
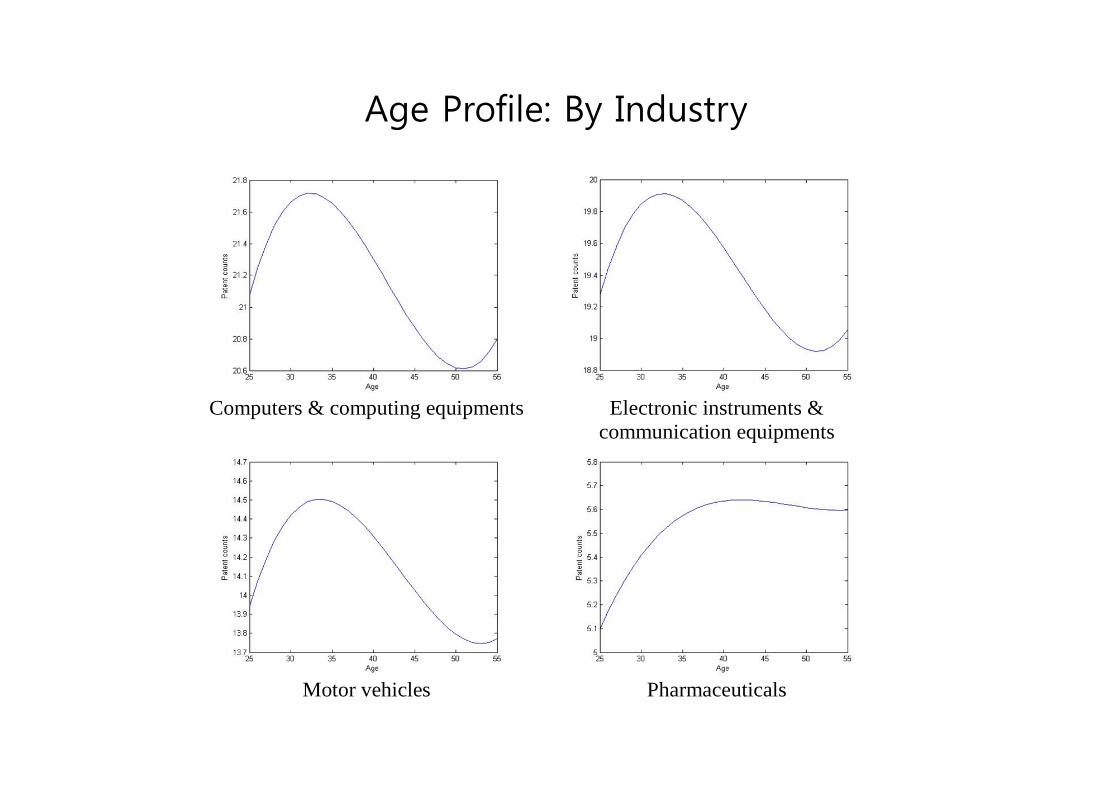
Age Profile: By Industryg y y
Computers & computing equipments Electronic instruments & communication equipments
Motor vehicles Pharmaceuticals
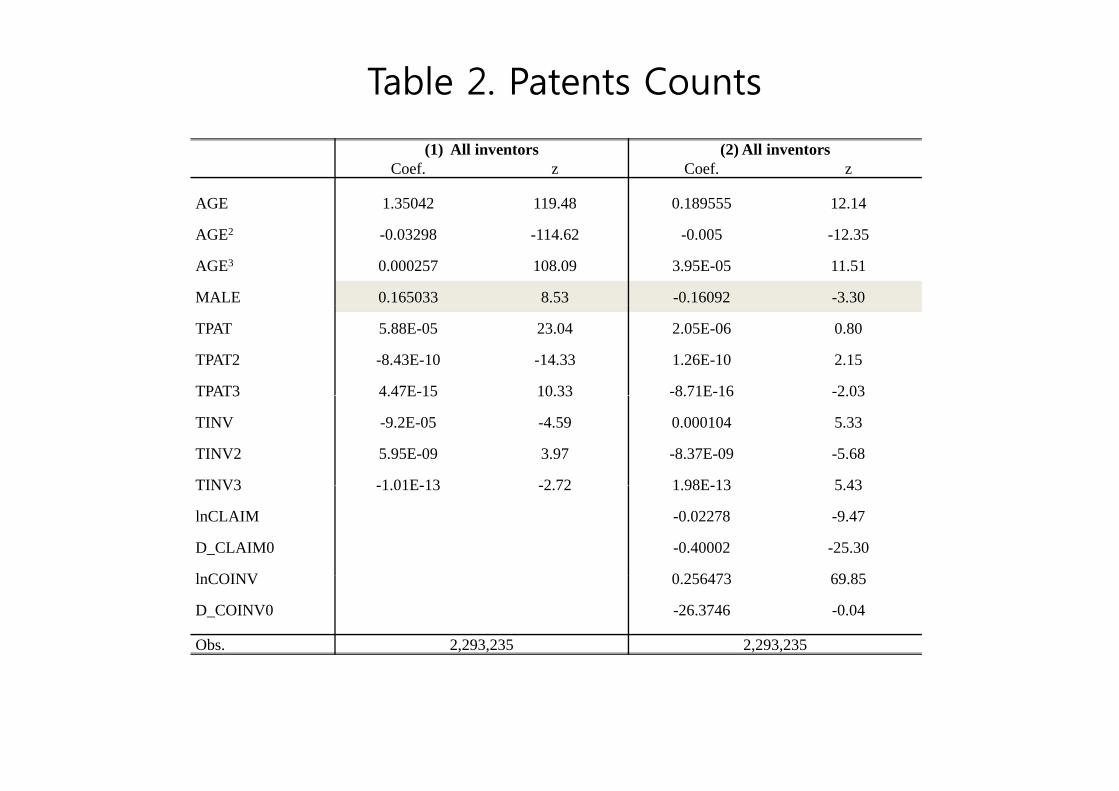
Table 2. Patents Counts
(1) All inventors (2) All inventorsCoef. z Coef. z
AGE 1.35042 119.48 0.189555 12.14
AGE2 -0.03298 -114.62 -0.005 -12.35
AGE3 0.000257 108.09 3.95E-05 11.51
MALE 0.165033 8.53 -0.16092 -3.30
TPAT 5.88E-05 23.04 2.05E-06 0.80
TPAT2 -8.43E-10 -14.33 1.26E-10 2.15
TPAT3 4.47E-15 10.33 -8.71E-16 -2.03TPAT3 4.47E 15 10.33 8.71E 16 2.03
TINV -9.2E-05 -4.59 0.000104 5.33
TINV2 5.95E-09 3.97 -8.37E-09 -5.68
TINV3 1 01E 13 2 72 1 98E 13 5 43TINV3 -1.01E-13 -2.72 1.98E-13 5.43
lnCLAIM -0.02278 -9.47
D_CLAIM0 -0.40002 -25.30
l COINV 0 256473 69 85lnCOINV 0.256473 69.85
D_COINV0 -26.3746 -0.04
Obs. 2,293,235 2,293,235
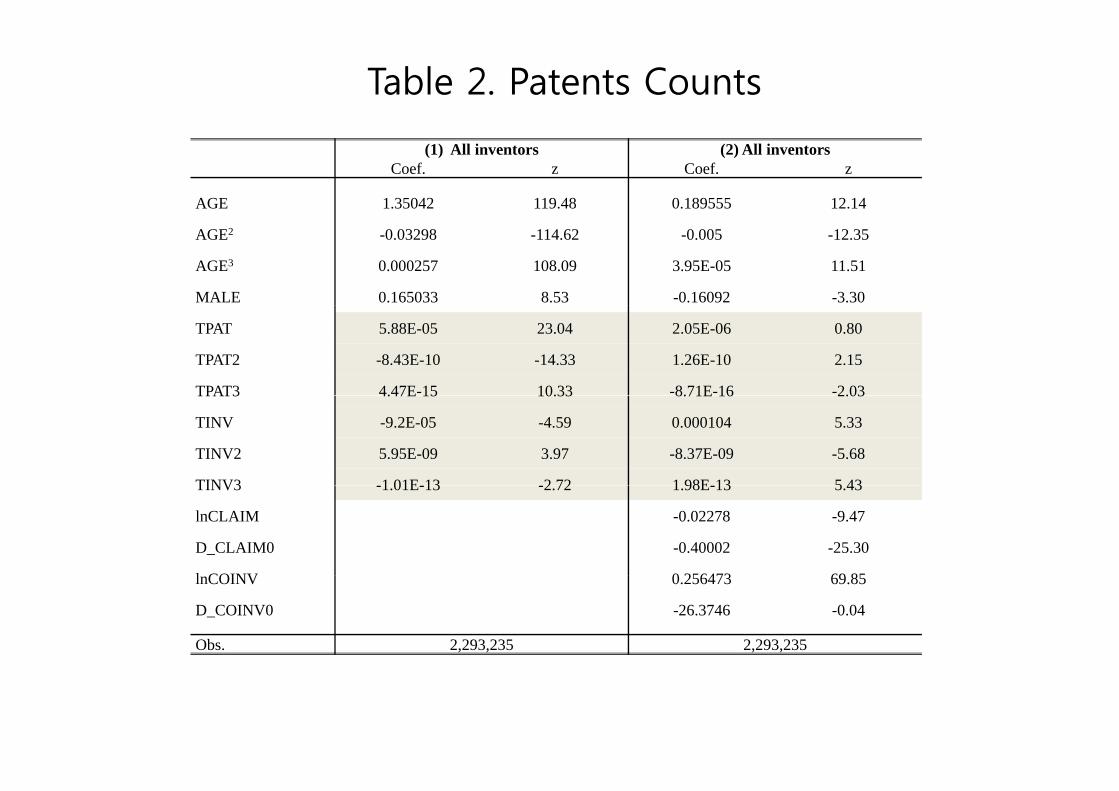
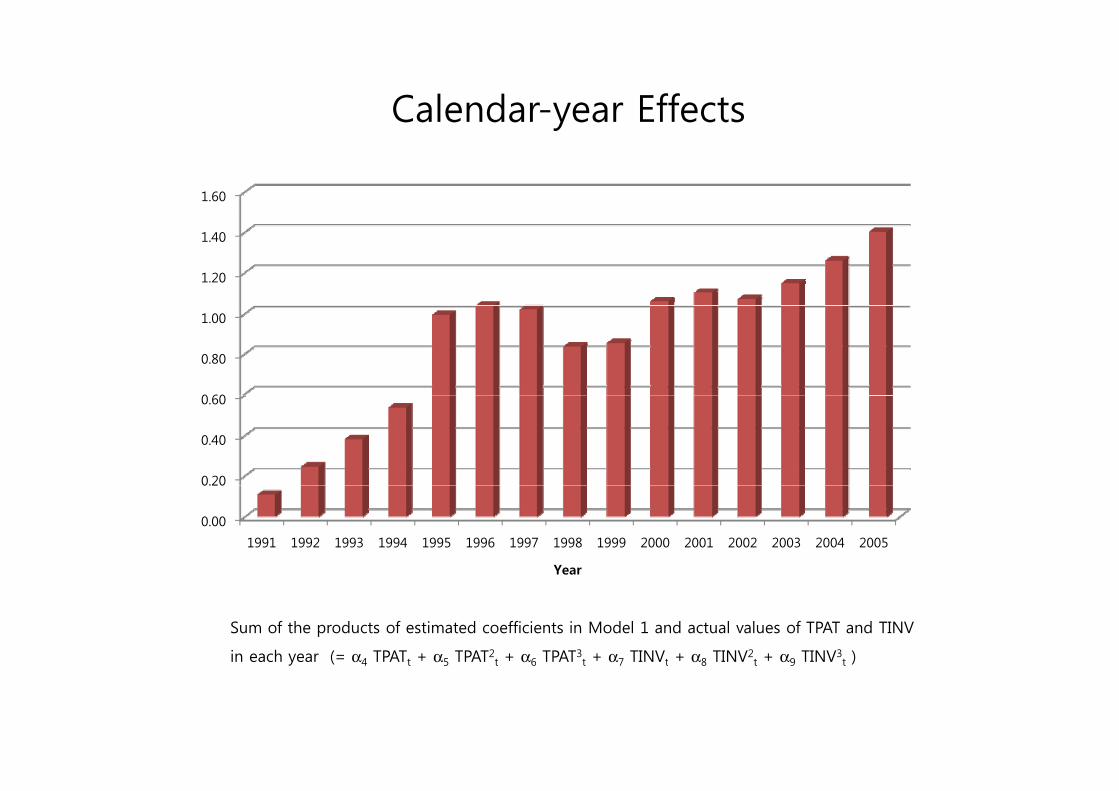
Calendar-year Effectsy
1.60
1.20
1.40
0 60
0.80
1.00
0.20
0.40
0.60
0.00
0.20
1991 1992 1993 1994 1995 1996 1997 1998 1999 2000 2001 2002 2003 2004 2005
Year
Sum of the products of estimated coefficients in Model 1 and actual values of TPAT and TINV
in each year (= α4 TPATt + α5 TPAT2t + α6 TPAT3
t + α7 TINVt + α8 TINV2t + α9 TINV3
t )y 4 t 5 t 6 t 7 t 8 t 9 t

Cohort Effects
0.7
0.8
0.5
0.6
0.3
0.4
0.1
0.2
0
1926~50 1951~55 1956~60 1961~65 1966~70 1971~75 1976~80

Table 2. Patents Counts
(1) All inventors (2) All inventorsCoef. z Coef. z
AGE 1.35042 119.48 0.189555 12.14
AGE2 -0.03298 -114.62 -0.005 -12.35
AGE3 0.000257 108.09 3.95E-05 11.51
MALE 0.165033 8.53 -0.16092 -3.30
TPAT 5.88E-05 23.04 2.05E-06 0.80
TPAT2 -8.43E-10 -14.33 1.26E-10 2.15
TPAT3 4.47E-15 10.33 -8.71E-16 -2.03TPAT3 4.47E 15 10.33 8.71E 16 2.03
TINV -9.2E-05 -4.59 0.000104 5.33
TINV2 5.95E-09 3.97 -8.37E-09 -5.68
TINV3 1 01E 13 2 72 1 98E 13 5 43TINV3 -1.01E-13 -2.72 1.98E-13 5.43
lnCLAIM -0.02278 -9.47
D_CLAIM0 -0.40002 -25.30
l COINV 0 256473 69 85lnCOINV 0.256473 69.85
D_COINV0 -26.3746 -0.04
Obs. 2,293,235 2,293,235
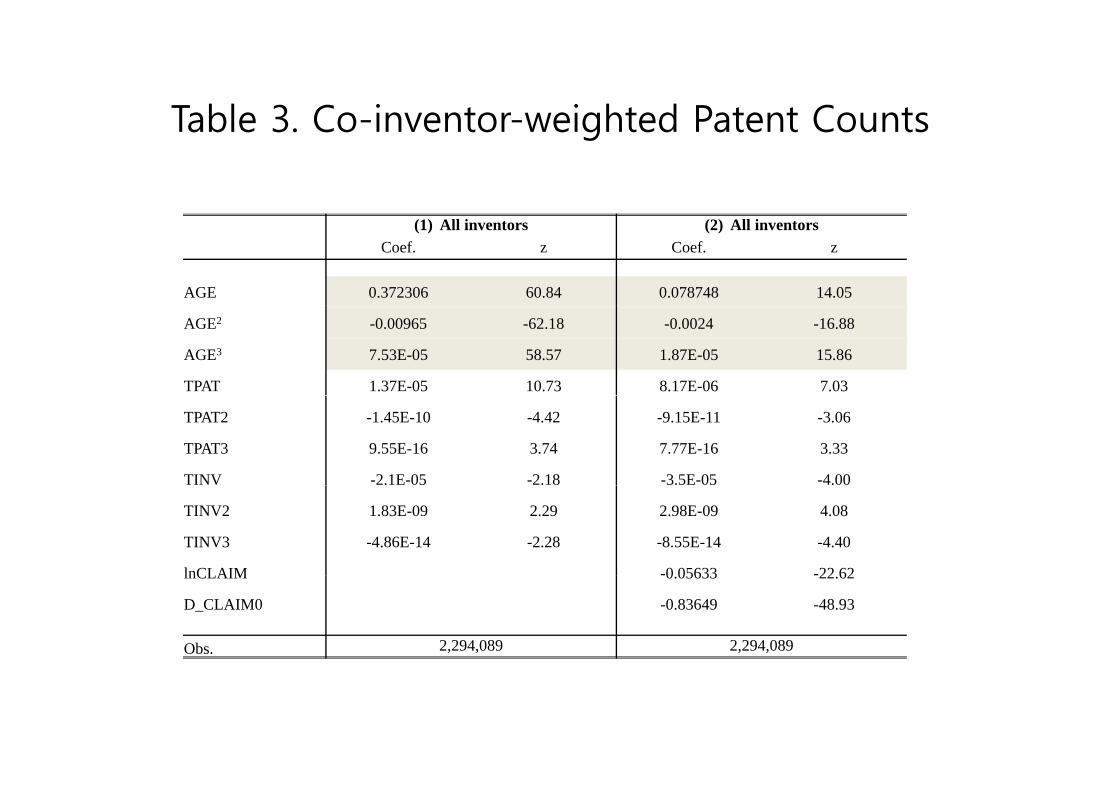
Table 3 Co-inventor-weighted Patent CountsTable 3. Co inventor weighted Patent Counts
(1) All inventors (2) All inventorsCoef. z Coef. z
AGE 0.372306 60.84 0.078748 14.05
AGE2 -0.00965 -62.18 -0.0024 -16.88
AGE3 7.53E-05 58.57 1.87E-05 15.86
TPAT 1.37E-05 10.73 8.17E-06 7.03
TPAT2 -1.45E-10 -4.42 -9.15E-11 -3.06
TPAT3 9.55E-16 3.74 7.77E-16 3.33
TINV -2.1E-05 -2.18 -3.5E-05 -4.00
TINV2 1.83E-09 2.29 2.98E-09 4.08
TINV3 -4.86E-14 -2.28 -8.55E-14 -4.40
lnCLAIM -0 05633 -22 62lnCLAIM -0.05633 -22.62
D_CLAIM0 -0.83649 -48.93
Obs. 2,294,089 2,294,089

Weighted Patent Counts, Model (1)g ( )
These profiles are based on coefficients w.r.t. AGE, AGE2, and AGE3 in Model 1 of Table 3.
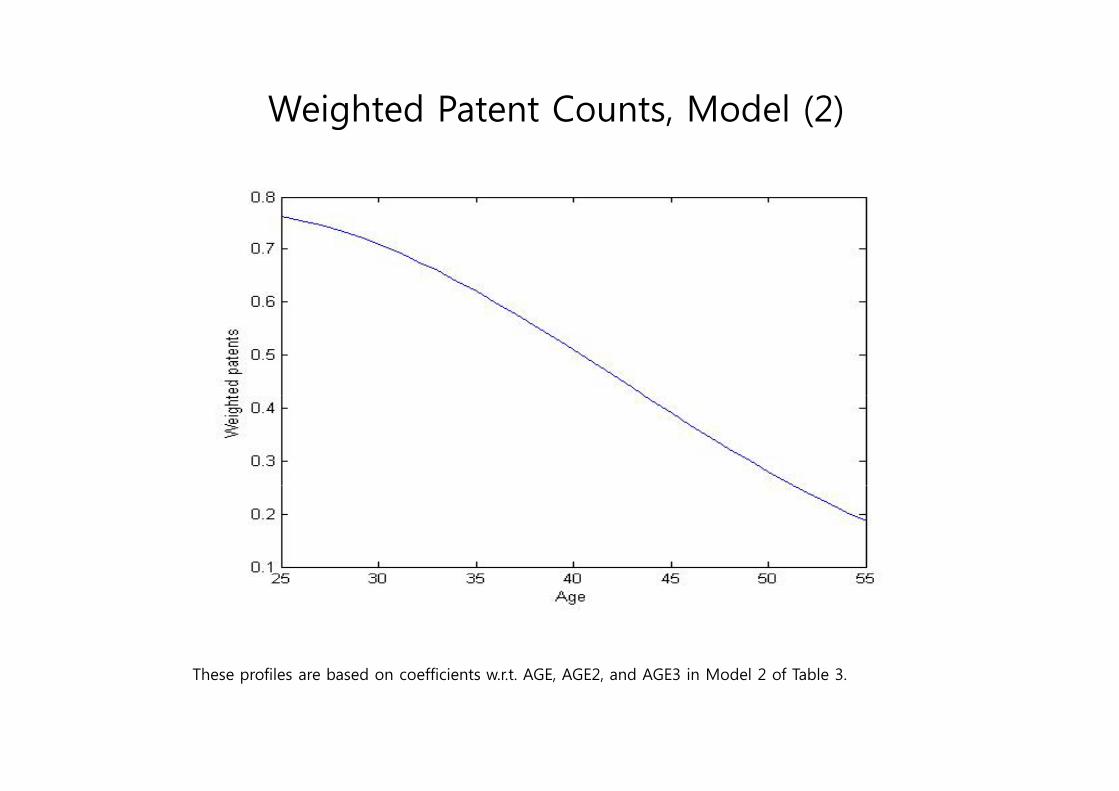
Weighted Patent Counts, Model (2)g ( )
These profiles are based on coefficients w.r.t. AGE, AGE2, and AGE3 in Model 2 of Table 3.
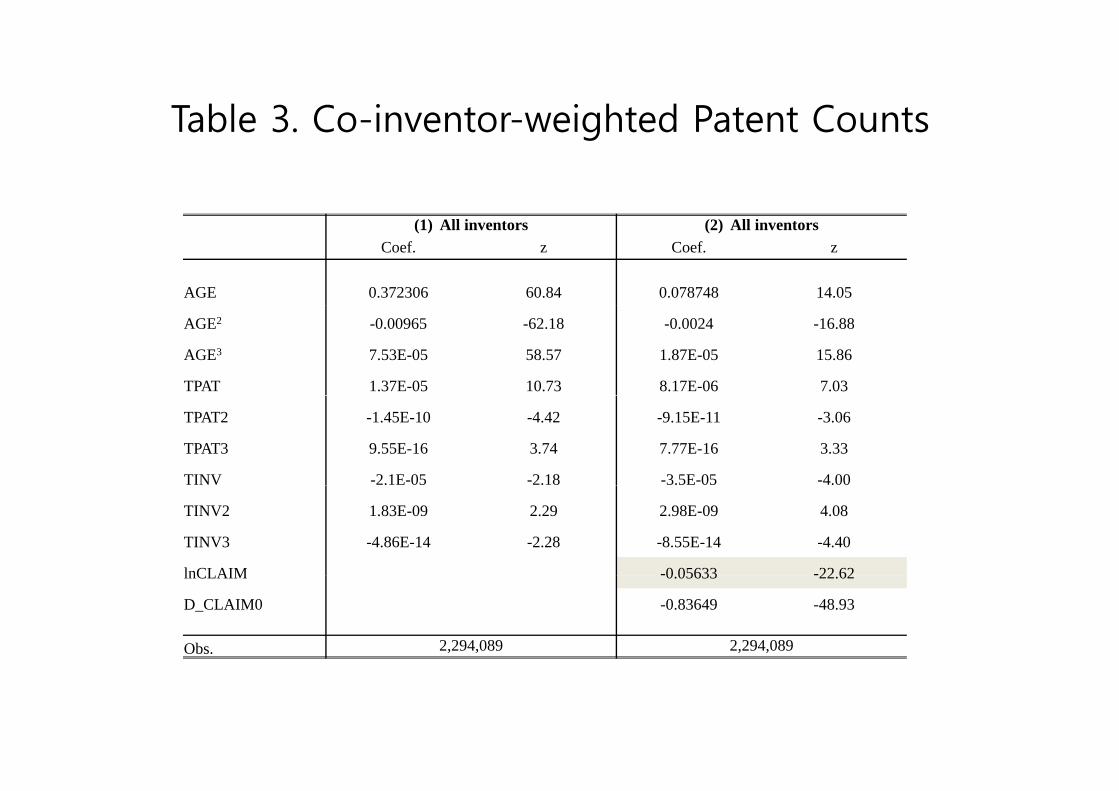
Table 3 Co-inventor-weighted Patent CountsTable 3. Co inventor weighted Patent Counts
(1) All inventors (2) All inventorsCoef. z Coef. z
AGE 0.372306 60.84 0.078748 14.05
AGE2 -0.00965 -62.18 -0.0024 -16.88
AGE3 7.53E-05 58.57 1.87E-05 15.86
TPAT 1.37E-05 10.73 8.17E-06 7.03
TPAT2 -1.45E-10 -4.42 -9.15E-11 -3.06
TPAT3 9.55E-16 3.74 7.77E-16 3.33
TINV -2.1E-05 -2.18 -3.5E-05 -4.00
TINV2 1.83E-09 2.29 2.98E-09 4.08
TINV3 -4.86E-14 -2.28 -8.55E-14 -4.40
lnCLAIM -0 05633 -22 62lnCLAIM -0.05633 -22.62
D_CLAIM0 -0.83649 -48.93
Obs. 2,294,089 2,294,089
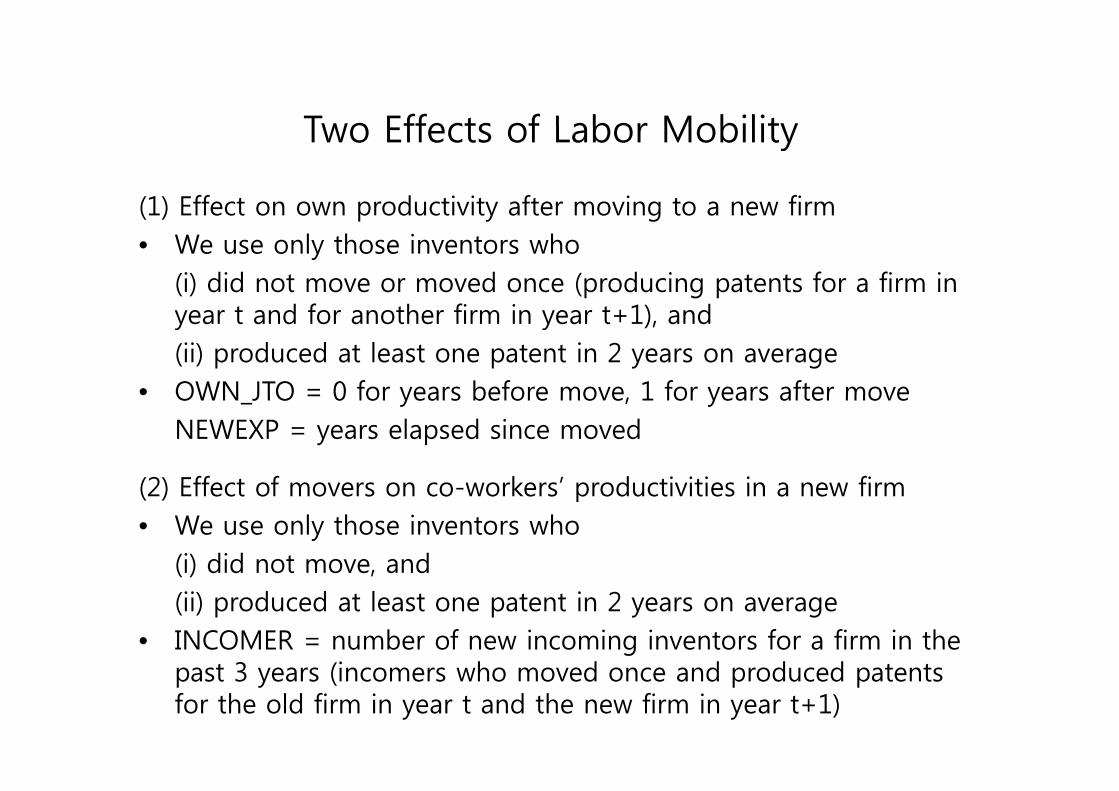
Two Effects of Labor MobilityTwo Effects of Labor Mobility
(1) Effect on own productivity after moving to a new firm ( ) p y g• We use only those inventors who
(i) did not move or moved once (producing patents for a firm in d f h fi i 1) dyear t and for another firm in year t+1), and
(ii) produced at least one patent in 2 years on average• OWN JTO = 0 for years before move 1 for years after moveOWN_JTO = 0 for years before move, 1 for years after move
NEWEXP = years elapsed since moved
(2) Effect of movers on co workers’ productivities in a new firm(2) Effect of movers on co-workers productivities in a new firm• We use only those inventors who
(i) did not move, and ( ) ,(ii) produced at least one patent in 2 years on average
• INCOMER = number of new incoming inventors for a firm in the t 3 (i h d d d d t tpast 3 years (incomers who moved once and produced patents
for the old firm in year t and the new firm in year t+1)
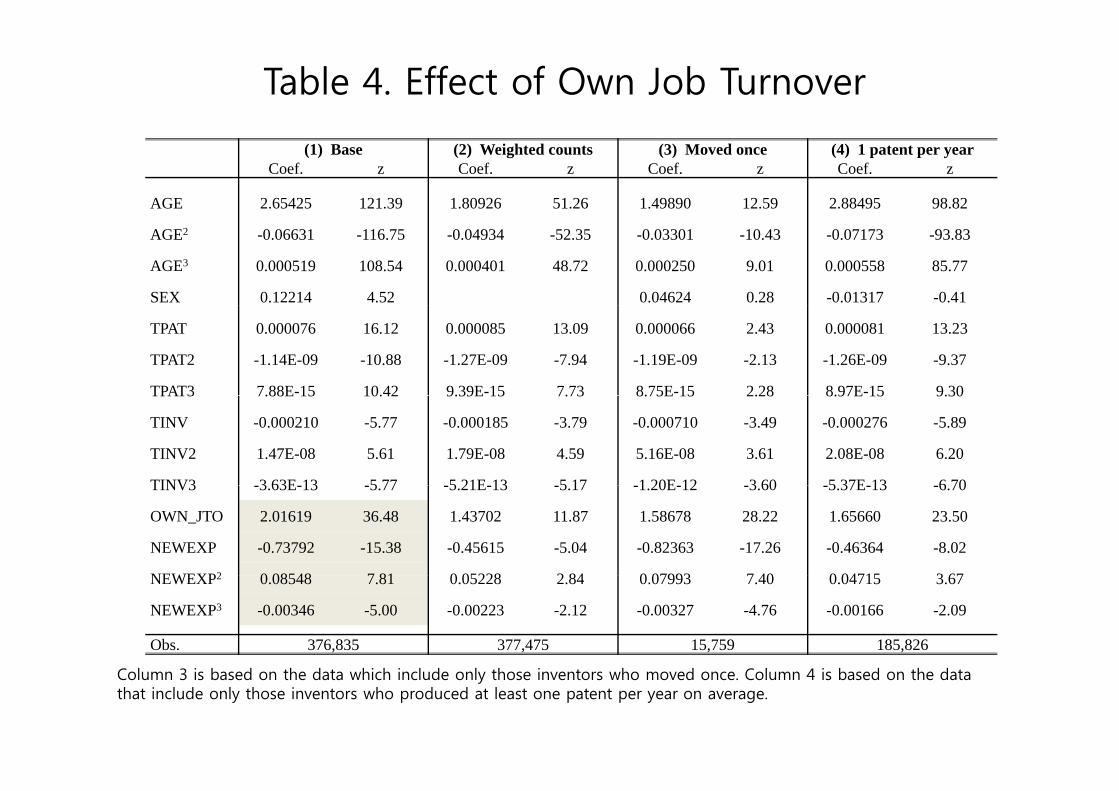
Table 4. Effect of Own Job Turnover
(1) Base (2) Weighted counts (3) Moved once (4) 1 patent per yearCoef. z Coef. z Coef. z Coef. z
AGE 2.65425 121.39 1.80926 51.26 1.49890 12.59 2.88495 98.82
AGE2 -0.06631 -116.75 -0.04934 -52.35 -0.03301 -10.43 -0.07173 -93.83
AGE3 0.000519 108.54 0.000401 48.72 0.000250 9.01 0.000558 85.77
SEX 0.12214 4.52 0.04624 0.28 -0.01317 -0.41
TPAT 0.000076 16.12 0.000085 13.09 0.000066 2.43 0.000081 13.23
TPAT2 -1.14E-09 -10.88 -1.27E-09 -7.94 -1.19E-09 -2.13 -1.26E-09 -9.37
TPAT3 7.88E-15 10.42 9.39E-15 7.73 8.75E-15 2.28 8.97E-15 9.30TPAT3 7.88E 15 10.42 9.39E 15 7.73 8.75E 15 2.28 8.97E 15 9.30
TINV -0.000210 -5.77 -0.000185 -3.79 -0.000710 -3.49 -0.000276 -5.89
TINV2 1.47E-08 5.61 1.79E-08 4.59 5.16E-08 3.61 2.08E-08 6.20
TINV3 3 63E 13 5 77 5 21E 13 5 17 1 20E 12 3 60 5 37E 13 6 70TINV3 -3.63E-13 -5.77 -5.21E-13 -5.17 -1.20E-12 -3.60 -5.37E-13 -6.70
OWN_JTO 2.01619 36.48 1.43702 11.87 1.58678 28.22 1.65660 23.50
NEWEXP -0.73792 -15.38 -0.45615 -5.04 -0.82363 -17.26 -0.46364 -8.02
NEWEXP2 0 08548 7 81 0 05228 2 84 0 07993 7 40 0 04715 3 67NEWEXP2 0.08548 7.81 0.05228 2.84 0.07993 7.40 0.04715 3.67
NEWEXP3 -0.00346 -5.00 -0.00223 -2.12 -0.00327 -4.76 -0.00166 -2.09
Obs. 376,835 377,475 15,759 185,826
Column 3 is based on the data which include only those inventors who moved once. Column 4 is based on the data that include only those inventors who produced at least one patent per year on average.
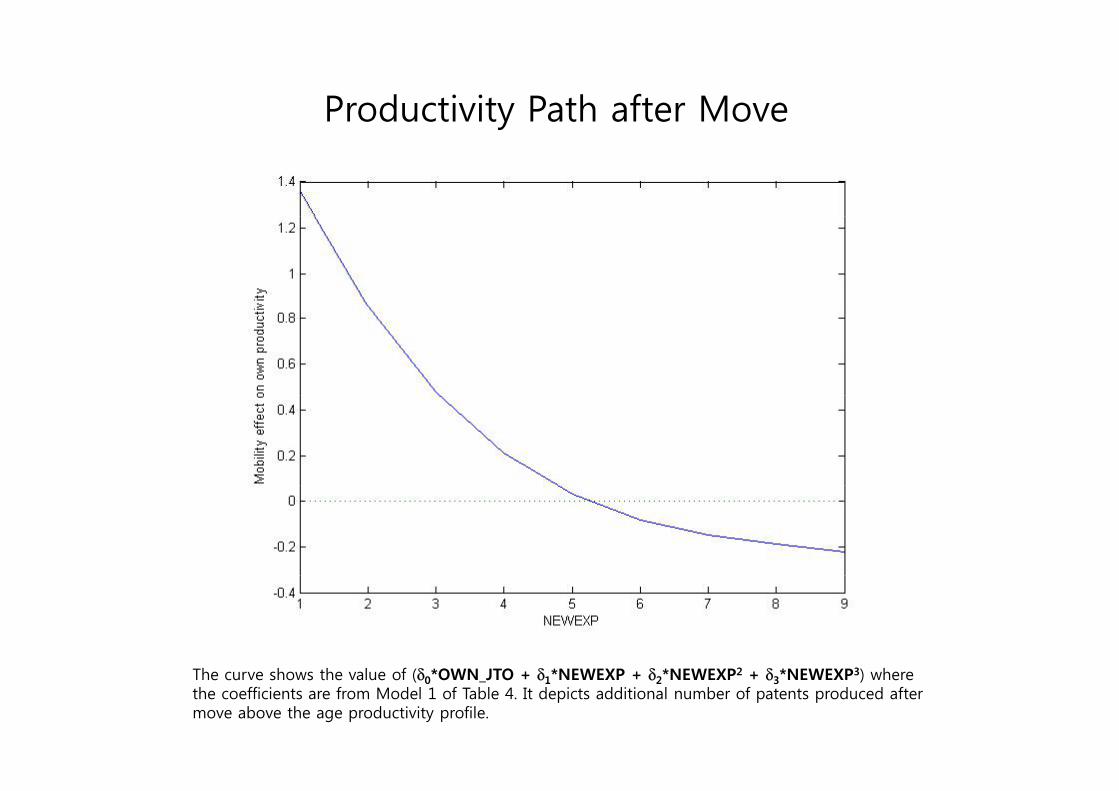
Productivity Path after Movey
The curve shows the value of (δ0*OWN_JTO + δ1*NEWEXP + δ2*NEWEXP2 + δ3*NEWEXP3) where the coefficients are from Model 1 of Table 4. It depicts additional number of patents produced after move above the age productivity profile.
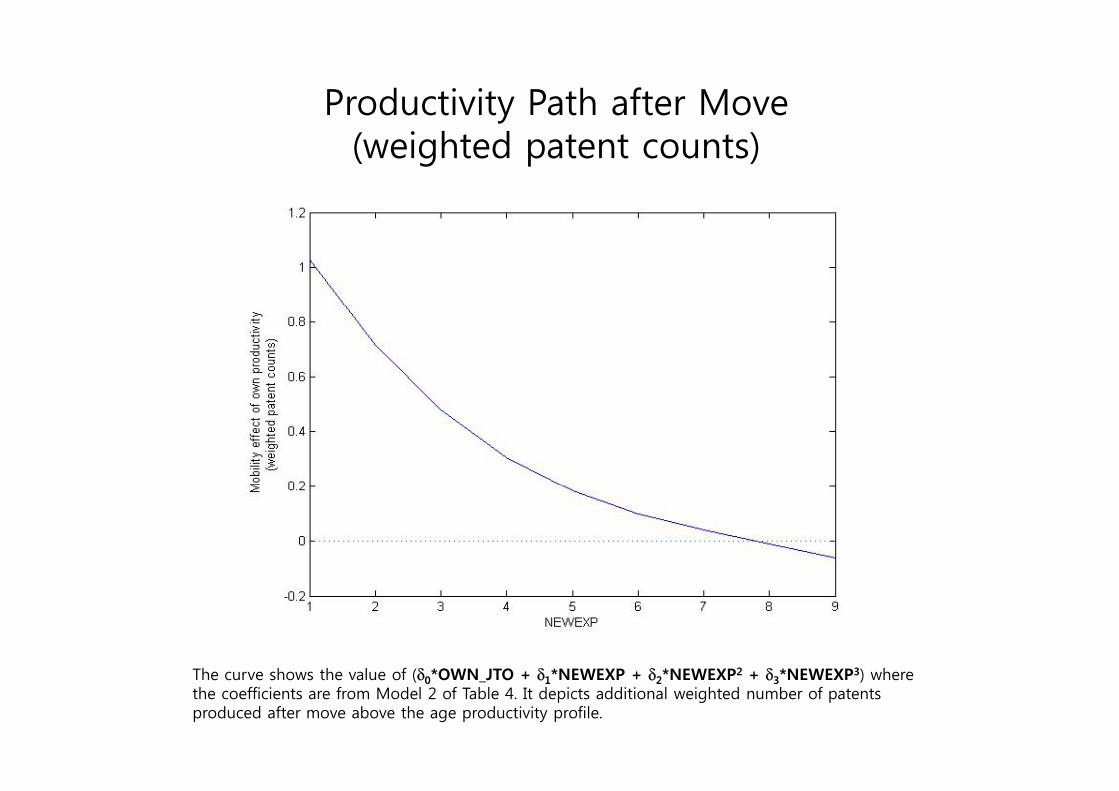
Productivity Path after Move (weighted patent counts)
The curve shows the value of (δ0*OWN_JTO + δ1*NEWEXP + δ2*NEWEXP2 + δ3*NEWEXP3) where the coefficients are from Model 2 of Table 4. It depicts additional weighted number of patents produced after move above the age productivity profile.
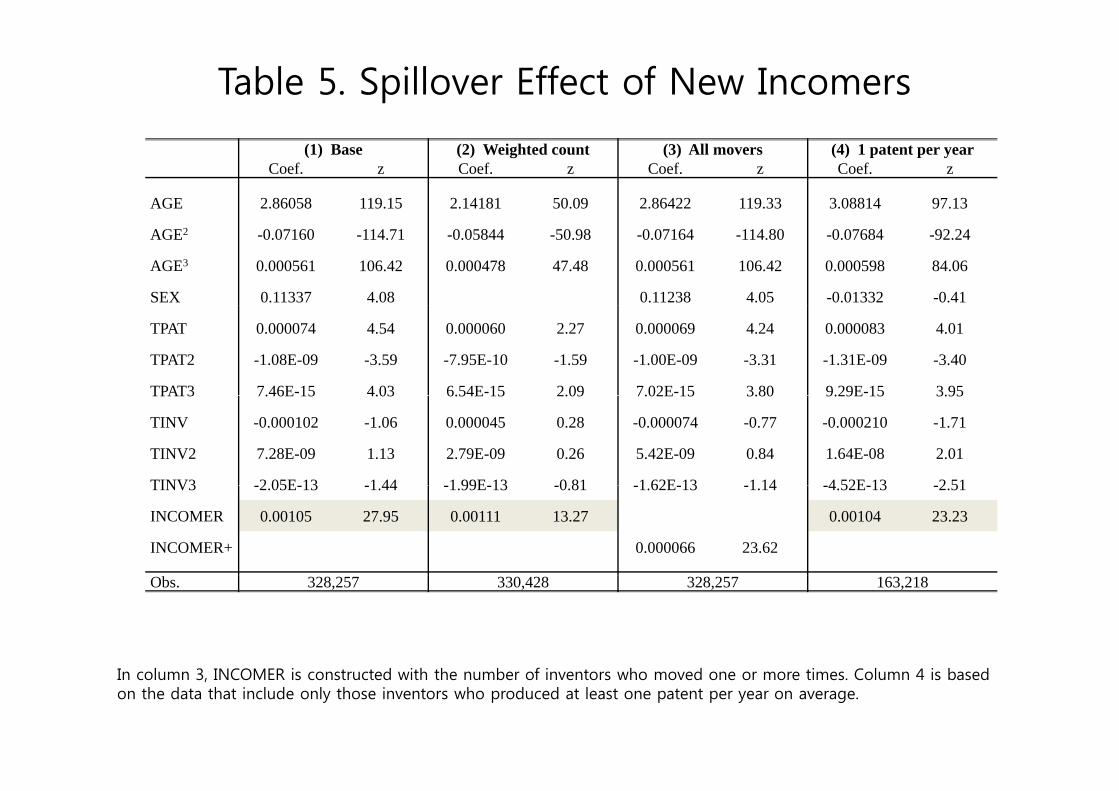
Table 5. Spillover Effect of New Incomers
(1) Base (2) Weighted count (3) All movers (4) 1 patent per yearCoef. z Coef. z Coef. z Coef. z
AGE 2.86058 119.15 2.14181 50.09 2.86422 119.33 3.08814 97.13
AGE2 -0.07160 -114.71 -0.05844 -50.98 -0.07164 -114.80 -0.07684 -92.24
AGE3 0.000561 106.42 0.000478 47.48 0.000561 106.42 0.000598 84.06
SEX 0.11337 4.08 0.11238 4.05 -0.01332 -0.41
TPAT 0.000074 4.54 0.000060 2.27 0.000069 4.24 0.000083 4.01
TPAT2 -1.08E-09 -3.59 -7.95E-10 -1.59 -1.00E-09 -3.31 -1.31E-09 -3.40
TPAT3 7.46E-15 4.03 6.54E-15 2.09 7.02E-15 3.80 9.29E-15 3.95TPAT3 7.46E 15 4.03 6.54E 15 2.09 7.02E 15 3.80 9.29E 15 3.95
TINV -0.000102 -1.06 0.000045 0.28 -0.000074 -0.77 -0.000210 -1.71
TINV2 7.28E-09 1.13 2.79E-09 0.26 5.42E-09 0.84 1.64E-08 2.01
TINV3 2 05E 13 1 44 1 99E 13 0 81 1 62E 13 1 14 4 52E 13 2 51TINV3 -2.05E-13 -1.44 -1.99E-13 -0.81 -1.62E-13 -1.14 -4.52E-13 -2.51
INCOMER 0.00105 27.95 0.00111 13.27 0.00104 23.23
INCOMER+ 0.000066 23.62
Obs. 328,257 330,428 328,257 163,218
In column 3, INCOMER is constructed with the number of inventors who moved one or more times. Column 4 is based on the data that include only those inventors who produced at least one patent per year on average.
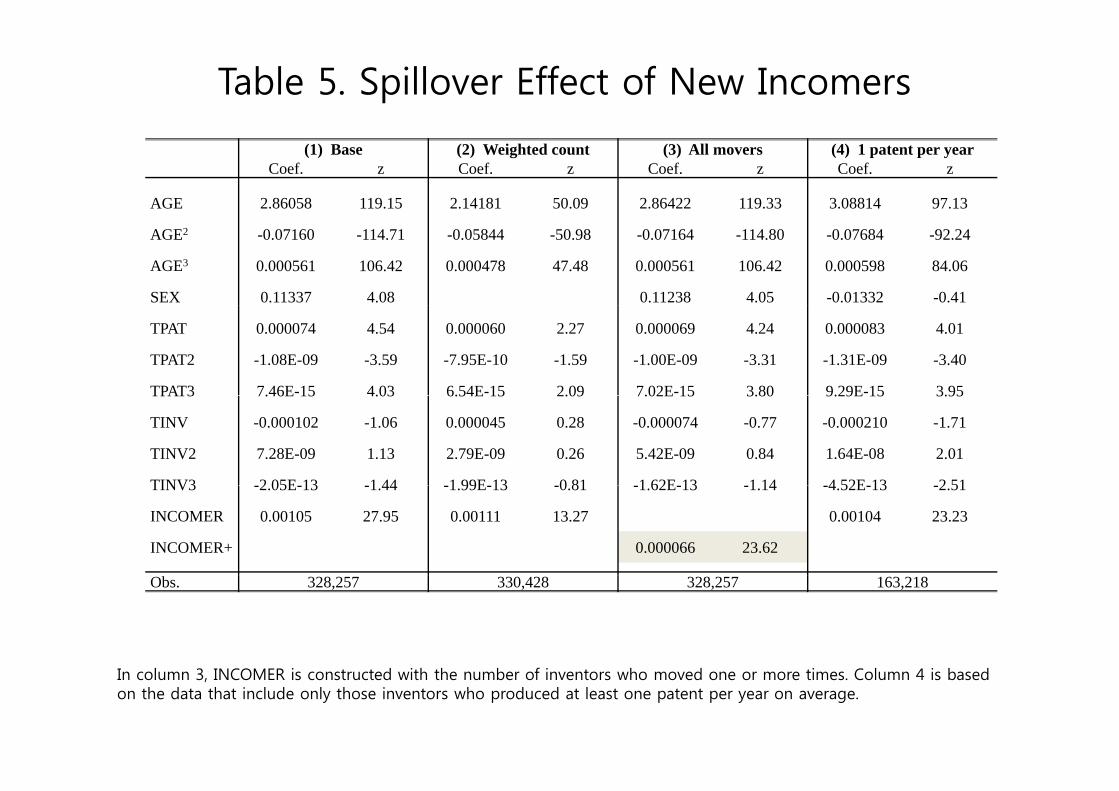
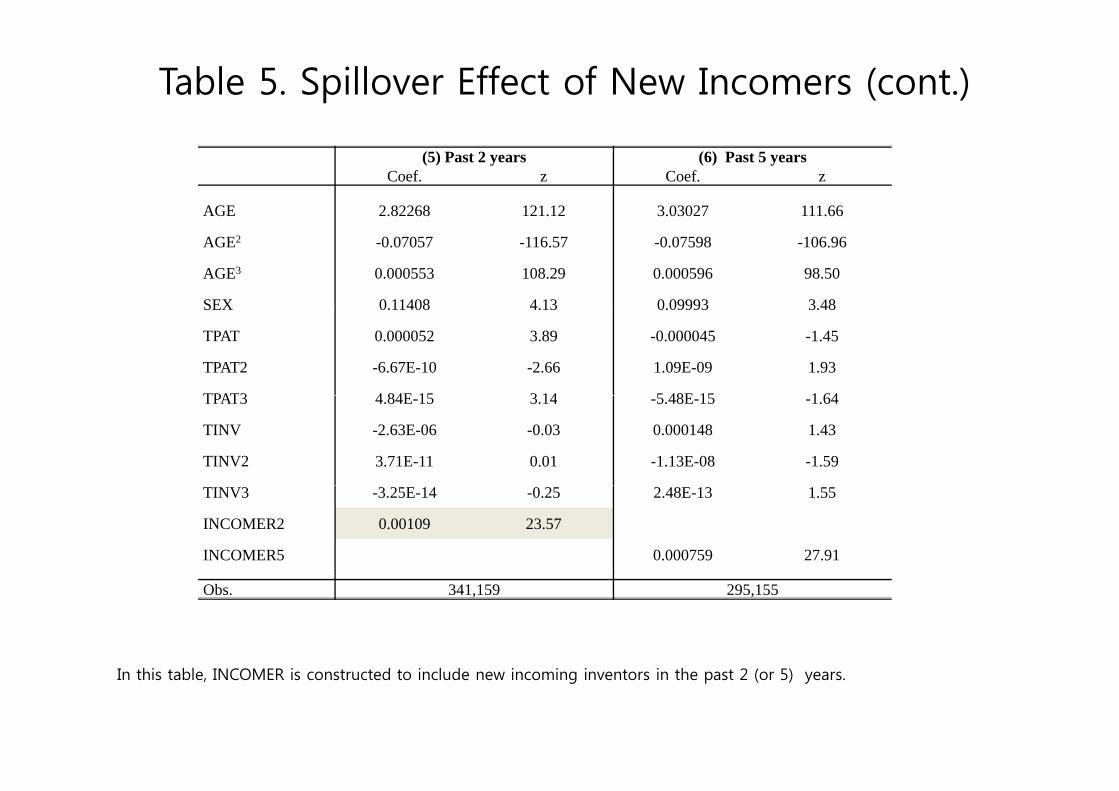
Table 5. Spillover Effect of New Incomers (cont.)
(5) Past 2 years (6) Past 5 yearsCoef. z Coef. z
AGE 2.82268 121.12 3.03027 111.66 G .8 68 . 3.030 7 .66
AGE2 -0.07057 -116.57 -0.07598 -106.96
AGE3 0.000553 108.29 0.000596 98.50
SEX 0 11408 4 13 0 09993 3 48SEX 0.11408 4.13 0.09993 3.48
TPAT 0.000052 3.89 -0.000045 -1.45
TPAT2 -6.67E-10 -2.66 1.09E-09 1.93
TPAT3 4 84E 15 3 14 5 48E 15 1 64TPAT3 4.84E-15 3.14 -5.48E-15 -1.64
TINV -2.63E-06 -0.03 0.000148 1.43
TINV2 3.71E-11 0.01 -1.13E-08 -1.59
TINV3 -3.25E-14 -0.25 2.48E-13 1.55
INCOMER2 0.00109 23.57
INCOMER5 0.000759 27.91
Obs. 341,159 295,155
In this table, INCOMER is constructed to include new incoming inventors in the past 2 (or 5) years.
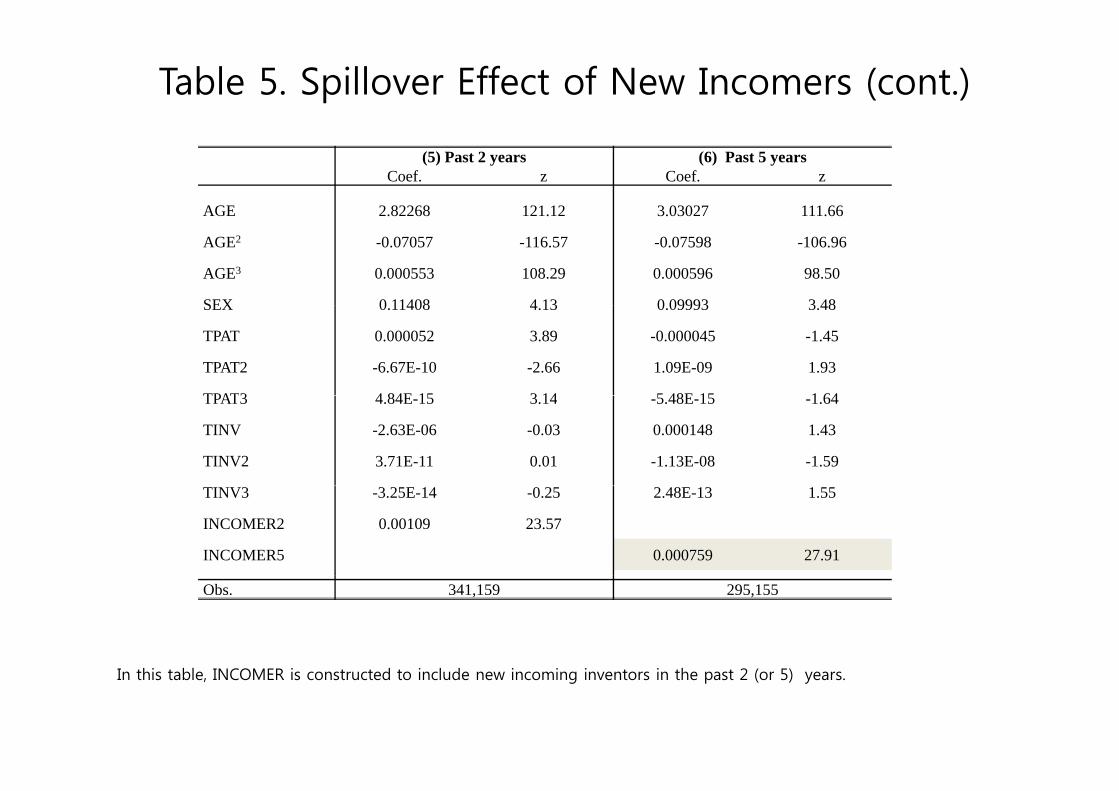
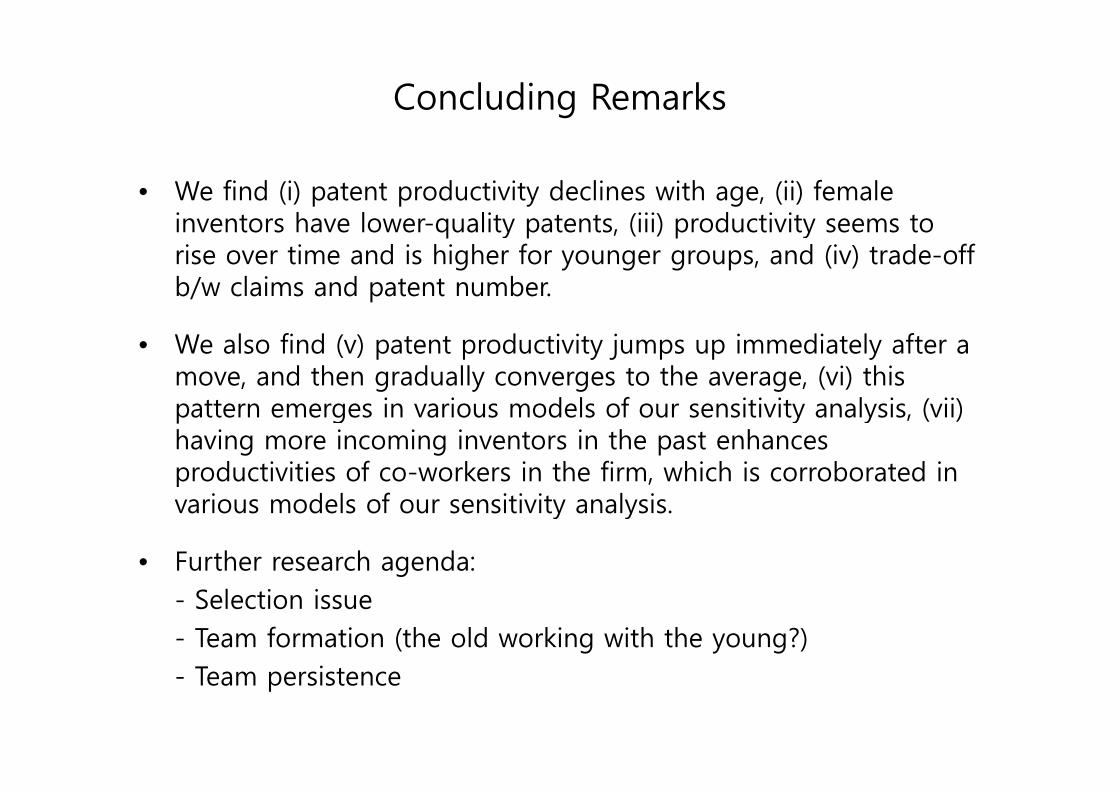
Concluding Remarks
• We find (i) patent productivity declines with age, (ii) female i t h l lit t t (iii) d ti it tinventors have lower-quality patents, (iii) productivity seems to rise over time and is higher for younger groups, and (iv) trade-off b/w claims and patent number.
• We also find (v) patent productivity jumps up immediately after a move, and then gradually converges to the average, (vi) this pattern emerges in various models of our sensitivity analysis, (vii) having more incoming inventors in the past enhances productivities of co-workers in the firm, which is corroborated in pvarious models of our sensitivity analysis.
• Further research agenda:g- Selection issue- Team formation (the old working with the young?)- Team persistence