Mobile Telephony Access and Usage in Africa
Mobile Telephony Access and Usage in Africa Chabossou, A., Stork, C., Stork, M., Zahonogo. Z. Abstract—This paper uses data from nationally representative household survey conducted in 17 African countries to analyse mobile adoption and usage. This paper shows that countries differ in their levels of ICT adoption and usage and also in factors that influence adoption and usage. Income and education vastly enhances mobile adoption but gender, age and membership in social networks have little impact. Income is the main explanatory variable for usage. In terms of mobile expenditure the study also finds linkages to fixed-line, work and public phone usages. These linkages need however be explored in more detail in future. Mobile expenditure is inelastic with respect to income, ie the share of mobile expenditure of individual income increases less than 1% for each 1% increase in income. This indicates that people with higher income spend a smaller proportion of their income on mobile expenditure compared to those with less income. The study provides tools to identify policy intervention to improve ICT take up and usage and define universal service obligations based on income and monthly usage costs. It help to put a number to what can be expected from lower access and usage costs in terms of market volume and number of new subscribers. Linking this to other economic data such as national household income and expenditure surveys and GDP calculation would allow to forecast the economic and social impact of policy interventions. Concrete recommendations are being made for policy interventions and regulatory measures to decrease access and usage costs. Index Terms—Economics, Information technology, Mobile communication, Developing nations I. INTRODUCTION The information, telecommunication and broadcasting sector is increasingly integrated into the day to day activities of businesses and lives of households and individuals worldwide. Numerous studies have shown that ICTs contribute to economic growth, employment and social inclusion. It is therefore important that policymakers monitor progress towards access and usage of ICTs. A paper by Roller and Waverman (2001) suggests that the spread of modern fixed-line networks in OECD countries was responsible for one third of output growth between 1970 and 1990. The importance of ICTs for economic growth are further supported by studies from Jalava & Pohjola (2002), Oliner & Sichel (2000), Pohjola (2001), Niininen (2001), Sichel (1997), Jorgenson et al (2005), OECD (2003) and UNCTAD (2006). Waverman et al (2005) investigate the role of mobile phones in developing economies and find that they are playing the same crucial role that fixed telephony played in developed economies in the 1970s and 1980s. Their study covered 38 developing countries for the period 1996 to 2003 and provides evidence of the strong impact of mobile in developing countries. TABLE I ICT DENSITIES IN 2007 (SOURCE: ITU DATABASE 2008) Internet users per 100 inhabitants Main (fixed) telephone lines per 100 inhabitants Mobile cellular telephone subscribers per 100 inhabitants Sub Saharan Africa 6.47 3.17 26.77 Low Income 6.04 5.87 24.06 Lower Middle Income 15.69 15.23 50.99 Upper Middle Income 31.48 21.01 86.18 High Income Countries 54.78 43.85 112.42 Benin 1.66 1.22 20.98 Botswana 4.25 7.28 75.84 Burkina Faso 1 0.59 0.70 10.90 Cameroon 2 2.23 0.79 24.45 Côte d'Ivoire 3 1.63 1.41 36.60 Ethiopia 0.35 1.06 1.45 Ghana 2.77 1.60 32.39 Kenya 7.99 0.71 30.48 Mozambique 4 0.93 0.33 15.42 Namibia 4.87 6.66 38.58 Nigeria 6.75 1.07 27.28 Rwanda 5 1.08 0.24 6.53 Senegal 6.62 2.17 33.31 South Africa 8.16 9.56 87.08 Tanzania 0.99 0.58 20.40 Uganda 6.48 0.53 13.58 Zambia 4.19 0.77 22.14 Country level data reveals a global digital divide between continents and countries but also within countries 1 Internet and main fixed line data from 2006 2 Internet and main fixed line data from 2006 3 Internet and main fixed line data from 2006 4 Main fixed line data from 2006 5 Internet data from 2006 T 392
Transcript of Mobile Telephony Access and Usage in Africa

Mobile Telephony Access and Usage in Africa Chabossou, A., Stork, C., Stork, M., Zahonogo. Z.
Abstract—This paper uses data from nationally representative
household survey conducted in 17 African countries to analyse mobile adoption and usage.
This paper shows that countries differ in their levels of ICT adoption and usage and also in factors that influence adoption and usage. Income and education vastly enhances mobile adoption but gender, age and membership in social networks have little impact. Income is the main explanatory variable for usage. In terms of mobile expenditure the study also finds linkages to fixed-line, work and public phone usages. These linkages need however be explored in more detail in future. Mobile expenditure is inelastic with respect to income, ie the share of mobile expenditure of individual income increases less than 1% for each 1% increase in income. This indicates that people with higher income spend a smaller proportion of their income on mobile expenditure compared to those with less income.
The study provides tools to identify policy intervention to improve ICT take up and usage and define universal service obligations based on income and monthly usage costs. It help to put a number to what can be expected from lower access and usage costs in terms of market volume and number of new subscribers. Linking this to other economic data such as national household income and expenditure surveys and GDP calculation would allow to forecast the economic and social impact of policy interventions.
Concrete recommendations are being made for policy interventions and regulatory measures to decrease access and usage costs. Index Terms—Economics, Information technology, Mobile communication, Developing nations
I. INTRODUCTION The information, telecommunication and broadcasting
sector is increasingly integrated into the day to day activities of businesses and lives of households and individuals worldwide. Numerous studies have shown that ICTs contribute to economic growth, employment and social inclusion. It is therefore important that policymakers monitor progress towards access and usage of ICTs. A paper by Roller and Waverman (2001) suggests that the spread of modern fixed-line networks in OECD countries was responsible for one third of output growth between 1970 and 1990. The importance of ICTs for economic growth are further supported by studies from Jalava & Pohjola (2002), Oliner & Sichel (2000), Pohjola (2001), Niininen (2001), Sichel (1997), Jorgenson et al (2005), OECD (2003) and UNCTAD (2006). Waverman et al (2005) investigate the role of mobile phones
in developing economies and find that they are playing the same crucial role that fixed telephony played in developed economies in the 1970s and 1980s. Their study covered 38 developing countries for the period 1996 to 2003 and provides evidence of the strong impact of mobile in developing countries.
TABLE I ICT DENSITIES IN 2007 (SOURCE: ITU DATABASE 2008)
Internet users per 100 inhabitants
Main (fixed) telephone lines per 100 inhabitants
Mobile cellular telephone subscribers per 100 inhabitants
Sub Saharan Africa
6.47 3.17 26.77
Low Income 6.04 5.87 24.06 Lower Middle Income
15.69 15.23 50.99
Upper Middle Income
31.48 21.01 86.18
High Income Countries
54.78 43.85 112.42
Benin 1.66 1.22 20.98 Botswana 4.25 7.28 75.84 Burkina Faso1 0.59 0.70 10.90 Cameroon2 2.23 0.79 24.45 Côte d'Ivoire3 1.63 1.41 36.60 Ethiopia 0.35 1.06 1.45 Ghana 2.77 1.60 32.39 Kenya 7.99 0.71 30.48 Mozambique 4 0.93 0.33 15.42 Namibia 4.87 6.66 38.58 Nigeria 6.75 1.07 27.28 Rwanda5 1.08 0.24 6.53 Senegal 6.62 2.17 33.31 South Africa 8.16 9.56 87.08 Tanzania 0.99 0.58 20.40 Uganda 6.48 0.53 13.58 Zambia 4.19 0.77 22.14 Country level data reveals a global digital divide between
continents and countries but also within countries
1 Internet and main fixed line data from 2006 2 Internet and main fixed line data from 2006 3 Internet and main fixed line data from 2006 4 Main fixed line data from 2006 5 Internet data from 2006
T
392
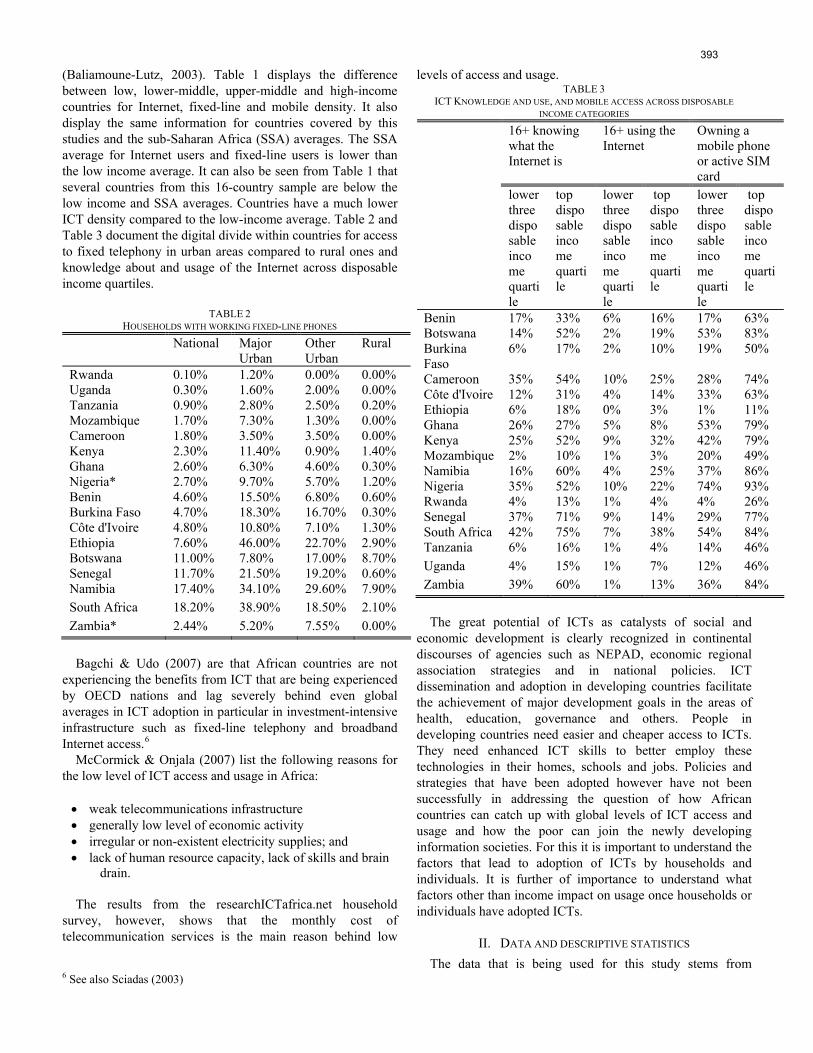
(Baliamoune-Lutz, 2003). Table 1 displays the difference between low, lower-middle, upper-middle and high-income countries for Internet, fixed-line and mobile density. It also display the same information for countries covered by this studies and the sub-Saharan Africa (SSA) averages. The SSA average for Internet users and fixed-line users is lower than the low income average. It can also be seen from Table 1 that several countries from this 16-country sample are below the low income and SSA averages. Countries have a much lower ICT density compared to the low-income average. Table 2 and Table 3 document the digital divide within countries for access to fixed telephony in urban areas compared to rural ones and knowledge about and usage of the Internet across disposable income quartiles.
TABLE 2
HOUSEHOLDS WITH WORKING FIXED-LINE PHONES
National Major Urban
Other Urban
Rural
Rwanda 0.10% 1.20% 0.00% 0.00% Uganda 0.30% 1.60% 2.00% 0.00% Tanzania 0.90% 2.80% 2.50% 0.20% Mozambique 1.70% 7.30% 1.30% 0.00% Cameroon 1.80% 3.50% 3.50% 0.00% Kenya 2.30% 11.40% 0.90% 1.40% Ghana 2.60% 6.30% 4.60% 0.30% Nigeria* 2.70% 9.70% 5.70% 1.20% Benin 4.60% 15.50% 6.80% 0.60% Burkina Faso 4.70% 18.30% 16.70% 0.30% Côte d'Ivoire 4.80% 10.80% 7.10% 1.30% Ethiopia 7.60% 46.00% 22.70% 2.90% Botswana 11.00% 7.80% 17.00% 8.70% Senegal 11.70% 21.50% 19.20% 0.60% Namibia 17.40% 34.10% 29.60% 7.90% South Africa 18.20% 38.90% 18.50% 2.10% Zambia* 2.44% 5.20% 7.55% 0.00% Bagchi & Udo (2007) are that African countries are not
experiencing the benefits from ICT that are being experienced by OECD nations and lag severely behind even global averages in ICT adoption in particular in investment-intensive infrastructure such as fixed-line telephony and broadband Internet access.6
McCormick & Onjala (2007) list the following reasons for the low level of ICT access and usage in Africa:
• weak telecommunications infrastructure • generally low level of economic activity • irregular or non-existent electricity supplies; and • lack of human resource capacity, lack of skills and brain
drain. The results from the researchICTafrica.net household
survey, however, shows that the monthly cost of telecommunication services is the main reason behind low
levels of access and usage.
6 See also Sciadas (2003)
TABLE 3 ICT KNOWLEDGE AND USE, AND MOBILE ACCESS ACROSS DISPOSABLE
INCOME CATEGORIES
16+ knowing what the Internet is
16+ using the Internet
Owning a mobile phone or active SIM card
lower three disposable income quartile
top disposable income quartile
lower three disposable income quartile
top disposable income quartile
lower three disposable income quartile
top disposable income quartile
Benin 17% 33% 6% 16% 17% 63% Botswana 14% 52% 2% 19% 53% 83% Burkina Faso
6% 17% 2% 10% 19% 50%
Cameroon 35% 54% 10% 25% 28% 74% Côte d'Ivoire 12% 31% 4% 14% 33% 63% Ethiopia 6% 18% 0% 3% 1% 11% Ghana 26% 27% 5% 8% 53% 79% Kenya 25% 52% 9% 32% 42% 79% Mozambique 2% 10% 1% 3% 20% 49% Namibia 16% 60% 4% 25% 37% 86% Nigeria 35% 52% 10% 22% 74% 93% Rwanda 4% 13% 1% 4% 4% 26% Senegal 37% 71% 9% 14% 29% 77% South Africa 42% 75% 7% 38% 54% 84% Tanzania 6% 16% 1% 4% 14% 46% Uganda 4% 15% 1% 7% 12% 46% Zambia 39% 60% 1% 13% 36% 84% The great potential of ICTs as catalysts of social and
economic development is clearly recognized in continental discourses of agencies such as NEPAD, economic regional association strategies and in national policies. ICT dissemination and adoption in developing countries facilitate the achievement of major development goals in the areas of health, education, governance and others. People in developing countries need easier and cheaper access to ICTs. They need enhanced ICT skills to better employ these technologies in their homes, schools and jobs. Policies and strategies that have been adopted however have not been successfully in addressing the question of how African countries can catch up with global levels of ICT access and usage and how the poor can join the newly developing information societies. For this it is important to understand the factors that lead to adoption of ICTs by households and individuals. It is further of importance to understand what factors other than income impact on usage once households or individuals have adopted ICTs.
II. DATA AND DESCRIPTIVE STATISTICS The data that is being used for this study stems from
393
surveys conducted by Research ICT Africa (RIA)7 in 17 African countries during the end of 2007 and the beginning of 20088. The data is nationally9 representative on a household level and for individuals 16 years of age or older. The survey was stratified into metropolitan, other urban and rural areas. Enumerator areas (EAs) were sampled for each stratum using probability proportional to size (pps). The individual to be selected for each household was randomly selected from all household members and visitors that stayed at the home on the night the household was visited and that were 16 years of age or older.
The RIA questionnaire was divided in three sections. The first part, the household rooster, collected information about all household members. The second part collected household related information. The head of the household or someone that manages the household answered part one and two. The third part, the individual section, was answered by a randomly selected individual 16 years of age or older that slept in the house the night of the interview and included household members and visitors.
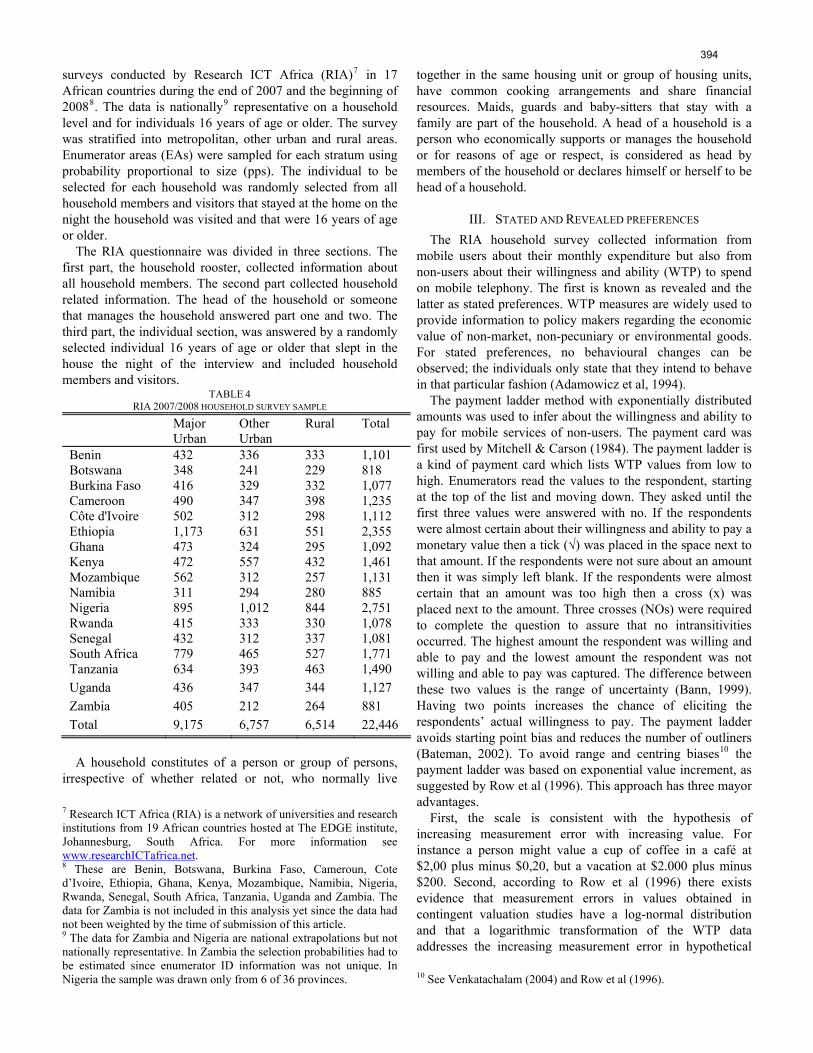
TABLE 4 RIA 2007/2008 HOUSEHOLD SURVEY SAMPLE
Major Urban
Other Urban
Rural Total
Benin 432 336 333 1,101 Botswana 348 241 229 818 Burkina Faso 416 329 332 1,077 Cameroon 490 347 398 1,235 Côte d'Ivoire 502 312 298 1,112 Ethiopia 1,173 631 551 2,355 Ghana 473 324 295 1,092 Kenya 472 557 432 1,461 Mozambique 562 312 257 1,131 Namibia 311 294 280 885 Nigeria 895 1,012 844 2,751 Rwanda 415 333 330 1,078 Senegal 432 312 337 1,081 South Africa 779 465 527 1,771 Tanzania 634 393 463 1,490 Uganda 436 347 344 1,127 Zambia 405 212 264 881 Total 9,175 6,757 6,514 22,446 A household constitutes of a person or group of persons,
irrespective of whether related or not, who normally live 7 Research ICT Africa (RIA) is a network of universities and research institutions from 19 African countries hosted at The EDGE institute, Johannesburg, South Africa. For more information see www.researchICTafrica.net. 8 These are Benin, Botswana, Burkina Faso, Cameroun, Cote d’Ivoire, Ethiopia, Ghana, Kenya, Mozambique, Namibia, Nigeria, Rwanda, Senegal, South Africa, Tanzania, Uganda and Zambia. The data for Zambia is not included in this analysis yet since the data had not been weighted by the time of submission of this article. 9 The data for Zambia and Nigeria are national extrapolations but not nationally representative. In Zambia the selection probabilities had to be estimated since enumerator ID information was not unique. In Nigeria the sample was drawn only from 6 of 36 provinces.
together in the same housing unit or group of housing units, have common cooking arrangements and share financial resources. Maids, guards and baby-sitters that stay with a family are part of the household. A head of a household is a person who economically supports or manages the household or for reasons of age or respect, is considered as head by members of the household or declares himself or herself to be head of a household.
III. STATED AND REVEALED PREFERENCES The RIA household survey collected information from
mobile users about their monthly expenditure but also from non-users about their willingness and ability (WTP) to spend on mobile telephony. The first is known as revealed and the latter as stated preferences. WTP measures are widely used to provide information to policy makers regarding the economic value of non-market, non-pecuniary or environmental goods. For stated preferences, no behavioural changes can be observed; the individuals only state that they intend to behave in that particular fashion (Adamowicz et al, 1994).
The payment ladder method with exponentially distributed amounts was used to infer about the willingness and ability to pay for mobile services of non-users. The payment card was first used by Mitchell & Carson (1984). The payment ladder is a kind of payment card which lists WTP values from low to high. Enumerators read the values to the respondent, starting at the top of the list and moving down. They asked until the first three values were answered with no. If the respondents were almost certain about their willingness and ability to pay a monetary value then a tick (√) was placed in the space next to that amount. If the respondents were not sure about an amount then it was simply left blank. If the respondents were almost certain that an amount was too high then a cross (x) was placed next to the amount. Three crosses (NOs) were required to complete the question to assure that no intransitivities occurred. The highest amount the respondent was willing and able to pay and the lowest amount the respondent was not willing and able to pay was captured. The difference between these two values is the range of uncertainty (Bann, 1999). Having two points increases the chance of eliciting the respondents’ actual willingness to pay. The payment ladder avoids starting point bias and reduces the number of outliners (Bateman, 2002). To avoid range and centring biases10 the payment ladder was based on exponential value increment, as suggested by Row et al (1996). This approach has three mayor advantages.
First, the scale is consistent with the hypothesis of increasing measurement error with increasing value. For instance a person might value a cup of coffee in a café at $2,00 plus minus $0,20, but a vacation at $2.000 plus minus $200. Second, according to Row et al (1996) there exists evidence that measurement errors in values obtained in contingent valuation studies have a log-normal distribution and that a logarithmic transformation of the WTP data addresses the increasing measurement error in hypothetical 10 See Venkatachalam (2004) and Row et al (1996).
394

WTP data. Therefore the exponential payment ladder can be seen consistent with the error distribution of WTP values. The third argument Row et al (1996) put forward refers to the concept of “just noticeable” differences and they uses the example of light sources to explain this. A source of light has a brightness B. The differences between two of such sources is “just noticeable” if the difference can be detected in 75% of the time. When bringing these sources in a sequence arranged in order of increasing brightness B1, B2, …, BBn,so that each source is “just noticeable” to the preceding one, than the relationship to each other is given by Weber’s law:
, (1)
where k is a positive constant. Hence the “just noticeable”
differences are increasing proportionally to the sequence of sources and can also been written by exponential function:
(2)
The value of k can be seen as a percentage increase between
adjacent scale values. The survey used 28 values, starting with a zero (not interested at all) and ending with an empty cell for amounts higher than listed. Equation (2) was used to compute the 2nd amounts to 27th amount. K was selected so that (1 + k)n-1 equals the highest value on the list.11
IV. MOBILE ADOPTION / ACCESS This section analyses factors that contribute to the
probability of an individual to adopting mobile telephony, ie either owning a mobile phone or active SIM card. The dependant variable is dichotomous and using linear regression models would not be appropriated.12 Probit models are being used instead, assuming normal distributed error terms. The assumption about the error term is arbitrary and its validity cannot be tested.13 A model can only be identified once an assumption is imposed on the mean and variance of the error term. This implies that coefficients cannot be interpreted directly since they are influenced by the necessary assumptions. Changing the assumptions about the error term changes the values of the coefficients uniformly (Long, 2006), but it does not affect the probability of an event occurring14. It affects the spread of the distribution but not the proportion of the distribution above or below the threshold (Long, 2006).
The decision to adopt mobile telephony is the result of several factors which cannot be observed and which will be different for each individual. What can be observed is whether an individual has a mobile phone or active SIM card (Mobile=1) or not (Mobile=0). One individual might neither be able to afford nor be interested in a mobile phone while
another might just be close to getting one and still saving money towards it. For both individuals it can only be observed that they do not have a mobile phone ie Mobile=0. The process leading to that decision is unobserved and referred to a latent variable. Probit or Logit models tie observable (independent variables) to the latent variable though contributions to the probability of the latent variable taking a value above or below a threshold that would lead to the observable outcome, adoption or not. Many factors are considered in the economic literature as influencing the latent variable,
11 For example with n = 24 cells which have to be computed and $1000 the highest value, the equation would be given by 1000 = (1 + 0,35)23
12 See for example Maddala (1983) and Gourieroux (1986) 13 For a more detailed discussion on this assumption see Long (1997). 14 See Long (2007) pp 49-50 for a proof.
15 such as socio-economic factors (social networks, income, prices, household size, education, age and gender) and environmental factors (infrastructures, enumerator area, country’s characteristics).
Piccoli et al (2001) established that the education level of an individual influences ICTs adoption and usage, through influencing an individual’s capability to use technology. The theory of technology use also points to age as a factor that influences when and how an individual uses technologies. Some studies indicate that age is a key factor in the use of technology, with younger people tending to exhibit higher use levels. Consequently, these individuals tend to use ICTs technologies more than older users.
Gender and technology studies have found that men and women adopt and use technology differently (Gefen & Straub, 1997; Venkatesh & Morris, 2000). Men’s decisions to use technology are more strongly influenced by their perception of usefulness, while women’s decisions are based more on perceptions of the technology’s ease of use (Venkatesh & Morris, 2000). Further, men and women may view the same mode of communication differently.16
Table 5 in the appendix. displays the Probit model
configuration and Table 6 in the appendix details the results for each country. Table 6 provides summary results without reporting coefficients, showing for each of the independent variables whether their impact on the probability of mobile adoption is significant and whether it is positive or negative.17
The results suggest that the variables used to analyse mobile
phone adoption contribute significantly to explaining the probability of adoption. Income increases the probability of mobile phone adoption as expected. Only for Ghana and Rwanda it wasn’t significant. Substituting individual income with disposable income increases the pseudo R2 in both cases and let to income being significant with positive coefficient. Disposable income has the advantage over individual income that it takes into account the buying power of dependents that do not have own income. It does not generally lead to better results though. Income being a barrier to adoption has two consequences. First, people will increasingly adopt mobile telephony should their income increase. Secondly, they might
15 See for example : Kwapong (2007) Fabiani al (2005), Bagchi & Udo (2007), Kabbar & Crump (2006) 16 See Gefen & Straub (1997); Ono (2003) 17 The detailed results can be found in the appendix.
395

be adopting it at current income if access (handset) prices and usage cost would come down.
Age influences for some countries positively and for others negatively the probability of mobile adoption. Age is likely to impact positively the probability to adopt mobile up to certain level and then decreases. Using age2 instead of age in subsequent research could get to the bottom of this. 18
The gender variable is mostly insignificant as expected (11 countries). Only in Senegal, Tanzania and Burkina Faso does being a woman decrease the probability of mobile telephony adoption. In South Africa and Mozambique it even increases the probability significantly.
The result from the Probit models confirm the assumptions about education as well as the rural areas. Membership in social networks contributed positively to the probability of mobile adoption in 7 out of 16 countries. For the remaining countries it was insignificant.
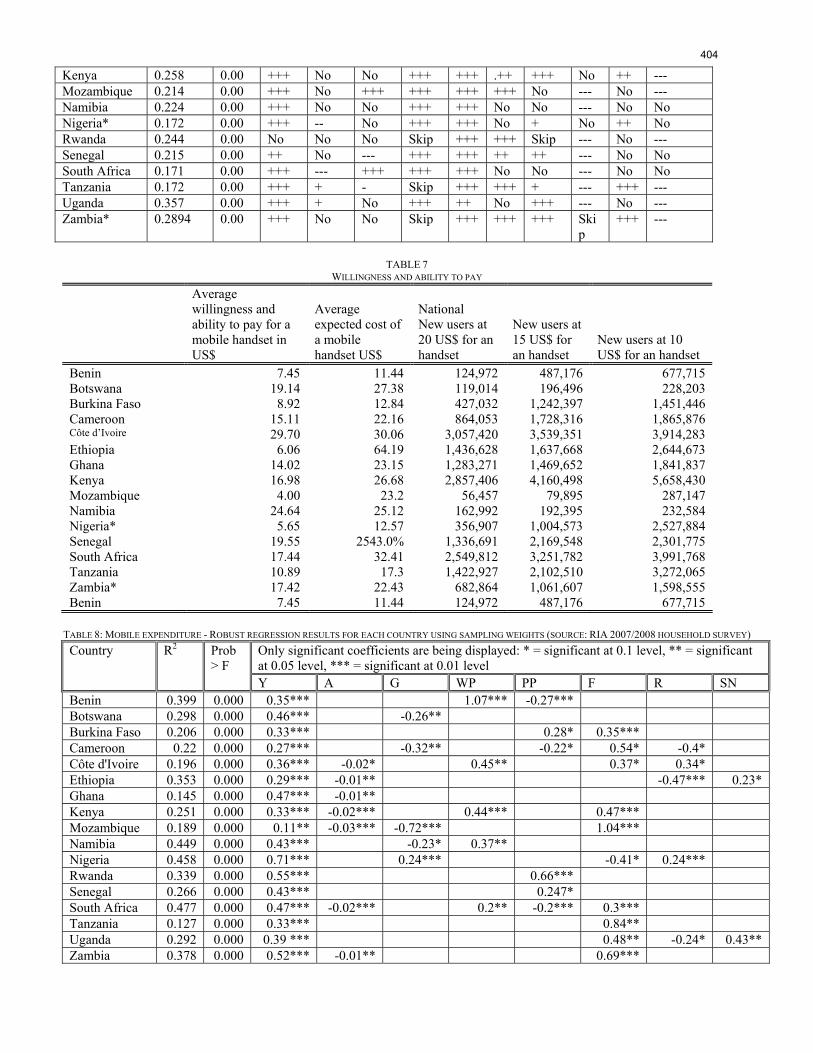
Randomly selected individuals 16 years from each household without mobile phone or active SIM card were asked for their willingness and ability to pay for a handset and what they think a handset would cost them. These average figures are being shown in Table 7 in the appendix. The difference between average willingness to pay and average expected costs confirms income as the main adoption barrier. Table 7 also indicates the number of new mobile phone users operators could expect should they offer mobiles for US$20, US$15 and US$10 respectively. 20US$ handsets would attract about 3 million new customers in Kenya and Ivory Coast, for example. Ethiopia could expect 2,6 million more users if the handset price would drop to US$10 and provided that SIM cards would be available. Ethiopia is the country with the widest gap between willingness to pay and expected cost and the country with the lowest mobile teledensity (see Table 1). The handset price is also known to fluctuate with the availability of SIM cards.
V. INCOME ELASTICITY / E-USAGE Perl (1983), Taylor (1994) and Taylor (2002) developed
telecommunication demand models that can be addressed price and income elasticities for public phones, mobile phones and local, national and international fixed-line call as well as cross price elasticities.19
Universal Service Obligations (USO) in this context have been thoroughly discussed in the literature.20 Garbacz & Thompson (1997, 2002, 2003) find that price elasticities for landline services in the USA approach zero in recent years and that subsidies therefore have little or no impact on universal service. Crandall & Waverman (2000) Eriksson et al (1998) and Hausman et al (1993) support these findings.
Wallsten (2001) finds that greatly reduced international settlement rates for telecom traffic between the United States and the rest of the world had the effect of reduced prices and
increased traffic in developing countries due to relatively high price elasticities. However, Garbacz & Thompson (2005) point out that international calls are less of relevance for poor people in developing countries compared to local and national calls, where price elasticities are low. They also find that the mobile monthly price elasticity exceeds fixed-line price elasticity in developing countries by a substantial amount and suggest that wireline phones are substitutes in the mobile market while mobile phones are not substitutes in the wireline market but complements. This is to some extent contradicted by Esselaar & Stork (2005) who find studying usage data for nine African countries that mobile telephony is a substitute for fixed-line telephony across all income groups.
18 See Tegegne (1999). 19 See for example Kaserman et al (1990) and Parsons (1998) 20 See Gasmi et al (2000), Panzar (2000), Rosston & Wimmer (2000), Valletti (2000)
Clarke & Wallsten (2002) argue that universal service for the poor in developing countries is generally ineffective. Modelling income elasticities could establish alternative approaches to current universal service definitions. Rather then specifying coverage or geographic spread, universal service obligations (USOs) could be in terms of costs for monthly usage packages that take into account existing income barriers.
Lee (1999), in estimating access demand for mobile networks, shows that per capita GDP and the size of the existing fixed-line network increase the probability of people subscribing to mobile telephone services. This implies that the mobile telephone network is interdependent with the fixed-line network.
Demand, as understood by economists, is defined as the amount of goods or services people are willing to buy at a certain price (ceteribus paribus - other things including income equal). In this sense, demand is a concept affected by buying power. A person may have needs but not demand du to income limitations. With insufficient income, demand can be zero or low even if the need is urgent. Demand or buying power for a goods or services arise from the consumers’ preferences for specific goods or services. Thus defining a good or service, and studying how the consumer orders his/her preferences for such a good or service in relation to other available goods and services is crucial.
Demand arises from a previous knowledge of the good and a subjective evaluation of its benefits and costs. Communications services differ from other goods or services since some require a subscription prior to usage such as post paid mobile and fixed line services. Even for prepaid mobile services a distinction can be made between access (cost of a handset) and usage costs. Subscription is necessary to use the Internet as well in most cases (notable exception is the Internet café). In the case of telephony the access service provides utility to a customer in terms of granting the ability to make and receive calls, even though it is uncertain whether the ability will be exercised. This is the so-called option value (Hee Lee, 2006).
For the purpose of analyzing demand income elasticity for mobile telecommunication services we assume that the potential usage basket of a consumer consists of calls (q) and a composite good (x) that represents all other goods and services. We further assume that the consumer’s decision on
396

individual demand for calls is made by maximizing a utility function within a given budget constraint. In addition to the factors of calls (q) and a composite good (x) affecting his/her utility, income (y) can be considered. Moreover, if call externality is incorporated in the utility of an individual, the number of existing subscribers who are making calls to and receiving calls from the individual affects the demand for calls. Thus, after including the size of the network (N) in order to reflect call externality, the utility function of a customer (U) is represented in expression (3):
(3)
At the same time, the budget constraint considering access
charge and call charge is given by
, (4) Where r is the price of access to the telecommunications
system, the price of a call, y is income of the consumer and p the price of the composite good x. For the utility function in (3), the number of calls represents direct benefits of using the mobile, while the number of subscribers represents indirect benefits through network size. Given the budget constraint in (4), and assuming the utility function is strictly quasi-concave and differentiable, using Lagrangian techniques the demand functions for calls and the composite good, as shown below in expressions (5) and (6), can be derived from the optimal solution of the utility function:
(5)
(6)
These functions differ from conventional demand functions
in two aspects: The budget constraint is y-r, rather than y, which reflects the conditionality of having to purchase access to telecommunication services, and the demand functions depend upon the number of subscribers, which reflects the access and usage externalities. Perl (1983), Taylor (1994, 2002) and Taylor and Kridel (1990) developed telecommunication demand models that are now widely used in the literature. The model has the following form:
, (7)
Where q denotes use of the telephone network, p denotes
the price of access and use, y denotes income, and u denotes a random error term. Network externalities as well as now socio-demographic factors can be included in this model as well. 21 Equation (7) can be transformed by taking the natural
logarithm of the left hand side and the right hand side:
21 Haque (2007) suggests ways of testing for the functional form of the demand function for telecommunication services. This would be beyond the scope of this paper and will be addressed with a separate paper.
(8)
Where and the socio-demographic factors
set. The transformed demand functions for mobile phone services are then expanded by socio-economic factors and postulated to be of following form:
(9) m = monthly mobile expenditure in US$, converted using
nominal end of 2007 exchange rates (source IMF) Y= natural logarithm of individual income in US$,
converted using nominal end of 2007 exchange rates (source IMF). The income is the sum of any salary or wage, self-employment income, property income, income from agricultural produce, pension, transfer income and scholarships.
A = age in years PP = dichotomous public phone variable: used public phone
in the last three months =1, otherwise 0 WP = dichotomous work phone variable: access to a phone
at work =1, otherwise 0 G = dichotomous gender variable, female=1, male=0 F = dichotomous fixed-line variable: fixed-line access at
home =1, otherwise 0 SN= Dichotomous variable: social network (church groups,
sports clubs etc.) membership= 1, otherwise 0 R = Dichotomous variable: rural= 1, urban (other urban
and major urban) =0 The price variable used in the analysis is represented by the
amount that an individual paid for access and usage of mobiles. However since country results are being computed individually, there will not be a change for any of the responses, the cost of the usage basket is the same for everyone in a country. This lets the price variable become a constant.
Table 8 in the appendix presents the results from robust regressions round for each country using weighted data. Income is in each case significant and positively related to mobile expenditure.
The gender variable is insignificant for 10 countries which is somewhat surprising given that the average income of women is lower compared to that of men for all countries but Mozambique. However income is already taking care off in the equation. This means that apart of being at different income levels women spend the same on mobile phone as men. For Botswana, Cameroon, Mozambique and Namibia the gender variables was significant and negative, which means that women spend less. Nigeria had the only positive significant coefficient.22
22 These finding can be explored further by using mean rank comparisons for the ratio mobile expenditure / disposable income.
397

Having a working fixed-line phone at home is linked to
higher mobile expenditure in 8 out of 16 countries. This can be explained by two factors. First, households with fixed-line phones are generally wealthier which might not directly be reflected in the individual income of the responded (dependents). Second, having a fixed-line phone at home provides more opportunity to talk, such as calling home. These results confirm the existence of a relationship between mobile and fixed-line networks. To contribute to the complementarity and substitutability discussion further the fixed-line expenditure would need to be investigated for any affect through the number of mobile phone users in the household as well. The survey data also can be used to explain usage pattern in more detail.
Public phone usage has only been significant for 6 out of 16 countries. For Benin, Cameroon and South Africa it has a negative affect on mobile phone expenditure and for Burkina Faso, Rwanda and Senegal a positive one. This too needs to be analyzed in more detail. Public phones might predominantly be used by lower income groups or might actually substitute mobile phone expenditure. More country specific research is required to come to definite conclusions.
Equally for the impact of access to a work phone or private use. Fore five countries the work phone variable shows as positive and significant. While having access to a work phone is a good indicator for income one might have also have suspected a negative impact on mobile usage expenditure since the work-phone could be used to substitute for mobile calls.
Age has a significant and negative impact in six countries where that variable is significant. For those countries a youth user’s effect can be established.
The main objective is to estimate demand elasticities. A distinction is made between income and price elasticities. Income elasticity describes the magnitude and also therefore the responsiveness of a demand change for a good in respect to a income change. Graphically expressed, the income elasticity is –ceteris paribus- the slope of the demand curve, dependent on the income.
eY =
ΔQ /QΔY /Y
Where: Q = quantity demanded; Y = income and, ey =
income elasticity. The first derivative of the regression equation for income
yields the coefficient for Y, which is the income elasticity, that is, the percentage change in mobile expenditure at a 1% change in income.23 The estimations results show that income variable is statically significant and positive for all 17 countries.
23 See Wooldrige (2006) pages 46 and 705, Hej et all (2004) page 296.
Figure 1: Income elasticity: percentage change in mobile expenditure for 1% change in income. The figure above shows the percentage change in mobile expenditure for a 1% income change. For all countries the mobile expenditure is inelastic with regard to income. Nigeria has the highest income elasticity and Mozambique the lowest. Since these are national figures based on cross-section data it implies that people with higher incomes spend a smaller proportion of their income on mobile telephony compared to low income households. Figure 2 confirms this. Income elasticity seems to be linked to relative cost of mobile usage, penetration and coverage. Those factors need to be explored in more detail in subsequent studies utilising supply side data and qualitative research.
398

Figure 2: Share of mobile expenditure per month in terms of individual income.
VI. PRICE ELASTICITY / E-USAGE Price elasticity describes the magnitude and also therefore
the responsiveness of a demand change for a good in respect to a price change. Graphically expressed, the price elasticity is –ceteris paribus- the slope of the demand curve, dependent on the price.
eY =ΔQ /QΔP /P
Where: Q= quantity demanded; P = price of the good and ep
= price elasticity. The price elasticity of demand is in almost all cases, except
for inferior goods, negative, if the price increases the demand decreases. To simplify the notation, demand elasticities are in general expressed in absolute value and therefore expressed as positive (Frank & Bernanke, 2003).
Milne (2006) provides a very intuitive argument for the changing structure of price elasticity in a hypothetical case. She argues that when phones become available for the first time in a low-income community and usage charges or tariffs are relatively high (in terms of income) people will make limited number of essential calls. In such a scenario, even if the prices falls by a small amount the number of such calls; for instance in an emergency or substituting a telephone call for a bus ride to a city, will not increase by much. In other words
price elasticity will be relatively low (much less than -1). But, as prices fall, in a much cheaper service environment, she argues that people will start using the phone for many non-essential purposes; ranging from relationship maintenance and simple conveniences. Added to this, pricing innovations that enable poorer people to purchase small denomination pre-paid calling cards to make phone calls it is intuitive that the number of calls made will increase significantly. Milne (2006) argues that when this happens, the price elasticity will rapidly rise towards -1 or even more than -1.
One of the biggest problems in estimating price elasticity of demand (PED) for telecom services in developing country situations is the lack of accurate usage data. Unlike in developed countries where usage is easily obtainable from monthly bills for post-paid connections, the vast majority in developing countries, in the case of the current study, between 78% and 99% have no billing records (for prepaid shares see Table 9). Many use public phones, phones at work or other people’s phones which equally does not generate records.
Figure 3: If calls were cheaper what would you do? (source: RIA 2007/2008 household survey).
399

Figure 4: Average reaction to cost of using your phone came down by half or going up double (source: RIA 2007/2008 household survey).
Another difficulty is that cross section data, like the one that
is being analysed here, is not suitable to calculate price elasticities since it only captures data for one snapshot in time. Changes in consumer behaviour due to price changes can only be analysed using time series data. Cross section data only allows a rough glimpse at price elaticities by using contingent valuation methods. Respondents with mobile phone or active SIM card were asked how the would react to price decreases and increases. The answers to these questions are being displayed in Figure 3 and Figure 4. Figure 3 shows that the vast majority of respondents would make more calls if prices would come down. Senegal and Ethiopia are the two countries with the highest share of respondents that would use the saved money for something else.
Figure 4 shows how respondents state that they would react to a doubling and halving of call charges. What can be seen is the response is asymmetrical, ie respondents would react to price increases stronger than they would do to price decreases. However, approximating price elasticity from these two contingent valuations results is strictly speaking not possible. Respondents state their preferences and do not reveal it (observed behaviour reacting to price changes).
Table presents data on the untapped market, those 16 years or older that do not have a mobile or active SIM card at present. It shows the results for the number of people that
could be reached with US$1, US$2 and US$5 Average Revenue per Users (ARPU) business models.
VII. CONCLUSION This paper shows that countries differ in their levels of ICT
adoption and usage and also in the factors that influence adoption and usage. Income and education vastly enhances mobile adoption but gender, age and membership in social networks have little impact. Income is the main explanatory variable for usage. In terms of mobile expenditure the study also finds linkages to fixed-line, work and public phone usages. These linkages need however be explored in more detail in future. Mobile expenditure proofs to be inelastic with regard to income, ie as income increases mobile expenditure increases to a lesser extent indicating its importance in individual budgets.
Key policy interventions would be regulatory measure to increase access and usage of mobile services by promoting network investment. The current super profits being enjoyed by operators across the continent as a result of prices that are amongst the highest in the world need to be moderated. In most markets there is not effective competition requiring regulatory interventions to ensure cost based wholesale and retail pricing.
Increasing Coverage: Licence fees for infrastructure investment should cover the administrative and usage costs of national resources only. The current high cost of licences in most countries used to generated funds for state coffers translate in high prices for consumers as operators recover their licence costs. Countries need to look at incentives to encourage networks rollout not disincentives.
Wider Access: Access prices can be reduced by exempting telecommunication equipment, in particular mobile handsets and services from import duties and additional taxes.
Allow more Usage: Policy measures to increase the competition within the industry are the best mechanism to reduce usage costs. In a competitive environment the operator can choose to compete on price or on service quality. Regulatory measure can improve competition on price by creating price transparency.
Price Transparency: Contract and prepaid tariffs vary across operators to an extent that a product to product comparison is impossible for consumers. Non- transparent pricing, including rapidly changing promotions and misleading media campaigns, make it difficult for end-users to make informed decisions. This prevents operators from having to compete on prices and leads to higher average prices. Establishing price transparency on the basis of published monthly usage baskets will make the cost to the end-user transparent and force operators to compete on price or service quality.
Cost-based Interconnection rates: Above cost interconnection charges are often used by dominant operators to restrict small operator from gaining market share. High interconnection charges make off-net calls expensive and punishes consumer or small operator. Cost based interconnection rates (or benchmarked on cost base) increase the competition between operators and hence lead to lower
400

usage cost. Licences for Low ARPU business models: Regulators
should award additional licences to applicants that are able to offer low ARPU business models, preferably below US$2.
The correct policy and regulatory measures can boost mobile access and usage. Avoiding sector and service specific levies and additional taxes will result in lower recovery costs and therefore lower prices. Lower prices would allow millions of people currently unable to afford to access mobile services to do so and those currently restricting their usage as a result of the high cost of services to use services more extensively and effectively. This is likely to produce greater profits for companies overall and Governments will as a consequence have even more money in their coffers due to taxes on greater operator revenues.
VIII. REFERENCES [1] Adamowicz W. & Louviere J. & Williams (1994). Combining Revealed
and Stated Preference Methods for Valuing Environmental Amenities. Journal of Environmental Economics and Management, Vol. 26, pp.271-292.
[2] Bagchi, K. and G. Udo (2007). Empirically testing factors that drive ICT adoption in Africa and OECD set of Nations, Issues in Information Systems, Vol. 8, No.2, pp. 45-52.
[3] Baliamoune-Lutz, M. (2003). An analysis of the determinants and effects of ICT diffusion in developing countries, Information Technology for development, Vol.10, pp.151-169.
[4] Bann C. (1999). A Contingent Valuation of the Mangroves of Benut. Forestry, Department, Peninsular Malaysia, Danish Cooperation for Environment and Development and the Johor State. www.soc.uoc.gr/calendar/2000EAERE/papers/PDF/A6-Bann.pdf Last Appeal: 10.07.07
[5] Bateman I., Carson R., Day B., Hanemann M., Hanley N., Hett T., Jones-Lee M., Loomes G., Mourato S., Ozdemiroglu E., Pearce D., Sugden R., Swanson J. (2002). Economic Valuation with Stated Preference Techniques – A Manual. Edward Elgar, Cheltham, UK, ISBN: 1-84064-919-4.
[6] Clarke, G., & Wallsten, S. (2002). Universal(ly bad) service: Providing infrastructure services to rural and poor urban consumers. World Bank Policy Research Working Paper, 2868, 1–54.
[7] Crandall, R. & Waverman, L. (2000). Who pays for universal service? When telephone subsidies become transparent. Washington, DC: Brookings Institution Press.
[8] Eriksson, R., Kaserman, D., & Mayo, J. (1998). Targeted and untargeted subsidy schemes: Evidence from postdivestiture efforts to promote universal telephone service. Journal of Law and Economics, 41, 477–502.
[9] Esselaar, S., and Stork, C. (2005). Mobile Cellular Telephone: Fixed-line Substitution in Sub-Saharan Africa, The Southern African Journal of Information and Communication, Issue 6, pages 64-73, ISSN 1607-2235.
[10] Fabiani, S., F. Schivardi and S. Trento (2005), ICT adoption in Italian manufacturing: firm-level evidence, Industrial and Cooperate Change, pp.1-25.
[11] Frank R. & Bernanke B. (2003), “Principles of Economic”. McGraw-Hill, Boston
[12] Garbacz, C., & Thompson, H. G., Jr. (1997). Assessing the impact of FCC lifeline and link-up programs on telephone penetration. Journal of Regulatory Economics, 11, 67–78.
[13] Garbacz, C., & Thompson, H. G., Jr. (2002). Estimating telephone demand with state decennial census data from 1970–1990. Journal of Regulatory Economics, 21, 317–329.
[14] Garbacz, C., & Thompson, H. G., Jr. (2003). Estimating telephone demand with state decennial census data from 1970–1990: Update with 2000 data. Journal of Regulatory Economics, 24, 373–378.
[15] Garbacz, C., & Thompson, H. G., Jr. (2005). Universal telecommunications service: A world perspective. Information Economics and Policy, 17, 495–512.
[16] Garbacz, C., & Thompson, H. G., Jr. (2007). Demand for telecommunication services in developing countries. Telecommunications Policy 31 (2007) 276–289.
[17] Gasmi, F., Laffont, J. J., & Sharkey, W. (2000). Competition, universal service and telecommunications policy in developing countries. Information Economics and Policy, 12, 221–248.
[18] Gefen, D. & Straub, D. (1997). Gender difference in the perception and use of e-mail: an extension to the technology acceptance model. MIS Quarterly, 21, 389– 400.
[19] Gourieroux, C. (1986). Econométrie des variables qualitatives, Economica.
[20] Haque, O., M. (2007). Income Elasticity and Economic Development, Springer, ISBN 0-387-24292-9.
[21] Hausman, J., Tardiff, T., & Belinfante, A. (1993). The effects of the breakup of AT&T on telephone penetration in the United States. American Economic Review (American Economic Association Papers and Proceedings), 83, 178–184.
[22] Heij, C., de Boer, P., Franses, P., Kloek, T. and van Dijk, H. (2004). Economteric Methods with Applications in Business and Economics, Oxford University Press, ISBN 0-19-926801-0.
[23] Jalava, J. and M. Pohjola (2002). Economic growth in New Economy: Evidence from advanced economies, Information Economics and Policy, Vol.14, pp. 189-210
[24] Jorgenson D, M.S.Ho and K .Stiroh (2005). Productivity: Information Technology and the American Growth Ressurgence. London; Cambridge: The MIT Press.
[25] Kabbar, E.F. and Crump B.J. (2006). The factors that influence Adoption of ICT by recent refugee immigrants to New Zealand, Informing Science Journal, Vol.9, pp.111-120.
[26] Kaserman, D. L., Mayo, J. W., & Flynn, J. E. (1990). Cross subsidization in telecommunications: Beyond the universal service fairy tale. Journal of Regulatory Economics, 2, 231–249.
[27] Kelly, T. (2004). Changing ICT ranking of African Nations. The Southern African journal of Information and Communication, Issue No. 5, 2004.
[28] Kwapong, O.A.T.F (2007). Problems of policy formulation and implementation: The case of ICT use in rural women’s empowerment in Ghana, International Journal of Education and development using Information and Communication technology, Vol.3, No. 2, pp. 68-88.
[29] Long, S. (1997). Regression Models for Categorical and Limited Dependent Variables, Advanced Quantitative Techniques in the Social Sience Series, Sage Publications, ISBN 0-8039-7374-8.
[30] Long, S. & Freese, J. (2006). Regression Models for Categorical Dependent Variables Using Stata, Stata Press, ISBN1-59718-011-4.
[31] Maddala, G. S. (1983). Limited-dependent and Qualitative Variables in Econometrics, Cambridge University Press.
[32] McCormick, D. & J. Onjala (2007). Methodology for Value Chain Analysis in ICT Industry Frameworks for the Study of Africa, Institute for Development Studies University of Nairobi
[33] Milne, C. (2006). “Telecoms demand: measures for improving demand in developing countries – a toolkit for action”. Discussion Paper WDR 0603, Main Report (World Dialogue on Regulation).
[34] Mitchell R. & Carson R. (1984). A Contingent Valuation Estimate of National Freshwater Benefits – Technical Report to the US Environmental Protection Agency. Resources for Future, Washington D.C.
[35] Niininen, P. (2001). Computers and economic growth in Finland, in Information Technology, Productivity, and Economic Growth: International Evidence and implications for economic Development, Matti Pohjola, ed., oxford University Press.
[36] OECD (2003). ICT and Economic growth. Evidence from OECD countries, industries and firms. Paris (France).
[37] Oliner, S.D. and D.E. Sichel (2000). The resurgence of growth in the late 1990s: Is Information technology the Story?, Journal of Economic Perspectives, Vol.14, pp. 3-22.
[38] Ono, H. (2003). Gender and the Internet. Social Sciences Quarterly, 84, 111–121.
[39] Orbicom (2003). L’observatoire de la fracture numérique... et au-delà. Conseil national de la recherche du Canada, Québec (Canada).
[40] Panzar, J. C. (2000). A methodology for measuring the costs of universal service obligations. Information Economics and Policy, 12, 211–220.
[41] Parsons, S. G. (1998). Cross-subsidization in telecommunications. Journal of Regulatory Economics, 13, 157–182.
[42] Perl, L. J. (1983). Residential demand for telephone service. White Plains, NY: National Economic Research Associates.
401
[43] Piccoli, G., Ahmed, R. & Ives, B. (2001). Web based virtual learning environments: a research framework and a preliminary assessment of effectiveness in basic IT skills training. MIS Quarterly, 25, 401–426.
[44] Pohjola, M. (2001). Information technology and economic growth: A cross-country Analysis, in: Information Technology, Productivity, and Economic Growth: International Evidence and implications for economic Development, Matti Pohjola, ed., oxford University Press.
[45] Roller, L. H. & Waverman, L. (2001). Telecommunications Infrastructure and Economic Development: A simultaneous approach. The American Economic Review, Vol. 91, No 4, 909-923.
[46] Rosston, G. L., & Wimmer, B. R. (2000). The state of universal service. Information Economics and Policy, 12, 261–283.
[47] Row R. & Schulze W. & Breffle W. (1996). A Test for Payment Card Biases. Journal of Environmental Economics and Management, Vol. 31, pp. 178-185.
[48] Sichel, D. (1997). The Computer revolution- An Economic Perspective, Washington D.C.: Brookings Institutions Press.
[49] Taylor, L. D. (1994). Telecommunications demand in theory and practice. Dordrecht: Kluwer Academic Press.
[50] Taylor, L. D. (2002). Customer demand analysis. In M. Cave, S. Majumdar, & I. Vogelsang (Eds.), Handbook of telecommunications economics (pp. 97–142). Amsterdam: Elsevier Science.
[51] Taylor, L.D. and Kridel, D.J. (1990). “Residential Demand for Access to the Telephone Network,” in Telecommunications Demand Modeling, ed. by A. de Fontenay, M.H. Shugard, and D.S. Sibley, North Holland Publishing Co., Amsterdam.
[52] Tegegne G.E., (1999). “Willingness to pay for environmental protection: an application of Contingent Valuation Method (CMV) in Sekota District, Nothern Ethiopia”. Ethiopian Journal of Agricultural Economics Vol 3: 123-130
[53] UNCTAD (2006). “Rapport 2006 sur l’Economie de l’information”, UNCTAD/SDTE/ECB/2006.
[54] Valletti, T. M. (2000). Introduction: Symposium on universal service obligation and competition. Information Economics and Policy, 12, 205–210.
[55] Venkatachalam L. (2004). The Contingent Valuation Method - A Review. Environmental Impact Assessment Review, Vol. 24, pp. 89–124.
[56] Venkatesh, V. & Morris, M.G. (2000). Why don’t men ever stop to ask for directions? Gender, social influence, and their role in technology acceptance and usage behavior. MIS Quarterly, 24, 115–139.
[57] Wallsten, S. (2001). Telecommunications investment and traffic in developing countries: The effects of international settlement rate reforms. Journal of Regulatory Economics, 20, 307–323.
[58] Waverman, L., Meschi, M. & Fuss, M. (2005). The impact of telecoms on economic growth in developing countries. In Africa: The Impact of Mobile Phones: Moving the Debate Forward, The Vodafone Policy paper series, No.2.
[59] Wooldrige, J. (2006). Introductory Econometrics A modern Approach, 4th edition, South-Western Cengage Leraning, Canada, ISBN 13 : 978-0-324-58548-3.
402

IX. APPENDIX TABLE 5: PROBIT MODEL SPECIFICATION
Variable Variable Name
Type of Variable Expected sign
Comment
Dependent Variable
Mobile (M)
Dichotomous variable: Individual has a mobile or active SIM card = 1, 0 otherwise
Na
Income (I)
Continuous variable: Individual income in US$ based on end of year nominal exchange rates (source IMF)
positive Income is assumed to be the main barrier to adoption
Gender (G) Dichotomous variable: female = 1, male = 0
Not significant
The assumption is that there is no gender difference when it comes to mobile adoption
Age (A) In years Negative Technology being a domain for the younger generation
Tertiary (T) Dichotomous variable: highest education being tertiary = 1, otherwise 0
Secondary (S)
Dichotomous variable: highest education being secondary = 1, otherwise 0
Primary (P) Dichotomous variable: highest education being primary, remedial or traditional =1, otherwise 0;
Vocational (V)
Dichotomous variable: highest education being vocational =1, otherwise 0
Positive Education should enable individuals to use mobile phones, while also being an indicator for income, model would drop variables if multi-collinearity persists
Rural (R) Dichotomous variable: rural = 1, urban =0
Negative Mobile network coverage is less in rural areas compared to urban (major urban and other urban) ones and less adoption is expected therefore
Social Network (SN)
Dichotomous variable: social network (as church groups, sports clubs etc.) membership = 1, otherwise 0
Positive Membership in social networks might increase communication need
Independent Variables
Constant Captures various factors that either are constant for a country such as the price for mobile or fixed telephony or that serve as reference for dichotomous variables such as the educational variables and rural-urban location.
Negative Captures no education, but also urban
TABLE 6: NATIONALLY REPRESENTATIVE PROBIT RESULTS FORE EACH COUNTRY USING SAMPLING WEIGHTS (SOURCE: RIA 2007/2008 HOUSEHOLD SURVEY)
Positive Coefficients + = significant at 0.1 level, ++ = significant at 0.05 level, +++ = significant at 0.01 level Negative Coefficients - = significant at 0.1 level, -- = significant at 0.05 level, --- = significant at 0.01 level
Country Pseudo R2
Prob > chi2
I A G T S P V R SN Constant Benin 0.396 0.00 +++ ++ No +++ +++ +++ +++ --- no --- Botswana 0.16 0.00 + No No ++ +++ No Skip -- +++ No Burkina Faso 0.253 0.00 +++ --- --- +++ +++ +++ Skip --- No No Cameroon 0.258 0.00 +++ ++ No +++ +++ +++ ++ --- ++ --- Côte d'Ivoire 0.292 0.00 +++ -- No +++ +++ No +++ --- +++ No Ethiopia 0.452 0.00 +++ No No +++ ++ No +++ --- No --- Ghana 0.158 0.00 No - No +++ +++ +++ ++ --- ++ No
403
Kenya 0.258 0.00 +++ No No +++ +++ .++ +++ No ++ --- Mozambique 0.214 0.00 +++ No +++ +++ +++ +++ No --- No --- Namibia 0.224 0.00 +++ No No +++ +++ No No --- No No Nigeria* 0.172 0.00 +++ -- No +++ +++ No + No ++ No Rwanda 0.244 0.00 No No No Skip +++ +++ Skip --- No --- Senegal 0.215 0.00 ++ No --- +++ +++ ++ ++ --- No No South Africa 0.171 0.00 +++ --- +++ +++ +++ No No --- No No Tanzania 0.172 0.00 +++ + - Skip +++ +++ + --- +++ --- Uganda 0.357 0.00 +++ + No +++ ++ No +++ --- No --- Zambia* 0.2894 0.00 +++ No No Skip +++ +++ +++ Ski
p +++ ---
TABLE 7
WILLINGNESS AND ABILITY TO PAY
Average willingness and ability to pay for a mobile handset in US$
Average expected cost of a mobile handset US$
National New users at 20 US$ for an handset
New users at 15 US$ for an handset
New users at 10 US$ for an handset
Benin 7.45 11.44 124,972 487,176 677,715 Botswana 19.14 27.38 119,014 196,496 228,203 Burkina Faso 8.92 12.84 427,032 1,242,397 1,451,446 Cameroon 15.11 22.16 864,053 1,728,316 1,865,876 Côte d’Ivoire 29.70 30.06 3,057,420 3,539,351 3,914,283 Ethiopia 6.06 64.19 1,436,628 1,637,668 2,644,673 Ghana 14.02 23.15 1,283,271 1,469,652 1,841,837 Kenya 16.98 26.68 2,857,406 4,160,498 5,658,430 Mozambique 4.00 23.2 56,457 79,895 287,147 Namibia 24.64 25.12 162,992 192,395 232,584 Nigeria* 5.65 12.57 356,907 1,004,573 2,527,884 Senegal 19.55 2543.0% 1,336,691 2,169,548 2,301,775 South Africa 17.44 32.41 2,549,812 3,251,782 3,991,768 Tanzania 10.89 17.3 1,422,927 2,102,510 3,272,065 Zambia* 17.42 22.43 682,864 1,061,607 1,598,555 Benin 7.45 11.44 124,972 487,176 677,715
TABLE 8: MOBILE EXPENDITURE - ROBUST REGRESSION RESULTS FOR EACH COUNTRY USING SAMPLING WEIGHTS (SOURCE: RIA 2007/2008 HOUSEHOLD SURVEY)
Only significant coefficients are being displayed: * = significant at 0.1 level, ** = significant at 0.05 level, *** = significant at 0.01 level
Country R2 Prob > F
Y A G WP PP F R SN Benin 0.399 0.000 0.35*** 1.07*** -0.27*** Botswana 0.298 0.000 0.46*** -0.26** Burkina Faso 0.206 0.000 0.33*** 0.28* 0.35*** Cameroon 0.22 0.000 0.27*** -0.32** -0.22* 0.54* -0.4* Côte d'Ivoire 0.196 0.000 0.36*** -0.02* 0.45** 0.37* 0.34* Ethiopia 0.353 0.000 0.29*** -0.01** -0.47*** 0.23* Ghana 0.145 0.000 0.47*** -0.01** Kenya 0.251 0.000 0.33*** -0.02*** 0.44*** 0.47*** Mozambique 0.189 0.000 0.11** -0.03*** -0.72*** 1.04*** Namibia 0.449 0.000 0.43*** -0.23* 0.37** Nigeria 0.458 0.000 0.71*** 0.24*** -0.41* 0.24*** Rwanda 0.339 0.000 0.55*** 0.66*** Senegal 0.266 0.000 0.43*** 0.247* South Africa 0.477 0.000 0.47*** -0.02*** 0.2** -0.2*** 0.3*** Tanzania 0.127 0.000 0.33*** 0.84** Uganda 0.292 0.000 0.39 *** 0.48** -0.24* 0.43** Zambia 0.378 0.000 0.52*** -0.01** 0.69***
404

TABLE 9: MOBILE PENETRATION (SOURCE: RIA 2007/2008 HOUSEHOLD SURVEY)
Monthly average mobile expenditure in US$
Current market in US$ million 16+ with mobile phone
or active SIM
16+ with more than one SIM card
Number of duplicated SIM Cards
Total Number of active SIM cards
Share of Prepaid users
Benin 8.33 11.38 1,365,851 30.2% 496,917 1,173,454 2,047,486 95.96% Botswana 10.18 6.67 654,737 59.5% 61,670 129,323 722,390 99.28% Burkina Faso 5.84 10.77 1,844,701 27.2% 380,945 943,819 2,408,616 96.69% Cameroon 7.14 21.29 2,979,597 36.5% 240,473 600,756 3,440,472 88.04% Côte d'Ivoire 12.52 63.13 5,042,524 41.8% 762,295 1,741,585 6,037,870 91.77% Ethiopia 3.81 5.29 1,387,910 3.2% 8,379 17,282 1,410,159 88.31% Ghana 10.44 78.23 7,491,378 59.8% 832,341 1,969,676 8,691,409 99.83% Kenya 10.41 112.11 10,772,696 52.0% 2,796,971 5,932,015 13,984,190 98.89% Mozambique 6.26 30.47 4,865,758 25.7% 143,404 286,808 5,012,287 98.89% Namibia 11.41 7.14 625,707 49.3% 39,090 83,807 670,424 89.95% Nigeria* 10.88 686.54 63,101,014 77.3% 12,265,752 26,381,512 77,954,949 99.33% Rwanda 6.02 3.13 520,259 9.9% 16,170 32,340 536,429 94.77% Senegal 11.00 27.54 2,502,300 39.8% 125,251 291,243 2,705,744 99.70% South Africa 15.88 320.49 20,185,135 62.1% 2,200,647 4,845,907 22,938,052 78.64% Tanzania 7.44 30.79 4,138,338 21.5% 602,730 1,301,997 5,070,790 96.95% Uganda 5.75 16.81 2,924,095 20.7% 526,378 1,097,654 3,505,813 97.84% Zambia* 10.55 25.96 2,459,961 45.5% 110,683 253,279 2,605,368 99.7%
TABLE 10: MOBILE WILLINGNESS AND ABILITY TO PAY (SOURCE: RIA 2007/2008 HOUSEHOLD SURVEY)
Number of 16+ without a mobile phone or active SIM willing and able to spend monthly:
16+ without mobile phone or active SIM card 1US$ or more 2 US$ or more 5 US$ or more
Average monthly WTP in US$
Monthly untapped market in US$ million
Benin 69.8% 3,162,099 2,797,101 1,402,507 161,217 2.94 8.26 Botswana 40.5% 446,140 311,446 199,511 66,192 4.28 1.47 Burkina Faso 72.8% 4,929,897 4,371,694 1,875,892 430,952 3.13 13.71 Cameroon 63.5% 5,177,393 3,452,460 1,855,275 550,724 3.75 13.14 Côte d'Ivoire 58.2% 7,033,592 4,485,498 3,645,855 1,677,528 6.86 31.44 Ethiopia 96.8% 42,497,353 10,231,145 3,104,395 74,428 1.53 25.68 Ghana 40.2% 5,036,815 2,849,435 1,953,135 984,279 9.34 38.40 Kenya 48.0% 9,941,748 5,866,299 5,235,785 1,245,083 3.30 25.69 Mozambique 74.3% 14,078,222 1,407,840 1,199,765 376,037 2.96 6.70 Namibia 50.7% 644,056 275,364 247,254 71,171 4.88 1.35 Nigeria* 22.7% 18,541,687 7,989,151 6,234,941 5,128,000 6.09 65.25 Rwanda 90.1% 4,735,492 Senegal 60.2% 3,779,221 3,428,481 1,294,681 502,730 3.28 11.33 South Africa 37.9% 12,331,758 7,604,512 5,551,777 2,209,625 4.34 36.27 Tanzania 78.5% 15,066,652 5,560,959 4,750,935 1,064,087 2.61 21.42 Uganda 79.3% 11,174,801 Zambia* 54% 2,944,732 1,933,833 1,310,576 329,922 3.45 8.2
405