Mobile Security Updates: Understanding the Issues · Mobile Security Updates: Understanding the...
134
0100011110010101010101110000011001000110000101110100011001010111001101010101011011100110010001100101011100100111001101110100011000010110111001100100011010010110111001100111011101000110100 Mobile Security Updates: Understanding the Issues 01011000110111010101110010011010010111010001111001010101010111000001100100011000010111010001100101011100110101010101101110011001000 00100110100101110100011110010101010101110000011001000110000101110100011001010111001101010101011011100110010001100101011100100111001 1100101010101011100000110010001100001011101000110010101110011010101010110111001100100011001010111001001110011011101000110000101101 10010011010010111010001111001010101010111000001100100011000010111010001100101011100110101010101101110011001000110010101110010011100 00011011101010111001001101001011101000111100101010101011100000110010001100001011101000110010101110011010101010110111001100100011001010111001001110011011101000110000101101110011001000110100 0000011001000110000101110100011001010111001101010101011011100110010001100101011100100111001101110100011000010110111001100100011010010110111001100111011101000110100001100101010010010111001 0110100101110100011110010101010101110000011001000110000101110100011001010111001101010101011011100110010001100101011100100111001101110100011000010110111001100100011010010110111001100111011 11011110110001001101001011011000110010101010011011001010110001101110101011100100110100101110100011110010101010101110000011001000110000101110100011001010111001101010101011011100110010001100101011 10110110001100101010100110110010101100011011101010111001001101001011101000111100101010101011100000110010001100001011101000110010101110011010101010110111001100100011001010111001001110011011101000 01011011000110010101010011011001010110001101110101011100100110100101110100011110010101010101110000011001000110000101110100011001010111001101010101011011100110010001100101011100100111001101110100 10110001001101001011011000110010101010011011001010110001101110101011100100110100101110100011110010101010101110000011001000110000101110100011001010111001101010101011011100110010001100101011100100111001101110100011000010110111001100100011010010110111001100111011101000110100001100 11110110001001101001011011000110010101010011011001010110001101110101011100100110100101110100011110010101010101110000011001000110000101110100011001010111001101010101011011100110010001100101011100100111001101110100011000010110111001100100011010010110111001100111011101000110100001 1010101110010011010010111010001111001010101010111000001100100011000010111010001100101011100110101010101101110011001000110010101110 01110100011110010101010101110000011001000110000101110100011001010111001101010101011011100110010001100101011100100111001101110100011 10111000001100100011000010111010001100101011100110101010101101110011001000110010101110010011100110111010001100001011011100110010001 0111010001111001010101010111000001100100011000010111010001100101011100110101010101101110011001000110010101110010011100110111010001 01001101001011101000111100101010101011100000110010001100001011101000110010101110011010101010110111001100100011001010111001001110011011101000110000101101110011001000110100101101110011001110 10100011110010101010101110000011001000110000101110100011001010111001101010101011011100110010001100101011100100111001101110100011000010110111001100100011010010110111001100111011101000110100 01011101000110010101110011010101010110111001100100011001010111001001110011011101000110000101101110011001000110100101101110011001110111010001101000011001010100100101110011011100110111010101 1110010101010101110000011001000110000101110100011001010111001101010101011011100110010001100101011100100111001101110100011000010110111001100100011010010110111001100111011101000110100001100 10010110110001100101010100110110010101100011011101010111001001101001011101000111100101010101011100000110010001100001011101000110010101110011010101010110111001100100011001010111001001110011011101 0100110110010101100011011101010111001001101001011101000111100101010101011100000110010001100001011101000110010101110011010101010110111001100100011001010111001001110011011101000110000101101110011 10100110110010101100011011101010111001001101001011101000111100101010101011100000110010001100001011101000110010101110011010101010110111001100100011001010111001001110011011101000110000101101110011 1101100011001010101001101100101011000110111010101110010011010010111010001111001010101010111000001100100011000010111010001100101011100110101010101101110011001000110010101110010011100110111010001100001011011100110010001101001011011100110011101110100011010000110010101001001011100 00110010101010011011001010110001101110101011100100110100101110100011110010101010101110000011001000110000101110100011001010111001101010101011011100110010001100101011100100111001101110100011000010110111001100100011010010110111001100111011101000110100001100101010010010111001101110 10100101110100011110010101010101110000011001000110000101110100011001010111001101010101011011100110010001100101011100100111001101110 10101011100000110010001100001011101000110010101110011010101010110111001100100011001010111001001110011011101000110000101101110011001000110100101101110011001110111010001101000011001010100100 1100000110010001100001011101000110010101110011010101010110111001100100011001010111001001110011011101000110000101101110011001000110100101101110011001110111010001101000011001010100100101110 Federal Trade Commission COMMISSION REPORT FEBRUARY 2018
Transcript of Mobile Security Updates: Understanding the Issues · Mobile Security Updates: Understanding the...
01001101011011110110001001101001011011000110010101010011011001010110001101110101011100100110100101110100011110010101010101110000011001000110000101110100011001010111001101010101011011100110010001100101011100100111001101110100011000010110111001100100011010010110111001100111011101000110100001100101010010010111001101110011011101010110010101110011
Mobile Security Updates: Understanding the Issues
01001101011011110110001001101001011011000110010101010011011001010110001101110101011100100110100101110100011110010101010101110000011001000110000101110100011001010111001101010101011011100110010001100101011100100111001101110100011000010110111001100100011010010110111001100111011101000110100001100101010010010111001101110011011101010110010101110011
01001101011011110110001001101001011011000110010101010011011001010110001101110101011100100110100101110100011110010101010101110000011001000110000101110100011001010111001101010101011011100110010001100101011100100111001101110100011000010110111001100100011010010110111001100111011101000110100001100101010010010111001101110011011101010110010101110011
01001101011011110110001001101001011011000110010101010011011001010110001101110101011100100110100101110100011110010101010101110000011001000110000101110100011001010111001101010101011011100110010001100101011100100111001101110100011000010110111001100100011010010110111001100111011101000110100001100101010010010111001101110011011101010110010101110011
01001101011011110110001001101001011011000110010101010011011001010110001101110101011100100110100101110100011110010101010101110000011001000110000101110100011001010111001101010101011011100110010001100101011100100111001101110100011000010110111001100100011010010110111001100111011101000110100001100101010010010111001101110011011101010110010101110011
01001101011011110110001001101001011011000110010101010011011001010110001101110101011100100110100101110100011110010101010101110000011001000110000101110100011001010111001101010101011011100110010001100101011100100111001101110100011000010110111001100100011010010110111001100111011101000110100001100101010010010111001101110011011101010110010101110011
01001101011011110110001001101001011011000110010101010011011001010110001101110101011100100110100101110100011110010101010101110000011001000110000101110100011001010111001101010101011011100110010001100101011100100111001101110100011000010110111001100100011010010110111001100111011101000110100001100101010010010111001101110011011101010110010101110011
01001101011011110110001001101001011011000110010101010011011001010110001101110101011100100110100101110100011110010101010101110000011001000110000101110100011001010111001101010101011011100110010001100101011100100111001101110100011000010110111001100100011010010110111001100111011101000110100001100101010010010111001101110011011101010110010101110011
01001101011011110110001001101001011011000110010101010011011001010110001101110101011100100110100101110100011110010101010101110000011001000110000101110100011001010111001101010101011011100110010001100101011100100111001101110100011000010110111001100100011010010110111001100111011101000110100001100101010010010111001101110011011101010110010101110011
01001101011011110110001001101001011011000110010101010011011001010110001101110101011100100110100101110100011110010101010101110000011001000110000101110100011001010111001101010101011011100110010001100101011100100111001101110100011000010110111001100100011010010110111001100111011101000110100001100101010010010111001101110011011101010110010101110011
01001101011011110110001001101001011011000110010101010011011001010110001101110101011100100110100101110100011110010101010101110000011001000110000101110100011001010111001101010101011011100110010001100101011100100111001101110100011000010110111001100100011010010110111001100111011101000110100001100101010010010111001101110011011101010110010101110011
01001101011011110110001001101001011011000110010101010011011001010110001101110101011100100110100101110100011110010101010101110000011001000110000101110100011001010111001101010101011011100110010001100101011100100111001101110100011000010110111001100100011010010110111001100111011101000110100001100101010010010111001101110011011101010110010101110011
01001101011011110110001001101001011011000110010101010011011001010110001101110101011100100110100101110100011110010101010101110000011001000110000101110100011001010111001101010101011011100110010001100101011100100111001101110100011000010110111001100100011010010110111001100111011101000110100001100101010010010111001101110011011101010110010101110011
01001101011011110110001001101001011011000110010101010011011001010110001101110101011100100110100101110100011110010101010101110000011001000110000101110100011001010111001101010101011011100110010001100101011100100111001101110100011000010110111001100100011010010110111001100111011101000110100001100101010010010111001101110011011101010110010101110011
01001101011011110110001001101001011011000110010101010011011001010110001101110101011100100110100101110100011110010101010101110000011001000110000101110100011001010111001101010101011011100110010001100101011100100111001101110100011000010110111001100100011010010110111001100111011101000110100001100101010010010111001101110011011101010110010101110011
01001101011011110110001001101001011011000110010101010011011001010110001101110101011100100110100101110100011110010101010101110000011001000110000101110100011001010111001101010101011011100110010001100101011100100111001101110100011000010110111001100100011010010110111001100111011101000110100001100101010010010111001101110011011101010110010101110011
01001101011011110110001001101001011011000110010101010011011001010110001101110101011100100110100101110100011110010101010101110000011001000110000101110100011001010111001101010101011011100110010001100101011100100111001101110100011000010110111001100100011010010110111001100111011101000110100001100101010010010111001101110011011101010110010101110011
01001101011011110110001001101001011011000110010101010011011001010110001101110101011100100110100101110100011110010101010101110000011001000110000101110100011001010111001101010101011011100110010001100101011100100111001101110100011000010110111001100100011010010110111001100111011101000110100001100101010010010111001101110011011101010110010101110011
01001101011011110110001001101001011011000110010101010011011001010110001101110101011100100110100101110100011110010101010101110000011001000110000101110100011001010111001101010101011011100110010001100101011100100111001101110100011000010110111001100100011010010110111001100111011101000110100001100101010010010111001101110011011101010110010101110011
01001101011011110110001001101001011011000110010101010011011001010110001101110101011100100110100101110100011110010101010101110000011001000110000101110100011001010111001101010101011011100110010001100101011100100111001101110100011000010110111001100100011010010110111001100111011101000110100001100101010010010111001101110011011101010110010101110011
01001101011011110110001001101001011011000110010101010011011001010110001101110101011100100110100101110100011110010101010101110000011001000110000101110100011001010111001101010101011011100110010001100101011100100111001101110100011000010110111001100100011010010110111001100111011101000110100001100101010010010111001101110011011101010110010101110011
01001101011011110110001001101001011011000110010101010011011001010110001101110101011100100110100101110100011110010101010101110000011001000110000101110100011001010111001101010101011011100110010001100101011100100111001101110100011000010110111001100100011010010110111001100111011101000110100001100101010010010111001101110011011101010110010101110011
01001101011011110110001001101001011011000110010101010011011001010110001101110101011100100110100101110100011110010101010101110000011001000110000101110100011001010111001101010101011011100110010001100101011100100111001101110100011000010110111001100100011010010110111001100111011101000110100001100101010010010111001101110011011101010110010101110011
01001101011011110110001001101001011011000110010101010011011001010110001101110101011100100110100101110100011110010101010101110000011001000110000101110100011001010111001101010101011011100110010001100101011100100111001101110100011000010110111001100100011010010110111001100111011101000110100001100101010010010111001101110011011101010110010101110011
01001101011011110110001001101001011011000110010101010011011001010110001101110101011100100110100101110100011110010101010101110000011001000110000101110100011001010111001101010101011011100110010001100101011100100111001101110100011000010110111001100100011010010110111001100111011101000110100001100101010010010111001101110011011101010110010101110011
01001101011011110110001001101001011011000110010101010011011001010110001101110101011100100110100101110100011110010101010101110000011001000110000101110100011001010111001101010101011011100110010001100101011100100111001101110100011000010110111001100100011010010110111001100111011101000110100001100101010010010111001101110011011101010110010101110011
01001101011011110110001001101001011011000110010101010011011001010110001101110101011100100110100101110100011110010101010101110000011001000110000101110100011001010111001101010101011011100110010001100101011100100111001101110100011000010110111001100100011010010110111001100111011101000110100001100101010010010111001101110011011101010110010101110011
01001101011011110110001001101001011011000110010101010011011001010110001101110101011100100110100101110100011110010101010101110000011001000110000101110100011001010111001101010101011011100110010001100101011100100111001101110100011000010110111001100100011010010110111001100111011101000110100001100101010010010111001101110011011101010110010101110011
01001101011011110110001001101001011011000110010101010011011001010110001101110101011100100110100101110100011110010101010101110000011001000110000101110100011001010111001101010101011011100110010001100101011100100111001101110100011000010110111001100100011010010110111001100111011101000110100001100101010010010111001101110011011101010110010101110011
Federal Trade CommissionCOMMISSION REPORT FEBRUARY 2018
Mobile Security Updates: Understanding the Issues
A Commission Report
February 2018
FEDERAL TRADE COMMISSION
Maureen K. Ohlhausen, Acting Chairman
Terrell McSweeny, Commissioner
Mobile Security Updates: Understanding the Issues
Contents
Executive Summary ........................................................................................................... 1
I. Preliminary Findings ................................................................................................. 3
A. Characteristics of Some Industry Participants .......................................................................... 3
B. Benefits and Risks .................................................................................................................... 4
C. Recommendations .................................................................................................................... 5
I. Introduction ................................................................................................................ 7
A. The Commission’s Past Efforts to Improve Mobile Device Security and Security UpdatePractices ................................................................................................................................. 11
B. Mobile Security Study ............................................................................................................ 14
II. Securing Mobile Devices ......................................................................................... 17
A. Mobile Malware: Risk and Harm ........................................................................................... 18
B. Mitigating the Threat: Patching in a Complex Ecosystem ..................................................... 20
III. The Security Update Process .................................................................................. 24
A. Identifying Vulnerabilities and Affected Devices .................................................................. 24
B. Deciding Whether to Update Specific Devices ...................................................................... 25
C. Deciding When to Update Specific Devices .......................................................................... 26
D. Security Update Testing ......................................................................................................... 27
E. Installing the Security Update ................................................................................................ 31
IV. Security Support Practices ...................................................................................... 33
A. Duration of Security Update Support ..................................................................................... 33
Mobile Security Updates: Understanding the Issues
1. Public Statements about Update Support .............................................................................. 33
2. Device Manufacturer Update Support Data .......................................................................... 36
B. Security Update Frequency .................................................................................................... 42
1. Public Statements about Update Frequency .......................................................................... 43
2. Security Update Frequency Data ........................................................................................... 45
C. Patch Development and Testing ............................................................................................. 50
D. Uptake Rates ........................................................................................................................... 58
V. Security Update Information For Consumers ...................................................... 61
VI. Findings and Recommendations............................................................................. 65
A. Preliminary Findings .............................................................................................................. 65
1. Characteristics of Some Industry Participants ....................................................................... 65
2. Benefits and Risks ................................................................................................................. 67
B. Recommendations .................................................................................................................. 68
1. Recommendations for Consumer Education ......................................................................... 68
2. Recommendations for Industry Best Practices ...................................................................... 69
VII. Conclusion ................................................................................................................ 74
Appendix A .....................................................................................................................A-1
1. Order to File a Special Report ..................................................................................................I 2. Attachment A ......................................................................................................................... .II
Appendix B .......................................................................................................................B-I
1. Letter from Federal Communications Commission to [Carrier] ............................................. I 2. Questions to [Carrier] on Mobile Device Security ..................................................................II
Appendix C ......................................................................................................................C-I
I. Manufacturer Update Support Period .................................................................... 2
Mobile Security Updates: Understanding the Issues
1. Data and Variables Considered ............................................................................................... 2
2. Univariate Analysis ................................................................................................................. 3
3. Multivariate Analysis ............................................................................................................... 5
II. Manufacturer Update Frequency............................................................................. 7
1. Data and Variables Considered ............................................................................................... 7
2. Univariate Analysis ................................................................................................................. 7
3. Multivariate Analysis ............................................................................................................... 9
4. Device Release Date and Update Frequency ......................................................................... 11
a. Univariate Analysis .............................................................................................................. 11
b. Multivariate Analysis ........................................................................................................... 13
III. Patch Development and Testing ............................................................................. 14
A. Device Manufacturers ............................................................................................................. 14
1. Data and Variables Considered ............................................................................................. 14
2. Univariate Analysis ............................................................................................................... 16
3. Multivariate Analysis ............................................................................................................. 23
B. OS Developers ........................................................................................................................ 26
1. Data and Variables Considered ............................................................................................. 26
2. Univariate Analysis ............................................................................................................... 27
3. Multivariate Analysis ............................................................................................................. 29
IV. Uptake Rate of Security Updates ........................................................................... 30
1. Data and Variables Considered ............................................................................................. 31
2. Univariate Analysis ............................................................................................................... 32
3. Multivariate Analysis ............................................................................................................. 35
Mobile Security Updates: Understanding the Issues
1
Executive Summary Thanks to our smartphones and tablets, we shop, bank, play, read, post, watch, date, record, and
search on the go. Three-quarters of Americans own smartphones1 and most check their devices four times or more every hour.2 Many consumers access the Internet primarily, or exclusively, through their phones.3 Adults are not alone in their devotion to mobile devices; over the last few years, children under eight have tripled their daily mobile device screen time4 and more than 90% of teenagers go online by mobile device.5
As these astounding use statistics suggest, consumers can derive enormous benefits from mobile technology. But reaping those benefits is contingent, in part, on consumers’ willingness to trust the technology. A basic component of that trust is fulfilling consumers’ expectation of reasonable security to protect the sensitive data about lifestyle, health, location, finances, and identity that mobile devices collect, store, and transmit.6
Security researchers and government agencies have consistently maintained that the best way to secure consumer information is to take reasonable steps to design secure products and maintain their security with updates that patch vulnerabilities in device software.7 Despite this consensus, security researchers and industry observers have reported that many mobile devices’ operating systems (the
1 PEW RESEARCH CENTER, MOBILE FACT SHEET (Feb. 5, 2018), http://www.pewinternet.org/fact-sheet/mobile/ [hereinafter PEW MOBILE FACT SHEET].
2 Jane E. Brody, Hooked on Our Smartphones, N.Y. TIMES, Jan. 9, 2017, https://www.nytimes.com/2017/01/09/well/live/hooked-on-our-smartphones.html (reviewing book that notes that most people check their smartphones every six minutes); SWNS, Americans Check Their Phones 80 Times a Day: Study, N.Y.POST, Nov. 8, 2017, https://nypost.com/2017/11/08/americans-check-their-phones-80-times-a-day-study/ (reporting on study claiming that Americans check their phone on average once every 12 minutes).
3 PEW MOBILE FACT SHEET, supra note 1 (describing “just over one-in-ten American adults” as “‘smartphone-only’ internet users”).
4 COMMON SENSE MEDIA, THE COMMON SENSE CONSENSUS: MEDIA USE BY KIDS AGE ZERO TO EIGHT, 3 (2017), https://www.commonsensemedia.org/research/the-common-sense-census-media-use-by-kids-age-zero-to-eight-2017 (follow “Read Full Report” link).
5 PEW RESEARCH CENTER, TEENS, SOCIAL MEDIA & TECHNOLOGY OVERVIEW 2015, 14-15 (Apr. 2015), http://assets.pewresearch.org/wp-content/uploads/sites/14/2015/04/PI_TeensandTech_Update2015_0409151.pdf.
6 PEW RESEARCH CENTER, AMERICANS & CYBERSECURITY, 3 (Jan. 26, 2017), http://assets.pewresearch.org/wp-content/uploads/sites/14/2017/01/26102016/Americans-and-Cyber-Security-final.pdf (reporting that 70% of Americans are at least “somewhat confident” in the ability of their device manufacturer to protect their data) [hereinafter AMERICANS & CYBERSECURITY].
7 See infra Parts I.A, II.B.
Mobile Security Updates: Understanding the Issues
2
software that powers the devices’ basic functions) are not receiving the security patches they need to protect them from critical vulnerabilities.8 As a result, many mobile devices are vulnerable to a wide range of malware (malicious software) attacks, including spyware, phishing, and ransomware.9 Each of these malware variants can put consumers at risk of identity theft scams, fraudulent charges, or device compromise, which can cost consumers hundreds or thousands of dollars.10
In May 2016, the Federal Trade Commission (“FTC” or “Commission”) issued identical Orders to File Special Reports (“Orders”) under section 6(b) of the Federal Trade Commission Act to eight device manufacturers to gather information about their security update procedures and practices.11 The respondents—Apple, Blackberry, Google, HTC, LG, Microsoft, Motorola, and Samsung—comprise most of the U.S. mobile device market12 and represent some of the variety of the mobile ecosystem. Collectively, they use, or have used, four different operating systems, including the two dominant operating systems in the U.S. (Android and iOS).13 A few, such as Apple and Microsoft, sell relatively few models powered by their own operating system. By contrast, several, including HTC, LG, Motorola, and Samsung, have large device portfolios whose phones and tablets run device-specific customizations of the Android operating system.
This Report summarizes the information provided in response to the Commission’s Orders, as well as responses to a parallel inquiry initiated by the Federal Communications Commission (“FCC”) into mobile carriers’ security updates practices.14 The data provided in response to these inquiries is not sufficiently representative to permit definitive conclusions about industry practices as a whole. Nevertheless, the companies’ narrative responses and several detailed data sets provide remarkable insight into the security update practices that affect a large proportion of the devices on the U.S. market.
8 See infra Part I.
9 See infra Part II.A.
10 See id.
11 Press Release, Fed. Trade Comm’n, FTC To Study Mobile Device Industry’s Security Update Practices (May 9, 2016), https://www.ftc.gov/news-events/press-releases/2016/05/ftc-study-mobile-device-industrys-security-update-practices [hereinafter, FTC Press Release].
12 Press Release, comScore, ComScore Reports June 2017 U.S. Smartphone Subscriber Market Share (Aug. 3, 2017), https://www.prnewswire.com/news-releases/comscore-reports-june-2017-us-smartphone-subscriber-market-share-300498296.html.
13 Id.
14 See Press Release, Fed. Comm. Comm’n, FCC Wireless Telecommunications Bureau Launches Inquiry into Mobile Device Security Updates (May 9, 2016), https://apps.fcc.gov/edocs_public/attachmatch/DOC-339256A1.pdf [hereinafter, FCC Press Release].
Mobile Security Updates: Understanding the Issues
3
Based on this data, publicly available materials, and the Commission’s long experience with mobile security and disclosure issues, this report highlights practices that may be conducive to assuring that consumers shop, bank, play, read, post, date, record, and search with reasonably secure devices.
I. Preliminary FindingsA. Characteristics of Some Industry Participants
• Because of the complexity of the mobile ecosystem, the security update process can becomplex and time-consuming. Many device manufacturers customize third-party operatingsystem software at the device level, either to introduce new features or at the request of a carrierpartner. As a result, a single operating system update may require dozens or hundreds ofdifferent device-level modifications, all of which may be tested by carrier partners (and,sometimes, additional third parties). Carrier testing labs with finite resources must accommodatehundreds of updates from multiple device manufacturers. As a result, there are many reasonswhy a security update may take weeks, months, or even years to be completed.
• Industry participants have taken steps to streamline the security update process butbottlenecks remain. Over the past two years, operating system developers, devicemanufacturers and carriers have implemented new policies and practices to improve the securityupdate process, such as security-only updates and regular security update schedules. To someextent, these efforts are working, but adoption of these changes is uneven and significant timegaps between discovery of vulnerabilities and patching likely still exist.
• Support periods and update schedules are highly variable. Formal support policies are rare.Many manufacturers prefer just-in-time support decisions, based on an informal assessment offactors such as the device’s age and popularity, the cost of support, partner input, the severity ofthe vulnerability, and regularly scheduled releases. As a result, update support periods andupdate schedules are highly variable.
• Device manufacturers that develop and control their own operating systems tend to commitin advance to longer support periods (usually for several years) for devices. Because theytend not to customize their operating system for particular devices, certain support costs (e.g., forpatch implementation and carrier testing) are likely lower.
• Some device manufacturers state that they do not commit to firm update support periodsor schedules because they cannot anticipate market conditions. Several manufacturersreported that it is difficult to predict (and share with consumers) update support periods andupdate schedules, because update support decisions turn on unpredictable variables likepopularity. Some data, however, suggests that support period length (for at least somemanufacturers) is slightly more closely correlated with device price and age than popularity.
Mobile Security Updates: Understanding the Issues
4
Manufacturers interested in publicizing update support period may be able to learn from past update support practices related to device price and age to inform update support estimates.
• Many device manufacturers do not maintain regular records about update support. Anumber of manufacturers reported that they could not provide data in response to theCommission’s Order because they do not record information about update support decisions,customized patch development time, carrier testing time, deployment time, or uptake rate. At thesame time, manufacturer-carrier communications revealed that when companies do record,study, and share their data, they have gleaned important insights that lead to practiceimprovements.
• Manufacturers provide little express information about support period, update frequency,and end of update support. Some manufacturers make information about security updatesupport (e.g., minimum support period, support end date, update frequency) available toconsumers before purchase. Many, however, do not, or do not make this information availablefor all of their devices. And few, if any, manufacturers or carriers explain that apparentlyidentical devices may receive different security update support based on the type of service theconsumer selects (e.g., unlocked, WiFi-only, major or budget carrier). Although most devicemanufacturers do notify consumers when a security update is available, most do not inform userswhen a phone is about to stop receiving support or when it has in fact stopped receiving securityupdates.
B. Benefits and Risks
• The mobile ecosystem’s diversity provides extensive consumer choice, but also contributesto security update complexity and inconsistency. Thanks to the diverse and competitivemobile ecosystem and to the device-level customizations made possible by free and customizableoperating systems, consumers can choose from thousands of different device-servicecombinations at a wide variety of price points. Variety, however, does have costs: Operatingsystem customization at the device level can prevent uniform security patch application, increasethe time and cost to develop, test, and deploy security updates, and may lead to shorter updatesupport periods and less frequent updates. Indeed, device manufacturers that customizeoperating systems across a wide range of devices tend to support phones for shorter periods—most often less than a year or two from device release.
• Device manufacturers’ security support decisions enable flexible responses to marketconditions, but make security support periods and schedules more uncertain. Devicemanufacturers’ case-by-case decision-making process can help to control update support coststhat might otherwise be passed onto consumers through higher prices. A byproduct of just-in-time decision-making, however, is that it impedes advanced commitments about update supportthat might benefit security-conscious consumers.
Mobile Security Updates: Understanding the Issues
5
• Each respondent focuses support on newer products and several focus update support on costlier, more popular devices. Each respondent reported prioritizing new products (whether measured by device or operating system age) for update support. Data we received suggests a tendency in practice to allocate update support towards more expensive and more popular models. Consumers benefit from the availability of older phones at lower prices whose discount reflects, in part, the reduced update support they receive. But failing to patch critical vulnerabilities on older, cheaper, or less popular devices creates risks for some device owners.
• Carrier involvement in the security update process contributes to stability but can lead to delays. Carrier involvement can benefit consumers: Carriers sometimes use their influence with manufacturers to encourage good patching practices, carrier testing helps to ensure continued device and network performance, and carriers bring considerable experience to update deployments. Carrier involvement comes at a cost, as well: Carriers with overcrowded testing labs sometimes resist security updates or delay testing for updates that include security patches.
C. Recommendations The Commission commends industry for its efforts to expedite the security update process. We
now call on advocacy groups and industry to continue these efforts by considering the recommendations below, each of which is explained in greater detail in Part VI of the Report.
First, there is a significant opportunity for government, industry, and advocacy groups to work together to educate consumers about their role in the operating system update process and the significance of security update support. The more consumers understand the importance of updates, the more likely they are to install available updates and to consider security update support when making purchasing, use, and upgrade decisions.
Second, there is an opportunity for industry—device manufacturers, operating system developers, and wireless carriers—to continue their efforts to “start with security”15 by embedding security further into design and support culture and decisions. To that end, industry should ensure that all mobile devices receive operating system security updates for a period of time that is consistent with consumers’ reasonable expectations. Support for particular devices will, of course, vary depending on the circumstances. Reasonable security support should be a shared priority, reflected in policies, practices, and contracts throughout the mobile ecosystem. When making decisions about operating system design or about whether to launch a customized device, developers and manufacturers should consider how their decisions will affect their commitment to reasonable security update support.
15 FED. TRADE COMM’N, START WITH SECURITY: A GUIDE FOR BUSINESS (June 2015), https://www.bulkorder.ftc.gov/system/files/publications/pdf0205-startwithsecurity.pdf [hereinafter START WITH SECURITY].
Mobile Security Updates: Understanding the Issues
6
Third, we recommend that industry prepare for the future by learning from the past. Companies involved in the security update process should consider keeping and consulting records about support length, update frequency, customized patch development time, testing time, and uptake rate. Companies should then consider sharing such information with partners so that industry can fashion policies and practices based on what they learn.
Fourth, industry should continue to streamline the security update process. In particular, companies should patch vulnerabilities in security-only updates when the benefits of more immediate action outweigh the convenience of a bundled security-functionality update. Companies that test updates (or impose testing requirements) should make sure that their processes and requirements are compatible with industry’s commitment to timely security updates. And companies that deploy updates should continue to explore ways to improve the rate at which consumers install updates.
Finally, we recommend that device manufacturers consider giving consumers more and better information about security update support. Specifically, manufacturers interested in providing security update information should consider adopting and disclosing minimum guaranteed security support periods (and update frequency) for their devices. They should also consider giving device owners prompt notice when security support is about to end (and when it has ended), so that consumers can make informed decisions about device replacement or post-support use.
Mobile Security Updates: Understanding the Issues
7
I. Introduction Mobile phone use is ubiquitous in America: 95% of Americans own a cell phone and more than three-quarters own a smartphone.16 Smartphones are as important to consumers as they are ubiquitous: Consumers use their smartphones to research health conditions, do their banking, look for information about jobs and government services, take classes, submit applications, and buy a host of products.17 Many consumers now rely primarily on their smartphones for Internet access.18 Adults younger than 30, those with lower incomes and educational attainment, and non-whites are particularly likely to go online primarily by phone.19
As consumers’ tool of choice to store and transmit sensitive information, mobile devices are obvious targets for attack. With a compromised smartphone, an attacker could steal sensitive user data,20 freeze the device until a ransom is paid,21 or be part of a denial-of-service attack on another target.22 Threats are escalating: A March 2017 security report describes an “all-time high in mobile device infections,”23 and several other recent studies have similarly found a significant increase in attacks on mobile devices.24
Survey research data shows that Americans trust their mobile device manufacturer to protect their data more than they trust their credit card companies, email providers, retailers, the government, or 16 PEW MOBILE FACT SHEET, supra note 1.
17 See, e.g., PEW RESEARCH CENTER, U.S. SMARTPHONE USE IN 2015, 5 (Apr. 1, 2015), http://www.pewinternet.org/files/2015/03/PI_Smartphones_0401151.pdf [hereinafter PEW SMARTPHONE USE].
18 PEW MOBILE FACT SHEET, supra note 1.
19 Id.; PEW SMARTPHONE USE, supra note 17 at 17.
20 Robin Sidel, Mobile Bank Heist: Hackers Target Your Phone, WALL ST. J., Aug. 26, 2016, https://www.wsj.com/articles/mobile-bank-heist-hackers-target-your-phone-1472119200.
21 Allen St. John, Smartphone Ransomware Is a Looming Threat, CONSUMER REPORTS, Jan. 24, 2017, http://www.consumerreports.org/digital-security/smartphone-ransomware-a-looming-threat/.
22 Ryan Knutson, The Night Zombie Smartphones Took Down 911, WALL ST. J., Mar. 3, 2017, https://www.wsj.com/articles/how-a-cyberattack-overwhelmed-the-911-system-1488554972.
23 Press Release, Nokia, Nokia Malware Report Reveals New All-Time High in Mobile Device Infections and Major IoT Device Security Vulnerabilities (Mar. 27, 2017), https://www.nokia.com/en_int/news/releases/2017/03/27/nokia-malware-report-reveals-new-all-time-high-in-mobile-device-infections-and-major-iot-device-security-vulnerabilities [hereinafter Nokia Report Press Release].
24 See, e.g., MCAFEE, TROJANS, GHOSTS, AND MORE MEAN BUMPS AHEAD FOR MOBILE AND CONNECTED THINGS: WHAT LIES AHEAD FOR 2017, 2 (Feb. 2017), https://www.mcafee.com/us/resources/reports/rp-mobile-threat-report-2017.pdf.
Mobile Security Updates: Understanding the Issues
8
social media sites.25 Security researchers, however, have raised questions about whether this high level of trust is consistent with the security support manufacturers actually provide. Specifically, researchers have reported in recent years that many mobile devices have not received operating system software updates to patch known vulnerabilities. For example, in a 2015 study, researchers at the University of Cambridge found that nearly 88% of Android devices had at least one of 11 known critical vulnerabilities.26
One event, in July 2015, focused attention on the harm that could result from slow security patching. At the Black Hat security conference in Las Vegas, security researcher Joshua Drake announced the discovery of a number of “Stagefright” vulnerabilities—critical vulnerabilities that put 950 million Android devices at risk of infection by text message-transmitted malware. Following the event, many observers expressed concern that industry patching practices impeded adequate responses to serious threats.27
Stagefright became a seminal moment for the industry. In response, Android operating system developer Google, Inc. and a number of Android device manufacturers made highly publicized changes to their security practices to improve patching speed and regularity.28 Despite improvements, security researchers and industry observers have continued to report security update gaps. For example, in mid-2016, a security research firm published data analysis indicating that only 17% of Android phones were operating with the latest security patch, and about a third had 24 critical vulnerabilities.29 In mid-2017,
25 AMERICANS & CYBERSECURITY, supra note 6 at 3. This survey also reports that more Americans trust their carriers than their email providers, retailers, government, or social media. See id.
26 Thomas et al., Security Metrics for the Android Ecosystem, 2015 PROCS. OF THE 5TH ANN. ACM CCS WORKSHOP ON SECURITY & PRIVACY IN SMARTPHONES & MOBILE DEVICES 87, https://www.cl.cam.ac.uk/~drt24/papers/spsm-scoring.pdf.
27 See, e.g., Thomas Fox-Brewster, Stagefright: It Only Takes One Text To Hack 950 Million Android Phones, FORBES, July 27, 2015, http://www.forbes.com/sites/thomasbrewster/2015/07/27/android-text-attacks/#39649574715c.
28 See, e.g., Russell Brandom, How the Stagefright Bug Changed Android Security, THE VERGE, Aug. 5, 2015, http://www.theverge.com/2015/8/5/9099627/google-stagefright-android-vulnerability-protect-patch. Some of these initiatives are described in Part III of this Report.
29 Olabode Anise, Thirty Percent of Android Devices Susceptible to 24 Critical Vulnerabilities, DUO LABS SECURITY BLOG (June 28, 2016), https://duo.com/blog/thirty-percent-of-android-devices-susceptible-to-24-critical-vulnerabilities. In its Android Security 2016 Year in Review report, Google reported that by the end of 2016, “over half” of the top 50 Android devices worldwide had a recent security patch. See ANDROID SECURITY 2016 YEAR IN REVIEW, GOOGLE, 5 (Mar. 2017), https://source.android.com/security/reports/Google_Android_Security_2016_Report_Final.pdf [hereinafter “2016 ANDROID SECURITY REPORT”]. The 2017 Android report is not yet available.
Mobile Security Updates: Understanding the Issues
9
technology press reported that only 7% of devices with Google Play installed were running the latest version of Android, which has the most up-to-date security protections.30
In May 2016, the Commission issued identical Orders to eight device manufacturers to gather information about their security update processes and practices since August 1, 2013.31 This report makes findings and recommendations about mobile operating systems patching based on the narrative responses, data, and communications that the manufacturers submitted. The report also reflects information gathered through follow-up communications, from publicly available sources, and from responses to a parallel inquiry by the FCC into mobile carriers’ security update practices.32
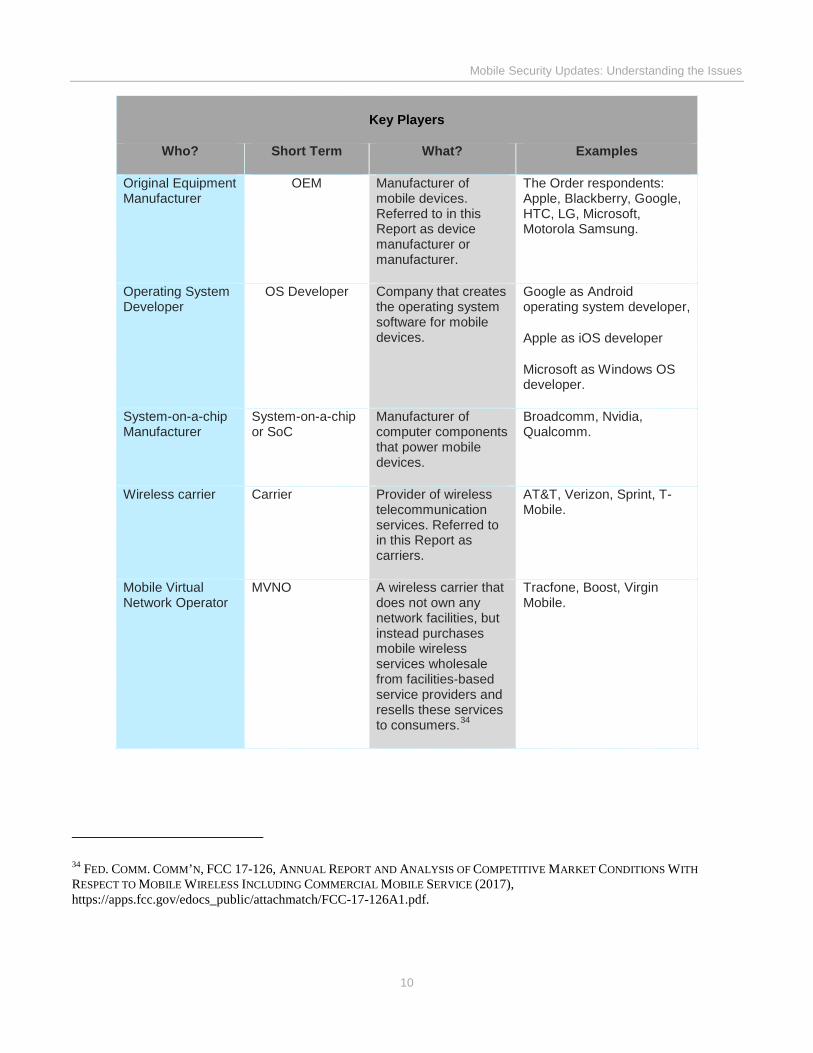
Importantly, device manufacturers do not find security flaws and issue security updates in isolation. Rather, a host of players—system-on-a-chip manufacturers, operating system developers, application (“app”) developers, other third-party software developers, carriers, and security researchers—may be involved in pinpointing security vulnerabilities, developing patches, customizing those patches for particular devices and carriers, testing the patches, deploying the updates, and notifying consumers.
Depending on the severity of the vulnerability, the number of parties involved, and their contractual relationships and norms, patching a device may take a few weeks or many months or years. A device may receive security updates every month, a few times a year, once a year, or not at all. Some devices receive regular updates for three years or longer while other devices do not receive any updates after a few months.33
30 Paul Wagenseil, Here’s Which Android Phones Get Regular Security Updates, TOM’S GUIDE, June 2, 2017, https://www.tomsguide.com/us/android-security-update-list,news-25221.html (“Phones that install the latest security updates are a small but growing minority in the Android world.”)
31 FTC Press Release, supra note 11.
32 See FCC Press Release, supra note 14.
33 See infra Part IV.A.2 (describing respondents’ update practices).
Mobile Security Updates: Understanding the Issues
10
Key Players
Who? Short Term What? Examples
Original Equipment Manufacturer
OEM Manufacturer of mobile devices. Referred to in this Report as device manufacturer or manufacturer.
The Order respondents: Apple, Blackberry, Google, HTC, LG, Microsoft, Motorola Samsung.
Operating System Developer
OS Developer Company that creates the operating system software for mobile devices.
Google as Android operating system developer,
Apple as iOS developer
Microsoft as Windows OS developer.
System-on-a-chip Manufacturer
System-on-a-chip or SoC
Manufacturer of computer components that power mobile devices.
Broadcomm, Nvidia, Qualcomm.
Wireless carrier Carrier Provider of wireless telecommunication services. Referred to in this Report as carriers.
AT&T, Verizon, Sprint, T-Mobile.
Mobile Virtual Network Operator
MVNO A wireless carrier that does not own any network facilities, but instead purchases mobile wireless services wholesale from facilities-based service providers and resells these services to consumers.34
Tracfone, Boost, Virgin Mobile.
34 FED. COMM. COMM’N, FCC 17-126, ANNUAL REPORT AND ANALYSIS OF COMPETITIVE MARKET CONDITIONS WITH RESPECT TO MOBILE WIRELESS INCLUDING COMMERCIAL MOBILE SERVICE (2017), https://apps.fcc.gov/edocs_public/attachmatch/FCC-17-126A1.pdf.
Mobile Security Updates: Understanding the Issues
11
A. The Commission’s Past Efforts to Improve Mobile Device Security and Security Update Practices
The FTC is an independent agency charged with protecting consumers and promoting competition. As part of its consumer protection mandate, the FTC enforces a wide range of laws to protect the privacy and security of consumer data, including the FTC Act, which prohibits “unfair” and “deceptive” acts or practices in or affecting commerce.35 Using its enforcement tools, the FTC has brought over 500 privacy and security-related cases.36
Through enforcement, policy, and education initiatives, the Commission has addressed an array of privacy and security issues presented by the explosive growth of mobile technology. For example, the Commission brought enforcement actions against a mobile device manufacturer,37 mobile app developers,38 and mobile advertising networks.39 The Commission hosted a public forum on mobile security issues, in which security researchers, academics and industry representatives discussed threats to mobile devices, mobile security challenges, and consumer behaviors regarding mobile security.40 The
35 15 U.S.C. § 45(a). The FTC also enforces statutes that protect certain health, credit, financial, and children’s information, and has issued regulations implementing each of these statutes. See, e.g., Health Breach Notification Rule, 16 C.F.R. Part 318 (health information breach notification); Fair Credit Reporting Act, 15 U.S.C. § 1681 et seq. and 16 C.F.R. Part 600 (consumer reporting information security and privacy); Gramm-Leach-Bliley Act Safeguards Rule, 16 C.F.R. Part 314 (financial information security); Children’s Online Privacy Protection Act of 1998, 15 U.S.C. § 6501 et seq. and 16 C.F.R. Part 412 (children’s online information security and privacy).
36 Thomas B. Pahl, BCP Acting Dir., Fed. Trade Comm’n, Remarks at ABA/FCBA Privacy and Data Security Symposium (Mar. 21, 2017), https://www.ftc.gov/system/files/documents/public_statements/1225563/pahl_-_aba_fcba_speech_3-21-17.pdf.
37 HTC America, Inc., No. C-4406 (F.T.C. June 25, 2013), https://www.ftc.gov/sites/default/files/documents/cases/2013/07/130702htcdo.pdf (Decision and Order).
38 Fed. Trade Comm’n v. Equiliv Investments, No. 2:2015 cv 04379 (D.N.J. June 24, 2015), https://www.ftc.gov/system/files/documents/cases/150625equilivstip.pdf (Stipulated Order); General Workings Inc., No. C-4573 (F.T.C. Apr. 18, 2016), https://www.ftc.gov/system/files/documents/cases/1604vulcundo.pdf (Decision and Order).
39 Turn, Inc., No. C-4612 (F.T.C. Apr. 6, 2017), https://www.ftc.gov/system/files/documents/cases/152_3099_c4612_turn_decision_and_order.pdf (Decision and Order); United States. v. InMobi Pte Ltd., No. 3:16-cv-3474 (N.D. Cal. June 22, 2016), https://www.ftc.gov/system/files/documents/cases/160622inmobistip.pdf (Stipulated Order).
40 Press Release, Fed. Trade Comm’n, FTC Announces Mobile Security Forum: Potential Threats & Solutions (May 24, 2013), https://www.ftc.gov/news-events/press-releases/2013/05/ftc-announces-agenda-panelists-upcoming-mobile-security-forum [hereinafter Forum Press Release]. The forum convened four panels that included security researchers, academics and industry representatives who discussed threats to mobile devices, mobile-specific security challenges, efforts to secure devices, the role of each player in the complex mobile ecosystem with respect to security, and consumer behaviors regarding mobile security. Several participants described formidable obstacles to patching mobile devices: the complexity of the mobile ecosystem and diffuseness of responsibility for patching. After the forum, the Commission sought further comment on a number of topics discussed in the forum, including security updates. Press Release, Fed. Trade Comm’n, FTC Invites Further
Mobile Security Updates: Understanding the Issues
12
FTC has testified before Congress about consumer privacy in the mobile marketplace41 and on mobile devices.42 Building on lessons from enforcement actions and workshops, the Commission has issued guidance and tools for mobile app developers.43
The Commission has consistently emphasized that reasonable security requires secure product design and maintenance of security through timely and effective software patching. For example, in 2013, the Commission entered into a consent order with mobile device manufacturer HTC America that settled allegations that HTC had put the sensitive information of millions of consumers at risk by introducing security vulnerabilities in the design of its phones.44 As part of the settlement, HTC agreed to implement and maintain a comprehensive security program; to undergo independent security audits; and to develop, release, and notify consumers about software patches to fix the specific vulnerabilities identified during the investigation.45
Similarly, in 2016, the Commission settled two complaints alleging that a router manufacturer (ASUS) and software manufacturer (Oracle) had engaged in unfair and/or deceptive practices related to their security update programs.46 The Commission’s complaint against ASUS alleged that the company
Public Comment on Mobile Security (Apr. 17, 2014), https://www.ftc.gov/news-events/press-releases/2014/04/ftc-invites-further-public-comment-mobile-security.
41 Consumer Privacy and Protection in the Mobile Marketplace: Hearing Before the S. Comm. on Commerce, Sci. & Transp., 112th Cong. 10-19 (2011) (prepared statement of the FTC), https://www.ftc.gov/sites/default/files/documents/public_statements/prepared-statement-federal-trade-commission-consumer-privacy-and-protection-mobile-marketplace/110519mobilemarketplace.pdf.
42 Protecting Mobile Privacy: Your Smartphones, Tablets & Your Privacy: Hearing Before the S. Comm. on the Judiciary, Subcomm. for Privacy, Tech. & the Law, 112th Cong. 53-65 (2011) (prepared statement of the FTC), https://www.ftc.gov/sites/default/files/documents/public_statements/prepared-statement-federal-trade-commission-protecting-mobile-privacy-your-smartphones-tablets-cell/110510mobileprivacysenate.pdf.
43 FED. TRADE COMM’N, APP DEVELOPERS: START WITH SECURITY (May 2017), https://www.ftc.gov/tips-advice/business-center/guidance/app-developers-start-security; FED. TRADE COMM’N, MOBILE HEALTH APPS INTERACTIVE TOOL (Apr. 2016), https://www.ftc.gov/tips-advice/business-center/guidance/mobile-health-apps-interactive-tool.
44 HTC America, Inc. (Decision and Order), supra note 37; Complaint at 2-8, HTC America, Inc., FTC File No. 1223049 (F.T.C. filed June 25, 2013), https://www.ftc.gov/sites/default/files/documents/cases/2013/07/130702htccmpt.pdf.
45 HTC America, Inc. (Decision and Order), supra note 37 at 3-5.
46 Press Release, Fed. Trade Comm’n, ASUS Settles FTC Charges That Insecure Home Routers and “Cloud” Services Put Consumers’ Privacy At Risk (Feb. 23, 2016), https://www.ftc.gov/news-events/press-releases/2016/02/asus-settles-ftc-charges-insecure-home-routers-cloud-services-put; Lesley Fair, ASUS Case Suggests 6 Things to Watch For in the Internet of Things, FTC BUSINESS BLOG (Feb. 23, 2016, 12:15 PM), https://www.ftc.gov/news-events/blogs/business-blog/2016/02/asus-case-suggests-6-things-watch-internet-things; Press Release, Fed. Trade Comm’n, Oracle Agrees to Settle FTC Charges It Deceived Consumers About Java Software Updates (Dec. 21, 2015), https://www.ftc.gov/news-events/press-releases/2015/12/oracle-agrees-settle-ftc-charges-it-deceived-consumers-about-java; Lesley Fair, Oracle Java SE Case
Mobile Security Updates: Understanding the Issues
13
unfairly failed to give consumers adequate notice of security vulnerabilities and related updates,47 and the complaint against Oracle alleged that the company unfairly failed to disclose material information about the effect of its security updates.48 The Commission’s consent order with ASUS required the company to notify consumers, clearly and conspicuously, when a software update is available and to explain to them how to install the update and the risks associated with declining it.49 The consent order with Oracle similarly required the company to make clear and conspicuous disclosures of certain security update-related information.50
Emphasizing the importance of patching has also been central to the Commission’s recent policy work on security. For example, in 2015, FTC staff issued a report on the Internet of Things (“IoT”) that, among other things, detailed challenges to updating devices, such as hardware limitations, lack of consumer awareness, and potential economic incentives to focus on manufacture rather than support.51 In 2016, Commission staff filed a comment with the National Telecommunications and Information Administration (“NTIA”) that recommended best practices for IoT manufacturers, such as informing consumers, when feasible, of the security support period.52 In 2017, the Commission submitted another comment to NTIA that recommended, among other things, that IoT device manufacturers tell consumers before purchase what security support they can expect.53 Most recently, the Commission announced an
Serves Up a Cuppa Caution, FTC BUSINESS BLOG (Dec. 21, 2015, 11:37 AM), https://www.ftc.gov/news-events/blogs/business-blog/2015/12/oracle-java-se-case-serves-cuppa-caution.
47 Complaint at 3-7, ASUSTeK Computer, Inc., F.T.C. File No. 1423156 (F.T.C. filed July 18, 2016), https://www.ftc.gov/system/files/documents/cases/1607asustekcmpt.pdf.
48 Complaint at 2-4, Oracle Corp., F.T.C. File No. 1323115 (F.T.C. filed Mar. 28, 2016), https://www.ftc.gov/system/files/documents/cases/160329oraclecmpt.pdf.
49 The order further provided that notice must be provided through at least several means, including by website posting and user interface (if feasible); by direct notice to registered consumers by email, text message, push notification or similar method; and by informing any consumer who contacted the company. ASUSTeK Computer, Inc., No. C-4587, 6-7 (F.T.C. July 18, 2016), https://www.ftc.gov/system/files/documents/cases/1607asustekdo.pdf (Decision and Order).
50 Oracle Corp., No. C-4571 (F.T.C. Mar. 28, 2016), https://www.ftc.gov/system/files/documents/cases/160329oracledo.pdf (Decision and Order).
51 See FTC STAFF REPORT, INTERNET OF THINGS: PRIVACY & SECURITY IN A CONNECTED WORLD, FED. TRADE COMM’N (Jan. 2015), https://www.ftc.gov/system/files/documents/reports/federal-trade-commission-staff-report-november-2013-workshop-entitled-internet-things-privacy/150127iotrpt.pdf.
52 See Comments from the Staff of the Fed. Trade Comm’n to Dep’t of Commerce, Nat’l Telecomm. & Info. Admin. on The Benefits, Challenges, and Potential Roles for the Government in Fostering the Advancement of the Internet of Things, No. 160331306-6306-01 (June 2, 2016), https://www.ftc.gov/system/files/documents/advocacy_documents/comment-staff-bureau-consumer-protection-office-policy-planning-national-telecommunications/160603ntiacomment.pdf.
53 Comment from Fed. Trade Comm’n to Dep’t of Commerce, Nat’l Telecomm. & Info. Admin. on Communicating IoT Device Security Update Capability to Improve Transparency for Consumers, No. P175410 (June 19, 2017),
https://www.ftc.gov/news-events/blogs/business-blog/2015/12/oracle-java-se-case-serves-cuppa-caution
Mobile Security Updates: Understanding the Issues
14
“IoT Home Inspector Challenge,” a public competition aimed at creating security update-related IoT tools.54 In July 2017, the Commission announced a winner of the competition, whose “IoT Watchdog” app would flag devices with out-of-date software and provide update instructions.55
Finally, the Commission’s education efforts have highlighted the role of security updates in a reasonable security program. For example, the Commission’s business education guide, “Start with Security,” advises companies to implement a process for regularly updating software.56 Similarly, the Commission’s “Careful Connections” guidance, geared towards IoT device manufacturers, advises companies to consider in advance how they will update devices and notify customers of available updates.57
B. Mobile Security Study In May 2016, the FTC and the FCC, which have related responsibilities in protecting the online
privacy of American consumers,58 initiated separate studies of mobile security practices.59 The FTC issued identical Orders to eight mobile device manufacturers who use (or have used) four different operating systems, requiring them to provide information related to their processes and practices for
https://www.ftc.gov/system/files/documents/advocacy_documents/ftc-comment-national-telecommunications-information-administration-communicating-iot-device-security/170619ntiaiotcomment.pdf [NTIA Comment on IoT Device Security Update Capability].
54 See FTC Notice of IoT Home Inspector Challenge, 82 Fed. Reg. 840-2, 840-41 (Jan. 4, 2017), https://www.ftc.gov/system/files/documents/federal_register_notices/2017/01/iot_frn_pub_010417_-_2016-31731.pdf.
55 Press Release, Fed. Trade Comm’n, FTC Announces Winner of its Internet of Things Home Device Security Contest (July 26, 2017), https://www.ftc.gov/news-events/press-releases/2017/07/ftc-announces-winner-its-internet-things-home-device-security.
56 See START WITH SECURITY, supra note 15 at 12 (“Outdated software undermines security. The solution is to update it regularly . . . . [H]aving a reasonable process in place to update and patch third party software is an important step to reducing the risk of a compromise.”); see also Thomas B. Pahl, Stick With Security, FTC BUSINESS BLOG (Sept. 22, 2017, 11:32 AM), https://www.ftc.gov/news-events/blogs/business-blog/2017/09/stick-security-put-procedures-place-keep-your-security.
57 FED. TRADE COMM’N, CAREFUL CONNECTIONS: BUILDING SECURITY IN THE INTERNET OF THINGS, 6 (Jan. 2015), https://www.ftc.gov/system/files/documents/plain-language/pdf0199-carefulconnections-buildingsecurityinternetofthings.pdf (advising IoT manufacturers to consider the following questions: “How will you provide updates for products that are already out there? Will you offer them for free? Will updates happen automatically?”).
58 Press Release, Fed. Trade Comm’n, Joint Statement of Acting FTC Chairman Maureen K. Ohlhausen and FCC Chairman Ajit Pai on Protecting Americans’ Online Privacy (Mar. 1, 2017), https://www.ftc.gov/news-events/press-releases/2017/03/joint-statement-acting-ftc-chairman-maureen-k-ohlhausen-fcc.
59 FTC Press Release, supra note 11; FCC Press Release, supra note 14.
Mobile Security Updates: Understanding the Issues
15
issuing security updates to address vulnerabilities in smartphones, tablets, and other mobile devices. 60 The FCC issued letters to mobile carriers asking questions about their processes for reviewing and releasing security updates for mobile devices.61 The FCC subsequently decided not to issue its own report, instead deferring to the FTC’s expertise in protecting consumer privacy. The FCC shared with the FTC all material obtained from the carriers in response to its inquiries.62 Appendix A is a copy of the text of the Orders that the Commission issued to the companies. Appendix B is a copy of the text of the letters that the FCC issued to wireless carriers.
The eight companies to whom the FTC sent its Orders are as follows:
1. Apple, Inc.: Apple offers smartphones and tablets running its iOS operating system and provides software updates directly to Apple devices, regardless of carrier. Although Apple is also an operating system developer, the Order focused on Apple’s role as a device manufacturer.
2. Google, Inc.: Google offers “Nexus”- and “Pixel”-branded smartphones and tablets that use Google’s Android operating system. Google collaborates with other manufacturers to produce these devices, but it controls the software and updates for them. After discovery of the Stagefright vulnerabilities in mid-2015, Google, as developer of the Android operating system, announced that it would provide monthly Android security bulletins. Although several other respondents use versions of Google’s Android operating system in their devices, the Order issued to Google was identical to that issued to other respondents: It focused on Google as the manufacturer for Nexus and Pixel devices rather than on Google as Android operating system developer.
3. Motorola Mobility, LLC: Motorola offers smartphones and tablets running the Android operating system. Motorola now offers many of its devices directly to consumers rather than through carriers (i.e., the devices are “unlocked” from any specific carrier network so that consumers can select any carrier’s service or use WiFi only).
60 In addition, the Orders requested that respondents identify the factors each company considers in deciding whether to patch a vulnerability on a particular mobile device; provide detailed data on the specific mobile devices they have offered for sale to consumers since August 2013; name the vulnerabilities that have affected those devices; and state whether and when the company patched such vulnerabilities. See Appendix A, Model Order to File Special Report, FTC No. P165402, FED. TRADE COMM’N (May 6, 2016), https://www.ftc.gov/system/files/attachments/press-releases/ftc-study-mobile-device-industrys-security-update-practices/160509mobilesecuritymodelorder.pdf. 61 Appendix B, Model Letter to Common Carriers, FED. COMM. COMM’N (May 9, 2016), https://apps.fcc.gov/edocs_public/attachmatch/DOC-339256A2.pdf.
62 See 47 CFR § 0.442. The carriers confirmed in their submissions to the FCC that they did not oppose such disclosures.
Mobile Security Updates: Understanding the Issues
16
4. Samsung Electronics America, Inc.: Samsung is the largest Android device manufacturer.63 The company also offers devices running Microsoft’s Windows operating system. Samsung devices are available through a number of carrier partnerships.
5. Microsoft Corporation: Microsoft offers smartphones and tablets running its Windows operating system. Several Order respondents (Samsung, LG, HTC) use the Windows operating system, but, as with Google, the Order issued to Microsoft focuses on its role as a device manufacturer.
6. LG Electronics USA, Inc.: The second largest Android device manufacturer, LG offers smartphones and tablets running the Android operating system and smartphones running Microsoft’s Windows operating system.
7. HTC America, Inc.: HTC offers smartphones and tablets running the Android operating system and smartphones running Microsoft’s Windows operating system.
8. Blackberry Corporation: Blackberry has offered smartphones and tablets running its Blackberry 10 operating system. Currently, it offers smartphones using the Android operating system. As with Apple, Google, and Microsoft, the Order focused on Blackberry’s role as device manufacturer rather than as operating system developer.
The Commission selected these device manufacturers for several reasons. First, their offerings represent a significant percentage of the devices in the U.S. market. Second, they use or have used the most common operating systems: Google’s Android, Apple’s iOS, Microsoft’s Windows, and Blackberry OS.64 Third, these device manufacturers are known to have differing update practices; deploying updates, for example, in different ways (e.g., directly versus through carriers) and at different speeds.
Sections 6(f) and 21(d) of the FTC Act authorize the publication of reports derived from information obtained pursuant to that authority in anonymized or aggregated form as long as no such information discloses any trade secret or any commercial or financial information which is obtained from any person and which is privileged or confidential.65 Reports issued pursuant to Section 6(b) of the
63 Press Release, Gartner, Inc., Gartner Says Worldwide Sales of Smartphones Grew 9 Percent in First Quarter of 2017 (May 23, 2017), http://www.gartner.com/newsroom/id/3725117.
64 Press Release, IDC Research, Inc., Smartphone OS Market Share, 2017 Q1, http://www.idc.com/prodserv/smartphone-os-market-share.jsp (last visited Feb. 22, 2018).
65 15 U.S.C. §§ 46(f), 57b-2.
Mobile Security Updates: Understanding the Issues
17
FTC Act are intended to describe general trends and issues affecting an industry.66 This report does not identify the practices of individual device manufacturers or carriers unless such information is publicly available.
This report focuses on operating system vulnerability patching, because, as described above, security researchers have raised concerns that mobile devices are not receiving operating system patches needed to defend against attack. Despite this report’s singular focus, it is important to recognize that operating system patching is only one element of reasonable device security. Other layers of the smartphone stack (comprised of the device, the operating system, apps, and the network) are also vulnerable to attack and require periodic security patches.67 Similarly, patching is only one aspect of security; as the FTC’s “Start with Security” guidance explains, secure product design is another indispensable element of a reasonable security program.68
Part II of this report explains what threatens the security of mobile devices, how security updates mitigate those threats, and how the complexities of the mobile ecosystem impact that process. Part III describes the often-complex process for patching vulnerabilities. Part IV addresses security update practices, making observations about support length, update frequency, patch rate, and uptake based primarily on the data provided by the device manufacturers. Part V describes the types of information about security updates that are available to consumers. Finally, Part VI summarizes our findings and makes recommendations for industry best practices and consumer education.
II. Securing Mobile Devices This Part relies primarily on publicly available information to describe the threats to the security
of consumers’ mobile devices and the often-sensitive information they contain and transmit. It then
66 The FTC has issued Section 6(b) reports on a wide variety of other consumer protection topics, such as data brokers and patent assertion entities. See, e.g., Press Release, Fed. Trade Comm’n, FTC Recommends Congress Require the Data Broker Industry to be More Transparent and Give Consumers Greater Control Over Their Personal Information (May 27, 2014), https://www.ftc.gov/news-events/press-releases/2014/05/ftc-recommends-congress-require-data-broker-industry-be-more; Press Release, Fed. Trade Comm’n, FTC Report Sheds New Light on How Patent Assertion Entities Operate; Recommends Patent Litigation Reforms (Oct. 6, 2016), https://www.ftc.gov/system/files/documents/reports/patent-assertion-entity-activity-ftc-study/p131203_patent_assertion_entity_activity_an_ftc_study_0.pdf.
67 For example, in January 2018, security researchers announced the discovery of two vulnerabilities, Spectre and Meltdown, that affect the microprocessors of nearly all computers, including those in mobile devices. See Sam Schechner & Stu Woo, Tech Giants Race to Address Chip Flaws With a Potentially Vast Impact, WALL ST. J., Jan. 4, 2018, https://www.wsj.com/articles/tech-giants-race-to-address-widespread-chip-flaws-1515070427 (describing scope of the problem and enormous challenges to remediation).
68 As the FTC advised in START WITH SECURITY, companies should “[a]pply sound security practices when developing new products.” Supra note 15 at 9.
Mobile Security Updates: Understanding the Issues
18
describes how security updates mitigate these threats and how certain aspects of the mobile ecosystem complicate the patching process.
A. Mobile Malware: Risk and Harm Among internet-connected devices, mobile devices have unique security challenges because consumers use them to access diverse content, services, and networks, and because mobile apps, in turn, often access a broad range of device data and functionality.69 Anyone can create a website for a consumer to visit, and app stores exercise varying levels of control70 over the millions of developers that publish apps.71 Moreover, websites and apps increasingly embed code from third-party providers to provide services (like advertising) and those third parties may then connect to dozens of other companies to solicit bids for an ad impression.72 Each point of connection creates another opportunity for a bad actor to exploit operating system vulnerabilities to execute malicious code, sometimes without any user interaction at all.73
As more consumers use mobile devices as their primary mode of computing,74 bad actors are increasingly targeting mobile devices. Specifically, although the likelihood of attack remains relatively low (about 1.35%75), the risk is increasing dramatically—rising 400%, for example, in 2016.76 One 69 See, e.g., Paul Ruggiero & Jon Foote, CYBER THREATS TO MOBILE PHONES, US-CERT, 2011, https://www.us-cert.gov/sites/default/files/publications/cyber_threats-to_mobile_phones.pdf (comparing risk profile of mobile devices to PCs). Cf. Goldenshores Tech., No. C-4446 (F.T.C. Mar. 31, 2014), https://www.ftc.gov/system/files/documents/cases/140409goldenshoresdo.pdf (Decision and Order) (settling allegations that Android app developer deceived consumers about the extent to which its flashlight app accessed sensitive device data). 70 Compare Google Play Developer Distribution Agreement, GOOGLE (May 17, 2017), https://play.google.com/about/developer-distribution-agreement.html with Apple App Store Guidelines, APPLE, https://developer.apple.com/app-store/guidelines/ (last visited Feb. 12, 2018) and App Distribution Agreement, AMAZON (Jan. 1, 2018), https://developer.amazon.com/public/support/legal/da.
71 Artyom Dogtiev, Mobile App Developer Statistics Roundup, BUSINESS OF APPS, Jan. 20, 2016, http://www.businessofapps.com/mobile-app-developer-statistics-roundup/.
72 Everything You Need To Know About Real Time Bidding For Display Ads, MARKETING LAND, May 8, 2014, http://marketingland.com/infographic-real-time-bidding-83186.
73 See generally Blue Coat Systems 2014 Mobile Malware Report: A New Look at Old Threats, BLUE COATS SYSTEMS, INC. (2014), https://media.scmagazine.com/documents/64/report-mobilemalware-fn_15880.pdf (summarizing threats); see also Chris Mills, How To Patch Your Devices Against the KRACK Wi-Fi Vulnerability Right Now, BGR, Oct. 16, 2017, http://bgr.com/2017/10/16/krack-wi-fi-wpa2-patches-available-android-ios-windows/ (internal citation omitted) (noting that “41% of Android devices are vulnerable to an ‘exceptionally devastating’ version of the attack, which allows [attackers] to insert fake websites into a network and collect sensitive information”).
74 PEW MOBILE FACT SHEET, supra note 1.
75 Nokia Report Press Release, supra note 23 (reporting infection rate as of October 2016).
Mobile Security Updates: Understanding the Issues
19
security report notes that while mobile malware used to be an afterthought for cyber criminals, researchers have seen a “dramatic” rise in both the number of mobile malware variants as well as the sophistication of the attacks.77 U.S. consumers are particularly attractive targets for mobile malware, because of worldwide familiarity with the English language and Americans’ relatively high wealth levels.78
Importantly, malware is not just an irritant; it can harm consumers in significant ways. For example, recent mobile ransomware attacks have extorted money—ranging from about $100-$300—from victims by holding photos, music, and other files hostage or by preventing users from accessing their devices or apps at all.79 Spyware and phishing applications have harvested financial information and passwords that enabled unauthorized access to consumers’ bank and credit card accounts, costing consumers thousands of dollars.80 Malware hidden in 200 recreational apps like style guides and children’s books (each of which had been downloaded between 500,000 and 1 million times) turned mobile devices into “backdoors” that allowed attackers to infiltrate any network connected to the device.81 Other malicious apps enrolled unwitting device owners in paid SMS subscription services that surreptitiously stole consumers’ money.82
76 Id.
77 See Bruce Snell, Mobile Threat Report: What’s on the Horizon for 2016, INTEL SECURITY, Mar. 1, 2016, https://securingtomorrow.mcafee.com/consumer/mobile-security/mobile-threats-report-whats-on-the-horizon-for-2016/ (follow “click here” link to access full report); see also Nokia Report Press Release, supra note 23; Michael Kan, Mobile Ransomware Use Jumps, Blocking Access to Phones, PC WORLD (June 30, 2016), http://www.pcworld.com/article/3090049/security/mobile-ransomware-use-jumps-blocking-access-to-phones.html.
78 John Snow, Ransomware on Mobile Devices: Knock-Knock-Block, KASPERSKY LAB DAILY BLOG (June 29, 2016), https://blog.kaspersky.com/mobile-ransomware-2016/12491/.
79 St. John, supra note 21 (reporting that ransomware transmitted through an app in the Google Play Store demanded the Bitcoin equivalent of about $180 in ransom); Doug Olenick, New Ransomware Demands Payments in iTunes, Targets Older Android Software, SC MAGAZINE, Apr. 26, 2016, https://www.scmagazine.com/new-ransomware-demands-payment-in-itunes-targets-older-android-software/article/528546/ (describing ransomware that demands $200 in iTunes gift cards).
80 Beware Downloading Some Apps or Risk ‘Being Spied On,’ CBS NEWS, Feb. 24, 2016, http://www.cbsnews.com/news/mobile-phone-apps-malware-risks-how-to-prevent-hacking-breach/ (reporting that hackers used malware in a slot machine game app to spend $5000 of victim’s money); Sidel, supra note 20 (describing malware used to steal banking credentials); Carlos Castillo, Android Banking Trojan Asks for Selfie With Your ID, MCAFEE, Oct. 13, 2016, https://securingtomorrow.mcafee.com/mcafee-labs/android-banking-trojan-asks-for-selfie-with-your-id/ (describing Android banking Trojan malware).
81 Bradley Barth, Got MilkyDoor? Android Malware Lets Attackers Infiltrate Your Phone's Connected Network, SC MEDIA, Apr. 21, 2017, https://www.scmagazine.com/got-milkydoor-android-malware-lets-attackers-infiltrate-your-phones-connected-network/article/652045/.
82 Swati Khandelwal, 300,000 Android Devices Infected by Premium SMS-Sending Malware, HACKER NEWS, Feb. 15, 2014, http://thehackernews.com/2014/02/android-Malware-subscription-premium-SMS-Services.html.
Mobile Security Updates: Understanding the Issues
20
Malware not only victimizes smartphone owners; it also turns mobile devices into weapons that target third parties, causing serious economic—and sometimes physical—harm. For example, a botnet of infected smartphones attacked 13 internet root name servers (servers that perform an authentication function necessary for websites to function), threatening the millions of businesses and critical infrastructure that rely on a stable internet.83 Another mobile botnet took down a website by issuing 4.5 billion page requests—showcasing the vulnerability of all websites to such attacks.84 In a different kind of attack, a flood of calls from compromised smartphones incapacitated 911 emergency call centers in twelve states, which may have prevented injured or endangered individuals from timely reaching emergency responder services.85
B. Mitigating the Threat: Patching in a Complex Ecosystem When designing mobile operating systems, developers attempt to anticipate vulnerabilities that attackers could exploit, but, in many cases, vulnerabilities are only discovered after the device’s public release.86 Developers mitigate discovered vulnerabilities by creating patches, software that overwrites the vulnerable code.87 Once the patch is incorporated into a software update, the new version of the device’s operating system includes the patched code.
Patching is essential to maintaining the security of software-based products,88 and security support can be a salient product attribute for security-conscious consumers. Successful and timely patching can also confer reputational benefits by providing evidence to consumers of a manufacturer’s
83 Anthony Cuthbertson, Massive DDoS Attack on Core Internet Servers Was ‘Zombie Army’ Botnet from Popular Smartphone App, INT’L BUSINESS TIMES, Dec. 11, 2015, http://www.ibtimes.co.uk/john-mcafee-massive-ddos-attack-internet-was-smartphone-botnet-popular-app-1532993.
84 Robert Abel, DDoS Attack Sent 4.5 Billion Requests Using Mobile Browsers, SC MEDIA, Sept. 29, 2015, https://www.scmagazine.com/ddos-attack-used-mobile-devices-to-deliver-45-billion-requests/article/533674/.
85 Knutson, supra note 22.
86 Developers and security researchers constantly search for vulnerabilities, and identify dozens of new vulnerabilities on a monthly, if not weekly, basis. For example, Google reported that the company addressed 655 vulnerabilities in 2016, of which 133 were rated critical and 365 were rated high. See 2016 ANDROID SECURITY REPORT, supra note 29 at 31.
87 Software patching is a long-standing practice in computing: in its original form, the term “patching” was quite literal, as software patches for systems processing punch cards consisted of replacement paper segments to be taped into an older deck.
88 See, e.g., Kami Vaniea & Yasmeen Rashidi, Tales of Software Updates: The Process of Updating Software, 2016 PROCS. OF THE 34TH ANN. ACM CONFERENCE ON HUMAN FACTORS IN COMPUTING SYSTEMS, 1 (May 2016), https://vaniea.com/papers/chi2016.pdf (“As soon as a vulnerability becomes public knowledge, exploit rates jump by as much as 5 orders of magnitude . . . . Systems that are regularly updated have both smaller attack surfaces and less compromise attempts.”).
Mobile Security Updates: Understanding the Issues
21
ongoing investment in its product.89 But support comes with costs that will be passed onto the consumer, perhaps through higher device prices.90 Patching can also impose direct time and inconvenience costs on consumers, and some patches may change device functionality. Moreover, maintaining existing software may divert resources from development of valuable new products and may prolong consumer reliance on outmoded software.91 When considering a purchase, security-conscious consumers may compare the level of support for their current devices with the likelihood of better security for new devices. Device manufacturers are, therefore, constantly balancing the need to meet consumers’ expectations that existing products will remain useful and reasonably secure with the desire to devote resources to new product innovation and sales.
There are unique challenges to issuing timely operating system patches for mobile devices. First, whereas operating system developers usually have a direct line to consumers in the PC market, updating a mobile device may involve cooperation among a diverse set of participants, including the operating system developer, the system-on-a-chip manufacturer, the device manufacturer, the carrier, carrier partners, and third-party testing labs.
Second, one of the greatest strengths of the mobile ecosystem—the ability to customize the operating system for each device—further complicates the patching process, because each device-level customization requires a somewhat different patch. A manufacturer that licenses the customizable Android operating system may sell dozens of models running dozens of slightly different customizations of the operating system—all of which require slightly different applications of a single security patch.92
Third, the involvement of wireless carriers can contribute to the complexity of the patching process. Carriers often impose software update testing requirements and may ask manufacturers to modify the devices’ operating systems further to differentiate that model from other carriers’ versions. While carrier testing and carrier-specific devices can benefit consumers, they have the ancillary effect of further complicating the patching process.
89 Cf. Nick Wingfield, In Ransomware Attack, Where Does Microsoft’s Responsibility Lie?, N.Y. TIMES, May 15, 2017, https://www.nytimes.com/2017/05/15/technology/cyberattack-microsoft-software-responsibility.html (describing reputational incentives for software vendors like Microsoft to patch their operating systems).
90 Cf. Robert L. Scheier, Foiled! How to Beat Software Vendors’ Sneaky Price Increases, INFOWORLD, Jan. 13, 2014, http://www.infoworld.com/article/2609217/software-licensing/software-licensing-foiled-how-to-beat-software-vendors-sneaky-price-increases.html (describing how software support costs are passed onto businesses through licensing models).
91 Cf. Wingfield, note 89 (“Providing updates to older systems could make computers more insecure by removing an incentive for users to modernize . . . .”).
92 For example, LG’s website offers 136 smartphones. Smartphones, LG, http://www.lg.com/us/smartphones (last visited Feb. 12, 2018). Samsung offers 265 devices. All Phones, SAMSUNG, http://www.samsung.com/us/mobile/phones/all-phones/s/all_other_phones-galaxy_note-galaxy_s/_/n-10+11+hv1rp+zq1xc+zq1xb+zq1xa/ (last visited Feb. 12, 2018).
Mobile Security Updates: Understanding the Issues
22
All of this variation means that consumers can choose from a wide array of products, with more variation in price and features than non-customizable operating systems permit. This diversity, however, imposes certain support costs: Because the operating systems may vary at the device and carrier level, security updates too must be customized on a model-by-model and carrier-by-carrier basis. Indeed, at any given time, a manufacturer may be supporting dozens, or even hundreds, of models with slightly different operating systems and testing regimes. While some consumers may understand and value the tradeoffs between variety and support, others may not perceive the cost to security that this variety may impose. In addition, reduced security from delayed patching for devices in a network can expose other users of the network to an increased risk of harm.93
93 See, e.g., Robert W. Hahn & Anne Layne-Farrar, The Law and Economics of Software Security, 30 Harv. J.L. & Pub. Pol’y 283, 317 (2006) (explaining that “by securing net-works himself, a user closes off one entry route for would-be hackers, benefiting himself and others on the larger, interconnected network.”). See also Ginger Zhe Jin & Andrew Stivers, Protecting Consumers in Privacy and Data Security: A Perspective of Information Economics (May 22, 2017), https://ssrn.com/abstract=3006172 (describing potential market failures, including externalities).
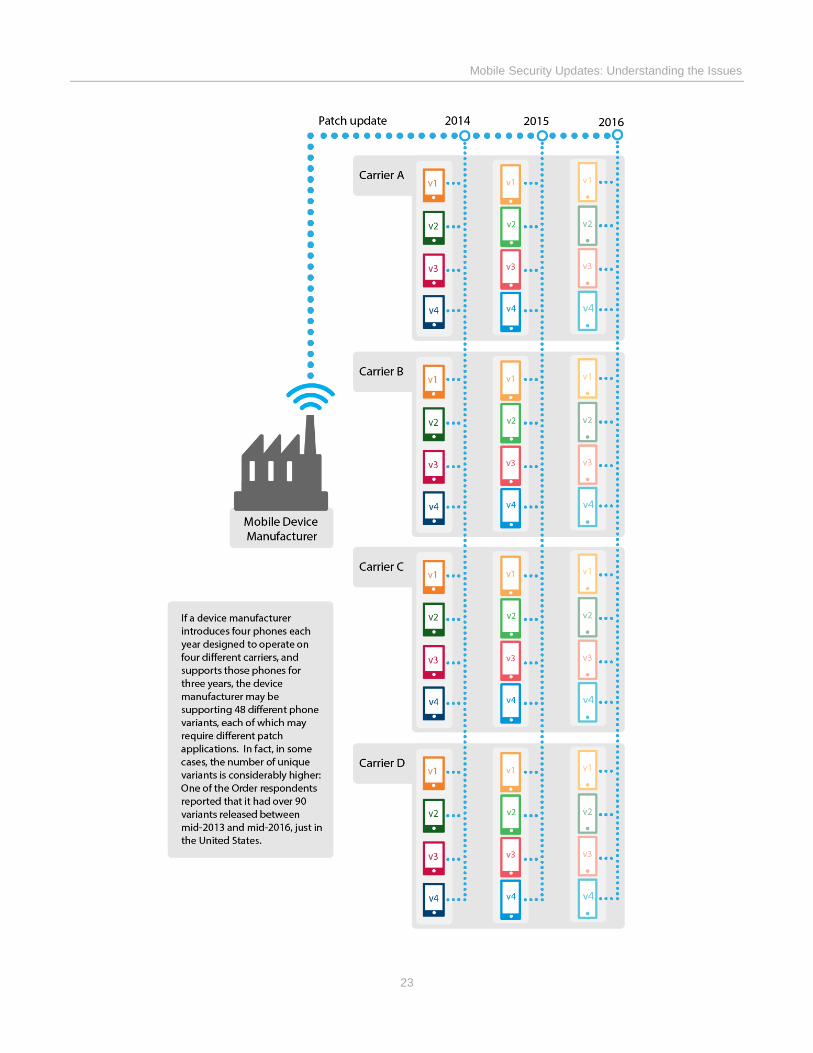
Mobile Security Updates: Understanding the Issues
23
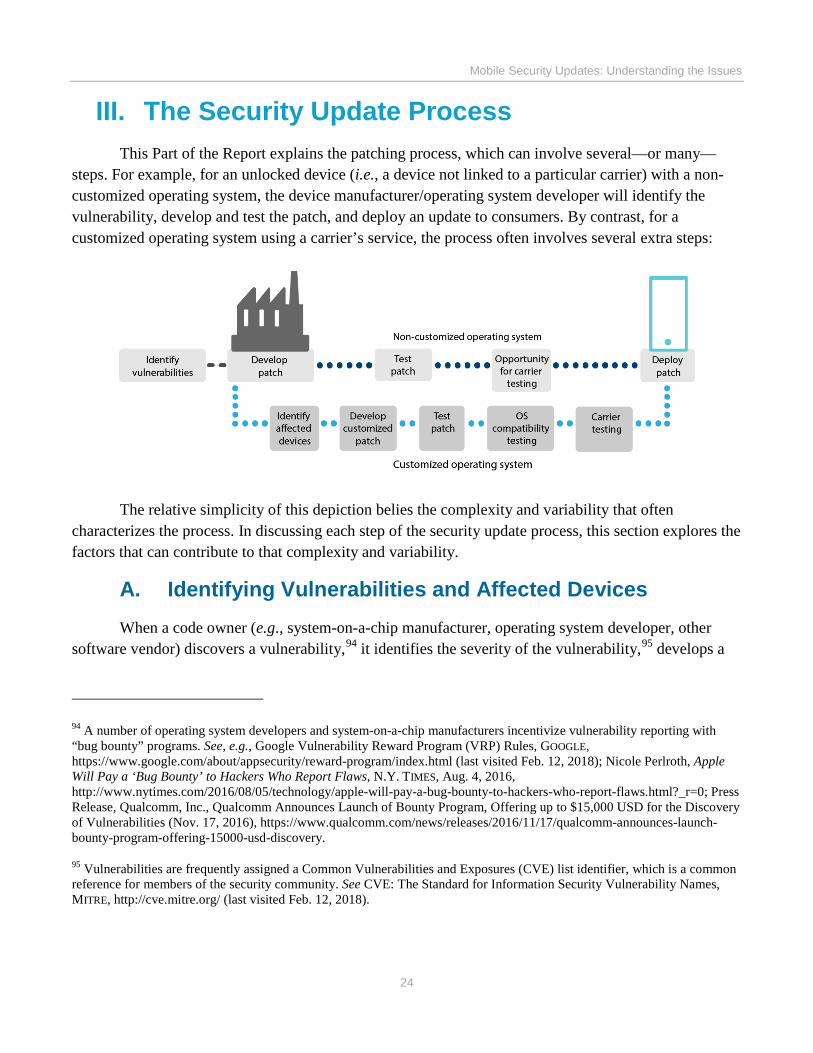
Mobile Security Updates: Understanding the Issues
24
III. The Security Update Process This Part of the Report explains the patching process, which can involve several—or many—
steps. For example, for an unlocked device (i.e., a device not linked to a particular carrier) with a non-customized operating system, the device manufacturer/operating system developer will identify the vulnerability, develop and test the patch, and deploy an update to consumers. By contrast, for a customized operating system using a carrier’s service, the process often involves several extra steps:
The relative simplicity of this depiction belies the complexity and variability that often characterizes the process. In discussing each step of the security update process, this section explores the factors that can contribute to that complexity and variability.
A. Identifying Vulnerabilities and Affected Devices When a code owner (e.g., system-on-a-chip manufacturer, operating system developer, other software vendor) discovers a vulnerability,94 it identifies the severity of the vulnerability,95 develops a
94 A number of operating system developers and system-on-a-chip manufacturers incentivize vulnerability reporting with “bug bounty” programs. See, e.g., Google Vulnerability Reward Program (VRP) Rules, GOOGLE, https://www.google.com/about/appsecurity/reward-program/index.html (last visited Feb. 12, 2018); Nicole Perlroth, Apple Will Pay a ‘Bug Bounty’ to Hackers Who Report Flaws, N.Y. TIMES, Aug. 4, 2016, http://www.nytimes.com/2016/08/05/technology/apple-will-pay-a-bug-bounty-to-hackers-who-report-flaws.html?_r=0; Press Release, Qualcomm, Inc., Qualcomm Announces Launch of Bounty Program, Offering up to $15,000 USD for the Discovery of Vulnerabilities (Nov. 17, 2016), https://www.qualcomm.com/news/releases/2016/11/17/qualcomm-announces-launch-bounty-program-offering-15000-usd-discovery.
95 Vulnerabilities are frequently assigned a Common Vulnerabilities and Exposures (CVE) list identifier, which is a common reference for members of the security community. See CVE: The Standard for Information Security Vulnerability Names, MITRE, http://cve.mitre.org/ (last visited Feb. 12, 2018).
Mobile Security Updates: Understanding the Issues
25
patch for the primary source code,96 and conveys the vulnerability and patching information to its downstream partners, usually via regular security bulletins.97
Device manufacturers must then determine whether the vulnerability affects any of their devices. Because of device- and carrier-specific customizations, a vulnerability affecting one device may not affect a similar device using the same type of operating system, made by the same manufacturer, and serviced by the same carrier. And a vulnerability that affects one device may not affect exactly the same device (same operating system, manufacturer, and model) if it is serviced by a different carrier. For manufacturers with large device portfolios and numerous carrier relationships, this step may involve examining dozens or even hundreds of instances of code.
B. Deciding Whether to Update Specific Devices Device manufacturers then decide whether to issue security updates for affected devices. Respondents reported that they typically decide to stop issuing regular security updates to a device based on the characteristics of that device, rather than making support decisions for each device on a vulnerability-by-vulnerability basis.98 Only one respondent had a written patch policy that expressly identifies the device characteristics that inform support decisions. However, in practice, the rest weigh similar factors:
Device Age: It is not feasible from either a technical or business perspective to support any device indefinitely. Hardware becomes outdated and consumers upgrade to new phones, so every manufacturer reported allocating support resources either towards newer devices or devices with newer operating systems.
Device Popularity: Popular devices are more likely to be updated, because a patch to a popular phone will benefit more consumers than a patch for a little-used phone and maintaining flagship devices (i.e., usually the most popular) benefits the brand. Although flagships tend to be more expensive than 96 Fixing the primary source code may itself be a complex process, because code owners often support multiple versions of their code. See, e.g., Android – Story, GOOGLE, https://www.android.com/history/ (last visited Feb. 12, 2018) (describing support for last three versions of the Android operating system).
97 For example, since Stagefright, Google has issued monthly security bulletins. ANDROID SECURITY 2015 YEAR IN REVIEW, GOOGLE (Apr. 2016), https://source.android.com/security/reports/Google_Android_Security_2015_Report_Final.pdf (describing transition from quarterly to monthly security bulletins). Other code owners, like Qualcomm and Microsoft, similarly issue regular security bulletins. Security Bulletins, QUALCOMM, https://www.qualcomm.com/company/product-security/bulletins (last visited Feb. 12, 2018); Security Update Guide, Security TechCenter, MICROSOFT, https://portal.msrc.microsoft.com/en-us/ (last visited Feb. 12, 2018).
98 Notwithstanding this preference for global assessment, device manufacturers will occasionally “backport” a patch, i.e., develop a patch for particular critical vulnerabilities, like Stagefright, even for devices that do not receive regularly scheduled support.
Mobile Security Updates: Understanding the Issues
26
other devices, no company described retail cost of the device (e.g., premium or budget) as relevant to its update decisions, nor did any manufacturer describe security support as a feature exclusively for high-end models.
Cost of Support: Because patching requires development and testing resources, manufacturers are cognizant of how many devices in their portfolio are receiving support and how much it will cost to continue supporting a particular device.
Carrier Input: Carrier contracts may require a minimum support period (e.g., 18 or 36 months), although, based on the contract provisions we received, such requirements are fairly rare. Where the contract is silent, carriers may function as conduits for any updates device manufacturers independently choose to provide, or they may be active partners in support decisions. Manufacturer-carrier communications reveal that, at times, carriers urge manufacturers to support popular devices, patch critical vulnerabilities, and use a routine update schedule. Other communications, however, show that carriers sometimes resist updates that require immediate action or consume limited testing resources.
Vulnerability Severity: Even if a device manufacturer is no longer supporting a device regularly, it may decide to “backport” patches for certain high-risk vulnerabilities to all devices.
C. Deciding When to Update Specific Devices Next, the patching manufacturer must decide when to issue the update: in an emergency release
(usually reserved for the most severe vulnerabilities), as part of a regularly-scheduled security-only update, or with a regularly scheduled general software update that bundles security fixes with functionality upgrades. Since Stagefright, several Android manufacturers have attempted to develop formal policies or, at least, relatively consistent practices for security-only updates, especially for flagship devices. For example, Google, LG, and Samsung have committed to monthly security updates for certain devices.99 Respondents reported, however, that many timing decisions remain case by case, with the manufacturer considering the severity of the vulnerability, the date of the next regular update, and any carrier input. The latter two factors are described further below.
Next Regular Update: If an update for a particular device is already scheduled within the next few months, the manufacturer will often slot a security patch for delivery with that update. A number of respondents reported that they prefer to deliver security patches in updates that bundle functionality upgrades with security fixes, for several reasons: Bundling reduces the overall number of updates that require testing and deployment, may reduce disruption to consumer experience (i.e., because there are fewer updates overall), may speed up functionality upgrades, and may provide an incentive for consumers interested in new functionality to install the update. Some respondents, however, 99 See infra Part IV.B.1 (chart summarizing device manufacturers’ public statements about update frequency).
Mobile Security Updates: Understanding the Issues
27
acknowledged that bundling can significantly delay security fixes. And some commentators have argued that for consumers who avoid functionality changes, bundling creates an incentive to avoid security patches.100
Partner Input: Partners may persuade manufacturers to patch at a certain time or on a certain schedule. For example, Google has received media attention for pressing manufacturers to issue monthly security-only updates.101 Manufacturer-carrier communications reveal a complex interplay: At times, some carrier personnel have viewed security-only updates as needlessly clogging testing labs, while, at other times, they have requested security-only releases. Carriers may provide their input by persuasion, by contract, or with testing fees (or waiver of such fees) pegged to the size of the update, the amount of advance notice about the update, or the number of updates per device per year.102
D. Security Update Testing The next step is testing. First, for device manufacturers that license the Android operating
system, Google mandates compatibility testing to verify that an update does not compromise the functionality of Android or Google applications.103 Second, for devices with carrier service, carriers conduct network compatibility and device functionality testing.104
100 See, e.g., Zeynep Tufekci, The World Is Getting Hacked. Why Don’t We Do More to Stop It?, N.Y. TIMES, May 13, 2017, https://www.nytimes.com/2017/05/13/opinion/the-world-is-getting-hacked-why-dont-we-do-more-to-stop-it.html?_r=0 (“[U]pgrades almost always bring unwanted features . . . . Users hate this, and often are rightfully reluctant to upgrade. ”).
101 See, e.g., Ewan Spence, Google Embraces Security Shaming To Answer Android’s Security Problems, FORBES, Oct. 1, 2015, https://www.forbes.com/sites/ewanspence/2015/10/01/google-android-security-fix-visible-solution/#19a7740946c7; Catalin Cimpanu, Google Publishes List of 42 Phones Running Latest Android Security Updates, BLEEPING COMPUTER, June 2, 2017, https://www.bleepingcomputer.com/news/security/google-publishes-list-of-42-phones-running-latest-android-security-updates/.
102 How much weight manufacturers give to partner input appears to depend on the bargaining power between the parties. Based on our review of their communications, it appears that companies that make popular, high-end devices and deploy their own updates are more likely to make unilateral timing decisions. By contrast, manufacturers competing to make their less expensive products available in limited carrier storefronts are more likely to acquiesce to carrier requests.
103 2016 ANDROID SECURITY REPORT, supra note 29 at 5. Respondents reported that because this compatibility testing must be performed for each device-carrier combination, it can consume considerable resources.
104 For example, carrier testing may explore whether a fix inadvertently affects basic device functions (e.g., phone call connection), core network functions (e.g., voicemail or roaming capabilities), safety features (e.g., 911 calls), data usage, or memory. If a regional carrier or a mobile virtual network operator (“MVNO,” i.e., a wholesale purchaser and reseller of wireless services such as TracFone) services the device, then both the regional carrier or MVNO and its carrier partner are likely to test the update. They often attempt to test simultaneously, but may complete testing at different times. Testing may be required by contract, or, if not, manufacturers may give the carrier time for a courtesy review.
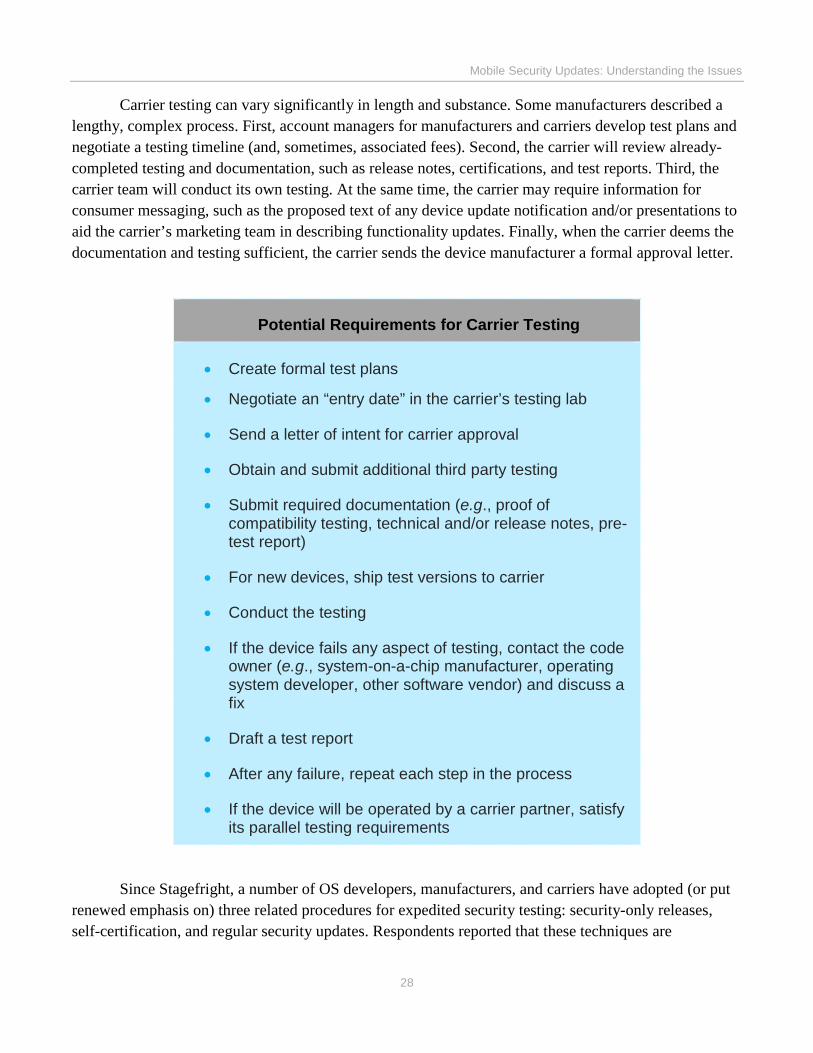
Mobile Security Updates: Understanding the Issues
28
Carrier testing can vary significantly in length and substance. Some manufacturers described a lengthy, complex process. First, account managers for manufacturers and carriers develop test plans and negotiate a testing timeline (and, sometimes, associated fees). Second, the carrier will review already-completed testing and documentation, such as release notes, certifications, and test reports. Third, the carrier team will conduct its own testing. At the same time, the carrier may require information for consumer messaging, such as the proposed text of any device update notification and/or presentations to aid the carrier’s marketing team in describing functionality updates. Finally, when the carrier deems the documentation and testing sufficient, the carrier sends the device manufacturer a formal approval letter.
Potential Requirements for Carrier Testing
• Create formal test plans
• Negotiate an “entry date” in the carrier’s testing lab
• Send a letter of intent for carrier approval
• Obtain and submit additional third party testing
• Submit required documentation (e.g., proof of compatibility testing, technical and/or release notes, pre-test report)
• For new devices, ship test versions to carrier
• Conduct the testing
• If the device fails any aspect of testing, contact the code owner (e.g., system-on-a-chip manufacturer, operating system developer, other software vendor) and discuss a fix
• Draft a test report
• After any failure, repeat each step in the process
• If the device will be operated by a carrier partner, satisfy its parallel testing requirements
Since Stagefright, a number of OS developers, manufacturers, and carriers have adopted (or put renewed emphasis on) three related procedures for expedited security testing: security-only releases, self-certification, and regular security updates. Respondents reported that these techniques are
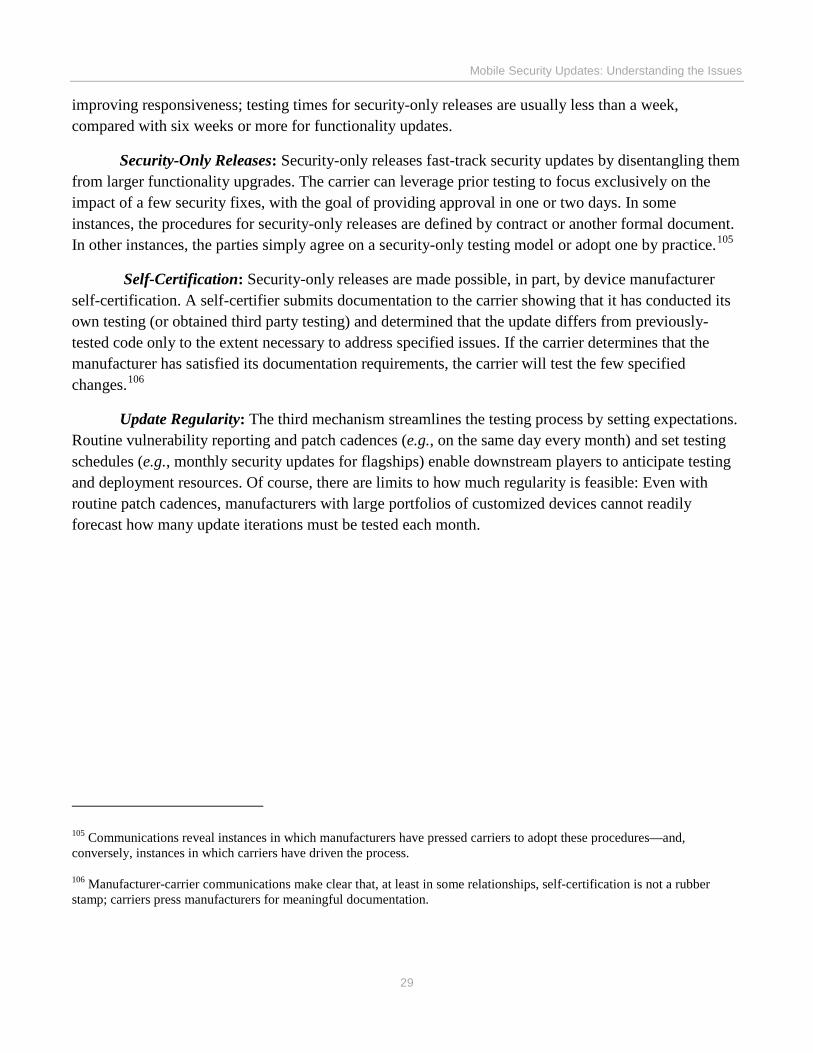
Mobile Security Updates: Understanding the Issues
29
improving responsiveness; testing times for security-only releases are usually less than a week, compared with six weeks or more for functionality updates.
Security-Only Releases: Security-only releases fast-track security updates by disentangling them from larger functionality upgrades. The carrier can leverage prior testing to focus exclusively on the impact of a few security fixes, with the goal of providing approval in one or two days. In some instances, the procedures for security-only releases are defined by contract or another formal document. In other instances, the parties simply agree on a security-only testing model or adopt one by practice.105
Self-Certification: Security-only releases are made possible, in part, by device manufacturer self-certification. A self-certifier submits documentation to the carrier showing that it has conducted its own testing (or obtained third party testing) and determined that the update differs from previously-tested code only to the extent necessary to address specified issues. If the carrier determines that the manufacturer has satisfied its documentation requirements, the carrier will test the few specified changes.106
Update Regularity: The third mechanism streamlines the testing process by setting expectations. Routine vulnerability reporting and patch cadences (e.g., on the same day every month) and set testing schedules (e.g., monthly security updates for flagships) enable downstream players to anticipate testing and deployment resources. Of course, there are limits to how much regularity is feasible: Even with routine patch cadences, manufacturers with large portfolios of customized devices cannot readily forecast how many update iterations must be tested each month.
105 Communications reveal instances in which manufacturers have pressed carriers to adopt these procedures—and, conversely, instances in which carriers have driven the process.
106 Manufacturer-carrier communications make clear that, at least in some relationships, self-certification is not a rubber stamp; carriers press manufacturers for meaningful documentation.
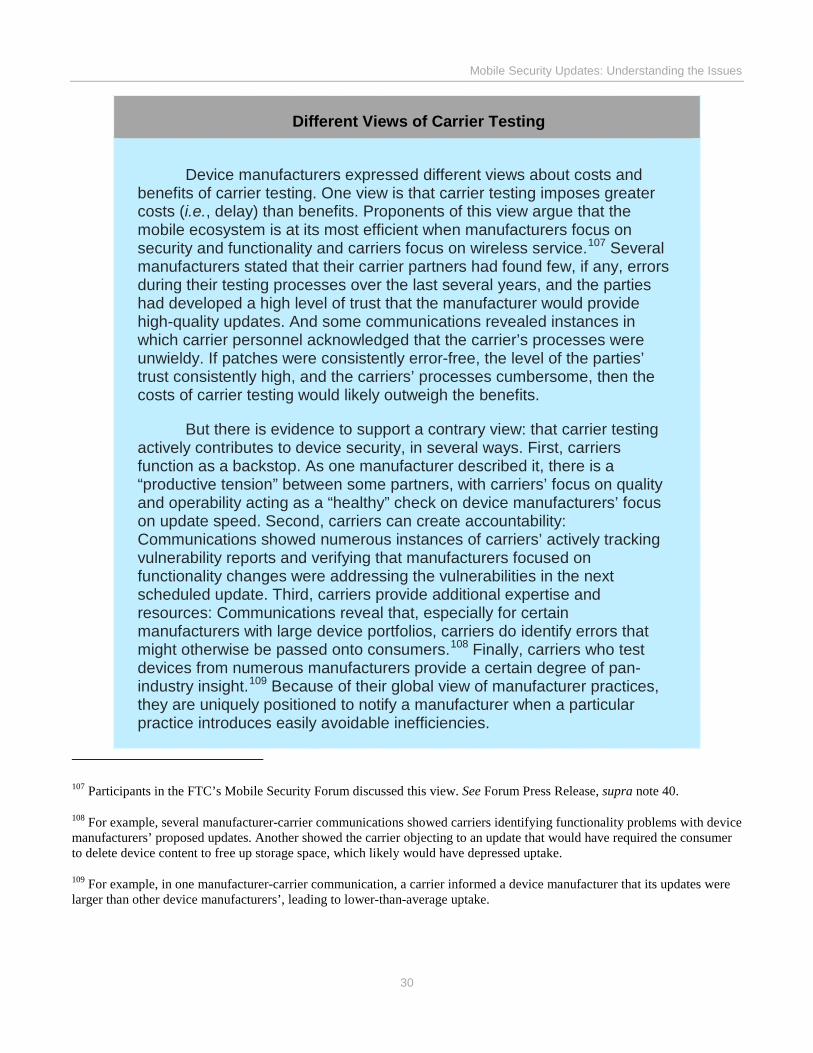
Mobile Security Updates: Understanding the Issues
30
Different Views of Carrier Testing
Device manufacturers expressed different views about costs and benefits of carrier testing. One view is that carrier testing imposes greater costs (i.e., delay) than benefits. Proponents of this view argue that the mobile ecosystem is at its most efficient when manufacturers focus on security and functionality and carriers focus on wireless service.107 Several manufacturers stated that their carrier partners had found few, if any, errors during their testing processes over the last several years, and the parties had developed a high level of trust that the manufacturer would provide high-quality updates. And some communications revealed instances in which carrier personnel acknowledged that the carrier’s processes were unwieldy. If patches were consistently error-free, the level of the parties’ trust consistently high, and the carriers’ processes cumbersome, then the costs of carrier testing would likely outweigh the benefits.
But there is evidence to support a contrary view: that carrier testing actively contributes to device security, in several ways. First, carriers function as a backstop. As one manufacturer described it, there is a “productive tension” between some partners, with carriers’ focus on quality and operability acting as a “healthy” check on device manufacturers’ focus on update speed. Second, carriers can create accountability: Communications showed numerous instances of carriers’ actively tracking vulnerability reports and verifying that manufacturers focused on functionality changes were addressing the vulnerabilities in the next scheduled update. Third, carriers provide additional expertise and resources: Communications reveal that, especially for certain manufacturers with large device portfolios, carriers do identify errors that might otherwise be passed onto consumers.108 Finally, carriers who test devices from numerous manufacturers provide a certain degree of pan-industry insight.109 Because of their global view of manufacturer practices, they are uniquely positioned to notify a manufacturer when a particular practice introduces easily avoidable inefficiencies.
107 Participants in the FTC’s Mobile Security Forum discussed this view. See Forum Press Release, supra note 40.
108 For example, several manufacturer-carrier communications showed carriers identifying functionality problems with device manufacturers’ proposed updates. Another showed the carrier objecting to an update that would have required the consumer to delete device content to free up storage space, which likely would have depressed uptake.
109 For example, in one manufacturer-carrier communication, a carrier informed a device manufacturer that its updates were larger than other device manufacturers’, leading to lower-than-average uptake.
Mobile Security Updates: Understanding the Issues
31
E. Installing the Security UpdateAfter testing, the security update is ready for consumer installation. There are two aspects to
installation: deployment and device uptake.
Deployment: There is no single deploying party or deployment method in the mobile ecosystem. Sometimes carriers deploy updates over-the-air (“OTA”) using their wireless network; sometimes operating system developers or device manufacturers deploy the updates themselves over a WiFi connection. Some operating system developers and device manufacturers reported that they prefer to deploy their own updates to maximize control over the testing and deployment schedule. Other manufacturers and carriers reported that consumers can benefit from carriers’ deployment expertise (developed from long experience with updates) and the opportunity to contact a carrier directly with any concerns about the update.
Deploying parties may use one or more of three methods: pushing, polling, and pulling. First, the deploying party may push the update to devices for automatic download, with installation complete upon consumer confirmation. Second, the deploying party may set devices to poll, or periodically check with the deploying party’s server for updates. Third, the deploying party may require consumers to affirmatively pull the update from their server by checking their website. No matter the deployment method(s), deploying parties often prefer a gradual schedule so that any problems with the update can be identified early before the update is deployed to all devices.
Uptake: Deployment does not guarantee an update; the device must “take” or install the update. The uptake rate depends on several factors. First, installing an update requires sufficient Internet access, either by WiFi or carrier service. There are advantages and disadvantages to each method. WiFi offers greater bandwidth (i.e., faster download times), which is particularly important for larger updates. It also offers all-inclusive pricing (i.e., “free” downloads unlike cellular plans with monthly data caps). However, consumers who do not have immediate or frequent access to WiFi—many of whom may be among the 10% of American consumers who do not have any home WiFi access110—may not be able to install the update. Installation over carrier network similarly has benefits and potential drawbacks. Carriers may charge for bandwidth usage or they may decide not to include update data (especially the minimal data usually required for a security-only update) against a user’s monthly cap. Network deployments can be slower than WiFi deployments, because carriers often deploy in waves to avoid network congestion. That gradual approach, however, can enable carriers to spot update issues and address them before these issues affect many consumer devices.
110 PEW SMARTPHONE USE, supra note 17; 2016 Broadband Progress Report, FED. COMM. COMM’N, 33-34 (Jan. 28, 2016), https://apps.fcc.gov/edocs_public/attachmatch/FCC-16-6A1.pdf.
Mobile Security Updates: Understanding the Issues
32
Second, updating requires sufficient device power. Consumers without enough battery or power outlet access must defer, and may ultimately ignore, an update. Third, updating requires sufficient device storage. A security-only update is less likely to require significant storage, but a maintenance release that bundles functionality and security upgrades may require the user to make space available on the device. Fourth, uptake can depend on user notifications; if a consumer must take affirmative action to install the update (either pulling the update or accepting installation), prominent notification increases uptake. Fifth, some devices have configurable update settings and can be set by default to auto-download updates, which increases uptake.111 Sixth, uptake depends on consumer deferrals and rejections. Forcing the device to update immediately, or after a certain number of deferrals, improves the uptake rate but may bother users,112 particularly those who are actively attempting to avoid functionality changes.113
Finally, not every device is able to accept updates: Non-standard devices—e.g., iOS devices that have been “jailbroken” or Android devices that have been “rooted” to bypass manufacturers’ default restrictions and expand the phones’ capabilities—may not be compatible with updates.114 In addition, some mobile device management software installed by enterprise customers to enhance enterprise control and security may interfere with a device’s ability to receive over-the-air updates.
111 According to a recent survey, only about 32% of American smartphone owners set their devices to update automatically. AMERICANS & CYBERSECURITY, supra note 6 at 20.
112 Recent survey research sheds light on the reasons for consumer deferrals and rejections. Specifically, users may reject updates because they do not want familiar functionality to change, do not think the upgrade sufficiently important to justify its inconvenience, or do not understand the update notice. See, e.g., Arunesh Mathur & Marshini Chetty, Impact of User Characteristics on Attitudes Towards Automatic Mobile Application Updates, 13TH SYMPOSIUM ON USABLE PRIVACY AND SECURITY, 175 (July 12-14, 2017), https://www.usenix.org/conference/soups2017/technical-sessions/presentation/mathur (describing reasons that user avoid mobile app updates); Vaniea & Rashidi, supra note 88 at 2 (summarizing survey research on consumers’ confusion about security updates); M. Fagan, et al., A Study of Users’ Experiences and Beliefs About Software Update Messges, 51 J. OF COMPUTERS IN HUMAN BEHAVIOR 504 (2015) (describing survey research reporting consumers’ annoyance with and confusion about security updates messaging).
A recent Pew Research survey reports that 42% of Americans only update their phones when it is convenient, and 14% say they never update their phones. AMERICANS & CYBERSECURITY, supra note 6 at 20. Consumers ages 65 and older are especially likely to ignore an update; nearly a quarter of these consumers report that they never update their phone’s operating system. Id.
113 Tripp Mickle, Apple Limits Performance in Old iPhones to Prevent Shutdowns, WALL ST. J., Dec. 21, 2017, https://www.wsj.com/articles/apple-limits-performance-in-old-iphones-to-prevent-shutdowns-1513812316 (describing an Apple operating system software update that throttled device performance to preserve battery health).
114 By jailbreaking or rooting a device, the owner configures it to run a customized operating system not certified by a carrier, which may violate some party’s terms of service (i.e., the operating system, manufacturer, and/or carrier), potentially jeopardizing support, updates, or even connectivity. See Marshall Honorof, Jailbreak, Root or Unlock: What’s the Difference?, MSN, Mar. 6, 2013, http://www.nbcnews.com/id/51071301/ns/technology_and_science-tech_and_gadgets/t/jailbreak-root-or-unlock-whats-difference/.
Mobile Security Updates: Understanding the Issues
33
IV. Security Support PracticesThe previous Part provided an overview of the mobile security update process. This Part
provides some insight into device manufacturer’s security support practices: the duration of their security support, the frequency of their updates, the amount of time it takes to develop and test patches, and their uptake rates.
No recipient of the Order maintained comprehensive or readily-accessible records of these practices, and each reported that it would be burdensome to fully reconstruct them. And perhaps because device manufacturers do not keep such records, they appear to have somewhat limited insight into their own practices. This section draws on available data to highlight some commonalities and trends in their practices.
A. Duration of Security Update SupportThe Commission’s Order asked respondents to identify the period of time that individual device
models were supported for security updates. In response, manufacturers generally described approximate time periods (e.g., “1-2 years,” “about 2 years,” “1-3 years,” etc.). They explained that they could not provide more definitive responses because support periods vary based on factors (such as device popularity, support costs, and carrier input) that cannot be easily predicted at the time the device is released.
We also researched whether any manufacturers made public statements about minimum support periods or security support periods for their devices. We then compared these public statements to update support data the manufacturers provided. This section first describes manufacturers’ public statements on update support and then reports on our data analysis.
1. Public Statements about Update Support
The table below summarizes device manufacturers’ public statements on the length of updatesupport periods.115
115 This table (and the companion table, infra Part IV.B.1) does not necessarily identify every statement these device manufacturers have made; we used Internet search methods that attempt to simulate the types of searches consumers would conduct when researching smartphone and tablet purchases.
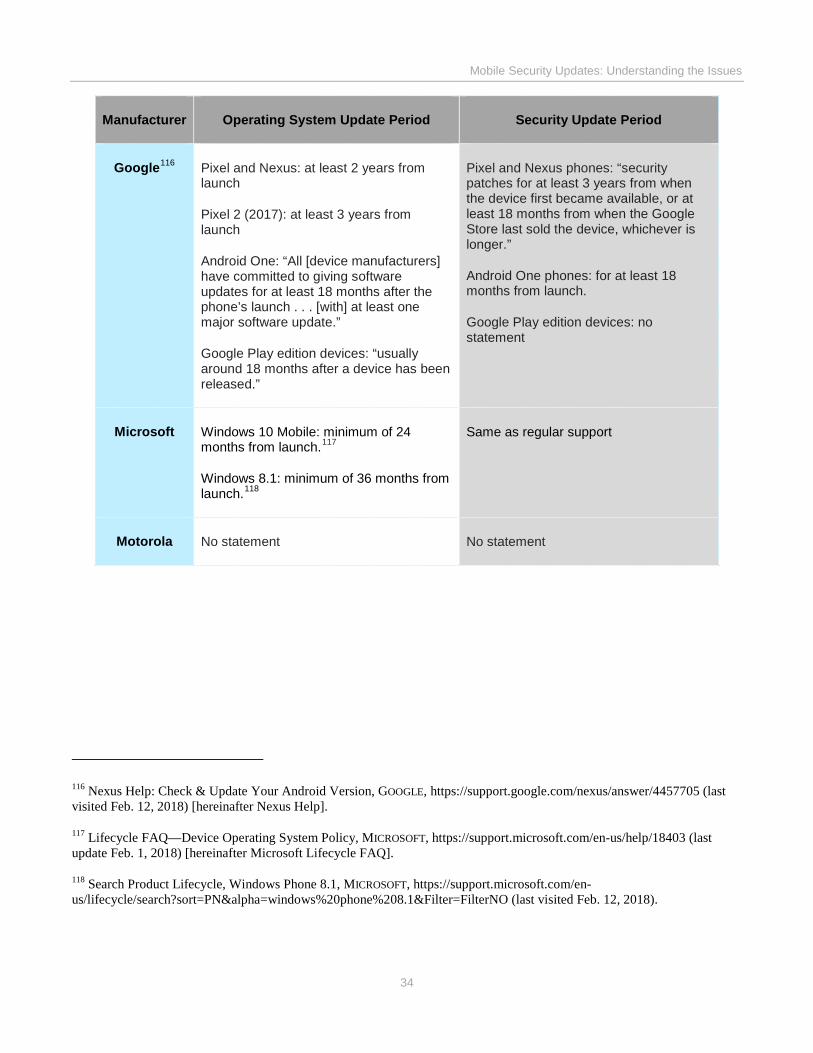
Mobile Security Updates: Understanding the Issues
34
116 Nexus Help: Check & Update Your Android Version, GOOGLE, https://support.google.com/nexus/answer/4457705 (last visited Feb. 12, 2018) [hereinafter Nexus Help].
117 Lifecycle FAQ—Device Operating System Policy, MICROSOFT, https://support.microsoft.com/en-us/help/18403 (last update Feb. 1, 2018) [hereinafter Microsoft Lifecycle FAQ].
118 Search Product Lifecycle, Windows Phone 8.1, MICROSOFT, https://support.microsoft.com/en-us/lifecycle/search?sort=PN&alpha=windows%20phone%208.1&Filter=FilterNO (last visited Feb. 12, 2018).
Manufacturer Operating System Update Period Security Update Period
Google116 Pixel and Nexus: at least 2 years from launch
Pixel 2 (2017): at least 3 years from launch
Android One: “All [device manufacturers] have committed to giving software updates for at least 18 months after the phone’s launch . . . [with] at least one major software update.”
Google Play edition devices: “usually around 18 months after a device has been released.”
Pixel and Nexus phones: “security patches for at least 3 years from when the device first became available, or at least 18 months from when the Google Store last sold the device, whichever is longer.”
Android One phones: for at least 18 months from launch.
Google Play edition devices: no statement
Microsoft Windows 10 Mobile: minimum of 24 months from launch.117
Windows 8.1: minimum of 36 months from launch.118
Same as regular support
Motorola No statement No statement
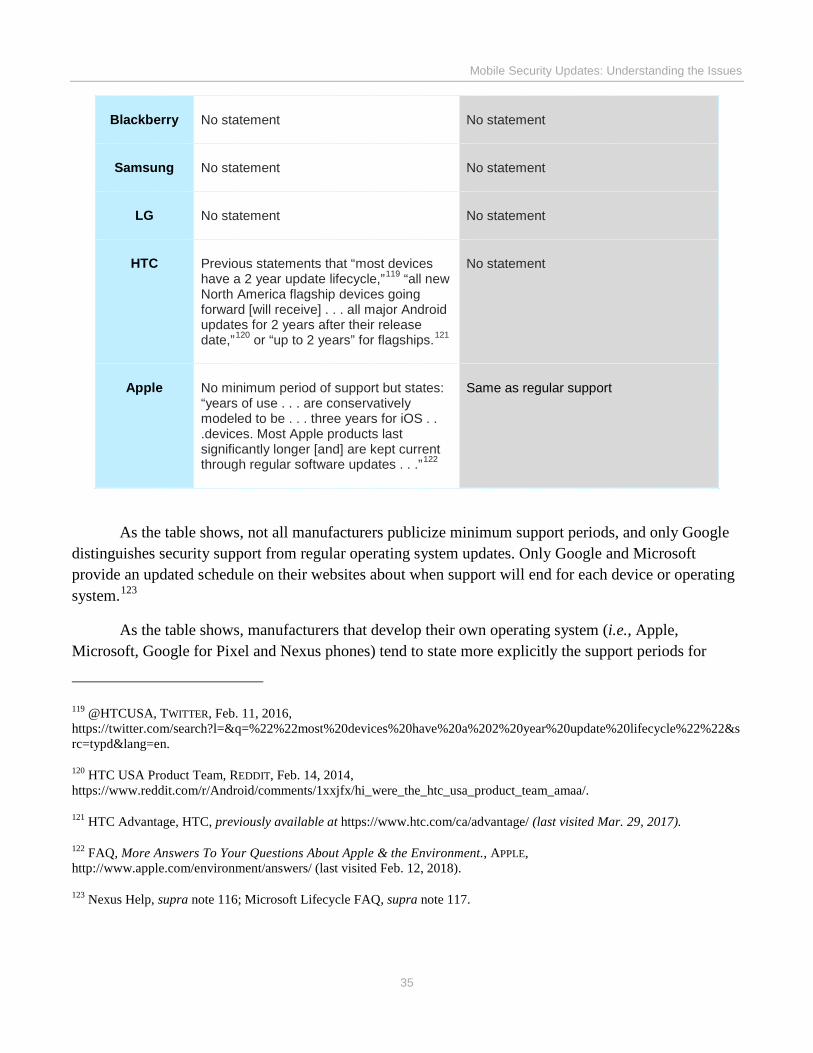
Mobile Security Updates: Understanding the Issues
35
As the table shows, not all manufacturers publicize minimum support periods, and only Google distinguishes security support from regular operating system updates. Only Google and Microsoft provide an updated schedule on their websites about when support will end for each device or operating system.123
As the table shows, manufacturers that develop their own operating system (i.e., Apple, Microsoft, Google for Pixel and Nexus phones) tend to state more explicitly the support periods for
119 @HTCUSA, TWITTER, Feb. 11, 2016, https://twitter.com/search?l=&q=%22%22most%20devices%20have%20a%202%20year%20update%20lifecycle%22%22&src=typd&lang=en.
120 HTC USA Product Team, REDDIT, Feb. 14, 2014, https://www.reddit.com/r/Android/comments/1xxjfx/hi_were_the_htc_usa_product_team_amaa/.
121 HTC Advantage, HTC, previously available at https://www.htc.com/ca/advantage/ (last visited Mar. 29, 2017).
122 FAQ, More Answers To Your Questions About Apple & the Environment., APPLE, http://www.apple.com/environment/answers/ (last visited Feb. 12, 2018).
123 Nexus Help, supra note 116; Microsoft Lifecycle FAQ, supra note 117.
Blackberry No statement No statement
Samsung No statement No statement
LG No statement No statement
HTC Previous statements that “most devices have a 2 year update lifecycle,”119 “all new North America flagship devices going forward [will receive] . . . all major Android updates for 2 years after their release date,”120 or “up to 2 years” for flagships.121
No statement
Apple No minimum period of support but states: “years of use . . . are conservatively modeled to be . . . three years for iOS . . .devices. Most Apple products last significantly longer [and] are kept current through regular software updates . . .”122
Same as regular support
Mobile Security Updates: Understanding the Issues
36
operating system updates and security updates. They may be able to make commitments more easily because they support fewer devices, do not customize their operating system by device or carrier, and their support processes may involve fewer entities (e.g., Apple is the operating system developer and device manufacturer).
2. Device Manufacturer Update Support Data
As part of this study, we requested operating system update support data from each device manufacturer for the Order response period: roughly mid-2013 through mid-2016. Three of the eight respondents provided data conducive to comparison. These three manufacturers, which sell devices using customized versions of the Android operating system, produce well over 50% of the Android devices sold. As a result, their practices collectively provide important insight into security update practices for Android devices.
Each manufacturer provided a detailed spreadsheet identifying the dates on which they released, sold, and/or updated their devices. We compiled these spreadsheets into a single, comprehensive data set that enabled us to observe certain characteristics about the data as a whole.124 We then explored differences in the data based on several attributes: manufacturer, price tier (i.e.¸ budget, mid-tier, or premium), popularity (i.e., units sold), and service, and used statistical analysis to analyze the relationship among these variables.125 Below is a series of observations based on our data analysis.
Observation #1: For Some Manufacturers, Variation in Update Support Periods Is the Norm. One salient aspect of the data we received is its heterogeneity at the device level. Figure A-1 shows the distribution of operating system update support periods (in years) for devices released by three manufacturers in 2013 and 2014.126
124 A few notes on the data and our calculations: First, the Order response period (mid-2013 to mid-2016) created an artificial support cut-off that limited our ability to comment on the evolution of practices over time. We focused our analysis on devices released in 2013 and 2014, where we could more reliably conclude that a device had stopped receiving updates. Second, respondents generally provided the month and year of the release and update rather than precise dates. In that instance, we calculated support period from the first day of the month, which slightly extended some support periods and reduced others. Third, we calculated support period by comparing release date to the date of the last update. The data does not identify which, if any, updates were backported patches to unsupported devices. As a result, our calculations may have inflated some regular support periods. Finally, we describe data only for selected devices so that, consistent with the requirements of the § 6(b) process requirements, no manufacturer can be identified by device count.
125 Appendix C (Part I) contains tables summarizing these regressions and explains the mechanics of our analysis.
126 See supra note 124 (explaining why we confined our analysis to devices released in 2013 and 2014).
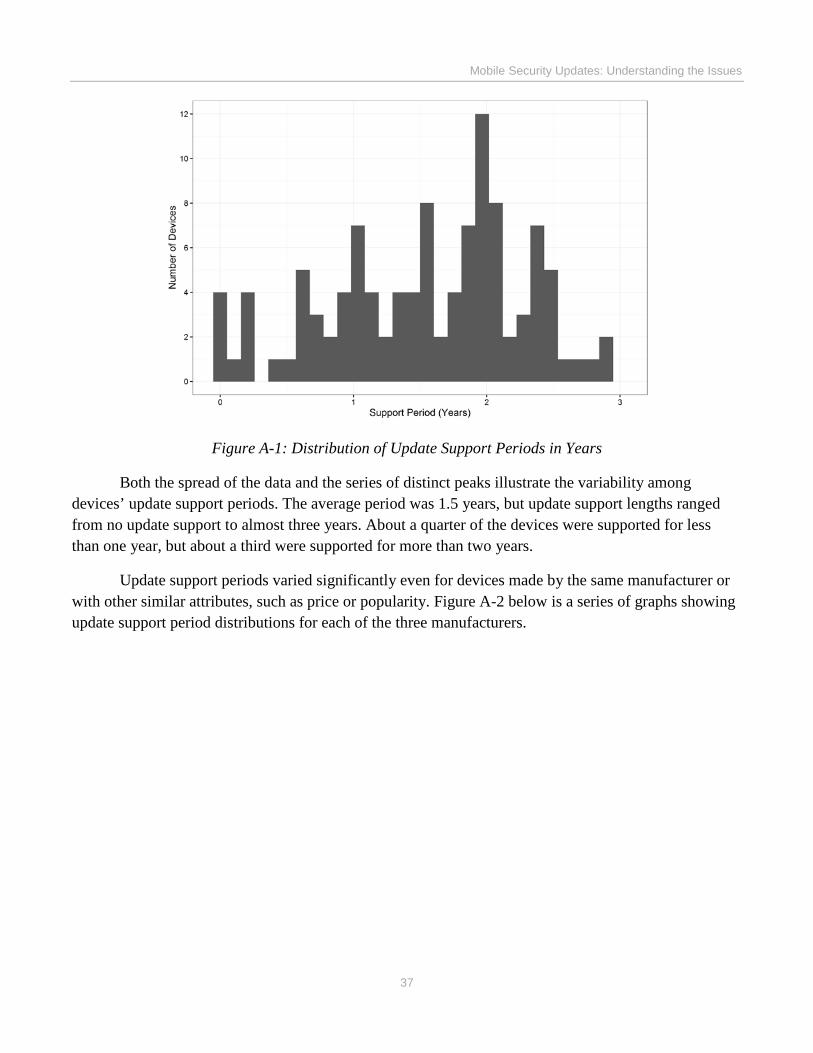
Mobile Security Updates: Understanding the Issues
37
Figure A-1: Distribution of Update Support Periods in Years
Both the spread of the data and the series of distinct peaks illustrate the variability among devices’ update support periods. The average period was 1.5 years, but update support lengths ranged from no update support to almost three years. About a quarter of the devices were supported for less than one year, but about a third were supported for more than two years.
Update support periods varied significantly even for devices made by the same manufacturer or with other similar attributes, such as price or popularity. Figure A-2 below is a series of graphs showing update support period distributions for each of the three manufacturers.
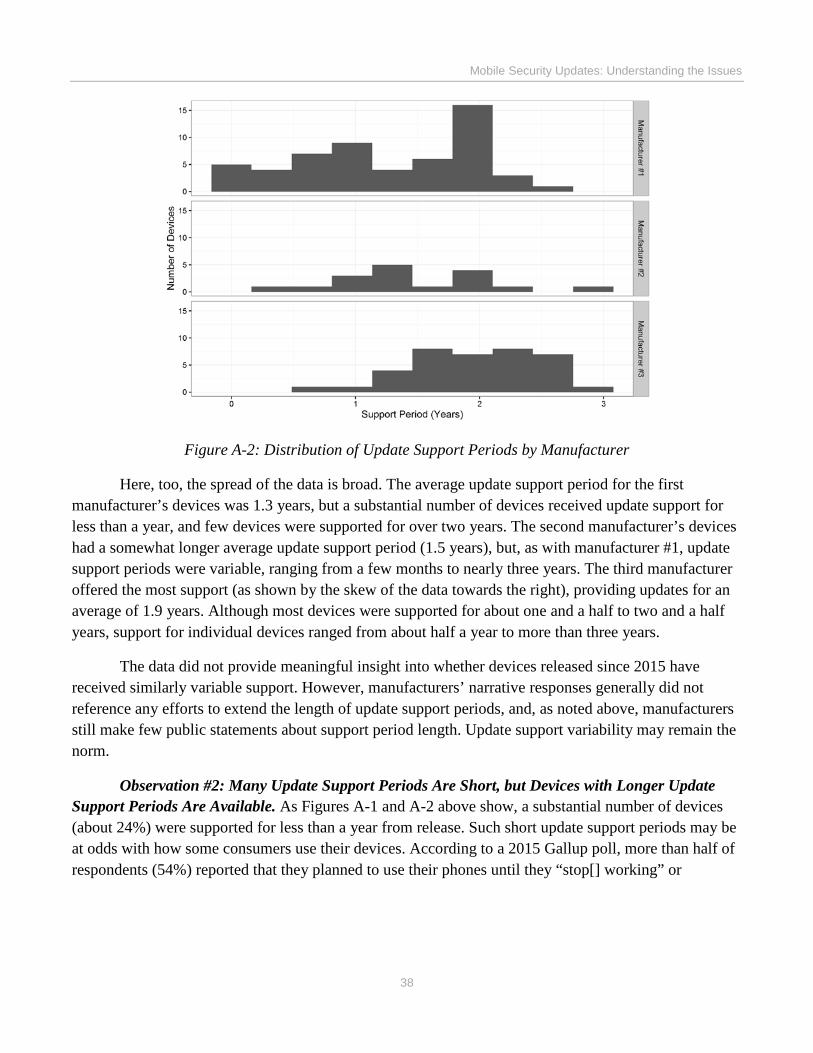
Mobile Security Updates: Understanding the Issues
38
Figure A-2: Distribution of Update Support Periods by Manufacturer
Here, too, the spread of the data is broad. The average update support period for the first manufacturer’s devices was 1.3 years, but a substantial number of devices received update support for less than a year, and few devices were supported for over two years. The second manufacturer’s devices had a somewhat longer average update support period (1.5 years), but, as with manufacturer #1, update support periods were variable, ranging from a few months to nearly three years. The third manufacturer offered the most support (as shown by the skew of the data towards the right), providing updates for an average of 1.9 years. Although most devices were supported for about one and a half to two and a half years, support for individual devices ranged from about half a year to more than three years.
The data did not provide meaningful insight into whether devices released since 2015 have received similarly variable support. However, manufacturers’ narrative responses generally did not reference any efforts to extend the length of update support periods, and, as noted above, manufacturers still make few public statements about support period length. Update support variability may remain the norm.
Observation #2: Many Update Support Periods Are Short, but Devices with Longer Update Support Periods Are Available. As Figures A-1 and A-2 above show, a substantial number of devices (about 24%) were supported for less than a year from release. Such short update support periods may be at odds with how some consumers use their devices. According to a 2015 Gallup poll, more than half of respondents (54%) reported that they planned to use their phones until they “stop[] working” or
Mobile Security Updates: Understanding the Issues
39
“become[] totally obsolete.”127 It is possible that some consumers view phones as “totally obsolete” when they stop receiving security updates, although this seems unlikely, because consumers typically do not receive a notification when support ends (and, therefore, are unlikely to know when support ends). And some consumers might prefer to keep using their old device even if they knew security support has ended.
According to survey data, consumers are using devices for longer periods. Several years ago, consumers typically kept a phone for 24-26 months. That figure increased to 29 months in 2016.128 If some consumers expect to use their phones for several years, this data suggests that many consumers will continue to use devices that do not receive security updates.
Respondents’ support data shows that devices with longer update support periods are available. As Figure A-2 shows, each manufacturer supported some devices with updates for more than two years, and each supported at least one device with updates for close to three years. But it may be challenging for security-conscious consumers to compare these devices at the time of purchase. Without consistent update support period disclosures, consumers must rely on information (perhaps imperfect) obtained from other sources (e.g., news articles about support), infer likely update support periods from device characteristics or reputation,129 or purchase devices offered by the relatively few manufacturers that do promise to provide updates for a specified period. They may also choose to replace devices at greater frequency to minimize the risk of an unsupported device.
Observation #3: Some Devices Are Sold After Update Support Has Ended. Data containing the release date, sales end date, and last update for certain device-carrier combinations revealed that devices were sometimes sold after update support had ended. That is, devices that had been launched months (or years) earlier and whose update support period has lapsed continued to be sold to consumers. We identified 16 examples of post-support device sales.
127 Art Swift, Americans Split on How Often They Upgrade Their Smartphones, GALLUP, July 8, 2015, http://www.gallup.com/poll/184043/americans-split-often-upgrade-smartphones.aspx?utm_source=Economy&utm_medium=newsfeed&utm_campaign=tiles.
128 Press Release, Phone Arena, Americans Are Keeping Their Phones Longer; New Data Says U.S. Users Wait 29 Months Between Upgrades (Apr. 18, 2016), http://www.phonearena.com/news/Americans-are-keeping-their-phones-longer-new-data-says-U.S.-users-wait-29-months-between-upgrades_id80327.
129 For example, industry observers have reported that Apple allows multiple generations of devices to run the same version of its operating system; phones receive updates as long as they are capable of running the most recent OS versions. See Apple Seemingly Ends Support For 32-bit Devices With iOS 10.3.2, APPLE INSIDER, Mar. 28, 2017, http://appleinsider.com/articles/17/03/28/apple-seemingly-ends-support-for-32-bit-devices-with-ios-1032.
Mobile Security Updates: Understanding the Issues
40
We are not aware of survey data that identifies how much mobile security support consumers expect to receive. It seems likely, however, that, absent effective notification, many consumers expect that their devices will receive some security updates, even if only for a short period.
It is possible that, based on the circumstances, post-support sales could be consistent with purchasers’ expectations. Most of these sales were of budget or mid-tier phones whose lower price may have signaled reduced support—although several devices were priced at more than $500. The Commission did not request evidence as to whether the device manufacturer informed purchasers of this cost-for-support bargain or otherwise alerted them to the lack of security support. Examining whether, and to what extent, consumers viewed security support as a relevant characteristic for mobile phones is an area for future research.
Observation #4: For Some Manufacturers’ Update Support Periods, Price Matters As Much As Popularity (Or Perhaps Slightly More). Recall that several device manufacturers explained that when making update support decisions, they consider device popularity, but do not consider price tier. These data, however, suggest that price point actually correlates with update support as well as popularity does—or perhaps slightly better.130
Figure A-3 below is a series of bar graphs showing update support period distribution for inexpensive (less than $250), mid-tier ($250-500), and costly (more than $500) devices.
130 We conducted a regression analysis, available in Part I of Appendix C, that suggests that price effects are somewhat stronger than popularity effects.
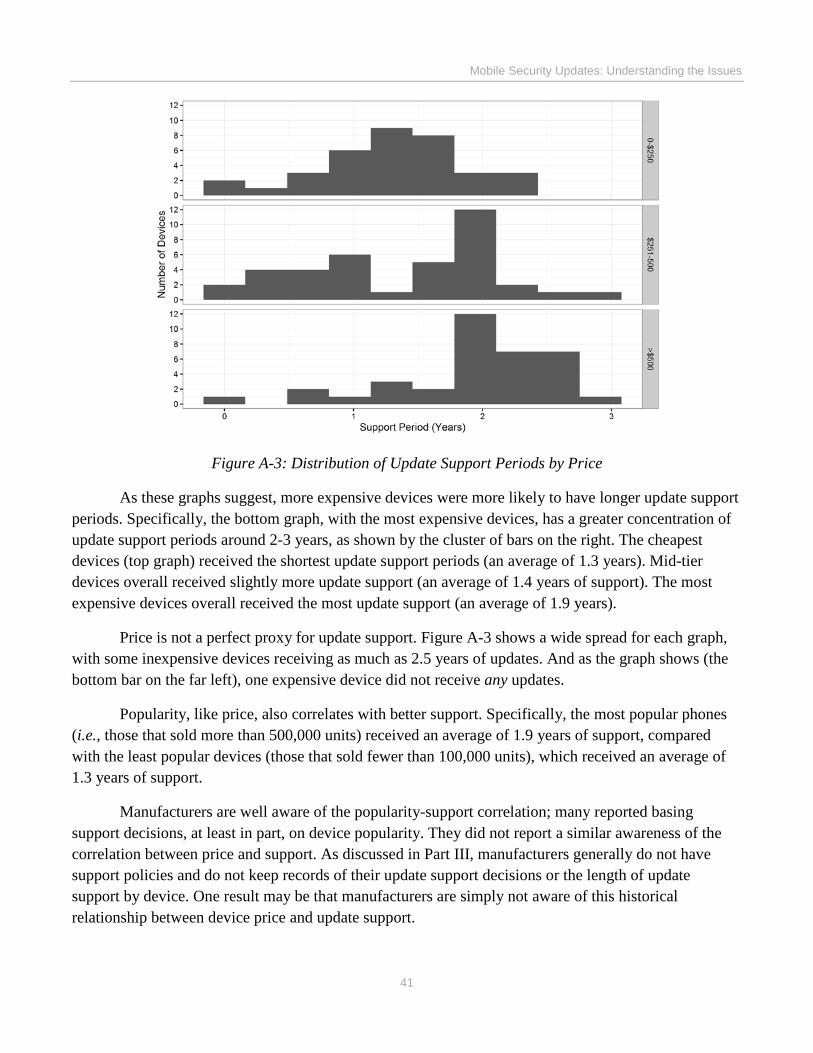
Mobile Security Updates: Understanding the Issues
41
Figure A-3: Distribution of Update Support Periods by Price
As these graphs suggest, more expensive devices were more likely to have longer update support periods. Specifically, the bottom graph, with the most expensive devices, has a greater concentration of update support periods around 2-3 years, as shown by the cluster of bars on the right. The cheapest devices (top graph) received the shortest update support periods (an average of 1.3 years). Mid-tier devices overall received slightly more update support (an average of 1.4 years of support). The most expensive devices overall received the most update support (an average of 1.9 years).
Price is not a perfect proxy for update support. Figure A-3 shows a wide spread for each graph, with some inexpensive devices receiving as much as 2.5 years of updates. And as the graph shows (the bottom bar on the far left), one expensive device did not receive any updates.
Popularity, like price, also correlates with better support. Specifically, the most popular phones (i.e., those that sold more than 500,000 units) received an average of 1.9 years of support, compared with the least popular devices (those that sold fewer than 100,000 units), which received an average of 1.3 years of support.
Manufacturers are well aware of the popularity-support correlation; many reported basing support decisions, at least in part, on device popularity. They did not report a similar awareness of the correlation between price and support. As discussed in Part III, manufacturers generally do not have support policies and do not keep records of their update support decisions or the length of update support by device. One result may be that manufacturers are simply not aware of this historical relationship between device price and update support.
Mobile Security Updates: Understanding the Issues
42
Observation #5: Carrier Identity and Service Type Do Not Predict Update Support Period Overall, But Can Matter Significantly In Individual Instances. As explained in Part III, carriers sometimes provide substantial input into manufacturers’ update support decisions. Based on these reports, we examined the data from three manufacturers for evidence of differences in update support periods depending on carrier identity and the type of service. To compare service type, we divided service into three categories: (1) major carriers (the four largest carriers), (2) other carriers (including budget and regional carriers), and (3) those sold without any carrier service (i.e., WiFi-only devices) or unlinked to any particular carrier’s service (i.e., unlocked devices). Devices in the third category, WiFi/unlocked, are not customized by carrier and may not undergo any carrier testing.
We did not find significant differences in length of update support period based on these categories. Although we did not observe significant differences by category overall, we did identify numerous instances in which identical devices received substantially different update support when serviced by different carriers or when sold without carrier service. For example, one inexpensive device, serviced by eight carriers, received as little as eight months of support or double that, depending on the carrier. One flagship device with carrier service received only 1.3 years of support, but the identical device serviced by a different carrier received support for over a year more (2.5 years). A third device received about 1.4 years of support with carrier service, but the unlocked version received 2.9 years of support.
This demonstrates that consumers owning apparently identical devices—same manufacturer, same device model—can in fact experience very different update support.
B. Security Update Frequency The Commission’s Orders also elicited data showing how frequently certain device
manufacturers issue updates. Regular security updates are important because they help ensure that devices receive patches for recently discovered vulnerabilities. For example, an Android phone that receives and installs monthly updates has the most up-to-date security because, as described in Part III, vulnerability and patching information is released in monthly security bulletins.131 This section first describes public statements about update frequency and then discusses certain manufacturers’ update frequency data.
131 Update frequency is, therefore, one indicator of the strength of a device’s security. Of course, it is not a perfect proxy. A device could receive fewer updates and nonetheless have robust security overall because of other security features. Moreover, for some operating systems, less frequent patching could actually be a marker of good security (e.g., strong operating system design) or a low risk profile (a less prominent attack surface). Nonetheless, devices using the same operating system are likely to need approximately the same number of security updates, so update frequency is one way to compare similar devices.
Mobile Security Updates: Understanding the Issues
43
1. Public Statements about Update Frequency
After discovery of the Stagefright vulnerabilities in mid-2015, news outlets reported certain Android device manufacturers’ new commitments to regular security updates.132 In light of these reports, we searched for public statements regarding security update frequency.
As the chart below shows, only one manufacturer (Microsoft) states that it will provide monthly updates. Until recently, Blackberry, like Microsoft, provided monthly updates and used its promise of monthly updates as a means of differentiating its product from other Android devices (e.g., describing the PRIV device as the “[m]ost secure Android smartphone” with “[b]est-in-class monthly Android security updates”).133 Blackberry, however, announced in December 2017 that it would no longer provide monthly updates.134
Three manufacturers (LG, Samsung, and Google) make qualified statements about monthly updates. LG states that certain devices receive security updates, but “[d]epending on regions and carriers, updates may be released monthly, quarterly, or irregularly.” Samsung identifies specific devices that receive monthly and quarterly security updates but notes that this list is “subject to change” and is reviewed “on a periodic basis.” Google describes a monthly patch cycle for its devices and partners (“We also have an established monthly update cycle for Nexus and Pixel devices, and partners.”), without expressly promising to deliver monthly updates.
Finally, three manufacturers (Apple, HTC, and Motorola) do not make statements about update frequency. Following reports that Samsung, LG, and Google were promising monthly updates for some devices, HTC’s president posted on Twitter that the company would “push for [monthly security updates],” but it is “unrealistic for anyone to say guaranteed every month.”135
132 See, e.g., Emily Dreyfuss, Big Android Makers Will Now Push Monthly Security Updates, WIRED, Aug. 6, 2015, https://www.wired.com/2015/08/google-samsung-lg-roll-regular-android-security-updates/; Samsung Lists Devices to Receive Monthly Updates, XDA DEVELOPERS, Oct. 19, 2015, https://www.xda-developers.com/samsung-lists-devices-to-receive-monthly-security-updates/.
133 Blackberry Overview, BLACKBERRY, http://www.blackberrymobile.com/us/ (last visited July 6, 2017).
134 Alex Thurber, Status of PRIV Monthly Updates, INSIDE BLACKBERRY BLOG (Dec. 14, 2017), http://blogs.blackberry.com/2017/12/status-of-priv-monthly-updates/.
135 President of HTC America, Jason Mackenzie, posted on Twitter that the company “will push for them, but unrealistic for anyone to say guaranteed every month.” Kevin Tofel, HTC Says Monthly Android Security Updates Are “Unrealistic,” ZDNET, Oct. 5, 2015, http://www.zdnet.com/article/htc-says-monthly-stagefright-android-security-updates-are-unrealistic/.
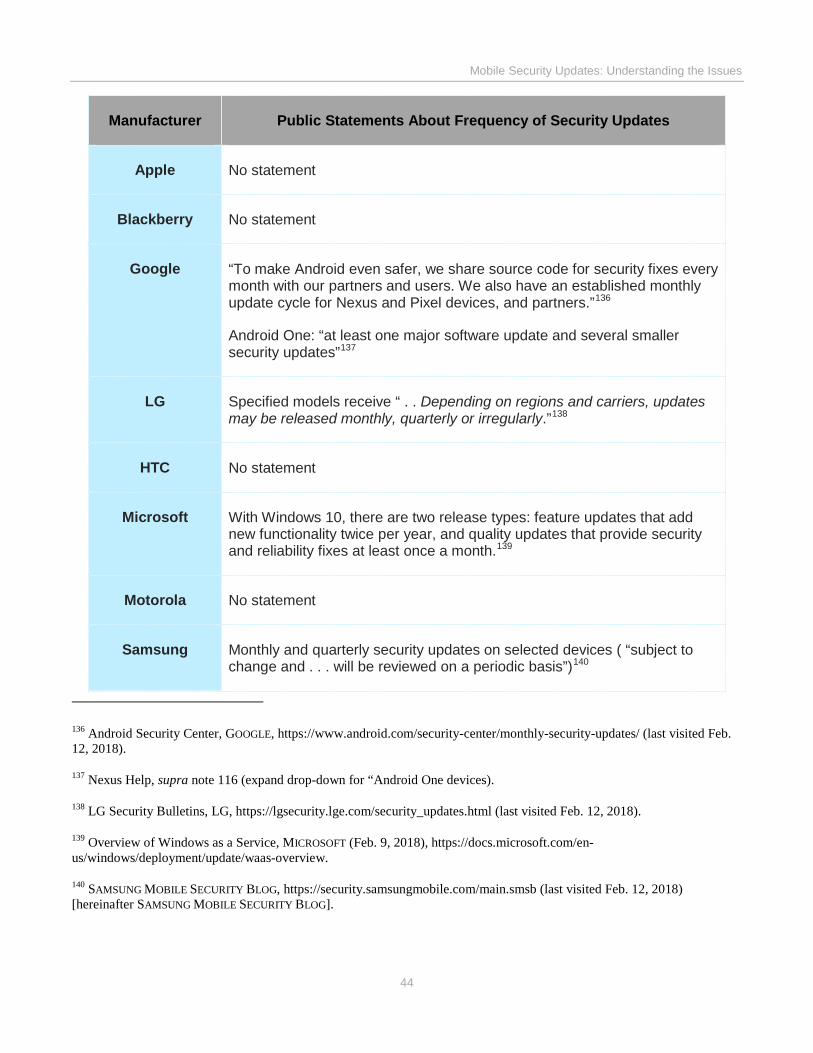
Mobile Security Updates: Understanding the Issues
44
Manufacturer Public Statements About Frequency of Security Updates
Apple No statement
Blackberry No statement
Google “To make Android even safer, we share source code for security fixes every month with our partners and users. We also have an established monthly update cycle for Nexus and Pixel devices, and partners.”136
Android One: “at least one major software update and several smaller security updates”137
LG Specified models receive “ . . Depending on regions and carriers, updates may be released monthly, quarterly or irregularly.”138
HTC No statement
Microsoft With Windows 10, there are two release types: feature updates that add new functionality twice per year, and quality updates that provide security and reliability fixes at least once a month.139
Motorola No statement
Samsung Monthly and quarterly security updates on selected devices ( “subject to change and . . . will be reviewed on a periodic basis”)140
136 Android Security Center, GOOGLE, https://www.android.com/security-center/monthly-security-updates/ (last visited Feb. 12, 2018).
137 Nexus Help, supra note 116 (expand drop-down for “Android One devices).
138 LG Security Bulletins, LG, https://lgsecurity.lge.com/security_updates.html (last visited Feb. 12, 2018).
139 Overview of Windows as a Service, MICROSOFT (Feb. 9, 2018), https://docs.microsoft.com/en-us/windows/deployment/update/waas-overview.
140 SAMSUNG MOBILE SECURITY BLOG, https://security.samsungmobile.com/main.smsb (last visited Feb. 12, 2018) [hereinafter SAMSUNG MOBILE SECURITY BLOG].
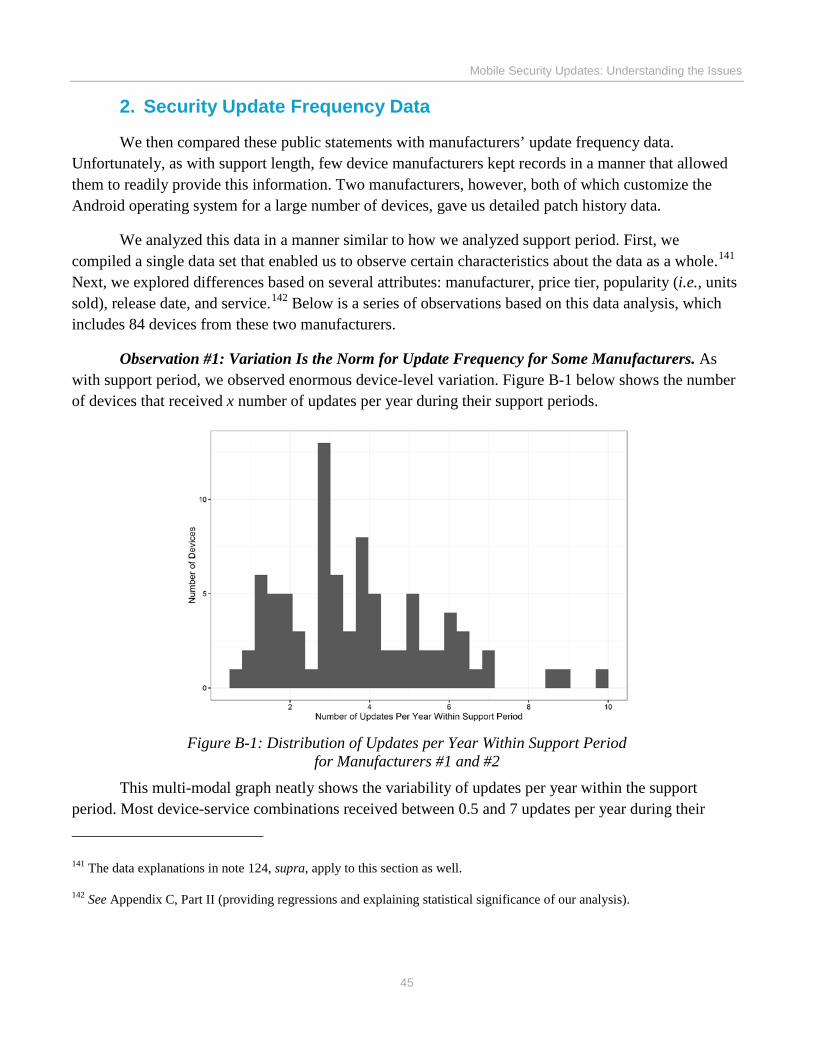
Mobile Security Updates: Understanding the Issues
45
2. Security Update Frequency Data
We then compared these public statements with manufacturers’ update frequency data. Unfortunately, as with support length, few device manufacturers kept records in a manner that allowed them to readily provide this information. Two manufacturers, however, both of which customize the Android operating system for a large number of devices, gave us detailed patch history data.
We analyzed this data in a manner similar to how we analyzed support period. First, we compiled a single data set that enabled us to observe certain characteristics about the data as a whole.141 Next, we explored differences based on several attributes: manufacturer, price tier, popularity (i.e., units sold), release date, and service.142 Below is a series of observations based on this data analysis, which includes 84 devices from these two manufacturers.
Observation #1: Variation Is the Norm for Update Frequency for Some Manufacturers. As with support period, we observed enormous device-level variation. Figure B-1 below shows the number of devices that received x number of updates per year during their support periods.
Figure B-1: Distribution of Updates per Year Within Support Period for Manufacturers #1 and #2
This multi-modal graph neatly shows the variability of updates per year within the support period. Most device-service combinations received between 0.5 and 7 updates per year during their
141 The data explanations in note 124, supra, apply to this section as well.
142 See Appendix C, Part II (providing regressions and explaining statistical significance of our analysis).
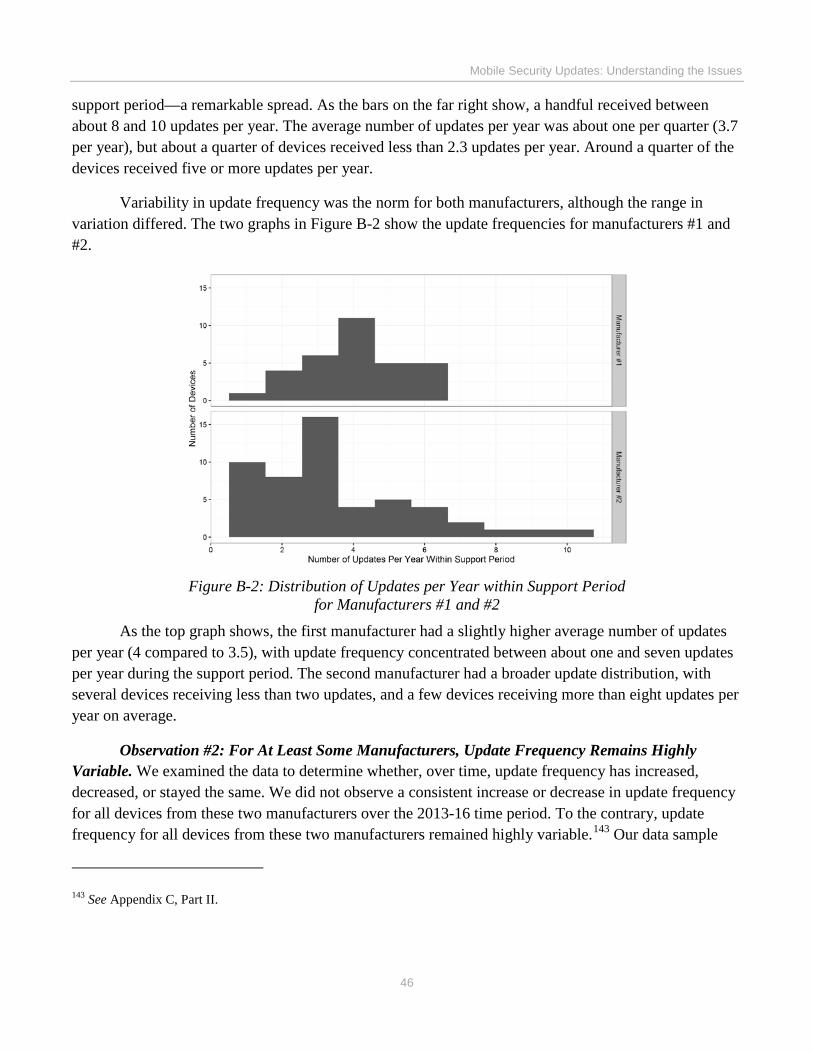
Mobile Security Updates: Understanding the Issues
46
support period—a remarkable spread. As the bars on the far right show, a handful received between about 8 and 10 updates per year. The average number of updates per year was about one per quarter (3.7 per year), but about a quarter of devices received less than 2.3 updates per year. Around a quarter of the devices received five or more updates per year.
Variability in update frequency was the norm for both manufacturers, although the range in variation differed. The two graphs in Figure B-2 show the update frequencies for manufacturers #1 and #2.
Figure B-2: Distribution of Updates per Year within Support Period for Manufacturers #1 and #2
As the top graph shows, the first manufacturer had a slightly higher average number of updates per year (4 compared to 3.5), with update frequency concentrated between about one and seven updates per year during the support period. The second manufacturer had a broader update distribution, with several devices receiving less than two updates, and a few devices receiving more than eight updates per year on average.
Observation #2: For At Least Some Manufacturers, Update Frequency Remains Highly Variable. We examined the data to determine whether, over time, update frequency has increased, decreased, or stayed the same. We did not observe a consistent increase or decrease in update frequency for all devices from these two manufacturers over the 2013-16 time period. To the contrary, update frequency for all devices from these two manufacturers remained highly variable.143 Our data sample
143 See Appendix C, Part II.
Mobile Security Updates: Understanding the Issues
47
mostly predates or is contemporaneous with the Stagefright incident and immediate aftermath. Increases in update frequency, if any, are more likely to be seen from studying data from 2016-2018.
Observation #3: Some Device Manufacturers Have Not Adopted Security-Only Updates or a Regular Patch Schedule. Device manufacturers using the Android operating system reported efforts to implement Google’s post-Stagefright monthly patch release schedule and to develop security-only updates. Manufacturer-carrier communications revealed challenges to implementing these process changes. The data also suggests uneven progress.
Monthly updates appear to be uncommon for at least some manufacturers. In this data, only one device-service combination received monthly updates within a one-year period.144 No other device-service combination approached this frequency of updates. Indeed, the same device that received monthly updates with one service option only received one update when serviced by a different carrier.
Security-only updates are not the norm. One device manufacturer identified the type of each update it issued (e.g., functionality, security, or emergency). It reported that 20 out of 154 total updates were security-only releases. Of those 20 security-only updates, eleven were for the single device described above that received monthly updates. The rest of its large device portfolio received nine security-only releases over a several year period. This suggests that at least this manufacturer has continued to prefer maintenance releases, which bundle security and functionality updates, to security-only updates.
Observation #4: For At Least Some Manufacturers’ Update Frequency, Price Matters More Than Popularity. Price was a more significant predictor of update frequency than device popularity, at least for these two manufacturers. Figure B-3 below shows a series of graphs based on price: the first shows update frequency for devices costing less than $250; the second for devices priced between $250 and $500; and the third costing more than $500.
144 This device did not receive monthly updates for its entire support period, so these monthly updates are not visible on Figure B-2, which shows average annual updates within support period.
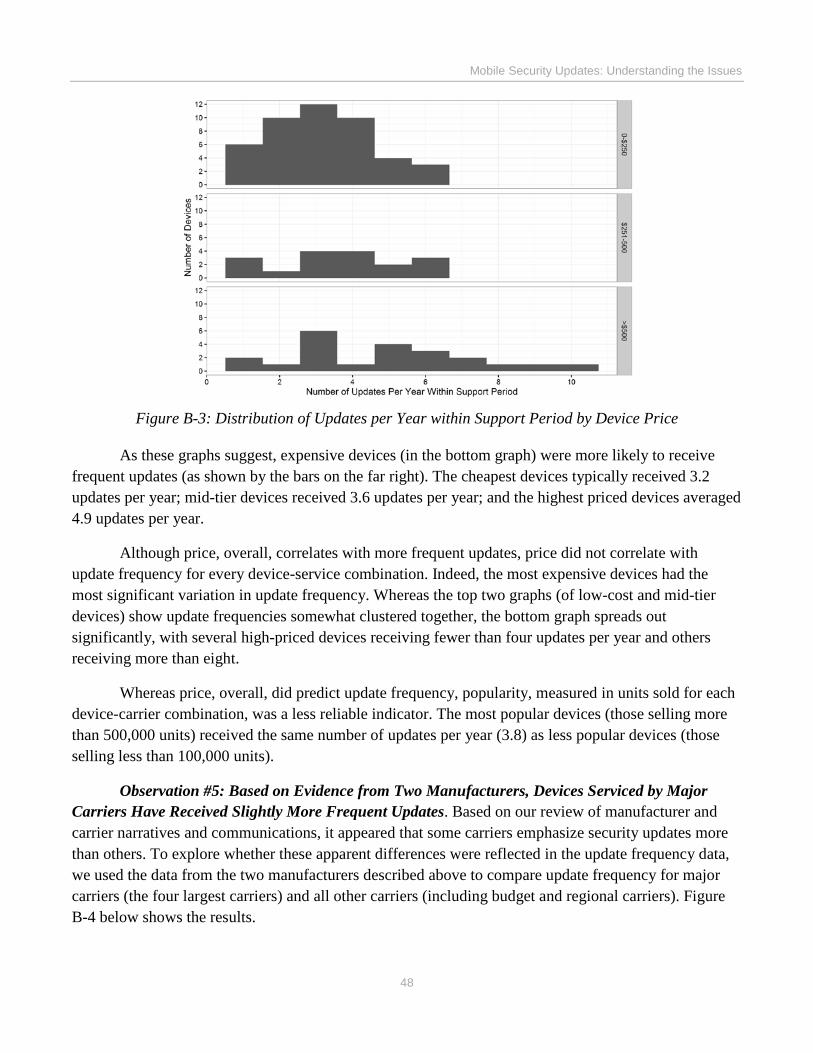
Mobile Security Updates: Understanding the Issues
48
Figure B-3: Distribution of Updates per Year within Support Period by Device Price
As these graphs suggest, expensive devices (in the bottom graph) were more likely to receive frequent updates (as shown by the bars on the far right). The cheapest devices typically received 3.2 updates per year; mid-tier devices received 3.6 updates per year; and the highest priced devices averaged 4.9 updates per year.
Although price, overall, correlates with more frequent updates, price did not correlate with update frequency for every device-service combination. Indeed, the most expensive devices had the most significant variation in update frequency. Whereas the top two graphs (of low-cost and mid-tier devices) show update frequencies somewhat clustered together, the bottom graph spreads out significantly, with several high-priced devices receiving fewer than four updates per year and others receiving more than eight.
Whereas price, overall, did predict update frequency, popularity, measured in units sold for each device-carrier combination, was a less reliable indicator. The most popular devices (those selling more than 500,000 units) received the same number of updates per year (3.8) as less popular devices (those selling less than 100,000 units).
Observation #5: Based on Evidence from Two Manufacturers, Devices Serviced by Major Carriers Have Received Slightly More Frequent Updates. Based on our review of manufacturer and carrier narratives and communications, it appeared that some carriers emphasize security updates more than others. To explore whether these apparent differences were reflected in the update frequency data, we used the data from the two manufacturers described above to compare update frequency for major carriers (the four largest carriers) and all other carriers (including budget and regional carriers). Figure B-4 below shows the results.
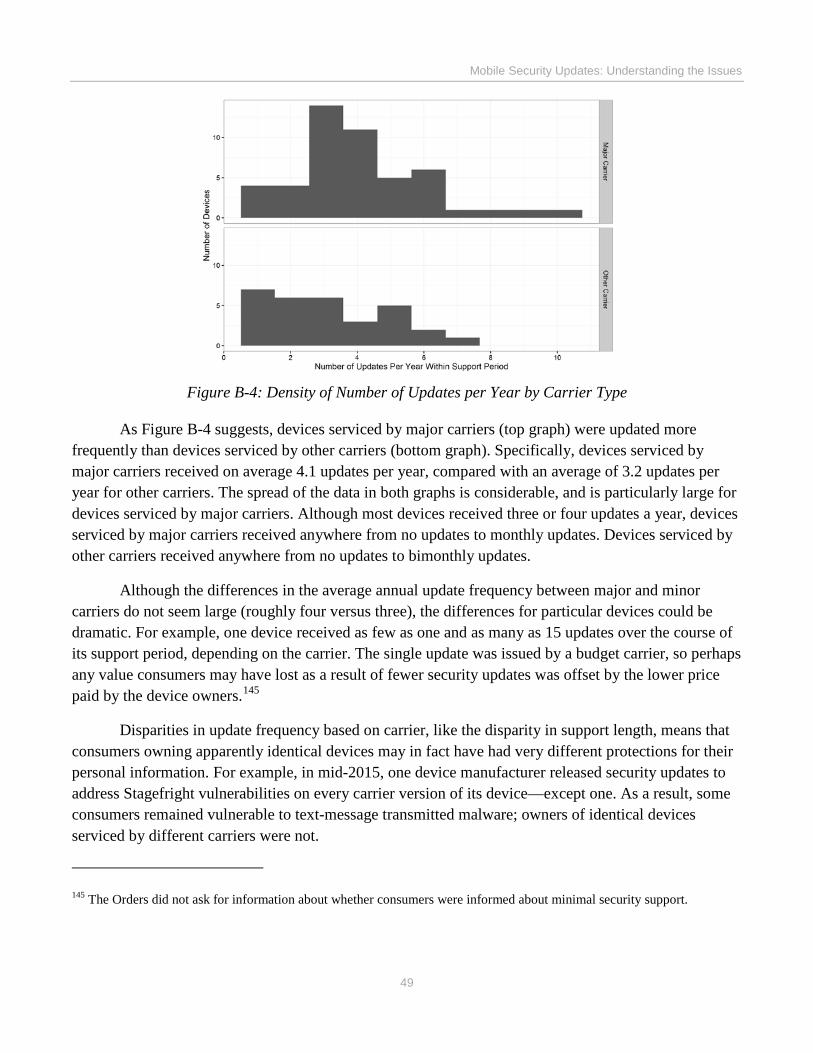
Mobile Security Updates: Understanding the Issues
49
Figure B-4: Density of Number of Updates per Year by Carrier Type
As Figure B-4 suggests, devices serviced by major carriers (top graph) were updated more frequently than devices serviced by other carriers (bottom graph). Specifically, devices serviced by major carriers received on average 4.1 updates per year, compared with an average of 3.2 updates per year for other carriers. The spread of the data in both graphs is considerable, and is particularly large for devices serviced by major carriers. Although most devices received three or four updates a year, devices serviced by major carriers received anywhere from no updates to monthly updates. Devices serviced by other carriers received anywhere from no updates to bimonthly updates.
Although the differences in the average annual update frequency between major and minor carriers do not seem large (roughly four versus three), the differences for particular devices could be dramatic. For example, one device received as few as one and as many as 15 updates over the course of its support period, depending on the carrier. The single update was issued by a budget carrier, so perhaps any value consumers may have lost as a result of fewer security updates was offset by the lower price paid by the device owners.145
Disparities in update frequency based on carrier, like the disparity in support length, means that consumers owning apparently identical devices may in fact have had very different protections for their personal information. For example, in mid-2015, one device manufacturer released security updates to address Stagefright vulnerabilities on every carrier version of its device—except one. As a result, some consumers remained vulnerable to text-message transmitted malware; owners of identical devices serviced by different carriers were not.
145 The Orders did not ask for information about whether consumers were informed about minimal security support.
Mobile Security Updates: Understanding the Issues
50
C. Patch Development and TestingThe Order required respondents to identify when they learned of vulnerabilities and patches and
when related updates were ready for testing and deployment. The respondents generally did not maintain records that would allow them to readily identify these dates.146 Most, however, provided some data related to patch development and testing. This section discusses that data and makes some observations about how quickly respondents patch vulnerabilities.147
Observation #1: Although Android Device Manufacturers Have Adopted Practices To Expedite Security Patch Development and Testing, Patch Development Times Vary. As Parts II and III described, after discovery of the Stagefright vulnerabilities in mid-2015, Android device manufacturers took steps to expedite security patch development and testing, such as adopting a fast-track for security-only updates. Only two manufacturers provided data conducive to comparing their patch rates.
Based on this data, it appears that one manufacturer patched vulnerabilities more slowly over time, although we do not know the reasons for the apparent slowing. A second manufacturer patched vulnerabilities at about the same rate (or somewhat more slowly) over time. Figure C-1 below, with these manufacturers’ patching data for years 2014, 2015, and 2016, illustrates these patch rates.
146 Device manufacturers generally maintain records about updates (which may patch multiple vulnerabilities) rather than individual vulnerabilities (the focus of the Order). As a result, manufacturers provided data with somewhat different dates (e.g., the date of discovery or notification of the vulnerability; the date on which its patch was ready for testing or was incorporated into an update ready for testing; the date on which the carrier received or approved the update; the date on which the update was first deployed or deployment was completed). These inconsistencies prevent precise comparisons of manufacturers’ practices.
147 We confined our analysis to vulnerabilities patched via updates (rather than those corrected by the time of a device’s initial release). As with the data on support length and update frequency, we used a regression analysis to examine the statistical significance of various attributes (e.g., price tier, popularity, carrier service, device release year). See Appendix C, Part III (containing regressions and statistical analysis).
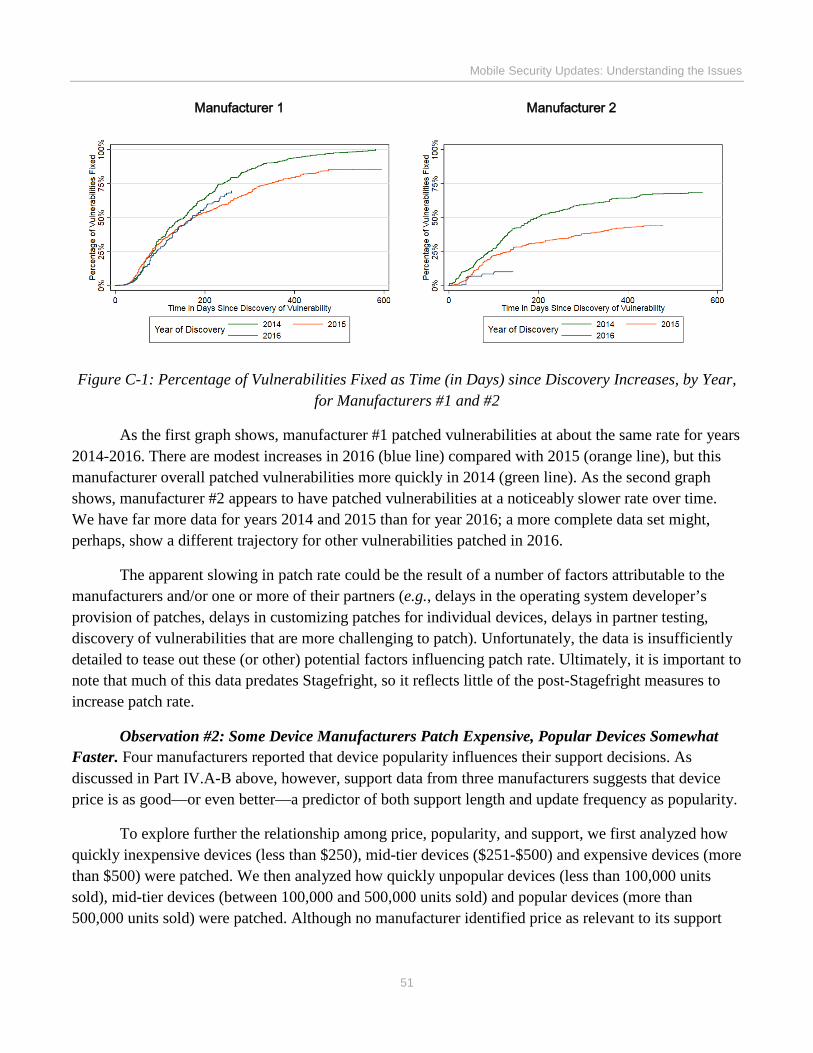
Mobile Security Updates: Understanding the Issues
51
Manufacturer 1 Manufacturer 2
Figure C-1: Percentage of Vulnerabilities Fixed as Time (in Days) since Discovery Increases, by Year, for Manufacturers #1 and #2
As the first graph shows, manufacturer #1 patched vulnerabilities at about the same rate for years 2014-2016. There are modest increases in 2016 (blue line) compared with 2015 (orange line), but this manufacturer overall patched vulnerabilities more quickly in 2014 (green line). As the second graph shows, manufacturer #2 appears to have patched vulnerabilities at a noticeably slower rate over time. We have far more data for years 2014 and 2015 than for year 2016; a more complete data set might, perhaps, show a different trajectory for other vulnerabilities patched in 2016.
The apparent slowing in patch rate could be the result of a number of factors attributable to the manufacturers and/or one or more of their partners (e.g., delays in the operating system developer’s provision of patches, delays in customizing patches for individual devices, delays in partner testing, discovery of vulnerabilities that are more challenging to patch). Unfortunately, the data is insufficiently detailed to tease out these (or other) potential factors influencing patch rate. Ultimately, it is important to note that much of this data predates Stagefright, so it reflects little of the post-Stagefright measures to increase patch rate.
Observation #2: Some Device Manufacturers Patch Expensive, Popular Devices Somewhat Faster. Four manufacturers reported that device popularity influences their support decisions. As discussed in Part IV.A-B above, however, support data from three manufacturers suggests that device price is as good—or even better—a predictor of both support length and update frequency as popularity.
To explore further the relationship among price, popularity, and support, we first analyzed how quickly inexpensive devices (less than $250), mid-tier devices ($251-$500) and expensive devices (more than $500) were patched. We then analyzed how quickly unpopular devices (less than 100,000 units sold), mid-tier devices (between 100,000 and 500,000 units sold) and popular devices (more than 500,000 units sold) were patched. Although no manufacturer identified price as relevant to its support
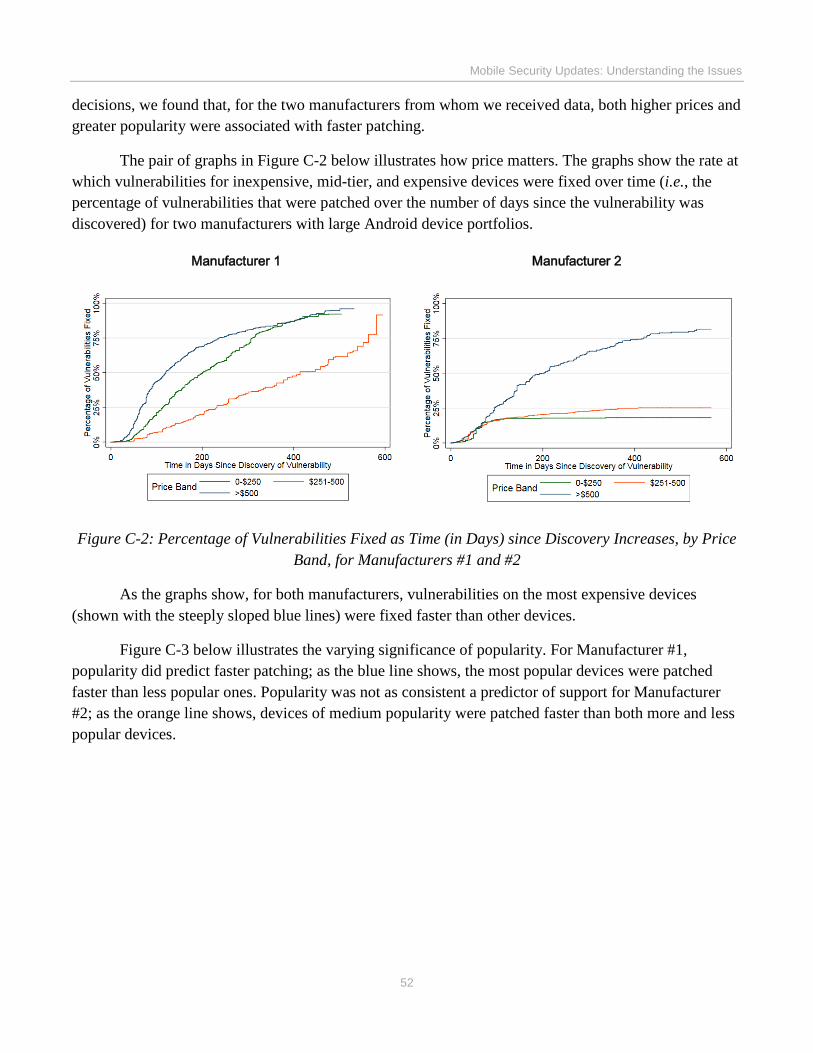
Mobile Security Updates: Understanding the Issues
52
decisions, we found that, for the two manufacturers from whom we received data, both higher prices and greater popularity were associated with faster patching.
The pair of graphs in Figure C-2 below illustrates how price matters. The graphs show the rate at which vulnerabilities for inexpensive, mid-tier, and expensive devices were fixed over time (i.e., the percentage of vulnerabilities that were patched over the number of days since the vulnerability was discovered) for two manufacturers with large Android device portfolios.
Manufacturer 1 Manufacturer 2
Figure C-2: Percentage of Vulnerabilities Fixed as Time (in Days) since Discovery Increases, by Price Band, for Manufacturers #1 and #2
As the graphs show, for both manufacturers, vulnerabilities on the most expensive devices (shown with the steeply sloped blue lines) were fixed faster than other devices.
Figure C-3 below illustrates the varying significance of popularity. For Manufacturer #1, popularity did predict faster patching; as the blue line shows, the most popular devices were patched faster than less popular ones. Popularity was not as consistent a predictor of support for Manufacturer #2; as the orange line shows, devices of medium popularity were patched faster than both more and less popular devices.
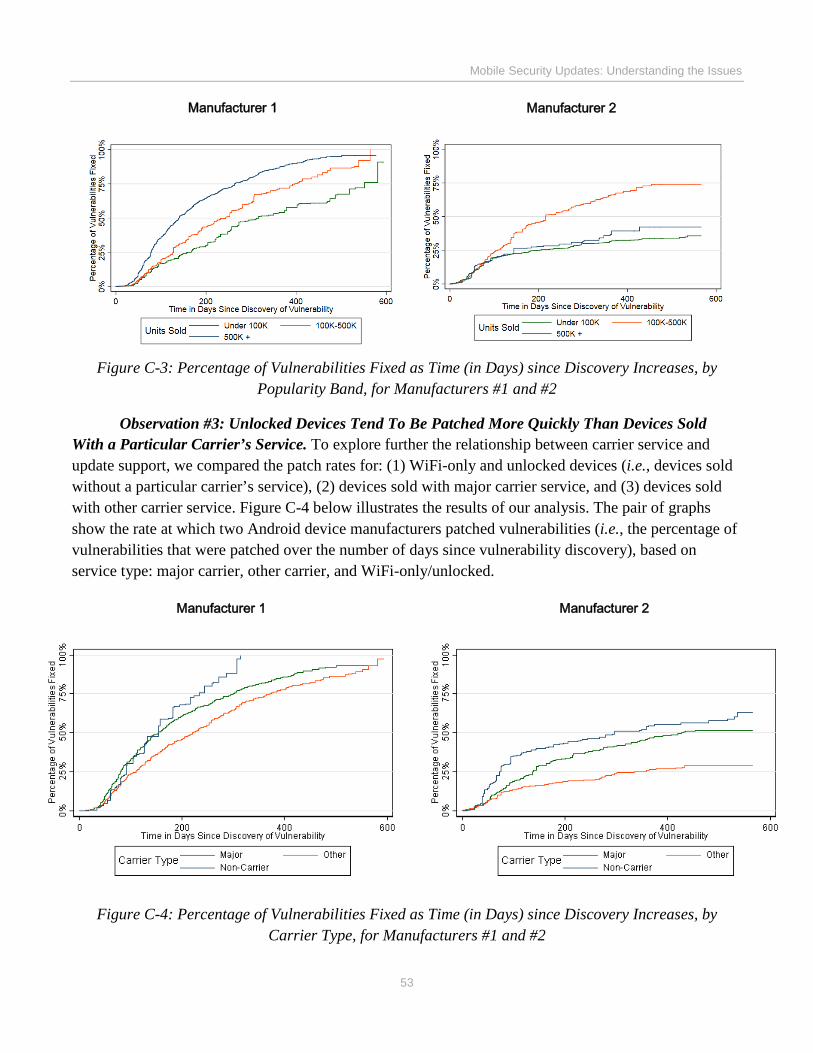
Mobile Security Updates: Understanding the Issues
53
Manufacturer 1 Manufacturer 2
Figure C-3: Percentage of Vulnerabilities Fixed as Time (in Days) since Discovery Increases, by
Popularity Band, for Manufacturers #1 and #2
Observation #3: Unlocked Devices Tend To Be Patched More Quickly Than Devices Sold With a Particular Carrier’s Service. To explore further the relationship between carrier service and update support, we compared the patch rates for: (1) WiFi-only and unlocked devices (i.e., devices sold without a particular carrier’s service), (2) devices sold with major carrier service, and (3) devices sold with other carrier service. Figure C-4 below illustrates the results of our analysis. The pair of graphs show the rate at which two Android device manufacturers patched vulnerabilities (i.e., the percentage of vulnerabilities that were patched over the number of days since vulnerability discovery), based on service type: major carrier, other carrier, and WiFi-only/unlocked.
Manufacturer 1 Manufacturer 2
Figure C-4: Percentage of Vulnerabilities Fixed as Time (in Days) since Discovery Increases, by Carrier Type, for Manufacturers #1 and #2
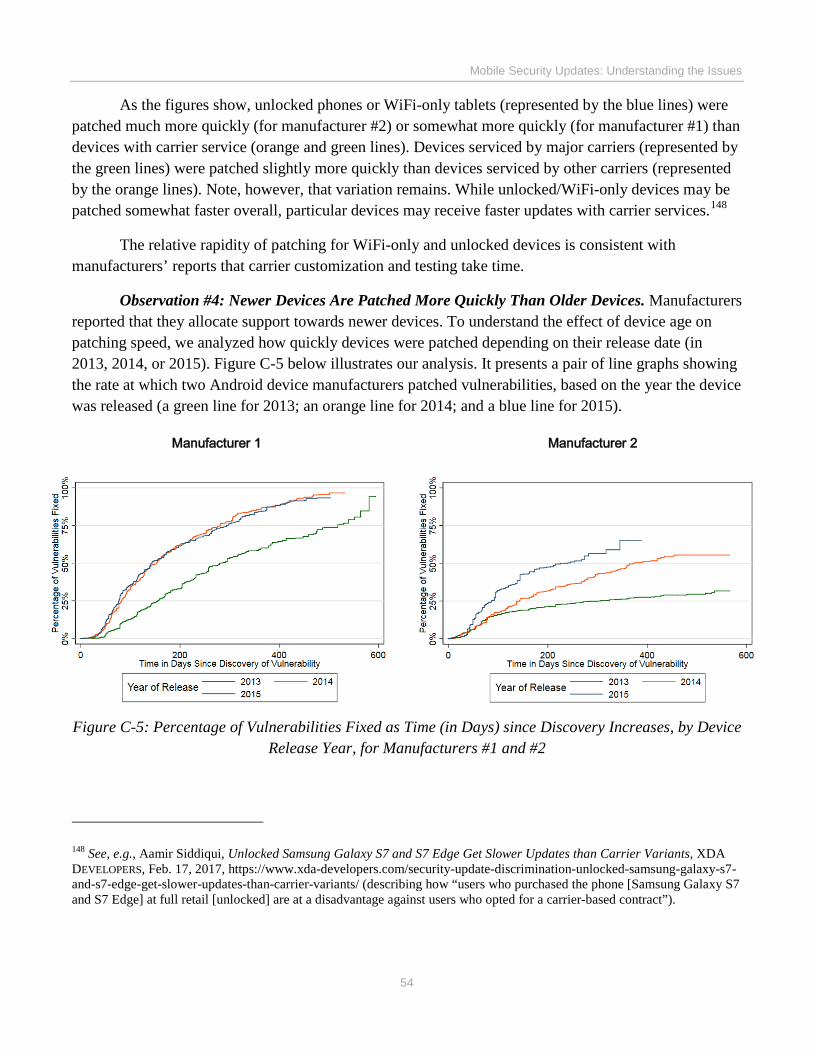
Mobile Security Updates: Understanding the Issues
54
As the figures show, unlocked phones or WiFi-only tablets (represented by the blue lines) were patched much more quickly (for manufacturer #2) or somewhat more quickly (for manufacturer #1) than devices with carrier service (orange and green lines). Devices serviced by major carriers (represented by the green lines) were patched slightly more quickly than devices serviced by other carriers (represented by the orange lines). Note, however, that variation remains. While unlocked/WiFi-only devices may be patched somewhat faster overall, particular devices may receive faster updates with carrier services.148
The relative rapidity of patching for WiFi-only and unlocked devices is consistent with manufacturers’ reports that carrier customization and testing take time.
Observation #4: Newer Devices Are Patched More Quickly Than Older Devices. Manufacturers reported that they allocate support towards newer devices. To understand the effect of device age on patching speed, we analyzed how quickly devices were patched depending on their release date (in 2013, 2014, or 2015). Figure C-5 below illustrates our analysis. It presents a pair of line graphs showing the rate at which two Android device manufacturers patched vulnerabilities, based on the year the device was released (a green line for 2013; an orange line for 2014; and a blue line for 2015).
Manufacturer 1 Manufacturer 2
Figure C-5: Percentage of Vulnerabilities Fixed as Time (in Days) since Discovery Increases, by Device
Release Year, for Manufacturers #1 and #2
148 See, e.g., Aamir Siddiqui, Unlocked Samsung Galaxy S7 and S7 Edge Get Slower Updates than Carrier Variants, XDA DEVELOPERS, Feb. 17, 2017, https://www.xda-developers.com/security-update-discrimination-unlocked-samsung-galaxy-s7-and-s7-edge-get-slower-updates-than-carrier-variants/ (describing how “users who purchased the phone [Samsung Galaxy S7 and S7 Edge] at full retail [unlocked] are at a disadvantage against users who opted for a carrier-based contract”).
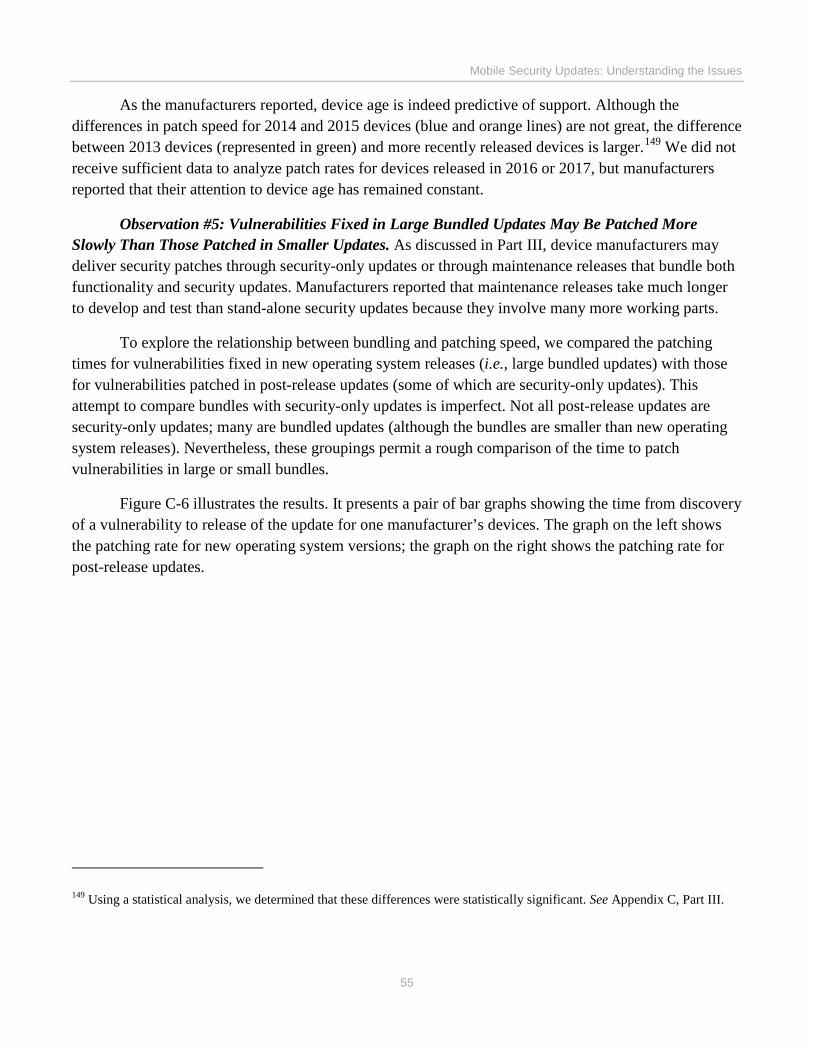
Mobile Security Updates: Understanding the Issues
55
As the manufacturers reported, device age is indeed predictive of support. Although the differences in patch speed for 2014 and 2015 devices (blue and orange lines) are not great, the difference between 2013 devices (represented in green) and more recently released devices is larger.149 We did not receive sufficient data to analyze patch rates for devices released in 2016 or 2017, but manufacturers reported that their attention to device age has remained constant.
Observation #5: Vulnerabilities Fixed in Large Bundled Updates May Be Patched More Slowly Than Those Patched in Smaller Updates. As discussed in Part III, device manufacturers may deliver security patches through security-only updates or through maintenance releases that bundle both functionality and security updates. Manufacturers reported that maintenance releases take much longer to develop and test than stand-alone security updates because they involve many more working parts.
To explore the relationship between bundling and patching speed, we compared the patching times for vulnerabilities fixed in new operating system releases (i.e., large bundled updates) with those for vulnerabilities patched in post-release updates (some of which are security-only updates). This attempt to compare bundles with security-only updates is imperfect. Not all post-release updates are security-only updates; many are bundled updates (although the bundles are smaller than new operating system releases). Nevertheless, these groupings permit a rough comparison of the time to patch vulnerabilities in large or small bundles.
Figure C-6 illustrates the results. It presents a pair of bar graphs showing the time from discovery of a vulnerability to release of the update for one manufacturer’s devices. The graph on the left shows the patching rate for new operating system versions; the graph on the right shows the patching rate for post-release updates.
149 Using a statistical analysis, we determined that these differences were statistically significant. See Appendix C, Part III.
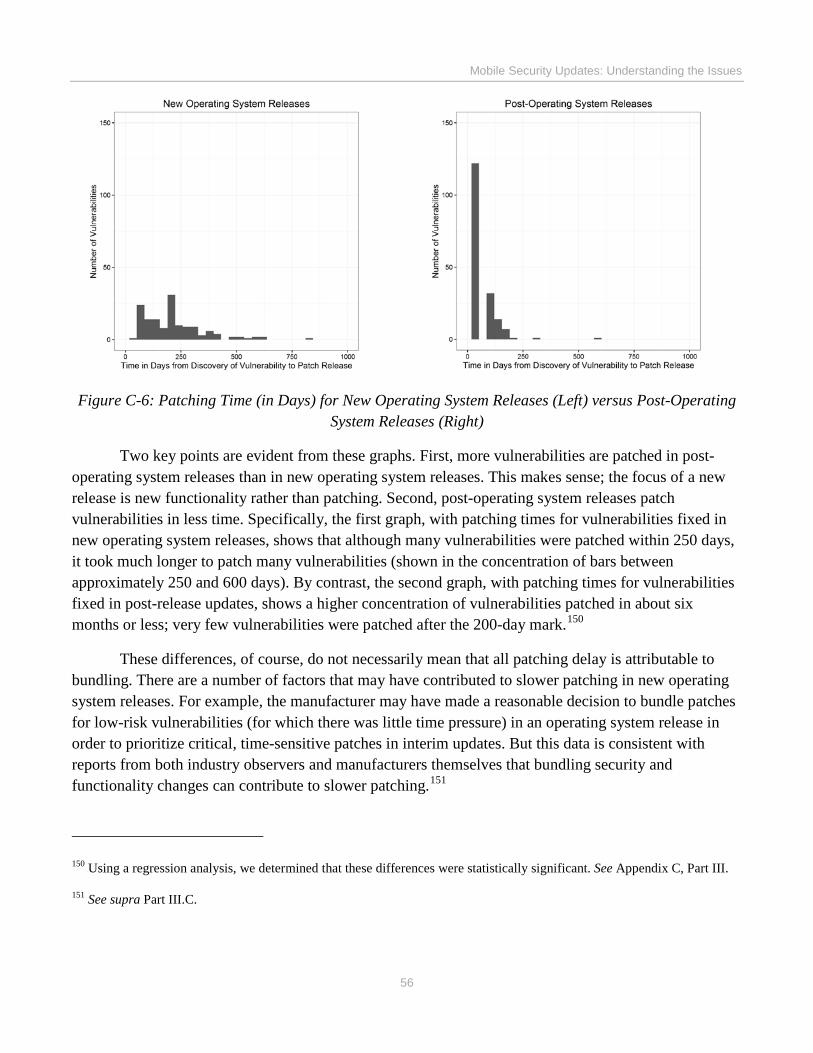
Mobile Security Updates: Understanding the Issues
56
Figure C-6: Patching Time (in Days) for New Operating System Releases (Left) versus Post-Operating System Releases (Right)
Two key points are evident from these graphs. First, more vulnerabilities are patched in post-operating system releases than in new operating system releases. This makes sense; the focus of a new release is new functionality rather than patching. Second, post-operating system releases patch vulnerabilities in less time. Specifically, the first graph, with patching times for vulnerabilities fixed in new operating system releases, shows that although many vulnerabilities were patched within 250 days, it took much longer to patch many vulnerabilities (shown in the concentration of bars between approximately 250 and 600 days). By contrast, the second graph, with patching times for vulnerabilities fixed in post-release updates, shows a higher concentration of vulnerabilities patched in about six months or less; very few vulnerabilities were patched after the 200-day mark.150
These differences, of course, do not necessarily mean that all patching delay is attributable to bundling. There are a number of factors that may have contributed to slower patching in new operating system releases. For example, the manufacturer may have made a reasonable decision to bundle patches for low-risk vulnerabilities (for which there was little time pressure) in an operating system release in order to prioritize critical, time-sensitive patches in interim updates. But this data is consistent with reports from both industry observers and manufacturers themselves that bundling security and functionality changes can contribute to slower patching.151
150 Using a regression analysis, we determined that these differences were statistically significant. See Appendix C, Part III.
151 See supra Part III.C.
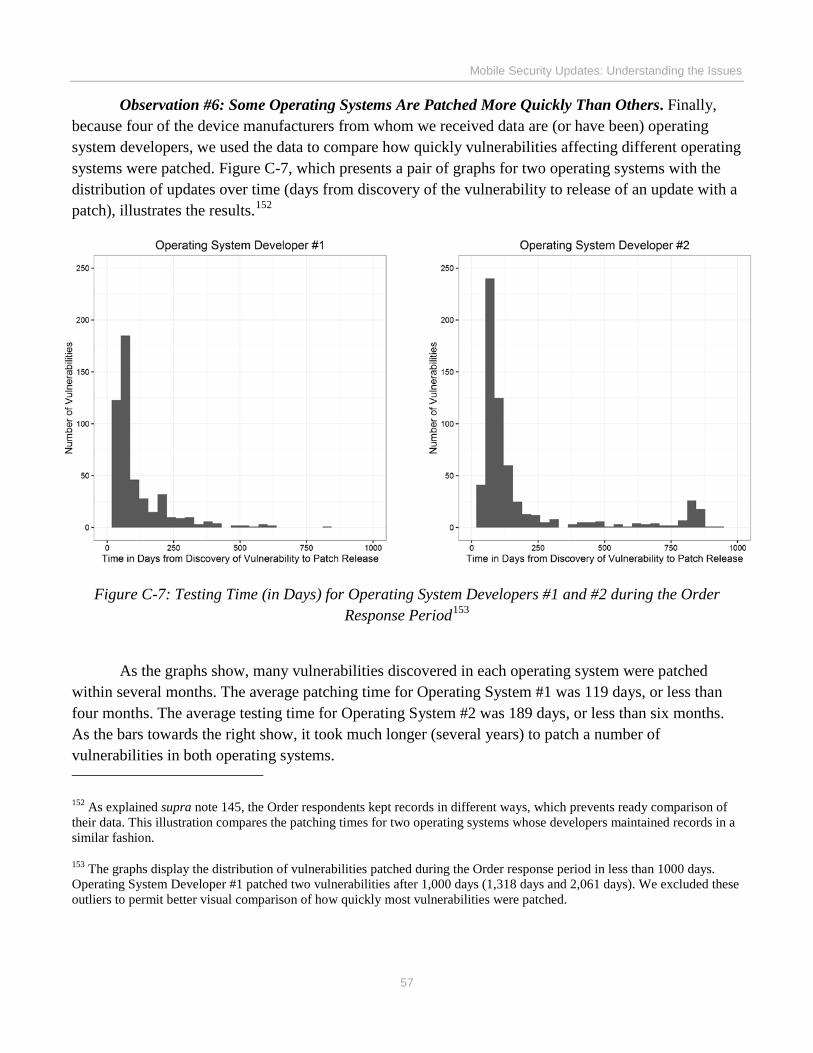
Mobile Security Updates: Understanding the Issues
57
Observation #6: Some Operating Systems Are Patched More Quickly Than Others. Finally, because four of the device manufacturers from whom we received data are (or have been) operating system developers, we used the data to compare how quickly vulnerabilities affecting different operating systems were patched. Figure C-7, which presents a pair of graphs for two operating systems with the distribution of updates over time (days from discovery of the vulnerability to release of an update with a patch), illustrates the results.152
Figure C-7: Testing Time (in Days) for Operating System Developers #1 and #2 during the Order Response Period153
As the graphs show, many vulnerabilities discovered in each operating system were patched within several months. The average patching time for Operating System #1 was 119 days, or less than four months. The average testing time for Operating System #2 was 189 days, or less than six months. As the bars towards the right show, it took much longer (several years) to patch a number of vulnerabilities in both operating systems.
152 As explained supra note 145, the Order respondents kept records in different ways, which prevents ready comparison of their data. This illustration compares the patching times for two operating systems whose developers maintained records in a similar fashion.
153 The graphs display the distribution of vulnerabilities patched during the Order response period in less than 1000 days. Operating System Developer #1 patched two vulnerabilities after 1,000 days (1,318 days and 2,061 days). We excluded these outliers to permit better visual comparison of how quickly most vulnerabilities were patched.
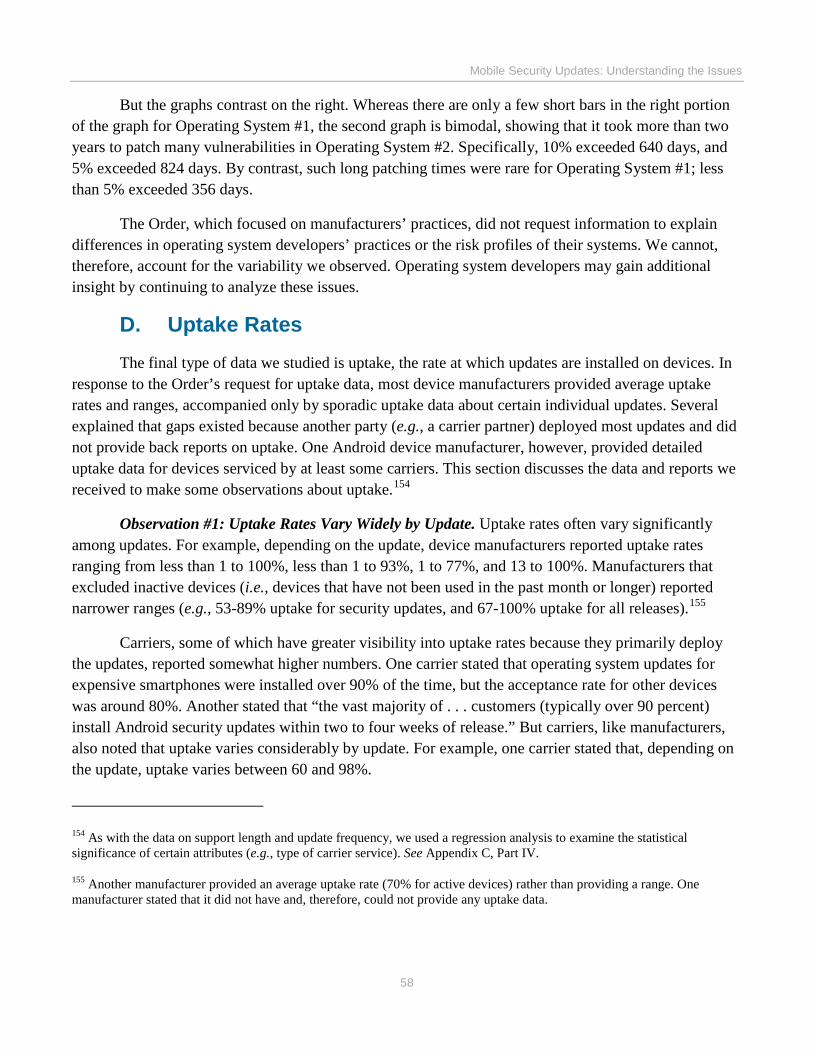
Mobile Security Updates: Understanding the Issues
58
But the graphs contrast on the right. Whereas there are only a few short bars in the right portion of the graph for Operating System #1, the second graph is bimodal, showing that it took more than two years to patch many vulnerabilities in Operating System #2. Specifically, 10% exceeded 640 days, and 5% exceeded 824 days. By contrast, such long patching times were rare for Operating System #1; less than 5% exceeded 356 days.
The Order, which focused on manufacturers’ practices, did not request information to explain differences in operating system developers’ practices or the risk profiles of their systems. We cannot, therefore, account for the variability we observed. Operating system developers may gain additional insight by continuing to analyze these issues.
D. Uptake Rates The final type of data we studied is uptake, the rate at which updates are installed on devices. In
response to the Order’s request for uptake data, most device manufacturers provided average uptake rates and ranges, accompanied only by sporadic uptake data about certain individual updates. Several explained that gaps existed because another party (e.g., a carrier partner) deployed most updates and did not provide back reports on uptake. One Android device manufacturer, however, provided detailed uptake data for devices serviced by at least some carriers. This section discusses the data and reports we received to make some observations about uptake.154
Observation #1: Uptake Rates Vary Widely by Update. Uptake rates often vary significantly among updates. For example, depending on the update, device manufacturers reported uptake rates ranging from less than 1 to 100%, less than 1 to 93%, 1 to 77%, and 13 to 100%. Manufacturers that excluded inactive devices (i.e., devices that have not been used in the past month or longer) reported narrower ranges (e.g., 53-89% uptake for security updates, and 67-100% uptake for all releases).155
Carriers, some of which have greater visibility into uptake rates because they primarily deploy the updates, reported somewhat higher numbers. One carrier stated that operating system updates for expensive smartphones were installed over 90% of the time, but the acceptance rate for other devices was around 80%. Another stated that “the vast majority of . . . customers (typically over 90 percent) install Android security updates within two to four weeks of release.” But carriers, like manufacturers, also noted that uptake varies considerably by update. For example, one carrier stated that, depending on the update, uptake varies between 60 and 98%.
154 As with the data on support length and update frequency, we used a regression analysis to examine the statistical significance of certain attributes (e.g., type of carrier service). See Appendix C, Part IV.
155 Another manufacturer provided an average uptake rate (70% for active devices) rather than providing a range. One manufacturer stated that it did not have and, therefore, could not provide any uptake data.
Mobile Security Updates: Understanding the Issues
59
Figure D-1 below depicts the distribution of uptake for the one manufacturer that provided the most granular data. This graph neatly illustrates the variability in uptake that manufacturers and carriers reported.
Figure D-1: Distribution of Percent Uptake for One Manufacturer’s Updates
The figure shows the wide range of update success. A majority of updates had high take rates: about half above 80%. Nearly half, however, fell below 80%, about a quarter of updates fell below 50%, and one fell below 10%.
Observation #2: Limited Data Does Not Show a Consistent Relationship Between Carrier Identity or Carrier Type and Uptake Rate. As Part III explained, carriers, rather than manufacturers, sometimes deploy updates and make decisions about deployment timing and method that can affect uptake. It seems plausible that, as a result of these practices, devices serviced by certain carriers experience better uptake. For some individual cases, carrier identity certainly mattered. For example, we received reports of uptake ranging from about 6% to 98% for the same device and update, depending on the carrier.
To explore the relationship between carrier identity or type and uptake, we examined uptake by individual carrier and computed the average uptake rate for major carriers (i.e., the four largest carriers) and for all other carriers (which includes smaller and low-cost carriers and MVNOs). For the most part,
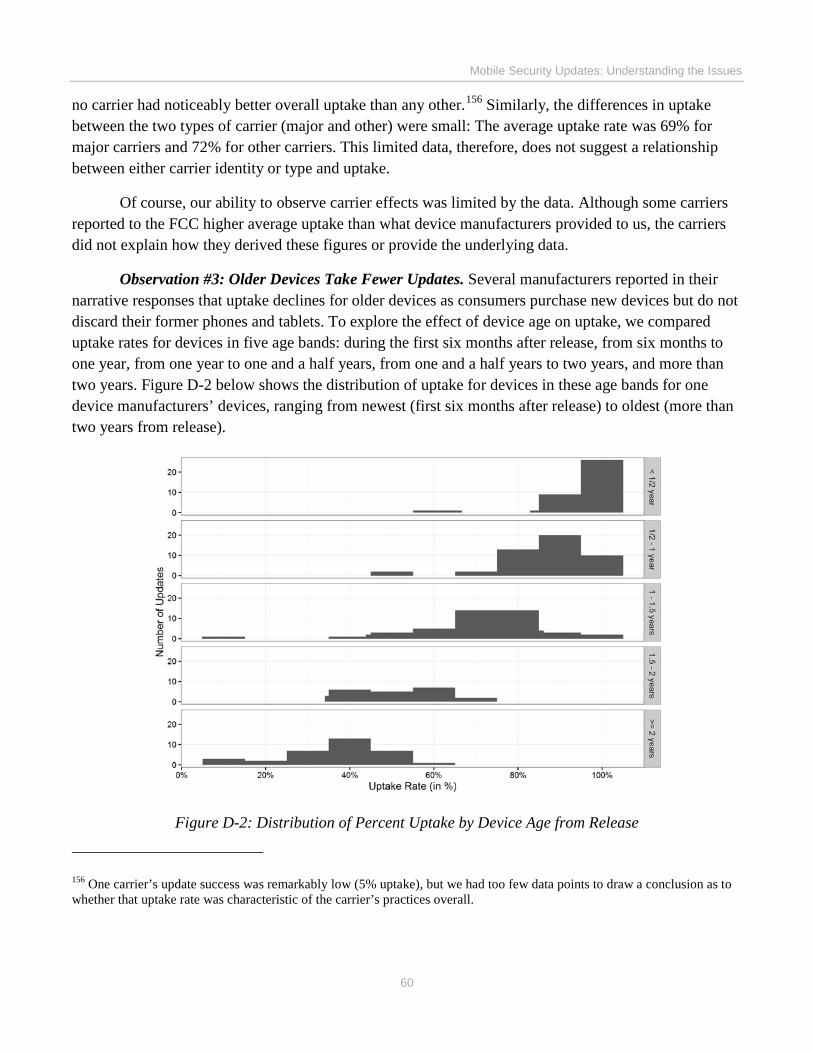
Mobile Security Updates: Understanding the Issues
60
no carrier had noticeably better overall uptake than any other.156 Similarly, the differences in uptake between the two types of carrier (major and other) were small: The average uptake rate was 69% for major carriers and 72% for other carriers. This limited data, therefore, does not suggest a relationship between either carrier identity or type and uptake.
Of course, our ability to observe carrier effects was limited by the data. Although some carriers reported to the FCC higher average uptake than what device manufacturers provided to us, the carriers did not explain how they derived these figures or provide the underlying data.
Observation #3: Older Devices Take Fewer Updates. Several manufacturers reported in their narrative responses that uptake declines for older devices as consumers purchase new devices but do not discard their former phones and tablets. To explore the effect of device age on uptake, we compared uptake rates for devices in five age bands: during the first six months after release, from six months to one year, from one year to one and a half years, from one and a half years to two years, and more than two years. Figure D-2 below shows the distribution of uptake for devices in these age bands for one device manufacturers’ devices, ranging from newest (first six months after release) to oldest (more than two years from release).
Figure D-2: Distribution of Percent Uptake by Device Age from Release
156 One carrier’s update success was remarkably low (5% uptake), but we had too few data points to draw a conclusion as to whether that uptake rate was characteristic of the carrier’s practices overall.
Mobile Security Updates: Understanding the Issues
61
The shift to the left through the age bands is consistent with some manufacturers’ description of uptake decreases as phones and tablets age. For this manufacturer, the trend was consistent regardless of carrier identity or type (major or other).
Failure to install updates, however, cannot entirely be due to consumers’ discarding of older devices; as noted earlier, manufacturers who calculated uptake rate solely in terms of active devices still reported uptake rates as low as 53% for some security updates. Other factors likely contribute to low uptake for older devices. For example, updates use device storage, so consumers may be less likely to accept updates as they use up that storage. And, over time, some consumers may become less interested in maintaining devices that they plan to replace in the near future.
Observation #4: Many Device Manufacturers Lack Basic Information About Uptake. Perhaps the most salient aspect of manufacturers’ responses about uptake was the fact that they did not have much data. For example, two manufacturers reported that they did not have, and could not readily obtain, uptake data for about a third of their updates. A third had no data for almost 90% of its updates, and a fourth reported that it had no uptake data whatsoever about its large portfolio of devices.
There are several potential explanations for this lack of data: lack of access to it, failure to share it, or failure to record it. As described in Part III, the identity of the deploying party varies by device and service: The manufacturer, carrier, or the operating system developer may deploy the update. The deploying party may record information about the deployment and may share that information with its partners. But there does not appear to be any standard industry practice for sharing data. Indeed, communications revealed one instance in which a manufacturer sought uptake data from carriers for a partner who was studying security update take rates. One carrier informed the manufacturer that the requested take rates were too hard to find; the carrier instead provided uptake rates about different updates.
Based on our review of carrier-manufacturer correspondence, it appears that carriers that deploy updates can provide important insights about uptake to their manufacturer partners. For example, one communication revealed a carrier (which had studied all of its manufacturers’ uptake data) informing a manufacturer that it needed to change practices to achieve better uptake. The carrier explained that the manufacturer’s devices had excellent uptake initially but its take rate fell precipitously for two reasons: Its updates were larger than other manufacturers’ and it allocated less device storage for updates than other manufacturers. The carrier told the manufacturer that it needed to adjust its practices because low uptake “ultimately impacts our ability to get security updates on key [manufacturer] devices.”
V. Security Update Information For Consumers The previous Parts described the role of patching in the mobile ecosystem, provided an overview of the mobile security update process, and made some observations about device manufacturers’ security update practices. This Part describes what information about security support is currently available to consumers.
Mobile Security Updates: Understanding the Issues
62
The most common ways to convey security support information to consumers are through manufacturer and carrier websites, an on-device “Update” feature in the “Settings” menu, direct messaging such as pop-up update notifications, and social media, each of which is described below.
Websites: As Part IV, Sections A and B described, some information about update support period and update frequency is available on device manufacturers’ websites. Specifically, as the chart in Part IV.A shows, Google and Microsoft’s websites publish their devices’ support periods or lifecycles, expressly stating the month and year when the device will no longer be supported. Google separately identifies the month and year when security support will end. And as the chart in Part IV.B shows, Google, LG, Microsoft, and Samsung make (or have made) at least qualified statements about update frequency on their websites. Most device manufacturer websites, however, do not include any information about support length or precise information about update frequency.
Some manufacturer and carrier websites provide certain update information based on device and carrier. For example, a consumer visiting LG’s website may “[b]rowse by [p]roduct,” select “Mobile Devices > LG Cell phones,” select a particular carrier, identify a particular device model, and (where available) click on the update instructions to view the software version history.157 A consumer might be able to deduce that a device last updated to an older version of the Android operating system (e.g., last updated to Android version 6.0, Marshmallow158) is no longer supported with security updates, but the website does not explicitly convey this information.
By contrast, a consumer visiting Motorola’s website may learn whether her device is still receiving security updates. After visiting “Your Home for Upgrades,” a consumer may select where she purchased her device (e.g., AT&T), then select her device model, and receive tailored update information.159 For example, after selecting AT&T and Moto X2, a consumer receives this notice: “This product will no longer receive security updates.” A consumer who selects AT&T and Moto X Pure Edition is instead notified: “This product is scheduled to continue to receive security updates.”
Some carriers also provide update information. For example, a consumer visiting Verizon’s website can select particular device models to learn the date of the last update.160 A consumer might
157 Software & Drivers, LG, http://www.lg.com/us/support/software-firmware-drivers (last visited Feb. 12, 2018).
158 LG G5 AT&T H820 SOFTWARE UPDATE, LG, http://www.lg.com/us/support/product-help/CT10000027-20150145319441 (last visited Feb. 12, 2018).
159 Your Home For Upgrades, MOTOROLA, https://motorola-global-portal.custhelp.com/app/software-upgrade-news/g_id/1949 (last visited Feb. 12, 2018).
160Advanced Devices – Software Updates, VERIZON WIRELESS, https://www.verizonwireless.com/support/software-updates/ (last visited Feb. 12, 2018).
Mobile Security Updates: Understanding the Issues
63
deduce from an older date (e.g., 03/14/2013 for the Droid Charge by Samsung161) that security update support has ended, but the site does not explicitly convey that information. T-Mobile website visitors can find a list of devices eligible for the latest operating system update, Android 8.0, Oreo.162 If a device is not listed on this page, consumers can learn more by visiting the “Devices” page,163 which allows searches by model name. If a model has an older version of the operating system (e.g., Android 4.4.x, KitKat,164 which is four versions older than the current version), the consumer might conclude that security support has ended. The website does not, however, explicitly convey that information.
A few manufacturer websites address update speed. For example, BlackBerry states that it is “the quickest to deliver security patches.”165 Google explains that its updates typically reach devices within two weeks, but devices with carrier service may take longer.166 Microsoft notes that update distribution for its older Windows 8.1 operating system may be controlled by the device manufacturer or carrier who sold the device.167
In addition to this support information, some websites address the mechanics of an update. For example, device manufacturer websites describe how much time to set aside for the update, how to power the device (i.e., connect to a charger with a certain minimum battery level), how to access the Internet (i.e., connect to the carrier network and/or WiFi),168 and common reasons why updates fail.169 On its website, HTC describes the update process itself, posting a flow chart with the 8-12 steps of its update process.170
161 Id. (expand “Samsung,” scroll to third item in list).
162 Software Updates, T-MOBILE, https://support.t-mobile.com/community/phones-tablets-devices/software-updates (last visited Feb. 12, 2018).
163 Devices, T-MOBILE, https://support.t-mobile.com/community/phones-tablets-devices (last visited Feb. 12, 2018).
164 Motorola Moto X, T-MOBILE, https://support.t-mobile.com/community/phones-tablets-devices/android/motorola-moto-x (last visited Feb. 12, 2018).
165 The World’s Most Secure Android Smartphone, BLACKBERRY, https://us.blackberry.com/software/smartphones/android/most-secure-smartphone (last visited Feb. 12, 2018).
166 Nexus Help, supra note 116.
167 Search Product Lifecycle, Windows Phone 8.1, MICROSOFT, https://support.microsoft.com/en-us/lifecycle/search?sort=PN&alpha=windows%20phone%208.1&Filter=FilterNO (last visited Feb. 12, 2018).
168 Updates & Downloads, HTC, http://www.htc.com/us/support/htc-one-a9-att/news/ (last visited July 7, 2016).
169 See, e.g., Nexus Help, supra note 116.
170 The Anatomy of an Android OS Update, HTC, http://www.htc.com/us/go/htc-software-updates-process/ (last visited Feb. 12, 2018).
Mobile Security Updates: Understanding the Issues
64
Finally, several manufacturers devote blogs or web pages specifically to security update information. For example, Samsung publishes a “Mobile Security Blog” that compiles its update schedule, provides information about which vulnerabilities are addressed by each update, accepts bug reports, and issues occasional security posts.171 Motorola and LG maintain security update web pages that post details on recent security releases.172
On-Device Feature: Another way manufacturers convey support information is through an update feature in their device’s settings menu. This feature allows consumers to obtain dynamic update information: the current operating system version and whether an update is available. Since the aftermath of Stagefright in 2015, Google has required all Android device manufacturers to identify the device’s “security patch level”—the date the device last received a security patch (e.g., June 1, 2016).173
Although these features convey valuable support information, none of the current features expressly inform device owners whether and when regular security support has ended or will end.
Direct Messaging: Some manufacturers and carriers send consumers pop-up notifications or text messages to notify them of an available update. Several manufacturers noted the importance of using direct messaging sparingly, to avoid annoying customers. Several observed, however, that just-in-time messaging can significantly improve uptake rates. No manufacturer currently uses direct messaging to inform device owners when security support is about to end, or has ended.
Social Media: Some manufacturers respond to consumers’ security-related questions by social media, such as Twitter and Facebook posts. For example, several have responded to consumer queries about updates addressing specific vulnerabilities (such as Stagefright vulnerabilities) with information about the update’s status.174 This medium best serves consumers who are sufficiently well informed about update practices to pose such questions.
171 SAMSUNG MOBILE SECURITY BLOG, supra note 140.
172 Your Home For Upgrades, supra note 159; LG Security Bulletins, LG, https://lgsecurity.lge.com/security_updates.html (last visited Feb. 12, 2018).
173 2016 ANDROID SECURITY REPORT, supra note 29 at 31; Android Security Bulletin—February 2018, GOOGLE, (Feb. 5, 2018), https://source.android.com/security/bulletin/2018-02-01.
174 See, e.g., @HTCAmerica, TWITTER (Aug. 8, 2015), https://twitter.com/search?l=&q=stagefright%20from%3AHTCUSA&src=typd&lang=en (“In regards to StageFright, it’s our number one priority and our engineering team is working on it as we speak.”).
Mobile Security Updates: Understanding the Issues
65
Other: Finally, at times, update information is available through issue-specific press releases175 or end user license agreements that describe updates generally. In addition, manufacturers occasionally include general update-related information on device packaging—advertising, for example, “timely” operating system updates.
VI. Findings and Recommendations This report reflects the information provided in response to the Orders issued to eight device manufacturers, FCC letters sent to six carriers, information gathered through follow-up communications with these parties, and information gathered through publicly available sources. The information we received provides insight into some manufacturers’ practices. This data is not, however, sufficiently broad or nuanced to permit definitive conclusions about industry-wide practices. Nevertheless, based on insight gleaned from these limited materials, the Commission makes the following preliminary findings and recommendations:
A. Preliminary Findings
1. Characteristics of Some Industry Participants
• Because of the complexity of the mobile ecosystem, the security update process can be complex and time-consuming. Many device manufacturers customize third-party operating system software at the device level, either to introduce new features or at the request of a carrier partner. As a result, a single operating system update may require dozens or hundreds of different device-level modifications, all of which may be tested by carrier partners (and, sometimes, additional third parties). Carrier testing labs with finite resources must accommodate hundreds of updates from multiple device manufacturers. As a result, there are many reasons why a security update may take weeks, months, or even years to be completed.
• Industry participants have taken steps to streamline the security update process but bottlenecks remain. Over the past two years, operating system developers, device manufacturers and carriers have implemented new policies and practices to improve the security update process, such as security-only updates and regular security update schedules. Support data from three manufacturers that comprise a large proportion of the Android device market and communications between eight manufactures and some carrier partners show that, to some extent, these efforts are working: Manufacturers and carriers have reduced testing times for some
175 See, e.g., Press Release, HTC America, Inc., HTC America Challenges Industry Standards With Innovative Ownership Experience and New Commitments to Customers (Feb. 19, 2014), https://www.htc.com/us/about/newsroom/2014/2014-02-19-htc-america-challenges-industry-standards-with-innovative-ownership-experience-and-new-commitments-to-customers/.
Mobile Security Updates: Understanding the Issues
66
updates and are issuing more frequent security updates for some devices. But update support data and communications also reveal that adoption of these changes is uneven and significant time gaps between discovery of vulnerabilities and patching likely still exist.
• Support periods and update schedules are highly variable. Formal support policies are rare. Many manufacturers prefer just-in-time support decisions, based on an informal assessment of factors such as the device’s age and popularity, the cost of support, partner input, the severity of the vulnerability, and regularly scheduled releases. As a result, update support periods and update schedules are highly variable. In some cases, the same model of phone receives markedly different update support depending on the carrier servicing the phone. Among some manufacturers and carriers, there seem to be few clear patterns of update support for similar devices.
• Device manufacturers that develop and control their own operating systems tend to commit in advance to longer support periods (usually for several years) for devices. Because they tend not to customize their operating system for particular devices, certain support costs (e.g., for patch implementation and carrier testing) are likely lower.
• Some device manufacturers state that they do not commit to firm update support periods or schedules because they cannot anticipate market conditions. Several manufacturers reported that it is difficult to predict (and share with consumers) update support periods and update schedules, because update support decisions turn on unpredictable variables like popularity. Some data, however, suggests that support period length (for at least some manufacturers) is as closely correlated with device price and age as it is with popularity. Although support predictions likely require highly complex analyses, manufacturers interested in publicizing update support periods may be able to learn from past update support practices related to device price and age to inform update support estimates.
• Many device manufacturers do not maintain regular records about update support. A number of manufacturers reported that they could not provide data in response to the Commission’s Order because they do not record information about update support decisions, customized patch development time, carrier testing time, deployment time, or uptake rate. At the same time, manufacturer-carrier communications revealed that when companies do record, study, and share their data, they have gleaned important insights that lead to practice improvements.
• Manufacturers provide little express information about support period, update frequency, and end of update support. Some manufacturers make information about security update support (e.g., minimum support period, support end date, update frequency) available to consumers before purchase. Many, however, do not, or do not make this information available for all of their devices. And few, if any, manufacturers or carriers explain that apparently identical devices may receive different security update support based on the type of service the
Mobile Security Updates: Understanding the Issues
67
consumer selects (e.g., unlocked, WiFi-only, major or budget carrier). Although most device manufacturers do notify consumers when a security update is available, most do not inform users when a phone is about to stop receiving support or when it has in fact stopped receiving security updates.
2. Benefits and Risks
• The mobile ecosystem’s diversity provides extensive consumer choice, but also contributes to security update complexity and inconsistency. Thanks to the diverse and competitive mobile ecosystem and to the device-level customizations made possible by free and customizable operating systems, consumers can choose from thousands of different device-service combinations at a wide variety of price points. Such variety also avoids monoculture security environments. Variety, however, does have costs: Operating system customization at the device level can prevent uniform security patch application, increase the time and cost to develop, test, and deploy security updates, and may lead to shorter update support periods and less frequent updates. Indeed, device manufacturers that customize operating systems across a wide range of devices tend to support phones for shorter periods—most often less than a year or two from device release.176
• Device manufacturers’ security support decisions enable flexible responses to market conditions, but make security support periods and schedules more uncertain. Device manufacturers’ case-by-case decision-making processes can help to control update support costs that might otherwise be passed onto consumers through higher prices. A byproduct of just-in-time decision-making, however, is that it impedes advanced commitments about update support that might benefit security-conscious consumers.
• Each respondent focuses support on newer products and several focus update support on costlier, more popular devices. Each respondent reported prioritizing new products (whether measured by device or operating system age) for update support. Data from three manufacturers suggests a tendency in practice to allocate update support towards more expensive and more popular models. Consumers benefit from the availability of older phones at lower prices whose discount reflects, in part, the reduced update support they receive. But failing to patch critical vulnerabilities on older, cheaper, or less popular devices creates risks for some device owners.177
176 See supra Part IV.A.2 (Figure A-1, displaying update support periods for three manufacturers of devices with customized operating systems with update support periods clustered under one or two years).
177 Mills, supra note 73 (“[G]iven the number of Android devices still being used that won’t get a security update, old Android devices are likely to be the weakest link” with respect to the KRACK vulnerability, which enables attackers to insert fake websites and collect sensitive information).
Mobile Security Updates: Understanding the Issues
68
Other owners may be motivated by this lack of update support—or uncertainty about the level of support—to upgrade sooner to new, perhaps more secure, devices. However, because device manufacturers typically do not expressly reveal consistent support information, customers may not be able to weigh these factors efficiently.
• Carrier involvement in the security update process contributes to stability but can lead to delays. Carrier involvement can benefit consumers: Carriers sometimes use their influence with manufacturers to encourage good patching practices, carrier testing helps to ensure continued device and network performance, and carriers bring considerable experience to update deployments. Carrier involvement comes at a cost, as well: Carriers with overcrowded testing labs sometimes resist security updates or delay testing for updates that include security patches.
B. Recommendations Manufacturers reported—and our findings note—important progress in expediting the security
update process. The Commission commends the device manufacturers, carriers, and operating system developers that have contributed to efforts to provide effective security updates. At the same time, other reports and some limited support data suggest that, at least in some quarters, there is wide variation in how the security of consumers’ devices is maintained. In light of this, the Commission recommends that industry consider whether adopting certain policies and practices related to security support could benefit consumers. In addition, the Commission recommends that industry and advocacy groups explore methods of informing and educating consumers about mobile device security. Specifically, the Commission recommends the following:
1. Recommendations for Consumer Education
First, the Commission recommends that government, industry, and advocacy groups work together to educate consumers about their role in the update process (e.g., their responsibility for installing or approving updates) and the significance of updates. The more individual consumers understand the importance of updates to the security of their devices and information, the more likely they are to benefit from available updates.
Second, there is an opportunity for industry and advocacy groups to educate consumers about what security support attributes are important: why support period length and update frequency matter. Moreover, if such groups made available information comparing support periods and update frequency across devices, manufacturers, carriers, and operating systems, consumers could make better informed
Mobile Security Updates: Understanding the Issues
69
purchasing decisions. Such comparisons could also incentivize manufacturers and carriers to compete on security.178
2. Recommendations for Industry Best Practices
• Start With Security The Commission’s consistent guidance to all businesses has been to consider security from the start.179 The mobile ecosystem has already proven itself adept at starting with security in number of ways, such as implementing physical security controls, sandboxing, and encryption for mobile devices and data.180 But the Commission recommends that industry build security into support culture and further embed security support considerations into product design, consistent with the costs and benefits of doing so.
Most importantly, we recommend that industry ensure that mobile devices receive operating system security updates for a period of time that is consistent with consumers’ reasonable expectations.181 Of course, this does not mean that all devices must receive confirmed update support for the conceivable life of the device. It is appropriate for manufacturers to weigh the costs and benefits of varying levels of update support for each device in their portfolio. Indeed, if choices are transparent, consumers will likely benefit from the choices that such variety permits.
Manufacturers, carriers, and operating system developers should ensure that reasonable security update support is a shared priority, reflected in each company’s policies, practices, and contracts. In addition, the Commission recommends that manufacturers consider whether their security update support practices would benefit from a written security policy that might reduce the inefficiencies that may arise from case-by-case decision-making.182 To reduce the variance
178 Cf. Ewan Spence, Another Magical Ingredient Inside Your Nokia Smartphone, FORBES (Feb 9, 2018), https://www.forbes.com/sites/ewanspence/2018/02/09/nokia-android-oreo-security-update-february-sales/#2648c8ae4588 (providing commentary on robust sales of Nokia phones after prominent advertising of monthly security updates: “Security may not be sexy, but it looks like it sell[s] smartphones.”).
179 See, e.g., START WITH SECURITY, supra note 15.
180 Indeed, consumers’ relatively high confidence in device manufacturers and carriers’ ability to safeguard their data may be a reflection of those efforts. See AMERICANS & CYBERSECURITY, supra note 6 at 3.
181 Although consumers likely expect security support for most mobile devices, they may not expect such support for inexpensive devices marketed as disposable, limited-use products. Companies and advocacy groups should consider conducting consumer surveys to explore consumers’ expectations for security support (especially the duration of support and the frequency of updates).
182 Of course, not every business practice should be dictated by written policy. But the Commission has consistently espoused adoption of a written information security policy. See, e.g., Complaint at 9, FTC v. Ruby Corp., No. 1:16-cv-02438 (D.D.C. Dec. 14, 2016), https://www.ftc.gov/system/files/documents/cases/161214ashleymadisoncmplt1.pdf (alleging that
Mobile Security Updates: Understanding the Issues
70
within organizations, training for personnel involved in the security update process should emphasize the company’s commitment to deliver reasonable security to its customers.
Security update considerations should also be factored into product design decisions. Operating system developers should continue creative efforts to make timely security updates feasible, such as by pushing certain functionality to the application level, where it can be updated globally without device manufacturer or carrier participation.183 When making decisions about design and support of customized models, companies should consider the benefits and costs of broad device portfolios.
• Learn From the Past The Commission’s second recommendation to industry is to evaluate current practices by studying past practices. As the findings above indicate, recordkeeping is not consistent. To learn from past practices, industry should consider keeping more consistent records on security support topics such as update decisions, support length, update frequency, customized patch development time, carrier testing time, and uptake rate.184 Analysis of this data may provide an empirical basis for improving mobile device security. Where feasible, operating system developers, device manufacturers, and carriers should consider whether to share data (and what data to share) so that each partner can gain insight.185 For example, deploying parties could record comprehensive uptake data, share it with partners, study it to determine what practices improve uptake,186 and then adopt new uptake practices—and set appropriate policies—based on these lessons.
Defendants failed to provide reasonable security by, among other things, failing to have a written information security policy).
183 See, e.g., JR Raphael, What’s the Answer to Android’s Upgrade Problem?, COMPUTER WORLD, Mar. 2, 2017, https://www.computerworld.com/article/3176516/android/android-upgrade-problem-answer.html (describing Google’s efforts to “pull[] pieces out of the operating system and turn[] them into standalone apps [which] . . . can then be updated instantly and universally, without any manufacturer or carrier involvement”).
184 When evaluating whether and how to change recordkeeping practices, companies should, of course, weigh the costs and benefits of any changes.
185 In determining what data to share, companies also must consider any limits on such sharing under applicable antitrust and other laws.
186 As a concrete example, industry should study update notifications to determine whether uptake is higher when the update notification makes clear that the update will not change device functionality (i.e., a security-only update), or, conversely, if uptake is higher when the notification touts the benefits of new functionality changes (i.e., a bundled update). This inquiry could be complemented by consumer research on uptake (conducted either by companies or advocacy groups), such as research about consumer preferences for security-only or bundled updates as well as research aimed at identifying the reasons for declining uptake for older devices.
Mobile Security Updates: Understanding the Issues
71
• Adjust the Security Update Process Next, the Commission recommends that industry continue to streamline the security update process, from patch development through deployment. The Commission specifically recommends that industry adjust the security update process with respect to bundling, testing, and deployment, as described below.
First, when deciding whether to issue standalone security updates versus bundled updates, device manufacturers should continue to weigh the costs and benefits of each approach. Bundling has certain efficiency benefits, but can cause delays. Moreover, consumers who do not like the feature changes or potential memory, battery, or bandwidth impacts of operating system updates may be more likely to accept security-only updates (if clearly explained). If the vulnerabilities to be patched are low risk, bundled update testing is fairly streamlined, and uptake for bundles is robust, then the benefits of bundling security patches with functionality updates may outweigh the costs. But if the vulnerabilities are higher risk, functionality testing remains slow, and the uptake rates for bundles are low, then manufacturers should consider issuing a security-only release. To the extent that industry is already conducting such analysis, we applaud their efforts and encourage them to continue.
Manufacturers and carriers should continue to streamline the testing process (while ensuring that streamlining does not have a negative impact on testing quality). Specifically, companies that impose testing requirements should continue to evaluate whether there are ways to expedite the process, reduce testing costs, and accommodate security-only updates on short notice. When manufacturers make commitments regarding the frequency of security updates, testing requirements should be sufficiently clear and predictable that manufacturers can fulfill their promises.
Finally, developers and manufacturers should continue to explore how best to package security updates to encourage consumers to accept them. Industry should consider the costs and benefits of configuring default settings to enable automatic download of security-only updates, and evaluate the efficacy of various prompts in encouraging consumers to install updates. If uptake is better when an update is issued over both WiFi and wireless network, companies should consider pushing security updates to consumers, free-of-charge, through both methods, if the benefit of rapid adoption of a particular patch outweighs the potential costs to network performance.
• Embrace Greater Transparency Finally, the Commission recommends that device manufacturers consider providing consumers with more and better information about their security update support practices. As the Commission recently recommended in its comment to an NTIA working group on security updates for IoT devices, device manufacturers interested in conveying update information to
Mobile Security Updates: Understanding the Issues
72
consumers should consider adopting and stating minimum guaranteed support periods for their devices.187 Manufacturers that choose to represent a minimum update support period should clearly explain the date on which updates will end (e.g., January 1, 2020), to ensure that consumers receive truthful, non-misleading information about that period.188
When manufacturers describe minimum update support periods and update schedules, they should consider the feasibility and desirability of specifying a minimum guaranteed support period or update frequency rather than an aspirational timeline or schedule. As the FTC noted in its recent comment to the NTIA, in some circumstances, aspirational representations can be problematic, for two reasons.189 First, an aspirational timeline or schedule that is subject to change based on market conditions (e.g., device popularity) may provide consumers with relatively little value. Second, consumers may interpret aspirational representations as claims of firm commitments of support—claims that would be false if the claimed support were not provided.190
As our comment to the NTIA noted, some consumers may benefit from just-in-time notifications when security update support is about to end, and when it has in fact ended. Currently, consumers may use unsupported devices for months or years without realizing it. Prompt notification of the end of security update support, perhaps by push notification or through an on-device feature, may help consumers decide when to buy a new device and how, if at all, to use an unsupported device.191 Maintaining readily accessible end-of-life schedules, such as on a company website, might also help consumers to plan device replacement. Again, companies that choose to make representations about support should evaluate their usefulness and make sure they are truthful and non-misleading.
187 NTIA Comment on IoT Device Security Update Capability, supra note 53.
188 For example, if a manufacturer promises one year of support, a purchaser may assume that the support period begins at the time of purchase, when it in fact began six months earlier, at device launch. Manufacturers could minimize consumer confusion by specifying the beginning or, preferably, the end date for support.
189 NTIA Comment on IoT Device Security Update Capability, supra note 53. Similarly, such manufacturers should also consider adopting and stating a minimum security update frequency (e.g., quarterly or monthly updates).
190 We are not aware of any empirical evidence about how consumers perceive security update support representations in general or for mobile devices in particular. Manufacturers aware of such credible evidence (or who develop such evidence) should, of course, adjust any claims they choose to make in light of such evidence.
191 As the Commission recommended in its comment to the NTIA, this notification should be separate from marketing communications that might deter consumers from agreeing to receive such information. See NTIA Comment on IoT Device Security Update Capability, supra note 53.
Mobile Security Updates: Understanding the Issues
73
Any company that chooses to provide information about security update support should keep three principles in mind. First, the information must be truthful, non-misleading, and supported by a reasonable basis, as Section 5 of the FTC Act requires.192 Second, effective notification may be difficult to get right.193 The disclosures, including overly extensive disclosures, can actually impede consumers’ ability to make informed choices.194 One way to mitigate this potential harm is to minimize the need for disclosures by providing secure devices that receive regular, automatic security updates for a period consistent with consumers’ reasonable expectations.
Finally, disclosures should complement, rather than substitute for, reasonable security. Useful information will generally allow consumers to purchase the level of security support they prefer (whether it be “best-in-class” or the minimum). But, even where consumers have access to complete information about security, the market for mobile devices still may not provide the most efficient level of security. For example, consumers may undervalue security measures that reduce the likelihood of harm to third parties targeted by compromised mobile devices.195 Disclosures, therefore, do not necessarily relieve companies of their obligation to take reasonable steps to safeguard consumer devices and information.196
192 Section 5(a) of the FTC Act prohibits “unfair or deceptive acts or practices in or affecting commerce.” 15 U.S.C. § 45. A claim is deceptive if it is likely to mislead consumers acting reasonably under the circumstances and is material to a consumer’s decision to buy or use the product. See FTC Policy Statement on Deception, appended to Cliffdale Associates, Inc., 103 F.T.C. 110, www.ftc.gov/bcp/policystmt/ad-decept.htm. A statement also may be deceptive if the advertiser does not have a reasonable basis to support the claim. See FTC Policy Statement on Advertising Substantiation, appended to Thompson Medical Co., 104 F.T.C. 648, 839 (1984), aff’d, 791 F.2d 189 (D.C. Cir. 1986), www.ftc.gov/bcp/guides/ad3subst.htm.
193 FTC Staff Summary, PUTTING DISCLOSURES TO THE TEST, FED. TRADE COMM’N (Nov. 2016), https://www.ftc.gov/system/files/documents/public_events/950633/disclosures-workshop-staff-summary-update.pdf.
194 See, e.g., Jim Bettman, et al., Consumer Decision Making, HANDBOOK OF CONSUMER BEHAVIOR, 50–84 (1991) (providing overview of consumer decision making, including overload); Naresh K. Malhotra, Information Load and Consumer Decision Making, J. OF CONSUMER RESEARCH 8, 419-430 (Mar. 1982) (same); Debra L. Scammon, Information Load and Consumers, J. OF CONSUMER RESEARCH 4 (3), 148–155 (1977) (same); Brian Stanton, et al., Security Fatigue, 18 IT PROFESSIONAL 26-32 (Sept.-Oct. 2016) (reporting that “decision fatigue” made respondents more likely to use poor security practices).
195 Cf. Jin & Stivers, supra note 93 at 3 (“[T]he persistence of information can cause commitment problems, and tends to exacerbate information asymmetry and externality . . . .”); Hahn & Layne-Farrar, supra note 93 at 314 (“Two primary market failures have been suggested in the provision of software security. First, there may be differences in the amount of information readily available to different parties, resulting in ‘information asymmetries’ that could lead to an inefficient provision of security. Second, individual end users may undervalue security in relation to the optimal level from society’s point of view.”); John Daley, Insecure Software Is Eating the World: Promoting Cybersecurity in an Age of Ubiquitous Software-Embedded Systems, 19 STAN. TECH. L. REV. 533, 537 (2016) (“The current regime of caveat emptor in which software consumers bear the risk of security vulnerabilities entirely is unsuited to a market where information asymmetry is high . . . .”).
196 See supra Part I.A (discussing reasonable update practices, as highlighted in the HTC, ASUS, and Oracle complaints and orders). Taking reasonable steps to protect consumers’ information is particularly important where, as here, there are
Mobile Security Updates: Understanding the Issues
74
VII. Conclusion This report attempts to shed light on the complexities of the mobile security update process and to explore the benefits of and challenges to issuing timely and regular mobile security updates. Many of its recommendations are geared towards encouraging industry in efforts to provide reasonable security. Other recommendations are intended to help government, industry, and advocacy groups work towards providing consumers with the tools to make better informed purchasing and updating decisions.
The findings and recommendations in this report are intended to be part of an ongoing dialogue, and the Commission welcomes further input and information on these issues. The Commission will continue to work with industry, consumer groups, and lawmakers to further the goals of reasonable security and greater transparency.
information asymmetries and externalities that may distort the market. Specifically, manufacturers are better positioned than consumers to assess security risks to complex software, particularly where third parties suffer significant harm from attack (e.g., the targets of botnets built from compromised mobile devices). See, e.g., J. Daley, supra note 195 at 537-38 (describing market failures in software security); Hahn & Layne-Farrar, supra note 93 at 314-15 (describing information asymmetries).

Mobile Security Updates: Understanding the Issues
A-I
Appendix A 1. Order to File a Special Report
1
UNITED STATES OF AMERICA BEFORE THE FEDERAL TRADE COMMISSION
COMMISSIONERS: Edith Ramirez, Chairwoman Maureen K. Ohlhausen Terrell McSweeny FTC Matter No. P165402
ORDER TO FILE A SPECIAL REPORT Pursuant to a resolution of the Federal Trade Commission (“FTC” or “the Commission”) dated May 6, 2016, entitled “Resolution Directing Use of Compulsory Process To Collect Information Regarding Mobile Device Security Updates,” a copy of which is enclosed, [COMPANY NAME], hereinafter referred to as the “Company,” is ordered to file with the Commission, no later than 45 days after date of service, a Special Report containing the information and documents specified herein. The Commission is seeking to compile data concerning policies, procedures, and practices for providing security updates to mobile devices offered by unnamed persons, partnerships, corporations, or others in the United States. The Special Report will assist the Commission in conducting a study of such policies, practices, and procedures. The Special Report must restate each item of this Order with which the corresponding answer is identified. Your report is required to be subscribed and sworn by an official of the Company who has prepared or supervised the preparation of the report from books, records, correspondence, and other data and material in your possession. If any question cannot be answered fully, give the information that is available and explain in what respects and why the answer is incomplete. The Special Report and all accompanying documentary responses must be Bates-stamped. Confidential or privileged commercial or financial information will be reported by the Commission on an aggregate or anonymous basis, consistent with Sections 6(f) and 21(d) of the FTC Act. Individual submissions responsive to this Order that are marked “confidential” will not be disclosed without first giving the Company ten (10) days notice of the Commission’s intention to do so, except as provided in Sections 6(f) and 21 of the FTC Act.
2
SPECIFICATIONS
Please provide the following information, documents, and items, consistent with the definitions, instructions, and formatting requirements contained in Attachment A:
1. Identification of Report Author: Identify the full name, business address, telephone
number, and title of the person(s) who has prepared or supervised the preparation of the Company’s response to this Order and describe in detail the steps taken by the Company to respond to this Order. For each specification, identify the individual(s) who assisted in preparation of the response. Provide a list of the persons (identified by name and corporate title or job description) whose files were searched and identify the person who conducted the search.
2. Company Information:
a. State the Company’s complete legal name and all other names under which it has
done business, its corporate mailing address, all addresses from which it does or has done business, and the dates and states of its incorporation.
b. Describe the Company’s corporate structure, and state the names of all parents,
subsidiaries (whether wholly or partially owned), divisions (whether incorporated or not), affiliates, branches, joint ventures, franchises, operations under assumed names, websites, and entities over which it exercises supervision or control. For each such entity, describe the nature of its relationship to the Company.
c. Identify each individual or entity having more than a 5% ownership interest in the
Company, as well as their individual ownership stakes and their positions and responsibilities within the Company.
3. Security Update Processes:
a. State whether the Company offers any of its mobile devices to U.S. consumers in each of the following options. Your answer should describe in detail how each option is made available to consumers (e.g., direct sales through the Company’s website or retail stores, sales through third-party retailers, or sales through carrier stores):
i. Carrier-locked device;
ii. Unlocked device;
iii. Carrier-certified device; or
iv. Wi-Fi device.
3
b. For each option in Specification 3(A) to which you responded affirmatively, please identify each entity that contributes to the device software, describing in detail the software that the entity contributes. Your response should include, but not be limited to, contributions from:
i. Device manufacturer;
ii. Operating system vendor;
iii. Chipset manufacturer; or
iv. Carrier.
c. For each option in Specification 3(A) to which you responded affirmatively, describe in detail any role each entity you identified in response to Specification 3(B) has in addressing security vulnerabilities in device software, including, but not limited to its role in any processes related to:
i. Communicating vulnerability information among such entities;
ii. Developing software updates to address vulnerabilities;
iii. Testing security updates that have been developed; or
iv. Deploying security updates to devices.
d. For each option in Specification 3(A) to which you responded affirmatively, describe in detail how the Company determines whether a specific device model will receive a security update to address a vulnerability, including whether and how each of the following criteria informs the decision whether to provide a security update:
i. The nature and severity of the vulnerability;
ii. How long the device model has been on the market;
iii. The number of consumers using the device model;
iv. The retail cost of the device model (e.g., whether the device is considered a premium or budget device);
v. The device model’s current operating system version;
vi. Whether the device model will be updated to the next version of the operating system;
4
vii. Development support (e.g., software code, instructions, or other information or material) necessary from any entity identified in your response to Specification 3(B);
viii. Testing, certification, or other requirements mandated by any entity identified in response to Specification 3(B);
ix. Contractual obligations or other business arrangements with any entity identified in response to Specification 3(B); and
x. Any other criteria not covered above.
e. For each option in Specification 3(A) to which you responded affirmatively, describe in detail how any of the criteria described in your response to Specification 3(D) affect the frequency or timing of security updates that the Company provides for any specific device model.
f. State whether the Company has (or had) any written policies regarding the processes described in response to Specification 3(C)-(E). Provide a copy of each such policy in effect during the applicable time period, indicating for each the date on which it became effective. If the policies changed at any time, please so state and describe the nature of the change and its effective time period.
g. Provide a copy of any documents that define any testing, certification, or other requirements identified in your response to Specification 3(D)(viii).
h. Provide a copy of any legal agreements covering any contractual obligations or other business arrangements described in your response to Specification 3(D)(ix).
i. State whether the Company licenses or otherwise provides device software, such as an operating system, for integration into devices offered for sale by device manufacturers other than the Company. If yes, for each device software, describe in detail the Company’s policies and processes regarding security updates for such software, including but not limited to:
i. Licensing terms or other contractual obligations that require the device manufacturer or any other entities to develop, test, or deploy security updates;
ii. Communication of vulnerability information to device manufacturers or other
entities involved in the development, testing, or deployment of security updates;
iii. Development support (e.g., software code, instructions, or other information or material) the Company provides for the development, testing, or deployment of security updates; and
5
iv. Any other assistance the Company provides to address security vulnerabilities in such device software.
4. Consumer Disclosures
a. Describe in detail whether the Company provides notice to consumers regarding each
of the following:
i. The period of time that a specific device model will be supported for operating system version or other feature updates that include security updates;
ii. The period of time that a specific device model will be supported for security updates, including the frequency or timing of security updates;
iii. When a specific device model is no longer supported for operating system version or other feature updates that include security updates; and
iv. When a specific device model is no longer supported for security updates.
b. State whether the Company has (or had) any written policies regarding the notices described by Specification 4(A)(i)-(iv). Provide copies of any such policies effective during the applicable time period, indicating for each the date on which it became effective. If the policies changed at any time, please so state and describe the nature of the change and its effective time period.
5. Specific Device Models
a. Identify each specific device model (e.g., “unlocked Model X” or “Carrier Y-locked
Model E”) that the Company has offered for sale to U.S. consumers.
b. For each specific device model identified in response to Specification 5(A), describe in detail:
i. The period of time that the specific device model was or has been offered for sale in the United States;
ii. The number of units of the specific device model that have been sold;
iii. The average retail price tier of the device (0-$250; $251-$500; $501-$750; over $751);
iv. The period of time that the specific device model was or will be supported for
operating system version or other feature updates that include security updates; and
6
v. The period of time that the specific device model was or will be supported for security updates.
c. For each specific device model identified in response to Specification 5(A), please
provide a copy of:
i. Each materially different consumer-facing statement the Company has made regarding support for, frequency, or timing of operating system version or feature updates that include security updates that applies to the specific device model; and
ii. Each materially different consumer-facing statement the Company has made regarding support for, frequency or timing of security updates that applies to the specific device model.
d. For each specific device model identified in response to Specification 5(A), please identify each vulnerability that has affected the specific device model that could result in unauthorized code execution or the compromise of the confidentiality of consumer data. Describe in detail the Company’s response to the vulnerability. Your response should include, but not be limited to:
i. A description of the vulnerability, including, if available, the Common Vulnerabilities and Exposure (CVE) identifier;
ii. The date on which the Company learned of the vulnerability;
iii. The date on which any other entity identified in your response to Specification 3(B) provided the Company with any software code, instructions, or other information or material necessary to address the vulnerability;
iv. Whether the Company decided to provide a security update for the vulnerability, and if not, an explanation of the criteria used to make that decision, including the criteria identified in response to Specification 3(D);
v. The Company’s process for developing a security update to address the vulnerability, including whether and how any other entity identified in your response to Specification 3(B) was involved in developing or testing the security update;
vi. The date on which the Company had a security update addressing the vulnerability ready for any required testing by any other entity identified in your response to Specification 3(B);
vii. The date or dates on which the Company deployed the security update, either directly to end-user devices, or to a Carrier for deployment to end-user devices. For the latter, please also state, to your knowledge, the date or dates
7
on which the Carrier deployed the security update to end-user devices on its network;
viii. The percentage of end-user devices that installed the update addressing the vulnerability; and
ix. If a security update for the vulnerability was not deployed to end-user devices, whether the company notified consumers that the specific device model would not receive a security update for the vulnerability.
e. For each vulnerability identified in response to Specification 5(D), please provide documents reflecting communications among the entities you identified in response to Specification 3(B) sufficient to show any necessary coordination among such entities to develop, test, and/or deploy security updates to address the vulnerability.
f. Please provide a copy of any notice described in response to Specification 5(D)(ix). The Special Report responses called for in this Order are to be filed no later than 45 days from the date of service of this Order.
By direction of the Commission.
___________________________ Edith Ramirez, Chairwoman
SEAL: Date of Order: May 6, 2016

Mobile Security Updates: Understanding the Issues
A-II
2. Attachment A
8
Attachment A
DEFINITIONS & ADDITIONAL INSTRUCTIONS
A. “Carrier” shall mean the operator of a cellular network.
B. “Carrier-certified device” shall mean a smartphone, tablet, or similar mobile
computing device that is not a carrier-locked device but has been certified by a carrier to be sold through that carrier or activated on that carrier’s network.
C. “Carrier-locked device” shall mean a smartphone, tablet, or similar mobile computing device that can connect to a particular carrier’s cellular network and is restricted via software to work only on that carrier’s network.
D. “Chipset manufacturer” shall mean the entity that provides a mobile computing
device’s system-on-a-chip, radio chip, or other chipset. A chipset manufacturer may also be an operating system vendor and/or device manufacturer.
E. “Company” shall mean [company name], its wholly or partially owned subsidiaries, unincorporated divisions, joint ventures, operations under assumed names, and affiliates, and all directors, officers, members, employees, agents, consultants, and other persons working for or on behalf of the foregoing.
F. “Device manufacturer” shall mean the entity that designs and develops a mobile
computing device offered for sale to consumers. A device manufacturer may also be an operating system vendor and/or chipset manufacturer.
G. “Device software” shall mean any software installed on a mobile computing device before the device is offered for sale to consumers or software installed through an update deployed by the device manufacturer and/or carrier.
H. “Identify” shall be construed to require identification of (a) natural persons by name,
title, present business affiliation, present business address and telephone number, or if a present business affiliation or present business address is not known, the last known business and home addresses; and (b) businesses or other organizations by name, address, identities of natural persons who are officers, directors or managers of the business or organization, and contact persons, where applicable.
I. “Order” shall mean the Order, including the attached Resolution, Specifications, and Attachment.
J. “Operating system vendor” shall mean the entity that provides a mobile computing device’s operating system. An operating system vendor may also be a device manufacturer and/or chipset manufacturer.
9
K. “Specific device model” shall mean the specific variation of a mobile computing device, such as the unlocked version of a particular model or the carrier-locked version of a particular model that will only work on a particular carrier.
L. “Unlocked device” shall mean a smartphone, tablet, or similar mobile computing device that is capable of connecting to cellular networks and is not a carrier-locked device or a carrier-certified device.
M. “Wi-Fi device” shall mean a smartphone, tablet, or similar mobile computing device that is not capable of connecting to cellular networks.
N. “You” and “your” shall mean the person or entity to whom this CID is issued and includes the “Company.”
O. Meet and Confer: You are encouraged to contact Nithan Sannappa at (202) 326-
3185, Kristin Cohen at (202) 326-2276, or Justin Brookman at (202) 326-2214 as soon as possible to schedule a meeting (telephonic or in person) in order to confer regarding your response.
P. Modification of Specifications: If you believe that the scope of the required search
or response for any specification can be narrowed consistent with the Commission’s need for documents or information, you are encouraged to discuss such possible modifications, including any modifications of definitions and instructions, with the Commission counsel named above.
Q. Electronic Submission of Documents: See the attached “Federal Trade
Commission, Bureau of Consumer Protection Production Requirements,” which details all requirements for submission of information, generally requiring that files be produced in native form and specifying the metadata to be produced. As noted in the attachment, some items require discussion with the FTC counsel prior to production, which can be part of the general “Meet and Confer” described above. If you would like to arrange a separate discussion involving persons specifically familiar with your electronically stored information (ESI) systems and methods of retrieval, make those arrangements with FTC counsel when scheduling the general meet and confer discussion
R. Applicable Time Period: Unless otherwise directed in the specifications, the applicable time period for the request shall be from August 1, 2013 until the date of full and complete compliance with this Order.
S. Document Production: Because postal delivery to the Commission is subject to
delay due to heightened security precautions, please use a courier service such as Federal Express or UPS.
10
T. Production of Copies: Copies of marketing materials and advertisements shall be produced in color, and copies of other materials shall be produced in color if necessary to interpret them or render them intelligible.
U. Sensitive Personally Identifiable Information: If any material called for by these
requests contains sensitive personally identifiable information or sensitive health information of any individual, please contact us before sending those materials to discuss ways to protect such information during production. For purposes of these requests, sensitive personally identifiable information includes: an individual’s Social Security number alone; or an individual’s name or address or phone number in combination with one or more of the following: date of birth, Social Security number, driver’s license number or other state identification number, or a foreign country equivalent, passport number, financial account number, credit card number, or debit card number. Sensitive health information includes medical records and other individually identifiable health information relating to the past, present, or future physical or mental health or conditions of an individual, the provision of health care to an individual, or the past, present, or future payment for the provision of health care to an individual.

Mobile Security Updates: Understanding the Issues
A-I
Appendix B 1. Letter from Federal Communications Commission to [Carrier]
Federal Communications Commission
Washington, D.C. 20554
May 9, 2016
Dear [Carrier],
As you know, one of the Commission’s top priorities is the promotion of safety and security of
communications. This is a priority that is shared by our colleagues at the Federal Trade Commission
(FTC).
As our nation’s consumers and businesses turn to mobile broadband to conduct ever more of their daily
activities, from the most sensitive to the most trivial, the safety and security and their communications
and other personal information is directly related to the security of the devices they use.
There have recently been a growing number of vulnerabilities associated with mobile operating systems
that threaten the security and integrity of a user’s device and all the personal, sensitive data on it. One of
the most significant to date is a vulnerability in the Android component called “Stagefright.” It may have
the ability to affect close to 1 billion Android devices around the world. And there are many other
vulnerabilities that could do just as much harm.
Consumers may be left unprotected, for long periods of time or even indefinitely, by any delays in
patching vulnerabilities once they are discovered. Therefore, we appreciate efforts made by operating
system providers, original equipment manufacturers, and mobile service providers to respond quickly to
address vulnerabilities as they arise. We are concerned, however, that there are significant delays in
delivering patches to actual devices—and that older devices may never be patched.
In partnership with the FTC, we have launched a joint effort to better understand, and ultimately to
improve, the mobile security “ecosystem.” The FCC is contacting the service provider community to
better understand the role that they play in ensuring the security of mobile devices. The FTC is separately
seeking information from operating system providers and original equipment manufacturers. We hope
that the efforts of our two agencies will lead to a greater understanding of what is being done today to
address mobile device vulnerabilities—and what can be done to improve mobile device consumer safety
and security in the future.
As a first step, I request that you provide us with your detailed responses within forty-five (45) days of
the date of this letter. If you request confidential treatment for your responses, your responses will be
treated confidentially (see 47 CFR § 0.459(d)(3)) but please be aware that we intend to share all responses
with the FTC, as we are permitted to do pursuant to 44 U.S.C. § 3510, and we ask that you state in your
response, pursuant to 47 CFR § 0.442, that you do not oppose such disclosure.
May 9, 2016 Page 2 of 2 Sample
2
Once we receive your responses, we look forward to meeting with your representatives to review your
answers and learn your perspectives on possible next steps.
Should you have any questions, please feel free to contact Charles Mathias on my staff. Thank you in
advance for help in this important undertaking.
Sincerely,
Jon Wilkins,
Chief
Wireless Telecommunications Bureau
Federal Communications Commission

Mobile Security Updates: Understanding the Issues
B-II
2. Questions to [Carrier] on Mobile Device Security
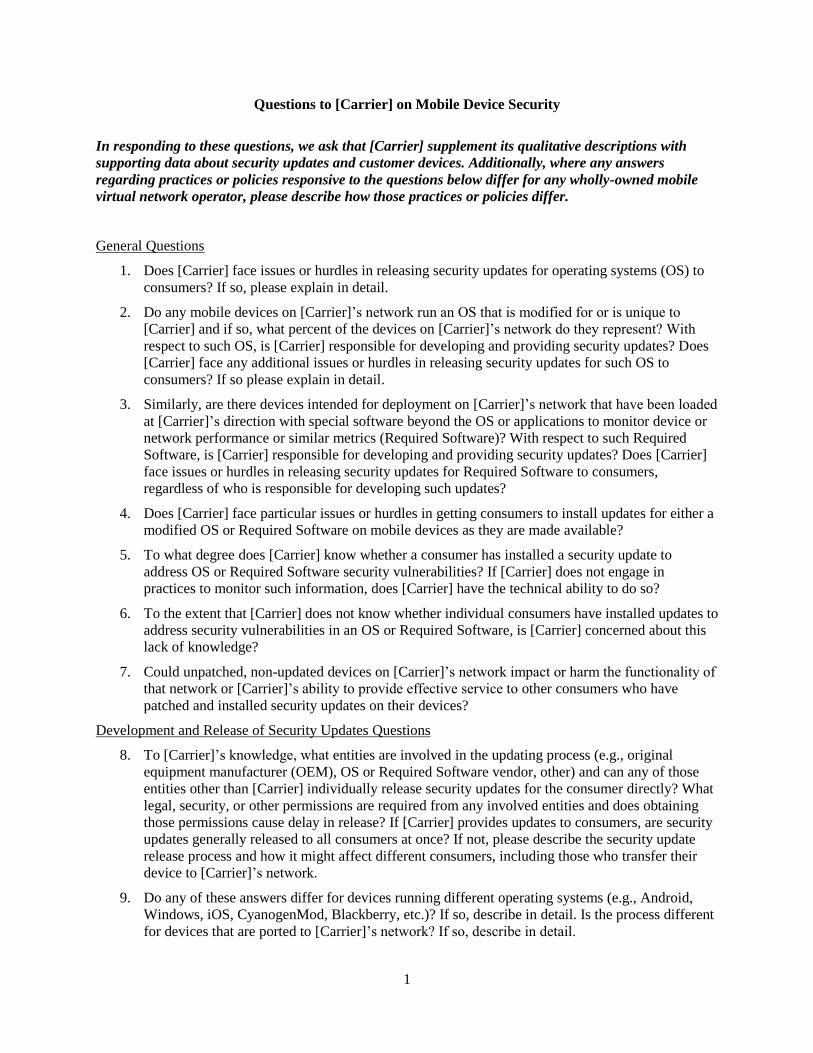
1
Questions to [Carrier] on Mobile Device Security
In responding to these questions, we ask that [Carrier] supplement its qualitative descriptions with
supporting data about security updates and customer devices. Additionally, where any answers
regarding practices or policies responsive to the questions below differ for any wholly-owned mobile
virtual network operator, please describe how those practices or policies differ.
General Questions
1. Does [Carrier] face issues or hurdles in releasing security updates for operating systems (OS) to
consumers? If so, please explain in detail.
2. Do any mobile devices on [Carrier]’s network run an OS that is modified for or is unique to
[Carrier] and if so, what percent of the devices on [Carrier]’s network do they represent? With
respect to such OS, is [Carrier] responsible for developing and providing security updates? Does
[Carrier] face any additional issues or hurdles in releasing security updates for such OS to
consumers? If so please explain in detail.
3. Similarly, are there devices intended for deployment on [Carrier]’s network that have been loaded
at [Carrier]’s direction with special software beyond the OS or applications to monitor device or
network performance or similar metrics (Required Software)? With respect to such Required
Software, is [Carrier] responsible for developing and providing security updates? Does [Carrier]
face issues or hurdles in releasing security updates for Required Software to consumers,
regardless of who is responsible for developing such updates?
4. Does [Carrier] face particular issues or hurdles in getting consumers to install updates for either a
modified OS or Required Software on mobile devices as they are made available?
5. To what degree does [Carrier] know whether a consumer has installed a security update to
address OS or Required Software security vulnerabilities? If [Carrier] does not engage in
practices to monitor such information, does [Carrier] have the technical ability to do so?
6. To the extent that [Carrier] does not know whether individual consumers have installed updates to
address security vulnerabilities in an OS or Required Software, is [Carrier] concerned about this
lack of knowledge?
7. Could unpatched, non-updated devices on [Carrier]’s network impact or harm the functionality of
that network or [Carrier]’s ability to provide effective service to other consumers who have
patched and installed security updates on their devices?
Development and Release of Security Updates Questions
8. To [Carrier]’s knowledge, what entities are involved in the updating process (e.g., original
equipment manufacturer (OEM), OS or Required Software vendor, other) and can any of those
entities other than [Carrier] individually release security updates for the consumer directly? What
legal, security, or other permissions are required from any involved entities and does obtaining
those permissions cause delay in release? If [Carrier] provides updates to consumers, are security
updates generally released to all consumers at once? If not, please describe the security update
release process and how it might affect different consumers, including those who transfer their
device to [Carrier]’s network.
9. Do any of these answers differ for devices running different operating systems (e.g., Android,
Windows, iOS, CyanogenMod, Blackberry, etc.)? If so, describe in detail. Is the process different
for devices that are ported to [Carrier]’s network? If so, describe in detail.
2
10. As a general matter, are security updates that have been made available or provided to [Carrier]
by an OEM or OS or Required Software vendor in response to an identified security vulnerability
regularly reviewed and/or released by [Carrier]? If so, how long does this process take? If not,
please explain.
11. What considerations does [Carrier] generally take into account when determining the
prioritization and timing of release of a security update (i.e., severity of vulnerability, whether it
can be rolled into another planned update, etc.)?
12. What data does [Carrier] maintain about security updates that have been made available to
[Carrier] and the actions [Carrier] has taken in response?
Consumer-specific Questions
13. Does [Carrier] provide updates to consumers with vulnerabilities on their mobile devices or make
available a website where consumers can easily check the vulnerability status of their device and
download required patches? If so, what are the steps and typical time frames from the discovery
of a vulnerability to the consumer receiving an update that resolves the vulnerability—or making
that vulnerability available for download?
14. Are there instances where [Carrier] knows of a vulnerability to OS or Required Software but does
not release a security update to consumers or otherwise make the security update available? If so,
why and how does [Carrier] protect consumer security in such instances?
15. Does [Carrier] discontinue security update support for mobile devices? How does [Carrier] decide
when to discontinue security update support? Are consumers notified at the time of sale how long
security updates will be provided or supported for their device by [Carrier]? Are consumers
notified when security updates to their mobile devices are no longer supported? What are
consumers’ options for protecting themselves against security vulnerabilities after such
discontinuance by [Carrier]?
16. What information or notices regarding security update support does [Carrier] provide to
customers who port or bring their device when they sign up for [Carrier]’s service?
Stagefright-specific Questions
17. When and how did [Carrier] first become aware of vulnerabilities in the Android libstagefright
library (commonly known as Stagefright)?
18. How many models of mobile devices on [Carrier]’s network were or might/could have been
impacted by Stagefright vulnerabilities?
19. How many models of mobile devices on [Carrier]’s network remain vulnerable to the Stagefright
vulnerabilities? Approximately how many such devices remain active on the network? How many
of these devices have a customized OS provided by the [Carrier]?
20. Following expressions of public concern surrounding the Stagefright vulnerabilities, Google,
Samsung, and LG committed to releasing monthly security updates for mobile devices. Has
[Carrier] made a similar commitment to expedite the release of the monthly security updates as
they become available? Have such monthly updates been made available and, if so, has [Carrier]
begun to release those updates as they become available? How many have been made available
and how many has [Carrier] released?

Mobile Security Updates: Understanding the Issues
C-I
Appendix C
Mobile Security Updates: Understanding the Issues
2
In this Appendix, we provide the empirical underpinnings of Part IV in the body of this report. More specifically, we describe and analyze data provided by device manufacturers who received the Commission’s Orders to provide insight regarding the four outcome variables considered in Part IV:
(I) Manufacturer Update Support Period;
(II) Manufacturer Update Frequency (the frequency with which the manufacturer issuessecurity updates and patches);
(III) Patch Development and Testing Period (the time needed to develop and test securityvulnerability updates and patches considered separately for (1) device manufacturers and (2)operating system (OS) developers); and
(IV) Uptake Rate of Security Updates (the rates at which consumer install security updates andpatches over time).
We examine each of these outcome variables in a separate section. Within each section, we first describe the various datasets we developed to perform these analyses, including a description of the data restrictions we imposed and the variables we considered. We then examine the relationships among various factors, such as device price, device sales volume, and the carrier type of the device, with each outcome. We develop and present both a univariate analysis of how each factor affected a given outcome, as well as a multivariate analysis of how each factor affected a given outcome after controlling for all other factors. This appendix includes explanatory graphs that supplement the graphs presented in the report.
I. Manufacturer Update Support PeriodQuestions Addressed: To what extent do the security update support periods offered by
manufacturers for their mobile devices differ, both across devices and across manufacturers, and what factors are correlated with these differences?
1. Data and Variables Considered
Dataset: Three Android mobile device manufacturers.
Data Restrictions: Since we only observe the length of the update support period up to the date when we received the data from each manufacturer, we restrict our attention to devices released in 2013 or 2014, as the manufacturers are likely to have ended update support for these devices by the time of our receipt of the data. We then have 109 devices.
Dependent Variable: Manufacturer Update Support Period, defined as the period of time between device launch and the last update provided.
Independent Variables: Manufacturer of Device, Price of Device, Sales Volume of Device, Carrier Associated with the Device, and Device Release Year.
a) Manufacturer: As noted above, we obtained data suitable for analysis from three Androidmobile device manufacturers. In this dataset, 50% of the devices in our data are fromManufacturer #1, 16% from Manufacturer #2, and 34% from Manufacturer #3.
Mobile Security Updates: Understanding the Issues
3
b) Price: We separate prices into three categories: devices with an average price between $0and $250, devices with an average price between $251 and $500, and devices with anaverage price above $500. In this dataset, 32% of devices are in the lowest price category,35% are in the middle price category, and 33% are in the highest price category.
c) Sales Volume: Measured as units sold for a given device on a given carrier. We separateunits sold into three categories: devices with overall/lifetime sales of less than 100,000 units,devices with overall/lifetime sales between 100,000 and 500,000 units, and devices withoverall/lifetime sales above 500,000 units. In this dataset, 44% of devices are in the lowestsales category, 28% are in the middle sales category, and 28% are in the highest salescategory.
d) Carrier Type: We separate carriers into three categories: Major carrier (T-Mobile, AT&T,Sprint, and Verizon), Other carrier (all other carriers), and Non-Carrier devices (Unlockedand Wi-Fi only devices). In this dataset, 61% of devices are associated with Major carriers,28% are associated with Other carriers, and 11% are not associated with any carriers (so-called Non-Carrier devices).
e) Release Year: We only include devices released in 2013 or 2014; 47% of the devices werereleased in 2013, and 53% in 2014.
2. Univariate Analysis
The report contains graphs of the distribution of the update support period overall, by manufacturer, and by price category. Below we include graphs showing the distribution of the update support period by sales volume category and by carrier type, and provide confidence intervals for the means of the manufacturer support period by category for each variable. Overall, these graphs show that device update support period varies considerably.
Figure A-2 in Part IV of the report depicts the distribution of the update support period by manufacturer. Manufacturer #1 has an average update support period of 1.3 years (95% Confidence Interval (CI) [1.1, 1.5]), compared to an average update support period of 1.5 years for Manufacturer #2 (95% CI [1.2, 1.8]), and an average update support period of 1.9 years for Manufacturer #3 (95% CI [1.8, 2.1]).
Figure A-3 in Part IV of the report depicts the distribution of the update support period by price categories. The lowest price category has an average update support period of 1.3 years (95% CI [1.1, 1.5]), compared to an average update support period of 1.4 years for the middle price category (95% CI [1.2, 1.6]), and an average update support period of 1.9 years for the highest price category (95% CI [1.7, 2.2]).
Figure 1 below depicts the distribution of the update support period by sales volume category. The lowest sales volume category has an average update support period of 1.3 years (95% CI [1.1, 1.5]), compared to 1.6 years (95% CI [1.4, 1.8]) for the middle sales volume category and 1.9 years (95% CI [1.7, 2.1]) for the highest sales volume category. Figure 2 depicts the distribution of the update support period by the carrier type. In this case, the distributions are similar: major carrier devices have an average update support period of 1.6 years (95% CI [1.4, 1.7]), while other carrier devices have an average update support period of 1.5 years (95% CI [1.2, 1.8]) .
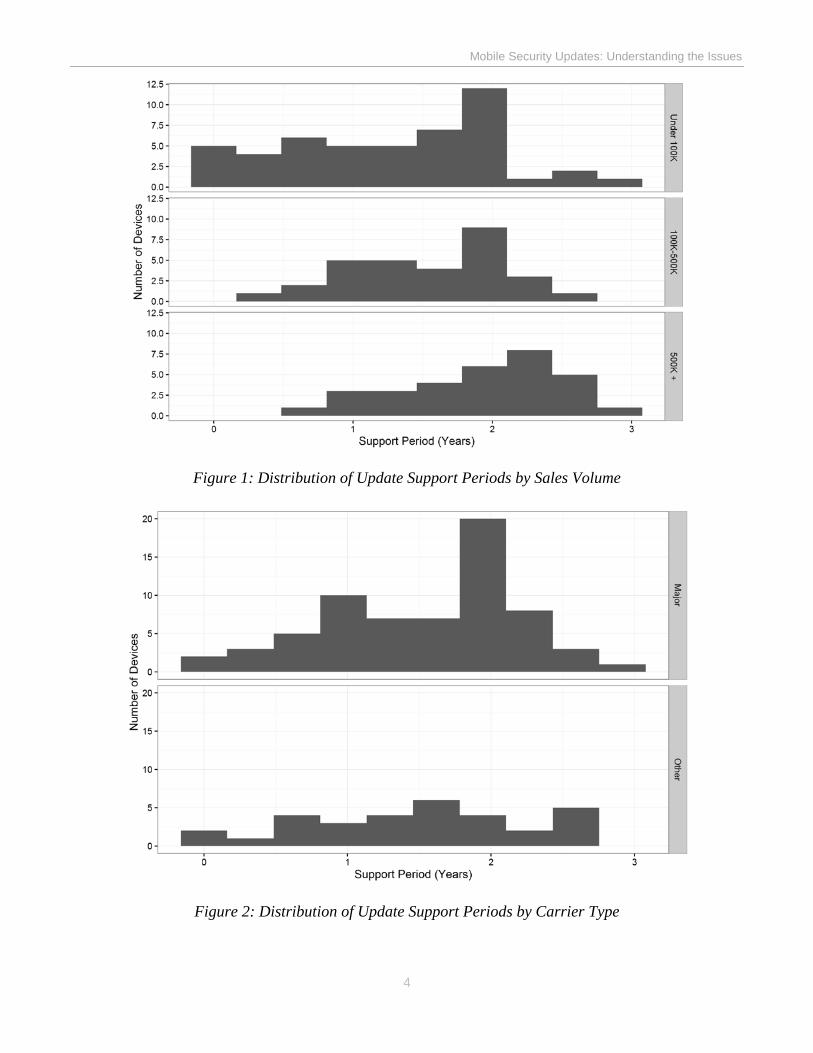
Mobile Security Updates: Understanding the Issues
4
Figure 1: Distribution of Update Support Periods by Sales Volume
Figure 2: Distribution of Update Support Periods by Carrier Type
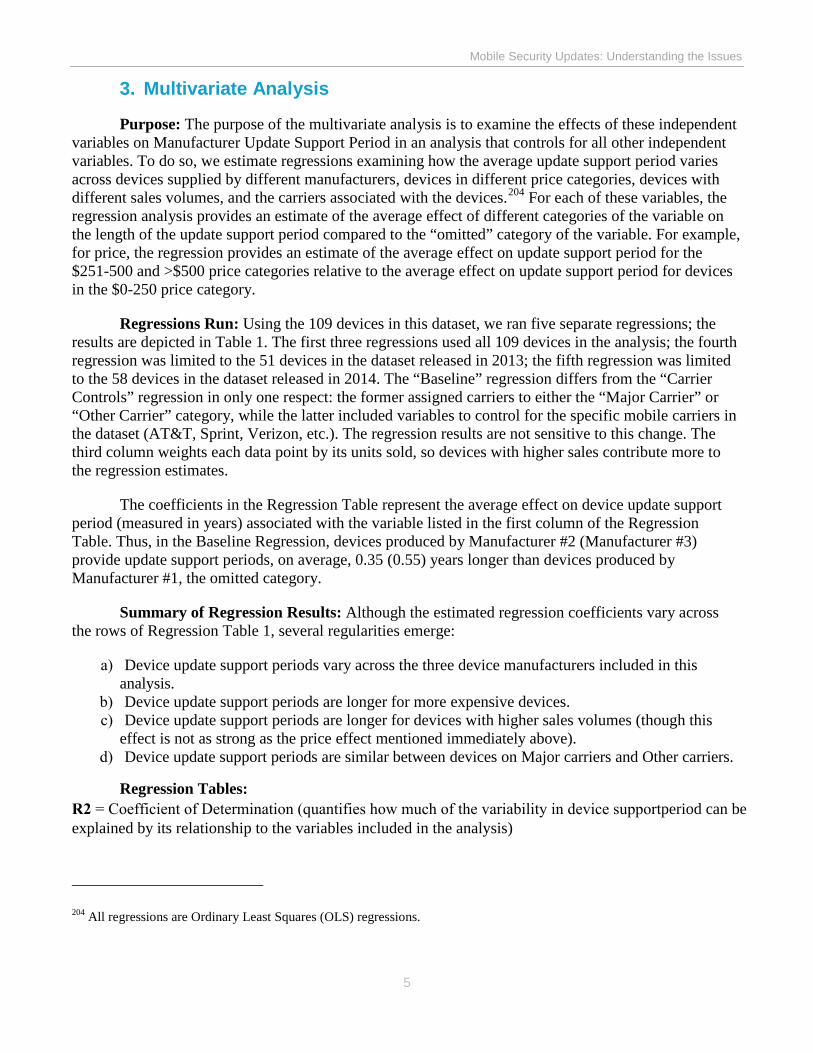
Mobile Security Updates: Understanding the Issues
5
3. Multivariate Analysis
Purpose: The purpose of the multivariate analysis is to examine the effects of these independent variables on Manufacturer Update Support Period in an analysis that controls for all other independent variables. To do so, we estimate regressions examining how the average update support period varies across devices supplied by different manufacturers, devices in different price categories, devices with different sales volumes, and the carriers associated with the devices.204 For each of these variables, the regression analysis provides an estimate of the average effect of different categories of the variable on the length of the update support period compared to the “omitted” category of the variable. For example, for price, the regression provides an estimate of the average effect on update support period for the $251-500 and >$500 price categories relative to the average effect on update support period for devices in the $0-250 price category.
Regressions Run: Using the 109 devices in this dataset, we ran five separate regressions; the results are depicted in Table 1. The first three regressions used all 109 devices in the analysis; the fourth regression was limited to the 51 devices in the dataset released in 2013; the fifth regression was limited to the 58 devices in the dataset released in 2014. The “Baseline” regression differs from the “Carrier Controls” regression in only one respect: the former assigned carriers to either the “Major Carrier” or “Other Carrier” category, while the latter included variables to control for the specific mobile carriers in the dataset (AT&T, Sprint, Verizon, etc.). The regression results are not sensitive to this change. The third column weights each data point by its units sold, so devices with higher sales contribute more to the regression estimates.
The coefficients in the Regression Table represent the average effect on device update support period (measured in years) associated with the variable listed in the first column of the Regression Table. Thus, in the Baseline Regression, devices produced by Manufacturer #2 (Manufacturer #3) provide update support periods, on average, 0.35 (0.55) years longer than devices produced by Manufacturer #1, the omitted category.
Summary of Regression Results: Although the estimated regression coefficients vary across the rows of Regression Table 1, several regularities emerge:
a) Device update support periods vary across the three device manufacturers included in this analysis.
b) Device update support periods are longer for more expensive devices.c) Device update support periods are longer for devices with higher sales volumes (though this
effect is not as strong as the price effect mentioned immediately above).d) Device update support periods are similar between devices on Major carriers and Other carriers.
Regression Tables: R2 = Coefficient of Determination (quantifies how much of the variability in device supportperiod can be
explained by its relationship to the variables included in the analysis)
204 All regressions are Ordinary Least Squares (OLS) regressions.
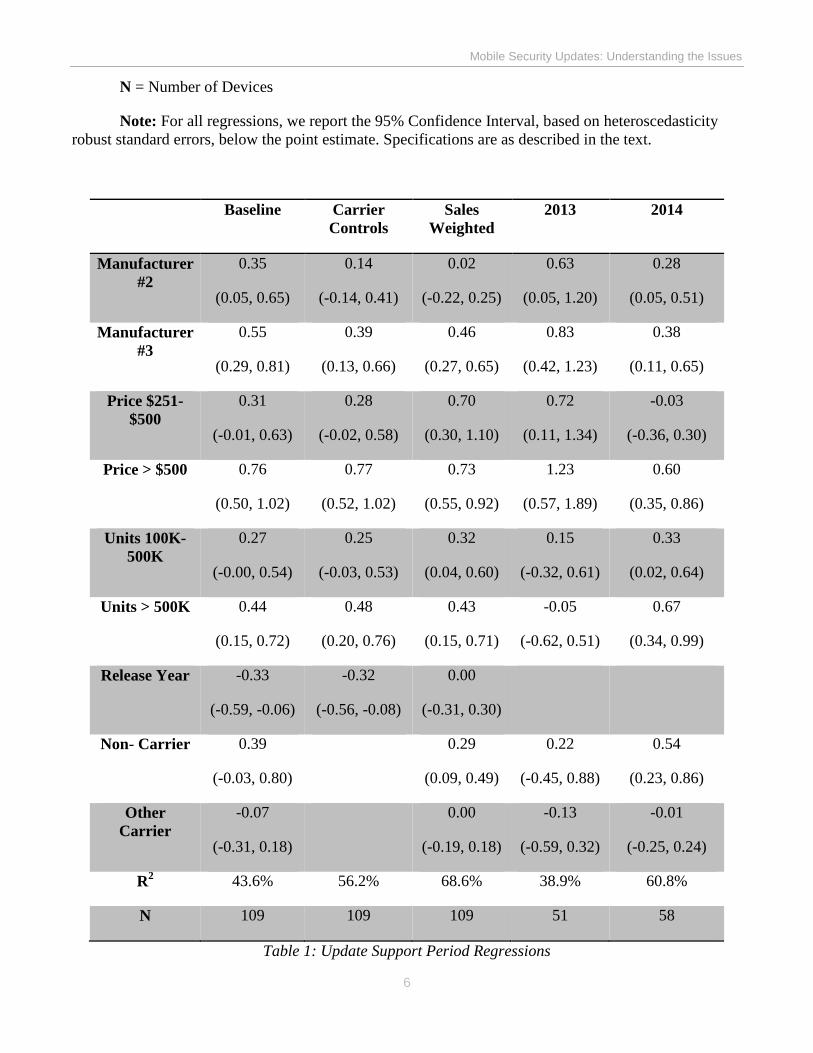
Mobile Security Updates: Understanding the Issues
6
N = Number of Devices
Note: For all regressions, we report the 95% Confidence Interval, based on heteroscedasticity robust standard errors, below the point estimate. Specifications are as described in the text.
Baseline Carrier Controls
Sales Weighted
2013 2014
Manufacturer #2
0.35
(0.05, 0.65)
0.14
(-0.14, 0.41)
0.02
(-0.22, 0.25)
0.63
(0.05, 1.20)
0.28
(0.05, 0.51)
Manufacturer #3
0.55
(0.29, 0.81)
0.39
(0.13, 0.66)
0.46
(0.27, 0.65)
0.83
(0.42, 1.23)
0.38
(0.11, 0.65)
Price $251-$500
0.31
(-0.01, 0.63)
0.28
(-0.02, 0.58)
0.70
(0.30, 1.10)
0.72
(0.11, 1.34)
-0.03
(-0.36, 0.30)
Price > $500 0.76
(0.50, 1.02)
0.77
(0.52, 1.02)
0.73
(0.55, 0.92)
1.23
(0.57, 1.89)
0.60
(0.35, 0.86)
Units 100K-500K
0.27
(-0.00, 0.54)
0.25
(-0.03, 0.53)
0.32
(0.04, 0.60)
0.15
(-0.32, 0.61)
0.33
(0.02, 0.64)
Units > 500K 0.44
(0.15, 0.72)
0.48
(0.20, 0.76)
0.43
(0.15, 0.71)
-0.05
(-0.62, 0.51)
0.67
(0.34, 0.99)
Release Year -0.33
(-0.59, -0.06)
-0.32
(-0.56, -0.08)
0.00
(-0.31, 0.30)
Non- Carrier 0.39
(-0.03, 0.80)
0.29
(0.09, 0.49)
0.22
(-0.45, 0.88)
0.54
(0.23, 0.86)
Other Carrier
-0.07
(-0.31, 0.18)
0.00
(-0.19, 0.18)
-0.13
(-0.59, 0.32)
-0.01
(-0.25, 0.24)
R2 43.6% 56.2% 68.6% 38.9% 60.8%
N 109 109 109 51 58
Table 1: Update Support Period Regressions
Mobile Security Updates: Understanding the Issues
7
II. Manufacturer Update FrequencyQuestions Addressed: To what extent does security update frequency for mobile devices differ,
both across devices and across manufacturers, and what factors are correlated with these differences?
1. Data and Variables Considered
Dataset: Two Android mobile device manufacturers, with 84 devices released between 2013 and 2015.
Dependent Variable: The number of updates per year within the support period, defined as the number of updates divided by the support period length.
Independent Variables: Manufacturer of Device, Price of Device, Sales Volume of Device, Carrier Associated with the Device, Device Release Year.
a) Manufacturer: For this analysis, we obtained data suitable for analysis from two Androidmobile device manufacturers. In this dataset, 38% of the devices in our data are fromManufacturer #1 and 62% from Manufacturer #2.
b) Price: We separate prices into three categories: devices with an average price between $0and $250, devices with an average price between $251 and $500, and devices with anaverage price above $500. In this dataset, 54% of devices are in the lowest price category,20% are in the middle price category, and 26% are in the highest price category.
c) Sales Volume: Measured as units sold for a given device on a given carrier. We separateunits sold into three categories: devices with overall/lifetime sales of less than 100,000 units,devices with overall/lifetime sales between 100,000 and 500,000 units, and devices withoverall/lifetime sales above 500,000 units. In this dataset, 15% of devices are in the lowestsales category, 32% are in the middle sales category, and 52% are in the highest salescategory.
d) Carrier Type: We separate carriers into three categories: Major carriers (T-Mobile, AT&T,Sprint, and Verizon), Other carriers (all other carriers), and Non-Carrier devices (Unlockedand Wi-Fi only devices). In this dataset, 57% of devices are associated with Major carriers,36% are associated with Other carriers, and 7% are not associated with any carriers (so-called Non-Carrier devices).
e) Release Year: We only include devices released from 2013 to 2015; 24% of the deviceswere released in 2013, 40% in 2014, and 36% in 2015.
2. Univariate Analysis
The report contains graphs of the distribution of the update frequency overall, by manufacturer, by price category, and by carrier type. Below we include graphs showing the distribution of the update frequency by sales volume category, and provide confidence intervals for the means of the update frequency by category for each variable. Overall, these graphs show that update frequency varies considerably.
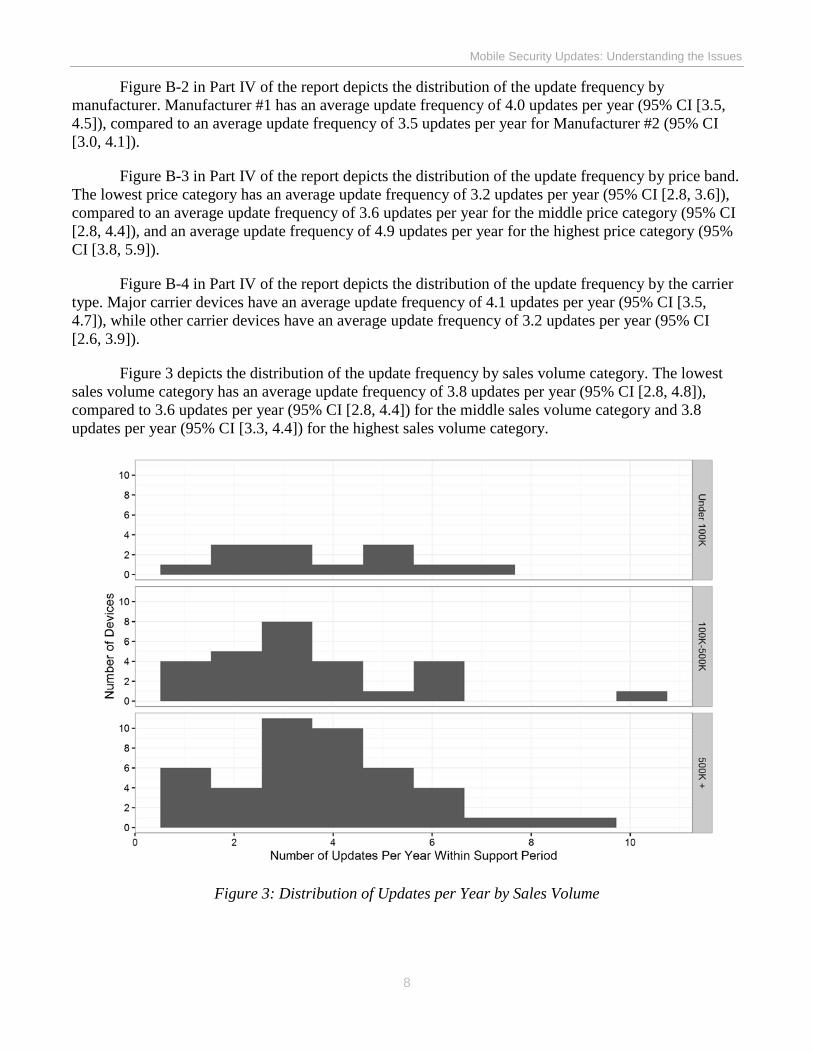
Mobile Security Updates: Understanding the Issues
8
Figure B-2 in Part IV of the report depicts the distribution of the update frequency by manufacturer. Manufacturer #1 has an average update frequency of 4.0 updates per year (95% CI [3.5, 4.5]), compared to an average update frequency of 3.5 updates per year for Manufacturer #2 (95% CI [3.0, 4.1]).
Figure B-3 in Part IV of the report depicts the distribution of the update frequency by price band. The lowest price category has an average update frequency of 3.2 updates per year (95% CI [2.8, 3.6]), compared to an average update frequency of 3.6 updates per year for the middle price category (95% CI [2.8, 4.4]), and an average update frequency of 4.9 updates per year for the highest price category (95% CI [3.8, 5.9]).
Figure B-4 in Part IV of the report depicts the distribution of the update frequency by the carrier type. Major carrier devices have an average update frequency of 4.1 updates per year (95% CI [3.5, 4.7]), while other carrier devices have an average update frequency of 3.2 updates per year (95% CI [2.6, 3.9]).
Figure 3 depicts the distribution of the update frequency by sales volume category. The lowest sales volume category has an average update frequency of 3.8 updates per year (95% CI [2.8, 4.8]), compared to 3.6 updates per year (95% CI [2.8, 4.4]) for the middle sales volume category and 3.8 updates per year (95% CI [3.3, 4.4]) for the highest sales volume category.
Figure 3: Distribution of Updates per Year by Sales Volume
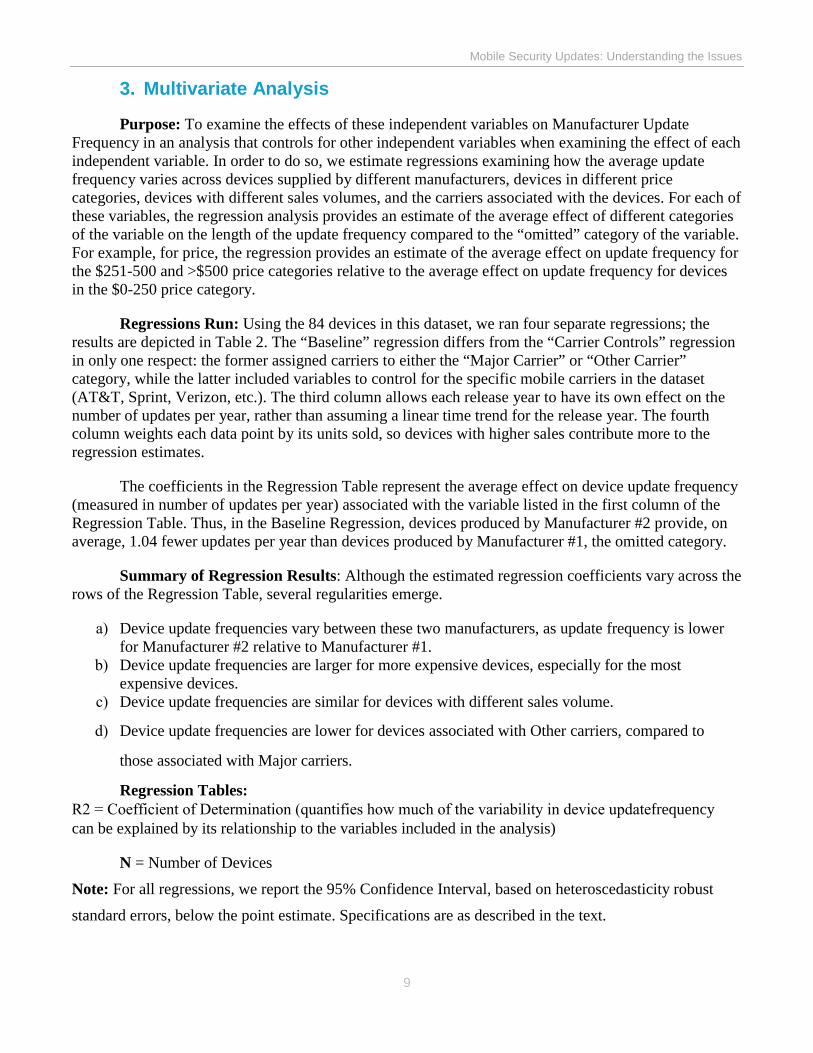
Mobile Security Updates: Understanding the Issues
9
3. Multivariate Analysis
Purpose: To examine the effects of these independent variables on Manufacturer Update Frequency in an analysis that controls for other independent variables when examining the effect of each independent variable. In order to do so, we estimate regressions examining how the average update frequency varies across devices supplied by different manufacturers, devices in different price categories, devices with different sales volumes, and the carriers associated with the devices. For each of these variables, the regression analysis provides an estimate of the average effect of different categories of the variable on the length of the update frequency compared to the “omitted” category of the variable. For example, for price, the regression provides an estimate of the average effect on update frequency for the $251-500 and >$500 price categories relative to the average effect on update frequency for devices in the $0-250 price category.
Regressions Run: Using the 84 devices in this dataset, we ran four separate regressions; the results are depicted in Table 2. The “Baseline” regression differs from the “Carrier Controls” regression in only one respect: the former assigned carriers to either the “Major Carrier” or “Other Carrier” category, while the latter included variables to control for the specific mobile carriers in the dataset (AT&T, Sprint, Verizon, etc.). The third column allows each release year to have its own effect on the number of updates per year, rather than assuming a linear time trend for the release year. The fourth column weights each data point by its units sold, so devices with higher sales contribute more to the regression estimates.
The coefficients in the Regression Table represent the average effect on device update frequency (measured in number of updates per year) associated with the variable listed in the first column of the Regression Table. Thus, in the Baseline Regression, devices produced by Manufacturer #2 provide, on average, 1.04 fewer updates per year than devices produced by Manufacturer #1, the omitted category.
Summary of Regression Results: Although the estimated regression coefficients vary across the rows of the Regression Table, several regularities emerge.
a) Device update frequencies vary between these two manufacturers, as update frequency is lowerfor Manufacturer #2 relative to Manufacturer #1.
b) Device update frequencies are larger for more expensive devices, especially for the mostexpensive devices.
c) Device update frequencies are similar for devices with different sales volume.
d) Device update frequencies are lower for devices associated with Other carriers, compared to
those associated with Major carriers.
Regression Tables:R2 = Coefficient of Determination (quantifies how much of the variability in device updatefrequency can be explained by its relationship to the variables included in the analysis)
N = Number of Devices Note: For all regressions, we report the 95% Confidence Interval, based on heteroscedasticity robust
standard errors, below the point estimate. Specifications are as described in the text.
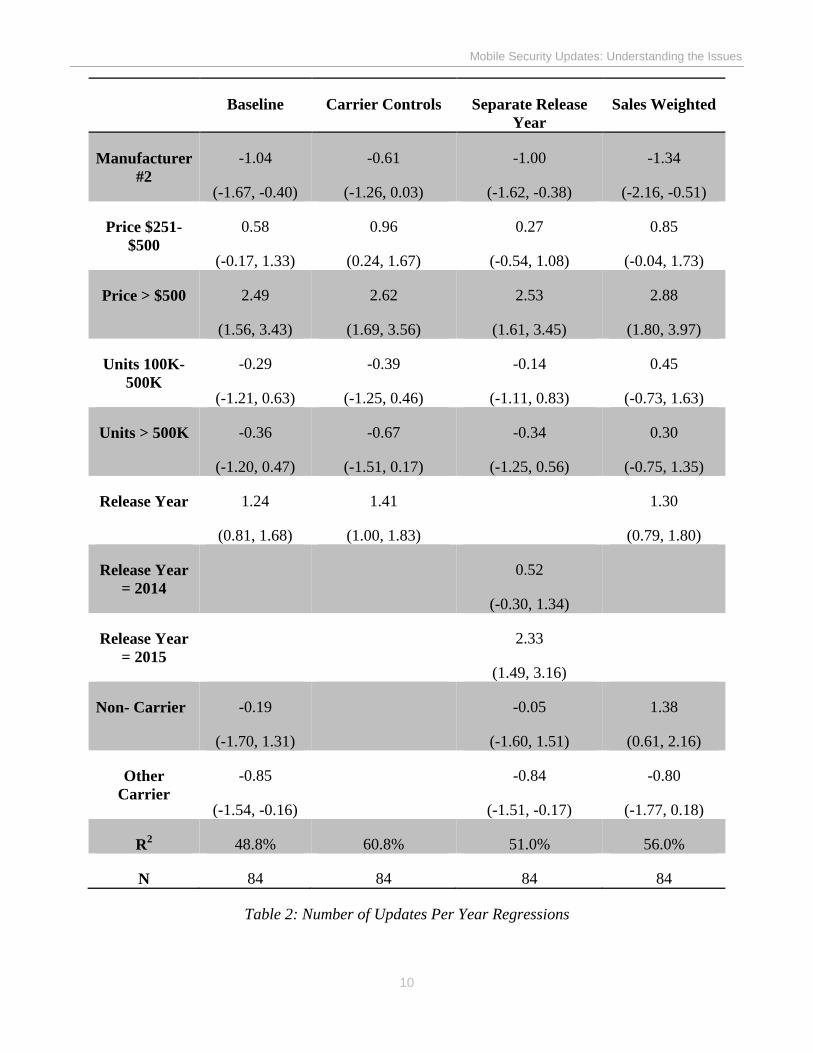
Mobile Security Updates: Understanding the Issues
10
Baseline Carrier Controls Separate Release Year
Sales Weighted
Manufacturer #2
-1.04
(-1.67, -0.40)
-0.61
(-1.26, 0.03)
-1.00
(-1.62, -0.38)
-1.34
(-2.16, -0.51)
Price $251-$500
0.58
(-0.17, 1.33)
0.96
(0.24, 1.67)
0.27
(-0.54, 1.08)
0.85
(-0.04, 1.73)
Price > $500 2.49
(1.56, 3.43)
2.62
(1.69, 3.56)
2.53
(1.61, 3.45)
2.88
(1.80, 3.97)
Units 100K-500K
-0.29
(-1.21, 0.63)
-0.39
(-1.25, 0.46)
-0.14
(-1.11, 0.83)
0.45
(-0.73, 1.63)
Units > 500K -0.36
(-1.20, 0.47)
-0.67
(-1.51, 0.17)
-0.34
(-1.25, 0.56)
0.30
(-0.75, 1.35)
Release Year 1.24
(0.81, 1.68)
1.41
(1.00, 1.83)
1.30
(0.79, 1.80)
Release Year = 2014
0.52
(-0.30, 1.34)
Release Year = 2015
2.33
(1.49, 3.16)
Non- Carrier -0.19
(-1.70, 1.31)
-0.05
(-1.60, 1.51)
1.38
(0.61, 2.16)
Other Carrier
-0.85
(-1.54, -0.16)
-0.84
(-1.51, -0.17)
-0.80
(-1.77, 0.18)
R2 48.8% 60.8% 51.0% 56.0%
N 84 84 84 84
Table 2: Number of Updates Per Year Regressions
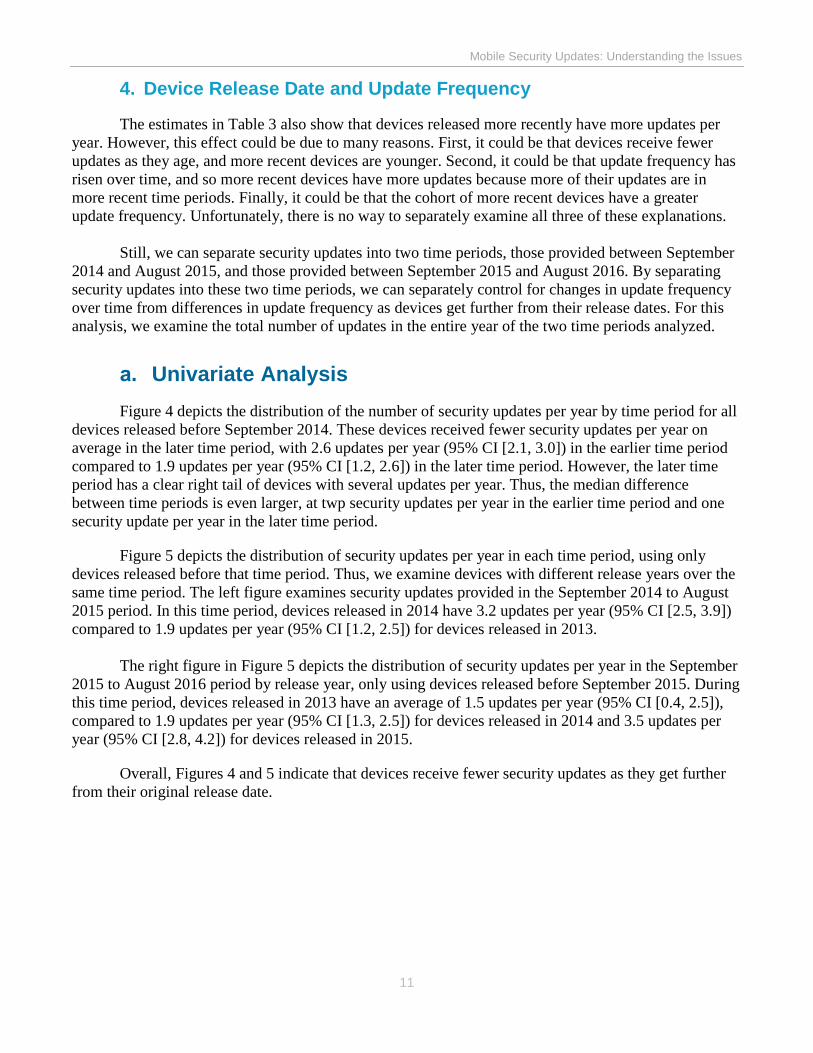
Mobile Security Updates: Understanding the Issues
11
4. Device Release Date and Update Frequency
The estimates in Table 3 also show that devices released more recently have more updates per year. However, this effect could be due to many reasons. First, it could be that devices receive fewer updates as they age, and more recent devices are younger. Second, it could be that update frequency has risen over time, and so more recent devices have more updates because more of their updates are in more recent time periods. Finally, it could be that the cohort of more recent devices have a greater update frequency. Unfortunately, there is no way to separately examine all three of these explanations.
Still, we can separate security updates into two time periods, those provided between September 2014 and August 2015, and those provided between September 2015 and August 2016. By separating security updates into these two time periods, we can separately control for changes in update frequency over time from differences in update frequency as devices get further from their release dates. For this analysis, we examine the total number of updates in the entire year of the two time periods analyzed.
a. Univariate AnalysisFigure 4 depicts the distribution of the number of security updates per year by time period for all
devices released before September 2014. These devices received fewer security updates per year on average in the later time period, with 2.6 updates per year (95% CI [2.1, 3.0]) in the earlier time period compared to 1.9 updates per year (95% CI [1.2, 2.6]) in the later time period. However, the later time period has a clear right tail of devices with several updates per year. Thus, the median difference between time periods is even larger, at twp security updates per year in the earlier time period and one security update per year in the later time period.
Figure 5 depicts the distribution of security updates per year in each time period, using only devices released before that time period. Thus, we examine devices with different release years over the same time period. The left figure examines security updates provided in the September 2014 to August 2015 period. In this time period, devices released in 2014 have 3.2 updates per year (95% CI [2.5, 3.9]) compared to 1.9 updates per year (95% CI [1.2, 2.5]) for devices released in 2013.
The right figure in Figure 5 depicts the distribution of security updates per year in the September 2015 to August 2016 period by release year, only using devices released before September 2015. During this time period, devices released in 2013 have an average of 1.5 updates per year (95% CI [0.4, 2.5]), compared to 1.9 updates per year (95% CI [1.3, 2.5]) for devices released in 2014 and 3.5 updates per year (95% CI [2.8, 4.2]) for devices released in 2015.
Overall, Figures 4 and 5 indicate that devices receive fewer security updates as they get further from their original release date.
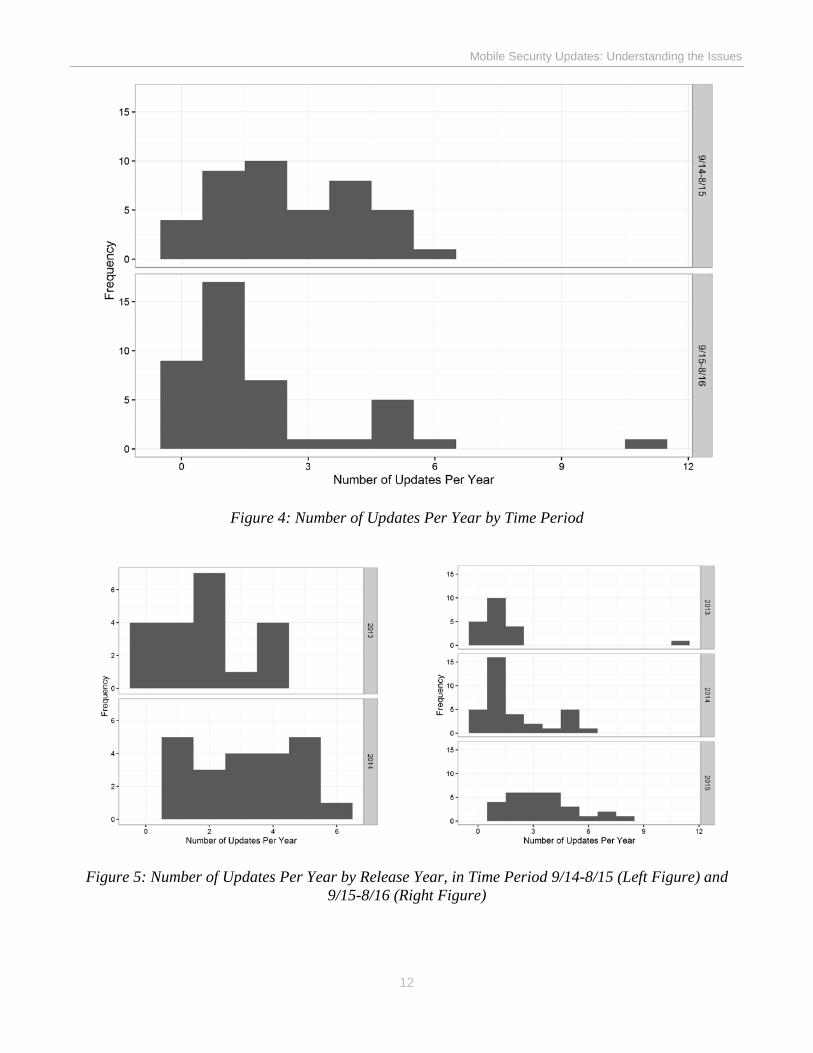
Mobile Security Updates: Understanding the Issues
12
Figure 4: Number of Updates Per Year by Time Period
Figure 5: Number of Updates Per Year by Release Year, in Time Period 9/14-8/15 (Left Figure) and 9/15-8/16 (Right Figure)
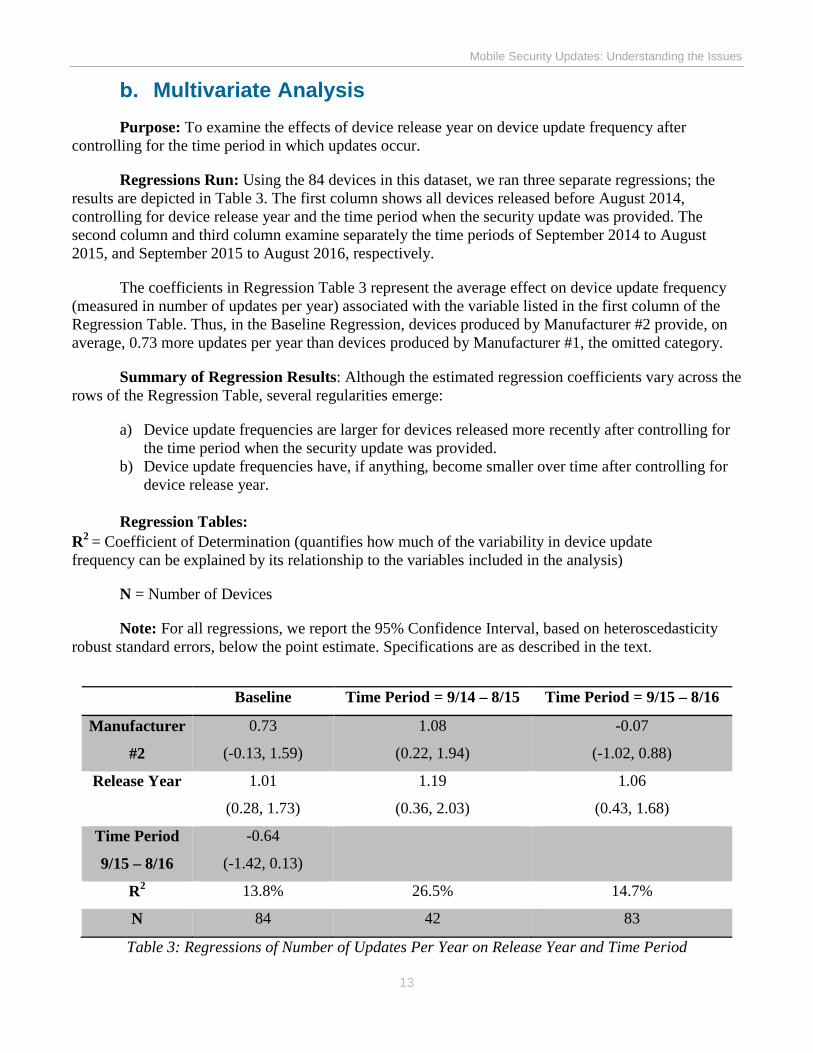
Mobile Security Updates: Understanding the Issues
13
b. Multivariate AnalysisPurpose: To examine the effects of device release year on device update frequency after
controlling for the time period in which updates occur.
Regressions Run: Using the 84 devices in this dataset, we ran three separate regressions; the results are depicted in Table 3. The first column shows all devices released before August 2014, controlling for device release year and the time period when the security update was provided. The second column and third column examine separately the time periods of September 2014 to August 2015, and September 2015 to August 2016, respectively.
The coefficients in Regression Table 3 represent the average effect on device update frequency (measured in number of updates per year) associated with the variable listed in the first column of the Regression Table. Thus, in the Baseline Regression, devices produced by Manufacturer #2 provide, on average, 0.73 more updates per year than devices produced by Manufacturer #1, the omitted category.
Summary of Regression Results: Although the estimated regression coefficients vary across the rows of the Regression Table, several regularities emerge:
a) Device update frequencies are larger for devices released more recently after controlling forthe time period when the security update was provided.
b) Device update frequencies have, if anything, become smaller over time after controlling fordevice release year.
Regression Tables: R2 = Coefficient of Determination (quantifies how much of the variability in device update frequency can be explained by its relationship to the variables included in the analysis)
N = Number of Devices
Note: For all regressions, we report the 95% Confidence Interval, based on heteroscedasticity robust standard errors, below the point estimate. Specifications are as described in the text.
Baseline Time Period = 9/14 – 8/15 Time Period = 9/15 – 8/16
Manufacturer
#2
0.73
(-0.13, 1.59)
1.08
(0.22, 1.94)
-0.07
(-1.02, 0.88)
Release Year 1.01
(0.28, 1.73)
1.19
(0.36, 2.03)
1.06
(0.43, 1.68)
Time Period
9/15 – 8/16
-0.64
(-1.42, 0.13)
R2 13.8% 26.5% 14.7%
N 84 42 83
Table 3: Regressions of Number of Updates Per Year on Release Year and Time Period
Mobile Security Updates: Understanding the Issues
14
III. Patch Development and TestingA. Device ManufacturersQuestions Addressed: To what extent does the time to patch a vulnerability vary, both across
devices and across time, and what factors are correlated with these differences?
1. Data and Variables Considered
Dataset: We have data from two Android mobile device manufacturers, which we analyze separately given several differences in the data provided by each manufacturer. These differences mean that it is difficult to compare vulnerability times between manufacturers, and so our analysis concentrates on differences across factors within a given manufacturer.
Dependent Variable: a) Manufacturer #1: The time that it takes to fix a given vulnerability, defined as the time from
when the manufacturer was notified about the vulnerability to the time when the relevant patchwas deployed for users.
a) Manufacturer #2: The time that it takes to fix a given vulnerability, defined as the time fromwhen the manufacturer was notified about the vulnerability to the time when the vulnerabilitypatch was released for testing. We use the patch testing date instead of the patch release datebecause the date when the vulnerability patch was deployed to users was not recorded for 11.4%of observations.205
Data Restrictions:a) Manufacturer #1: For this manufacturer, we only received data on vulnerabilities that were fixed
for at least one device. Thus, our analysis is conditional on a vulnerability having been fixed forsome device and carrier, and so we may overestimate the fraction of vulnerabilities for thismanufacturer that were fixed. The time that the vulnerability patch was released for deploymentby users should be after the time when the manufacturer was notified about the vulnerability; thiscondition was violated for 0.5% of vulnerabilities, which we exclude from the analysis. Inaddition, we only include vulnerabilities discovered post device release, which removes 11.8%of the remaining vulnerabilities. We also exclude the small number of vulnerabilities discoveredin 2013, which excludes a further 1.1% of vulnerabilities. Even with these exclusions, the datasetfor Manufacturer #1 contains 24,597 vulnerabilities, of which 52.4% have been fixed.
205 On average, for vulnerabilities for which we have information on both the testing date and deployment date, the deployment date was 18 days after the testing date, and the largest gap between deployment date and testing date was 70 days.
Mobile Security Updates: Understanding the Issues
15
b) Manufacturer #2: We included vulnerabilities for a given device and carrier that we could matchto data from this manufacturer on device support periods. This approach excluded somevulnerabilities as we could not exactly match these two datasets. In addition, for 11 differentdevice-carrier pairs, the data on vulnerabilities patching times mapped to two different entries inthe device support data. In this case, which affected 14.0% of vulnerabilities in the final dataset,we assigned information (such as price and units sold) based upon the higher selling device forthe given device-carrier pair.
The time that the vulnerability patch was released for testing should be after the time when themanufacturer was notified about the vulnerability; this condition was violated for 6.3% of vulnerabilities, which we exclude from the analysis. In addition, we only include vulnerabilities discovered post device release, which removes 25.1% of the remaining vulnerabilities. We also exclude the small number of vulnerabilities discovered in 2013 and the small number of devices released in 2016, which excludes another 4.6% of vulnerabilities. Even with these exclusions, the dataset for Manufacturer #2 contains 7,115 vulnerabilities, of which 33.2% have been fixed.
Independent Variables: Price of Device, Sales Volume of Device, Carrier Associated with the Device, Device Release Year, and Vulnerability Discovery Year
a) Price: We separate prices into three categories: devices with an average price between $0 and$250, devices with an average price between $251 and $500, and devices with an average priceabove $500. For Manufacturer #1, 46% of vulnerabilities are for devices are in the lowest pricecategory, 10% are for devices in the middle price category, and 43% are for devices in thehighest price category. For Manufacturer #2, 21% of vulnerabilities are for devices are in thelowest price category, 32% are for devices in the middle price category, and 47% are for devicesin the highest price category.
b) Sales Volume: Measured as units sold for a given device on a given carrier. We separate unitssold into three categories: devices with overall/lifetime sales of less than 100,000 units, deviceswith overall/lifetime sales between 100,000 and 500,000 units, and devices with overall/lifetimesales above 500,000 units. For Manufacturer #1, 13% of vulnerabilities are for devices in thelowest sales category, 26% are for devices in the middle sales category, and 61% are for devicesin the highest sales category. For Manufacturer #2, 58% of vulnerabilities are for devices in thelowest sales category, 33% are for devices in the middle sales category, and 9% are for devicesin the highest sales category.
c) Carrier Type: We separate carriers into three categories: Major carriers (T-Mobile, AT&T,Sprint, and Verizon), Other carriers (all other carriers), and Non-Carrier devices (Unlocked andWi-Fi only devices). For Manufacturer #1, 56% of updates are for devices associated with Majorcarriers, 40% are associated with Other carriers, and 4% are not associated with any carriers (so-called Non-Carrier devices). For Manufacturer #2, 56% of updates are for devices associatedwith Major carriers, 23% are associated with Other carriers, and 20% are not associated with anycarriers (so-called Non-Carrier devices).
d) Device Release Year: For Manufacturer #1, 24% of the vulnerabilities were for devices releasedin 2013, 49% in 2014, and 27% in 2015. For Manufacturer #2, 34% of the vulnerabilities were
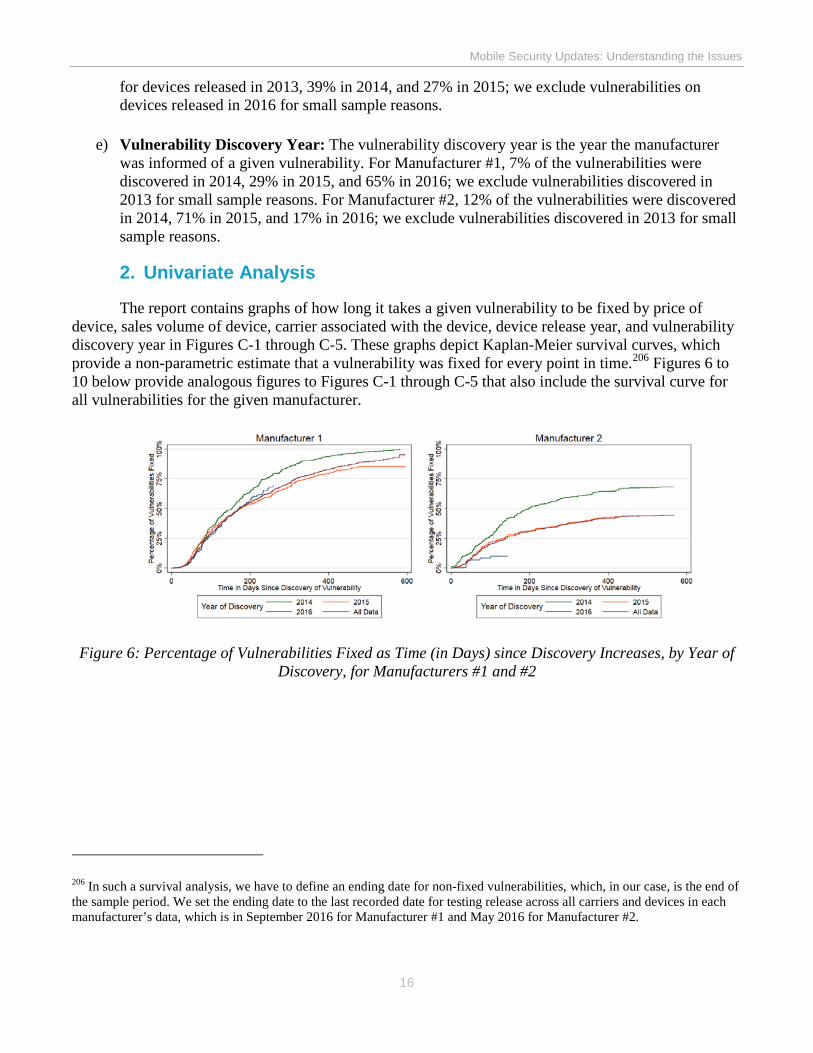
Mobile Security Updates: Understanding the Issues
16
for devices released in 2013, 39% in 2014, and 27% in 2015; we exclude vulnerabilities on devices released in 2016 for small sample reasons.
e) Vulnerability Discovery Year: The vulnerability discovery year is the year the manufacturerwas informed of a given vulnerability. For Manufacturer #1, 7% of the vulnerabilities werediscovered in 2014, 29% in 2015, and 65% in 2016; we exclude vulnerabilities discovered in2013 for small sample reasons. For Manufacturer #2, 12% of the vulnerabilities were discoveredin 2014, 71% in 2015, and 17% in 2016; we exclude vulnerabilities discovered in 2013 for smallsample reasons.
2. Univariate Analysis
The report contains graphs of how long it takes a given vulnerability to be fixed by price of device, sales volume of device, carrier associated with the device, device release year, and vulnerability discovery year in Figures C-1 through C-5. These graphs depict Kaplan-Meier survival curves, which provide a non-parametric estimate that a vulnerability was fixed for every point in time.206 Figures 6 to 10 below provide analogous figures to Figures C-1 through C-5 that also include the survival curve for all vulnerabilities for the given manufacturer.
Figure 6: Percentage of Vulnerabilities Fixed as Time (in Days) since Discovery Increases, by Year of Discovery, for Manufacturers #1 and #2
206 In such a survival analysis, we have to define an ending date for non-fixed vulnerabilities, which, in our case, is the end of the sample period. We set the ending date to the last recorded date for testing release across all carriers and devices in each manufacturer’s data, which is in September 2016 for Manufacturer #1 and May 2016 for Manufacturer #2.
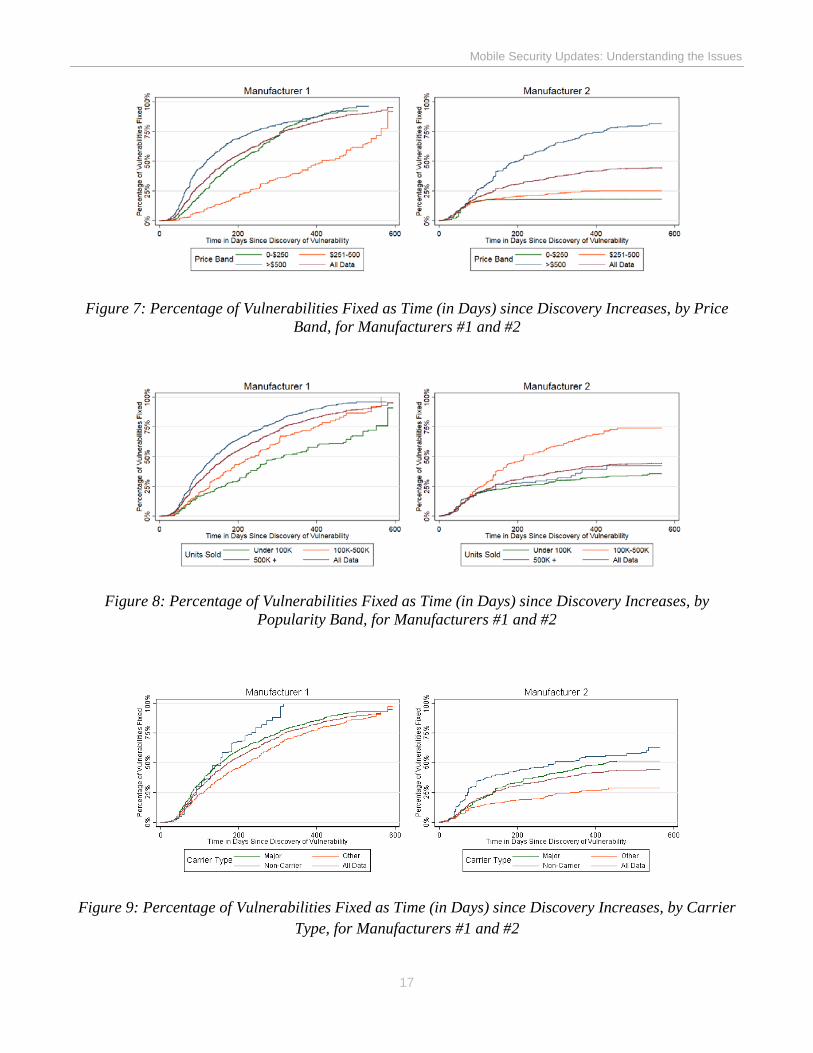
Mobile Security Updates: Understanding the Issues
17
Figure 7: Percentage of Vulnerabilities Fixed as Time (in Days) since Discovery Increases, by Price Band, for Manufacturers #1 and #2
Figure 8: Percentage of Vulnerabilities Fixed as Time (in Days) since Discovery Increases, by Popularity Band, for Manufacturers #1 and #2
Figure 9: Percentage of Vulnerabilities Fixed as Time (in Days) since Discovery Increases, by Carrier Type, for Manufacturers #1 and #2
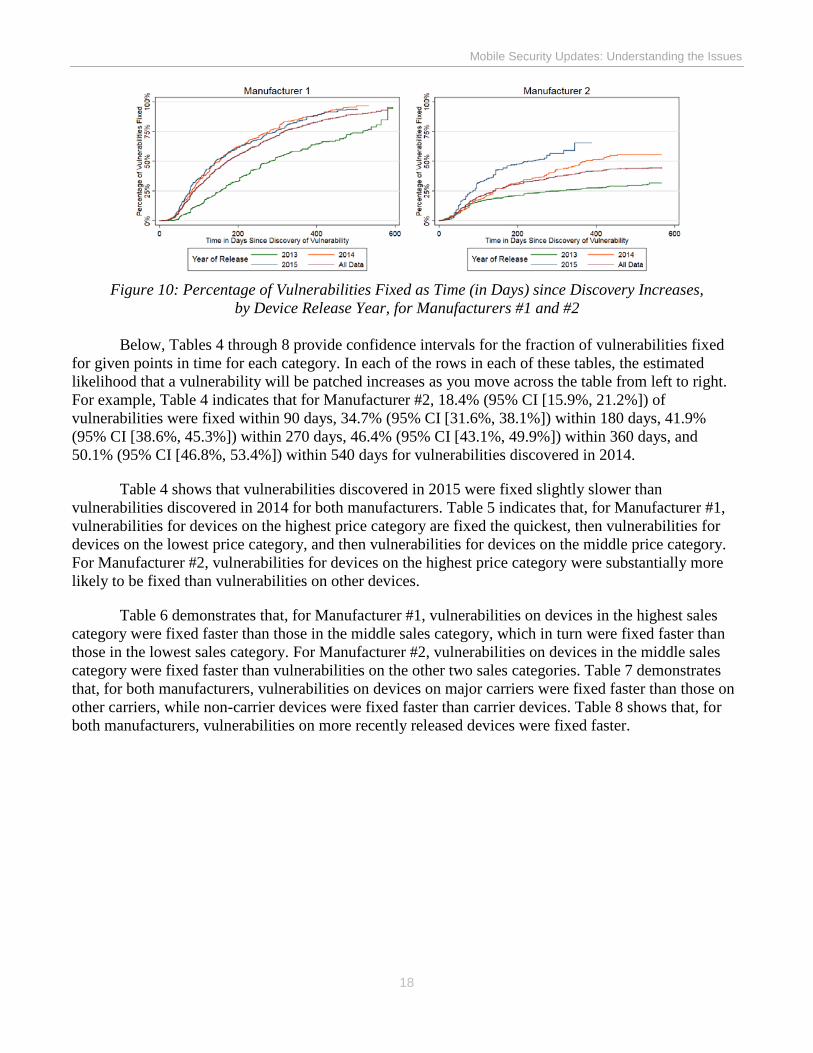
Mobile Security Updates: Understanding the Issues
18
Figure 10: Percentage of Vulnerabilities Fixed as Time (in Days) since Discovery Increases, by Device Release Year, for Manufacturers #1 and #2
Below, Tables 4 through 8 provide confidence intervals for the fraction of vulnerabilities fixed for given points in time for each category. In each of the rows in each of these tables, the estimated likelihood that a vulnerability will be patched increases as you move across the table from left to right. For example, Table 4 indicates that for Manufacturer #2, 18.4% (95% CI [15.9%, 21.2%]) of vulnerabilities were fixed within 90 days, 34.7% (95% CI [31.6%, 38.1%]) within 180 days, 41.9% (95% CI [38.6%, 45.3%]) within 270 days, 46.4% (95% CI [43.1%, 49.9%]) within 360 days, and 50.1% (95% CI [46.8%, 53.4%]) within 540 days for vulnerabilities discovered in 2014.
Table 4 shows that vulnerabilities discovered in 2015 were fixed slightly slower than vulnerabilities discovered in 2014 for both manufacturers. Table 5 indicates that, for Manufacturer #1, vulnerabilities for devices on the highest price category are fixed the quickest, then vulnerabilities for devices on the lowest price category, and then vulnerabilities for devices on the middle price category. For Manufacturer #2, vulnerabilities for devices on the highest price category were substantially more likely to be fixed than vulnerabilities on other devices.
Table 6 demonstrates that, for Manufacturer #1, vulnerabilities on devices in the highest sales category were fixed faster than those in the middle sales category, which in turn were fixed faster than those in the lowest sales category. For Manufacturer #2, vulnerabilities on devices in the middle sales category were fixed faster than vulnerabilities on the other two sales categories. Table 7 demonstrates that, for both manufacturers, vulnerabilities on devices on major carriers were fixed faster than those on other carriers, while non-carrier devices were fixed faster than carrier devices. Table 8 shows that, for both manufacturers, vulnerabilities on more recently released devices were fixed faster.
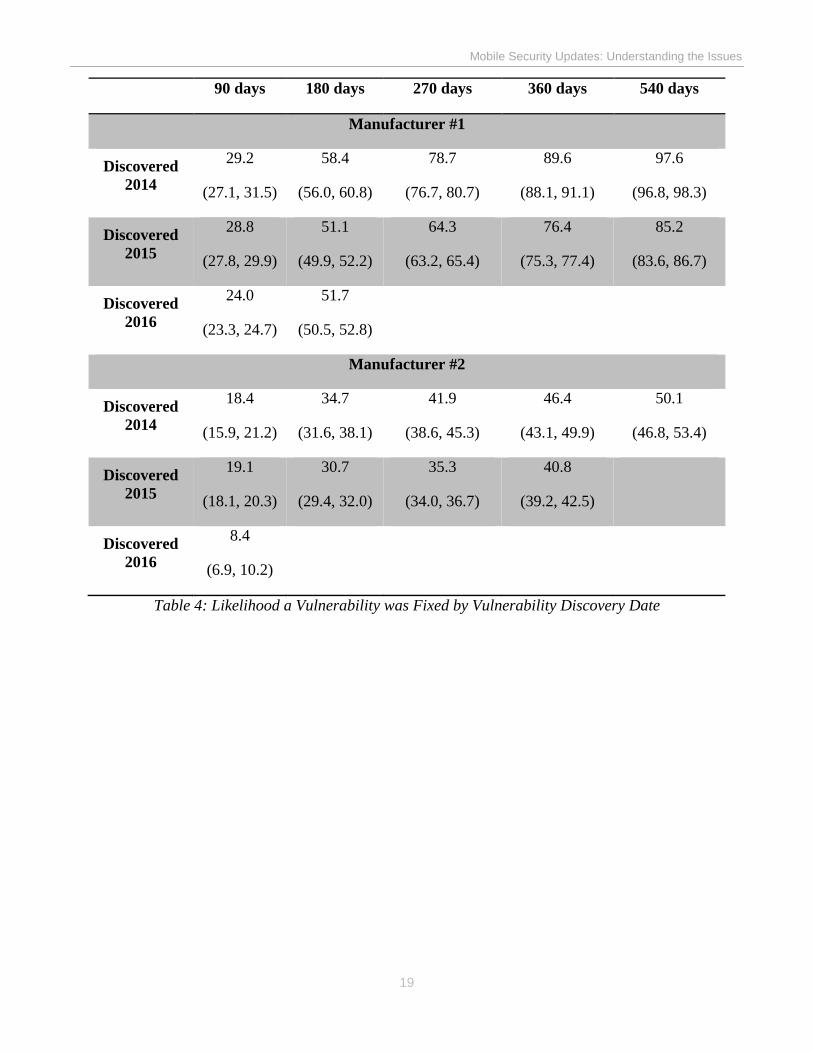
Mobile Security Updates: Understanding the Issues
19
90 days 180 days 270 days 360 days 540 days
Manufacturer #1
Discovered 2014
29.2
(27.1, 31.5)
58.4
(56.0, 60.8)
78.7
(76.7, 80.7)
89.6
(88.1, 91.1)
97.6
(96.8, 98.3)
Discovered 2015
28.8
(27.8, 29.9)
51.1
(49.9, 52.2)
64.3
(63.2, 65.4)
76.4
(75.3, 77.4)
85.2
(83.6, 86.7)
Discovered 2016
24.0
(23.3, 24.7)
51.7
(50.5, 52.8)
Manufacturer #2
Discovered 2014
18.4
(15.9, 21.2)
34.7
(31.6, 38.1)
41.9
(38.6, 45.3)
46.4
(43.1, 49.9)
50.1
(46.8, 53.4)
Discovered 2015
19.1
(18.1, 20.3)
30.7
(29.4, 32.0)
35.3
(34.0, 36.7)
40.8
(39.2, 42.5)
Discovered 2016
8.4
(6.9, 10.2)
Table 4: Likelihood a Vulnerability was Fixed by Vulnerability Discovery Date
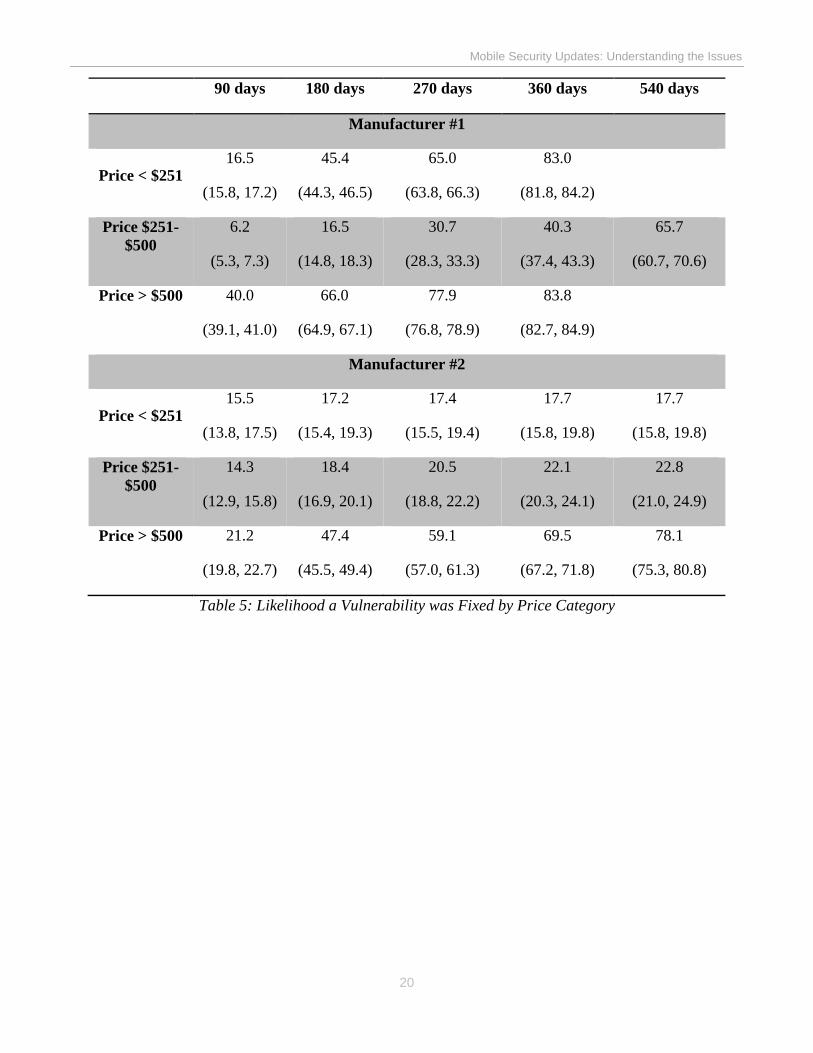
Mobile Security Updates: Understanding the Issues
20
90 days 180 days 270 days 360 days 540 days
Manufacturer #1
Price < $251 16.5
(15.8, 17.2)
45.4
(44.3, 46.5)
65.0
(63.8, 66.3)
83.0
(81.8, 84.2)
Price $251-$500
6.2
(5.3, 7.3)
16.5
(14.8, 18.3)
30.7
(28.3, 33.3)
40.3
(37.4, 43.3)
65.7
(60.7, 70.6)
Price > $500 40.0
(39.1, 41.0)
66.0
(64.9, 67.1)
77.9
(76.8, 78.9)
83.8
(82.7, 84.9)
Manufacturer #2
Price < $251 15.5
(13.8, 17.5)
17.2
(15.4, 19.3)
17.4
(15.5, 19.4)
17.7
(15.8, 19.8)
17.7
(15.8, 19.8)
Price $251-$500
14.3
(12.9, 15.8)
18.4
(16.9, 20.1)
20.5
(18.8, 22.2)
22.1
(20.3, 24.1)
22.8
(21.0, 24.9)
Price > $500 21.2
(19.8, 22.7)
47.4
(45.5, 49.4)
59.1
(57.0, 61.3)
69.5
(67.2, 71.8)
78.1
(75.3, 80.8)
Table 5: Likelihood a Vulnerability was Fixed by Price Category
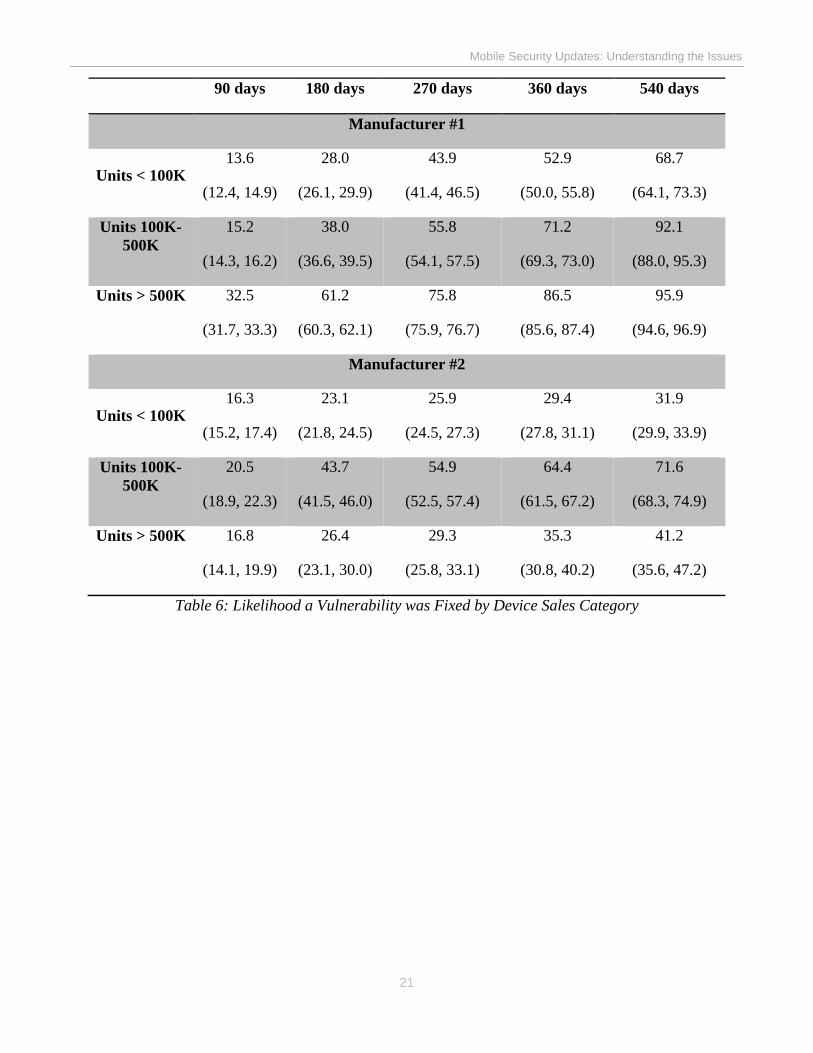
Mobile Security Updates: Understanding the Issues
21
90 days 180 days 270 days 360 days 540 days
Manufacturer #1
Units < 100K 13.6
(12.4, 14.9)
28.0
(26.1, 29.9)
43.9
(41.4, 46.5)
52.9
(50.0, 55.8)
68.7
(64.1, 73.3)
Units 100K-500K
15.2
(14.3, 16.2)
38.0
(36.6, 39.5)
55.8
(54.1, 57.5)
71.2
(69.3, 73.0)
92.1
(88.0, 95.3)
Units > 500K 32.5
(31.7, 33.3)
61.2
(60.3, 62.1)
75.8
(75.9, 76.7)
86.5
(85.6, 87.4)
95.9
(94.6, 96.9)
Manufacturer #2
Units < 100K 16.3
(15.2, 17.4)
23.1
(21.8, 24.5)
25.9
(24.5, 27.3)
29.4
(27.8, 31.1)
31.9
(29.9, 33.9)
Units 100K-500K
20.5
(18.9, 22.3)
43.7
(41.5, 46.0)
54.9
(52.5, 57.4)
64.4
(61.5, 67.2)
71.6
(68.3, 74.9)
Units > 500K 16.8
(14.1, 19.9)
26.4
(23.1, 30.0)
29.3
(25.8, 33.1)
35.3
(30.8, 40.2)
41.2
(35.6, 47.2)
Table 6: Likelihood a Vulnerability was Fixed by Device Sales Category
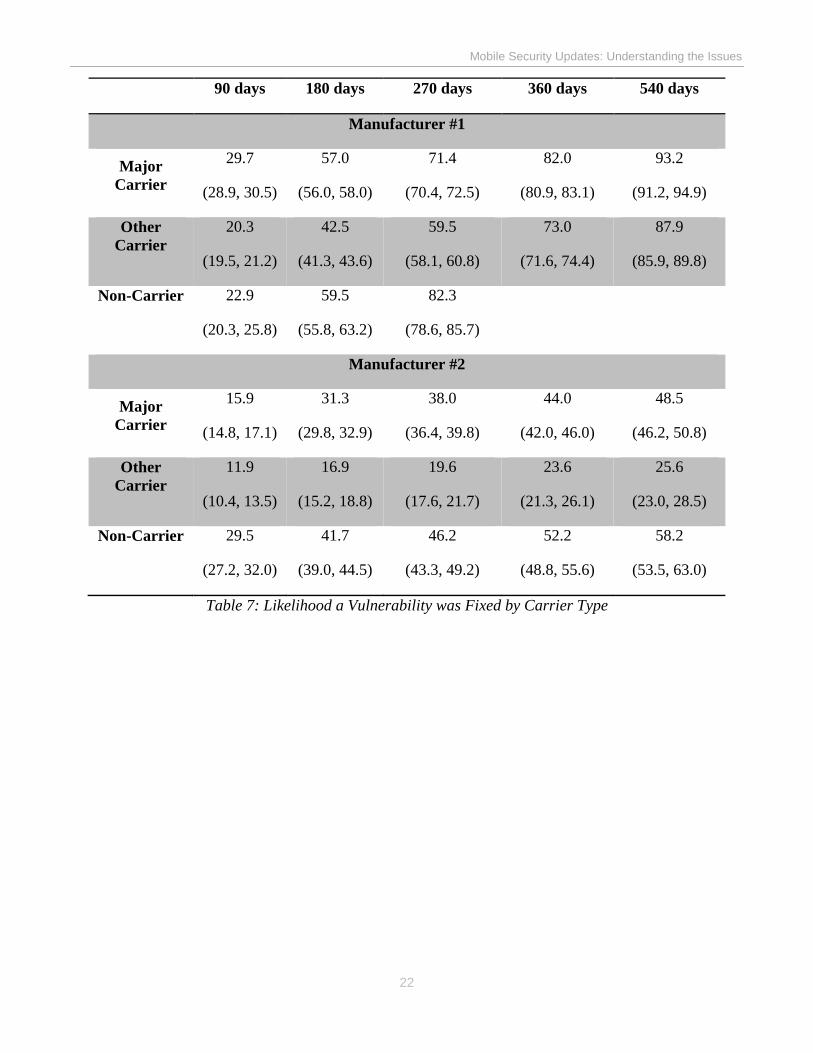
Mobile Security Updates: Understanding the Issues
22
90 days 180 days 270 days 360 days 540 days
Manufacturer #1
Major Carrier
29.7
(28.9, 30.5)
57.0
(56.0, 58.0)
71.4
(70.4, 72.5)
82.0
(80.9, 83.1)
93.2
(91.2, 94.9)
Other Carrier
20.3
(19.5, 21.2)
42.5
(41.3, 43.6)
59.5
(58.1, 60.8)
73.0
(71.6, 74.4)
87.9
(85.9, 89.8)
Non-Carrier 22.9
(20.3, 25.8)
59.5
(55.8, 63.2)
82.3
(78.6, 85.7)
Manufacturer #2
Major Carrier
15.9
(14.8, 17.1)
31.3
(29.8, 32.9)
38.0
(36.4, 39.8)
44.0
(42.0, 46.0)
48.5
(46.2, 50.8)
Other Carrier
11.9
(10.4, 13.5)
16.9
(15.2, 18.8)
19.6
(17.6, 21.7)
23.6
(21.3, 26.1)
25.6
(23.0, 28.5)
Non-Carrier 29.5
(27.2, 32.0)
41.7
(39.0, 44.5)
46.2
(43.3, 49.2)
52.2
(48.8, 55.6)
58.2
(53.5, 63.0)
Table 7: Likelihood a Vulnerability was Fixed by Carrier Type
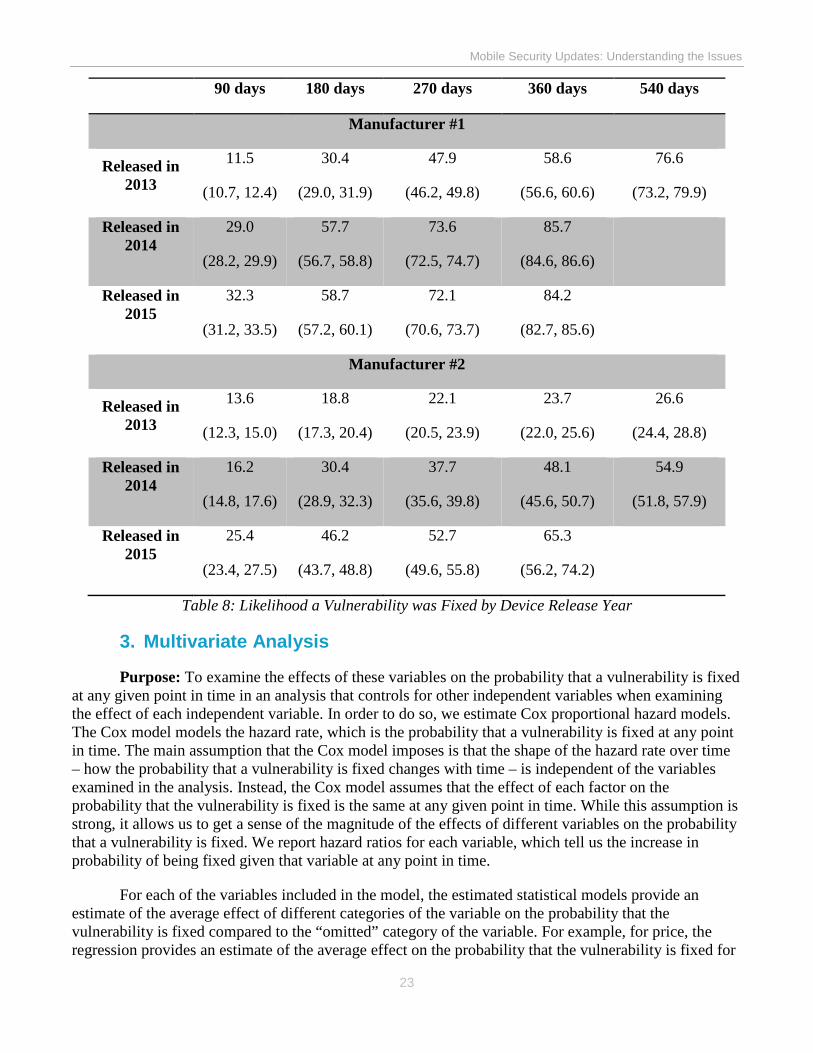
Mobile Security Updates: Understanding the Issues
23
90 days 180 days 270 days 360 days 540 days
Manufacturer #1
Released in 2013
11.5
(10.7, 12.4)
30.4
(29.0, 31.9)
47.9
(46.2, 49.8)
58.6
(56.6, 60.6)
76.6
(73.2, 79.9)
Released in 2014
29.0
(28.2, 29.9)
57.7
(56.7, 58.8)
73.6
(72.5, 74.7)
85.7
(84.6, 86.6)
Released in 2015
32.3
(31.2, 33.5)
58.7
(57.2, 60.1)
72.1
(70.6, 73.7)
84.2
(82.7, 85.6)
Manufacturer #2
Released in 2013
13.6
(12.3, 15.0)
18.8
(17.3, 20.4)
22.1
(20.5, 23.9)
23.7
(22.0, 25.6)
26.6
(24.4, 28.8)
Released in 2014
16.2
(14.8, 17.6)
30.4
(28.9, 32.3)
37.7
(35.6, 39.8)
48.1
(45.6, 50.7)
54.9
(51.8, 57.9)
Released in 2015
25.4
(23.4, 27.5)
46.2
(43.7, 48.8)
52.7
(49.6, 55.8)
65.3
(56.2, 74.2)
Table 8: Likelihood a Vulnerability was Fixed by Device Release Year
3. Multivariate Analysis
Purpose: To examine the effects of these variables on the probability that a vulnerability is fixed at any given point in time in an analysis that controls for other independent variables when examining the effect of each independent variable. In order to do so, we estimate Cox proportional hazard models. The Cox model models the hazard rate, which is the probability that a vulnerability is fixed at any point in time. The main assumption that the Cox model imposes is that the shape of the hazard rate over time – how the probability that a vulnerability is fixed changes with time – is independent of the variablesexamined in the analysis. Instead, the Cox model assumes that the effect of each factor on theprobability that the vulnerability is fixed is the same at any given point in time. While this assumption isstrong, it allows us to get a sense of the magnitude of the effects of different variables on the probabilitythat a vulnerability is fixed. We report hazard ratios for each variable, which tell us the increase inprobability of being fixed given that variable at any point in time.
For each of the variables included in the model, the estimated statistical models provide an estimate of the average effect of different categories of the variable on the probability that the vulnerability is fixed compared to the “omitted” category of the variable. For example, for price, the regression provides an estimate of the average effect on the probability that the vulnerability is fixed for
Mobile Security Updates: Understanding the Issues
24
the $251-500 and >$500 price categories relative to the average effect on the probability that the vulnerability is fixed for devices in the (omitted) $0-250 price category.
Specifications Run: For both Manufacturer #1 and Manufacturer #2, we estimated two separate proportional hazard models. The “Baseline” model differs from the “Carrier Controls” model in only one respect: the former assigned carriers to either the “Major Carrier” or “Other Carrier” category, while the latter included variables to control for the specific mobile carriers in the dataset (AT&T, Sprint, Verizon, etc.). For Manufacturer #2, we include an additional specification excluding the 11 device-carrier pairs that could be mapped to two different entries in the manufacturer support data. The results from these five specifications are contained in Table 9.
The coefficients in Table 9 represent the effect on the hazard ratio associated with the variable listed in the first column of the Table.207 Thus, in the Baseline Regression, for Manufacturer #1, vulnerabilities discovered in 2015 (2016) are 32% (30%) less likely to be fixed at any given point in time.
Summary of Multivariate Analysis Results: While the estimated coefficients vary across the rows of the Regression Table, several regularities emerge:
a) Vulnerabilities discovered in earlier years are more likely to be fixed at any given point intime since discovery.
b) Vulnerabilities on higher price and higher selling devices are more likely to be fixed at anygiven point in time since discovery.
c) Vulnerabilities on non-carrier devices are more likely to be fixed at any given point in timesince discovery.
d) Vulnerabilities on more recently released devices are more likely to be fixed at any givenpoint in time since discovery.
Regression Tables: N = Number of Vulnerabilities.
Note: For all regressions we report the 95% Confidence Interval, based on standard errors clustered at the vulnerability level, below the point estimate. Specifications are as described in the text.
207 For example, a hazard ratio of one on Year Discovered 2015 indicates that the probability that a vulnerability is fixed at any point in time since discovery is the same between vulnerabilities discovered in 2015 and those discovered in 2014, the omitted category. A hazard ratio of 1.2 indicates that the probability that a vulnerability is fixed at any point in time since discovery is 20% higher for vulnerabilities discovered in 2015 compared to those discovered in 2014, while a hazard ratio of 0.8 indicates that the probability is 20% lower.
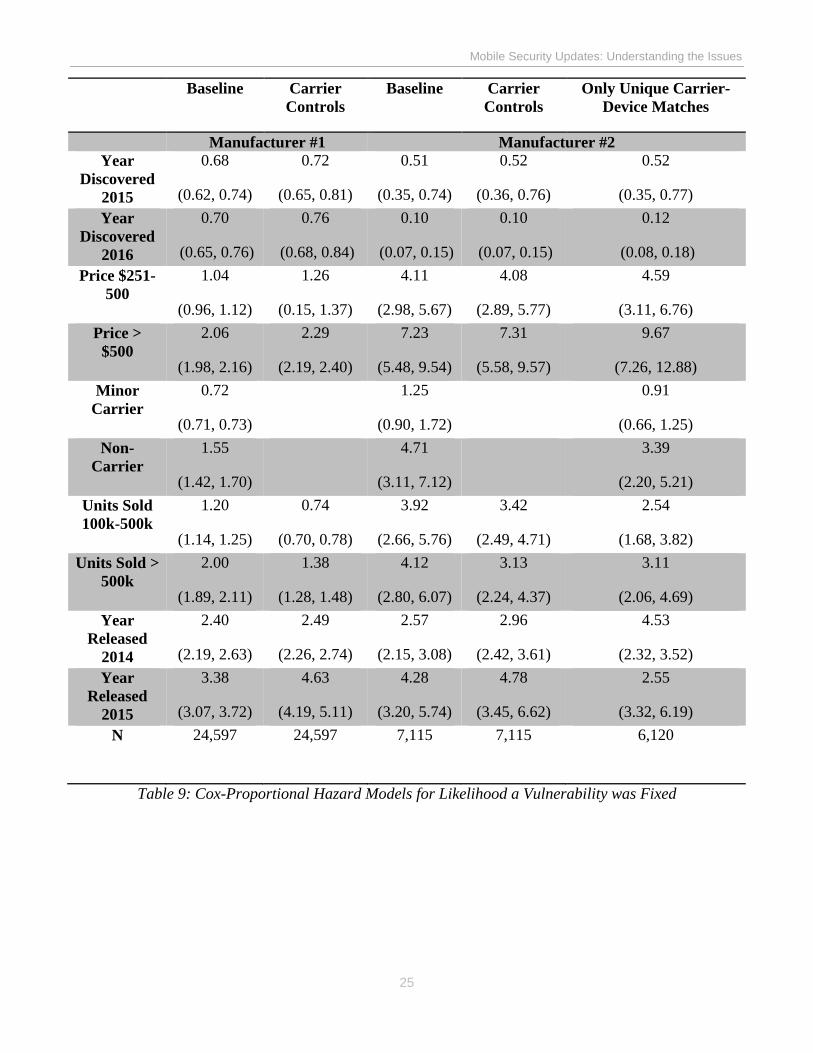
Mobile Security Updates: Understanding the Issues
25
Baseline Carrier Controls
Baseline Carrier Controls
Only Unique Carrier-Device Matches
Manufacturer #1 Manufacturer #2 Year
Discovered 2015
0.68
(0.62, 0.74)
0.72
(0.65, 0.81)
0.51
(0.35, 0.74)
0.52
(0.36, 0.76)
0.52
(0.35, 0.77) Year
Discovered 2016
0.70
(0.65, 0.76)
0.76
(0.68, 0.84)
0.10
(0.07, 0.15)
0.10
(0.07, 0.15)
0.12
(0.08, 0.18) Price $251-
500 1.04
(0.96, 1.12)
1.26
(0.15, 1.37)
4.11
(2.98, 5.67)
4.08
(2.89, 5.77)
4.59
(3.11, 6.76) Price >
$500 2.06
(1.98, 2.16)
2.29
(2.19, 2.40)
7.23
(5.48, 9.54)
7.31
(5.58, 9.57)
9.67
(7.26, 12.88) Minor
Carrier 0.72
(0.71, 0.73)
1.25
(0.90, 1.72)
0.91
(0.66, 1.25) Non-
Carrier 1.55
(1.42, 1.70)
4.71
(3.11, 7.12)
3.39
(2.20, 5.21) Units Sold 100k-500k
1.20
(1.14, 1.25)
0.74
(0.70, 0.78)
3.92
(2.66, 5.76)
3.42
(2.49, 4.71)
2.54
(1.68, 3.82) Units Sold >
500k 2.00
(1.89, 2.11)
1.38
(1.28, 1.48)
4.12
(2.80, 6.07)
3.13
(2.24, 4.37)
3.11
(2.06, 4.69) Year
Released 2014
2.40
(2.19, 2.63)
2.49
(2.26, 2.74)
2.57
(2.15, 3.08)
2.96
(2.42, 3.61)
4.53
(2.32, 3.52) Year
Released 2015
3.38
(3.07, 3.72)
4.63
(4.19, 5.11)
4.28
(3.20, 5.74)
4.78
(3.45, 6.62)
2.55
(3.32, 6.19) N 24,597 24,597 7,115 7,115 6,120
Table 9: Cox-Proportional Hazard Models for Likelihood a Vulnerability was Fixed
Mobile Security Updates: Understanding the Issues
26
B. OS DevelopersQuestions Addressed: To what extent does the time to patch a vulnerability vary for OS
developers, and what factors are correlated with these differences?
1. Data and Variables Considered
Dataset: We have data from two OS developers.
Dependent Variable: Patch Development and Testing Period, defined as the time from when the OS developer discovered the vulnerability to the time when the relevant patch was deployed to users or manufacturers.
Data Restrictions: We only have data on vulnerabilities that were fixed and for which the patch was released within our sample period. Thus, we do not have information on vulnerabilities fixed before our sample period, or vulnerabilities discovered within our sample period but not fixed. For both OS Developers, we have information on patches released for a sample period of a set of months between 2013 and 2016.
In addition, for OS Developer #2, we exclude 5.6% of observations for which the time to fix a vulnerability is missing or negative. In the final dataset, for OS Developer #1, we have 487 fixed vulnerabilities, and for OS Developer #2, we have 624 fixed vulnerabilities.
Independent Variables: Vulnerability Patch Release Year, CVE Severity Score, Whether the Patch was Bundled with an OS Release
a) Vulnerability Patch Release Year: We have the year during which the patch for each fixedvulnerability was released. For both OS Developers combined, 6% of the vulnerabilities werepatched in 2013, 13% of the vulnerabilities were patched in 2014, 36% of the vulnerabilitieswere patched in 2015, and 45% of the vulnerabilities were patched in 2016.
b) CVE Severity Score: Most of the vulnerabilities we observe have a CVE ID, which is inturn linked to an assessment of the severity of the vulnerability, or CVE Score.208 The CVEScore is missing for 2.9% of vulnerabilities for OS Developer #1 and 13.3% ofvulnerabilities for OS Developer #2. We divide the CVE Score into three categories: Low,for CVE scores less than 4, Medium, for CVE scores between 4 and 6, and High, for CVEscores above 6. For OS Developer #1, 0% have Low scores, 65% have Medium scores, 32%have High scores, and 3% have missing scores. For OS Developer #2, 3% have Low scores,25% have Medium scores, 59% have High scores, and 13% have missing scores.
208 The Common Vulnerability and Exposures (CVE)) system is maintained by the National Cybersecurity FFRDDC, and provides references for information security vulnerabilities. The Common Vulnerability Scoring System is an industry standard to assess the severity of vulnerabilities. See https://nvd.nist.gov/vuln-metrics/cvss and https://cve.mitre.org/ for more details.
Mobile Security Updates: Understanding the Issues
27
c) Patch Bundled with OS Release: For OS Developer #1, we have information on whetherthe vulnerability fix was bundled with a new operating system. For OS Developer #1, 30% offixes are bundles with a new operating system.
2. Univariate Analysis
The report contains graphs of the distribution of the time to fix a vulnerability for both OS Developers, and by whether the vulnerability was bundled with OS Release for OS Developer #1. Below we include graphs showing the distribution of the time to fix the vulnerability by patch release year, and by CVE severity score, and provide confidence intervals for the means of the time to fix the vulnerability by category for each variable.209
Figure C-7 provides graphs of the testing time for vulnerabilities patched in our sample period by both OS Developers. For all vulnerabilities, the average testing time was 119 days (95% CI [105, 133]) for OS Developer #1, and 189 days (95% CI (171, 208) for OS Developer #2. For OS Developer #1, 10% of testing times are above 235 days, 5% above 356 days, and 1% above 619 days for all vulnerabilities. For OS Developer #2, 10% of testing times are above 640 days, 5% above 824 days, and 1% above 857 days for all vulnerabilities.
Figure 11 below contains graphs of the testing time for all vulnerabilities by both OS Developers by patch release year. Across both OS Developers, the average testing time for vulnerabilities in patches released in 2013 is 208 days (95% CI [176, 240]), in 2014 is 99 days (95% CI [84, 115]), in 2015 is 109 days (95% CI [97, 121]), and in 2016 is 209 days (95% CI [186, 232]).
Figure 12 below depicts the distribution of testing times for all vulnerabilities by severity score. For OS Developer #1, the average testing time for Medium vulnerabilities was 117 days (95% CI [99, 135]), and the average testing time for High vulnerabilities was 110 days (95% CI [90, 130]). For OS Developer #2, the average testing time for Medium vulnerabilities was 239 days (95% CI [195, 283]), and the average testing time for High vulnerabilities was 176 days (95% CI [153, 199]).
209 These graphs display the distribution for vulnerabilities patched during the Order Response Period that each operating system developer patched in less than 1000 days. Two of Operating System #1’s vulnerabilities were patched in longer than 1000 days, which is beyond the scale of the graphs, with one vulnerability taking 1318 days and another taking 2061 days, both of which were patches released with a new OS release. All of Operating System #2’s vulnerabilities were patched in less than 1000 days. We excluded these outliers to permit better visual comparison of how these operating system developers patched the vast majority of the vulnerabilities affecting their systems.
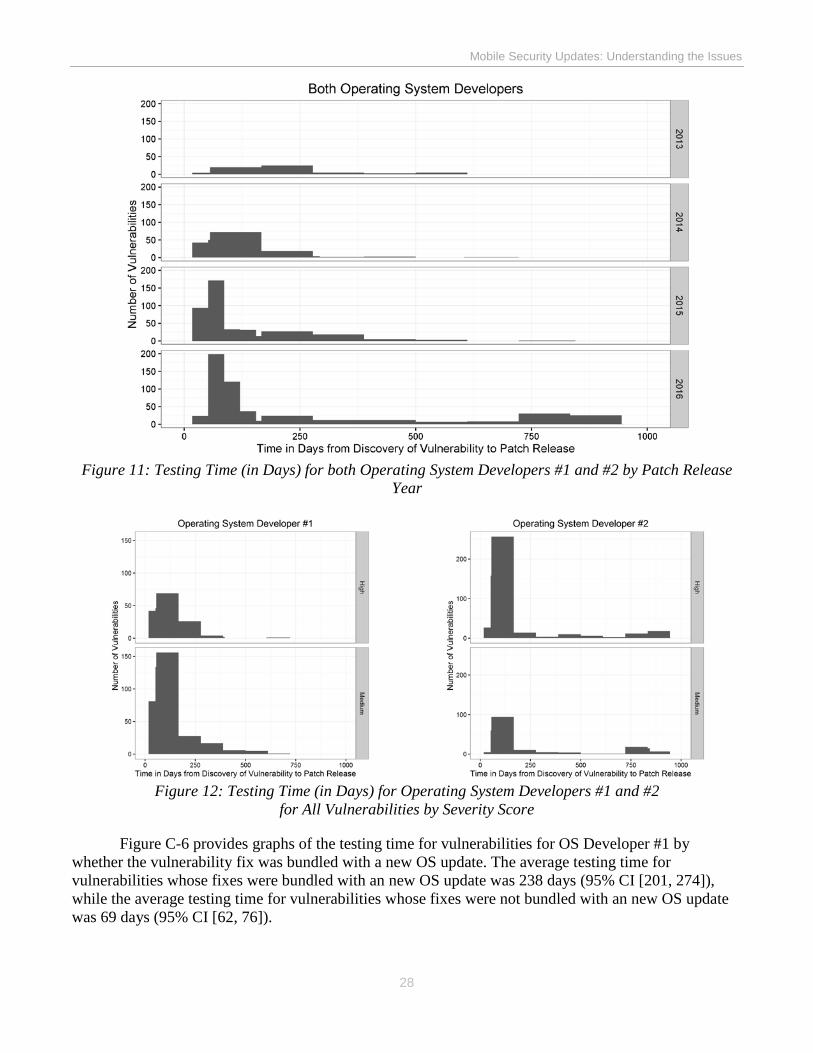
Mobile Security Updates: Understanding the Issues
28
Figure 11: Testing Time (in Days) for both Operating System Developers #1 and #2 by Patch Release Year
Figure 12: Testing Time (in Days) for Operating System Developers #1 and #2 for All Vulnerabilities by Severity Score
Figure C-6 provides graphs of the testing time for vulnerabilities for OS Developer #1 by whether the vulnerability fix was bundled with a new OS update. The average testing time for vulnerabilities whose fixes were bundled with an new OS update was 238 days (95% CI [201, 274]), while the average testing time for vulnerabilities whose fixes were not bundled with an new OS update was 69 days (95% CI [62, 76]).
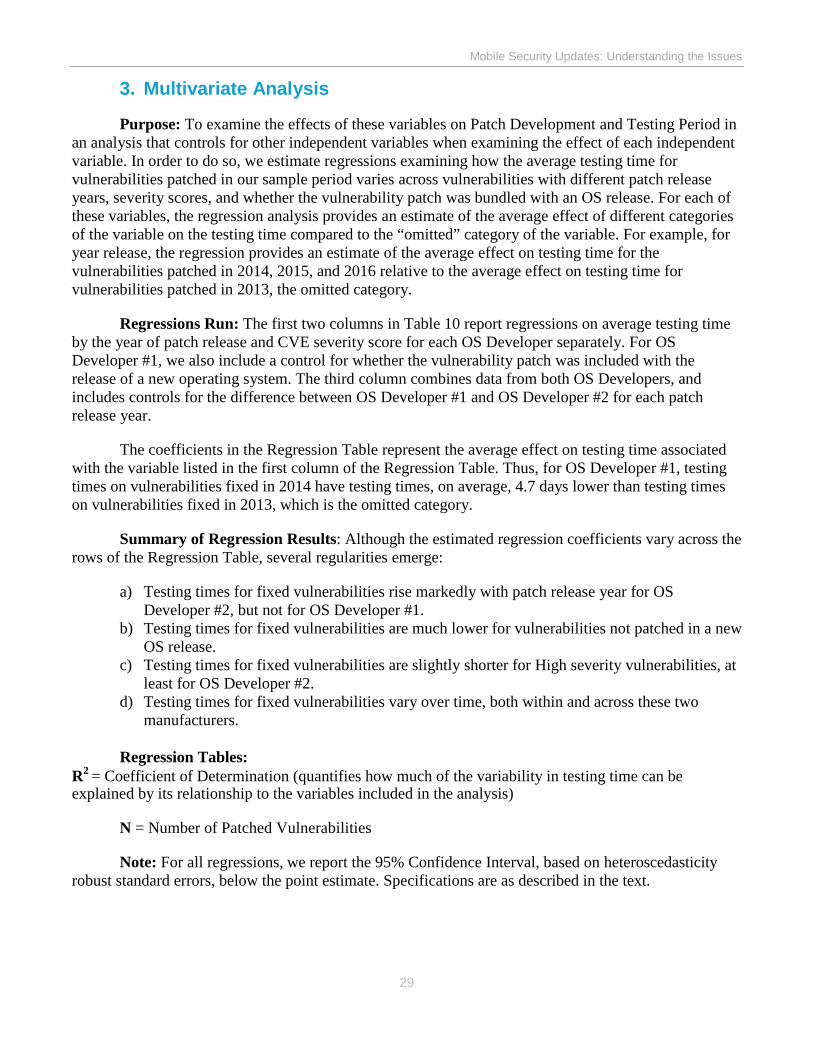
Mobile Security Updates: Understanding the Issues
29
3. Multivariate Analysis
Purpose: To examine the effects of these variables on Patch Development and Testing Period in an analysis that controls for other independent variables when examining the effect of each independent variable. In order to do so, we estimate regressions examining how the average testing time for vulnerabilities patched in our sample period varies across vulnerabilities with different patch release years, severity scores, and whether the vulnerability patch was bundled with an OS release. For each of these variables, the regression analysis provides an estimate of the average effect of different categories of the variable on the testing time compared to the “omitted” category of the variable. For example, for year release, the regression provides an estimate of the average effect on testing time for the vulnerabilities patched in 2014, 2015, and 2016 relative to the average effect on testing time for vulnerabilities patched in 2013, the omitted category.
Regressions Run: The first two columns in Table 10 report regressions on average testing time by the year of patch release and CVE severity score for each OS Developer separately. For OS Developer #1, we also include a control for whether the vulnerability patch was included with the release of a new operating system. The third column combines data from both OS Developers, and includes controls for the difference between OS Developer #1 and OS Developer #2 for each patch release year.
The coefficients in the Regression Table represent the average effect on testing time associated with the variable listed in the first column of the Regression Table. Thus, for OS Developer #1, testing times on vulnerabilities fixed in 2014 have testing times, on average, 4.7 days lower than testing times on vulnerabilities fixed in 2013, which is the omitted category.
Summary of Regression Results: Although the estimated regression coefficients vary across the rows of the Regression Table, several regularities emerge:
a) Testing times for fixed vulnerabilities rise markedly with patch release year for OSDeveloper #2, but not for OS Developer #1.
b) Testing times for fixed vulnerabilities are much lower for vulnerabilities not patched in a newOS release.
c) Testing times for fixed vulnerabilities are slightly shorter for High severity vulnerabilities, atleast for OS Developer #2.
d) Testing times for fixed vulnerabilities vary over time, both within and across these twomanufacturers.
Regression Tables: R2 = Coefficient of Determination (quantifies how much of the variability in testing time can be explained by its relationship to the variables included in the analysis)
N = Number of Patched Vulnerabilities
Note: For all regressions, we report the 95% Confidence Interval, based on heteroscedasticity robust standard errors, below the point estimate. Specifications are as described in the text.
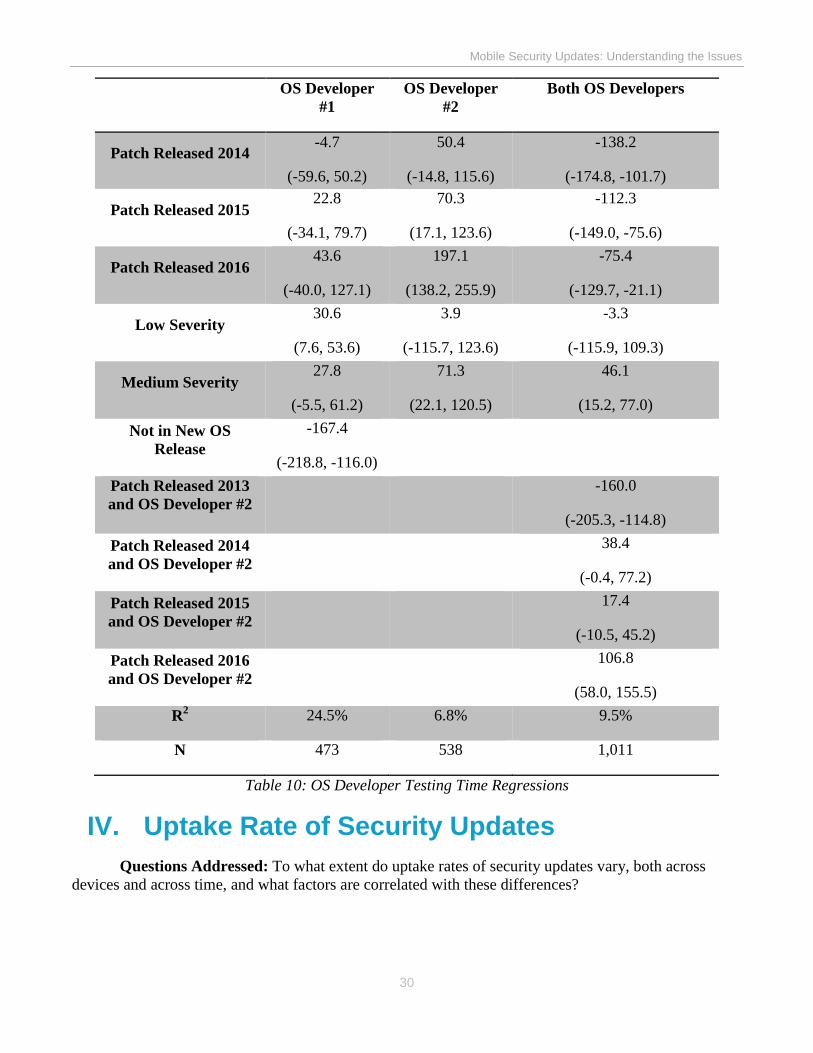
Mobile Security Updates: Understanding the Issues
30
OS Developer #1
OS Developer #2
Both OS Developers
Patch Released 2014 -4.7
(-59.6, 50.2)
50.4
(-14.8, 115.6)
-138.2
(-174.8, -101.7)
Patch Released 2015 22.8
(-34.1, 79.7)
70.3
(17.1, 123.6)
-112.3
(-149.0, -75.6)
Patch Released 2016 43.6
(-40.0, 127.1)
197.1
(138.2, 255.9)
-75.4
(-129.7, -21.1)
Low Severity 30.6
(7.6, 53.6)
3.9
(-115.7, 123.6)
-3.3
(-115.9, 109.3)
Medium Severity 27.8
(-5.5, 61.2)
71.3
(22.1, 120.5)
46.1
(15.2, 77.0) Not in New OS
Release -167.4
(-218.8, -116.0) Patch Released 2013 and OS Developer #2
-160.0
(-205.3, -114.8) Patch Released 2014 and OS Developer #2
38.4
(-0.4, 77.2) Patch Released 2015 and OS Developer #2
17.4
(-10.5, 45.2) Patch Released 2016 and OS Developer #2
106.8
(58.0, 155.5) R2 24.5% 6.8% 9.5%
N 473 538 1,011
Table 10: OS Developer Testing Time Regressions
IV. Uptake Rate of Security UpdatesQuestions Addressed: To what extent do uptake rates of security updates vary, both across
devices and across time, and what factors are correlated with these differences?
Mobile Security Updates: Understanding the Issues
31
1. Data and Variables Considered
Dataset: One Android mobile device manufacturer.
Data Restrictions: For this particular device manufacturer, we do not have any data on uptake rates on devices associated with two Major carriers (AT&T and Verizon) and only limited uptake data on devices associated with one Other carrier. Our unit of measure for this analysis is an update, so several vulnerabilities may be corrected in the same update. We exclude from this analysis updates released in 2013, as we have very few updates in this year. In addition, for one carrier and one device, the software of the device was refreshed to a new version mid-release; we exclude information on uptake rates for the refreshed device, as we do not know when the refresh occurred. This leaves a dataset with uptake data for 179 separate updates.
Dependent Variable: Uptake Rate of Security Updates, defined as the fraction of devices that have updated their device with a given security update by the time that we received the data from the manufacturer.210
Independent Variables: Price of Device, Sales Volume of Device, Carrier Associated with the Device, Update Release Year, and Age of Device at the Time the Security Update was Released.
a) Price: We separate prices into three categories: devices with an average price between $0 and $250, devices with an average price between $251 and $500, and devices with an average price above $500. In this dataset, 29% of updates are for devices are in the lowest price category, 4% are for devices in the middle price category, and 67% are for devices in the highest price category.
b) Sales Volume: Measured as units sold for a given device on a given carrier. We separate units
sold into three categories: devices with overall/lifetime sales of less than 100,000 units, devices with overall/lifetime sales between 100,000 and 500,000 units, and devices with overall/lifetime sales above 500,000 units. In this dataset, 7% of updates are for devices in the lowest sales category, 27% are for devices in the middle sales category, and 66% are for devices in the highest sales category.
c) Carrier Type: We separate carriers into three categories: Major carriers (T-Mobile, AT&T,
Sprint, and Verizon), Other carriers (all other carriers), and Non-Carrier devices (Unlocked and Wi-Fi only devices). In this dataset, 48% of updates are for devices associated with Major carriers, 44% are associated with Other carriers, and 8% are not associated with any carriers (so-called Non-Carrier devices).
d) Update Release Year: We only include updates released from 2014 through 2016; 22% of the
updates were released in 2014, 49% in 2015, and 29% in 2016.
210 The last update in our dataset was released in September 2016.
Mobile Security Updates: Understanding the Issues
32
e) Age of Device at Update Release: We separate age of device at update release into five categories; updates released less than ½ year after the device was released, updates released between ½ year to 1 year after the device was released, updates released between 1 year to 1½ years after the device was released, updates released between 1½ years to 2 years after the device was released, and updates released more than 2 years after the device was released. In this dataset, 20% of updates were released less than ½ year after the device was released, 26% between ½ year to 1 year after the device was released, 24% between 1 year to 1½ years after the device was released, 11% between 1½ years to 2 years after the device was released, and 18% more than 2 years after the device was released.
2. Univariate Analysis
The report contains graphs of the distribution of the uptake rate overall, and by device age. Below we include graphs showing the distribution of the uptake rate by price category, sales volume category, carrier type, and by update release year, and provide confidence intervals for the means of the uptake rate by category for each variable.
Figure D-2 in Part IV of the report depicts the distribution of the uptake rate by device age. On average, uptake rates decline as devices get older. Updates for devices less than ½ year old have an average uptake rate of 95.0% (95% CI [92.9%, 97.2%]), compared to an average uptake rate of 87.1% for devices between ½ to 1 year old (95% CI [84.1%, 90.1%]), an average uptake rate of 71.0% for devices between 1 to 1½ years old (95% CI [66.3%, 75.8%]), an average uptake rate of 51.1% for devices between 1½ to 2 years old (95% CI [46.4%, 55.9%]), and an average uptake rate of 37.1% for devices more than 2 years old (95% CI [33.1%, 41.1%]).
Figure 13 below depicts the distribution of the uptake rate by price band. The lowest price category has an average uptake rate of 75.3% (95% CI [68.6%, 82.1%]), compared to an average uptake rate of 70.1% for the middle price category (95% CI [54.7%, 85.6%]), and an average uptake rate of 70.1% for the highest price category (95% CI [65.8%, 74.3%]).
Figure 14 depicts the distribution of the uptake rate by sales volume category. The lowest sales volume category has an average uptake rate of 83.1% (95% CI [72.6%, 93.6%]), compared to 74.2% (95% CI [67.9%, 80.4%]) for the middle sales volume category and 69.4% (95% CI [64.9%, 73.9%]) for the highest sales volume category.
Figure 15 depicts the distribution of the uptake rate by the carrier type. In this case, major carrier devices have an average uptake rate of 68.9% (95% CI [64.2%, 73.7%]) , while other carrier devices have an average uptake rate of 72.0% (95% CI [66.3%, 77.7%]), and non-carrier devices have an average uptake rate of 84.7% (95% CI [74.5%, 94.8%]).
Figure 16 depicts the distribution of the uptake rate by the release year of the update. In this case, updates released in 2014 have an average uptake rate of 87.0% (95% CI [82.3%, 91.7%]) , while updates released in 2015 have an average uptake rate of 79.9% (95% CI [76.1%, 83.6%]), and updates released in 2016 have an average uptake rate of 45.9% (95% CI [41.0%, 50.8%]).
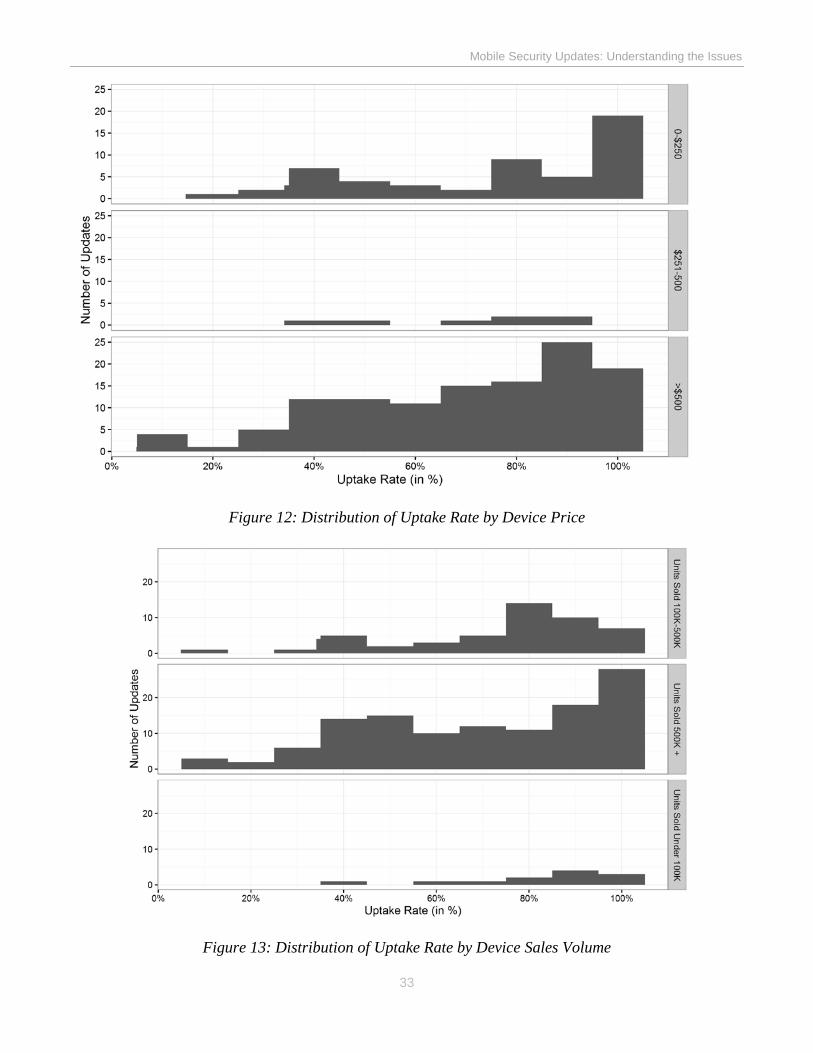
Mobile Security Updates: Understanding the Issues
33
Figure 12: Distribution of Uptake Rate by Device Price
Figure 13: Distribution of Uptake Rate by Device Sales Volume
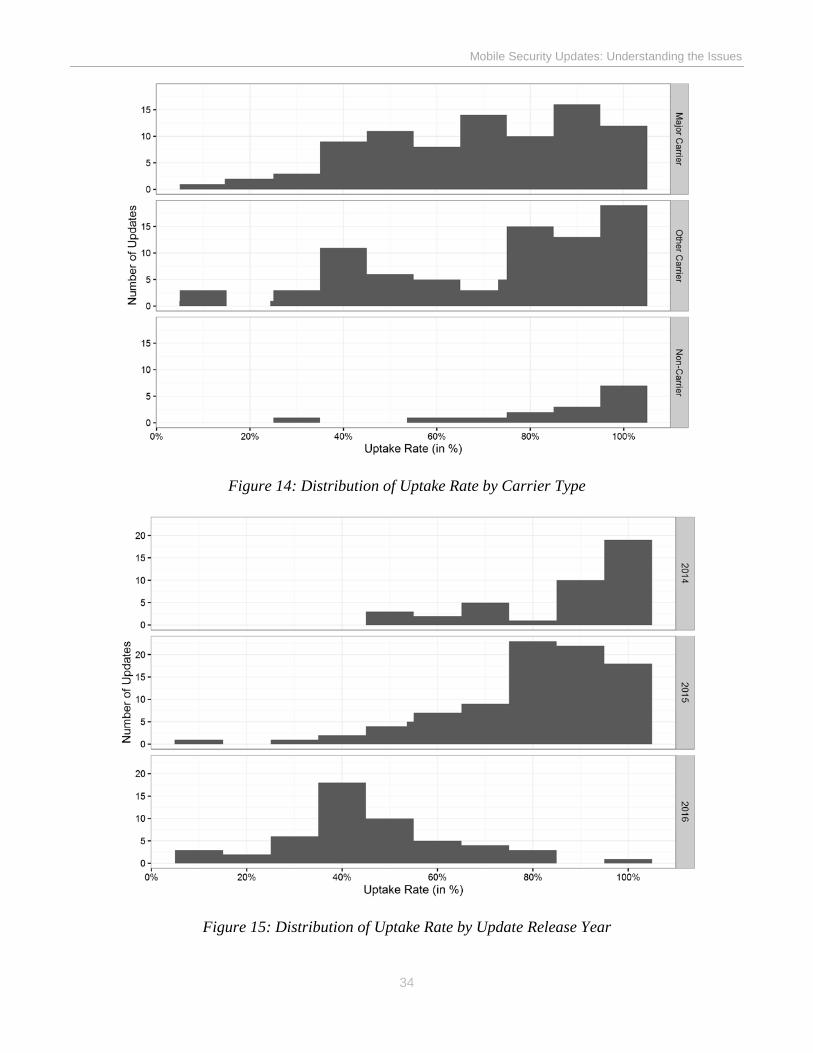
Mobile Security Updates: Understanding the Issues
34
Figure 14: Distribution of Uptake Rate by Carrier Type
Figure 15: Distribution of Uptake Rate by Update Release Year
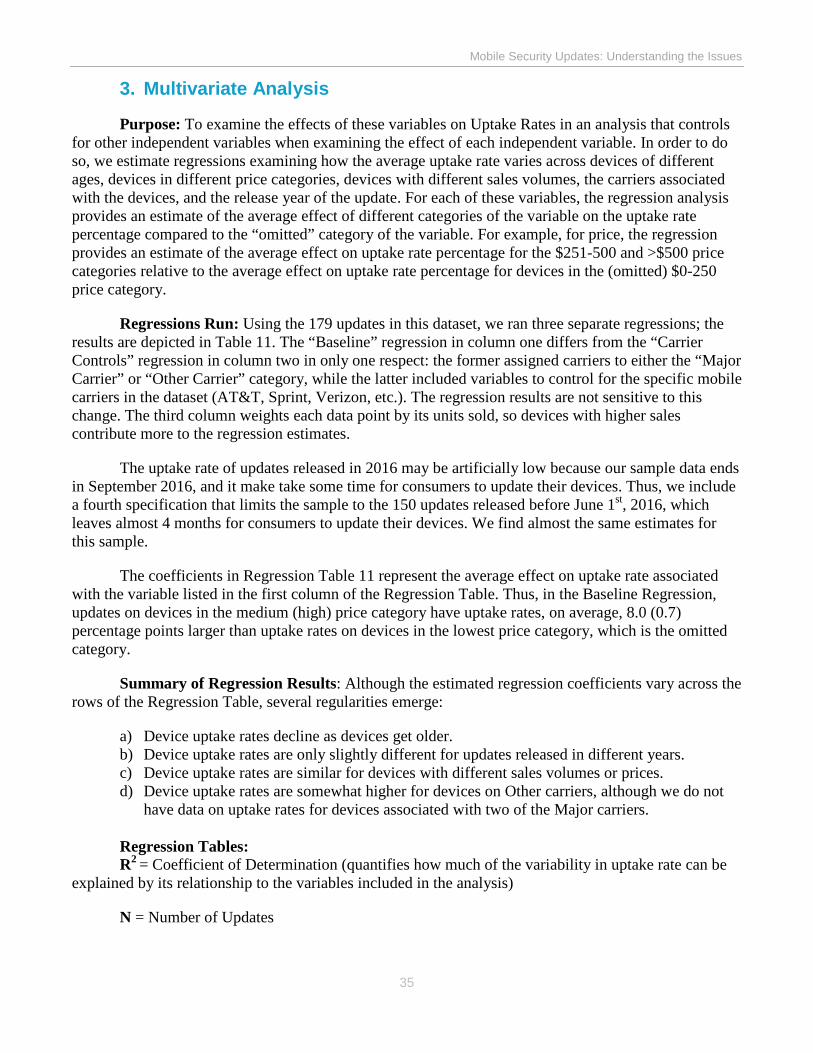
Mobile Security Updates: Understanding the Issues
35
3. Multivariate Analysis
Purpose: To examine the effects of these variables on Uptake Rates in an analysis that controls for other independent variables when examining the effect of each independent variable. In order to do so, we estimate regressions examining how the average uptake rate varies across devices of different ages, devices in different price categories, devices with different sales volumes, the carriers associated with the devices, and the release year of the update. For each of these variables, the regression analysis provides an estimate of the average effect of different categories of the variable on the uptake rate percentage compared to the “omitted” category of the variable. For example, for price, the regression provides an estimate of the average effect on uptake rate percentage for the $251-500 and >$500 price categories relative to the average effect on uptake rate percentage for devices in the (omitted) $0-250 price category.
Regressions Run: Using the 179 updates in this dataset, we ran three separate regressions; the results are depicted in Table 11. The “Baseline” regression in column one differs from the “Carrier Controls” regression in column two in only one respect: the former assigned carriers to either the “Major Carrier” or “Other Carrier” category, while the latter included variables to control for the specific mobile carriers in the dataset (AT&T, Sprint, Verizon, etc.). The regression results are not sensitive to this change. The third column weights each data point by its units sold, so devices with higher sales contribute more to the regression estimates.
The uptake rate of updates released in 2016 may be artificially low because our sample data ends in September 2016, and it make take some time for consumers to update their devices. Thus, we include a fourth specification that limits the sample to the 150 updates released before June 1st, 2016, which leaves almost 4 months for consumers to update their devices. We find almost the same estimates for this sample.
The coefficients in Regression Table 11 represent the average effect on uptake rate associated with the variable listed in the first column of the Regression Table. Thus, in the Baseline Regression, updates on devices in the medium (high) price category have uptake rates, on average, 8.0 (0.7) percentage points larger than uptake rates on devices in the lowest price category, which is the omitted category.
Summary of Regression Results: Although the estimated regression coefficients vary across the rows of the Regression Table, several regularities emerge:
a) Device uptake rates decline as devices get older. b) Device uptake rates are only slightly different for updates released in different years. c) Device uptake rates are similar for devices with different sales volumes or prices. d) Device uptake rates are somewhat higher for devices on Other carriers, although we do not
have data on uptake rates for devices associated with two of the Major carriers.
Regression Tables: R2 = Coefficient of Determination (quantifies how much of the variability in uptake rate can be explained by its relationship to the variables included in the analysis)
N = Number of Updates
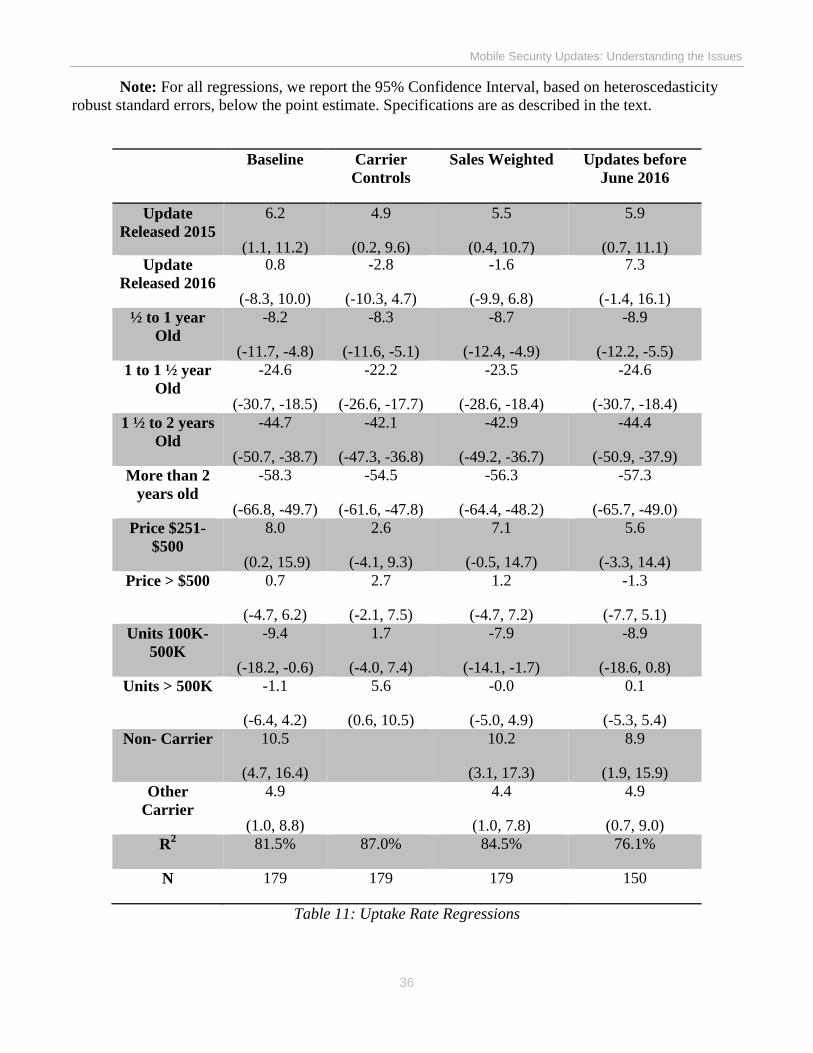
Mobile Security Updates: Understanding the Issues
36
Note: For all regressions, we report the 95% Confidence Interval, based on heteroscedasticity robust standard errors, below the point estimate. Specifications are as described in the text.
Baseline Carrier Controls
Sales Weighted Updates before June 2016
Update Released 2015
6.2
(1.1, 11.2)
4.9
(0.2, 9.6)
5.5
(0.4, 10.7)
5.9
(0.7, 11.1) Update
Released 2016 0.8
(-8.3, 10.0)
-2.8
(-10.3, 4.7)
-1.6
(-9.9, 6.8)
7.3
(-1.4, 16.1) ½ to 1 year
Old -8.2
(-11.7, -4.8)
-8.3
(-11.6, -5.1)
-8.7
(-12.4, -4.9)
-8.9
(-12.2, -5.5) 1 to 1 ½ year
Old -24.6
(-30.7, -18.5)
-22.2
(-26.6, -17.7)
-23.5
(-28.6, -18.4)
-24.6
(-30.7, -18.4) 1 ½ to 2 years
Old -44.7
(-50.7, -38.7)
-42.1
(-47.3, -36.8)
-42.9
(-49.2, -36.7)
-44.4
(-50.9, -37.9) More than 2
years old -58.3
(-66.8, -49.7)
-54.5
(-61.6, -47.8)
-56.3
(-64.4, -48.2)
-57.3
(-65.7, -49.0) Price $251-
$500 8.0
(0.2, 15.9)
2.6
(-4.1, 9.3)
7.1
(-0.5, 14.7)
5.6
(-3.3, 14.4) Price > $500 0.7
(-4.7, 6.2)
2.7
(-2.1, 7.5)
1.2
(-4.7, 7.2)
-1.3
(-7.7, 5.1) Units 100K-
500K -9.4
(-18.2, -0.6)
1.7
(-4.0, 7.4)
-7.9
(-14.1, -1.7)
-8.9
(-18.6, 0.8) Units > 500K -1.1
(-6.4, 4.2)
5.6
(0.6, 10.5)
-0.0
(-5.0, 4.9)
0.1
(-5.3, 5.4) Non- Carrier 10.5
(4.7, 16.4)
10.2
(3.1, 17.3)
8.9
(1.9, 15.9) Other
Carrier 4.9
(1.0, 8.8)
4.4
(1.0, 7.8)
4.9
(0.7, 9.0) R2 81.5% 87.0% 84.5% 76.1%
N 179 179 179 150
Table 11: Uptake Rate Regressions

01001101011011110110001001101001011011000110010101010011011001010110001101110101011100100110100101110100011110010101010101110000011001000110000101110100011001010111001101010101011011100110010001100101011100100111001101110100011000010110111001100100011010010110111001100111011101000110100001100101010010010111001101110011011101010110010101110011
01001101011011110110001001101001011011000110010101010011011001010110001101110101011100100110100101110100011110010101010101110000011001000110000101110100011001010111001101010101011011100110010001100101011100100111001101110100011000010110111001100100011010010110111001100111011101000110100001100101010010010111001101110011011101010110010101110011
01001101011011110110001001101001011011000110010101010011011001010110001101110101011100100110100101110100011110010101010101110000011001000110000101110100011001010111001101010101011011100110010001100101011100100111001101110100011000010110111001100100011010010110111001100111011101000110100001100101010010010111001101110011011101010110010101110011
01001101011011110110001001101001011011000110010101010011011001010110001101110101011100100110100101110100011110010101010101110000011001000110000101110100011001010111001101010101011011100110010001100101011100100111001101110100011000010110111001100100011010010110111001100111011101000110100001100101010010010111001101110011011101010110010101110011
01001101011011110110001001101001011011000110010101010011011001010110001101110101011100100110100101110100011110010101010101110000011001000110000101110100011001010111001101010101011011100110010001100101011100100111001101110100011000010110111001100100011010010110111001100111011101000110100001100101010010010111001101110011011101010110010101110011
01001101011011110110001001101001011011000110010101010011011001010110001101110101011100100110100101110100011110010101010101110000011001000110000101110100011001010111001101010101011011100110010001100101011100100111001101110100011000010110111001100100011010010110111001100111011101000110100001100101010010010111001101110011011101010110010101110011
01001101011011110110001001101001011011000110010101010011011001010110001101110101011100100110100101110100011110010101010101110000011001000110000101110100011001010111001101010101011011100110010001100101011100100111001101110100011000010110111001100100011010010110111001100111011101000110100001100101010010010111001101110011011101010110010101110011
01001101011011110110001001101001011011000110010101010011011001010110001101110101011100100110100101110100011110010101010101110000011001000110000101110100011001010111001101010101011011100110010001100101011100100111001101110100011000010110111001100100011010010110111001100111011101000110100001100101010010010111001101110011011101010110010101110011
01001101011011110110001001101001011011000110010101010011011001010110001101110101011100100110100101110100011110010101010101110000011001000110000101110100011001010111001101010101011011100110010001100101011100100111001101110100011000010110111001100100011010010110111001100111011101000110100001100101010010010111001101110011011101010110010101110011
01001101011011110110001001101001011011000110010101010011011001010110001101110101011100100110100101110100011110010101010101110000011001000110000101110100011001010111001101010101011011100110010001100101011100100111001101110100011000010110111001100100011010010110111001100111011101000110100001100101010010010111001101110011011101010110010101110011
01001101011011110110001001101001011011000110010101010011011001010110001101110101011100100110100101110100011110010101010101110000011001000110000101110100011001010111001101010101011011100110010001100101011100100111001101110100011000010110111001100100011010010110111001100111011101000110100001100101010010010111001101110011011101010110010101110011
01001101011011110110001001101001011011000110010101010011011001010110001101110101011100100110100101110100011110010101010101110000011001000110000101110100011001010111001101010101011011100110010001100101011100100111001101110100011000010110111001100100011010010110111001100111011101000110100001100101010010010111001101110011011101010110010101110011
01001101011011110110001001101001011011000110010101010011011001010110001101110101011100100110100101110100011110010101010101110000011001000110000101110100011001010111001101010101011011100110010001100101011100100111001101110100011000010110111001100100011010010110111001100111011101000110100001100101010010010111001101110011011101010110010101110011
01001101011011110110001001101001011011000110010101010011011001010110001101110101011100100110100101110100011110010101010101110000011001000110000101110100011001010111001101010101011011100110010001100101011100100111001101110100011000010110111001100100011010010110111001100111011101000110100001100101010010010111001101110011011101010110010101110011
01001101011011110110001001101001011011000110010101010011011001010110001101110101011100100110100101110100011110010101010101110000011001000110000101110100011001010111001101010101011011100110010001100101011100100111001101110100011000010110111001100100011010010110111001100111011101000110100001100101010010010111001101110011011101010110010101110011
01001101011011110110001001101001011011000110010101010011011001010110001101110101011100100110100101110100011110010101010101110000011001000110000101110100011001010111001101010101011011100110010001100101011100100111001101110100011000010110111001100100011010010110111001100111011101000110100001100101010010010111001101110011011101010110010101110011
01001101011011110110001001101001011011000110010101010011011001010110001101110101011100100110100101110100011110010101010101110000011001000110000101110100011001010111001101010101011011100110010001100101011100100111001101110100011000010110111001100100011010010110111001100111011101000110100001100101010010010111001101110011011101010110010101110011
01001101011011110110001001101001011011000110010101010011011001010110001101110101011100100110100101110100011110010101010101110000011001000110000101110100011001010111001101010101011011100110010001100101011100100111001101110100011000010110111001100100011010010110111001100111011101000110100001100101010010010111001101110011011101010110010101110011
01001101011011110110001001101001011011000110010101010011011001010110001101110101011100100110100101110100011110010101010101110000011001000110000101110100011001010111001101010101011011100110010001100101011100100111001101110100011000010110111001100100011010010110111001100111011101000110100001100101010010010111001101110011011101010110010101110011
01001101011011110110001001101001011011000110010101010011011001010110001101110101011100100110100101110100011110010101010101110000011001000110000101110100011001010111001101010101011011100110010001100101011100100111001101110100011000010110111001100100011010010110111001100111011101000110100001100101010010010111001101110011011101010110010101110011
01001101011011110110001001101001011011000110010101010011011001010110001101110101011100100110100101110100011110010101010101110000011001000110000101110100011001010111001101010101011011100110010001100101011100100111001101110100011000010110111001100100011010010110111001100111011101000110100001100101010010010111001101110011011101010110010101110011
01001101011011110110001001101001011011000110010101010011011001010110001101110101011100100110100101110100011110010101010101110000011001000110000101110100011001010111001101010101011011100110010001100101011100100111001101110100011000010110111001100100011010010110111001100111011101000110100001100101010010010111001101110011011101010110010101110011
01001101011011110110001001101001011011000110010101010011011001010110001101110101011100100110100101110100011110010101010101110000011001000110000101110100011001010111001101010101011011100110010001100101011100100111001101110100011000010110111001100100011010010110111001100111011101000110100001100101010010010111001101110011011101010110010101110011
01001101011011110110001001101001011011000110010101010011011001010110001101110101011100100110100101110100011110010101010101110000011001000110000101110100011001010111001101010101011011100110010001100101011100100111001101110100011000010110111001100100011010010110111001100111011101000110100001100101010010010111001101110011011101010110010101110011
01001101011011110110001001101001011011000110010101010011011001010110001101110101011100100110100101110100011110010101010101110000011001000110000101110100011001010111001101010101011011100110010001100101011100100111001101110100011000010110111001100100011010010110111001100111011101000110100001100101010010010111001101110011011101010110010101110011
01001101011011110110001001101001011011000110010101010011011001010110001101110101011100100110100101110100011110010101010101110000011001000110000101110100011001010111001101010101011011100110010001100101011100100111001101110100011000010110111001100100011010010110111001100111011101000110100001100101010010010111001101110011011101010110010101110011
01001101011011110110001001101001011011000110010101010011011001010110001101110101011100100110100101110100011110010101010101110000011001000110000101110100011001010111001101010101011011100110010001100101011100100111001101110100011000010110111001100100011010010110111001100111011101000110100001100101010010010111001101110011011101010110010101110011
01001101011011110110001001101001011011000110010101010011011001010110001101110101011100100110100101110100011110010101010101110000011001000110000101110100011001010111001101010101011011100110010001100101011100100111001101110100011000010110111001100100011010010110111001100111011101000110100001100101010010010111001101110011011101010110010101110011
01001101011011110110001001101001011011000110010101010011011001010110001101110101011100100110100101110100011110010101010101110000011001000110000101110100011001010111001101010101011011100110010001100101011100100111001101110100011000010110111001100100011010010110111001100111011101000110100001100101010010010111001101110011011101010110010101110011
Federal Trade CommissionCOMMISSION REPORT FEBRUARY 2018