MOBILE OPTICAL REMOTE SENSING FOR AIR QUALITY AND …
23
MOBILE OPTICAL REMOTE SENSING FOR AIR QUALITY AND EMISSION MONITORING OLGA PIKELNAYA SOUTH COAST AIR QUALITY MANAGEMENT DISTRICT, DIAMOND BAR, CALIFORNIA,
Transcript of MOBILE OPTICAL REMOTE SENSING FOR AIR QUALITY AND …
MOBILE OPTICAL REMOTE SENSING FOR AIR QUALITY AND EMISSION MONITORING
OLGA PIKELNAYA
SOUTH COAST AIR QUALITY MANAGEMENT DISTRICT, DIAMOND BAR, CALIFORNIA,
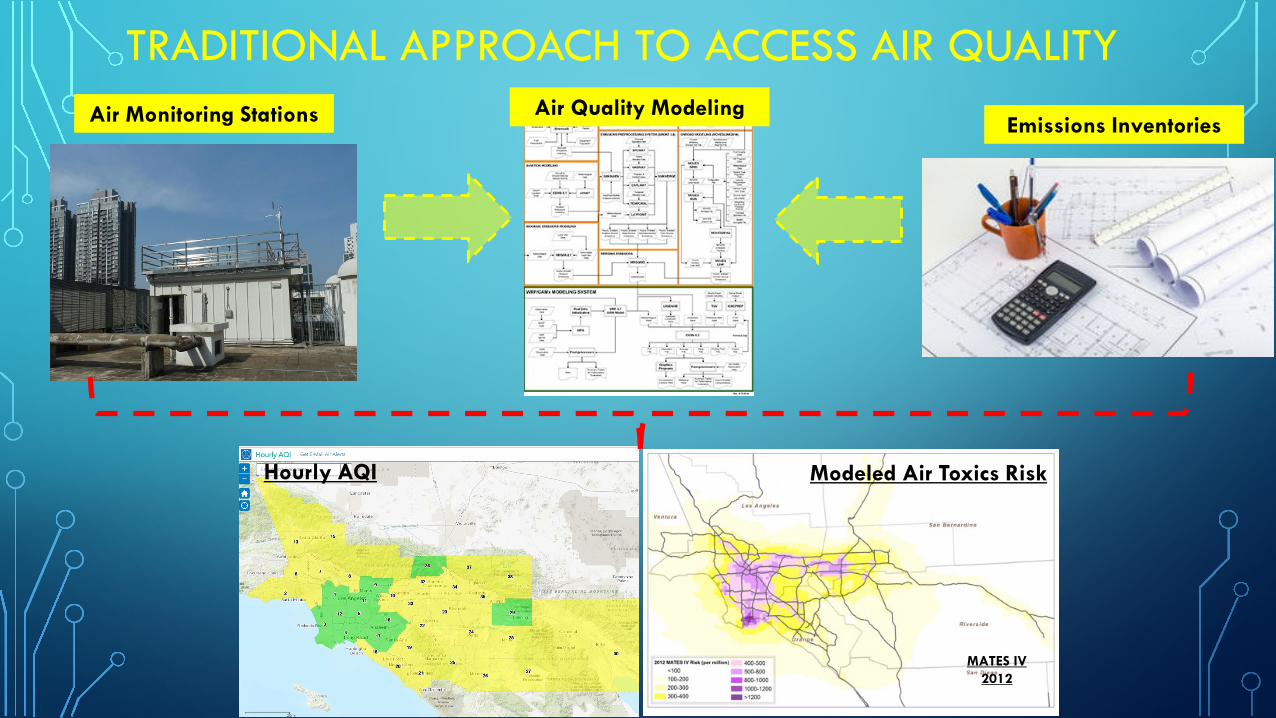
TRADITIONAL APPROACH TO ACCESS AIR QUALITYAir Monitoring Stations Air Quality Modeling
Emissions Inventories
Modeled Air Toxics Risk
MATES IV2012
Hourly AQI

TRADITIONAL APPROACH TO QUANTIFY EMISSIONSAP-42 Emission Factors
Emission Estimation Protocol
https://www3.epa.gov/ttn/chief/efpac/protocol/Protocol%20Repor
t%202015.pdf
Refinery Equipment
Emission Inventory

INVENTORIES MAY UNDERESTIMATE FUGITIVE VOCEMISSIONS
Adapted from Cuclis, 2012
ORS Refinery Measurement Surveys 1988 - 2008
http://www.aqmd.gov/fenceline-monitoring
South Coast AQMD 2015 ORS Refinery Measurement Survey
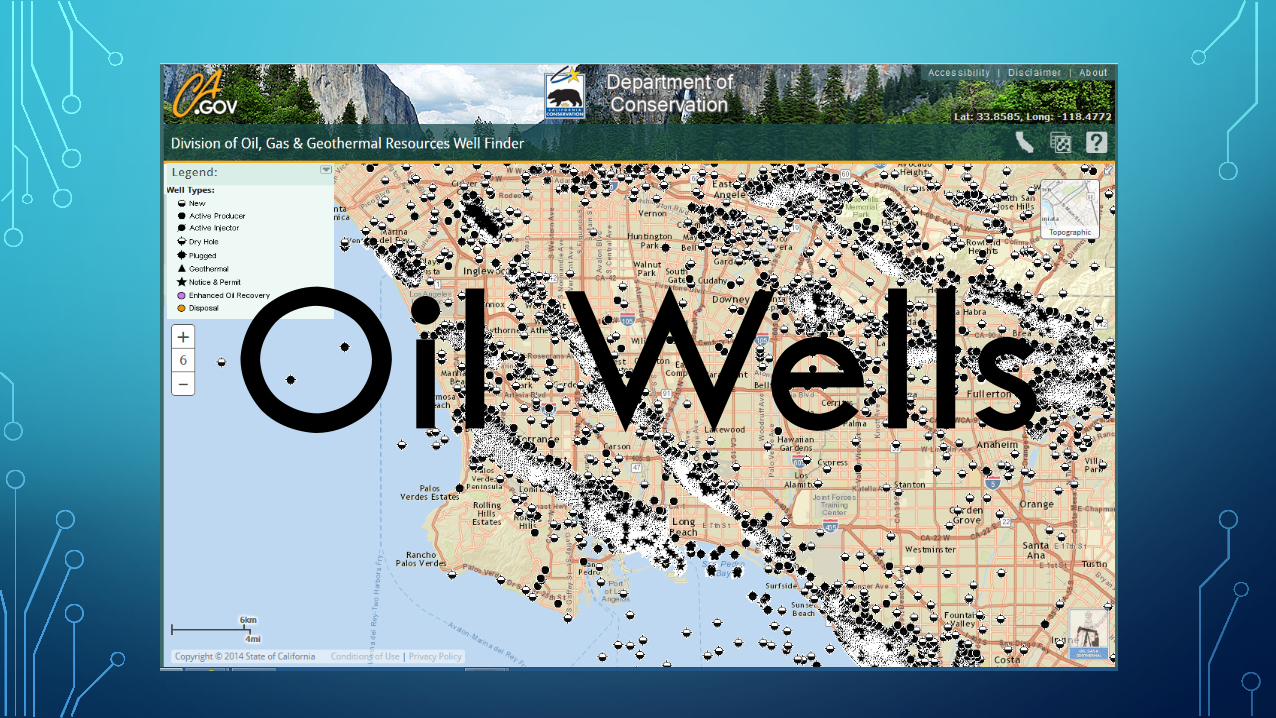
Oil Wells

5000 +

Emissions?
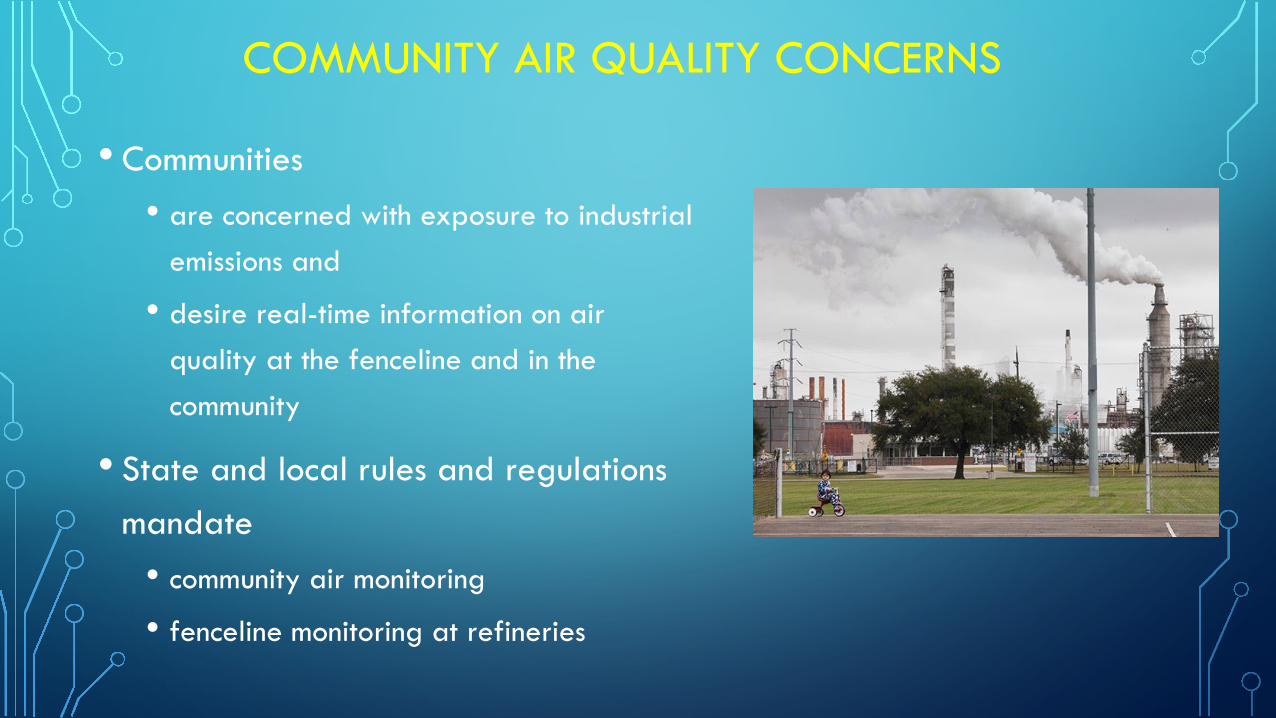
• Communities • are concerned with exposure to industrial
emissions and
• desire real-time information on air quality at the fenceline and in the community
• State and local rules and regulations mandate
• community air monitoring
• fenceline monitoring at refineries
COMMUNITY AIR QUALITY CONCERNS

OPTICAL REMOTE SENSING METHODS• Optical Remote Sensing (ORS) Technologies
• Matured over the past decade• Fully automated / continuous / no calibration required
• Ideally suited for long-term fenceline monitoring, allow to characterize and quantify emissions
• Can be deployed from various mobile platforms for rapid leak detection, emission flux measurements, and community monitoring

PRINCIPLE OF OPTICAL REMOTE SENSING
Light Source I0(λ) Detector I(λ)
Initial light spectrum Light spectrum after passing through gas cloud
• Beer-Lambert Law
• Trace gases in the atmosphere absorb light
• Each molecule has its own unique fingerprint
• Multiple gases can be observed simultaneously
• Works with natural (e.g. direct or scattered sunlight) or artificial light

MOBILE ORS MEASUREMENT STRATEGY
https://vimeo.com/132697716

REMOTE SENSING TECHNIQUESActive: Artificial Light Source Passive: Direct or Scattered Sunlight
Raleigh and Miescattering
Spectrometer
Light Source
Reflector
Gas cloudGas cloud
• UV-vis: O3, SO2, NO2, HCHO, BTEX, aerosol
• IR: O3, CO2, CO, CH4, VOCs
• Measurements during day and night
• Permanente installation
• HCHO, NO2, SO2, HONO, aerosol, total alkanes
• Plume vertical and horizontal extend
• Measurements during the day
• Permanent installation or on mobile or aerial platforms

FLUXSENSE MOBILE LABORATORY

INSTRUMENTS ABOARD MOBILE LABORATORY
Direct em
ission flux m
easurements
Direct em
ission flux m
easurements
Concentration m
apping and flux m
easurements
Concentration m
apping and flux m
easurements

MEASUREMENT STRATEGY • Spectroscopic analysis of direct solar
IR light and zenith scattered UV light to determine the number of molecules for the key species above the mobile laboratory (column)
• The measurements are conducted while driving therefore measuring the total mass of molecules along the traveled path
• The total mass is multiplied by the wind which yields the flux (kg/hr)

MEASUREMENT STRATEGY
• Circumvent facility multiple times
• The upwind (“background”) measurements are subtracted from the downwind measurements in to remove contribution from other sources
• Emission flux is determined by combining column measurements with wind speed and direction
Size and color of bubbles is proportional to alkanes
column

MOBILE UV AND FTIR CELLS
Enclosed Cell – Mobile Extractive FTIROpen Cell – Mobile White Cell DOAS
• Multi-reflection cells with effective pathlength of ~100 – 200 m• UV: Real time concentration measurements of BTEX and SO2 with 1-30 s time
response and 0.2 -3 ppb detection limits• IR: Real time concentration measurements of alkanes, alkenes, methane, CO,
CO2 and NH3 with 1-15 s response time and 1-10 ppb detection limit


VERTICAL WIND PROFILES – WIND LIDAR

CONTROLLED-RELEASE EXPERIMENTS
• Designed to test the capability of ORS method (e.g. SOF) to detect and quantify certain pollutants
• “Blind” release operated by independent observer
• Coordinated measurements with other techniques
Typical uncertainty of SOF is within 30%

DETECTION OF AIR TOXICS PLUMES
• FILL ME
BTEX x10
alkanes
BTEX x10
alkanes

CONCENTRATION MAPPING

ACKNOWLEDGEMENTS
South Coast AQMD Fenceline Air Monitoring:http://www.aqmd.gov/fenceline-monitoring
Olga [email protected]
(909) 396-3157
RESOURCES AND CONTACT INFO.
South Coast AQMDDr. Jason Low
Dr. Andrea PolidoriORS Group: Dr. Olga Pikelnaya, Dr.
Catalina Tsai, Dr. Ross Cheung, Dr. Jack Porter, Mr. Robert Wimmer
FluxSenseMarianne Ericsson Jerker Samuelsson,
Johan Mellqvist, and the entire FluxSense team