Mobile Offshore Production Systems for Offshore Oil and ......1 Mobile Offshore Production Systems...
46
1 Mobile Offshore Production Systems for Offshore Oil and Gas Fields Presented by: Bruce Crager Rice Annual Forum XIII September 14, 2010 Houston, TX
Transcript of Mobile Offshore Production Systems for Offshore Oil and ......1 Mobile Offshore Production Systems...

1
Mobile Offshore Production
Systems for Offshore Oil and
Gas Fields
Presented by: Bruce Crager
Rice Annual Forum XIII
September 14, 2010
Houston, TX
2
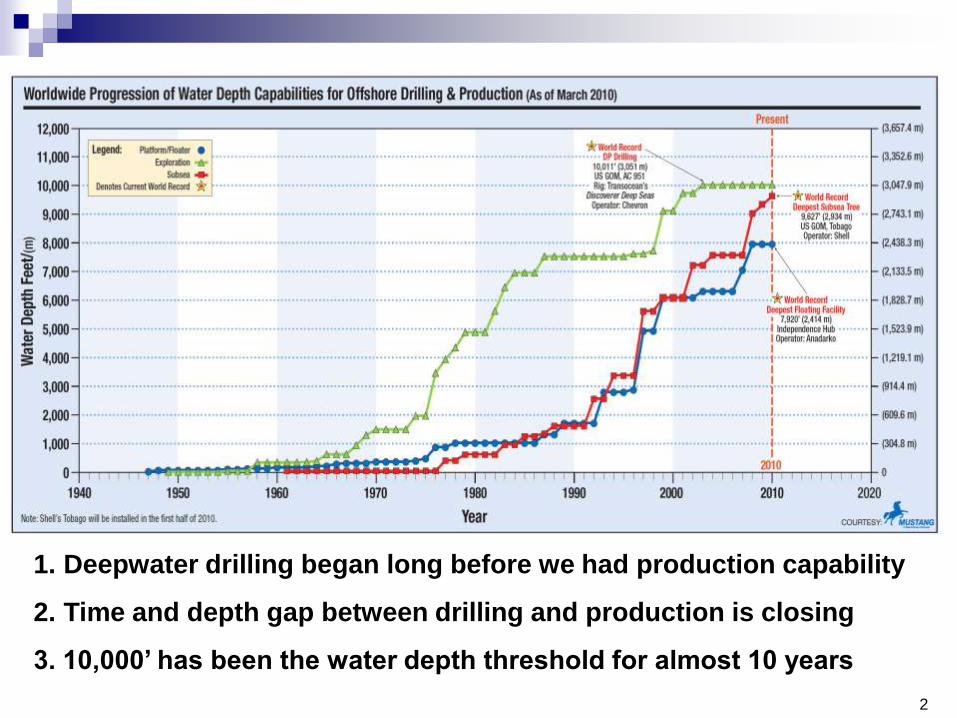
1. Deepwater drilling began long before we had production capability
2. Time and depth gap between drilling and production is closing
3. 10,000’ has been the water depth threshold for almost 10 years
3
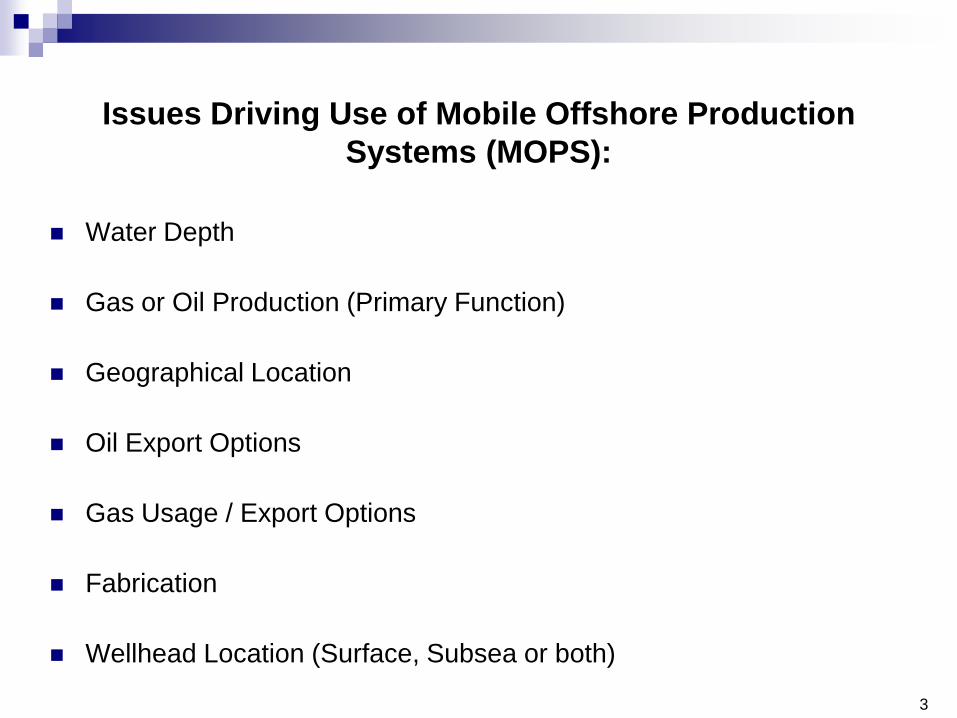
Issues Driving Use of Mobile Offshore Production
Systems (MOPS):
Water Depth
Gas or Oil Production (Primary Function)
Geographical Location
Oil Export Options
Gas Usage / Export Options
Fabrication
Wellhead Location (Surface, Subsea or both)
4
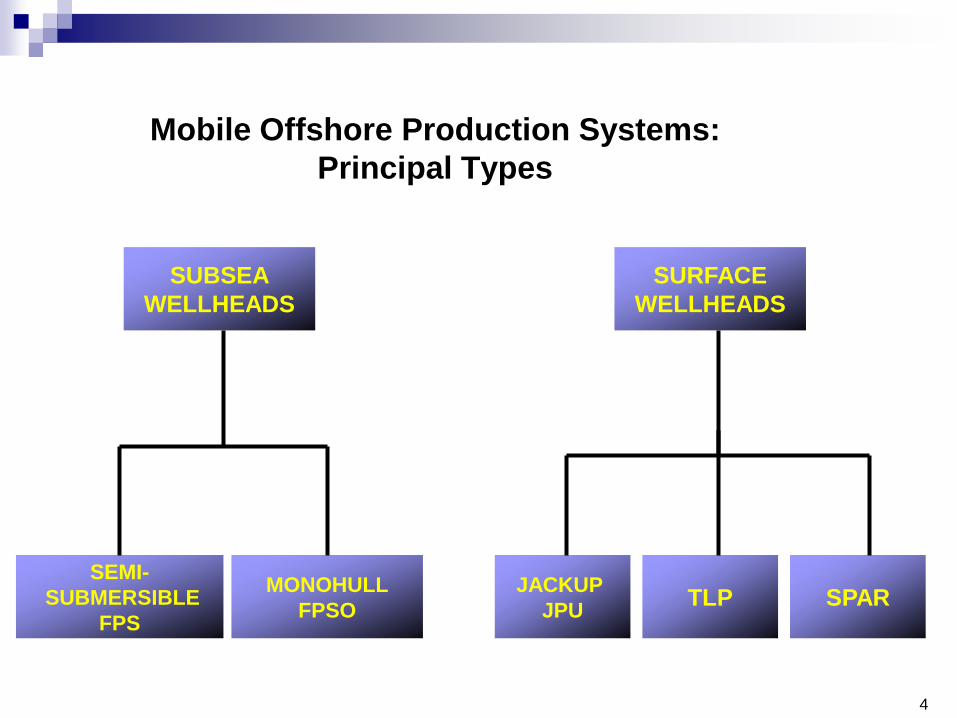
Mobile Offshore Production Systems:
Principal Types
SURFACE
WELLHEADS
JACKUP
JPUTLP SPAR
SEMI-
SUBMERSIBLE
FPS
MONOHULL
FPSO
SUBSEA
WELLHEADS
5
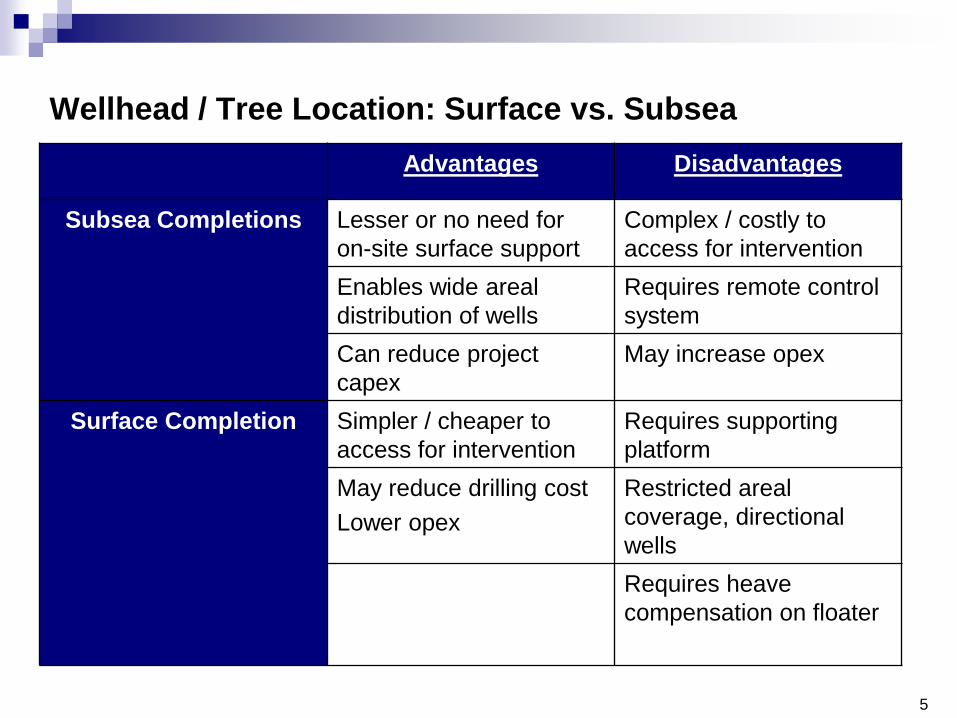
Wellhead / Tree Location: Surface vs. Subsea
Advantages Disadvantages
Subsea Completions Lesser or no need for
on-site surface support
Complex / costly to
access for intervention
Enables wide areal
distribution of wells
Requires remote control
system
Can reduce project
capex
May increase opex
Surface Completion Simpler / cheaper to
access for intervention
Requires supporting
platform
May reduce drilling cost
Lower opex
Restricted areal
coverage, directional
wells
Requires heave
compensation on floater
6
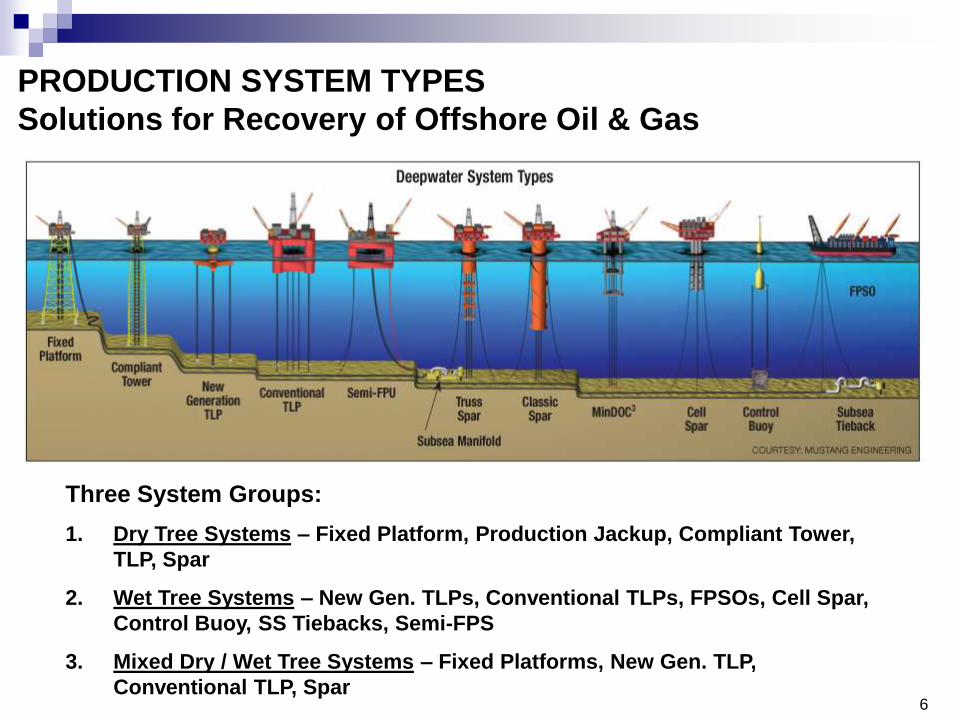
Three System Groups:
1. Dry Tree Systems – Fixed Platform, Production Jackup, Compliant Tower,
TLP, Spar
2. Wet Tree Systems – New Gen. TLPs, Conventional TLPs, FPSOs, Cell Spar,
Control Buoy, SS Tiebacks, Semi-FPS
3. Mixed Dry / Wet Tree Systems – Fixed Platforms, New Gen. TLP,
Conventional TLP, Spar
COURTESY OF: MUSTANG
ENGINEERING
PRODUCTION SYSTEM TYPES
Solutions for Recovery of Offshore Oil & Gas
7
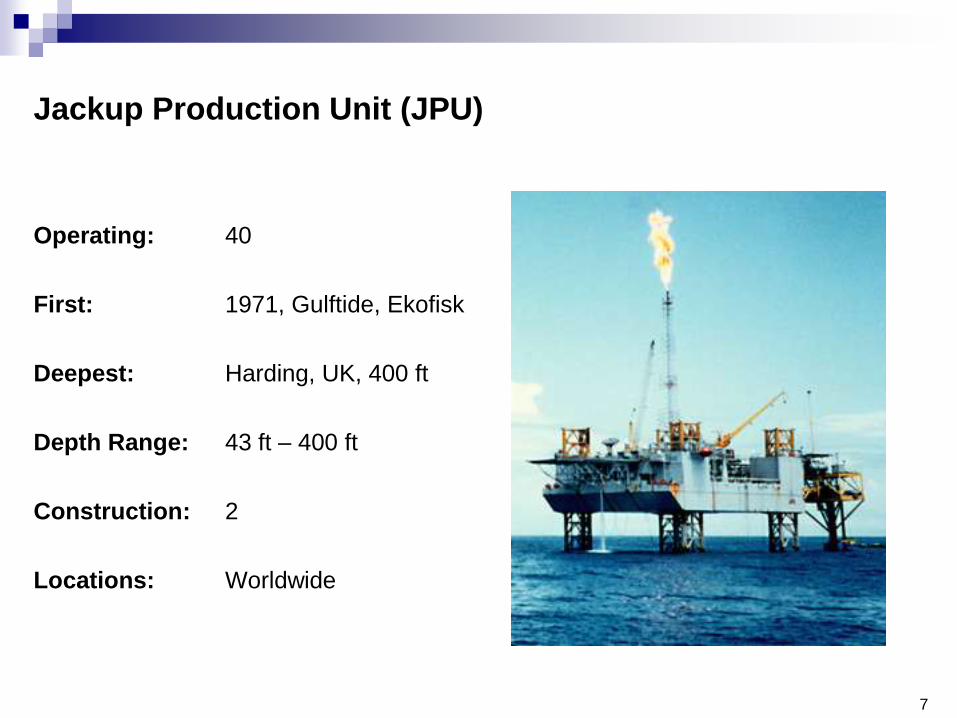
Jackup Production Unit (JPU)
Operating: 40
First: 1971, Gulftide, Ekofisk
Deepest: Harding, UK, 400 ft
Depth Range: 43 ft – 400 ft
Construction: 2
Locations: Worldwide

8
FPS - Semi Submersible
Operating : 39
Stacked: 4
First: 1975, Argyll, Hamilton
Deepest: 7,920 ft, MC920
Independence Hub
Construction: 6
Locations: Worldwide

9
FPSO
Operating : 182
Stacked: 13
First: 1977, Castellon, Shell
Deepest: 8,300 ft, Cascade
Chinook
Construction: 29
Locations: Worldwide

10
TLP
Operating : 24
First: 1984, Hutton, Conoco
Deepest: 4,674 ft, Magnolia
GB783/84
Construction: 1
Locations: North Sea, Angola,
Gulf of Mexico,
Indonesia and
Equatorial Guinea
11
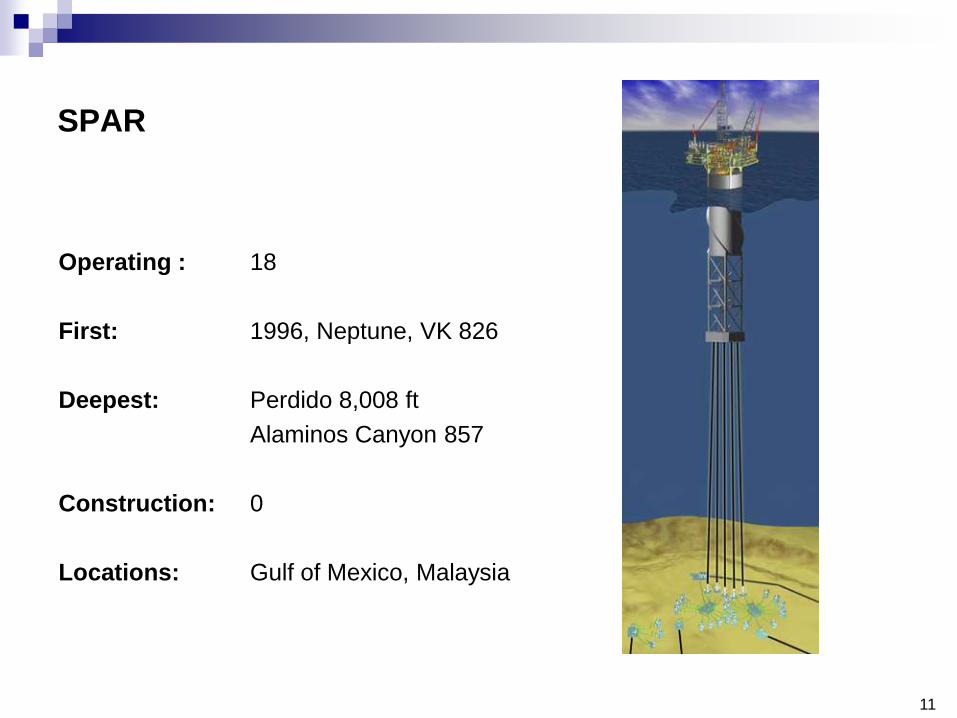
SPAR
Operating : 18
First: 1996, Neptune, VK 826
Deepest: Perdido 8,008 ft
Alaminos Canyon 857
Construction: 0
Locations: Gulf of Mexico, Malaysia

12
0
10,000
20,000
30,000
40,000
50,000
0 2,000 4,000 6,000 8,000 10,000
Water Depth (ft)
Facil
ity P
aylo
ad
(st)
Spars
Semis
TLP
Spar
Semi
TLP
Optimum Application Ranges
Source: FloaTEC

13
Worldwide Forecast Floating Activity by Year 2010-2014e
Units to Start-up 2010-2014: 85
Source: Quest Offshore Resources, Inc.
Units to Award 2010-2014: 129
0
5
10
15
20
25
30
35
40
2010
e
2011
e
2012
e
2013
e
2014
e
Year
Nu
mb
er
of
Un
its
Award Startup
14
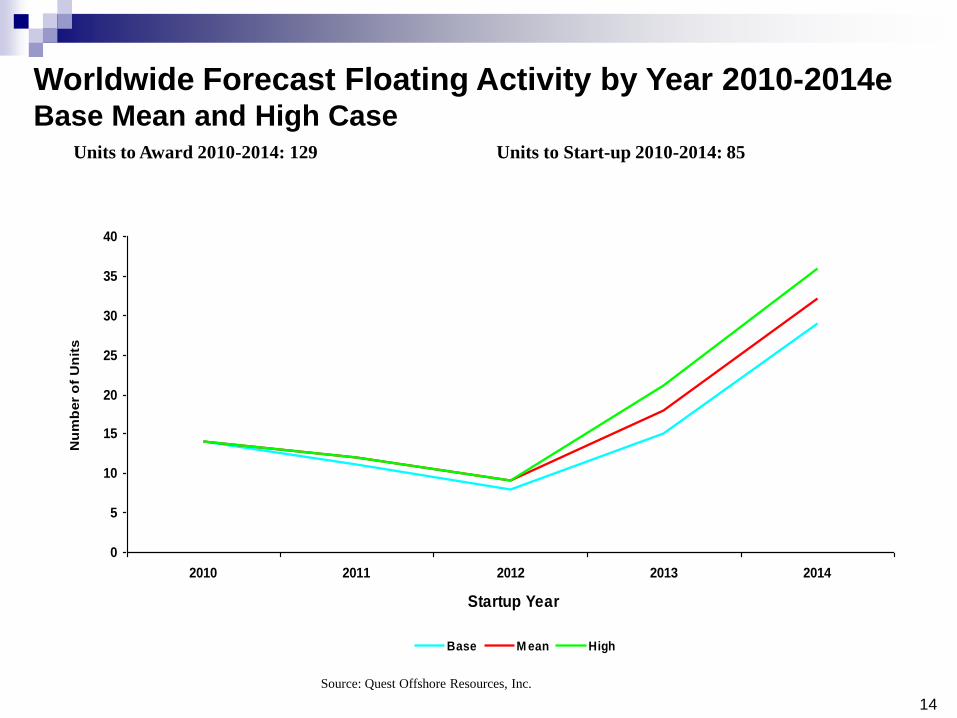
Worldwide Forecast Floating Activity by Year 2010-2014eBase Mean and High Case
Units to Start-up 2010-2014: 85
Source: Quest Offshore Resources, Inc.
Units to Award 2010-2014: 129
0
5
10
15
20
25
30
35
40
2010 2011 2012 2013 2014
Startup Year
Nu
mb
er
of
Un
its
Base M ean High
15
Top Operator Analysis

16
Worldwide FPSO Top OperatorsFlowing and Under Construction Top 11 Operators (87 of 211 Units)
Source: Quest Offshore Resources, Inc.
0
5
10
15
20
25
30
35
Petro
bras
CNOO
C
Exxon
Mobil
Total
Enibp
Chev
ron
Roya
l Dutc
h/She
ll
Woodsi
de Pet
role
um
Cono
coPhill
ips
Petro
nas C
arig
ali
Operator
Nu
mb
er
of
Un
its
17
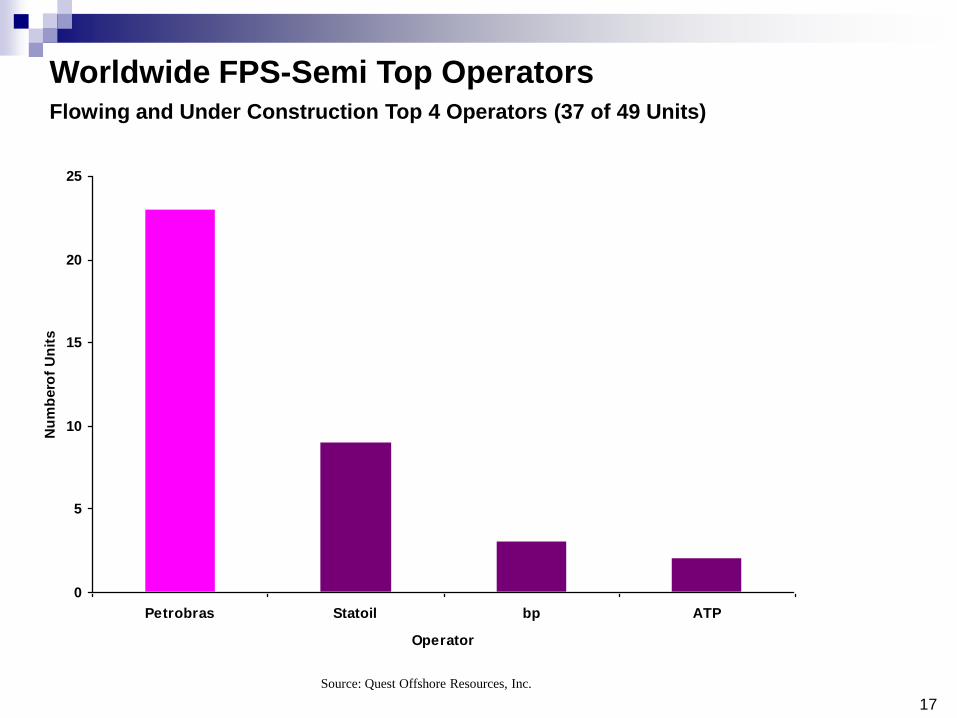
Worldwide FPS-Semi Top OperatorsFlowing and Under Construction Top 4 Operators (37 of 49 Units)
Source: Quest Offshore Resources, Inc.
0
5
10
15
20
25
Petrobras Statoil bp ATP
Operator
Nu
mb
ero
f U
nit
s
18
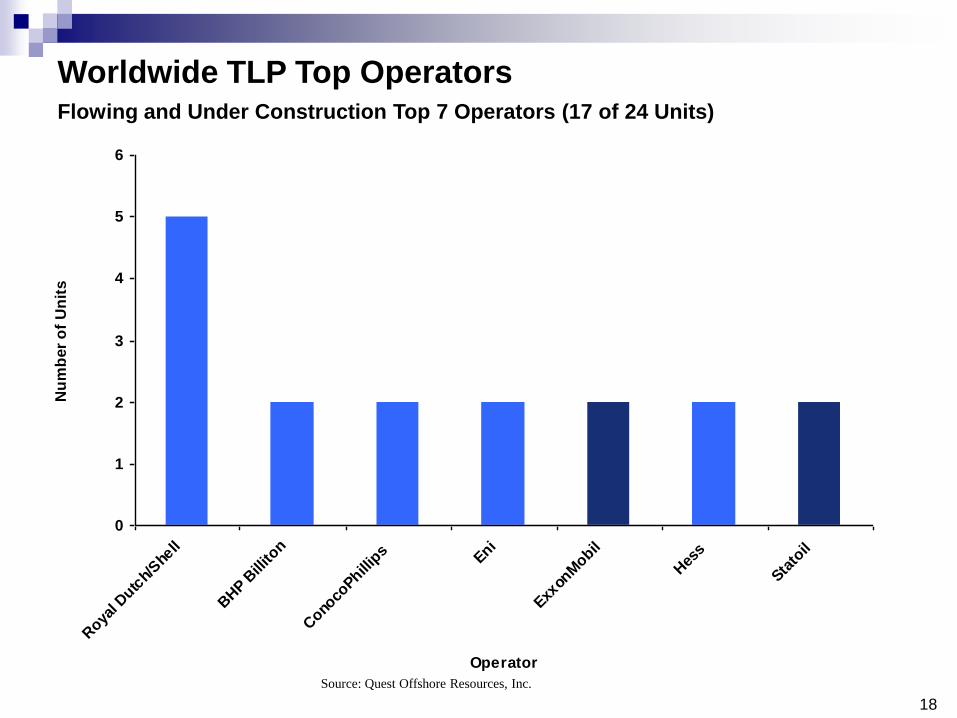
Worldwide TLP Top OperatorsFlowing and Under Construction Top 7 Operators (17 of 24 Units)
Source: Quest Offshore Resources, Inc.
0
1
2
3
4
5
6
Roya
l Dutc
h/She
ll
BHP B
illito
n
Cono
coPhill
ips Eni
Exxon
Mobil
Hes
s
Stato
il
Operator
Nu
mb
er
of
Un
its
19
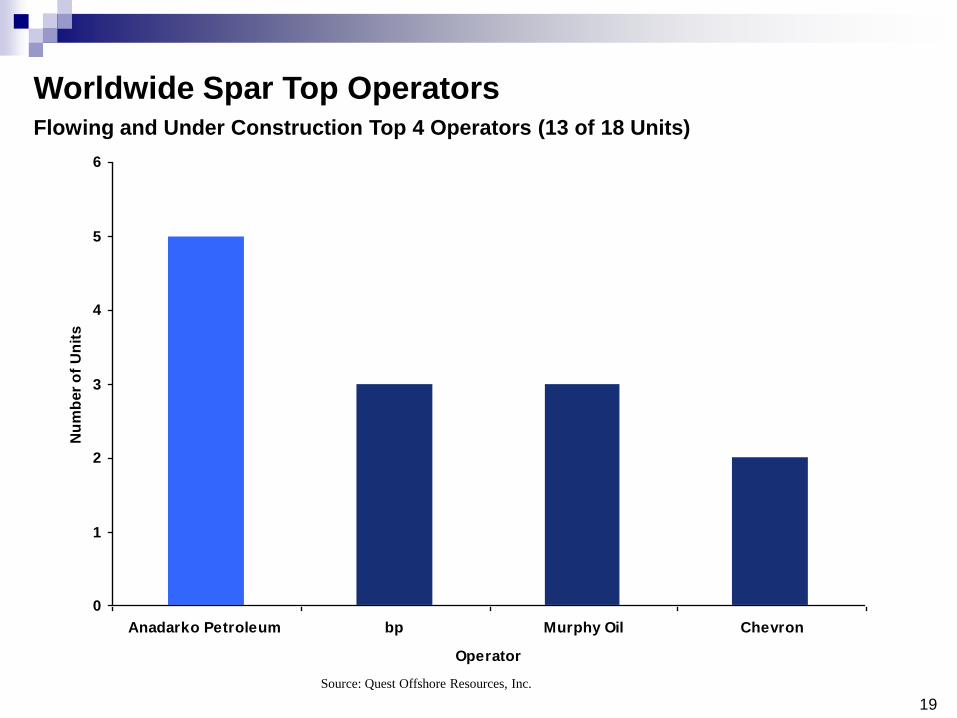
Worldwide Spar Top OperatorsFlowing and Under Construction Top 4 Operators (13 of 18 Units)
Source: Quest Offshore Resources, Inc.
0
1
2
3
4
5
6
Anadarko Petroleum bp Murphy Oil Chevron
Operator
Nu
mb
er
of
Un
its

20
Normalized Forecast
21
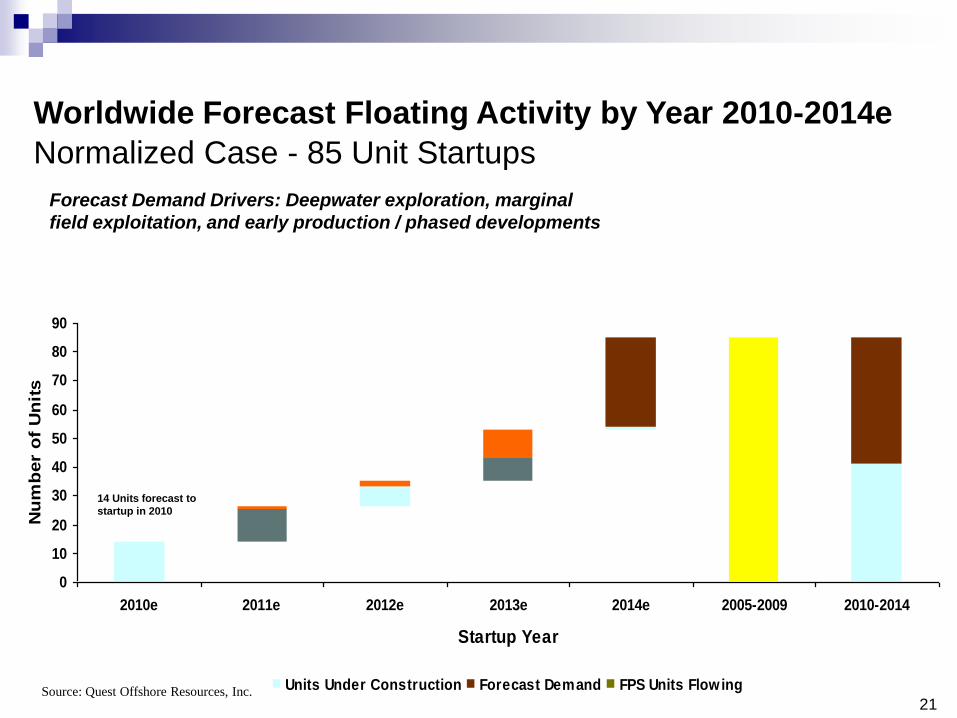
0
10
20
30
40
50
60
70
80
90
2010e 2011e 2012e 2013e 2014e 2005-2009 2010-2014
Startup Year
Nu
mb
er
of
Un
its
Units Under Construction Forecast Demand FPS Units Flowing
Worldwide Forecast Floating Activity by Year 2010-2014e
Normalized Case - 85 Unit Startups
Forecast Demand Drivers: Deepwater exploration, marginal
field exploitation, and early production / phased developments
14 Units forecast to
startup in 2010
Source: Quest Offshore Resources, Inc.
22
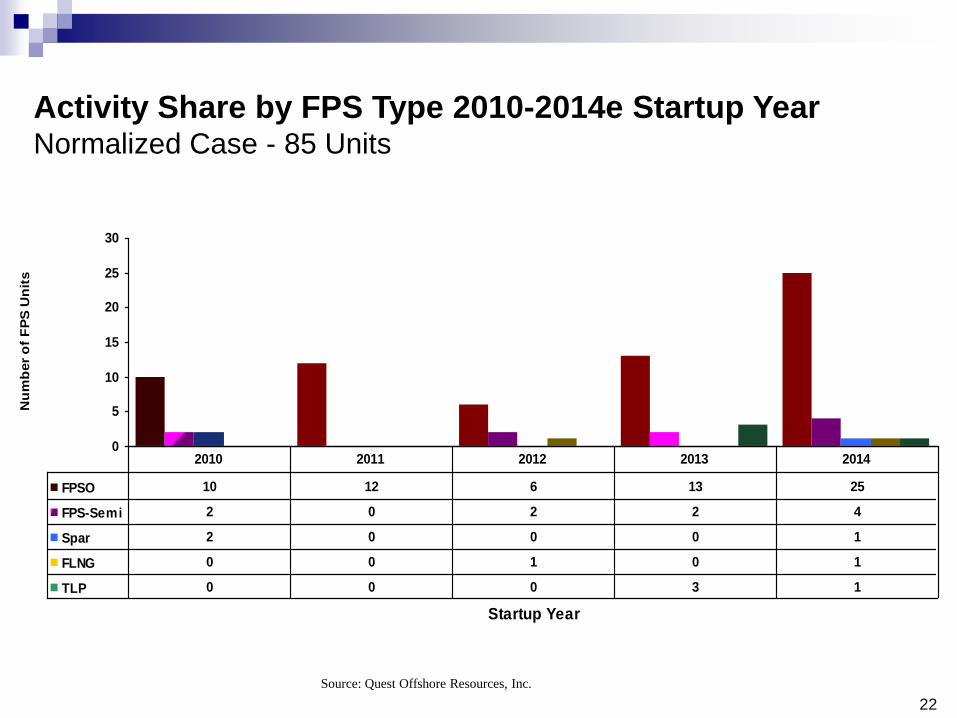
Activity Share by FPS Type 2010-2014e Startup Year Normalized Case - 85 Units
Source: Quest Offshore Resources, Inc.
0
5
10
15
20
25
30
Startup Year
Nu
mb
er
of
FP
S U
nit
s
FPSO 10 12 6 13 25
FPS-Semi 2 0 2 2 4
Spar 2 0 0 0 1
FLNG 0 0 1 0 1
TLP 0 0 0 3 1
2010 2011 2012 2013 2014
23
Global Award Analysis

24
Worldwide FPS Awards 2002 (A) – 2014 (e) (Mean Case)
Source: Quest Offshore Resources, Inc.
0
10
20
30
40
50
2002 2003 2004 2005 2006 2007 2008 2009 2010 2011 2012 2013 2014
Hull Award Year
Nu
mb
er
of
FP
S U
nit
s
Awarded Unawarded High Case Base Case
25
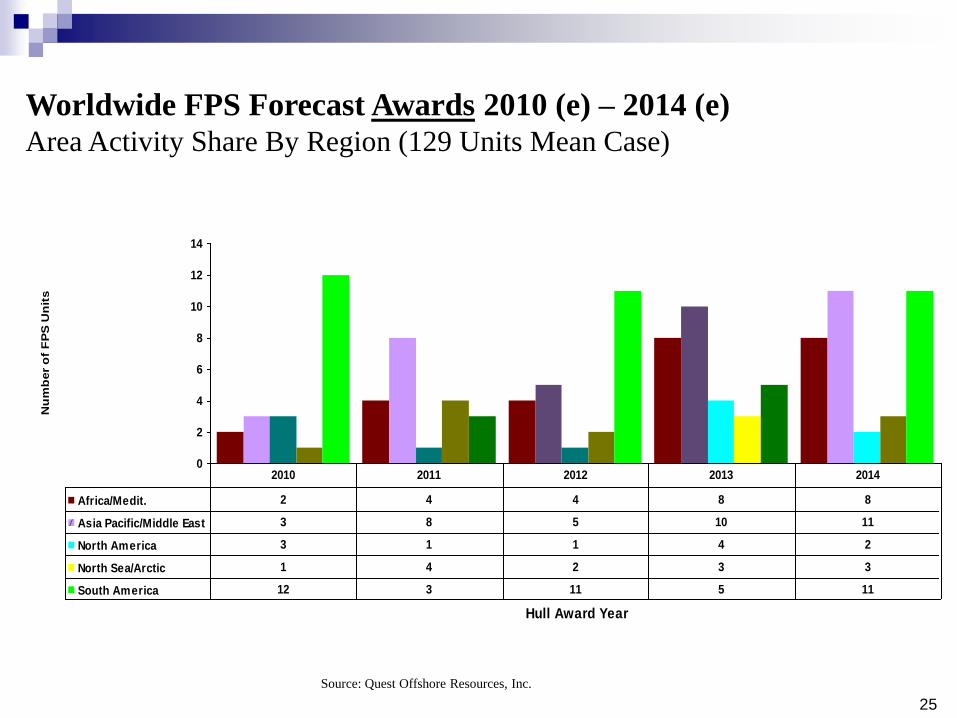
Worldwide FPS Forecast Awards 2010 (e) – 2014 (e)
Area Activity Share By Region (129 Units Mean Case)
Source: Quest Offshore Resources, Inc.
0
2
4
6
8
10
12
14
Hull Award Year
Nu
mb
er
of
FP
S U
nit
s
Africa/Medit. 2 4 4 8 8
Asia Pacific/Middle East 3 8 5 10 11
North America 3 1 1 4 2
North Sea/Arctic 1 4 2 3 3
South America 12 3 11 5 11
2010 2011 2012 2013 2014

26
Worldwide FPS Awards 2010 (A) – 2014 (e) Mean Case By FPS Type (129 Units)
Source: Quest Offshore Resources, Inc.
0
5
10
15
20
25
30
Hull Award Year
Nu
mb
er
of
FP
S U
nit
s
FPSO 17 13 20 24 26
FPS-Semi 1 3 1 2 5
Spar 0 0 0 3 1
FLNG 1 3 1 1 2
TLP 2 1 1 0 1
2010 2011 2012 2013 2014
27
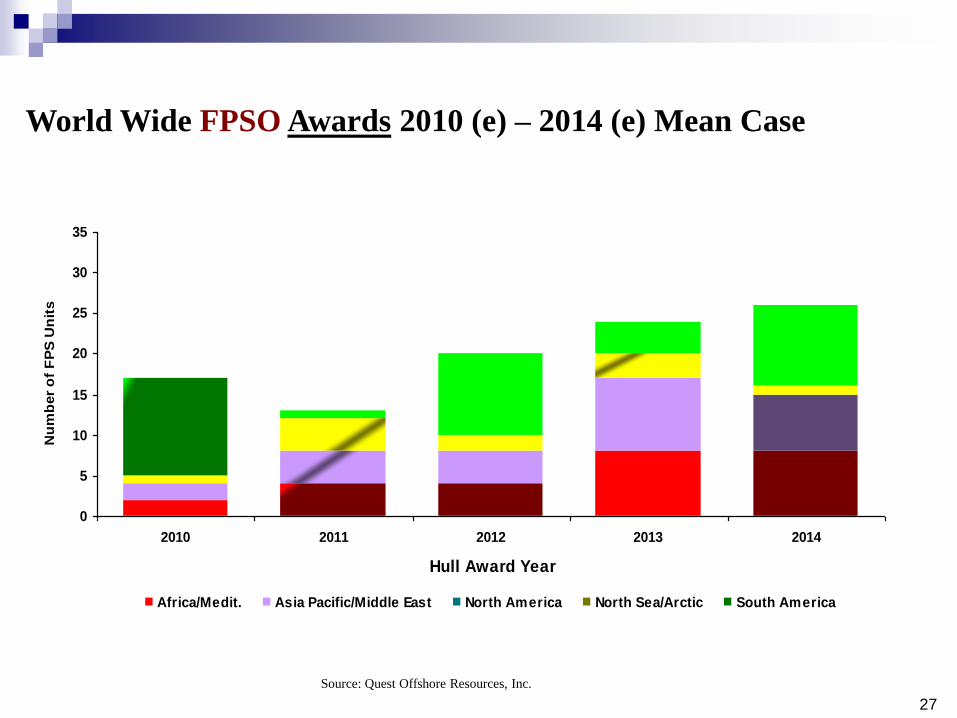
World Wide FPSO Awards 2010 (e) – 2014 (e) Mean Case
Source: Quest Offshore Resources, Inc.
0
5
10
15
20
25
30
35
2010 2011 2012 2013 2014
Hull Award Year
Nu
mb
er
of
FP
S U
nit
s
Africa/Medit. Asia Pacific/Middle East North America North Sea/Arctic South America
28
$0
$5,000,000
$10,000,000
$15,000,000
$20,000,000
$25,000,000
2002 2003 2004 2005 2006 2007 2008 2009 2010 2011 2012 2013 2014
Hull Award Year
Th
ou
san
ds o
f U
S D
ollars
Africa/M edit. Asia Pacific/M iddle East
North America North Sea/Arctic
South America
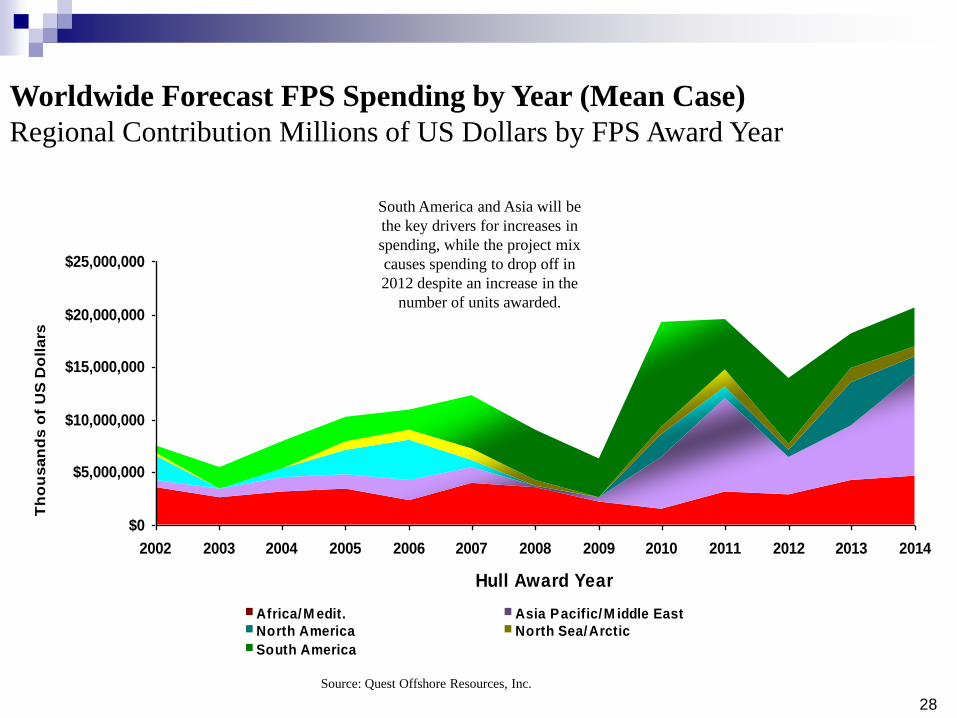
Worldwide Forecast FPS Spending by Year (Mean Case)
Regional Contribution Millions of US Dollars by FPS Award Year
South America and Asia will be
the key drivers for increases in
spending, while the project mix
causes spending to drop off in
2012 despite an increase in the
number of units awarded.
Source: Quest Offshore Resources, Inc.
29
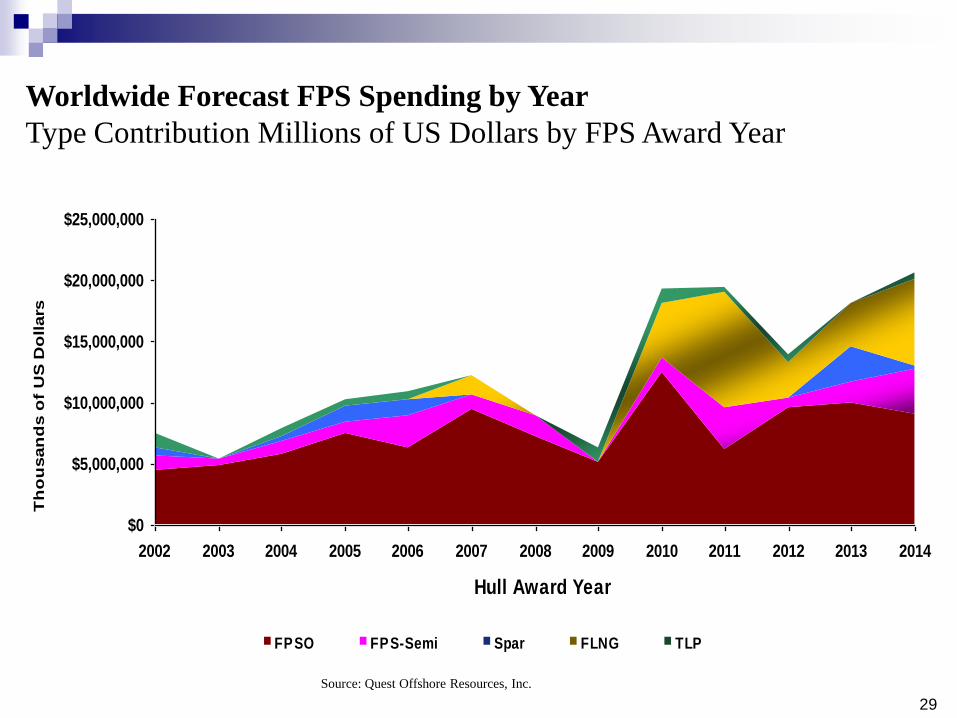
Worldwide Forecast FPS Spending by Year
Type Contribution Millions of US Dollars by FPS Award Year
Source: Quest Offshore Resources, Inc.
$0
$5,000,000
$10,000,000
$15,000,000
$20,000,000
$25,000,000
2002 2003 2004 2005 2006 2007 2008 2009 2010 2011 2012 2013 2014
Hull Award Year
Th
ou
san
ds o
f U
S D
ollars
FPSO FPS-Semi Spar FLNG TLP
30
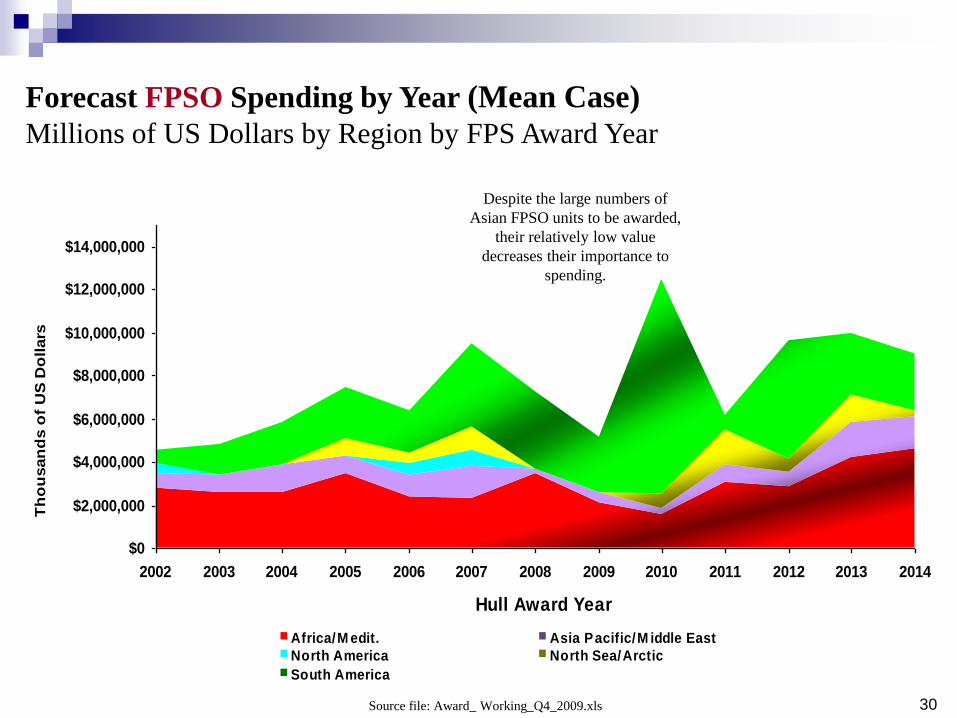
Forecast FPSO Spending by Year (Mean Case)
Millions of US Dollars by Region by FPS Award Year
Source file: Award_ Working_Q4_2009.xls
Despite the large numbers of
Asian FPSO units to be awarded,
their relatively low value
decreases their importance to
spending.
$0
$2,000,000
$4,000,000
$6,000,000
$8,000,000
$10,000,000
$12,000,000
$14,000,000
2002 2003 2004 2005 2006 2007 2008 2009 2010 2011 2012 2013 2014
Hull Award Year
Th
ou
san
ds o
f U
S D
ollars
Africa/M edit. Asia Pacific/M iddle East
North America North Sea/Arctic
South America

31
Leased FPS Units
32
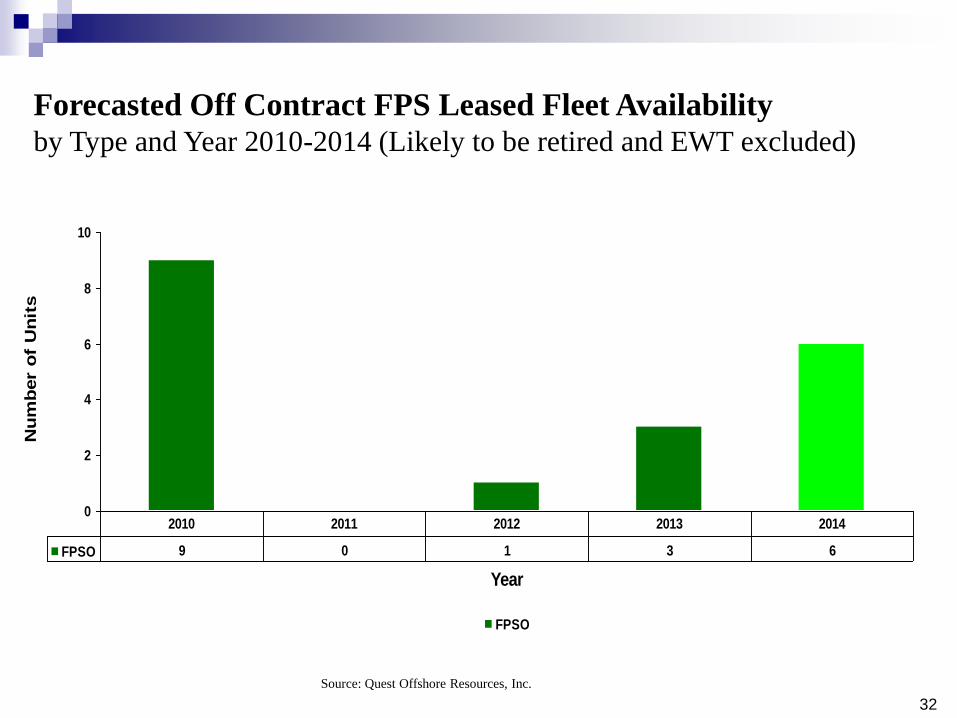
Forecasted Off Contract FPS Leased Fleet Availability
by Type and Year 2010-2014 (Likely to be retired and EWT excluded)
Source: Quest Offshore Resources, Inc.
0
2
4
6
8
10
Year
Nu
mb
er o
f U
nit
s
FPSO
FPSO 9 0 1 3 6
2010 2011 2012 2013 2014

33
5%
8%
3%
10%
3%
3%
3%
17%
3%
3%
9%
14%
3%
8%
3%5%
Aker Floating Production
Bluewater Offshore
Bumi Armada
BW Offshore
FPS Ocean
Fred Olsen Production
Maersk
MODEC
Nexus/APL
Nortech
Prosafe Production
SBM
Sea Production
Sevan Marine
Tanker Pacific
Teekay Shipping Corp
Leased FPSO Market Share by Owner
Owners with >1 Unit
Includes JV Shares
Source: Quest Offshore Resources, Inc.
34
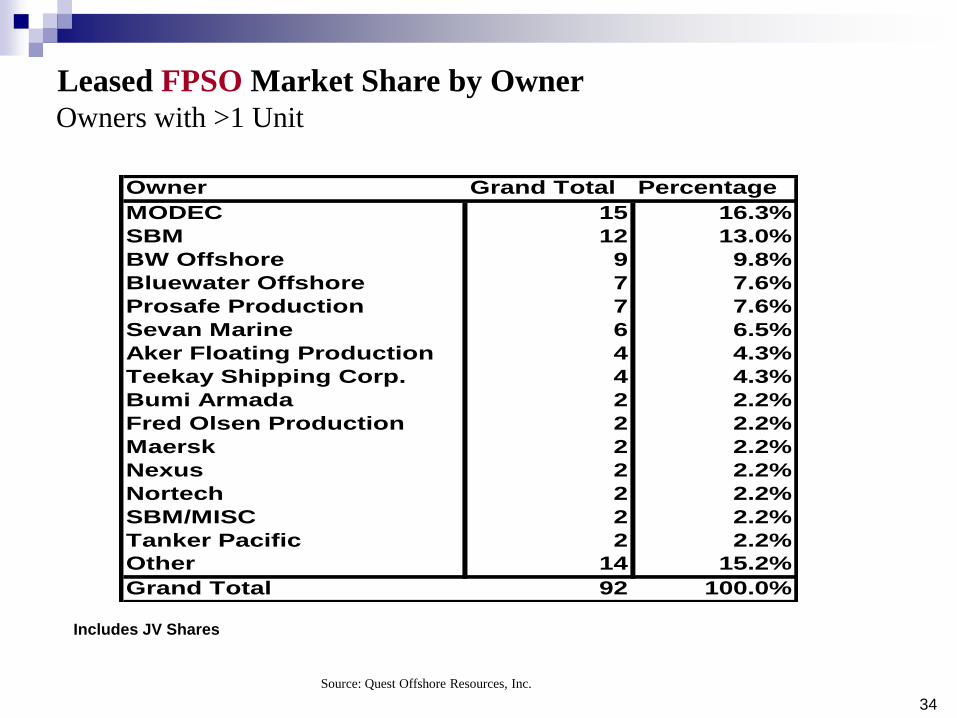
Leased FPSO Market Share by Owner
Owners with >1 Unit
Includes JV Shares
Source: Quest Offshore Resources, Inc.
Owner Grand Total Percentage
MODEC 15 16.3%
SBM 12 13.0%
BW Offshore 9 9.8%
Bluewater Offshore 7 7.6%
Prosafe Production 7 7.6%
Sevan Marine 6 6.5%
Aker Floating Production 4 4.3%
Teekay Shipping Corp. 4 4.3%
Bumi Armada 2 2.2%
Fred Olsen Production 2 2.2%
Maersk 2 2.2%
Nexus 2 2.2%
Nortech 2 2.2%
SBM/MISC 2 2.2%
Tanker Pacific 2 2.2%
Other 14 15.2%
Grand Total 92 100.0%
35
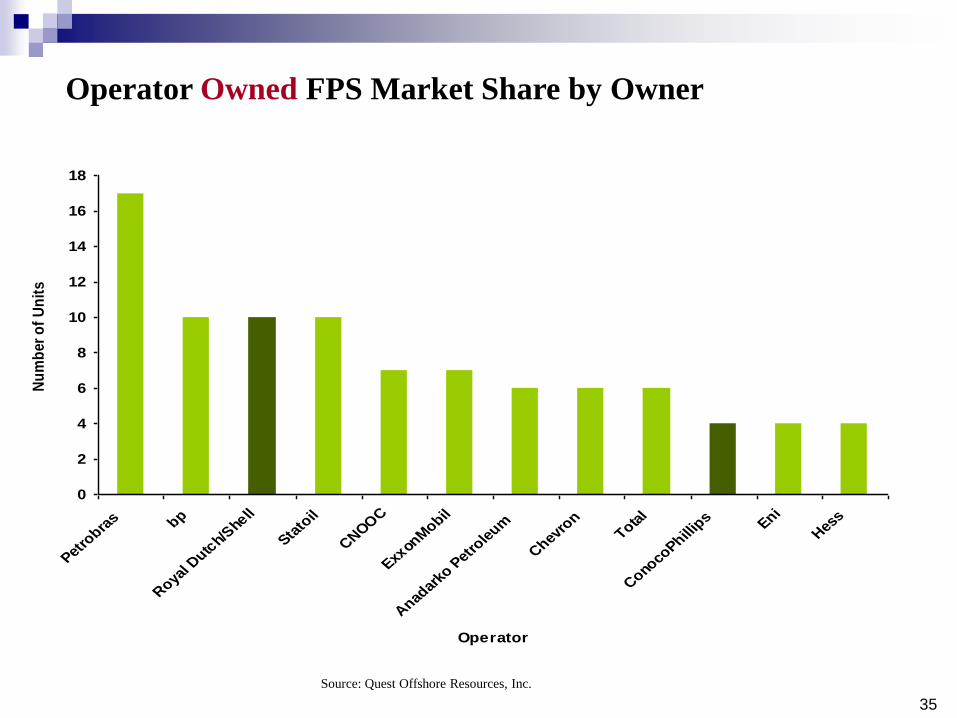
Operator Owned FPS Market Share by Owner
Source: Quest Offshore Resources, Inc.
0
2
4
6
8
10
12
14
16
18
Petro
bras bp
Roya
l Dutc
h/She
ll
Stato
il
CNOO
C
Exxon
Mobil
Anad
arko
Pet
role
um
Chev
ron
Total
Cono
coPhill
ips Eni
Hes
s
Operator
Nu
mb
er
of
Un
its

36
Global Hull Fabrication Analysis
37
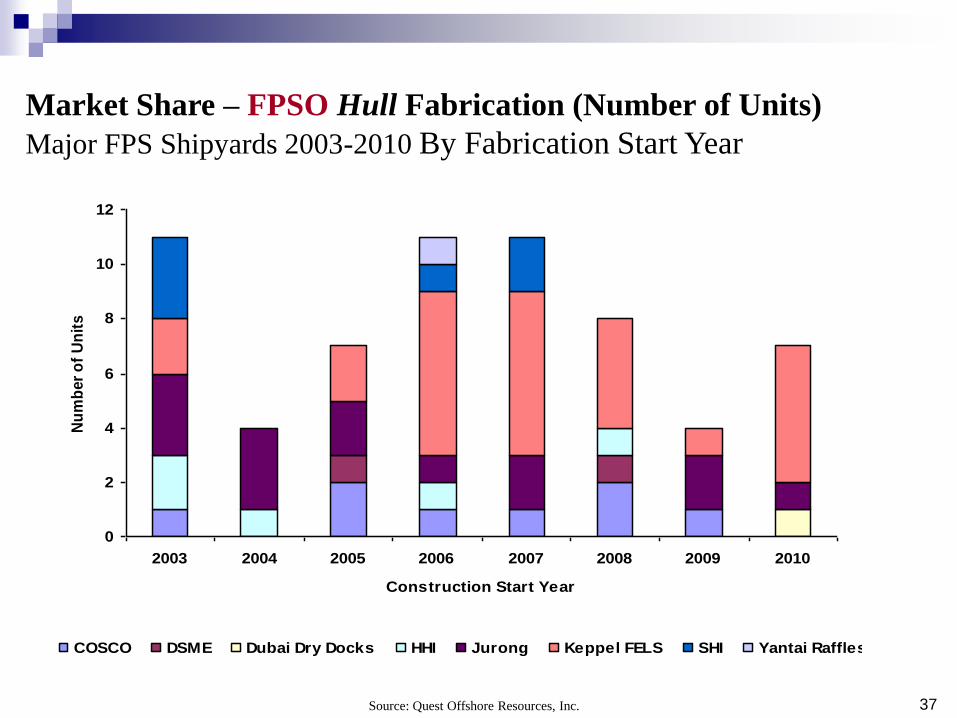
Market Share – FPSO Hull Fabrication (Number of Units)
Major FPS Shipyards 2003-2010 By Fabrication Start Year
Source: Quest Offshore Resources, Inc.
0
2
4
6
8
10
12
2003 2004 2005 2006 2007 2008 2009 2010
Construction Start Year
Nu
mb
er
of
Un
its
COSCO DSME Dubai Dry Docks HHI Jurong Keppel FELS SHI Yantai Raffles
38
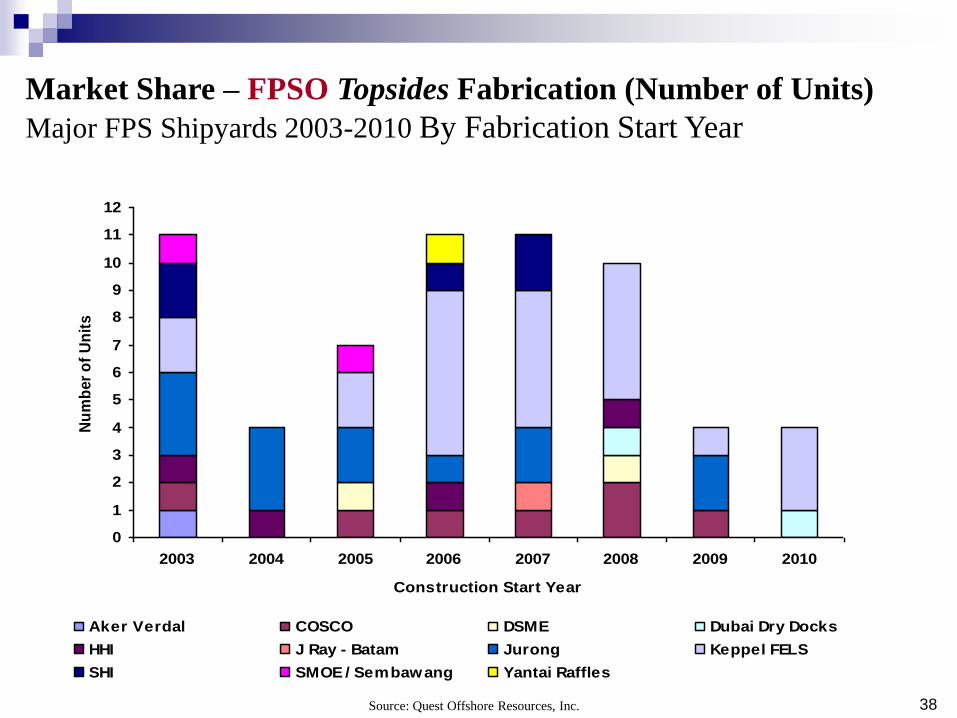
Market Share – FPSO Topsides Fabrication (Number of Units)
Major FPS Shipyards 2003-2010 By Fabrication Start Year
Source: Quest Offshore Resources, Inc.
0
1
2
3
4
5
6
7
8
9
10
11
12
2003 2004 2005 2006 2007 2008 2009 2010
Construction Start Year
Nu
mb
er
of
Un
its
Aker Verdal COSCO DSME Dubai Dry Docks
HHI J Ray - Batam Jurong Keppel FELS
SHI SMOE / Sembawang Yantai Raffles

39
Market Share – FPS-Semi Hull Fabrication (Number of Units)
Major FPS Shipyards 2003-2010 By Fabrication Start Year
Source: Quest Offshore Resources, Inc.
0
1
2
3
4
2003 2004 2005 2006 2007
Construction Start Year
Nu
mb
er
of
Un
its
Aker Verdal DSME Jurong Keppel FELS MMHE SHI
40
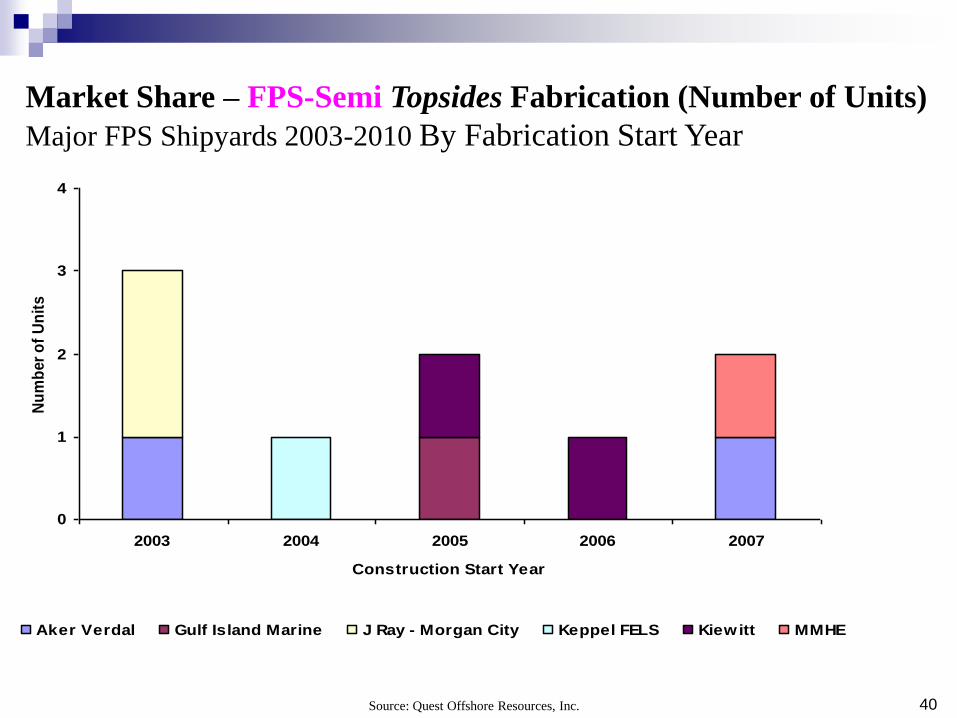
Market Share – FPS-Semi Topsides Fabrication (Number of Units)
Major FPS Shipyards 2003-2010 By Fabrication Start Year
Source: Quest Offshore Resources, Inc.
0
1
2
3
4
2003 2004 2005 2006 2007
Construction Start Year
Nu
mb
er
of
Un
its
Aker Verdal Gulf Island Marine J Ray - Morgan City Keppel FELS Kiewitt MMHE

41
Conclusions
42
Conclusions
MOPS market continues to expand
Leased FPSOs are approximately 1/2 of the FPSO market
FPSOs are by far the most common type of MOPS
A number of FPSO units are available today
Floating Production Systems are the only option for surface facilities in
water depths greater than 1,750 ft

43
Questions?
44
Selecting a MOPS Unit Type: Principal Determining
Criteria
Surface or Subsea Completions
Need for Well Access and Intervention
Drilling Program Requirements
Access to Existing Hydrocarbon Export Infrastructure
Water Depth and Environmental Regime
Size and weight of process equipment

45
Principal Operational Sensitivities
Oil Export Method / Storage and
Offloading Systems
Environmental Parameters and the
Mooring System
Permanent moorings
Disconnectable options
Weathervaning (single-point) vs.
spread moorings
Process System Sensitivities
46
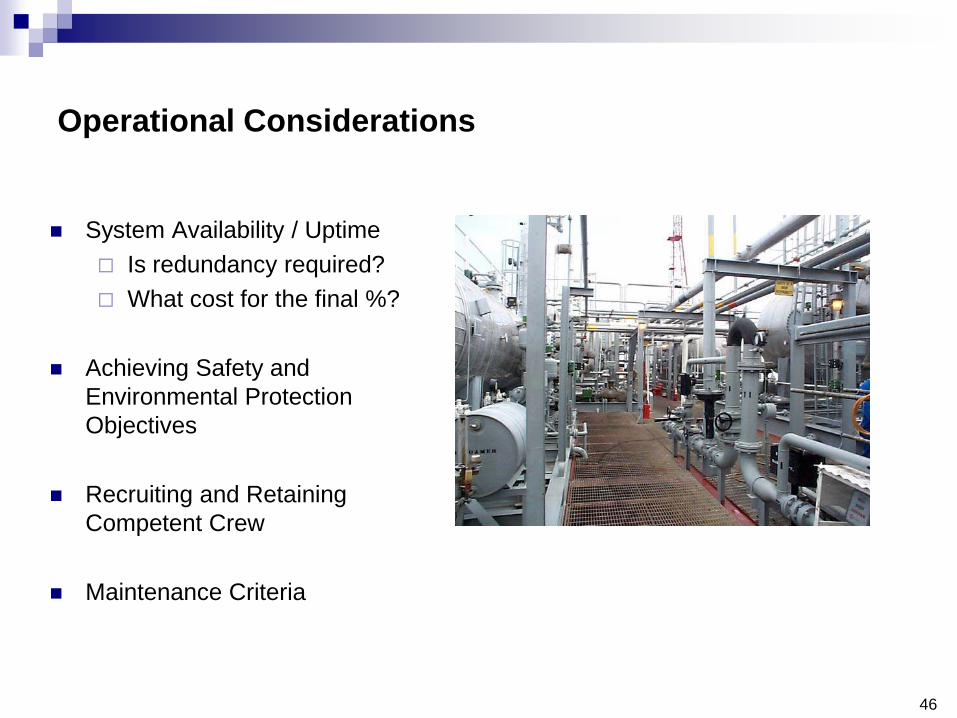
Operational Considerations
System Availability / Uptime
Is redundancy required?
What cost for the final %?
Achieving Safety and
Environmental Protection
Objectives
Recruiting and Retaining
Competent Crew
Maintenance Criteria