Chapter 4: Market Structure and Market Power 1 Market Structure and Market Power.

February 2020
Mobile market structure and performance in Europe
Lessons from the 4G era
Copyright © 2020 GSM Association

GSMAThe GSMA represents the interests of mobile operators worldwide, uniting more than 750 operators and nearly 400 companies in the broader mobile ecosystem, including handset and device makers, software companies, equipment providers and internet companies, as well as organisations in adjacent industry sectors. The GSMA also produces the industry-leading MWC events held annually in Barcelona, Los Angeles and Shanghai, as well as the Mobile 360 Series of regional conferences. For more information, please visit the GSMA corporate website at gsma.com Follow the GSMA on Twitter: @GSMA
GSMA IntelligenceGSMA Intelligence is the definitive source of global mobile operator data, analysis and forecasts, and publisher of authoritative industry reports and research. Our data covers every operator group, network and MVNO in every country worldwide — from Afghanistan to Zimbabwe. It is the most accurate and complete set of industry metrics available, comprising tens of millions of individual data points, updated daily.
GSMA Intelligence is relied on by leading operators, vendors, regulators, financial institutions and third-party industry players, to support strategic decision-making and long-term investment planning. The data is used as an industry reference point and is frequently cited by the media and by the industry itself.
Our team of analysts and experts produce regular thought-leading research reports across a range of industry topics.
gsmaintelligence.com [email protected]
AcknowledgementsWe are very grateful for the advice and peer review provided by Professor Christos Genakos and for his continuous support in helping to improve this study. We would also like to thank Ookla for providing invaluable access to their data and expertise on network quality and performance measurements.
Authors
Serafino AbatePau Castells
Kalvin Bahia
Mayuran Sivakumaran

Executive summary 04
1. Introduction 06
2. Mobile consumers in three-player European markets have benefitted from higher quality and innovation
12
2.1 Quality 13
2.2 4G coverage 21
2.3 Prices 22
3. Investment has remained strong despite economic headwinds
24
4. Market concentration in Europe decreased — even though the number of operators fell
28
5. Recent studies support economic theory that mobile consolidation can lead to improved outcomes
32
6. Our econometric analysis supports the trends on download speeds and investment
34
7. Conclusions 38
Annex 1: Data, methodology and econometrics results 40
Annex 2: Network-sharing sensitivities 50
Contents

Covering 99 operators in 29 markets across an eight-year period, this study analyses how European mobile markets performed during the 4G era — in particular, how different market structures affected network quality, coverage and investment. We also consider how the implicit average price for mobile broadband changed over the period, how market structures and market concentration evolved, and how these factors affected the competitive intensity across Europe’s mobile markets.
The trend of mobile consolidation that started in the 3G era continued in the 4G era. Specifically, we saw several markets transition from four to three players. In addition, new players emerged in some markets — often following regulatory intervention, including remedies to proposed mergers. Following these changes in market structures, market shares for the smallest players have increased across Europe.
Europe’s mobile networks have continued to improve the customer experience. By the end of 2018, 4G networks covered, on average, 98% of the population across 29 European countries and delivered average speeds in excess of 30 Mbps with latencies lower than 30 ms. This made mobile broadband fit for purpose for all mass-market consumer applications, from browsing and posting on social networks to streaming music and videos and file sharing. At the same time, average prices fell across Europe. Both average revenue per user and average revenue per MB of data dropped significantly during the 2011–2018 period. However, investment remained resilient despite declining revenues. We can also infer from our analysis that many of the gains in performance came not just from increased investments but also from greater efficiency in the use of resources.
Our analysis shows that during this same period, three-player markets in Europe provided better performance for consumers in the form of higher download speeds. In particular, the performance gap between more concentrated and less concentrated markets opened up from 2015 onwards, after 4G coverage across the continent had, on average, reached almost 90% of the population. These results held when we accounted for market- and operator-specific factors, such as share of urban versus rural population, spectrum holdings, GDP per capita, market position of the different operators and the number of years since the launch of services.
In terms of investment, our econometric analysis points towards strong evidence of a link between more concentrated markets and increased capex per operator, including when other relevant factors are controlled for. This is in line with much of the existing literature. We also observed better outcomes, albeit more marginally, in terms of speed of rollouts and lower latencies for three-player markets than four-player markets, but we cannot conclude that market structure was a determining factor for these. For both coverage and latencies, there are good reasons why other factors might be as important as market structure in driving improved performance. Overall, our results suggest that more concentrated markets were able to provide consumers with better performance, especially on network quality.
As more operators begin to deploy 5G networks, this study has important implications for policies to ensure that Europe has the right conditions in place for the rollout of high performing 5G networks:
04 Executive Summary
Executive Summary
MOBILE MARKET STRUCTURE AND PERFORMANCE IN EUROPE — LESSONS FROM THE 4G ERA

Executive Summary 05
First, we find that during the 4G era there were two phases in the evolution of networks. Operators competed to provide coverage to most of the population, with more concentrated markets delivering faster 4G rollouts. Once coverage reached 90% of the population, capacity went up, as evidenced by fast improvements in speeds — and that is when we start to see significantly enhanced performance in more concentrated markets.
It is important for governments, regulators and competition authorities to consider the lessons this study provides, including the relative advantages of more concentrated market structures in terms of network quality. While every market is unique, regulators aiming to increase the number of players or considering preventing the reduction in the number of players (e.g. merger control) should reflect carefully on the likely impact this could have on network performance and the consumer experience.
1 Study on Socio-Economic Benefits of 5G Services Provided in mmWave, GSMA, 2019
Finally, as we infer from our analysis during the 4G era, an important factor for improved performance has been the ability of operators to optimise the use of resources, including scarce assets such as spectrum, sites and towers. Dispersion of these among a greater number of players can result in less efficient use of such resources, which can translate into lower network performance, to the detriment of consumers.
Second, the experience with 4G in Europe shows that markets with more concentrated market structures are better at delivering higher performances. This is important for policymakers because high network performance will be crucial for unlocking the full potential of 5G networks, including improvements to productivity worth potentially $2.2 trillion to the global economy1 through supporting different vertical industries and advanced applications that require very low latencies, high speeds and plenty of network capacity.
1. 2. 3.

1. IntroductionThe world’s first 4G LTE networks launched in 2009 in Norway and Sweden. Soon after (from 2011), 4G began to account for an increasingly large proportion of mobile connections2 in Europe (see Figure 1), as operators in other countries rolled out their 4G networks and consumers began to migrate from 3G. We refer to this post-2011 period as Europe’s ‘4G era’.
Demand for data capacity grew quickly during the 4G era (see Figure 2) because consumers were using mobile broadband more, so the main source of revenues shifted from minutes and SMS to data packages. In order to meet this demand, operators have sought to reduce network costs while increasing capacity, which has been achieved through investments in new generations of mobile technologies, each of which is more efficient at handling data traffic.
4G began to make inroads from 2011 onwards Share of connections in Europe by network technology Source: GSMA Intelligence
Figure 1
4G2G
06 Introduction
2011 2012 2013 2014 2015 2016 2017 2018
0%
10%
20%
30%
40%
50%
60%
70%
80%
90%
100%
2 ‘Mobile connections’ are defined as unique SIM cards (or phone numbers where SIM cards are not used) that have been registered on a mobile network.
MOBILE MARKET STRUCTURE AND PERFORMANCE IN EUROPE — LESSONS FROM THE 4G ERA
3G

Figure 2
Data usage across Europe has grown more than 14-fold between 2011 and 2018 Exabytes per month Source: Ericsson*
Introduction 07
2011 2012 2013 2014 2015 2016 2017 2018
* Based on total data for western, central and eastern Europe
4.5
4.0
3.5
3.0
2.5
2.0
1.5
1.0
0.5
0.0
MOBILE MARKET STRUCTURE AND PERFORMANCE IN EUROPE — LESSONS FROM THE 4G ERA

Historically, many operators have consolidated operations and assets through mergers and acquisitions to lower the cost of mobile technology rollouts.
In Europe, this trend has evolved over time. In the 3G era, several mobile markets saw the emergence of new competitors. However, by the end of this period the trend of consolidation started to gain traction. By 2011, there were 11 markets with four players and 18 markets with three players3 in Europe4 (see Figure 3). While five-to-four mergers have generally been approved with few remedies, four-to-three mergers usually face deeper regulatory challenges, with those cleared typically facing additional remedies to allay regulators’ concerns. Between 2011 and 2018, there were five approved mergers between mobile network operators, in Austria, Ireland, Germany, Norway and Italy (and more recently in the Netherlands in 2019). In the same period, four new mobile operators surfaced, in France, Slovakia, Norway and the Netherlands (and more recently, a new player appeared in Italy). By the end of 2018, there were 10 four-player markets and 19 three-player markets.
However, not all proposed mergers have proceeded. In 2016, the European Commission’s Directorate General for Competition rejected a proposed merger in the UK on grounds that competition concerns outweighed the perceived potential benefits.5 Additionally, a merger was withdrawn in Denmark on the expectation that the European Commission would not clear it without significant remedies.6
08 Introduction
3 We define a mobile network operator, or player, as a distinct commercial entity that can differentiate on pricing and quality of service to the consumer. In Europe, there has been a range of network-sharing agreements during 2011–2018, ranging from passive infrastructure sharing to multi-operator core networks (MOCNs), where core networks are shared – and in some cases spectrum as well. We treat operators that share networks (whether passive, active, core and/or spectrum) as distinct entities as they have well-defined relationships with end consumers. This means that any countries with four operators that have network sharing in place (e.g. the UK, Sweden, Denmark and Poland) are considered four-player markets. We discuss networking sharing in more detail in Annex 2.
4 The data we studied covers 29 European countries – 27 of the 28 members of the European Union along with Norway and Switzerland (Cyprus was not included because of the existence of two practical mobile markets on the island). We included operators that had a market share greater than 3% at some point in the period of analysis. This was for two reasons: (i) to ensure that we only took into account operators with a significant presence in the national market, and (ii) to ensure that the operators in our sample had sufficient network-quality data. The operators included in our analysis accounted for more than 99% of mobile connections in the 29 countries over the period.
5 http://ec.europa.eu/competition/mergers/cases/decisions/m7612_6555_3.pdf
6 https://europa.eu/rapid/press-release_STATEMENT-15-5627_en.htm
MOBILE MARKET STRUCTURE AND PERFORMANCE IN EUROPE — LESSONS FROM THE 4G ERA

Introduction 09
Figure 3
Three- and four-player markets in Europe Source: GSMA Intelligence
Three-player market Four-player market
Q1 2011 Q4 2018
MOBILE MARKET STRUCTURE AND PERFORMANCE IN EUROPE — LESSONS FROM THE 4G ERA

As the 5G era begins, the debate about mobile market structure and mobile consolidation is receiving new impetus, with policies being considered in some countries to facilitate further market entry. Historically, the debate on how different mobile market structures may or may not benefit consumers has mainly focussed on price effects, foregoing important considerations of network coverage, performance and user experience.
This study provides a comprehensive assessment of mobile market performance across Europe during the 4G era. It adds evidence to recent studies that have sought to inform the debate on mobile consolidation by investigating the relationship between mobile market structure and market outcomes.
The study combines coverage data and other publicly available data from operators’ quarterly and annual reports with network-quality measurement data from Ookla®.7 Speedtest®, Ookla’s flagship network testing platform, is used by 500 million unique users globally and collects millions of measurements into the performance and quality of networks around the world each day. We conducted econometric analysis using different models, with advice and peer review provided by Professor Christos Genakos.
In the next section, we consider how the consumer experience has evolved and what has underpinned this. We then look at the development of operator investments, before considering the impact of market concentration and competition intensity during the 4G era on market performance. The last section provides important policy implications for the future development of high-performing 5G networks in Europe.
7 Based on GSMA analysis of Speedtest Intelligence data from Ookla for 2011–2018. Ookla trademarks used under licence and reprinted with permission.
10 Introduction
MOBILE MARKET STRUCTURE AND PERFORMANCE IN EUROPE — LESSONS FROM THE 4G ERA

Introduction 11
MOBILE MARKET STRUCTURE AND PERFORMANCE IN EUROPE — LESSONS FROM THE 4G ERA

2. Mobile consumers in three-player European markets have benefitted from higher quality and innovation
MOBILE MARKET STRUCTURE AND PERFORMANCE IN EUROPE — LESSONS FROM THE 4G ERA

Consumers value a range of factors when it comes to their mobile service. While the focus of regulators has often been on lower prices, there has been a gradual shift in attention to other aspects of the consumer experience and market performance, such as innovation and quality.8 This includes network coverage, download and upload speeds, and latency, all of which have a direct impact on the performance of mobile services. We look at these factors, as well as pricing, in turn and compare the performances between three- and four-player markets in Europe.
Mobile consumers in three-player European markets have benefitted from higher quality and innovation 13
We consider market performance using the following measures of network quality:
2.1 Quality
8 For further discussion, see Assessing the impact of mobile consolidation on innovation and quality: An evaluation of the Hutchison/Orange merger in Austria, GSMA, 2017
1.
2.
3.
Download speeds (higher speeds allow consumers to download content more quickly and use data-intensive applications, such as video).
Upload speeds (higher speeds enable consumers to share more content and experience better performance of services, such as for online gaming).
Latency (relevant for services that require short delays such as HD video streaming, video calls, voice over IP or online gaming, and more advanced applications such as telemedicine or remote vehicle driving).
MOBILE MARKET STRUCTURE AND PERFORMANCE IN EUROPE — LESSONS FROM THE 4G ERA

Figure 4
By 2018, three-player markets were outperforming four-player markets by 5 Mbps (13% higher) Average download speeds (Mbps) Source: GSMA analysis of data from Ookla
Three-player market
0
10
20
30
40
Figure 5
By 2018, upload speeds were 16% higher in three-player marketsAverage upload speeds (Mbps) Source: GSMA analysis of data from Ookla
0
5
10
15
We source data on all three metrics at the operator level from Speedtest Intelligence® data from Ookla. Overall, download and upload speeds increased, while latency decreased, as Europe moved from 3G to 4G. Download speeds rose on average from below 5 Mbps in 2011 to more than 30 Mbps by the end of 2018 (see Figure 4), at which point three-player markets were outperforming four-player markets by 5 Mbps (13% higher speeds). The difference in performance is also apparent when assessing upload speeds, which were 16% higher in three-player markets than in four-player markets in 2018 (Figure 5).
14 Mobile consumers in three-player European markets have benefitted from higher quality and innovation
Four-player market
Three-player market Four-player market
Q4 2011
Q4 2012
Q4 2013
Q4 2014
Q4 2015
Q4 2016
Q4 2017
Q4 2018
35
25
15
5
Q4 2011
Q4 2012
Q4 2013
Q4 2014
Q4 2015
Q4 2016
Q4 2017
Q4 2018
MOBILE MARKET STRUCTURE AND PERFORMANCE IN EUROPE — LESSONS FROM THE 4G ERA

These network quality measures show a widening gap between three- and four-player markets in the second half of the 4G era, from late 2015. This holds true even when we go beyond the number of operators and consider the level of market concentration.
Figure 6 shows that while there was no clear relationship between market concentration and average download speed in 2011, the relationship between the two became much stronger by 2018, when 4G was the most widely used network technology. The range of these results has also become wider in the 4G era: there is a difference in download speed of 40 Mbps between the weakest and strongest countries in 2018.
Figure 6
The relationship between download speeds and market concentration became much stronger by 2018 Source: GSMA analysis of data from Ookla
0
1
2
3
4
5
2500
Ave
rage
dow
nloa
d sp
eeds
, Mbp
s
HHI
Three-player market Four-player market
2011
3000 3500 4000 4500 5000
20
30
40
50
60
70
2000
Ave
rage
dow
nloa
d sp
eeds
, Mbp
s
HHI
2500 3000 3500 4000 50004500
2018
Mobile consumers in three-player European markets have benefitted from higher quality and innovation 15
Three-player market Four-player market
MOBILE MARKET STRUCTURE AND PERFORMANCE IN EUROPE — LESSONS FROM THE 4G ERA

There are several potential explanations for the change in performances of three- and four-player markets in late 2015:
9 Source: GSMA Intelligence. At the end of 2018, operators in three-player markets had an average of more than 103 MHz of spectrum that could be used for 4G compared with 91 MHz in four-player markets.
16 Mobile consumers in three-player European markets have benefitted from higher quality and innovation
Mergers
Three significant mergers took place in Germany, Ireland and Norway during 2014–2015. However, separate analysis shows that three-player markets that have had no changes in market structure are the highest performing from 2015 onwards.
Maturity of 4G coverage
The majority of operators in European markets acquired 4G spectrum by 2013. Network performance at the beginning of a rollout of new technology is variable as consumer take-up is low and the initial focus is to expand network coverage as much as possible. It is only after this initial phase that operators concentrate their investment efforts on capacity improvements. For 4G this coincided with the end of 2015, when coverage was at around 80%.
Efficiency of investments
Operators in three-player markets may have been able to better optimise their assets, including spectrum. From 2016, when the majority of European countries had assigned spectrum in the 800 and 2600 MHz bands (and some refarming of 1800 MHz), operators in three-player markets had on average 14% more 4G spectrum than operators in four-player markets.9
Ability to invest
The sharp decline in revenues observed at the beginning of the period stabilised across all markets by 2014 (see Figure 16). This helped improve the financial position of all operators but more so for those in three-player markets, as shown in Figure 7. Improved profit margins can enable greater investments; we observed that from 2015 operators in three-player markets invested more per connection and as a proportion of revenues (see Figures 14 and 15). This meant they could invest more quickly in newer and faster technologies, for example LTE Advanced.
1. 2.
3. 4.
MOBILE MARKET STRUCTURE AND PERFORMANCE IN EUROPE — LESSONS FROM THE 4G ERA

Figure 7
Margins improved in three-player markets from 2015, enabling greater investments*EBITDA margin Source: GSMA Intelligence
* Based on EBITDA margin data for an average of 68 operators per quarter
Mobile consumers in three-player European markets have benefitted from higher quality and innovation 17
20%
25%
30%
35%
Q4 2010
Q4 2011
Three-player market Four-player market
Margins improved in three-player markets from 2015, enabling greater investments
Q4 2012
Q4 2013
Q4 2014
Q4 2015
Q4 2016
Q4 2017
Q4 2018
MOBILE MARKET STRUCTURE AND PERFORMANCE IN EUROPE — LESSONS FROM THE 4G ERA

18 Mobile consumers in three-player European markets have benefitted from higher quality and innovation
Overall latency decreased dramatically as consumers switched to 4G services (Figure 8). The divide between three- and four-player markets appears to have been split into three phases: in 2011–2012 average latencies were lower in three-player markets; in 2013–2015 they were very similar; and after 2015 latencies fell more quickly in three-player markets (in line with the differences we see between three- and four-player markets in network speeds). By the end of 2018, latencies were 15% lower in three-player markets.
By the end of 2018, latencies were 15% lower in three-player markets.
MOBILE MARKET STRUCTURE AND PERFORMANCE IN EUROPE — LESSONS FROM THE 4G ERA

Mobile consumers in three-player European markets have benefitted from higher quality and innovation 19
Figure 8
Latencies fell more quickly in three-player markets after 2015Average latency, ms Source: GSMA analysis of data from Ookla
0
100
150
200
250
Q1 2015
Q2 2015
Q3 2015
Q4 2015
Q1 2016
Q2 2016
Q3 2016
Q4 2016
Q1 2017
Q2 2017
Q3 2017
Q4 2017
Q1 2018
Q2 2018
Q3 2018
Q4 2018
30
40
50
60
70
80
90
Three-player market Four-player market
50
Q4 2011
Q4 2012
Q4 2013
Q4 2014
Q4 2015
Q4 2016
Q4 2017
Q4 2018
MOBILE MARKET STRUCTURE AND PERFORMANCE IN EUROPE — LESSONS FROM THE 4G ERA

20 Mobile consumers in three-player European markets have benefitted from higher quality and innovation
Latency continues to be an increasingly important factor for consumers, as many services today can only be delivered with low latency. Further decreases in latency are also required to enable services such as real-time gaming and disaster alerts, as well as services we expect 5G to facilitate such as autonomous driving.
Figure 9
Bandwidth and latency requirements for 5G use cases Source: GSMA Intelligence
Disaster alert Real-time gaming
Multi-person video call
Autonomous driving
Virtual reality
Augmented reality
Tactile internet
Bi-directionalremote controlling
First responder connectivity
Video streaming
Wireless cloud-based office
Personal cloudMonitoring
sensor networks
Automotive eCall Device
remote controlling
1,000ms
100ms
10ms
1ms
<1 Mbps 1 Mbps 10 Mbps 100 Mbps >1 Gbps
Del
ay
Bandwidth throughput
Fixed Nomadic On-the-go
Services that can be delivered by legacy networks
Services that could be enabled by 5G
M2M connectivity
MOBILE MARKET STRUCTURE AND PERFORMANCE IN EUROPE — LESSONS FROM THE 4G ERA

Mobile consumers in three-player European markets have benefitted from higher quality and innovation 21
2.2 4G coverage
Irrespective of market type, most European operators had achieved 80% 4G population coverage by mid-2015 and 90% by the end of 2016 (see Figure 10). The gap in network quality between three- and four-player markets only emerged after 4G coverage reached these levels of penetration.
The difference in 4G coverage between three- and four-player markets during the period is relatively small. There was marginally better coverage in three-player markets for most of the period after 2012, with three-player markets reaching a given level of coverage faster than four-player markets. While we cannot infer much from this, the difference in average 4G coverage towards the end of the period may concern difficult but potentially important coverage areas e.g. rural locations, small towns, islands and mountainous regions. However, we would need more granular data than what we have available to us to test this, so we cannot draw conclusions here.
Figure 10
The difference in 4G coverage between the two market types is relatively small 4G coverage (average of operators within each market type), % of population Source: GSMA Intelligence
Q4 2011
Q4 2012
0%
10%
20%
30%
40%
50%
60%
70%
80%
90%
100%
Q4 2013
Q4 2014
Q4 2015
Q4 2016
Q4 2017
Q4 2018
Three-player market Four-player market
MOBILE MARKET STRUCTURE AND PERFORMANCE IN EUROPE — LESSONS FROM THE 4G ERA

2.3 Prices
22 Mobile consumers in three-player European markets have benefitted from higher quality and innovation
In addition to general improvements in performance and fast provision of 4G to at least 90% of the population, we are also able to show that, in respect of some metrics, prices have decreased across Europe, indicating better value for consumers over time.
We had access to information on average prices per MB from a limited time-series, so the average calculations could be distorted by extremely high or low unit prices. However, the data we were able to analyse suggests that unit prices have decreased significantly in both three- and four-player markets (see Figure 11).
Figure 11
Prices have fallen across Europe in both market types Average revenue per MB, Euros10 Source: GSMA Intelligence
10 The data used in this chart is limited due to the availability of data on consumer data usage at an operator level: the average number of operators reporting ARPMB is 22 per quarter across Europe (compared to our total sample of 99 operators). Furthermore, not all operators report data in each quarter, so the trend in Figure 11 will compare different operators in certain quarters. We restricted the sample to include operators that had data for more than half of the time period, but the overall trend is similar.
Q4 2012
Q4 2013
Q4 2014
Q4 2015
Q4 2016
Q4 2017
Q4 2018
0.00
0.01
0.02
0.03
0.04
0.05
0.06
Three-player market Four-player market
MOBILE MARKET STRUCTURE AND PERFORMANCE IN EUROPE — LESSONS FROM THE 4G ERA

Mobile consumers in three-player European markets have benefitted from higher quality and innovation 23
Notably, there appears to be no significant difference, considering the scale of the unit price as well, between the two market types from 2015 onwards. Two trends have contributed to the reduction in the average revenue per MB: a reduction in overall prices (using ARPU as a proxy) and an increase in data usage among consumers. ARPU, which takes into account consumer usage as well, has also decreased during the 4G era, most significantly in the 2011–2015 period. Meanwhile, average data usage per user has increased 12-fold between 2011 and 2018 (see Figure 13).
Figure 12
ARPU levels also decreased during the 4G eraAverage revenue per user, Euros Source: GSMA Intelligence
Figure 13
Data usage per monthGB per user per month Source: Ericsson*
Q4 2011
Q4 2012
Q4 2013
Q4 2014
Q4 2015
Q4 2016
Q4 2017
Q4 2018
14
15
16
17
18
19
20
1
2
3
4
5
6
7
0
2011
2012
2013
2014
2015
2016
2017
2018
Three-player market Four-player market
* Based on data for western, central and eastern Europe
MOBILE MARKET STRUCTURE AND PERFORMANCE IN EUROPE — LESSONS FROM THE 4G ERA

3. Investment has remained strong despite economic headwinds
MOBILE MARKET STRUCTURE AND PERFORMANCE IN EUROPE — LESSONS FROM THE 4G ERA

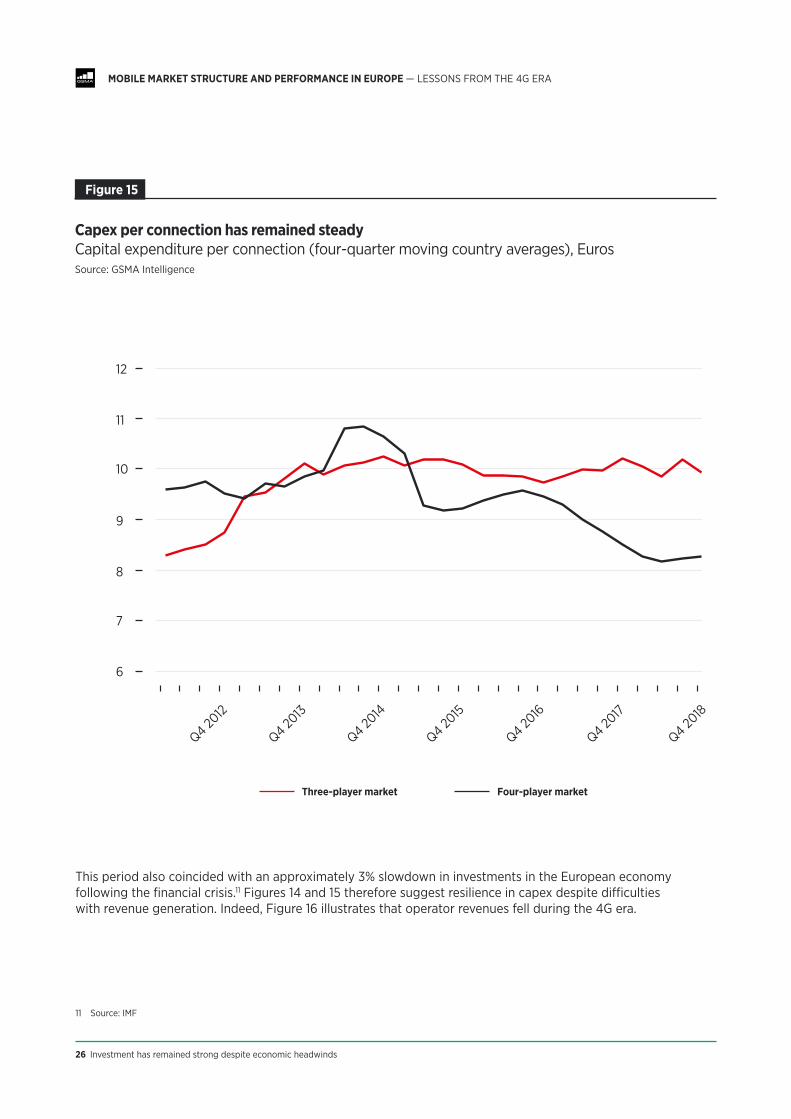
In the past, investment has been used as a proxy for the mobile industry’s performance, particularly to measure network quality and innovation. While it is preferable to consider actual outcomes (such as download speeds and coverage levels) than inputs (such as investment), we also assess operator investment by measuring changes in capital expenditure. Capital expenditure as a percentage of revenue has increased on average during the 4G era, peaking in 2015, to deliver coverage to European consumers. From 2013, capex as a proportion of revenue was greater in three-player markets than in four-player markets (see Figure 14). Investment growth (as a percentage of revenues) helped operators meet increasing demand for 4G over the period, as shown by the fact that capital expenditure per connection has remained steady over the 4G era, as seen in Figure 15.
Investment has remained strong despite economic headwinds 25
Figure 14
Capex as a proportion of revenue has been higher in three-player markets since 2013Capital expenditure as a % of revenue (country averages) Source: GSMA Intelligence
Three-player market Four-player market
Q4 2011
Q4 2012
Q4 2013
Q4 2014
Q4 2015
Q4 2016
Q4 2017
Q4 2018
10%
11%
12%
13%
14%
15%
16%
17%
18%
19%
20%
MOBILE MARKET STRUCTURE AND PERFORMANCE IN EUROPE — LESSONS FROM THE 4G ERA
26 Investment has remained strong despite economic headwinds
Figure 15
Capex per connection has remained steady Capital expenditure per connection (four-quarter moving country averages), Euros Source: GSMA Intelligence
This period also coincided with an approximately 3% slowdown in investments in the European economy following the financial crisis.11 Figures 14 and 15 therefore suggest resilience in capex despite difficulties with revenue generation. Indeed, Figure 16 illustrates that operator revenues fell during the 4G era.
11 Source: IMF
Q4 2012
Q4 2013
Q4 2014
Q4 2015
Q4 2016
Q4 2017
Q4 2018
Three-player market Four-player market
6
7
8
9
10
11
12
MOBILE MARKET STRUCTURE AND PERFORMANCE IN EUROPE — LESSONS FROM THE 4G ERA

Investment has remained strong despite economic headwinds 27
Figure 16
Capex remained healthy despite declining revenuesCapital expenditure and revenue (Index = 100 in 2011) Source: GSMA Intelligence
Taking into account the improving market performance of operators (as evidenced earlier), the relative stability in investment suggests operators have become more efficient at delivering higher speeds and lower latencies.
2011
2012
2013
2014
2015
2016
2017
2018
120
115
110
105
100
95
90
85
80
Capex Revenue
MOBILE MARKET STRUCTURE AND PERFORMANCE IN EUROPE — LESSONS FROM THE 4G ERA

4. Market concentration in Europe decreased – even though the number of operators fell
MOBILE MARKET STRUCTURE AND PERFORMANCE IN EUROPE — LESSONS FROM THE 4G ERA

The number of players tells us how many competitors exist in a market, but it does not tell us the size of those firms and whether the market is evenly distributed or skewed (i.e. more concentrated) in favour of certain operators. Therefore, we consider a commonly used market concentration index, the Herfindahl-Hirschman Index,12 which carries values between 0 and 10,000, with increasing values suggesting a higher level of market concentration.
Market concentration in Europe decreased – even though the number of operators fell 29
Figure 17
Market concentration decreased overall during the 4G era HHI Source: GSMA Intelligence
12 The index is formed by summing the squares of individual operator market shares within each market — the functional form has the impact of skewing higher results to markets where individual operators have very high market shares. This data was based on market shares (by connections) available on the GSMA Intelligence portal.
3,500
3,400
3,300
3,200
3,100
3,000
Q4 2011
Q4 2012
Q4 2013
Q4 2014
Q4 2015
Q4 2016
Q4 2017
Q4 2018
MOBILE MARKET STRUCTURE AND PERFORMANCE IN EUROPE — LESSONS FROM THE 4G ERA

30 Market concentration in Europe decreased — even though the number of operators fell
Figure 18
Market shares of operators in European markets are converging*Average market share across European markets, % of connections Source: GSMA Intelligence
European mobile markets reduced in concentration over the study period, suggesting they have become more equally distributed in terms of market share. We can also see this in Figure 18, where the average market shares of the top two operators at the start of 2011 steadily decreased while operators that were third and fourth (in 2011) increased their market shares. This increase was particularly driven by four-to-three mergers in Austria, Germany, Ireland and Italy, where the fourth operator merged with a larger operator. However, it also reflects a general trend — including in markets where there was no merger — for most of Europe's third and fourth operators in 2011.
* The chart shows the evolution of average market shares based on operators’ market positions at the start of 2011 (i.e. an operator that was the fourth largest in 2011 is categorised as a fourth operator throughout the entire period).
50%
40%
30%
20%
10%
0%
Q4 2011
Q4 2012
Q4 2013
Q4 2014
Q4 2015
Q4 2016
Q4 2017
Q4 2018
1st operator 2nd operator 3rd operator 4th operator
MOBILE MARKET STRUCTURE AND PERFORMANCE IN EUROPE — LESSONS FROM THE 4G ERA

Market concentration in Europe decreased – even though the number of operators fell 31
MOBILE MARKET STRUCTURE AND PERFORMANCE IN EUROPE – LESSONS FROM THE 4G ERA
Concentration in European mobile markets decreased over the study period, suggesting they have become more equally distributed in terms of market share.

5. Recent studies support economic theory that mobile consolidation can lead to improved outcomes
Historically, competition has been measured using indicators such as the number of players or market concentration (e.g. market shares and HHI). However, the relationship between the number of players and outcomes (including quality, innovation, prices and consumer welfare) is complex. Economic theory suggests that an increase in concentration can have both positive and negative effects, and that it depends on the particular circumstances, the incentives of players and consumer attitudes to products and services.
Lower market concentration indices can be associated with greater incentives to reduce prices and improve quality of service.13 But concentration levels that are too low can generate dynamics that cancel out these positive competitive effects.14 In particular, market structures with a larger number of operators can undermine the scale of operators, push up average deployment costs, and decrease margins and returns on investment. This can reduce the ability and incentive to invest in network quality improvements and innovation and limit operators’ ability to minimise costs.
The latest empirical research has shown that having fewer operators in a market can lead to more investments for operators,15 and no study to date has found that higher market concentration reduces operator investment. Other recent empirical studies have also found a positive impact of mergers, operator scale and more concentrated markets on network coverage and speeds.16 Building on these studies, this report has looked at the impact of competition on non-price outcomes in the mobile market in Europe more generally.
13 Motta, Tarantino 2017, “The effect of horizontal mergers: when firms compete in prices and investments” and Federico, Langus, Valletti 2018, “Horizontal Mergers and Product Innovation”
14 Noting that firms in higher concentrated markets may engage in business expansion: Jullien, Lefouili 2018, “Horizontal mergers and innovation” and Bourreau, Jullien 2017, “Mergers, investments and demand expansion”
15 Genakos, Valletti, Verboven 2018, “Evaluating market consolidation in mobile communications”
16 This includes the evaluation of a European merger in Austria and a study looking at investment, network quality and market structure in Central America. See: An evaluation of the Hutchison/Orange merger in Austria and Driving mobile broadband in Central America
32 Recent studies support economic theory that mobile consolidation can lead to improved outcomes
MOBILE MARKET STRUCTURE AND PERFORMANCE IN EUROPE — LESSONS FROM THE 4G ERA

Recent studies support economic theory that mobile consolidation can lead to improved outcomes 33
Figure 19
Summary of assumed outcomes under higher market concentration17 Source: GSMA Intelligence
Study Quality and Innovation
Investment Price Scope
Motta, Tarantino, (2017)
NA Lower Higher Theoretical
Federico, Langus, Valletti, (2018)
NA Ambiguous NA Theoretical
Jullien, Lefouili (2018)
NA Ambiguous NA Theoretical
Bourreau, Jullien (2017)
NA Higher Higher Theoretical
Genakos, Valletti, Verboven, (2018)
NA Higher per operator, inconclusive at market level
Higher (basket price)
OECD countries, 2002–2014
GSMA (2017) Higher NA NA Austria, 2012 merger
GSMA (2019) Higher ‘Inverted-U’ NA Latin America, 2013–2016
Houngbonon and Jeanjean (2016)
NA ‘Inverted-U’ at operator level
NA 110 operators, 2005–2012
HSBC (2015) NA 'Inverted-U' at operator level
66 markets, 2003–2013
WIK (2015) NA No effect NA 12 European and non-EU countries, 2005–2013
DG Comp (2015) NA NA Higher (basket price)
Netherlands, 2007 merger
RTR (2016) NA NA Higher (basket price)
Austria, 2012 merger
Houngbonon (2015)
NA NA Lower (unit price)
Austria, 2012 merger
HSBC (2015)
NA NA Lower (unit price)
Austria, 2012 merger
17 A more detailed literature review in Fruits, Hurwitz, Manne, Morris and Stapp, A Review of the Empirical Evidence on the Effects of Market Concentration and Mergers in the Wireless Telecommunications Industry (ICLE, 2019)
MOBILE MARKET STRUCTURE AND PERFORMANCE IN EUROPE — LESSONS FROM THE 4G ERA

6. Our econometric analysis supports the trends on download speeds and investment
MOBILE MARKET STRUCTURE AND PERFORMANCE IN EUROPE — LESSONS FROM THE 4G ERA

Our econometric analysis supports the trends on download speeds and investment 35
The trends we looked at earlier in this report indicated a difference in performance between three- and four-player markets during the 4G era after networks had been deployed to most of the population. However, this could have been caused by a variety of factors unrelated to the number of operators (or level of concentration) in the market.
Econometric analysis allows us to estimate the impact of market concentration on market outcomes, such as performance and investment, while controlling for effects that we are not studying. In effect, it isolates the impact of market structure from other possible contributing factors and allows us to test the causal effect of market concentration on market outcomes. This is important because trends suggest a correlative relationship between two factors, but the cause may be a result of many other factors. This is particularly true when looking at a trend over time.
Other important factors that could have an impact on performance and investment include the amount of spectrum available to the market for mobile services, the population density of the market and the average income level.
Figure 20
Factors included in econometric models Source: GSMA Intelligence
Supply-side factors Demand-side factors
Operator capital investment
Deployment costs:
• Proportion of population that is rural
• Geography*
• Technological process**
Spectrum assignment:
• Amount of spectrum assigned
• Time at which spectrum was assigned to operator
Market structure:
• Whether market has three or four players
• Competition index using HHI and Lerner Index
Demand characteristics:
• Per capita income (willingness to pay, digital skills)
* Factor included in country fixed effects** Factor included in time trend
We find that our econometric analysis supports the patterns observed in the trends on download speeds. After operators reach 90% 4G coverage, we find that download speeds are 3.3 Mbps greater in three-player markets compared with four-player markets. We also observed that upload speeds could be 0.8 Mbps greater, but the result was not statistically significant.
MOBILE MARKET STRUCTURE AND PERFORMANCE IN EUROPE — LESSONS FROM THE 4G ERA

36 Our econometric analysis supports the trends on download speeds and investment
Figure 21
Empirical results for download speedsAverage download speeds, Mbps Source: GSMA analysis of data from Ookla
* The simulation presented in this chart is based on comparing two predictions of our econometric model: one where four-player markets are kept as they are and one where they are assumed to be three-player markets.
40
35
30
25
20
15
Q4 2011
Q4 2012
Q4 2013
Q4 2014
Q4 2015
Q4 2016
Q4 2017
Q4 2018
10
5
0
Four-player market Four-player market (simulation as three-players)
MOBILE MARKET STRUCTURE AND PERFORMANCE IN EUROPE — LESSONS FROM THE 4G ERA

Our econometric analysis supports the trends on download speeds and investment 37
This result holds true when we consider market concentration metrics, including HHI. Once an operator’s 4G coverage reaches 90%, every increase of 1,000 points in HHI leads to a 4.4 Mbps increase in overall download speeds. The average difference between three- and four-player markets was approximately 780 in HHI, suggesting that three-player markets achieved average download speeds 3.5 Mbps greater than four-player markets, which is similar to the result found in the comparison between three- and four-player markets.
While we do not have the data to fully assess the impact of network sharing, we have carried out analysis that suggests network performance in four-player markets with network sharing is short of that associated with full integration (see Annex 2).
We did not find any statistically significant impact of market structure and concentration on upload speeds or latency. The latter is, to some extent, to be expected because, unlike capacity (and therefore speeds), operators cannot fully control latency performance for consumers. Latency depends on the location of the customer and the server from which the customer is demanding data. This can only be partially controlled by operators through the densification of base stations, increases in capacity to avoid queuing of data packets at network switches and the deployment of content distribution networks closer to customers.
Similarly, we did not find any statistically significant impact on 4G coverage. By the end of 2018, most countries had 4G coverage in excess of 90%, regardless of whether it was a three- or four-player market. Therefore, the testing would be based on the pace of coverage rollout, rather than the absolute result. However, we did not find any significant impact of market concentration on coverage in our analysis.
In terms of investment, our econometric analysis points towards strong evidence of a link between more concentrated markets and increased capex per operator, including when other relevant factors are controlled for. This is in line with much of the existing literature discussed in the previous section. Our analysis also finds evidence that operators invest more when their margins increase, which may be one of the reasons why we observe better network quality in more concentrated markets. This result is robust to methods that take into account the direction of effect and, in particular, whether greater margins lead to increased investment or whether higher investment increases margins.
We did not have enough data on unit pricing to undertake a conclusive econometric analysis of market concentration on prices. Our results on pricing are therefore limited, but they suggest no correlation or statistically significant link between market structure and consumer prices.
MOBILE MARKET STRUCTURE AND PERFORMANCE IN EUROPE — LESSONS FROM THE 4G ERA

The 4G era was an expansive one for the European mobile industry. By 2016, 90% of European consumers were covered by 4G networks, and significant improvements to speeds and latencies resulted in a superior consumer experience. The average price per MB also dropped sharply as mobile data became cheaper and users consumed ever-increasing volumes of data.
This study shows that European mobile users in three-player markets benefitted the most from higher quality and innovation. By the end of 2018, three-player markets were outperforming four-player markets by 4.5 Mbps in download speeds. Our econometric analysis shows that over half of that difference (3.3–3.5 Mbps) can be attributed to the role of market structure in three-player markets, accounting for other factors. This is an important finding because it attributes a significant premium in performance to markets with more concentrated market structures that is both statistically significant and tangible for the end-user experience. When combined with the observed faster 4G rollouts and lower latencies (around 15% lower by the end of 2018) in three-player markets, this paints a compelling picture of superior consumer experience on average in three-player markets compared with four-player markets in Europe.
In addition to general improvements in performance, prices have also decreased across Europe, indicating more efficiency and better value for consumers over time. While our analysis does not focus on price effects, we have used the data available to us to chart some measures of how prices have evolved during the 4G era. In particular, our analysis shows that implicit
unit prices (i.e. revenue per MB and revenue per user) have decreased significantly in both three- and four-player markets. In other words, we can demonstrate that a European consumer in a three-player market during the 4G era would have on average experienced a better quality mobile broadband service while paying similar prices per MB of data to those in a four-player market.
Improvements in network performance were enabled by continued operator investment, despite falling revenues and economic headwinds. We find evidence that more concentrated markets yield greater investment per operator. However, investments alone are unlikely to explain the comparatively better performance of three-player markets. From our analysis, it is plausible to infer that operators in more concentrated markets were able to achieve greater efficiency, making better use of their investments and resources, including scarce resources such as spectrum and sites.
Finally, it is important to reflect on the insights that this study has for policymakers setting out to promote high-performing 5G networks in Europe over the coming years.
38 Conclusions
7. Conclusions
MOBILE MARKET STRUCTURE AND PERFORMANCE IN EUROPE — LESSONS FROM THE 4G ERA

Conclusions 39
First, the study shows that during the 4G era there were two phases in the evolution of networks. Operators competed to provide coverage to most of the population, with more concentrated markets deploying 4G more quickly. Once coverage reached 90% of the population, the focus of competition between operators became network capacity, as evidenced by fast improvements in speeds. At that point, we begin to see better performance in three-player markets.
Second, three-player markets in Europe during the 4G era delivered better network quality. This is an especially important insight when considering the best ways to unlock the full potential of 5G networks, including improvements to productivity through supporting different vertical industries and advanced applications that require very low latencies, high speeds and plenty of network capacity.
Finally, our analysis cannot attribute the better performance of three-player markets totally and unequivocally to greater investment. We find strong evidence of operator investment being greater in more concentrated markets, but the results also attribute an important role to the greater efficiency in three-player markets in the use of resources, including spectrum and sites. The analysis carried out in Annex 2 on the sensitivity of our analysis to different definitions of three-player markets also seems to provide partial support to this theory, since it shows that progressively deeper levels of network integration deliver improved performance, while coming short of full integration in terms of average performance. Therefore, it is reasonable to infer that a key aspect to improved performance is to ensure operators can optimise the use of assets, including spectrum, sites and towers. Dispersion of these among a greater number of players can result in less efficient use of resources, which can translate into lower network performance, to the detriment of users. Policies aimed at increasing the number of players in a market therefore risk slowing, rather than accelerating, innovation.
1.
2.
3.
Key insights

40 Annex 1: Data, methodology and econometrics results
Annex 1: Data, methodology and econometrics results
Table A1: Summary statistics
Variable Source Observations Mean Standard Deviation
Minimum Maximum
Average download speeds (Mbps)
Speedtest Intelligence, Ookla
2,964 18.10 14.28 0.19 77.81
Average upload speeds (Mbps)
Speedtest Intelligence, Ookla
2,964 6.86 5.18 0.08 27.44
Average latency (ms)
Speedtest Intelligence, Ookla
2,964 112.15 88.10 19.46 654.83
Capex per connection (Euros)
GSMA Intelligence
1,825 10.57 18.45 0.20 638.32
Share of population in rural areas (%)
World Bank 3,038 26.63 12.43 2.00 47.12
GDP per capita (euros, chain linked volumes 2010)
Eurostat 3,035 6985.67 4470.38 1100 20800
Total spectrum holdings (MHz)
GSMA Intelligence
3,038 648.34 161.52 226.4 870
4G coverage GSMA Intelligence
2,292 0.75 0.28 0.02 1
HHI GSMA Intelligence
3,038 3275.90 505.36 2330 4620
EBITDA GSMA Intelligence
1,986 0.27 0.14 -0.89 0.6
Data
MOBILE MARKET STRUCTURE AND PERFORMANCE IN EUROPE — LESSONS FROM THE 4G ERA

Annex 1: Data, methodology and econometrics results 41
Table A2: Scope of operators and countries, Q2 2011 to Q4 2018
Country Number of operators Country Number of operators
Austria 4 -> 3 Lithuania 3
Belgium 3 Luxembourg 3
Bulgaria 3 Malta 3
Croatia 3 Netherlands 3 -> 4*
Czech Republic 3 Norway 3**
Denmark 4 Poland 4
Estonia 3 Portugal 3
Finland 3 Romania 4
France 3 -> 4 Slovakia 3 -> 4
Germany 4 -> 3 Slovenia 4
Greece 3 Spain 4
Hungary 3 Sweden 4
Ireland 4 -> 3 Switzerland 3
Italy 4 -> 3*** United Kingdom 4
Latvia 3
* In January 2019, Tele2 and Deutsche Telekom completed a merger in the Netherlands. However, as our analysis covers the period to Q4 2018, we do not incorporate the effects of the merger.
** Norway experienced a merger (3 to 2) which was immediately followed by the expansion of a new third player (2 to 3).
*** Following the merger in Italy between Hutchison and Wind, a new entrant (Iliad) entered the market in 2018. However, it only became a significant player in 2019. For simplicity, we leave Italy as a three-player market at the end of our analysis.
MOBILE MARKET STRUCTURE AND PERFORMANCE IN EUROPE — LESSONS FROM THE 4G ERA

42 Annex 1: Data, methodology and econometrics results
Our starting econometric method is a basic OLS panel estimation with the following functional form:
Methodology
Where:
yi,c,t is a performance or investment outcome of an operator i in country c in quarter t (e.g. download speeds, upload speeds, latencies), representing the outcomes of mobile market investment.
Cc and Tt are country and time fixed effects – they capture any unobserved variation in consumer outcomes that can be attributed to specific characteristics of each country (e.g. geography and topology) and year (e.g. technology upgrades and new handset releases).
Xict is a set of control variables that predict changes in consumer outcomes. These might vary for each consumer outcome but generally include aspects such as income per capita, rural population share and spectrum holdings.
Zct is the market concentration measure – either the number of operators or HHI for country c and quarter t. We also leveraged operators’ EBITDA margins as a measure of competition, as an approximation of the Lerner index of market power. This also provides insights into the link between profitability and consumer outcomes and investment.
Our model is based at the operator level, as opposed to the country level, so that we can maximise the number of observations used and use the variation between operators within countries to drive results.
Using an operator-level model means we can use country fixed effects and country-specific trends to control for unobserved factors in individual countries (and over time within those countries). The control variables are as follows:
• GDP per capita: measuring income levels captures the potential differences in demand for mobile services.
• Rural population share: sparsely populated countries are harder to provide coverage to than more densely populated countries. In addition, providing capacity to rural areas is harder than for urban areas, due to greater requirements to invest in backhaul. This measure is preferred to population density because of the anomalies of uninhabited land. We note that the drawback of rural population share estimates (from Eurostat) is that each country carries its own definition of rural areas.
• Total country spectrum holdings: spectrum is a key part of the capacity available to operators. While we could include spectrum holdings at the operator level, one of the reasons why operators in more concentrated markets could potentially deliver better network quality or coverage is that spectrum resources are less dispersed between operators. As we want to capture this effect when assessing market structure, we have used total country spectrum holdings by technology (e.g. 4G or 3G or all).
We note that GDP per capita, rural population share and total country spectrum holdings are operator-invariant within countries. These control variables will therefore be affected by the use of country fixed effects.
(1) yi,c,t = α + γc Cc + λt Tt + ∑ μict Xict + ρct Zct +εi,c,ti,c,t =1
I,C,T
MOBILE MARKET STRUCTURE AND PERFORMANCE IN EUROPE — LESSONS FROM THE 4G ERA

Annex 1: Data, methodology and econometrics results 43
A variation of equation 1 continues with OLS panel estimation but takes the functional form:
Where:Mict is a dummy variable which takes a value of 1 for operator o if it has achieved 4G coverage for 90% of the population.
In model (2), we interact the 4G 90% coverage dummy variable with the other market concentration variables. There are therefore two coefficient results from the regression: ρct as the coefficient for the relationship between market concentration and outcomes before 90% 4G coverage is achieved and ρct + δct as the coefficient for the relationship between market concentration and outcomes after 90% 4G coverage is achieved. We ran this model for network quality measures based on the observed trends, which suggested that the difference between three- and four-player markets emerged once 4G coverage had been mostly rolled out. There was less of an obvious break in the case of investment, so our primary model did not make this distinction when we analysed capex.18
When using HHI as a measure of concentration, it is well acknowledged that it can be affected by market outcomes as much as market outcomes are affected by market concentration. This two-way causality issue can be addressed by using instruments in place of HHI. Our model for the first-stage regression is:
From which fitted values of Zct are used in the second stage:
Selecting instruments for first-stage model (3a) involves ensuring that any instrument is correlated with Zct but not with the error term from the second stage regression Ԑi,c,t . We selected Hct as the transformation of the share of spectrum holdings from the previous generation i.e. when assessing 4G outcomes, we used the share of 3G spectrum holdings.19 As 3G spectrum was typically auctioned in the 2000s, it should not be affected by the market share of operators today, but it undoubtedly formed the basis of market concentration going into the 4G era.
When we leveraged the Lerner Index as a measure of market power in our regression analysis, we used as an instrument the amount of time since the operator launched its first network in the country. The more years since launch, the higher the value of the Lerner Index that we would expect, since more time in the market may provide more efficient operations, scale and knowledge, impacting both operator costs and product differentiation or substitutability. This instrument was used to estimate fitted values for Zct, which was in turn used in a regression on consumer outcomes.
18 As a sensitivity, we did run the capex analysis using model 2, but the results confirmed there was no statistically significant result after operators had achieved 90% coverage compared with the results using model 1.
19 We recreated an index of HHI using 3G spectrum shares instead of market shares and then employed a 2SLS approach using this as an instrument for HHI.
(3a) Zct = α + ηct Hct + νct Mct + ωi,c,t
(3b) yi,c,t = α + γc Cc + λ t Tt + ∑ μict Xict + ρct Zct + εi,c,ti,c,t =1
I,C,T
(2) yi,c,t = α + γc Cc + λt Tt + ∑ μict Xict + ρct Zct + δct Mict Zct + εi,c,ti,c,t =1
I,C,T
MOBILE MARKET STRUCTURE AND PERFORMANCE IN EUROPE — LESSONS FROM THE 4G ERA

44 Annex 1: Data, methodology and econometrics results
Table A3: Three-player market impact (OLS with fixed effects)
Network quality results
OLS-FE Download speeds
OLS-FE Upload speeds
OLS-FE Latency
Share of rural population 10.23 (11.41) 0.260 (2.072) 28.39 (40.75)
GDP per capita (log) 14.57*** (3.591) 5.518*** (1.437) -43.34*** (14.46)
Spectrum holdings 0.00890** (0.00345) 0.00496*** (0.00113) -0.182*** (0.0227)
Post 90% coverage 3.177*** (0.786) 1.165** (0.425) -7.971 (9.455)
Three-player -0.0471 (1.623) 0.435 (0.332) -16.14 (12.09)
Three-player (post 90% coverage) 3.350* (1.809) 0.782 (0.564) 1.381 (10.65)
Constant -588.0 (514.1) -58.88 (87.66) -621.2 (1874.0)
R2 0.817 0.802 0.736
Number of observations 2961 2961 2961
Number of clusters 29 29 29
*** p<0.01, ** p<0.05, * p<0.1. Country-clustered standard errors in parentheses. Includes country fixed effects and country-specific year trends.
Table A4: Market concentration impact (instrumental variables with fixed effects)
IV-FE Download speeds
IV-FE Upload speeds
IV-FE Latency
Share of rural population 10.90 (10.96) -0.565 (2.409) 43.57 (43.04)
GDP per capita 14.60*** (3.525) 5.574*** (1.430) -45.32*** (15.64)
Spectrum holdings 0.00885** (0.00345) 0.00513*** (0.00122) -0.184*** (0.0236)
Post 90% coverage -9.100 (7.392) 0.953 (2.789) 16.00 (50.84)
HHI -0.000328 (0.00582) -0.00249 (0.00259) 0.0482 (0.0669)
HHI (post 90% coverage) 0.00443* (0.00256) 0.000217 (0.000902) -0.00731 (0.0153)
Constant -617.6 (497.9) -11.67 (108.4) -1501.1 (2098.7)
Number of observations 2761 2761 2761
Number of clusters 29 29 29
*** p<0.01, ** p<0.05, * p<0.1. Country-clustered standard errors in parentheses. Includes country fixed effects and country-specific year trends.
MOBILE MARKET STRUCTURE AND PERFORMANCE IN EUROPE — LESSONS FROM THE 4G ERA

Annex 1: Data, methodology and econometrics results 45
Table A5: Market power impact (instrumental variables with fixed effects)
IV-FE Download speeds
IV-FE Upload speeds
IV-FE Latency
Share of rural population 12.11 (14.18) -0.160 (2.031) 74.09 (58.98)
GDP per capita 19.84*** (3.218) 6.994*** (0.972) -67.67*** (23.63)
Spectrum holdings 0.00462 (0.00472) 0.00381*** (0.00135) -0.174*** (0.0278)
Lerner Index 33.12*** (9.892) 9.415*** (3.109) -62.48 (97.09)
Constant -726.7 (654.6) -54.16 (92.64) -2497.0 (2668.2)
Number of observations 1911 1911 1911
Number of clusters 29 29 29
*** p<0.01, ** p<0.05, * p<0.1. Country-clustered standard errors in parentheses. Includes country fixed effects and country-specific year trends.
MOBILE MARKET STRUCTURE AND PERFORMANCE IN EUROPE — LESSONS FROM THE 4G ERA

46 Annex 1: Data, methodology and econometrics results
Table A6: Three-player market impact (OLS with fixed effects) and market concentration impact (instrumental variables with fixed effects)
Network coverage results
OLS-FE 4G coverage
IV-FE 4G coverage
IV-FE 4G coverage
Share of rural population -0.161 (0.117) -0.151 (0.114) -0.133 (0.198)
GDP per capita (log) 0.146*** (0.0353) 0.147*** (0.0342) 0.250** (0.101)
Spectrum holdings (4G) 0.000427*** (0.000104)
0.000419*** (0.0000992)
0.000491*** (0.000123)
2-4 years since acquiring 4G spectrum
0.175*** (0.0205) 0.175*** (0.0199) 0.204*** (0.0354)
4 years plus since acquiring 4G spectrum
0.277*** (0.0275) 0.277*** (0.0264) 0.323*** (0.0476)
Three-player -0.00726 (0.0473)
HHI 0.0000490 (0.0000850)
Lerner Index 1.758* (1.017)
Constant 6.215 (5.350) 5.545 (5.273) 3.165 (8.934)R2 0.770
Number of observations 2248 2248 1383
Number of clusters 29 29 28
*** p<0.01, ** p<0.05, * p<0.1. Country-clustered standard errors in parentheses. Includes country fixed effects and country-specific year trends.
MOBILE MARKET STRUCTURE AND PERFORMANCE IN EUROPE — LESSONS FROM THE 4G ERA

Annex 1: Data, methodology and econometrics results 47
Table A7: Three-player market, market concentration and market power impact on investment per operator (OLS with fixed effects)
Investment per operator results
OLS-FELog capex per operator
OLS-FELog capex per operator
OLS-FELog capex per operator
Share of rural population -0.442 (0.506) -0.377 (0.585) -0.492 (0.596)
GDP per capita 0.788 (0.571) 0.775 (0.570) 0.837 (0.531)
Spectrum holdings 0.000378 (0.000270) 0.000413 (0.000271) 0.000641** (0.000266)
Three-player 0.260 (0.158)
HHI 0.00197*** (0.000580)
HHI squared -0.000000231*** (8.32e-08)
Lerner Index 2.166*** (0.273)
Lerner Index squared -0.210*** (0.0240)
Constant 29.48 (25.16) 22.75 (28.55) 30.86 (28.55)R2 0.790 0.791 0.822
Number of observations 1821 1821 1731
Number of clusters 28 28 28
*** p<0.01, ** p<0.05, * p<0.1. Country-clustered standard errors in parentheses. Includes country fixed effects and country-specific year trends.
MOBILE MARKET STRUCTURE AND PERFORMANCE IN EUROPE — LESSONS FROM THE 4G ERA

48 Annex 1: Data, methodology and econometrics results
Table A8: Market concentration and market power impact on investment per operator (IV with fixed effects)
IV-FELog capex per operator
IV-FELog capex per operator
Share of rural population 0.0194 (0.658) -0.162 (1.072)
GDP per capita 0.765 (0.557) 0.896 (0.662)
Spectrum holdings 0.000440 (0.000320) 0.00116*** (0.000438)
HHI 0.00117 (0.000757)
Lerner 10.78** (4.636)
Constant 4.466 (33.65) 11.91 (48.06)
Number of observations 1821 1660
Number of clusters 28 28
*** p<0.01, ** p<0.05, * p<0.1. Country-clustered standard errors in parentheses. Includes country fixed effects and country-specific year trends.
MOBILE MARKET STRUCTURE AND PERFORMANCE IN EUROPE — LESSONS FROM THE 4G ERA

Annex 1: Data, methodology and econometrics results 49
MOBILE MARKET STRUCTURE AND PERFORMANCE IN EUROPE — LESSONS FROM THE 4G ERA

50 Annex 2: Network-sharing sensitivities
Annex 2: Network-sharing sensitivities
Our core result is based on a split between three- and four-player markets. As a simple split of data, we recognise the inherent difficulty in defining how many competing networks there are. The simple form involved counting the number of mobile network operators who had enough national scale; for the purposes of this exercise, we set the minimum threshold for that scale to be at least 3% of total market connections.20 This was to ensure that we only took into account operators with a significant presence in the national market. It also meant that the operators in our sample had sufficient data (especially on network quality). The operators included in our analysis accounted for more than 99% of mobile connections in the 29 countries over the period.
In addition, when looking at the performance of different markets, we considered the impact of network sharing on our definition of three- and four-player markets. There are a variety of network-sharing arrangements, including a full core network share that includes spectrum sharing, hybrid models of RAN and core network shares, simple RAN network shares, and passive network shares.
We define a three-player market as one with three mobile network operators that have commercial independence. As shown in Figure A1, we find that successive inclusion of deeper network shares was associated with improved network performance for four-player markets during the 4G era – though still below that achieved by three-player markets. However, it was not possible to test the impact of different forms of network sharing using econometric methods because of the lack of variation in the data. For example, by the end of the period almost all countries in our sample had at least some type of network-sharing agreement between operators, making it difficult to isolate the impact of different network shares against ‘pure’ three- and four-player markets.
Therefore, while there is an important question around different types of network sharing and the impact on consumer outcomes (especially network quality), further analysis would require more granular data than we had on network-sharing arrangements in Europe.
20 For operators that started with market shares below 3% but increased their share above the threshold, we included them for the whole 2011–2018 period. Operators that were excluded were therefore those that never achieved a market share greater than 3%.
MOBILE MARKET STRUCTURE AND PERFORMANCE IN EUROPE — LESSONS FROM THE 4G ERA

MOBILE MARKET STRUCTURE AND PERFORMANCE IN EUROPE — LESSONS FROM THE 4G ERA
Annex 2: Network-sharing sensitivities 51
Figure A1
Network-sharing sensitivities Source: GSMA Intelligence
Ave
rage
dow
nloa
d sp
eeds
(M
bps)
40
30
20
10
0
Q4 2011
Q4 2012
Q4 2013
Q4 2014
Q4 2015
Q4 2016
Q4 2017
Q4 2018
Three-player market Four-player + Passive + MORAN + MOCN
Four-player + Passive + MORAN Four-player market (excluding network sharing)

GSMA HEAD OFFICEFloor 2The Walbrook Building25 WalbrookLondon EC4N 8AFUnited KingdomTel: +44 (0)20 7356 0600Fax: +44 (0)20 7356 0601
To download this report, please visit gsma.com/mobile-market-structure-and-performance-in-europe