Mobile M2M Traffic Characteristics - Royal Institute of...
56
Master of Science Thesis Stockholm, Sweden 2009 TRITA-ICT-EX-2009:212 ANDERS ORREVAD When machines participate in communication M2M Traffic Characteristics KTH Information and Communication Technology
Transcript of Mobile M2M Traffic Characteristics - Royal Institute of...

Master of Science ThesisStockholm, Sweden 2009
TRITA-ICT-EX-2009:212
A N D E R S O R R E V A D
When machines participate in communication
M2M Traffic Characteristics
K T H I n f o r m a t i o n a n d
C o m m u n i c a t i o n T e c h n o l o g y

KUNGLIGA TEKNISKA HÖGSKOLAN
Royal Institute of Technology Date: 01/12-2009
M2M Traffic Characteristics When machines participate in communication
Anders Orrevad <orrevad(at)kth(dot)se>
Masters thesis
Examiner and academic advisor: Professor G. Q. Maguire Jr., KTH
Industrial advisor: Per Ljungberg M.Sc., Ericsson
Technical advisors: Jan Arwald, Hassan Alaoui, Vlasios Tsiatsis, Stefan Avesand

KUNGLIGA TEKNISKA HÖGSKOLAN
Royal Institute of Technology Date: 01/12-2009
Abstract
Machine-to-machine, machine-to-man, or man-to-machine (M2M) communications is expected to grow very rapidly over the next few years with an anticipated 50 billion devices being connected to broadband connections by 2020 [35]. To be able to plan and dimension for the expected (increase) in data traffic it is important to have a model for the traffic that will flow through the network.
A concept often talked about in conjunction with M2M communications is the “Internet of things”, where billions of “smart” objects are connected to the Internet and can be easily shared and used or re-used by many applications. One sub-field of M2M communications is sensor/actuator networks that are installed in households, creating automated homes by enabling home appliances to talk to each other and to applications that can be running on hosts connected to the Internet. Such sensor/actuator networks extend the uses of home appliances into completely new and exciting applications, while also potentially making homes more energy efficient by smarter management and operation of these appliances.
The thesis was proposed by and carried out at Ericsson in Kista, Sweden during the summer and fall of 2009. The academic advisor was G. Q. Maguire Jr. of the Royal Institute of Technology (KTH) and industrial advisor was Per Ljungberg at Ericsson. This thesis has an industrial focus, specifically to produce models and prototypes that benefit Ericsson as a company and the Ericsson Connected Home project. This thesis has evaluated the available standards and designed, buildt, and evaluated a prototype application for one of these standards to operate with this home gateway. Additionally, the thesis should also benefit the academic world by offering tractable models for M2M traffic that have a foundation in reality, rather than solutions in search of a problem.
Keywords: M2M, WPAN, ZigBee, 6LoWPAN, Connected Home, home automation, traffic characteristics, 802.15.4, home gateway
Sammanfattning Maskin-till-maskin, maskin-till-man, eller man-till-maskin (M2M) kommunikation förväntas växa mycket snabbt under de närmaste åren med förväntade 50 miljarder enheter anslutna till en bredbandsuppkoppling år 2020 [35]. För att kunna planera och dimensionera för den förväntade (ökningen) i datatrafik är det viktigt att ha en modell för den trafik som kommer att flöda genom nätverket.
Ett begrepp det ofta talas om i samband med M2M-kommunikation är " Internet of things ", där miljarder "smarta" objekt är anslutna till Internet och enkelt kan delas och användas på nytt sätt och av många användare. En undergrupp inom M2M-kommunikation är sensor nätverk som installeras i hushåll, för att skapa automatiserade hem där hemelektroniken kan prata med andra apparater och program som körs på datorer anslutna till Internet. Sådana sensornätverk utvidgar användningen av hushållsapparater till helt nya och spännande applikationer, samtidigt som det potentiellt göra bostäder mer energisnåla genom smartare förvaltning och drift av dessa apparater.
Detta examensarbete görs på uppdrag av Ericsson i Kista, Sverige under sommaren och hösten 2009. Akademisk rådgivare är GQ Maguire Jr från Kungliga Tekniska Högskolan (KTH) och industriell rådgivare är Per Ljungberg på Ericsson. Examensarbetet har som industriellt fokus att tillverka modeller och prototyper för att modellera trafiken i Ericssons nätverk. Examensarbetets akademiska värde är genom att erbjuda lättgörliga modeller för M2M trafik som har en grund i verkligheten, snarare än lösningar på jakt efter ett problem.
Nyckelord: M2M, WPAN, ZigBee, 6LoWPAN, Connected Home, home automation, trafikkaraktär, 802.15.4, home gateway

Acknowledgements
First and foremost I would like to thank my academic advisor and examiner Professor G. Q. Maguire Jr. for his through and constructive criticism and advice. Also I would like to thank my industrial advisor at Ericsson Per Ljungberg through which I received the thesis work. He has both given ample feedback himself and if not having the answers putting me in contact with the right people to further my work.
Further acknowledgements go to Jan Arwald for his help with security concerns and business cases, Vlasios Tsiatsis for the tools given and tackling problems with the help of his engineering expertise and Stefan Avesand for giving me access to the Connected Home Gateway and all the support making work with the goals of my thesis. Also Fredrik and Niclas Luthman at TriTech for hardware support and technology reports, George Younan for his expert programming advice and lastly Dan Peterström for letting me share an office at Ericsson with him and listening to my complaints and problems for 20 weeks.
Thank you,
Anders
ii

iii
Contents
Abstract .......................................................................................................................................................................... i Acknowledgements...................................................................................................................................................... ii Contents ....................................................................................................................................................................... iii List of figures................................................................................................................................................................ v List of equations.......................................................................................................................................................... vi List of Acronyms and Abbreviations...................................................................................................................... vii 1 Introduction......................................................................................................................................................... 1
1.1 Overview................................................................................................................................................ 1 2 Background.......................................................................................................................................................... 3
2.1 Home Gateway Initiative (HGI)........................................................................................................ 3 2.2 Ericsson Connected Home................................................................................................................. 3
2.2.1 OSGi....................................................................................................................................................... 4 2.3 The European Energy Challenge....................................................................................................... 4 2.4 Building Energy Watcher (BeyWatch) .............................................................................................. 4 2.5 Contiki.................................................................................................................................................... 5 2.6 Wireless Personal Area Network (WPAN) standards .................................................................... 5
2.6.1 IEEE 802.15.4 ...................................................................................................................................... 6 2.6.1.1 Frames ........................................................................................................................................ 6 2.6.1.2 Headers ...................................................................................................................................... 6
2.6.2 6LoWPAN............................................................................................................................................. 6 2.6.2.1 Advantages of 6LoWPAN...................................................................................................... 7 2.6.2.2 Disadvantage of 6LoWPAN................................................................................................... 7 2.6.2.3 6LoWPAN compression......................................................................................................... 7 2.6.2.4 Application layers ..................................................................................................................... 8
2.6.3 ZigBee .................................................................................................................................................... 8 2.6.3.1 Advantages of ZigBee:............................................................................................................. 9 2.6.3.2 Disadvantages of ZigBee:...................................................................................................... 10
2.6.4 Z-Wave................................................................................................................................................. 10 2.6.4.1 Advantages of Z-Wave: ......................................................................................................... 10 2.6.4.2 Disadvantages of Z-Wave: .................................................................................................... 10
2.6.5 Bluetooth Low Energy ...................................................................................................................... 10 2.6.5.1 Advantages of Bluetooth LE: ............................................................................................... 10 2.6.5.2 Disadvantages of Bluetooth LE:.......................................................................................... 10
2.7 Conclusions regarding WPAN standards....................................................................................... 11 2.8 Home gateways to WPANs.............................................................................................................. 11
2.8.1 End-to-end security............................................................................................................................ 11 2.8.1.1 IEEE 802.15.4 ........................................................................................................................ 13 2.8.1.2 6LoWPAN...............................................................................................................................13 2.8.1.3 ZigBee ...................................................................................................................................... 13 2.8.1.4 Access management and public-key cryptography ........................................................... 13
2.8.2 Aggregation ......................................................................................................................................... 14 2.8.3 Implementations of standards.......................................................................................................... 15

3 Traffic characteristics ....................................................................................................................................... 16 3.1 Parameterization of devices .............................................................................................................. 16 3.2 Confidence interval and level ........................................................................................................... 18 3.3 Traffic generation ...............................................................................................................................18 3.4 Conclusions on traffic characteristics ............................................................................................. 18
3.4.1 What traffic patterns are observed?................................................................................................. 21 4 Prototype............................................................................................................................................................ 22
4.1 Use-cases.............................................................................................................................................. 22 4.1.1 Water leak alert and response........................................................................................................... 22 4.1.2 House in sleep-mode ......................................................................................................................... 23
5 Theoretic traffic estimates ...............................................................................................................................25 5.1 Common traffic patterns................................................................................................................... 25 5.2 Water leak alert and response........................................................................................................... 26 5.3 House in sleep mode.......................................................................................................................... 26 5.4 Automated home estimate ................................................................................................................ 26
6 Hardware............................................................................................................................................................ 29 6.1 Sensinode Development Kit............................................................................................................. 29 6.2 Sentilla Perk......................................................................................................................................... 29 6.3 Moteiv tmote sky................................................................................................................................ 29
7 Connected home demo.................................................................................................................................... 30 7.1 Functional overview........................................................................................................................... 31 7.2 Demonstration configurations ......................................................................................................... 32
7.2.1 Demonstration setup A - Network initiated communication ..................................................... 32 7.2.2 Demonstration setup B – User initiated communication............................................................ 33
7.3 Design choices .................................................................................................................................... 33 8 Conclusions ....................................................................................................................................................... 34
8.1 M2M traffic calculations.................................................................................................................... 34 8.2 WPAN standards................................................................................................................................ 35 8.3 Contiki.................................................................................................................................................. 36 8.4 OSGi evaluation ................................................................................................................................. 36
9 Future work ....................................................................................................................................................... 37 9.1 KTH ..................................................................................................................................................... 37 9.2 Ericsson ............................................................................................................................................... 37 9.3 Home automation partners............................................................................................................... 37
References ................................................................................................................................................................... 38 Appendix A - ZigBee/802.15.4 headers ................................................................................................................ 40 Appendix B – Modifications to run Contiki on a Connected Home Gateway Ubuntu 7.10 image ............ 41 Appendix C – Manual for Ericsson Connected Home Gateway demonstration use-cases .......................... 42 Appendix D – SensorSky OSGi Bundle ................................................................................................................ 43 Appendix E – HttpSensor OSGi Bundle............................................................................................................... 44
iv

List of figures
Figure 1 - BeyWatch Roadmap.................................................................................................................................. 5 Figure 2 - Illustration of different operators needing their own security sphere for home automation ..... 14 Figure 3 – Implementing WPAN standards in an OSGi home gateway .......................................................... 15 Figure 4: Illustration of interference experiment................................................................................................. 20 Figure 5 - Water leak alert and response ................................................................................................................ 23 Figure 6 - House in sleep-mode (going into sleep mode) ................................................................................... 23 Figure 7 - House in sleep-mode (waking up from sleep mode) ......................................................................... 24 Figure 8 – IEEE 802.15.4 Message sequence chart for association .................................................................. 26 Figure 9 - Functional overview of demo setup ..................................................................................................... 31 Figure 10 - Layered overview of demo setup........................................................................................................ 32 Figure 13 – ZigBee ZCL payload............................................................................................................................ 40 Figure 14 – ZigBee ZCL header.............................................................................................................................. 40 Figure 15 – ZigBee APS header .............................................................................................................................. 40 Figure 16 – ZigBee NWK header ........................................................................................................................... 40 Figure 17 – 802.15.4 MAC header .......................................................................................................................... 40 Figure 18 – 802.15.4 PHY frame............................................................................................................................. 40 Figure 19 - UML diagram of SensorSky bundle ................................................................................................... 43 Figure 20 - UML diagram of httpSensor bundle .................................................................................................. 44
v

List of equations
Equation 1 - Calculate the heartbeat traffic........................................................................................................... 18 Equation 2 - Calculate the trigger traffic for non-alert type sensor devices..................................................... 18 Equation 3 – Calculate the trigger traffic for alert type sensor devices ............................................................ 18 Equation 4 – Calculate the fthreshold value for Equation 3 .................................................................................... 18
vi
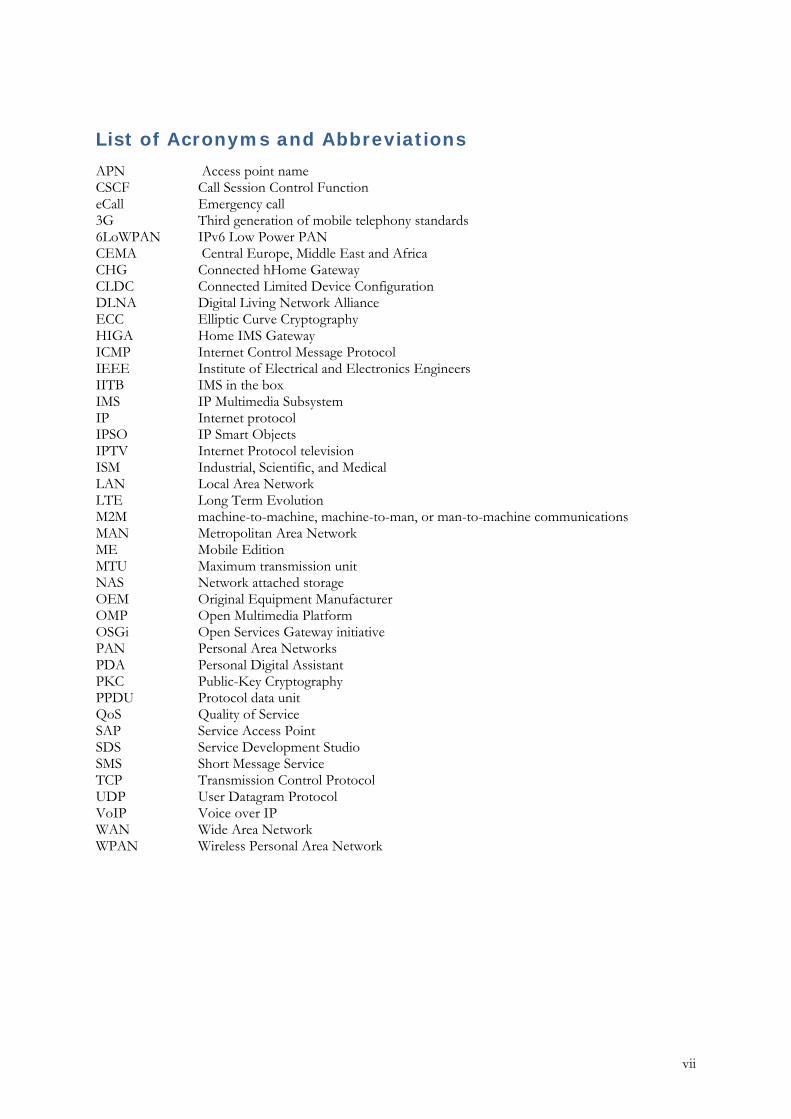
List of Acronyms and Abbreviations
APN Access point name CSCF Call Session Control Function eCall Emergency call 3G Third generation of mobile telephony standards 6LoWPAN IPv6 Low Power PAN CEMA Central Europe, Middle East and Africa CHG Connected hHome Gateway CLDC Connected Limited Device Configuration DLNA Digital Living Network Alliance ECC Elliptic Curve Cryptography HIGA Home IMS Gateway ICMP Internet Control Message Protocol IEEE Institute of Electrical and Electronics Engineers IITB IMS in the box IMS IP Multimedia Subsystem IP Internet protocol IPSO IP Smart Objects IPTV Internet Protocol television ISM Industrial, Scientific, and Medical LAN Local Area Network LTE Long Term Evolution M2M machine-to-machine, machine-to-man, or man-to-machine communications MAN Metropolitan Area Network ME Mobile Edition MTU Maximum transmission unit NAS Network attached storage OEM Original Equipment Manufacturer OMP Open Multimedia Platform OSGi Open Services Gateway initiative PAN Personal Area Networks PDA Personal Digital Assistant PKC Public-Key Cryptography PPDU Protocol data unit QoS Quality of Service SAP Service Access Point SDS Service Development Studio SMS Short Message Service TCP Transmission Control Protocol UDP User Datagram Protocol VoIP Voice over IP WAN Wide Area Network WPAN Wireless Personal Area Network
vii

KUNGLIGA TEKNISKA HÖGSKOLAN
Royal Institute of Technology Version: Beta Date: 16/10-2009
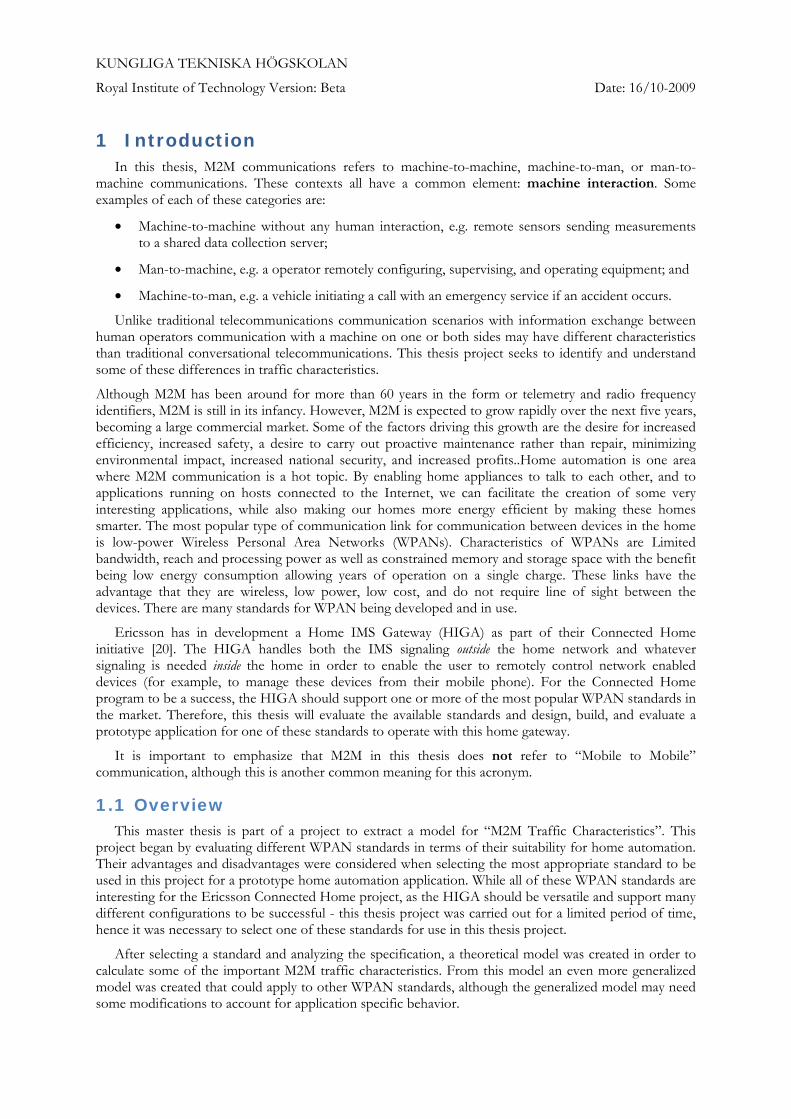
1 Introduction In this thesis, M2M communications refers to machine-to-machine, machine-to-man, or man-to-
machine communications. These contexts all have a common element: machine interaction. Some examples of each of these categories are:
• Machine-to-machine without any human interaction, e.g. remote sensors sending measurements to a shared data collection server;
• Man-to-machine, e.g. a operator remotely configuring, supervising, and operating equipment; and
• Machine-to-man, e.g. a vehicle initiating a call with an emergency service if an accident occurs.
Unlike traditional telecommunications communication scenarios with information exchange between human operators communication with a machine on one or both sides may have different characteristics than traditional conversational telecommunications. This thesis project seeks to identify and understand some of these differences in traffic characteristics.
Although M2M has been around for more than 60 years in the form or telemetry and radio frequency identifiers, M2M is still in its infancy. However, M2M is expected to grow rapidly over the next five years, becoming a large commercial market. Some of the factors driving this growth are the desire for increased efficiency, increased safety, a desire to carry out proactive maintenance rather than repair, minimizing environmental impact, increased national security, and increased profits..Home automation is one area where M2M communication is a hot topic. By enabling home appliances to talk to each other, and to applications running on hosts connected to the Internet, we can facilitate the creation of some very interesting applications, while also making our homes more energy efficient by making these homes smarter. The most popular type of communication link for communication between devices in the home is low-power Wireless Personal Area Networks (WPANs). Characteristics of WPANs are Limited bandwidth, reach and processing power as well as constrained memory and storage space with the benefit being low energy consumption allowing years of operation on a single charge. These links have the advantage that they are wireless, low power, low cost, and do not require line of sight between the devices. There are many standards for WPAN being developed and in use.
Ericsson has in development a Home IMS Gateway (HIGA) as part of their Connected Home initiative [20]. The HIGA handles both the IMS signaling outside the home network and whatever signaling is needed inside the home in order to enable the user to remotely control network enabled devices (for example, to manage these devices from their mobile phone). For the Connected Home program to be a success, the HIGA should support one or more of the most popular WPAN standards in the market. Therefore, this thesis will evaluate the available standards and design, build, and evaluate a prototype application for one of these standards to operate with this home gateway.
It is important to emphasize that M2M in this thesis does not refer to “Mobile to Mobile” communication, although this is another common meaning for this acronym.
1.1 Overview This master thesis is part of a project to extract a model for “M2M Traffic Characteristics”. This
project began by evaluating different WPAN standards in terms of their suitability for home automation. Their advantages and disadvantages were considered when selecting the most appropriate standard to be used in this project for a prototype home automation application. While all of these WPAN standards are interesting for the Ericsson Connected Home project, as the HIGA should be versatile and support many different configurations to be successful - this thesis project was carried out for a limited period of time, hence it was necessary to select one of these standards for use in this thesis project.
After selecting a standard and analyzing the specification, a theoretical model was created in order to calculate some of the important M2M traffic characteristics. From this model an even more generalized model was created that could apply to other WPAN standards, although the generalized model may need some modifications to account for application specific behavior.

The project has two major goals: the first is to design and implement a prototype that can be used to verify the traffic model, and the second goal is to interact with the Ericsson Connected Home group (as this group will focus on the implementation of the sensor/actuator networks). Measurements and analysis of the traffic characteristics of the prototype will be used to verify the traffic model and as necessary modifications were made to the model so that it better models the actual observed traffic.
The thesis background in Chapter 2 is divided into an introduction that describes the goals of the thesis project, a background study of prior work ,describing what has been done previously and what can be learned from it, and a survey of Wireless Personal Area Network (WPAN) standards that are used in existing products and an evaluation of these standards (relative to the thesis topic). Chapter 3 discusses how the traffic characteristics shall be modeled and how this model can be used to accurately predict interesting results meaning quantified numbers on sensor networks traffic patterns. Chapter 4 describes the prototype implementation that implements the proposed home automation use-cases. For each of the use-cases, Chapter 5 utilizes the parameterized model designed in this thesis to estimate the amount of traffic that will be produced in different sizes of automated homes. Chapter 6 describes the hardware that was used for the demonstration (described in Chapter 7). Chapters 8 and 9 present some conclusions and future work, respectively.
2

2 Background This chapter starts by summarizing related work in home automation and WPANs. It continues with a
discussion of a number of different WPAN standards and their features. The chapter concludes with the selection of a standard that should be explored further in this thesis project (i.e., the standard that should be used to create a prototype).
2.1 Home Gateway Initiative (HGI) The Home Gateway Initiative (HGI) is a non-profit alliance of telecommunications companies that
have come together to provide a forum where operators, content providers, service providers, and manufacturers can discuss home gateways. The primary goals of this initiative are to improve interoperability and functionality. The specific sub-goals of the initiative are:
“To produce requirements for a residential gateway enabling end-to-end delivery of services;
To work with manufacturers in order to leverage volumes, to validate against uses cases and requirements, in order to ensure interoperability; and
Build upon the existing standards and work of others (such as ITU H610, DSL forum, DLNA, OSGi Alliance ...) and to analyze gaps with respects to the requirements for home gateways.” [21]
2.2 Ericsson Connected Home Connected Home is Ericsson´s platform for making the home remotely accessible. The main product
in this platform is the Home IMS Gateway (HIGA). Thus far the focus has been on accessing media content such as IPTV, VoIP, and remote storage i.e. network attached storage (NAS), but the possibility of enabling the gateway to communicate with other networks (e.g. WPANs) for home automation has also come up as an interesting feature. This development means that the Connected Home project and this thesis project have a common interest in WPANs and as such it makes sense that the prototype should be built around the Connected Home platform and its gateway.
Home Gateway
Water – Trigger sends alert to gateway which sends message to home owner and tells the actuator to turn off the water main
Temperature – Reports temperature to gateway that regulates A/C or heating
Smoke/fire – Trigger makes gateway sound the fire alarm, send a report to emergency services along with temperature readings from all rooms, …
Sensors and triggers
Other uses: motion sensors, access control, lighting, electrical appliances, remote controls etc.
3

2.2.1 OSGi
The OSGi alliance (formerly the Open Services Gateway initiative) is an open standards organization that develops the OSGi specification. The alliance has specified a Java based platform that can be remotely managed with the core deliverable being a framework for application life cycle management, a service registry, an execution environment, and modules.
For OSGi you develop bundles. Bundles have OSGi specific code in them to be able to install, start, stop and update the bundle. The Activator class present in all OSGi bundles implements the start and stop functionality and registering of services making them visible to other bundles. The manifest for each bundle stores information about bundle properties such as name, version and export and import requirements.
An OSGi environment is more and more becoming a common addition to gateways. This is also true for the HIGA, as it will incorporate the OSGi environment. A result is that an implementation for sensor devices developed to run in the OSGi environment can be transferred relatively easily between different models and brands of home gateways. The OSGi environment could implement support for many different sensor network standards by having several specific standard drivers - as proposed in [36].
2.3 The European Energy Challenge The European Union (EU) has together with its member states defined clear goals and directives
regarding energy politics and management to tackle the threats of climate change and to secure an energy supply for the future. The green house gas emissions are expected to increase 2% from the 1990 level by 2010 and 5% by 2030 [7]. The commission’s “An Energy Policy for Europe” [8] proposed a strategic energy plan to combat the energy and pollution threats of the EU. This plan states that by 2020 that green house gas emissions should be lowered 20% compared to the 1990 level and further to comply with the commission’s “Limiting Climate Change to 2°C - Policy Options for the EU and the World for 2020 and Beyond”[9] to lower global emissions 50% by 2050. One of the methods proposed in the European Strategic Energy Technology Plan (SET-plan) to achieving these goals is:
“Full liberalization and interconnection of energy systems, incorporating 'smart' information and communication technologies to provide a resilient and interactive (customers/operators) service network.”[7]
The above EU directives suggest that a prototype for energy management is highly interesting and in line with current energy politics and policies. Hence this will be one of the target applications of the prototype developed in this thesis to apply developed models.
2.4 Building Energy Watcher (BeyWatch) BeyWatch is a European research project supported by the European Commission under the seventh
Framework Program. Using Information and Communication Technology (ICT) tools it focuses on environment and energy management. The scope of BeyWatch spans all the way from designing energy efficient white-goods such as dishwashers, refrigerators/freezers, and washing machines to utility companies being able to monitor energy consumption and scheduling operation of appliances to balance the load versus generating capacity (and its impact), thus saving energy and reducing cost for all parties involved.
Since its start in December 2008, BeyWatch has produced and published several white papers, specifications, and reports on the current market situation and other topics. These reports have been useful to this thesis project by providing background information concerning current market state and ideas for use-cases. However, they have not (yet) provided much technical knowledge. As the roadmap (Figure 1) shows, BeyWatch started in December 2008 and ends in June 2011 with the first implemented deliverables coming in 2010. We should be on the lookup for results from the BeyWatch Agent and M2M Communication Interface efforts, as these results become available during this thesis project.
4

Figure 1 - BeyWatch Roadmap [31] (Appears with permission of BeyWatch Project)
2.5 Contiki Contiki is the operating system that will be run on the sensor nodes used when developing the
platform for prototyping of use-cases proposed in this thesis. Contiki is a light-weight open-source operating system designed to run on several memory-constrained networked systems, e.g. on nodes in WPANs. The core has been developed by Adam Dunkels at the Swedish Institute of Computer Science (SICS). Contiki incorporates multitasking and the world’s smallest IP stack enabling a full graphical installation requiring only a few kilobytes of code and a few hundred bytes of RAM to run. Contiki has been ported to several microprocessor architectures. One of these microprocessors is the Texas Instruments MSP430 that the Sentilla Perk development kit is built on (see section 6.2).
2.6 Wireless Personal Area Network (WPAN) standards Home automation is one of many areas where WPANs have a huge advantage over wired or infrared
(IR) solutions because of the ease of installation, price competitiveness, and many diverse use-cases. IR devices are limited by the requirement for line-of-sight; while wired options of course require the installation of wires that is costly and often inconvenient. WPANs promise many advantages over these technologies with richer communication and increased reliability, enhanced features, flexibility, interoperability, etc. The most prominent standards for WPANs are: ZigBee, 6LoWPAN, Z-Wave, and Bluetooth Low Energy. Each of these will be examined below, but first the IEEE 802.15.4 standard is introduced; as this is used as the physical and medium access and control layers for both ZigBee and 6LoWPAN.
5

2.6.1 IEEE 802.15.4
IEEE 802.15.4 is a standard developed and maintained by the IEEE 802.15 working group. It is a specification of the physical (PHY) and medium access control (MAC) layers. It was developed for low-rate, low-power, ubiquitous wireless personal area networks. This standard relies on others to define higher layers to offer a full networking protocol stack. Standards that utilize IEEE 802.15.4 include: ZigBee, WirelessHART, 6LoWPAN, etc.
The physical layer is defined for three different frequency bands:
868-868.8 MHz (Europe) allows one communication channel
902-928 MHz (North America) initially up to ten channels, extended to thirty
2400-2483.5 MHz (worldwide use) up to sixteen channels
Important features of this standard are the use of guaranteed time slots (GTS) and carrier sense multiple access with collision avoidance (CSMA/CA) to avoid collisions, robustness to noise by using direct sequence spread spectrum (DSSS), and energy efficiency by sleeping most of the time. GTS makes it possible to guarantee some sensor types their transmission if they are of a critical nature, e.g. in the case of home automation this could be a fire alarm wanting to transmit an alert or a security system detecting an intruder.
2.6.1.1 Frames
With different frames we mean a standard behavior or pattern that other devices can parse and understand. Different frame types have different characteristics and uses. Four types of frames are defined in the IEEE 802.15.4 standard: Beacon, Data, ACK, and MAC. In the standard they are described as:
“A beacon frame, used by a coordinator to transmit beacons
A data frame, used for all transfers of data
An acknowledgment (ACK) frame, used for confirming successful frame reception
A MAC command frame, used for handling all MAC peer entity control transfers” [32]
The beacon, ACK, and MAC frames are mostly used for lower layer signaling, e.g. for associating with another device and making transfers sufficiently robust for transmission in noisy environments.
2.6.1.2 Headers
Headers in the IEEE 802.15.4 standard consist of the physical layer (PHY) and medium access control (MAC) layer headers with several options that will be set and read when transmitting. Maximum physical layer packet size (aMaxPHYPacketSize) is 127 octets, with a maximum frame overhead (aMaxFrameOverhead) of 25 octets. The resulting maximum frame size at the MAC layer is 102 octets. Link-layer security, which is optional, but highly recommended, imposes further overhead, which in the maximum case (21 octets in the AES-CCM-128 case, versus 13 and 9 for AES-CCM-64 and AES-CCM-32, respectively) leaves 81 octets available for higher layers.
2.6.2 6LoWPAN
IPv6 over Low-power Wireless Personal Area Networks (6LoWPAN) is a specification for compressing the IPv6 headers to run on small inexpensive microcontrollers with low power wireless capabilities, specifically on the MAC/PHY layers of IEEE 802.15.4. The major advantage of 6LoWPAN over ZigBee is that 6LoWPAN is built on the latest IP protocol (i.e. IP v6) and as such enables users to reach devices over the Internet without having to go through a protocol translation, for example a ZigBee-to-IP translation step. Earlier the main reason for IP not being the obvious choice when implementing light weight network devices has been that IP has been regarded as being too resource heavy, but with IP stacks such as Contiki uIP [10] and several others consuming only ~10 kilobytes of memory - this belief had been refuted.
6

IPv4 and IPv6 are and have been the workhorses of local, metropolitan, and wide area networks for the last two decades and are set to continue offering an open, lightweight, versatile, ubiquitous, manageable, scalable, stable, end-to-end solution for data delivery for the foreseeable future [10]. For this reason 6LoWPAN offers a long-lasting and highly interoperable solution to low power wireless embedded devices.
2.6.2.1 Advantages of 6LoWPAN
• Building on IPv6 gives 6LoWPAN a standardized, lightweight, and platform-independent means of access to smart objects and other embedded network devices making them accessible from anywhere and anything, e.g. PCs, PDAs, mobile phones, etc.
• Several open source (uIP and lwIP) and commercial IP stacks are available with memory footprints as small as or smaller than that of ZigBee. The IP Smart Object (IPSO) Alliance [11] has attracted more than fifty members since its inception in September 2008. Hence, there is a sizable group of developers that are interested in using 6LoWPAN.
2.6.2.2 Disadvantage of 6LoWPAN
• Does not define a specification for the layers above IP. UDP is the most widespread transport layer, but for the application layer no framework exists. At the 75th IETF meeting a group of people met to discuss the formation of a 6LowApp working group to address this issue1.
2.6.2.3 6LoWPAN compression
The IP maximum transport unit (MTU) for standard IPv6 packets over IEEE 802.15.4 is 1280 octets [29]. Such an IPv6 packet will not fit inside a single 802.15.4 frame. An IPv6 packet header is 40 octets, so encapsulating an uncompressed IPv6 packet in an 802.15.4 frame would result in only 41 octets being left for upper layer protocols and user data (see section 2.6.1.2). Even using a minimal application layer such as UDP on top of the 6LoWPAN layer would take an additional 8 octets leaving only 33 octets for application layer data.
In addition to all the headers, there is also a need for a fragmentation and reassembly adaptation layer at a layer below IP, as per section 5 of the IPv6 specification [30]. A specification for such a layer can be found in section 5 of the IPv6 over IEEE 802.15.4 specification [29]. Taking all these layers and headers into account means that header compression is compelling to the point of almost being unavoidable for IP over IEEE 802.15.4 networks.
To compress the IPv6 header 6LoWPAN exploits the fact that devices that have joined the same 6LoWPAN network share some state information. By relying on information pertaining to the entire link there is no need to explicitly build any compression context state for flows in the network. As a result, the following IPv6 header fields are expected to be common in 6LoWPAN networks [29]:
1. The IP version field is always IPv6.
2. If both IPv6 source and destination addresses are link local i.e. are auto-configured using the interfaces MAC address as per [28], then the IPv6 interface identifiers (bottom 64 bits) for the source or destination addresses can be inferred from the link layer source and destination addresses.
3. The packet length can be inferred either from layer two ("Frame Length" in the IEEE 802.15.4 PPDU) or from the "datagram_size" field in the fragment header (if present).
4. Both the Traffic Class and the Flow Label are zero.
5. The Next Header is UDP, ICMP, or TCP.
1 See http://trac.tools.ietf.org/area/app/trac/wiki/BarBofs/IETF75/6LowApp and http://zachshelby.org/2009/07/07/6lowapp-embedded-application-protocols/
7

With all the typical fields as described above in place, the common IPv6 header can be compressed from 40 to 2 octets using the LOWPAN_IPHC encoding. Although the actual compression depends on how many of the fields match the common case, as some may need to be carried in-line with different combinations being described in the two octets used for encoding. A worst case scenario as described above would mean that a standard UDP packet (with its 8 octet header) would have a maximum payload of 71 octets per IEEE 802.15.4 DATA frame.
2.6.2.4 Application layers
With 6LoWPAN having specified the framework for wireless embedded IP networking, the next step is to develop application protocols for resource-constrained embedded devices and networks. As mentioned above, a 6LoWApp [37] workgroup is likely to form within the IETF with this as its goal.
2.6.3 ZigBee
The ZigBee specification was designed for low power, low bandwidth, and secure WPANs. ZigBee runs on the IEEE 802.15.4-2003 MAC/PHY standard by adding network and application layers to complete the protocol stack. Developing and backing the ZigBee standard is the ZigBee alliance, which consists of some 200 companies and contributors. The ZigBee 1.0 specification was ratified in December 2004 while the latest version of this specification was released in October 2007. To promote interoperability between products from different vendors the ZigBee standard has defined several device profiles. The profiles that have been defined thus far in the ZigBee standard are Home Automation, ZigBee Smart Energy, Commercial Building Automation, Telecommunication Applications, and Personal-, Home-, and Hospital Care. These profiles cover applications such as industrial control, embedded sensing, medical data collection, smoke and intruder warning, building automation, home automation, etc.
The ZigBee/IP initiative is an effort to incorporate the IETF 6LoWPAN and ROLL IPv6 standards in the ZigBee stack. The most straightforward way to do this is by adapting the ZigBee Application Layer (ZAL) over UDP [39].
The ZigBee specification defines several layers above the MAC/PHY of IEEE 802.15.4. The network (NWK), Application Support Sub- layer (APS), and ZigBee Cluster Library (ZCL) header structures can all be seen in Appendix A and are the building blocks of the ZigBee stack. An analysis of the stack gives an idea of how much overhead each layer adds for maximum, minimum, and typical usage.
Running ZigBee on 802.15.4 that has a maximum physical layer packet size (aMaxPHYPacketSize) of 127 octets leaves on average ~50-70 bytes of payload for application specific traffic i.e. goodput [38] depending on if we use IEEE 16 bit or IPv6 64 bit addresses in the network.
8

Table 2-1 - Analysis of ZigBee stack headers
MAC bytes
Maximum 2+1+20+14+var(payload)+2 49
Minimum 2+1+4+0+var(payload)+2 9
Typical (16 bit addresses) 2+1+8+14+var(payload)+2 27
Typical (64 bit addresses) 2+1+20+14+var(payload)+2 39
NWK
Maximum 2+2+2+1+1+8+8+1+var(8)+var(payload) 33
Minimum 2+2+2+1+1+0+0+0+var(2)+var(payload) 10
Typical (16 bit addresses) 2+2+2+1+1+2+2+0+4+var(payload) 16
Typical (64 bit addresses) 2+2+2+1+1+8+8+0+4+var(payload) 28
APS
Maximum 1+1+2+2+2+1+1+var(0)+var(payload) 10
Minimum 1+0+0+0+0+0+1+var(0)+var(payload) 2
Typical 1+1+0+2+2+1+1+var(0)+var(payload) 8
ZCL
Maximum 1+2+1+1+var(payload) 4
Minimum 1+2+1+1+var(payload) 3
Typical 1+2+1+1+var(payload) 4
Total overhead
Maximum MAC+NWK+APS+ZCL 96
Minimum MAC+NWK+APS+ZCL 24
Typical (16 bit addresses) MAC+NWK+APS+ZCL 55
Typical (64 bit addresses) MAC+NWK+APS+ZCL 79
2.6.3.1 Advantages of ZigBee:
1. The required software is designed to be easy to develop on small, inexpensive microcontrollers.
2. The market acceptance is strong with lots of products already available and many more to come. This also has the effect that the price of ZigBee hardware is very competitive.
3. ZigBee profiles enable interoperability between components from different vendors.
9

2.6.3.2 Disadvantages of ZigBee:
1. ZigBee networking protocols are proprietary, and not directly compatible with the Internet. However, an effort is being made to enable ZigBee with IP.
2. Using an intermediary translation gateway between the ZigBee network and the Internet creates a single point of failure.
3. Having two separate protocols, one for inside the network and one outside creates two different security ‘spheres’. This creates a point of attack that weakens the integrity of the end-to-end communication.
The potential weaknesses introduced by protocol conversion in the gateway will be an important issue in this thesis project. This suggests that we need to use end-to-end security in our solution. This issue will be addressed in section 2.8.1.
2.6.4 Z-Wave
Z-Wave is a proprietary wireless standard developed for remote control in light commercial and residential environments. Z-Wave was developed by the Danish company Zensys, now a division of SIGMA [15]. The specification is now maintained by the Z-Wave alliance. It is designed to operate in sub-Gigahertz frequencies around 900 MHz which reduces interference from other common wireless appliances, such as Wi-Fi, Bluetooth, cordless phones, etc. that operate in the higher 2.4 GHz ISM band.
2.6.4.1 Advantages of Z-Wave:
1. Operates on frequencies with reduced interference from other common appliances; and
2. The Z-Wave alliance has 160 member manufacturers who are developing products for the Z-Wave standard.
2.6.4.2 Disadvantages of Z-Wave:
1. Offers relatively low bandwidth (40 Kbit/s) compared to other WPANs technologies; and
2. Z-Wave is a proprietary standard and not open to non-Zensys customers (i.e., it is only available under a non-disclosure agreement).
2.6.5 Bluetooth Low Energy
The specification for a low energy version of Bluetooth (Bluetooth LE) was made public when this effort merged with the Nokia Wibree group [16] in June 2007. The current version (v.0.9) specification was released in May 2009, but the version number implies it is still not mature enough for development of applications. A finalized 1.0 version is not yet scheduled for release, but the first production devices are expected at the end of 2009 or beginning of 2010 [17].
2.6.5.1 Advantages of Bluetooth LE:
1. Builds on and is interoperable with the original Bluetooth standard (enabling a potentially large number of devices to communicate with Bluetooth LE devices);
2. Bluetooth has a huge market presence with an 8000-company strong trade association (Bluetooth SIG) responsible for advancing Bluetooth wireless technology [16]; and
3. The specification is for a bandwidth of 200 Kbit/s.
2.6.5.2 Disadvantages of Bluetooth LE:
1. No finalized version or hardware available, and
2. Typical maximum distance is limited to 10 m.
10

2.7 Conclusions regarding WPAN standards Based upon my study of the above WPAN standards, all of the above standards would seem to be
appropriate for the use-cases described in Chapter 4. However, some issues make some standards more attractive than others. The criteria that I have considered when evaluating the different standards have been:
• Bandwidth and range,
• Hardware costs,
• Interoperability between vendors and existing standards,
• Openness of standards, and
• Current availability
After comparing these standards with regards to the above criteria, it was decided that the most versatile and interesting platforms to work with in this thesis project are 802.15.4/6LoWPAN and 802.15.4/ZigBee. The reason for this decision is that 6LoWPAN and ZigBee are meant to run on the IEEE 802.15.4 MAC/PHY that has been widely adopted for a wide range of possible application, several frequency bands enable worldwide operation, and it has sufficient robustness against interference and noise for operation in a home.
6LoWPAN adds the capabilities of IP that is the dominant protocol used in the Internet and also the protocol implemented on nearly every network enabled device available. Furthermore, 6LoWPAN achieves efficiency and performance equal to or better than ZigBee; while being directly compatible with the Internet without the need for protocol translation. 6LoWPAN can make use of IP capable gateways and routers, this can be viewed as simply extending the Internet to 6LoWPAN capable devices. All of this makes 6LoWPAN an extremely versatile and future proof technology. One shortcoming of 6LoWPAN is that there is no well-defined specification for the layers and protocols above IP. The protocols must also support the needs of WPAN networks (specifically: the devices often have limited battery power, hence the devices must spend most of their time sleeping).
ZigBee offers a complete protocol stack specification with several profiles that make interoperability between manufacturers and application design simple. The drawbacks of ZigBee are that it is a proprietary technology; it is not directly compatible with the Internet as it is now, and security issues that arise with the need to do protocol conversion when connecting a ZigBee network to the Internet.
Realizing the strengths and weaknesses of 6LoWPAN and ZigBee a possible middle road would be to take the APS and ZCL layers from the ZigBee stack and put these on top of the 6LoWPAN network layer in UDP packets. This solution would eliminate the weaknesses and keep the strengths of both protocols/specifications; although it is outside the scope of this thesis. An IETF Internet-Draft advocating this approach exists [39].
In this thesis we will use IEEE 802.15.4 DATA frames to transport information (including signaling) between devices; as this is how communication is done in 6LoWPAN [29]. An advantage of choosing this approach is that the signaling is independent of the underlying PHY and MAC layers, making it easy to utilize alternative PHY and MAC layers.
2.8 Home gateways to WPANs There are several design and implementation issues that need to be addressed concerning home
gateways supporting wireless sensor networks with security and confidentiality, access management, aggregation of data, and standards support being the most prominent issues.
2.8.1 End-to-end security
One important aspect of having devices and sensors collecting information and handling tasks in a home is security. This concern for security is common to all applications. Appropriately performing authorization and authentication, and providing confidentiality are each of great importance. However, security may face hard tradeoffs in WPANs since high security always has a cost and WPANs have a
11

small packet size, low bandwidth, and potentially a large number of devices. These devices are generally assumed to be resource-limited with respect to computational power, storage, memory, and especially battery life. These constraints create many obstacles to be overcome. Also the exposed nature of WPAN nodes creates problems as they can be physically assaulted and stolen or high-jacked making possible threats not typical seen in other settings. For example, threats in the IEEE 802.15.4 specification that need to be taken into consideration arranged in order of OSI layers include:
Physical layer attacks, i.e. threats due to physical node destruction, relocation, and masking. By analyzing the stolen node, cryptographic secrets could be found, then used to insert nodes under the control of the attacker into the network.
1. Denial of Service (DoS) attacks could be triggered on several layers. On the physical layer the attacks include tampering and jamming with electromagnetic (EM) signals in order to saturate the resources of WPAN devices. Such attacks can very easily be performed with high resource devices (for example, a laptop PC). DoS attacks on the MAC layer can utilize collisions, exhaustion, and cause unfairness by issuing commands and tasks to nodes to quickly exhaust their battery power, resulting in a device that no longer functions. An attack against network availability could flood the network with a large number of packets. In such a case, the attacker may degrade the network performance and drastically reduce the throughput of other nodes. By misusing a replay protection mechanism, e.g. sequential freshness, the malicious node sends many frames containing large counters to a particular receiver, which in turn raises its replay counter. Then, when a normal device sends a frame with a lower frame counter, this frame will be rejected by the receiver, thus leading to DoS attack.
2. The ACK frame is not protected. Because of this it is possible to create a forged ACK frame using the unencrypted sequence number from the data frame and sending this forged ACK to the source while creating interference to prevent the legitimate receiver from receiving the frame.
3. A corrupted device can also attack the key distribution process since the IEEE 802.15.4 WPAN coordinator announces the IDs of devices who are about the change their link key in plain-text in a beacon frame. Therefore, the attacker can send request packets with the ID of the legitimate node. The goal of such requests is to cause the coordinator to trigger a key exchange process while the legitimate recipient may not be ready.
Network layer attacks:
1. Spoofed, altered, or replayed routing information: in this attack, the malicious node uses spoofing, altering, and/or replaying to target routing information exchanged between nodes in an attempt to create routing loops, attract/repel network traffic, extend/shorten source routes, generate false error messages, etc.
2. Selective forwarding: in this attack, the malicious device may refuse to forward certain messages (e.g., by dropping them). In this case, neighboring devices may conclude that the malicious device has failed and thus, try to seek another route. A more subtle form of this attack is when the malicious device selectively forwards packets, thus neighboring nodes will not conclude that another route is needed which in turn, would encourage them to re-send the data packets.
3. Sinkhole attack: a malicious node can listen to requests for routes and reply back that it offers the highest quality and shortest route. As such it will insert itself between the communicating nodes and can now do anything with passing packets.
4. Sybil attack: in a Sybil attack, a single node presents multiple identities to other nodes in the WPAN.
5. Wormhole attack: the attacker records packets (or bits) at one location in the network and tunnels them to another location. The effect of such an attack is that all the nodes in area A assume that nodes in area B are their neighbors and vice versa. This affects routing and other connectivity based protocols in the network. Once the new routes are established and the traffic in the network starts using the A-B shortcut, the wormhole nodes can start dropping packets and cause network disruption.
12

Transport layer attacks can be performed by half open and half closed TCP segments. A malicious device can repeatedly forge messages carrying sequence numbers or control flags ultimately causing the endpoints to request retransmission of missed frames.
2.8.1.1 IEEE 802.15.4
Layers running on top of IEEE 802.15.4 have a choice of activating one of the security suites that controls the level of security for transmitted data. These suites are: no security, encryption, authentication, and encryption and authentication; with no security being the default setting. These modes balance the need to keep the protocol as lightweight as possible with the need for frame security. IEEE 802.15.4 uses symmetric key pairs to enable secure communication. It can support several key pairs; where one pair is used for link security (point-to-point) shared only between two devices and another pair supports group security (with all devices in the device group sharing the same secret keys). To guard against replay attacks IEEE 802.15.4 uses a nonce value to guarantee freshness of communications, for authenticity a MAC code can be generated and attached to the message. For encryption AES is available. According to the standard the keys that are used are provided by higher layer processes; hence the establishment, maintenance, and storage of these keys are outside the scope of the IEEE 802.15.4 standard.
2.8.1.2 6LoWPAN
The 6LoWPAN specification does not address security. 6LowApp has as one of their goals to address this issue. One possible solution is a modified EAP standard [37]. Because most 6LoWPAN research has been done assuming the IEEE 802.15.4 layers underneath, it is a logical assumption that 6LoWPAN would continue to have this as its main platform and use the security functions provided by IEEE 802.15.4. Key generation and maintenance is work left up to the upper layers.
Although the IPv6 protocol suite offers several security functions such as Encapsulating Security Payload (ESP) and Authentication Header (AH) these mechanisms generate a lot of overhead and as such are unsuitable for a network with small frames. The ESP header provides origin authenticity, integrity, and confidentiality protection of packets, but by design the smallest packet possible because of padding is 255 bytes, this would generate extra traffic hence shortening the lifetime of the network with increased fragmentation and reassembly, etc.
2.8.1.3 ZigBee
ZigBee uses MAC layer features for securing the MAC command, beacon, and acknowledgement frames. ZigBee can also secures messages transmitted over a single hop using secured MAC data frames, but for multi-hop messaging ZigBee relies upon upper layers (such as the NWK layer) for security. The MAC layer uses the AES as dictated in the IEEE 802.15.4 specification as its core cryptographic algorithm and describes a variety of security suites that use the AES algorithm. These suites can protect the confidentiality, integrity, and authenticity of MAC frames. The MAC layer does the security processing, but the upper layers, which set up the keys and determine the security levels to use, control this processing. When the MAC layer transmits (receives) a frame with security enabled, it looks at the destination (source) of the frame, retrieves the key associated with that destination (source), then uses this key to process the frame according to the security suite designated for the key being used. Each security suite, i.e. each operator (security company, insurance company, home owner etc) needing their own security profile will have its own pair of symmetric keys.
2.8.1.4 Access management and public-key cryptography
Although using symmetric-key cryptography has been investigated extensively for sensor networks to provide authenticity and confidentiality and has proven to be an efficient scheme it has drawbacks. Some of these drawbacks are:
13

• Scalability: Because a symmetric-key scheme requires all users to have authentication codes for all peers, it does not scale well. If the sensor nodes are pervasive in the environment, then the key distribution center will need to generate large numbers of authentication codes for users.
• Storage: Just as generation of keys is an issue of scalability, so is storage of these keys.
• Re-deployment: When new sensors need to be inserted to the existing network due to replacement or network expansion, a problem arises when users try to access these newly added sensors because the new nodes do not have the correct authentication codes.
• Key distribution: normally, symmetric-key based security schemes require complicated key redistribution and a considerable amount of memory for storing pre-distributed keys. Key-distribution is often difficult and problematic in pervasive computing environments, especially after the network has already been established.
Access management is a critical part of many WPAN areas. In this thesis we focus on home automation. In this setting, it is important that access can be granted to some parties, while others should be blocked from access. For example, the business model of home automation depends on the security company e.g. G4S or Securitas being able to monitor and configure the security alarm, but other parties should be blocked from performing these operations. In the same way, the electric power distribution company e.g. Fortum must be able to make adjustments to the electric metering device, but this should be impossible for the home owner or other parties (unless they are authorized by the meter owner). All of these examples can also be applied in other WPAN areas. Due to the drawbacks of symmetric-key cryptography mentioned above providing access management becomes a problem. One solution to this is using public-key cryptography (PKC).
Figure 2 - Illustration of different operators needing their own security sphere for home automation
Both public-key and symmetric-key cryptography have long been known and used in the secure communications world with advantages and disadvantages well mapped over decades. It has long been a popular belief in the sensor network research community that public-key cryptography is not practical because the required computational power is not suitable for sensors with limited computation capability and energy budget. Recent studies using 160-bit Elliptic Curve Cryptography (ECC) seem to prove this is a misconception, thus in the near future public key cryptography could prove to be the best alternative for secure access management in WPANs, although like many other systems a hybrid cryptosystem [42] will most likely be used to benefit from the strengths of both symmetric- and public-key schema.
2.8.2 Aggregation
Aggregation of measurements and other data in a home network is an issue that needs to be discussed. The approach of using a low-power WPAN technology and a gateway acting as data sink with WAN
14

capabilities (Ethernet/3G/LTE) is for several reasons the best solution in many home automation use cases. The main features of interest are cost, reliability, security, and life expectancy.
Cost Current WPAN technology, e.g. IEEE 802.15.4, is price competitive with other wireless technologies that can support the connected home concept, e.g. 3G WAN.
Life expectancy
WPANs are designed for long life even with battery-operated devices, making diverse installation in the home possible.
Reliability A semi-open topic is that the 2.4 GHz frequency band most frequently used by IEEE 802.15.4 is also used by many other technologies, leading to a risk of interference and other problems.
.Security The constrained nature of the devices limits some of the possible implementations of security. Symmetric key cryptography is a current solution that has drawbacks regarding scalability and deployment issues [41].
The alternative to a home gateway aggregating traffic is using WAN technology such as 3G/LTE in every sensor node, but this approach would not be possible for several reasons, one of which being that battery operated devices hoping to work for an extended period of time (years) would not be possible.
2.8.3 Implementations of standards
With several different standards for WPANs on the market, there is an issue of how we implement support for each of them in a gateway. The standards can consist of several different upper layer implementations built upon the same lower layers (as is the case of 6LoWPAN and ZigBee both running on the IEEE 802.15.4 MAC/PHY layers). Also there are devices operating on other PHY/MAC layers such as the Z-Wave standard and Bluetooth LE. By using OSGi as the platform for implementing gateway software between different WPAN standards the market is open to any developer or operator (See Figure 4.). Installing, starting, stopping, and updating software is easily made possible by using the OSGi framework as are addressing software security questions such as limiting access between different parties. Also as the framework is a Java platform, running the gateway on different operating systems such as Linux, Windows, and UNIX is possible because of Java’s virtual machine technology.
Figure 3 – Implementing WPAN standards in an OSGi home gateway (Adaptation from [36])
15

3 Traffic characteristics The analysis of traffic characteristics of sensor networks will focus on networks running on the
MAC/PHY layers of IEEE 802.15.4 as this standard is mature and has a large market presence. When modeling the traffic two patterns were expected to be observed, e.g. a sensor network used for surveillance will most of the time be in sleep mode only sending small amounts of traffic to notify the rest of the network that it is still functioning. On the other hand when it is triggered by a door bell or motion sensor, then the traffic will come in bursts. Similarly a water leak alert system will notify a server of its continued existence on the network, but until triggered by moisture to generate an alarm will not generate additional traffic. The resulting traffic patterns that are likely are: (1) no traffic when the system is in sleep mode, with bursts of communication when an event occurs or an alarm is triggered and (2) a sustained low rate of data. The later might be modeled as short sleep periods with (very) short bursts (i.e., a classic On-Off traffic model may be applicable to both cases); while the first could be modeled with very long off periods.
To get accurate results one needs to consider several issues:
• What data is needed, i.e. data amounts, latencies, content?
• How much data has to be collected to make results statistically reliable?
• How will traffic be generated and monitored so as to affect the system behavior as little as possible?
We define some questions that should be answered. These questions will help us focus on what work needs to be done in order to come to the conclusions we seek, i.e. what characteristics the traffic has. These questions are:
1. How much of the traffic sent is network overhead, i.e. setting up and maintaining a network? How does this relate to a normal wireless/wired installation, e.g. Ethernet, Wi-Fi.
2. Network overhead in a 6LoWPAN will come from the network- and transport layer headers. This will of course correspond to any regular IP network except that the IP and UDP header will be compressed if possible.
3. How much of the data sent is transmission overhead, i.e. how much application payload (goodput) per packet can one expect?
4. How well do the 802.15.4 nodes perform in large numbers e.g. does the home automation use-case seem possible with its requirements in number of nodes and amount of data?
5. Number of packets per unit time, e.g. how many packets can we expect to receive from a network of X nodes in Y minutes. From this can we draw a conclusion about the maximum size of a network?
6. What traffic patterns are observed?
7. What is the observed QoS (packet loss, jitter, delay, …), etc.
3.1 Parameterization of devices In most cases we can see that the traffic of different types of sensor devices can be described with the
same equations. Common parameters that need to be known or estimated to compute the amount of data sent in a WPAN sensor network might include those shown in Table 3-1 and Table 3-2.
16

Table 3-1 - Potential common parameters
Type ( )t The type of sensor e.g. temperature, water, smoke, etc
Number of nodes ( )N How many sensors can be found in the network of this type
Maximum frame overhead �X frame� How much data is overhead from the protocols below the application layer. This means address fields, possible security fields, checksums, etc.
Heartbeat payload �X payload � How much data that is heartbeat information e.g. what node that is signaling etc
Heartbeat frequency ( )heartbeatf How often the heartbeat occurs e.g. once/minute
Heartbeat uplink traffic �T h� (Mbytes/year)
The total amount of heartbeat traffic that comes from a certain type of sensors every year
Trigger payload �X payload � This is the amount of data that is trigger specific e.g. a smoke alarm message or a humidity value that is above a set threshold
Trigger frequency �f trigger� How often a trigger occurs e.g. for a light switch might be several times a day and for a fire alarm hopefully never
Trigger uplink traffic �T t� (bytes/time unit)
The amount of uplink traffic generate for a specific trigger.
Table 3-2 - Parameters only applicable to alert type sensor devices
( )ty ∂∂ / This is the rate at which the sensor’s environment is changing with regards to what the sensor is monitoring; e.g. how fast the humidity is changing (x % per minute) as measured by a humidity sensor.
Threshold ( )threshold This is the spacing of the threshold values in the sensor e.g. report a new value every four degrees change
Threshold frequency �f threshold�
When triggered, how often the now active sensor will transmit a new updated sensor value. This parameter is only applicable to devices that sound alarms; as these kinds of sensors usually monitor the surrounding environments which changes over time. For example, when a water leak alert device monitors humidity it will first be asleep when the humidity is below some threshold. When there is a leak and the humidity threshold is passed the device will wake up and send an alert. A very simple device would stop signaling after this, but as humidity sensors are not simply an ON/OFF sensor it can report humidity values within its sensing range - thus it could be meaningful for the sensor to signal every time a new threshold is passed. Thus the fthreshold parameter depends on two parameters in itself, how widely spaced the thresholds are (threshold) and how rapidly the environment is changing (∂y/∂t).
With the above parameters we can create some simple equations to calculate network and trigger traffic in a WPAN sensor network:
17

( )( )heartbeatframeheartbeatt X+XfN=T
Equation 1 - Calculate the heartbeat traffic
( )( )payloadframetriggert X+XfN=T
Equation 2 - Calculate the trigger traffic for non-alert type sensor devices
( ( ( )))framethresholdtriggert X+XffN=T payload
Equation 3 – Calculate the trigger traffic for alert type sensor devices
thresholdt)Y(=fthreshold // ∂∂
Equation 4 – Calculate the fthreshold value for Equation 3
3.2 Confidence interval and level The terms confidence interval and confidence level are used when attempting to show how reliable a
result or statistic is. In most scientific areas the confidence level of 95% is used. To explain what this means we first need to explain what the confidence interval is. The confidence interval can often be seen in newspapers and other publications as the plus/minus number that comes after a stated value, e.g. 100 ± 10. This coupled with a stated confidence level of 95% means that statistically 95% of the measured values will end up in the confidence interval of 100 ± 10; i.e. between 90 and 110 where (90, 110) is the actual confidence interval. The 95% confidence level will be used in this thesis.
3.3 Traffic generation When attempting to measure network performance it is often necessary to generate traffic. This is
often accomplished by using a packet generator specifically designed to produce large numbers of packets or to generate a specific pattern of traffic (for example, to match a measured traffic source). Many traffic generator applications can be downloaded and run on both Windows and Linux machines [23]. In this thesis we assume that the source or destination of traffic is a small sensor node with very limited resources in terms of processing power, memory/storage space, and power. Therefore, we are not interested in a traffic generator that generates the maximum load for our testing. Instead, we want to use a traffic generator that generates traffic comparable to the actual devices that would be utilized in our use case scenarios. As these nodes are expected to spend most of their time in sleep mode (neither sending nor receiving traffic), we expect that they will only generate traffic at certain intervals (for example, to report their continued existence and status). By decreasing this interval it is possible to increase the traffic and to load test the network. Thus we can emulate an existing WPAN network with many nodes by decreasing the interval at which our test node generates traffic. This testing principle is not fully equivalent with having a large number of nodes though as the radio propagation of several nodes compared with many nodes is different, e.g. multi-path fading will be very different with an increased number of nodes. However, this model could give an estimate figure of how responsive and robust a large network could be. Also we will also have to consider the traffic needed to create and maintain this WPAN – but this is not expected to be a significant portion of the traffic until the network is quite large (however, it is interesting to understand when this point would be reached).
In order to generate traffic for testing the scalability of WPANs we need to measure and analyze the traffic from representative nodes. To do this we will construct a set of prototypes, as described in the next chapter. The traffic characteristics of these prototypes will then be characterized.
3.4 Conclusions on traffic characteristics How much of the traffic sent is network overhead, i.e. setting up and maintaining a network?
First we must define what network overhead is. The network set-up is initial signaling between connecting nodes and the already in place network.
18

In ZigBee this is done by the Network Coordinator sending out beacons periodically and the connecting node listening, when the beacon is heard the node will signal its presence and through a handshaking procedure be coupled with the network. As this procedure is only supposed to happen once for every node it is not necessary to analyze this behavior much further.
From Table 2-2 we can see that the cost of maintaining a ZigBee specification network in terms of typical frame overhead with MAC+NWK+APS+ZCL headers is ~80 bytes. The frequency at which ZigBee nodes are to poll its coordinator as specified in the ZigBee home automation application profile is every 60 seconds. This calculates to a node sending at least 40 Mbytes per year for the purpose of maintaining the network and polling for new data. Comparing this with Table 5-2 where the trigger traffic for a year is ~1-10 Mbytes we see that the relationship between network and trigger traffic can range between 40:1 to 4:1 in a ZigBee solution that is following the home automation specification.
For 6LoWPAN the network set-up will depend on the transport protocol used, most likely UDP. The connecting node has several options for address configuration, the easiest and most likely being auto-configuring addresses with a link local prefix, after this it can use a neighbor discovery protocol to find neighbor nodes and routers. When using UDP no handshaking routine is necessary, this also means that any handshake or acknowledgements will have to be handled by the application layer.
The traffic sent when maintaining a 6LoWPAN network is application specific. When using link local addresses the overhead per packet from MAC+6LoWPAN/IP+UDP headers will amount to ~50 bytes. There are no restrictions on polling frequency, but if we use the estimations from Table 5-1 -- the timings will range between once every 30 minutes to once per minute which amounts to ~1-25 Mbytes/year in network heartbeat traffic.
Using the estimations again from Table 5-2, but with a per packet overhead of ~50 bytes we can calculate the trigger traffic amount to be ~.5-5 Mbytes/year depending on the sensor type. Hence the relationship between network and trigger traffic could be in the range 2:1 to 5:1.
How much of the data sent is transmission overhead, i.e. how much application payload (goodput) per frame can one expect?
In both cases (ZigBee and 6LoWPAN solutions) the typical MTU will be limited in size, typically 127 bytes. Compared to the MTU of Ethernet or Wi-Fi (~1500 bytes) this means the goodput traffic is relatively low. From Table 2-1 we see that the typical overhead in ZigBee packets is 79 bytes, when using 64 bit addressing, leaving 48 bytes for application data. As ZigBee uses a binary protocol this amount of data is sufficient for most purposes in an automated home such as temperature readings, remote control, alarms without having to send several packets fragmenting data.
The overhead in a similar 6LoWPAN set-up using UDP will be lower than the ZigBee solution. The MAC header can be identical, 6LoWPAN adds two (2) bytes and UDP adds 8 bytes resulting in a total of 49 bytes overhead per frame leaving 78 bytes free for application data.
How well do the 802.15.4 nodes perform in large numbers e.g. does the home automation use-case seem possible with its requirements in number of nodes and amount of data?
To answer this question this thesis sought answers both from research papers and specifications as well as conducting our own experiment. According to [52], the ZigBee Home Automation network scales from 2 to 500 nodes. From [53] we see that an industry installation running on IEEE 802.15.4 equipment can work reliably with more than 800 nodes. Both these sources show that the scenario’s estimate of 50-100 sensors in an automated home is supported by the technology.
An experiment was conducted to show the robustness of available IEEE 802.15.4 equipment. The experimental set-up consisted of two pairs of tmote sky nodes. One pair, from now on called the communicating pair, sends regular updates using a simple binary protocol over 6LoWPAN and the other pair, the interfering pair, simulating different degrees of network interference. The amount of interference (due to this other network traffic) was emulated by having the interfering pair send frames more and more frequently. The experimental configuration is shown schematically in Figure 4.
19

Figure 4: Illustration of interference experiment
The communicating pair was configured to send a message every two seconds, the message contains all of the sensor values collected by the tmote sky -- a total of 57 bytes with all headers included, hence the message fit into a single frame. The interfering pair sent the same data at varying intervals; starting at once per second, then ten times per second, and without limit – resulting in the node attempting to send a message approximately one hundred times per second. The experiment continued until 100 messages had successfully been exchanged between the communicating pair.
Table 3-3 shows the results from this interference experiment. We see that the total time to successfully transfer 100 messages increases with the interference; as there is more and more contention for the channel. In the nominal case where there is no interference we see that the sending pair are very close to reaching the theoretical limit of 100 packets in 200 seconds (i.e., achieving the theoretical maximum channel throughput for this size frame). This high QoS continues even when we the interfering pair send packets at a rate of once per second. When the interference increases by 10 times to 10 packets per second, there is a 27 second increase in the total time required to successful send 100 packets in comparison to the nominal case; this is a 15% increase – which most would regard as still giving an acceptable QoS. In scenario D when we remove the limiter from the interfering pair the total time to send 100 messages/frames more than doubles.
A None 202 2.0±0.02
B 1 206 2.1±0.06
C 10 233 2.3±0.14
D ~100 440 4.4±0.40
Inter-packet delay E=2 (sec)
Total time E=200 (sec) Scenario Interference (packets) packets per second
Table 3-3: Interference experiment results
Scenario C (with the interfering pair sending ten packets every second) examined the case of a large amount of interference while still giving acceptable performance. This corresponds to a network with 600 sensors when using the guidelines from [52] and many more nodes when using the estimates from Table 5-1 and Table 5-2 with regards to polling frequency and amount of data. Based upon these numbers we believe that the technology used in this thesis would be sufficient for an automated home.
20

This experiment has drawbacks making it an imperfectly emulation an actual network consisting of many nodes. One drawback is that it is unable to model fading properties of many sending nodes, i.e. multipath propagation. It also does not examine the case when multiple nodes are trying to simultaneously transmit, but some frame may be successfully received due to the packet capture that would occur in a real network with nodes having different path gains to the receiver.
3.4.1 What traffic patterns are observed?
The prototype developed in this thesis matches the expected patterns discussed in the beginning of Chapter 3. The sensor node sends data periodically when its timer is triggered in order to continue to be part of the network and sleeps otherwise. When an event occurs, e.g. the temperature rises above a set threshold – then it signals more frequently until the threshold is passed in the opposite direction or a message telling it to stop is received.
21

4 Prototype The prototype is to implement some features and use-cases that can be found in a automated home
based on WPAN technology. The prototype will as far as possible use hardware and software representative of a real world solution.
4.1 Use-cases
4.1.1 Water leak alert and response
Just as homes should have fire detectors, it is also desirable to install water leak detector/alarms as a water leak can occur when the home or apartment is not occupied and this leak might not be detected until it is too late. The longer a water leak is left unattended, the more expensive it will be to recover from this leak, so the possibility of detecting a water leak early can save a house owner and their insurance company a lot of time and costs. For example, a water leak detecting solution in a summer house would be invaluable for the owner, as the leak might occur due to a burst pipe in the winter and if left unattended for a longer time (until spring) could lead to very expensive repairs.
In Sweden the cost of water damage on households is five billion SEK every year with an average cost of 40k per incident [46]. This means that rough 125 thousand incidents happen every year in Sweden and given ~5 million households [47] this means that one in forty (1/40) households can expect a water leak in a given year. These numbers show that there is a large incentive for both a homeowner as well as an insurance company to decrease the number of incidents with a solution, such as a water leak detecting sensor network.
The solution could either utilize a flow monitor on the main pipe into the house or strategically place detectors throughout the house that activate when they get wet. An advantage of using detectors instead of a flow monitor is that they can sound an alarm even if the leak is in the roof and not a broken pipe. When a leak is detected an alarm is triggered, in response the gateway would notify the owner. This notification could include additional information, such as which room’s sensor(s) had been triggered and to perhaps even give an indication of degree of the problem.
Use-case Bob has installed water-leak sensors in his house at strategic positions, e.g. under the fridge/freezer,
sink, water heater, etc. These sensors are wirelessly connected to the gateway. In addition to these sensors, Bob has also installed an automatic shutoff valve on the main water pipe into the house. This valve can be closed remotely via signaling from the gateway. The valve and its associated wireless actuator are mains powered and as such the node is a likely choice for operating as a sensor network router as well.
The water heater has sprung a leak and water is coming out onto the floor. The detector under the heater detects this leak and sends an alarm to the gateway. The gateway immediately closes the shutoff valve and notifies Bob of the leak. Shutting off the water main stops the flow of additional water into the water heater, potentially limiting the damage. After Bob receives the alert he can either go home or call the plumber (potentially remotely opening the door to admit the plumber). These steps are illustrated in Figure 6.
22

Figure 5 - Water leak alert and response
4.1.2 House in sleep-mode
During working hours most houses and apartments stand empty as their owners and tenants are at another location2. Having the house go into sleep-mode during these hours makes sense as the need for light, climate control, warm water, appliances on standby, etc. are either not needed or significantly reduced during these hours. To enable sleep-mode there are two necessary elements. The house needs to be able to know that no one is home; this could be by (1) the user telling the house when they leave or (2) the house using sensors to detect that everyone has left, or (3) a combination of both. Furthermore the house needs to have control over the appliances that are to be turned off.
Use-case Bob lives by himself. At 7:00 he is leaving his home to go to work. Before he goes he tells the gateway
that he is leaving by pressing the “Out of house” button on his mobile phone. The gateway acts upon this information first by polling motion sensors in the house several minutes afterwards (to check that Bob has actually left). The sensors tell the gateway that they have not detected movement in the house for X minutes. The gateway might use a location system to determine that Bob’s mobile phone is further from the home than some user specified distance (for example, more than 1km). From this information the gateway deduces that the house is empty and that the house should now go into sleep-mode to conserve energy (see Figure 7). Therefore, the gateway places all lights, appliances, heating, blinds, etc. into sleep-mode (see Figure 8). The gateway maintains this mode until somebody comes home triggering the motion detectors, until some preset time of day, or Bob tells the gateway remotely from his mobile that he is on his way home and that the house should wake up, warm up the sauna, and turn on the lights along the driveway.
Figure 6 - House in sleep-mode (going into sleep mode)
2 Note that while an increasing number of people work at home (either full-time or part-time), this use case will focus only on those persons who are working outside of their homes for many hours per day.
23

Figure 7 - House in sleep-mode (waking up from sleep mode)
24

5 Theoretic traffic estimates The purpose of this section is to define and estimate the traffic patterns that are likely to be seen in
the use-cases described in the previous chapter. For example, the use-cases have a traffic pattern of initial signaling between nodes and gateway in order to establish the network; after this at some regular interval (perhaps somewhat randomized) each node sends a notification to the gateway that it is still functioning. Details of this will be discussed in section 5.1. In addition, to the common traffic each of the use-cases has use-case specific patterns – these are discussed under their own heading in subsequent subsections.
When considering what protocols to use when sending commands and data we need to consider the network’s capabilities. Inside the home the network traffic is sent between the gateway and nodes (and the reverse) - the goal is to limit transmit & receiver active time as much as possible as this is likely to be the largest power drain on battery powered nodes. This means that the protocols used should be simple and the data should hopefully fit into a single IEEE 802.15.4 frame. Examining the ZigBee specification of the upper layers (APS, ZCL) we can see that packet format and lengths are designed for a small frame with the sensor data being transported via a binary protocol.
The communications outside the gateway do not have the same power and processing limitations and as such can use more expensive protocols. The advantages of using the session initiation protocol (SIP) on the outside are its existing authentication framework and the wide availability of clients that can be run on different hardware such as phones, PDAs and laptops. These kinds of devices are the most suitable (and most likely) for communicating with the gateway in the first place.
5.1 Common traffic patterns The message sequence for a device associating and connecting to a WPAN can be seen in (Figure 8),
but before it is possible to send the MLME-ASSOCIATE.request there is a need to know on which of the IEEE 802.15.4 channels are there WPANs. This is accomplished by sending an MLME-SCAN.request command to the MAC layer of IEEE 802.15.4 device which will cause the receiver to listen on all channels for beacons and to save information about all the detected WPANs in a PAN descriptor structure to be sent to the next higher layer above the MAC layer (i.e., the link layer) when the scan is finished. Given this list of PANs the device will operate as shown in Figure 8 to associate with a network. The PHY layer has been excluded from Figure 8, but the messages that are sent between the two Media Access Control (MAC) Sub-layer Management Entity MLME layers are the messages being sent wirelessly to associate the device with the coordinator. Assuming that each message fits within one IEEE 802.15.4 frame (which should be the case as the amount of data is relatively small), then each device connecting to the network will generate six initial frames.
25

Figure 8 – IEEE 802.15.4 Message sequence chart for association (Appears with permission of IEEE© [2006]) [32]
An established PAN consisting of a coordinator and connected devices will periodically need to transmit a heartbeat across the network to signal that each of the nodes is still alive and functioning. This heartbeat is not part of the IEEE 802.15.4 standard, thus it has to be implemented on a layer above the MAC layer. The time between heartbeats and the time that a coordinator or device will wait for another heartbeat depend upon the application (above the MAC layer). Each heartbeat will consist of a frame sent from one device and an acknowledgement frame being sent back, this means at most 2x128 octets per device being sent periodically. The overhead in these frames comes from the PHY/MAC layer with the fields and data as described in section 2.6.1 on page 6. The higher layer overhead above the MAC sublayer could be a proprietary network layer such as in ZigBee or a compressed IPv6 header as in 6LoWPAN.
5.2 Water leak alert and response There are two typical traffic patterns that can be seen in this prototype: the one occurring on the
(inside) network between IEEE 802.15.4 nodes and the gateway and the traffic occurring on the (outside) network between the gateway and the user’s SIP device:
Internal traffic When the water detector is triggered it will send a “Humidity alert” message to the gateway. Based upon this alert the gateway will close the water main shutoff valve and contact Bob to notify him of the leak. The gateway sends a “Close valve message” to the node connected to the water pipe running to the leak, triggering the node to activate its actuator and send an “ACK” message in response.
External traffic The gateway contacts Bob via the usual SIP MESSAGE mechanism. This SIP MESSAGE can convey the “Humidity alert” with details about which sensor was triggered and when. There is no need for a SIP session to be initiated, although earlier a SIP REGISTER request occurred and a 200 OK message will be sent to acknowledge the receipt of the SIP MESSAGE.
5.3 House in sleep mode There are two typical traffic patterns that can be seen in this scenario: going to sleep and waking up.
The signaling that occurs when the house it told to go into sleep mode when initiated by the house owner. The SIP MESSAGE “Sleep mode” can be sent from any SIP device programmed to do so e.g. laptop, mobile phone, PDA to the home gateway. When the gateway receives the message “Sleep mode” it will look through its registries of what devices should sleep when in sleep mode and begin signaling them. It will send a message “Sleep” or alternatively “Sleep until hh:mm” to all devices in the list and get ACK responses when they have complied. The house is now in sleep mode and optionally a confirmation message could be sent to the user. The signaling between the gateway and the IEEE 802.15.4 nodes could be done with SIP messages, but this would increase the signaling overhead as the commands from the gateway to the wireless node should be as simple as possible. A new command dictionary should instead be defined to decrease the amount of information sent, most likely using a similar binary protocol as used in ZigBee.
Awakening from sleep mode can either be triggered from the user via their mobile phone (or other device) or by a timer located at the gateway. When the gateway gets a “Wake up” message or the timer expires the gateway will check which devices should be wake up from sleep mode. It will send a “Wake up” messages to each, getting ACK messages when successful. Optionally the gateway can signal to the user that the house is now awake.
5.4 Automated home estimate Using the ZigBee stack header analysis from , Table 2-1 Equation 1-4, polling frequencies within the
ZigBee guidelines [44], and an estimated number of devices in a home we can calculate the amount of
26

data that is produced over the course of a year with regards to network traffic and application specific (goodput) traffic. This traffic is shown in Table 5-1.
The network traffic is used to keep the network alive by having devices periodically signal their current status. In IEEE 802.15.4 this is solved with nodes asking the coordinator if it has any new data for them sending a MAC frame with a one (1) octet payload specifying a data request message. This network traffic is not interesting for parties outside the home gateway as it is simply traffic that keeps the IEEE 802.15.4 network running. Other entities, such as utility companies and security firms, will have their own application specific traffic that tells them their hardware is functioning. Table 5-1: Heartbeat traffic based on the ZigBee specification with 64 bit addressing
Heartbeat traffic quantity (ZigBee/802.15.4 MAC/PHY) Type (t) Number of
nodes (N) Maximum
frame overhead
(Xframe)
Heartbeat payload (Xpayload)
Heartbeat frequency (fheartbeat)
Uplink traffic (Th)
(Mbytes/year)
AVG 2 rooms
AVG 8
rooms
(bytes) (bytes) (Hz) Min Max
Humidity detector
3 5 79 1 6 x 10⁻⁴ 4 7
Smoke detector
2 8 79 1 2 x 10⁻² 80 321
Security system center
1 1 79 1 2 x 10⁻² 40 40
Light switches 20 40 79 1 6 x 10⁻⁴ 27 53Electric meter 1 1 79 1 6 x 10⁻⁴ 1 1Electrical outlets
10 40 79 1 6 x 10⁻⁴ 13 53
Temperature 3 10 79 1 6 x 10⁻⁴ 4 13Total 40 105 170 489
Looking at Table 5-1 we see that the smoke detector and security system produce a large quantity of heartbeat traffic even though the number of units in each system is small, comparing this traffic to the large number of light switches we see that the difference is due to the polling frequency. The high polling frequency of the smoke detectors and security system is because alarms from these systems are time critical, i.e. the cost of them being non-functional when an event happens (break-in or fire) that they should register is very high. The remaining sensors are not critical and as such produce a considerably smaller amount of heartbeat traffic.
Table 5-2 gives an estimate of how much traffic would be sent out of the home through the gateway’s WAN connection. The security system and utility company operated devices are the most traffic intense applications as these are supported by outside operators that need high reliability and security. The trigger frequency of humidity and smoke detectors were calculated with numbers from [46], [47], and [48].
27

Table 5-2: Trigger traffic based on the ZigBee specification with 64 bit addressing
Trigger traffic quantity (ZigBee/802.15.4 MAC/PHY) Type
(t) (Average) Number of nodes
(N)
Maximum frame
overhead (Xframe)
Trigger payload (Xpayload)
Trigger frequency (ftrigger)
Threshold frequency (fthreshold)
Uplink traffic (Tt)
(Mbytes/year)
2 ro
oms
8 ro
oms (bytes) (bytes) (times
per year)
(Hz) Min Max
Humidity detector (alert)
3 5 79 2 2.5 x 10-
2 1.7 x 10⁻² 10-7 2 x 10⁻⁷
Smoke detector (alert)
2 8 79 4 1.2 x 10-
3 2 x 10⁻¹ 4 x 10-
8 2 x 10⁻⁷
(times per day)
Mbytes/year
Security system center
1 1 55 100 144 N/A 7,77 7,77
Light switches 20 40 79 2 5 N/A 2.82 5.64
Electric meter 1 1 79 100 144 N/A 8.97 8.97
Electrical outlets 10 40 79 4 3 N/A 0.87 3.47
Temperature 3 10 79 4 5 N/A 0.43 1.44
Total 40 105 21 27
Table 5-2 shows that trigger traffic of fire and smoke sensors is minimal, as it is only when a smoke or humidity alarm is triggered that it will send an event message and this happens rarely. Again it is the security critical systems that account for the majority of the traffic. The electricity meter and security system both have high trigger frequencies and large payloads as the company operators that are responsible need high reliability and security.
28

6 Hardware The prototype was built using off the shelf WPAN hardware and tested/evaluated with the help of
PCs and a prototype Ericsson home gateway. A number of WPAN hardware kits were considered as potential platforms for development and testing purposes. Three of these are described below. Each of them comes with example software and tools enabling a developer to quickly get started with application development.
6.1 Sensinode Development Kit The Sensinode kit [25] contains two NanoSensor nodes with tri-axis accelerometer sensors and
illumination sensors. The kit also contains two USB NanoRouters to connect a PC to the IEEE 802.15.4 network. The NanoSensors are powered by Texas Instruments (TI) 2431 System-on-Chip (SoC) radio modules and for testing have two buttons, two LEDs, and a 9-pin expansion connector with analog and digital inputs and output, debugging, and UART signals. The kit comes with programming examples in C and Java, Sensinode’s IPv6 stack NanoStack and a demo version of NodeView are included. The preliminary price is 500€.
6.2 Sentilla Perk Sentilla Perk [26] contains two JCreate motes and one USB gateway device for connecting a PC to the
motes. Originally it runs Sentilla's Java ME CLDC 1.1 complaint software standard, but to enable IPv6/6LoWPAN there is a Contiki port that can be run on the JCreate motes [27]. Each JCreate is powered by a TI MSP430 microprocessor and a TI/Chipcon CC2420 wireless transceiver. The motes have on-board tri-axis accelerometers and 8 LEDs for development feedback. Furthermore they have two expansion ports for incorporating standard sensors and one 16-pin expansion connector for miscellaneous sensors. List price is US$199 with additional JCreate motes costing $90 each as of July 21, 2009.
6.3 Moteiv tmote sky The tmote sky is the predecessor of the JCreate nodes since moteiv changed its name to Sentilla. The
tmote sky has luminance, temperature, and humidity sensors and is powered by the same CC2420 wireless transceiver and TI MSP430 microprocessor. The Contiki OS has used the tmote sky as one of its main testing platforms and as such Contiki on these nodes is a mature solution. The tmote sky nodes were a very popular model for developing WPAN solutions and prototypes, but have stopped being produced since the JCreate node’s introduction.
29

7 Connected home demo The purpose of the demo is to build a working implementation of a collection of functions that could
be found in an automated home e.g. remote control and monitoring of devices, events in the house triggering communication outside the home network, i.e. alarms being sounded.
Other activities will be to:
• through using the OSGi framework evaluate its usability and functions
• evaluate approaches to different operators sharing open resources (sensors and data) and limiting access to sensitive resources using the OSGi framework,
• show end-to-end use-case between sensor nodes and management station,
• show end-to-end use-case between user and connected home network,
• use a simple binary protocol on top of 6LoWPAN networking to send messages and data.
The hardware and software tools used in the prototype will be as much as possible representative of a real life solution. The tools will be:
Table 7-2 – Tools for prototype
Hardware Description
Tmote sky wireless sensor nodes Battery powered nodes with temperature, humidity and light sensors. Will run Contiki and SICSLoWPAN sending data and receiving commands from the HIGA.
Gateway The MIPS powered platform for prototyping the HIGA
Laptop (HP 6930p) Acting as management station in network initiated use-case and as user in user initiated use-case.
Software
Java 1.4/Knopflerfish OSGi Java JRE on the HIGA and the OSGi implementation in use
Contiki and 6LoWPAN (SICSLoWPAN) implementation
Program environment on the tmote sky nodes
Linux gateway 2.6.21.5 Operating system on the HIGA. Customized Linux kernel running BusyBox and with a lot of unnecessary functionality removed.
Java 1.4/1.6 Java JRE on the management station/user platform
Ericsson Home IMS Gateway Suite with functionality for OSGi, IMS, IPTV, DLNA etc. OSGi is the only tool used in the prototype
30
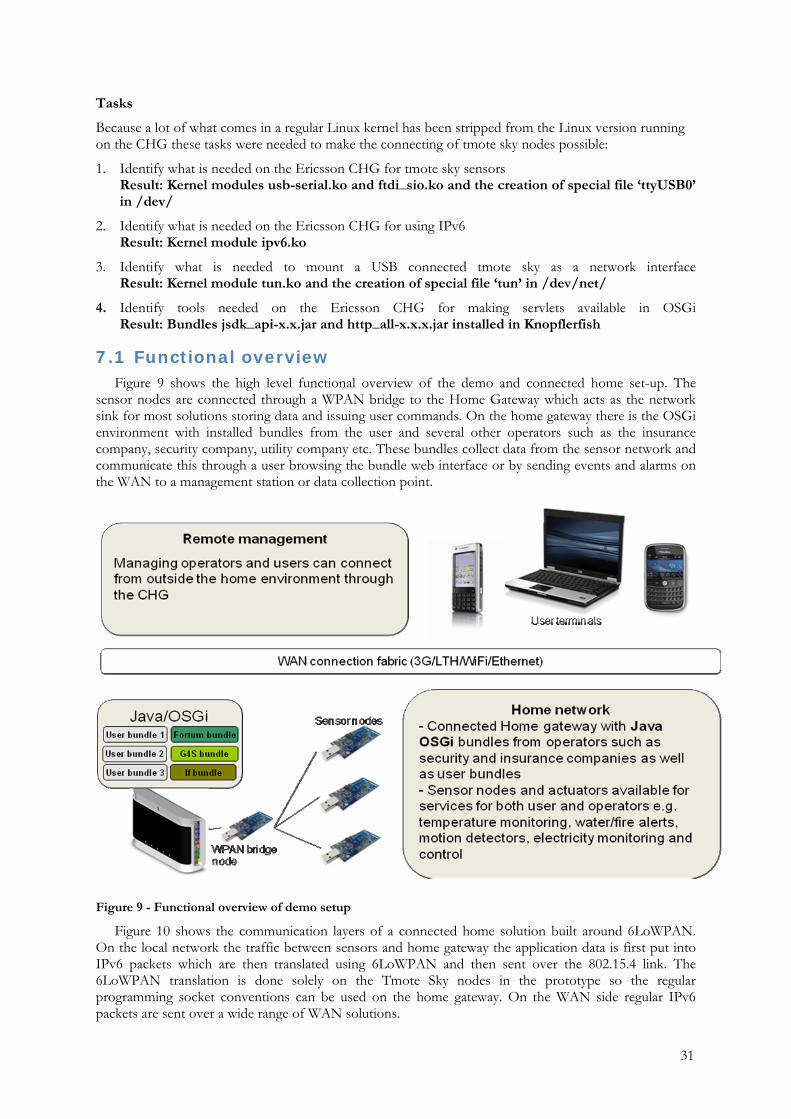
Tasks
Because a lot of what comes in a regular Linux kernel has been stripped from the Linux version running on the CHG these tasks were needed to make the connecting of tmote sky nodes possible:
1. Identify what is needed on the Ericsson CHG for tmote sky sensors Result: Kernel modules usb-serial.ko and ftdi_sio.ko and the creation of special file ‘ttyUSB0’ in /dev/
2. Identify what is needed on the Ericsson CHG for using IPv6 Result: Kernel module ipv6.ko
3. Identify what is needed to mount a USB connected tmote sky as a network interface Result: Kernel module tun.ko and the creation of special file ‘tun’ in /dev/net/
4. Identify tools needed on the Ericsson CHG for making servlets available in OSGi Result: Bundles jsdk_api-x.x.jar and http_all-x.x.x.jar installed in Knopflerfish
7.1 Functional overview Figure 9 shows the high level functional overview of the demo and connected home set-up. The
sensor nodes are connected through a WPAN bridge to the Home Gateway which acts as the network sink for most solutions storing data and issuing user commands. On the home gateway there is the OSGi environment with installed bundles from the user and several other operators such as the insurance company, security company, utility company etc. These bundles collect data from the sensor network and communicate this through a user browsing the bundle web interface or by sending events and alarms on the WAN to a management station or data collection point.
Figure 9 - Functional overview of demo setup
Figure 10 shows the communication layers of a connected home solution built around 6LoWPAN. On the local network the traffic between sensors and home gateway the application data is first put into IPv6 packets which are then translated using 6LoWPAN and then sent over the 802.15.4 link. The 6LoWPAN translation is done solely on the Tmote Sky nodes in the prototype so the regular programming socket conventions can be used on the home gateway. On the WAN side regular IPv6 packets are sent over a wide range of WAN solutions.
31
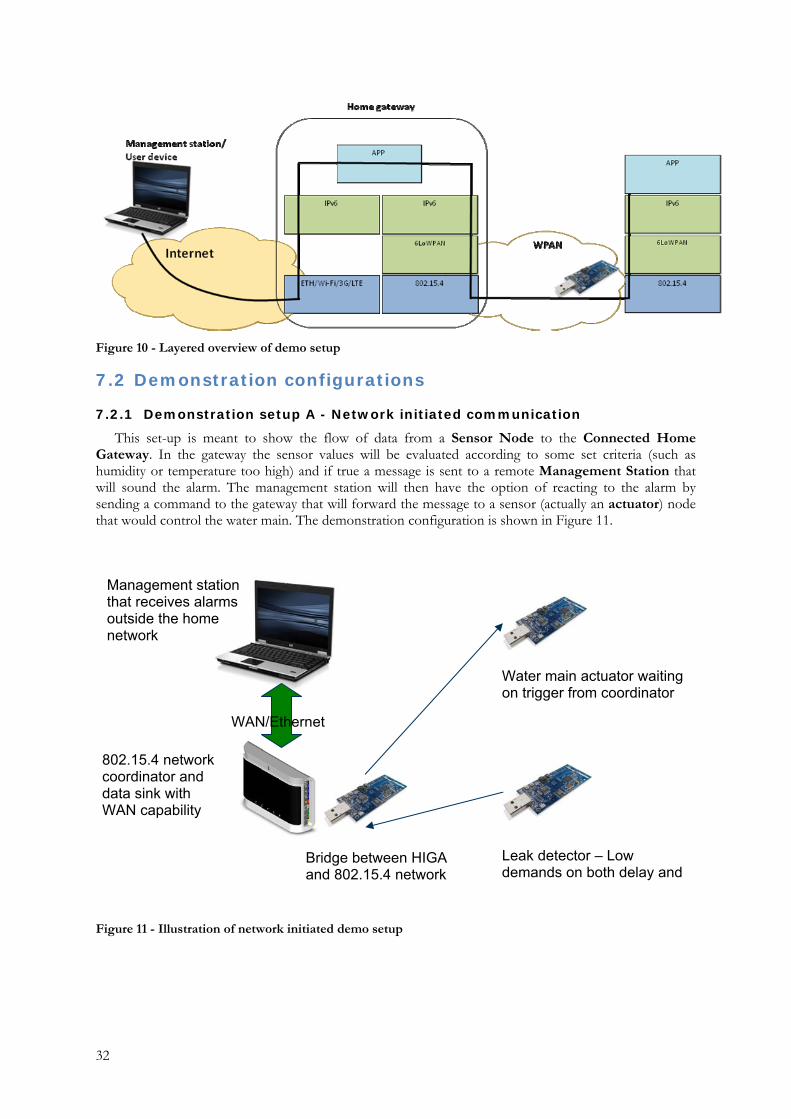
Figure 10 - Layered overview of demo setup
7.2 Demonstration configurations
7.2.1 Demonstration setup A - Network initiated communication
This set-up is meant to show the flow of data from a Sensor Node to the Connected Home Gateway. In the gateway the sensor values will be evaluated according to some set criteria (such as humidity or temperature too high) and if true a message is sent to a remote Management Station that will sound the alarm. The management station will then have the option of reacting to the alarm by sending a command to the gateway that will forward the message to a sensor (actually an actuator) node that would control the water main. The demonstration configuration is shown in . Figure 11
Management station that receives alarms outside the home network
Water main actuator waiting on trigger from coordinator
WAN/Ethernet
802.15.4 network coordinator and data sink with WAN capability
Leak detector – Low demands on both delay and
Bridge between HIGA and 802.15.4 network
Figure 11 - Illustration of network initiated demo setup
32

7.2.2 Demonstration setup B – User initiated communication
Figure 12 shows the control that a user could have of a connected home. The user will surf using a web browser to the CHG where he/she will be offered statistics derived from the sensors detected in the house and control of those that are interactive, e.g. update the temperature readout or control the A/C system (simulated by a sensor mote flashing its lights).
7.3 Design choices These are the design choices made when developing the prototype.
1. IP addresses configured using IPv6 Stateless Address Auto configuration as per RFC4862.
2. One port on the gateway is used for each type of sensor. If a bundle on the gateway receives a message from the wrong sensor type, then it sends a NACK to that sensor – the alternative would be to have one port shared by all sensors, but that would mean that one single bundle would have to collect all sensor data making it difficult to ensure security and confidentiality.
3. Service discovery is sensor initiated with a new sensor initially sending out a pairing request at a set interval until it gets an ACK from a responding gateway. After this the sensor sends messages when its internal timer expires or when asked to do so by the gateway.
4. UDP will be used as the transport protocol with acknowledgements being handled on the application layer. This must be done because not all messages from sensors should be acknowledged, in order to limit the amount of overhead and due to chatty traffic patterns. Also when testing with a TCP solution the 3-way handshake reduced communications throughput.
Bridge between HIGA and 802.15.4
Temperature sensor – (getTemp)
User on WAN connected device surfs to CHG web interface and checks sensors
A/C system - (Timer/ON/OFF)
WAN/Ethernet
802.15.4 network coordinator and data sink with WAN capability hosting web interface for user services
Lightswitch – (ON/OFF)
Figure 12 - Illustration of user initiated demo setup
33
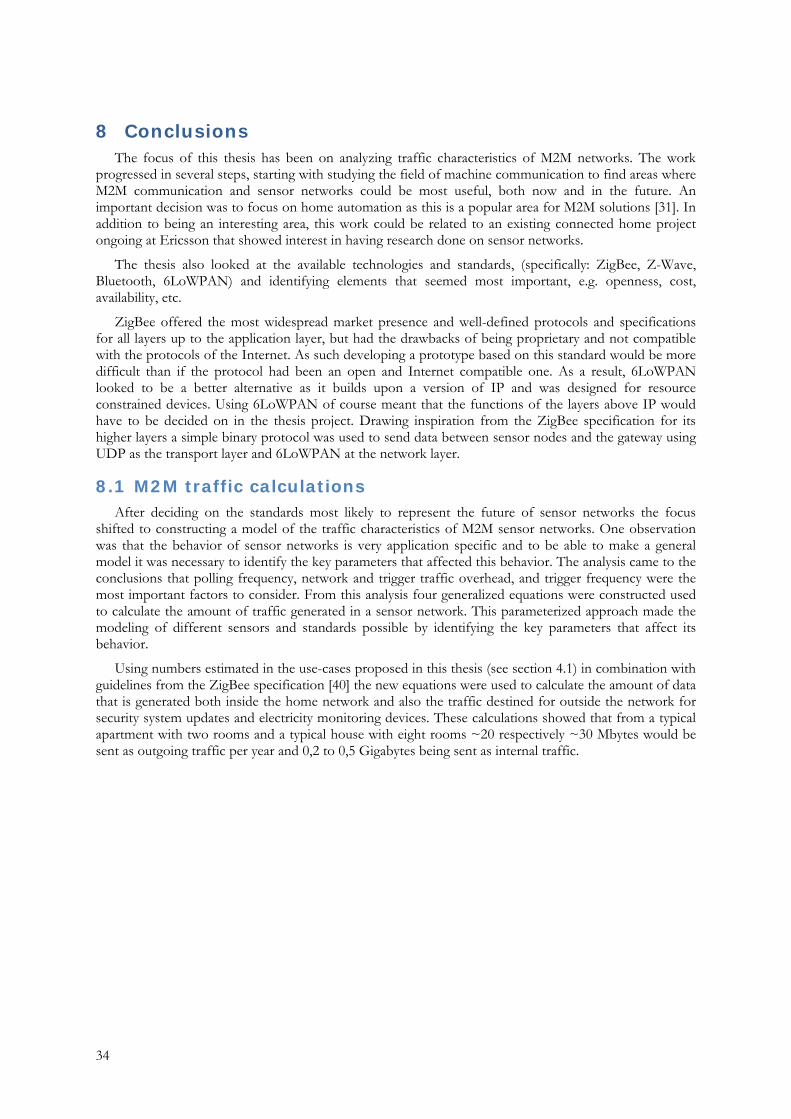
8 Conclusions The focus of this thesis has been on analyzing traffic characteristics of M2M networks. The work
progressed in several steps, starting with studying the field of machine communication to find areas where M2M communication and sensor networks could be most useful, both now and in the future. An important decision was to focus on home automation as this is a popular area for M2M solutions [31]. In addition to being an interesting area, this work could be related to an existing connected home project ongoing at Ericsson that showed interest in having research done on sensor networks.
The thesis also looked at the available technologies and standards, (specifically: ZigBee, Z-Wave, Bluetooth, 6LoWPAN) and identifying elements that seemed most important, e.g. openness, cost, availability, etc.
ZigBee offered the most widespread market presence and well-defined protocols and specifications for all layers up to the application layer, but had the drawbacks of being proprietary and not compatible with the protocols of the Internet. As such developing a prototype based on this standard would be more difficult than if the protocol had been an open and Internet compatible one. As a result, 6LoWPAN looked to be a better alternative as it builds upon a version of IP and was designed for resource constrained devices. Using 6LoWPAN of course meant that the functions of the layers above IP would have to be decided on in the thesis project. Drawing inspiration from the ZigBee specification for its higher layers a simple binary protocol was used to send data between sensor nodes and the gateway using UDP as the transport layer and 6LoWPAN at the network layer.
8.1 M2M traffic calculations After deciding on the standards most likely to represent the future of sensor networks the focus
shifted to constructing a model of the traffic characteristics of M2M sensor networks. One observation was that the behavior of sensor networks is very application specific and to be able to make a general model it was necessary to identify the key parameters that affected this behavior. The analysis came to the conclusions that polling frequency, network and trigger traffic overhead, and trigger frequency were the most important factors to consider. From this analysis four generalized equations were constructed used to calculate the amount of traffic generated in a sensor network. This parameterized approach made the modeling of different sensors and standards possible by identifying the key parameters that affect its behavior.
Using numbers estimated in the use-cases proposed in this thesis (see section 4.1) in combination with guidelines from the ZigBee specification [40] the new equations were used to calculate the amount of data that is generated both inside the home network and also the traffic destined for outside the network for security system updates and electricity monitoring devices. These calculations showed that from a typical apartment with two rooms and a typical house with eight rooms ~20 respectively ~30 Mbytes would be sent as outgoing traffic per year and 0,2 to 0,5 Gigabytes being sent as internal traffic.
34
1. How much of the traffic sent is network overhead? The ZigBee solution calculates to a node sending at least 40 Mbytes per year with the purpose of maintaining the network and polling for new data. Comparing this with Table 5-2 where the trigger traffic for a year is ~1-10 Mbytes we see that the relationship between network and trigger traffic can range between 40:1 to 4:1 in a ZigBee solution that is following the home automation specification.
The traffic sent when maintaining a 6LoWPAN network is application specific. If the estimations from Table 5-1 are used the network traffic amounts to ~1-25 Mbytes/year. Using the estimations from Table 5-2, but with a per packet overhead of ~50 bytes we can calculate the trigger traffic amount to be ~.5-5 Mbytes/year depending on the sensor type. The relationship between network and trigger traffic can then be in the range 2:1 to 5:1.
2. How much of the data sent is transmission overhead, i.e. how much application payload (goodput) per frame can one expect?
From we see that the typical overhead in ZigBee packets is 79 bytes, when using 64 bit addressing, leaving 48 bytes for application data. As ZigBee uses a binary protocol this amount of data is sufficient for most purposes in an automated home such as temperature readings, remote control, alarms without having to send several packets fragmenting data.
Table 2-1
The overhead in a similar 6LoWPAN set-up using UDP will be lower than the ZigBee solution. The MAC header can be identical, 6LoWPAN adds two (2) bytes and UDP adds 8 bytes resulting in a total of 49 bytes overhead per frame leaving 78 bytes free for application data.
3. How well do the 802.15.4 nodes perform in large numbers e.g. does the home automation use-case seem possible with its requirements in number of nodes and amount of data?
According to [52] the ZigBee Home Automation networks scale from 2 to 500 nodes and from [53] we see that an industry installation running on 802.15.4 equipment can work reliably with 800+ nodes. Both these sources show that the estimated scenario of 50-100 sensors in an automated home is supported by the 802.15.4 technology.
The interference experiment in Chapter 3.4 shows that a 600 sensors network would be possible with regards to timing and data amount, but does not take into account radio propagation issues such as fading. This should not be an issue as the estimated largest number of sensors in an automated home is one hundred making the experiment support the use-cases.
8.2 WPAN standards When comparing WPAN standards the conclusion was that no killer app exists yet. ZigBee is the
current market leader, but still has drawbacks in that it is not IP compliant and is a proprietary standard. In April 2009, the ZigBee foundation realized this and announced their efforts to enhance their application capabilities with native IP support, allowing seamless integration of Internet connectivity into each product. The advantage of ZigBee is its strong application protocol specification defining exactly how to communicate many different alarms and messages. This specification enables partners to build interoperable solutions giving the possibility of combining parts from different vendors for a complete ZigBee solution.
While ZigBee is a solution that has all the layers and protocols defined, 6LoWPAN as a solution offers only the protocols for network communication as it is not a complete framework, but a compressed IP and fragmentation specification. This means that the possibilities of upper layers are endless, also it means that standardization and interoperability can be a challenge. The 6LowApp initiative is one of the groups attempting to give structure and standardization to the field with backing from many companies and research projects (Arch Rock, SENSEI, and Contiki being some that I have come in contact with). The field of WPANs is far from fully explored and there are still many issues concerning what the proper APIs, abstractions, mechanisms, and protocols should be.
A possible implementation brought up both in this thesis and by G. Tolle in a RFC draft is to use the underlying protocols of EEE 802.15.4 (MAC/PHY), 6LoWPAN (NWK), UDP/TCP, and the upper
35

protocols of ZigBee (APS, ZCL) in order to offer a complete solution that is both Internet compatible and well structured for interoperability [39].
8.3 Contiki Contiki and its 6LoWPAN implementation (SICSLoWPAN) have performed very well in the
prototyping phase of this thesis. From a developer’s point of view the API and system design is simple to understand and use. The features of Contiki (proto-threads, uIP stack, Rime protocols, timers, etc.) all combine to make the tmote sky nodes into powerful communication tools for application in a broad set of application areas.
The maturity of Contiki is hard to judge as it is continually evolving, removing and adding features. This means that companies interested in developing applications on and using tools from Contiki might look elsewhere, this hurts Contiki and the companies as Contiki might offer a beneficial solution to their work A possible solution discussed in the Contiki mailing list is to have a stable branch with features tested and that will be supported and a development branch with new features that may or may not be included in the stable branch. This approach is popular among developing R&D projects.
8.4 OSGi evaluation One of the goals of prototyping was to evaluate the OSGi framework. Having not worked with it
before, but having a solid background in programming I think I represent a typical beginner OSGi developer well. After using OSGi to develop the prototype my evaluation is that the OSGi framework is easy to work with and enables developers and operators to have separation between their functions while also making sharing resources possible. These enablers are both needed to make the business aspects of an automated home possible.
Porting software from being a standalone Java application to running in an OSGi environment is simple and can be done quickly, this is because the functionality of OSGi is concentrated in the Activator class and the Service Tracking functionality leaving the application specific functionality mostly untouched.
Installing, starting, stopping and updating software can all be done dynamically and remotely and the Java virtual machine technology makes portability to other operating systems and hardware a possibility.
Adding new packages for new functionality e.g. http servlets to create a web interface for a application is simple and using Service Trackers makes dependencies known before running the application.
36
9 Future work
9.1 KTH A number of tasks could be done in future work via KTH:
1. Acquire more real world sensor data and compare this with estimated calculations to improve the thesis developed model and equations.
2. Defining and implementing secure communications between sensor node and sensor node, sensor node and gateway and gateway and remote operator.
3. Investigate the effort of implementing application layers and mechanisms on top of 6LoWPAN as being done in 6LoWApp.
4. Investigate the use of the ZCL and APS layers of ZigBee on top of 6LoWPAN and the advantages and disadvantages of this.
9.2 Ericsson Continue development of demo bundles to cover more uses and more functionality e.g. IMS
functionality together with sensor networks. Because the home gateway as a product isn’t complete without applications that run on it Ericsson should create some incentives to outside developers to build applications for the Home gateway e.g. a prize competition for the best OSGI home gateway software etc.
Evolve the demonstration set-up from the thesis and apply the concept on the proposed Ericsson smart city project to make some different types of studies:
1. Concept study
2. Small demonstration and basic evaluation
3. A concept study project where we include smart mobile control of the home environment and run this as a trial in cooperation with a partner company
4. Implementation a proposal for a small commune
5. Delivery of products & solutions
9.3 Home automation partners Developing OSGi compatible applications that utilizes sensors in an automated home could become a
successful business. It is not likely that Ericsson, Fortum or G4S will develop their own software in-house; so starting a software company specializing in home gateway software would have a good chance of having projects from many areas of industry. The challenge is that both the software (applications) and hardware (home gateways) need to exist before it can become desirable for the home mass market. This means that the home gateway vendors and software developers need to work together to be successful.
Although not much is known about the ZigBee Alliance incorporating IP into the ZigBee specification it is a good decision as this opens up their partner products to a wider range of gateways and also uses as the sensor nodes will be more accessible without the ZigBee/IP translations being needed.
37

References [1] Berg Insight, “Berg Insight for the global wireless M2M market”, Report, October 27, 2008
[2] CEMA Demo lab environment – Located at Ericsson, Kista. Includes an IITB, QuicLINK, etc.
[3] Ericsson, “QuicLINK – a 3G network in a box”, [WWW], Ericsson, July 12, 2007 http://www.ericsson.com/solutions/news/2007/q3/20070712_quiclink.shtml
[4] Berg Insight, “Car Telematics and Wireless M2M”, Report, January 2007, [WWW], http://bic.ericsson.se/sources/berg_insight/2007-01_car_telematics_and_wireless_m2m.pdf
[5] Wikipedia, “Standby power”, [WWW], 18 June, 2009, http://en.wikipedia.org/wiki/Standby_power
[6] New PRIMES Baseline Scenario, Prof. P. Capros E3MLab – NTUA, [WWW], 2006, http://www.eusustel.be/public/documents_publ/meetings/june_meeting/EUSUSTEL%202006%20New%20PRIMES%20Baseline%20Scenario.pdf
[7] Towards a European Strategic Energy Technology Plan, [WWW], COM(2006), http://eur-lex.europa.eu/LexUriServ/site/en/com/2006/com2006_0847en01.pdf
[8] An Energy Policy for Europe, Commission of the European Communities, 2007, [WWW], http://www.europarl.europa.eu/meetdocs/2004_2009/documents/com/com_com(2007)0001_/com_com(2007)0001_en.pdf
[9] Limiting Global Climate Change to 2 degrees Celsius - The way ahead for 2020 and beyond, COMMISSION OF THE EUROPEAN COMMUNITIES, 2007, [WWW], http://eur-lex.europa.eu/LexUriServ/site/en/com/2007/com2007_0002en01.pdf
[10] IP for Smart Objects (IPSO) White Paper #1, IPSO Alliance, September 2008, [WWW], http://www.ipso-alliance.org/Documents/IPSO-WP-1.pdf
[11] IP for Smart Objects (IPSO) Alliance homepage, IPSO Alliance, July 2009, [WWW], http://www.ipso-alliance.org/Pages/Front.php
[12] Z-Wave on Wikipedia, Wikipedia.org, 7 July 2009, [WWW], http://en.wikipedia.org/wiki/Z-wave
[13] ZigBee on Wikipedia, Wikipedia.org, 24 June 2009, [WWW], http://en.wikipedia.org/wiki/Zigbee
[14] 6LoWPAN on Wikipedia, Wikipedia.org, 1 July 2009, [WWW], http://en.wikipedia.org/wiki/6LoWPAN
[15] Our Company, Zensys, 2007, [WWW], http://web1.zen-sys.com/modules/Company/?id=1&chk=a2d0d7c36c3ee182ca83c332a9a675fa
[16] Wibree forum merges with Bluetooth SIG, Nokia Research Center, June 2007, [WWW], http://research.nokia.com/node/254
[17] Bluetooth Low Energy on Wikipedia, Wikipedia.org, 20 June 2009, [WWW], http://en.wikipedia.org/wiki/Bluetooth_low_energy
[18] 802.15.4 vs. ZigBee, David Gascón, November 17 2008, [WWW], http://www.sensor-networks.org/index.php?page=0823123150
[19] Ericsson homepage, L. M. Ericsson AB, July 13 2009, [WWW], http://www.ericsson.com/
[20] Connected home, L. M. Ericsson AB, January 19 2009, [WWW], http://www.ericsson.com/developer/sub/articles/other_articles/090119_connected
[21] About Us, Home Gateway Initiative, 2007, [WWW], http://www.homegateway.org/aboutus/index.html
[22] Shuang Di, USB Attached Network Performance, Masters thesis, Royal Institute of Technology (KTH), School of Information and Communication Technology, April 2 2009, [WWW], http://web.it.kth.se/~maguire/DEGREE-PROJECT-REPORTS/090403-Shuang_Di-with-cover.pdf
[23] Description and list of packet generators, Wikipedia.org, July 10 2009, [WWW], http://en.wikipedia.org/wiki/Packet_generator
[24] M2M Traffic Scenarios and Forecasts 2009-2014, Berg Insight AB, March 2009, [Report]
[25] Sensinode Evaluation Kits, Sensinode Ltd, 2008, [WWW], http://www.sensinode.com/EN/products/evaluation-kits.html
[26] Sentilla Perk, Sentilla Corporation, 2008, [WWW], https://www.sentilla.com/store/product.php?productid=1&cat=0&page=1
38

[27] Adam Dunkels, Changelog for Contiki OS, June 2009, [WWW], http://www.sics.se/contiki/changelog.html
[28] IPv6 Stateless Address Auto configuration, Thomson & Narten, December 1998, [WWW], http://tools.ietf.org/html/rfc2462
[29] G. Montenegro, et al., Transmission of IPv6 Packets over IEEE 802.15.4 Networks, September 2007, [WWW], http://tools.ietf.org/html/rfc4944
[30] S. Deering & R. Hinden, Internet Protocol, Version 6 (IPv6) Specification, IETF, Network Working Group, RFC 2460, December 1998, [WWW], http://tools.ietf.org/html/rfc2460
[31] BeyWatch roadmap, BeyWatch Consortium, 2008, [WWW], http://www.beywatch.eu/pub.php
[32] IEEE 802 working group, Part 15.4: Wireless Medium Access Control (MAC) and Physical Layer (PHY) Specifications for Low-Rate Wireless Personal Area Networks (WPANs), IEEE Computer Society, Standard specification, [WWW], http://standards.ieee.org/getieee802/download/802.15.4-2006.pdf
[33] ZigBee protocol stack, Mitsubishi Electric Research Laboratories, 2009, [WWW], http://www.merl.com/projects/images/zigbeesec.jpg
[34] Ericsson Service Development Studio (SDS), L.M. Ericsson, 20 February 2009, [WWW], http://www.ericsson.com/developer/sub/open/technologies/ims_poc/tools/sds_40
[35] 50 billion connections by 2020, Louise Forshell, 26 May 2009, [WWW], http://app4.internal.ericsson.com/news/BU_Networks.asp?ItemID=27586
[36] Design and Implementation of a Gateway for Web-based Interaction and Management of Embedded Devices, Vlad Trifa et al., June 2009, [WWW], http://www.webofthings.com/wp-content/uploads/2009/06/paper.pdf
[37] IETF75 Bar Bof: 6LowApp: Applications in resource-constrained networks, IETF, July 2009, [WWW], https://trac.tools.ietf.org/area/app/trac/wiki/BarBofs/IETF75/6LowApp
[38] Goodput on Wikipedia, Wikipedia.org, 11 August 2009, [WWW], http://en.wikipedia.org/wiki/Goodput
[39] A UDP/IP Adaptation of the ZigBee Application Protocol, G. Tolle, October 8 2008, [WWW], http://tools.ietf.org/html/draft-tolle-cap-00
[40] ZigBee specification, ZigBee alliance, January 17 2008, [WWW], http://www.zigbee.org/Products/TechnicalDocumentsDownload/tabid/237/Default.aspx
[41] Wang, H., Sheng, B. and Li, Q. (2006) ‘Elliptic curve cryptography-based access control in sensor networks’, Int. J. Security and Networks, Vol. 1, Nos. 3/4, pp.127–137, http://www.cs.wm.edu/~liqun/paper/ijsn06.pdf
[42] Wikipedia on hybrid-cryptosystem, Wikipedia.org, 16 July 2009, [WWW], http://en.wikipedia.org/wiki/Hybrid_cryptosystem
[43] Wikipedia on CCM mode, Wikipedia.org, 15 May 2009, [WWW], http://en.wikipedia.org/wiki/CCM_mode
[44] ZigBee-2007 Layer PICS and Stack Profiles, ZigBee alliance, June 2008, [WWW], http://www.zigbee.org/Products/TechnicalDocumentsDownload/tabid/237/Default.aspx
[45] 6LowApp Bar BOF intro, Don Sturek and Pacific Gas and Electric Company, August 2009, [WWW], http://trac.tools.ietf.org/area/app/trac/attachment/wiki/BarBofs/IETF75/6LowApp/6lowapp-intro-v2.pdf
[46] Fukt kan ge stora skador, omBoende.se, January 2009, [WWW], http://www.omboende.se/sv/Aga1/Inomhusmiljo/Vattenskador-/
[47] Antal hushåll i Sverige med olika beräkningsmetoder, Statistiska centralbyrån, 2007, [WWW], http://www.scb.se/Pages/TableAndChart____146283.aspx
[48] Räddningstjänst i siffror, Räddningsverket, 2007, [WWW], http://www.raddningsverket.se/upload/Statistik/räddningstjänst/räddningstjänst%20i%20siffror%202007%20tabellbilaga.xls
[49] Compression Format for IPv6 Datagrams in 6LoWPAN Networks, J. Hui, July 2008, [WWW], http://tools.ietf.org/html/draft-hui-6lowpan-hc-01
[50] Home Heartbeat, EATON Corporation, 2009, [WWW], http://www.homeheartbeat.com/HomeHeartBeat/index.htm
[51] essModel homepage, ELDEAN, 2003, [WWW], http://essmodel.sourceforge.net/
[52] ZigBee Home Automation Public Application Profile, ZigBee Alliance, 2009, [WWW], http://www.zigbee.org/ZigBeeHomeAutomationPublicApplicationProfile/tabid/313/Default.aspx
[53] Network Case Study: Twisthink Wireless Lighting Control, Ember, April 10 2009, [WWW], http://www.ember.com/pdf/120-5060-000_Twisthink_Network_Performance.pdf
39

40
Appendix A - ZigBee/802.15.4 headers
Figure 13 – ZigBee ZCL payload [40] (Appears with permission of ZigBee Alliance)
Figure 14 – ZigBee ZCL header [40] (Appears with permission of ZigBee Alliance)
Figure 15 – ZigBee APS header [40] (Appears with permission of ZigBee Alliance)
Figure 16 – ZigBee NWK header [40] (Appears with permission of ZigBee Alliance)
Figure 17 – 802.15.4 MAC header [32] (Appears with permission of IEEE)
Figure 18 – 802.15.4 PHY frame [32] (Appears with permission of IEEE© [2006])

Appendix B – Modifications to run Contiki on a Connected Home Gateway Ubuntu 7.10 image
Install WMware Player, can be found here.
In Windows, install the FTDI Virtual COM port (VCP) drivers. This enables the USB device (tmote) to appear as an additional COM port available to the PC. The FTDI driver can be found here.
Run the Ubuntu 7.10 CHG DevEnv image file in WMware Player.
Download the Contiki Source Code to the WMware image. Can be found here
To be able to compile for the MSP430 microprocessor we need to add these packages to the image. These can be installed from the http://wyper.ca/debian i686/ repository. For further details see Step 1 here.
binutils-msp430
gcc-msp430
msp430-libc
Package “brltty” must be stopped or removed because of a bug that makes it claim the USB port that the mote is plugged into. More information can be found here.
41

Appendix C – Manual for Ericsson Connected Home Gateway demonstration use-cases
Program one or more sensor nodes with the thesis developed udp-client software.
Connect a sensor node over USB with the CHG and program it to run the uip6_bridge_tap software found in /Contiki/tools/sky/uip6_bridge_tap/. The sensor mote which will be referred to as bridge-mote from here on now runs a Contiki core with a 6LoWPAN implementation. The bridge-mote checks incoming packets for the correct addressing i.e. addressed to the machine with the bridge-mote attached and if it is uses its 6LoWPAN implementation to translate the packet to regular IPv6 format which the CHG in this case can understand.
After this, mount the bridge mote as a network interface using the Contiki tapslip6 program in /Contiki/tools/.
In the Knopflerfish OSGi framework install and start bundles jsdk_api-2.5.jar, http_all-2.1.1.jar, sensorsky.jar and httpSensor.jar. Now the SensorSky OSGi bundle will receive the packet and send an ACK packet in response to the sensor. To access information on which sensors were found and their latest measured data received you should surf to the gateways address and port 8080.
To set up the management station start its .jar file. It will receive messages from the SensorSky bundle when the threshold values in SensorSky are exceeded and display them when you press refresh.
42

Appendix D – SensorSky OSGi Bundle Overview of the SensorSky bundle
Activator – OSGi specific functionality for starting, stopping, registering bundles and exporting/importing resources from other bundles
receiveThread – Receives incoming UDP packets from sensors and starts a new processThread to process the packet
sendThread – Sends a command to a sensor, called from httpSensor bundle
processThread – Processes new packets received from receiveThread, sends responses to sensors
Figure 19 - UML diagram of SensorSky bundle (Generated using essModel [51])
43

44
Appendix E – HttpSensor OSGi Bundle Overview of the httpSensor bundle
Activator – OSGi specific functionality for starting, stopping, registering bundles and exporting/importing resources from other bundles
HttpServiceTracker – Monitors if there is an HttpService service registered
SensorServiceTracker - Monitors if there is an SensorSky service registered
HttpSensorServlet – Servlet that retrieves statistics from SensorSky bundle and makes them web accessible. Also from user interaction sends commands to SensorSky which sends the command to sensor nodes
Figure 20 - UML diagram of httpSensor bundle (Generated using essModel [51])

www.kth.se
TRITA-ICT-EX-2009:212