Mobile Handset Population in Finland 2005 2012 -...
17
Antti Riikonen / Timo Smura MoMIE project report April 11th, 2013 Mobile Handset Population in Finland 2005 – 2012
Transcript of Mobile Handset Population in Finland 2005 2012 -...

Antti Riikonen / Timo Smura MoMIE project report April 11th, 2013
Mobile Handset Population in Finland 2005 – 2012
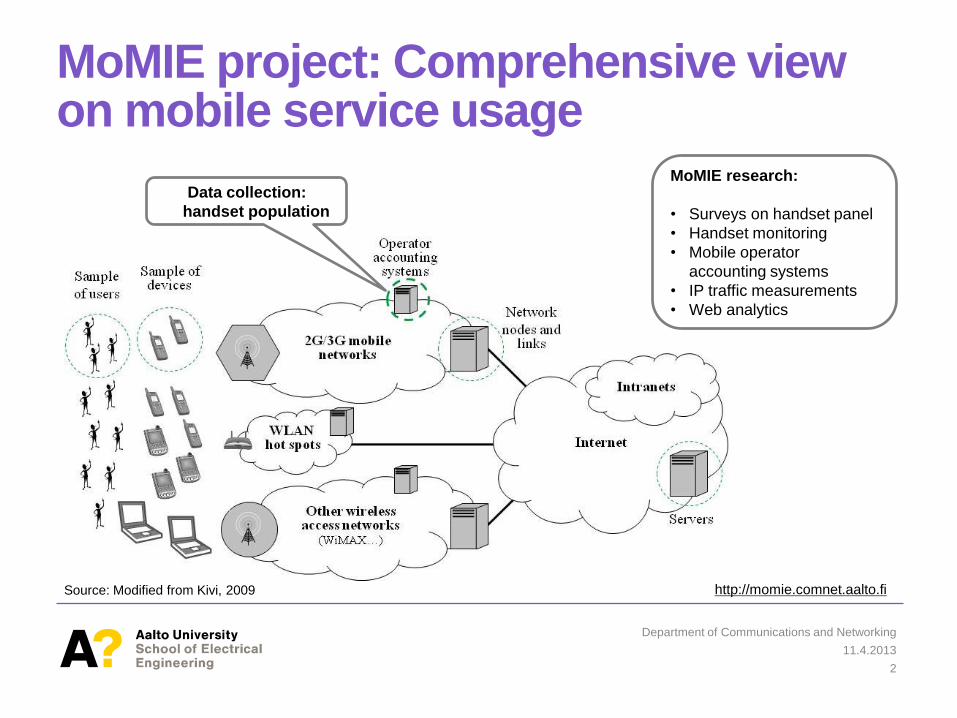
MoMIE project: Comprehensive view on mobile service usage
11.4.2013
Department of Communications and Networking
2
Source: Modified from Kivi, 2009
Data collection:
handset population
http://momie.comnet.aalto.fi
MoMIE research:
• Surveys on handset panel
• Handset monitoring
• Mobile operator
accounting systems
• IP traffic measurements
• Web analytics

Data collection: handset population
Data collected from mobile operators’ accounting systems • Data from DNA, Elisa, and TeliaSonera • Collected in the end of September, annually 2005–2012 • Feature information from GfK and public sources
Data represents 80-99% of devices in use in Finnish mobile networks (~99% in 2012) • Includes devices observed at operators’ network • Some error due to
- No data on Apple iPhone between 2005 and 2010
- Mobile subscriber churn during observation period - Differences in operator-specific data sets - Unidentified devices and missing feature-data of handset models
11.4.2013
3
Department of Communications and Networking

0
2
4
6
8
10
2005 2006 2007 2008 2009 2010 2011 2012
Dev
ices
M
illio
ns
Shares of device types in Finnish mobile device population
Other/Unknown
Data terminal
Handset
Device types
Share of data terminals growing slowly
• USB modems as the major category
• Tablets roughly 1.5% out of all devices (does not include WLAN-only tablets)
Size of the active device population growing
• Exact size depends on definition
• Here, size of the population assumed to equal the total number of mobile subscriptions
• Relative shares of handsets and data terminals based on MoMIE measurements
Other/Unknown and Data terminals excluded from the rest of the analyses
11.4.2013
4
* Other + unknown
device types (e.g.
desktop phones)
** USB modems, data cards,
tablets, embedded data
modules
Department of Communications and Networking
76%
22%
2%
Mobile Handset
Data terminal**
Other/Unknown*

Fragmentation of handset population has stopped
Top models’ share of all handsets has stopped decreasing
• Top 1 model
- 14% (2005) 4% (2012)
• Top 10 models
- 50% (2005) 25% (2012)
Between 2005 – 2008, the number of available models increased, increasing fragmentation
• Since 2008, the amount of available models has remained rather stable
11.4.2013
5
Department of Communications and Networking

Top handset models in use in Finland September 2012
More smartphones
included in top models
Top 3 • Models introduced in 2010
• All equipped with 3G connectivity
Top 15 • 7 smartphone models
• Only one model (Nokia 1100) not capable of Internet access
11.4.2013
6
Department of Communications and Networking
Rank Model name Intro
yearShare
Change
from '11
Packet
data
1 Nokia C2-01 2010 3.9% Yes (3G)
2 Nokia C5-00 2010 2.8% Yes (3G)
3 Apple iPhone 4 2010 2.7% Yes (3G)
4 Apple iPhone 4S 2011 2.5% Yes (3G)
5 Nokia 3720 Classic 2009 2.3% Yes (2G)
6 Nokia 7230 2009 2.2% Yes (3G)
7 Nokia E7-00 2010 2.2% Yes (3G)
8 Nokia Lumia 800 2011 2.1% Yes (3G)
9 Nokia C1-01 / C1-03 2010 2.0% Yes (2G)
10 Nokia 2760 2007 1.9% Yes (2G)
11 Nokia 2730 Classic 2009 1.8% Yes (3G)
12 Nokia 5230 2009 1.6% Yes (3G)
13 Samsung Galaxy S II 2011 1.6% Yes (3G)
14 Nokia 1100 2003 1.6% No
15 Nokia 2330 Classic 2008 1.6% Yes (2G)
Majority of people using Nokia handsets
11.4.2013
7
Department of Communications and Networking
0%
10%
20%
30%
40%
50%
60%
70%
80%
90%
100%
2005 2006 2007 2008 2009 2010 2011 2012
Sh
are
ou
t o
f a
ll h
an
ds
ets
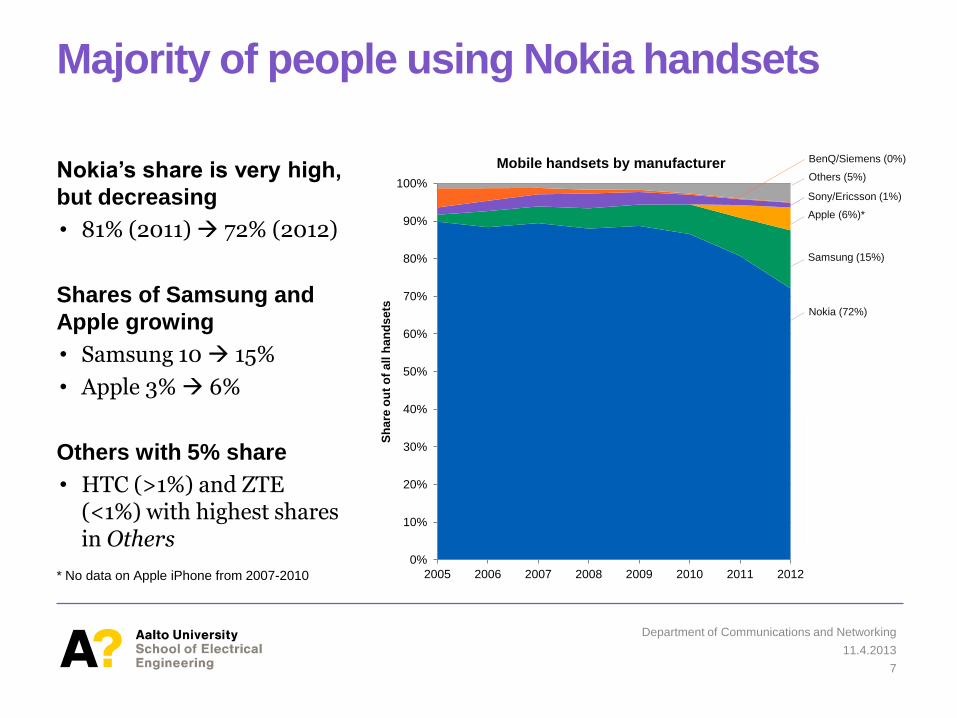
Mobile handsets by manufacturer
Others
BenQ/Siemens
Sony/Ericsson
Apple
Samsung
Nokia
Apple (6%)*
Samsung (15%)
Nokia (72%)
Others (5%)
BenQ/Siemens (0%)
Sony/Ericsson (1%)
Nokia’s share is very high,
but decreasing
• 81% (2011) 72% (2012)
Shares of Samsung and
Apple growing
• Samsung 10 15%
• Apple 3% 6%
Others with 5% share
• HTC (>1%) and ZTE (<1%) with highest shares in Others
* No data on Apple iPhone from 2007-2010

Operating systems: mobile phones vs. smartphones
Share of smartphones increasing • 34% (2011) 45% (2012)
• Smartphone definition: Possibility to install native applications. For example, Android, iOS, Symbian, Windows Phone, MeeGo
Mobile phones mainly Nokia Series 40 • Single largest development
platform
• Share decreasing 45% (2011) 38% (2012)
11.4.2013
8
Department of Communications and Networking
0%
10%
20%
30%
40%
50%
60%
70%
80%
90%
100%
2005 2006 2007 2008 2009 2010 2011 2012
Sh
are
ou
t o
f a
ll h
an
ds
ets
Shares of mobile handset operating systems
Smartphones (45%)
Others (10%)
Nokia Series 40. 6. ed. /
Dev. Plat. 1.0-2.0 (18%)
Nokia Series 40
5. ed. (13%)
Nokia Series 40
1.-3. ed. (7%)
Nokia OS (7%)

Operating systems: smartphones
Share of Google’s Android
increasing
• Android handsets manufactured mainly by Samsung (73% out of all Android handsets)
Apple iOS also gaining
market share
• Two models (4/4S) generate majority of Apple’s share
Share of Nokia’s handsets
rather stable from 2011
• Windows Phone and new versions of Symbian substitute older Symbian models
11.4.2013
9
Department of Communications and Networking
0%
10%
20%
30%
40%
50%
2005 2006 2007 2008 2009 2010 2011 2012
Sh
are
ou
t o
f a
ll h
an
ds
ets
Shares of smartphone operating systems
Symbian^3/
Anna/Belle (7%)
Android (11%)
Symbian
1.-5. ed. (15%)
iOS (6%)*
Windows
Phone (4%)
Others (1%)
* No data on Apple iPhone from 2007-2010
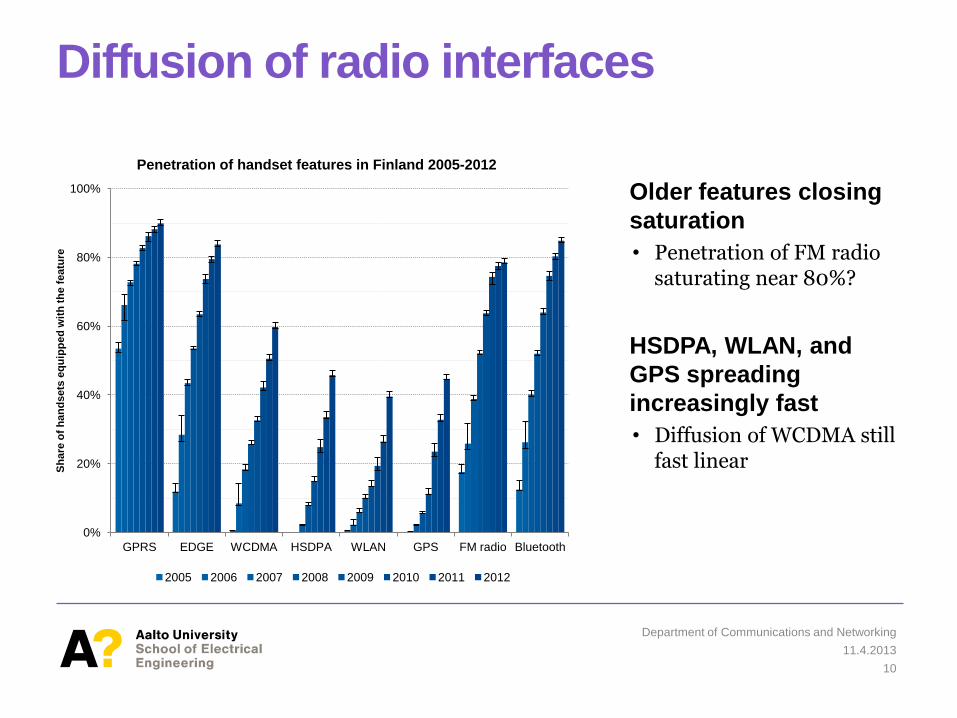
Diffusion of radio interfaces
Older features closing
saturation
• Penetration of FM radio saturating near 80%?
HSDPA, WLAN, and
GPS spreading
increasingly fast
• Diffusion of WCDMA still fast linear
11.4.2013
10
0%
20%
40%
60%
80%
100%
GPRS EDGE WCDMA HSDPA WLAN GPS FM radio Bluetooth
Sh
are
of
ha
nd
sets
eq
uip
pe
d w
ith
th
e f
eatu
re
Penetration of handset features in Finland 2005-2012
2005 2006 2007 2008 2009 2010 2011 2012
Department of Communications and Networking
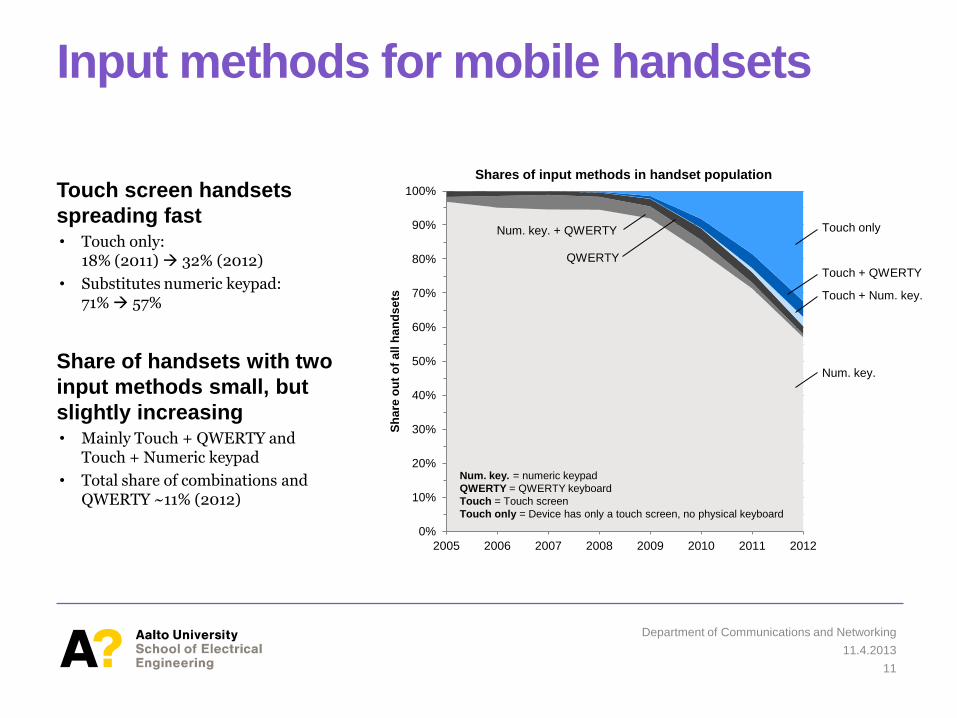
Input methods for mobile handsets
11.4.2013
11
Touch screen handsets
spreading fast • Touch only:
18% (2011) 32% (2012)
• Substitutes numeric keypad: 71% 57%
Share of handsets with two
input methods small, but
slightly increasing • Mainly Touch + QWERTY and
Touch + Numeric keypad
• Total share of combinations and QWERTY ~11% (2012)
0%
10%
20%
30%
40%
50%
60%
70%
80%
90%
100%
2005 2006 2007 2008 2009 2010 2011 2012
Sh
are
ou
t o
f a
ll h
an
ds
ets
Num. key.
Num. key. + QWERTY Touch only
Touch + QWERTY
Touch + Num. key.
Num. key. = numeric keypad
QWERTY = QWERTY keyboard
Touch = Touch screen
Touch only = Device has only a touch screen, no physical keyboard
Shares of input methods in handset population
Department of Communications and Networking
QWERTY

0%
10%
20%
30%
40%
2010 2011 2012
Sh
are
ou
t o
f a
ll h
an
ds
ets
Shares of touch screen screen sizes and pixel densities*
Touch screen handsets: Screen sizes and pixel densities
Some important characteristics:
• Screen size (Inches)
• Resolution (width x height)
• Aspect ratio (res. width / res. height)
• Pixel density (PPI, Points Per Inch) - Low <= 200 (e.g. 3.5” screen with 320 x 480 resolution)
- High > 200 (e.g. 3.5” screen with 640 x 960 resolution)
Share of touch screen handsets with high
pixel densities and larger screens
increasing
• Data includes Touch only, Touch + QWERTY, and Touch + Num. Keypad -handsets
11.4.2013
12
Department of Communications and Networking
* Share of other/unknown screen sizes and PPIs out of identified
touch screen handsets (< 0.6%) not included in figure
High PPI (with pattern)
Low PPI (no pattern)
4-5”
3-3.9”
<3”
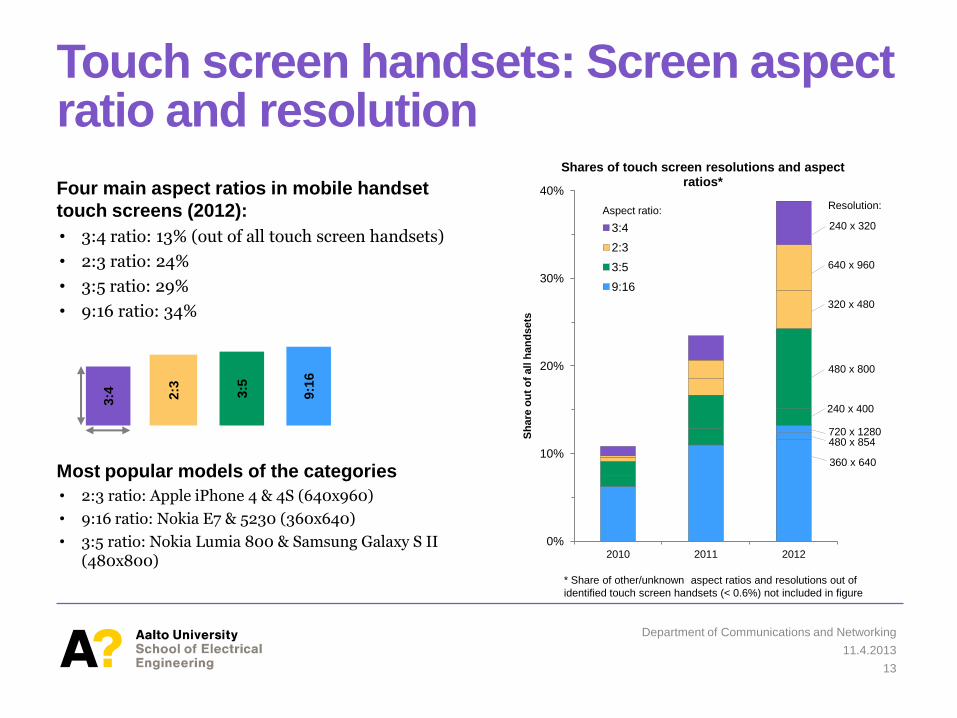
Four main aspect ratios in mobile handset
touch screens (2012):
• 3:4 ratio: 13% (out of all touch screen handsets)
• 2:3 ratio: 24%
• 3:5 ratio: 29%
• 9:16 ratio: 34%
Most popular models of the categories
• 2:3 ratio: Apple iPhone 4 & 4S (640x960)
• 9:16 ratio: Nokia E7 & 5230 (360x640)
• 3:5 ratio: Nokia Lumia 800 & Samsung Galaxy S II (480x800)
Touch screen handsets: Screen aspect ratio and resolution
11.4.2013
13
Department of Communications and Networking
* Share of other/unknown aspect ratios and resolutions out of
identified touch screen handsets (< 0.6%) not included in figure
3:4
2:3
3:5
9:1
6
0%
10%
20%
30%
40%
2010 2011 2012
Sh
are
ou
t o
f all
ha
nd
sets
Shares of touch screen resolutions and aspect ratios*
3:4
2:3
3:5
9:16
240 x 320
240 x 400
480 x 800
320 x 480
640 x 960
480 x 854 720 x 1280
360 x 640
Resolution: Aspect ratio:
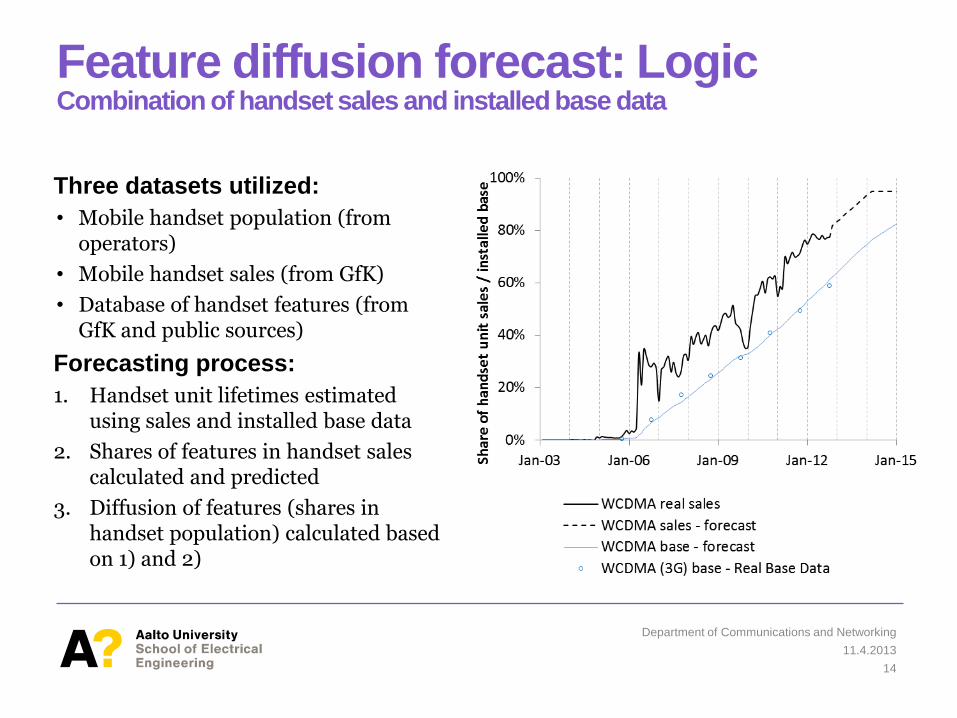
Feature diffusion forecast: Logic Combination of handset sales and installed base data
Three datasets utilized:
• Mobile handset population (from operators)
• Mobile handset sales (from GfK)
• Database of handset features (from GfK and public sources)
Forecasting process:
1. Handset unit lifetimes estimated using sales and installed base data
2. Shares of features in handset sales calculated and predicted
3. Diffusion of features (shares in handset population) calculated based on 1) and 2)
11.4.2013
14
Department of Communications and Networking

Forecasts for diffusion of selected features
Steady growth in feature diffusion
• WCDMA predicted to reach 80% penetration in two years, WLAN in three years
Features diffuse in bundles
• Certain features found together in feature phones, other features in smartphones
11.4.2013
15
Department of Communications and Networking

Summary
Data of the Finnish mobile device population collected annually 2005-2012 from all Finnish mobile network operators
Typical handset manufactured by Nokia (72%) and has a Nokia Series 40 (38%) operating system • Shares of Samsung and Apple increasing
Smartphones (45%) and advanced features spreading fast • Especially technologies providing higher data transfer speeds • Touch screen substituting numeric keypad • Fragmentation of touch screen sizes and resolutions visible
Forecasts predict stable growth of key features
11.4.2013
16
Department of Communications and Networking
Further information
Contact: Antti Riikonen, Doctoral candidate
Timo Smura, Post-doctoral researcher
firstname.lastname (at) aalto.fi
MoMIE project: Modeling of Mobile Internet Ecosystem
http://momie.comnet.aalto.fi/