Mobile data usage got a boost when we were immobile
23
tefficient AB www.tefficient.com 9 July 2021 1 Industry analysis #2 2021 Mobile data – full year 2020 Mobile data usage got a boost when we were immobile We sat at home, but Wi-Fi offloaded mobile data only in a few countries Tefficient’s 31 st public analysis of the development and drivers of mobile data compares 44 countries from all regions of the world. The pandemic affected us all but although we to a high extent spent the year in our homes, mobile data usage increased in every single country. Mobile data is apparently not just used by people on the move. Generally speaking, the growth accelerated in 2020; only a few countries experienced a slower growth rate. Finland, Taiwan, Bahrain and Latvia lead the world in average data usage per subscription. But with 111%, Croatia leads the world in usage growth. Australia, the Netherlands and New Zealand had the slowest growth. In these countries, home Wi-Fi seems to have offloaded mobile data. Data-only defines the average mobile data usage although the share of base is limited. This is old news, but we believe that the pandemic fuelled the usage of data-only subscriptions as these often are used as a substitute to fixed broadband. The pandemic drove the overall internet traffic and mobile data-only got its fair share of that. Using mobile data has never been cheaper but the erosion in the revenue per gigabyte varies a lot between markets. Croatia had the fastest erosion, 53%, and India the slowest with just 5%. And how did ARPU then develop? To answer that, we present an updated Christmas tree graph.
Transcript of Mobile data usage got a boost when we were immobile

tefficient AB www.tefficient.com 9 July 2021 1
Industry analysis #2 2021
Mobile data – full year 2020
Mobile data usage got a boost when we
were immobile We sat at home, but Wi-Fi offloaded mobile data only in a few countries
Tefficient’s 31st public analysis of the
development and drivers of mobile data
compares 44 countries from all regions of
the world.
The pandemic affected us all but although
we to a high extent spent the year in our
homes, mobile data usage increased in
every single country. Mobile data is
apparently not just used by people on the
move.
Generally speaking, the growth accelerated in 2020; only a few countries experienced a slower
growth rate.
Finland, Taiwan, Bahrain and Latvia lead the world in average data usage per subscription. But
with 111%, Croatia leads the world in usage growth. Australia, the Netherlands and New
Zealand had the slowest growth. In these countries, home Wi-Fi seems to have offloaded
mobile data.
Data-only defines the average mobile data usage although the share of base is limited. This is
old news, but we believe that the pandemic fuelled the usage of data-only subscriptions as
these often are used as a substitute to fixed broadband. The pandemic drove the overall
internet traffic and mobile data-only got its fair share of that.
Using mobile data has never been cheaper but the erosion in the revenue per gigabyte varies a
lot between markets. Croatia had the fastest erosion, 53%, and India the slowest with just 5%.
And how did ARPU then develop? To answer that, we present an updated Christmas tree graph.

tefficient AB www.tefficient.com 9 July 2021 2
Data usage is still growing in every single country
Figure 1 shows the development of mobile data usage for 44 countries where regulators1 report mobile data
traffic. The usage is shown per SIM per month – and in Figure 1 we are including all2 SIMs, also M2M/IoT
SIMs.
Figure 1. Development of mobile data usage per SIM (incl. M2M) per month – the legend shows the ranking3
Starting from the top of the chart, Finland and Taiwan are defending the number one and two positions in
the world when it comes to mobile data usage. The average Finnish SIM card carried 24.4 GB of data per
month in 2020. 68% of the Finnish SIMs (M2M included) had unlimited data volume in December 2020.
If excluding M2M, 80%. If excluding also voice-only SIMs, 85%. No other country is as unlimited as Finland.
The average Taiwanese SIM carried 22.5 GB per month. Unlimited is behind Taiwan’s usage development
as well. The Taiwanese operators – there are five MNOs – have tried to cool off the market by attempting to
1 Exception: USA, where the data is from the industry body CTIA 2 All SIMs in a market included; even the SIMs that used no or little data. We think it provides a better comparison than usage
per ’mobile broadband subscription’ even if it lowers the average mobile data usage numbers somewhat. 3 USA, Estonia, Switzerland and Canada have not yet reported. Japan and Mexico have to date just reported figures for 1H 2020. Italy
and Czech Republic still need to report their revenues although subscriptions and traffic have been reported.
FI
TW
BH
LV
MY
LT HR
ATIS
QA
DK
CLKR
2) AUCN1) SE
INTR FR
SGIT
PENOES
UK
HK
NLGRDEPT 7) CZ
0
5
10
15
20
25
2014 2015 2016 2017 2018 2019 2020
GB
pe
r S
IM (
incl.
M2
M)
pe
r m
on
th
FI TW BH LV MY LT HR AT IS QA DK
CL EE IE KR 2) AU CN 1) SE PL IN US TR
CH FR SG 3) 4) JP IT PE NO ES RO UK HU
4) MX HK 5) NZ LU NL GR CA DE BE PT 7) CZ
1) Excluding M2M SIMs not in country2) Q2 & Q4 annualised, upload excluded3) Traffic for last month each quarter4) 1H 2020 for 20205) Each year: 12 months ending June7) Excl. fixed LTE

tefficient AB www.tefficient.com 9 July 2021 3
move the unlimited price points upwards while discontinuing unlimited for customers that have run out of
binding, but the discipline isn’t there – ARPU is still in decline.
Bahrain (21.2 GB) surpassed Latvia (20.6 GB) during 2020 and both have come closer to the leader duo.
Malaysia’s (15.1 GB) data usage growth continues too and its number 5 position was strengthened in 2020.
The M2M reporting dilemma
Regulators’ reporting of M2M/IoT SIMs continues to create a challenge for the comparability between countries. A
growing problem is international M2M SIMs that are registered in one country but used somewhere else. Sweden is a
good example. The country regulator, PTS, reports 16.9 million M2M SIMs in Sweden – a figure that more than doubles
the total SIM base if added to the regular SIM base of 14.3 million. We are therefore happy that PTS now reports the
number M2M SIMs that are active in Sweden; 3.9 million, i.e. just 23% of the total M2M base. This has allowed us to
recalculate a more representative mobile data usage figure for Sweden when including M2M.
The same issue emerges in Austria where Deutsche Telekom group registers many of its international M2M SIMs. The
number of ‘Austrian’ M2M SIMs as reported by RTR grew 25% in 2020 – to 6.2 million. Similar to how it was for Sweden
previously, Austria’s average mobile data usage per SIM thus looks lower when including M2M SIMs than what it
realistically is. Luckily Austria’s regulator is one of those breaking out M2M SIMs in its reporting allowing a like-for-like
comparison of mobile data usage per non-M2M SIM, see Figure 2 and Figure 4.
Figure 2 is a variant of Figure 1 but with M2M SIMs excluded. As the M2M SIMs typically carry significantly
less traffic than the regular SIMs, this makes the usage figures look higher.

tefficient AB www.tefficient.com 9 July 2021 4
Figure 2. Development of mobile data usage per SIM (excl. M2M) per month – the legend shows the ranking4
Since only a fraction of the countries separate out the data traffic associated with M2M SIMs in their
reporting (kudos to Norway, Sweden, Czech, Bahrain and Greece), the assumption for most of the countries
in Figure 2 is that the M2M data usage is zero. This is of course not correct and as we could expect M2M/IoT
SIMs to carry more traffic in future, we think that Figure 1 provides the most accurate comparison.
With 28.8 GB per non-M2M SIM per month, Finland tops also Figure 2. Bahrain follows with 24.3 GB and
Latvia with 23.8 GB. Taiwan and Malaysia have disappeared from the top five here as the M2M SIM number
isn’t broken out in these countries.
The legends of Figure 1 and Figure 2 show the ranking of the 44 studied countries. But since it’s difficult to
spot them all, Figure 3 and 4 offer an easier visualisation. First including M2M:
4 Countries for which the regulator doesn’t break out the M2M SIMs have been excluded
FI
BHLV
AT
IS LTHR
DK
IE
KRSECL
FR
TRIT
NO
ESUK
NLBEGRPT
0
5
10
15
20
25
30
35
2014 2015 2016 2017 2018 2019 2020
GB
pe
r S
IM (
ex
cl.
M2
M)
pe
r m
on
th
FI BH LV AT IS LT HR DK IE KR EE
SE CL PL FR CH TR IT NO ES UK LU
HU HK NL DE BE GR CA PT 7) CZ
7) Excl. fixed LTE

tefficient AB www.tefficient.com 9 July 2021 5
Figure 3. Mobile data usage per SIM (incl. M2M) per month, 2020 and 2019
And in Figure 4 excluding M2M:
Figure 4. Mobile data usage per SIM (excl. M2M) per month, 2020 and 2019
24,4
22,5
21,2
20,6
15,1
13,0
12,9
12,3
12,2
11,6
10,8
9,7
9,4
9,2
8,9
8,6
8,5
8,0
7,2
6,8
6,6
5,6
5,2
5,1
4,7
4,7
4,2
4,2
4,0
3,9
3,5
3,3
2,7
2,6
2,4
2,3
2,2
2,1
18,4
18,1
14,1
15,0
10,2
8,3
6,1
9,7
8,7 9,0
8,0
7,1
9,4
6,9 7,3 7,4
6,4
6,4
5,8
5,3
7,1
4,4
6,8
5,1
3,6
3,4
4,5
2,8
3,7
2,5
3,2
3,0
2,5 2,7
2,7 2,8
2,7
2,3
1,5
2,3
1,7 1,8
1,7
1,2
0
5
10
15
20
25
30
FI
TW BH LV
MY
LT
HR
AT IS QA
DK
CL
EE IE KR
2)
AU
CN
1)
SE
PL
IN US
TR
CH FR
SG IT
3)
4)
JP PE
NO ES
RO
UK
HU
4)
MX
HK
5)
NZ
LU
NL
GR
CA
DE
BE
PT
7)
CZ
GB
pe
r S
IM (
incl.
M2
M)
pe
r m
on
th
FY 2020 FY 2019
1) Excluding M2M SIMs not in country2) Q2 & Q4 annualised, upload excluded
3) Traffic for last month each quarter4) 1H 2020 for 2020
5) Each year: 12 months ending June
28,8
24,3
23,8
17,6
14,3
14,1
13,7
12,8
11,8
10,8
10,6
9,9
8,7
8,5
7,4
6,8
6,3
4,7
4,3
4,1
3,6
3,6
3,1
3,0
2,7
2,3
2,3
21,5
15,7
17,2
12,7
9,6
8,9
6,4
9,4
8,4
8,4
10,7
7,8
7,2
6,2 6,4
7,6
4,8
4,4 4
,8
2,8 3
,3
3,0
3,0
2,9
2,1 2,3
1,6
2,6
0
5
10
15
20
25
30
35
FI
BH LV
AT IS LT
HR
DK IE KR
EE
SE
CL
PL
FR
CH
TR IT NO ES
UK
LU
HU
HK
NL
DE
BE
GR
CA
PT
7)
CZ
GB
pe
r S
IM
(e
xcl.
M2
M)
pe
r m
on
th
FY 2020 FY 2019
7) Excl. fixed LTE

tefficient AB www.tefficient.com 9 July 2021 6
The countries with the lowest data usage in both Figure 3 and Figure 4 are Czech Republic5, Portugal,
Belgium, Germany, Canada6, and Greece.
Figure 5 is a zoom-in on the lower end of Figure 1.
Figure 5. Development of mobile data usage per SIM (incl. M2M) per month [zoom-in on low end]
In the lower usage range, Peru, Spain, Greece and Czech Republic demonstrated good usage growth in
2020.
5 Note that the fixed LTE traffic is excluded in the reported mobile data traffic of the regulator CTU. To make it comparable with other
markets, we could have added it, if only CTU reported it. 6 Based on the latest available (2019) data
PENO
ESRO
UKHU
4) MX
HK5) NZ
LU
NLGR
DEBE
PT 7) CZ
0
1
1
2
2
3
3
4
4
5
5
2014 2015 2016 2017 2018 2019 2020
GB
pe
r S
IM (
incl.
M2
M)
pe
r m
on
th
FI TW BH LV MY LT HR AT IS QA DK
CL EE IE KR 2) AU CN 1) SE PL IN US TR
CH FR SG 3) 4) JP IT PE NO ES RO UK HU
4) MX HK 5) NZ LU NL GR CA DE BE PT 7) CZ
1) Excluding M2M SIMs not in country2) Q2 & Q4 annualised, upload excluded3) Traffic for last month each quarter4) 1H 2020 for 20205) Each year: 12 months ending June7) Excl. fixed LTE

tefficient AB www.tefficient.com 9 July 2021 7
Data usage growth fastest in Croatia – more than doubled y-o-y
Figure 6 shows the growth in average usage per SIM (incl. M2M) between 2019 and 2020.
Figure 6. Development of mobile data usage per SIM 2019-2020
Croatia outpaced every other market in mobile data usage growth. The average Croatian SIM used 111%
more mobile data in 2020 than what it did in 2019. The usage of Czech Republic grew 84%, Greece’s
72%, Peru’s 71% and Spain’s 68%. The previous growth powerhouses India and China had more modest
growth rates this time; 34-35%.
The growth laggards in Figure 6 are Australia (16%), the Netherlands (19%) and
New Zealand (20%). Although COVID-19 measures might have influenced, we need
to mention that the two MNOs that drove unlimited into the Dutch market – T-Mobile
and Tele2 – merged in January 2019. Also Australia had a merger – between
Vodafone and TPG in July 2020 after long preparations – and although TPG wasn’t a
MNO, it had been quite successful as MVNO so the merger concentrated the mobile
market. The Australian Competition & Consumer Commission (ACCC) opposed the
merger and last month criticised the three MNOs for raising prices.
111%
84%
72%
71%
68%
57%
54%
53%
53%
51%
51%
48%
47%
40%
38%
37%
37%
37%
35%
35%
34%
34%
34%
33%
33%
31%
30%
30%
28%
27%
26%
26%
26%
24%
22%
20%
19%
16%
0%
20%
40%
60%
80%
100%
120%
HR
7)
CZ
GR
PE
ES
LT
TR
HU
SG IT BH
MY
LU IS CL
PL
DE
LV IE CN IN DK
UK FI
1)
SE
PT
FR
RO
QA
AT
KR
BE
NO
TW HK
5)
NZ
NL
2)
AU
GB
pe
r S
IM (
incl.
M2
M)
tre
nd
20
19
-20
20
1) Excluding M2M SIMs not in country2) Q2 & Q4 annualised, upload excluded
5) Each year: 12 months ending June7) Excl. fixed LTE
Australia, the
Netherlands, and
New Zealand had
the slowest usage
growth

tefficient AB www.tefficient.com 9 July 2021 8
Data-only rarely more than 20% of base, but defines usage
Although fixed wireless access (FWA) seems to experience a renaissance with 5G, using mobile networks
to substitute fixed broadband is hardly something new. In some markets, like Finland and Austria, this has
been around for long. The take-up can be significant if the FWA/data-only offers are reasonably charged and
without usage caps. It also helps if the fixed broadband offering is weak with much DSL is the mix.
Since Q4 2017, the regulator RTR publishes the fixed data traffic of Austria. If we compare it to the mobile
data traffic, it’s obvious how important the mobile networks are for the overall internet of the country: In the
fourth quarter of 2020, the mobile data traffic was 57% of the fixed data traffic. But maybe there’s a trend
shift coming; in Q2 2020 it was even higher; 60%.
Figure 7. Development of fixed and mobile data traffic in Austria
This takes us to Figure 8. It plots the average data usage per SIM vs. the data-only share of a country’s SIM
base.
43%44% 47%
47%
51%48% 53%
50%53%
53%60% 56%
57%of fixed
0
200
400
600
800
1000
1200
1400
1600
Q4 2
017
Q1 2
018
Q2 2
018
Q3 2
018
Q4 2
018
Q1 2
019
Q2 2
019
Q3 2
019
Q4 2
019
Q1 2
020
Q2 2
020
Q3 2
020
Q4 2
020
Da
ta t
raff
ic [
PB
]
Fixed
Mobile

tefficient AB www.tefficient.com 9 July 2021 9
Figure 8. Mobile data usage vs. data-only share
In December 2020, 25% of the SIM base in Latvia was data-only. That makes Latvia the leader in data-
only share of base – and the average mobile data usage was also high. In Finland data-only represented 20%
of the base but usage was even higher than in Latvia. Also Bahrain had a high data-only share – 17%.
There are ten countries forming a central cluster between 8% and 16%: Estonia, Sweden, Iceland, Denmark,
USA, Austria, Croatia, Australia, Lithuania and Poland.
The adherence to the regression line is relatively strong. As in all previous reports we therefore conclude
that data-only penetration is a significant driver of the average mobile data usage.
The easiest way for low-usage countries to grow data usage and
expand the mobile market would be to start addressing and
monetising the data-only segment. This seems to be
effective particularly in markets where fast fixed broadband
networks (FTTH, FTTB or HFC) aren’t already available to a
substantial share of the households. The US wireless market
leader Verizon launched its first 5G branded service in December
2018 to support a fixed wireless access (FWA) use case.
Operators such as Optus in Australia (left), 3 in the UK, Sunrise in
AT
NO
1) SE
NL
IE
TR
LT
2) AU
PT
13) FR
FI
ES
UK
DK
US
CA
EE
BE
CH
PL
IS
HURO
LV
GR
KR
HR
BH
LU
PE
DE
CL
14) FR
R² = 0,6702
0
5
10
15
20
25
0% 5% 10% 15% 20% 25% 30%
GB
pe
r S
IM (
incl.
M2
M)
pe
r m
on
th
Data-only share of SIM base
1) Excluding M2M SIMs not in country2) Q2 & Q4 annualised, upload excluded13) Excl. fixed 4G boxes14) Incl. fixed 4G boxes
FY 2020
1H 2020 or FY 2019

tefficient AB www.tefficient.com 9 July 2021 10
Switzerland, 3 in Austria and DNA & Elisa in Finland have all followed Verizon into 5G-based FWA. Figure 8
shows that even a relatively low share of such data-only subscriptions could lift the average data
consumption significantly.
Some of the countries in Figure 8 are also reporting the data-only traffic. For these countries, we can
compare the data-only penetration of the SIM base to its share of the total mobile data traffic, see Figure 9.
Figure 9. Data-only share of total traffic vs. data-only share of SIM base
With the exception of Romania, data-only SIMs carry a disproportionally high share of the data traffic:
Portugal 10.2x higher traffic per data-only SIM vs. any SIM
Austria 6.5x
Norway 6.3x
Ireland 5.4x
Lithuania 4.9x
Sweden 4.7x
Iceland 4.4x
Belgium 4.4x
Bahrain 3.3x
Finland 3.1x
AT
NO
1) SE
IE
LT
2) AU
PT
13) FR
FI
BE
IS
ROGR
BH
8) LU14) FR
0%
10%
20%
30%
40%
50%
60%
70%
80%
90%
100%
0% 10% 20% 30% 40% 50% 60% 70% 80% 90% 100%
Da
ta-o
nly
sh
are
of
tota
l d
ata
tra
ffic
Data-only share of SIM base
FY 2020
1H 2020 or FY 2019
1) Excluding M2M SIMs not in country2) Q2 & Q4 annualised, upload excluded8) Incl. all roaming-out traffic (not just data-only)13) Excl. fixed 4G boxes14) Incl. fixed 4G boxes

tefficient AB www.tefficient.com 9 July 2021 11
France (incl. fixed 4G boxes) 2.6x
Luxembourg 1.9x
Australia 1.7x
Greece 1.4x
Romania 0.3x
In addition to the countries in Figure 9, there is one which doesn’t report data-only SIM base, but data-only’s
share of traffic: In China, 5% of mobile data traffic wasn’t carried over regular mobile phones.
For the countries that are reporting both data-only traffic and the number of data-only subscriptions, we can
compare the average usage per data-only subscription, see Figure 10.
Figure 10. Mobile data usage per data-only SIM per month, 2020 and 2019
Starting from the left, the average ‘4G box’ in France carried 165.7 GB of mobile
data per month in 2020. This is significantly higher than for the other FWA-only usage
number in Figure 10: In Australia, the usage per FWA subscription was 40.7 GB in
2020 – actually a decline from the 59.9 GB reported for 2019.
If instead looking at the whole data-only base (not just the FWA segment), Austria
leads with the average mobile data consumption per data-only SIM of 78.6 GB.
165,7
40,7
78,675,0
67,4 66,0
51,147,6
38,8
27,522,3
15,0
9,0 7,33,5 3,4 1,3
137,9
59,9 59,2
51,8
34,2
47,4
30,3 31,5
24,322,1
15,7
10,36,6
8,7
3,0 2,4 1,2
0
20
40
60
80
100
120
140
160
180
14)
FR
2)
16)
AU
AT FI
BH LT IE IS SE
NO PT
2)
AU
12)
BE
8)
LU
13)
FR
GR
RO
GB
pe
r d
ata
-on
ly S
IM p
er
mo
nth
FY 2020 FY 2019
2) Q2 & Q4 annualised, upload excluded8) Incl. all roaming-out traffic (not just data-only)
12) Traffic of 3 MNOs13) Excl. fixed 4G boxes
14) Per fixed 4G box16) Per FWA subscription
Full data-only baseFWA-only base
The average
Austrian data-only
subscription
consumed 78.6 GB
per month in 2020

tefficient AB www.tefficient.com 9 July 2021 12
Finland had 75.0 GB. Bahrain follows with 67.4 GB – and very fast growth. Lithuania is just behind with
66.0 GB.
If 5G should become the fibre-over-radio solution that e.g. Verizon, Sunrise and others suggest, the data-
only FWA usage figure of France gives a taste of the usage that the solution must at least manage. Fixed
broadband usage is yet higher – often around 300 GB per month.
The appetite that operators show for FWA seems to make them let go of their anxiety for unlimited
within the data-only segment. Figure 11 shows something quite interesting.
Figure 11. Development in the data-only share of total mobile data traffic – for all reporting countries
Data-only’s share of traffic decreased until 2018. It’s not necessarily that the absolute
data-only traffic decreased, but the growth of the smartphone traffic was much
quicker. But something happened in 2019 which continued in 2020.
For a number of markets – Austria, Finland, Bahrain, Sweden, Portugal, Ireland,
France and China – data-only traffic gained market share in 2020. Of our
markets, Iceland, Norway, Belgium, Greece and Romania had a decline. Overall, the
trend seems to have turned to a higher share of traffic originating from data-only
subscriptions. It’s must be because of Corona, right? No; that trend shift happened
already in 2019. We instead attribute it to FWA and the wider adoption of unlimited within operators’ data-
only propositions.
0%
10%
20%
30%
40%
50%
60%
70%
80%
90%
2014 2015 2016 2017 2018 2019 2020
Da
ta-o
nly
sh
are
of
tota
l d
ata
tra
ffic
AT
LT
CZ
FI
BH
IS
SE
PT
IE
NO
IT
BE
FR
CN
GR
RO
Data-only’s share
of total traffic
started to grow
again in many
markets

tefficient AB www.tefficient.com 9 July 2021 13
4G adoption a weakening driver of data usage – 5G a different story
Ever since Tefficient started to publish these mobile data analyses back in 2013, we have checked mobile
data usage against the 4G adoption. With the growing adoption of 4G, that correlation has weakened and
weakened. Unlike data-only, 4G adoption is no longer defining data usage.
As 5G has been in commercial operation in more than two years by now, it would be more interesting to
now correlate mobile data usage with 5G adoption. Too few regulators (and operators for that sake) are
however reporting 5G traffic – and 5G base – to make a sensible correlation graph for 5G. We strongly
encourage regulators to see to that 5G numbers are reported.
Figure 12 below gathers all 5G information reported for our 44 markets.
Figure 12. Mobile data usage vs. 4G/5G share
From left in Figure 12: In December 2020, 0.02% of Iceland’s mobile subscriptions were 5G. In June 20207,
0.1% of Japan’s mobile subscriptions were 5G. For both of these countries, 5G traffic wasn’t reported.
Sweden had 1.5% 5G adoption in December 2020 – but just 0.1% of the mobile data traffic was 5G in
2020. In the month of June 2020, the 5G networks of the UK carried 1.2% of the mobile data traffic – but
7 The newest Japanese stats reported to date
0,02% 0,1%
1,5% 1,8%
16,8%
0,1%
1,2%
30,9%
0%
5%
10%
15%
20%
25%
30%
35%
IS 3) 4) JP 1) SE 14) UK PL KR
Sh
are
of
tota
l, 2
02
0
5G share of SIM base (incl. M2M) 5G share of mobile data traffic
1) Excluding M2M SIMs not in country3) Traffic for last month each quarter4) 1H 2020 for 202014) June 2020 for 2020

tefficient AB www.tefficient.com 9 July 2021 14
Ofcom doesn’t break out 5G subscriptions in its reporting. In Poland, 1.8% of the SIM base was 5G in
December 2020.
And then there’s South Korea, the country that was first with commercial, standards-based, 5G in the
world: In December 2020, 16.8% of the SIM base in the country was 5G – while 5G carried 30.9% of the
traffic.
As the Korean government reports monthly stats on 5G, Figure 13 shows the development up to May 2021
for the subscriber and traffic adoption.
Figure 13. 5G share of total traffic vs. 5G share of SIM base – Korea per month since 5G launch
In May 2021, a majority of the mobile data traffic in South Korea – 52.4% – was 5G. 5G represented 22.2%
of the total SIM base, indicating that the average mobile data usage per 5G subscriber is far higher than for
non-5G subscribers in South Korea. The usage figures for May 2021 are:
5G: 27.4 GB per month
4G: 9.4 GB per month
It’s important to point out that it’s not 5G as such that alone explains that 2.4x higher mobile data usage in
5G: Korea’s operators are offering unlimited data plans more widely in 5G compared to what they did in 4G.
But even if comparing apples to apples – unlimited to unlimited – 5G still seems to drive usage.

tefficient AB www.tefficient.com 9 July 2021 15
In March 20218, the average unlimited 5G subscription generated 38.8 GB whereas the average unlimited
4G subscription generated 10 GB less – 28.4 GB.
The development in Korea is impressive and bodes well for the industry. It will be interesting to see if China
and Japan – two other countries where operators with launched 5G networks have started to report 5G
customer numbers – will be able to follow the Korean ‘gearing’ curve between base and traffic.
8 These stats are reported quarterly

tefficient AB www.tefficient.com 9 July 2021 16
A gigabyte has never been cheaper – but it doesn’t mean it’s cheap everywhere
Most mobile operators in mature markets aren’t attempting to monetise voice and SMS based on usage any
longer; they have instead made these allowances unlimited and included them in a flat fee. This means that
the last price-defining parameter for most mobile users is data volume. Even though more and more
operators introduce unlimited propositions, these are often the last step in a tiered data plan9 – which
means that price still, essentially, is about data volume.
Figure 14 plots the total mobile service revenue per consumed gigabyte10 against the average mobile data
usage per SIM and month.
Figure 14. Mobile data usage vs. total mobile service revenue per consumed GB
The amber line shows where 15 EUR of ARPU is earned. Countries below it had an ARPU lower than 15
EUR; countries above an ARPU higher than 15 EUR.
There are a few countries where operators enjoy very high total revenue per consumed gigabyte: Canada
foremost11, but also the cluster of Belgium, New Zealand12, Luxembourg and Germany.
9 There are exceptions to this, e.g. Finnish operators, Swisscom, O2 Germany and Vodafone in Spain, the UK and most other European
Vodafone markets except Germany, where the price-defining parameter instead is data throughput. There are also operators mixing
several parameters such as volume, throughput, policy, zero-rating, video resolution, service bundling etc. 10 Attributing zero value to voice and messaging
NO
IE
AT
ES
KR
TR FR
2) AU
LT
NL
SG
UK
DK
1) SE
FI
DE
US
EE
LV
BE
HK
PL
CH
IS
CA
IT
TW
GR
CN
IN
HR
MX
LU5) NZ
BH
0
5
10
15
20
25
0 2 4 6 8 10 12 14
GB
pe
r S
IM (
incl.
M2
M)
pe
r m
on
th
Total mobile service revenue per GB [EUR]
15 EUR ARPU line
1) Excluding M2M SIMs not in country2) Q2 & Q4 annualised, upload excluded
5) Each year: 12 months ending June
FY 2020
1H 2020 or FY 2019(latest available)
tefficient AB www.tefficient.com 9 July 2021 17
It’s important to point out that our analysis looks at what the mobile operator industry de facto makes on
end-users, not what the best offer on the market currently is. In reality, most users are on old price plans
because they are still locked in by a contract – or because they have not bothered to find the best deal.
In the other end of the scale we find the countries where operators get the lowest
revenue per consumed gigabyte: India, Latvia, Lithuania, Taiwan, Finland,
Bahrain, China and Poland.
Looking at Figure 14 we can conclude – as in all our previous analyses on this topic
– that the key explanation to high mobile data usage is low effective revenue per
gigabyte: Bigger data buckets lead to lower revenue per GB – which, on
the other hand, increases usage. At least when customers can use those big
buckets also on data-only devices; see Figure 8.
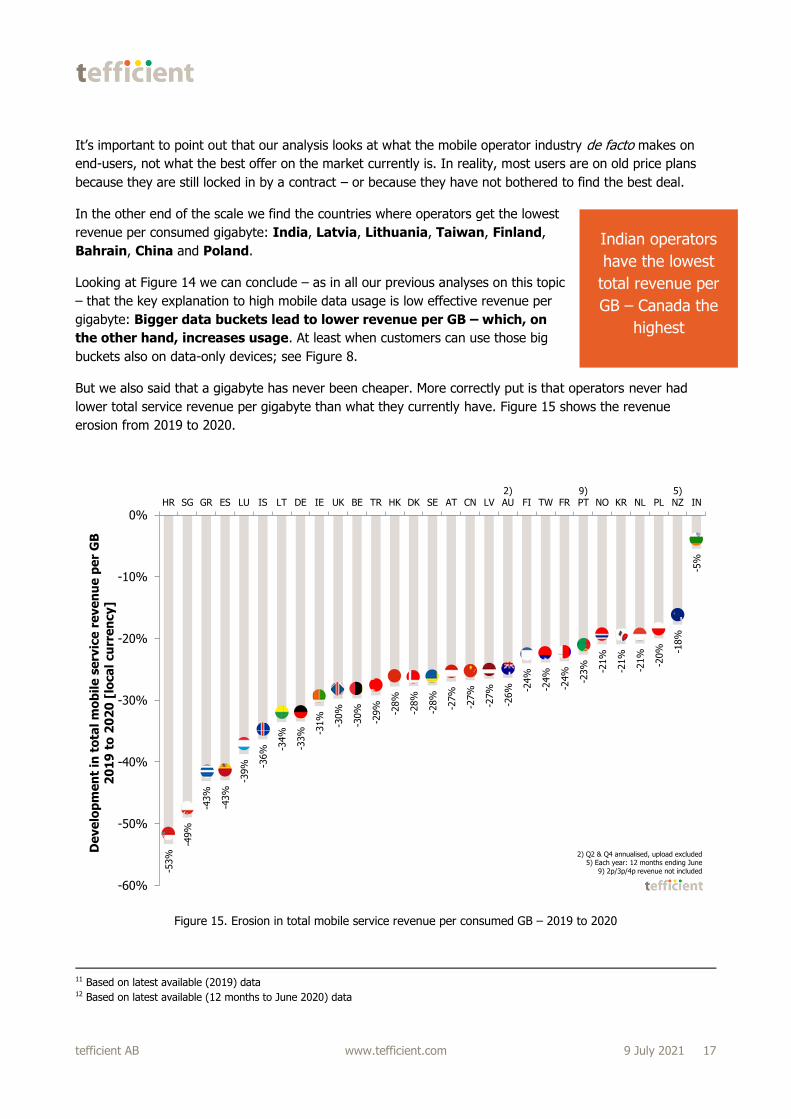
But we also said that a gigabyte has never been cheaper. More correctly put is that operators never had
lower total service revenue per gigabyte than what they currently have. Figure 15 shows the revenue
erosion from 2019 to 2020.
Figure 15. Erosion in total mobile service revenue per consumed GB – 2019 to 2020
11 Based on latest available (2019) data 12 Based on latest available (12 months to June 2020) data
-53%
-49%
-43%
-43%
-39% -3
6% -3
4%
-33% -3
1%
-30%
-30%
-29%
-28%
-28%
-28%
-27%
-27%
-27%
-26% -2
4%
-24%
-24%
-23% -21%
-21%
-21%
-20% -1
8%
-5%
-60%
-50%
-40%
-30%
-20%
-10%
0%HR SG GR ES LU IS LT DE IE UK BE TR HK DK SE AT CN LV
2)AU FI TW FR
9)PT NO KR NL PL
5)NZ IN
De
ve
lop
me
nt
in t
ota
l m
ob
ile
se
rvic
e r
eve
nu
e p
er
GB
2
01
9 t
o 2
02
0 [
loca
l cu
rre
ncy]
2) Q2 & Q4 annualised, upload excluded5) Each year: 12 months ending June
9) 2p/3p/4p revenue not included
Indian operators
have the lowest
total revenue per
GB – Canada the
highest

tefficient AB www.tefficient.com 9 July 2021 18
The prerequisite to be in Figure 15 is of course that the statistics have been reported both for 2019 and
2020. Of these markets, Croatia has the fastest revenue erosion, 53%. Singapore is just behind with 49%
as TPG’s entry led to a shift in data consumption. Greece – which finally moves away from its very low
levels of data usage had 43%. Spain had 43% too while Luxembourg was at 39%.
India, which historically often had the fastest revenue erosion in our reports, is now having the absolute
slowest erosion, just 5%. The merger between Vodafone and Idea into Vi seems to have benefited the two
market leaders Jio and Airtel while Vi continues to weakens, leading to higher market concentration.

tefficient AB www.tefficient.com 9 July 2021 19
No correlation between data usage and ARPU
Figure 16 is a variant of the revenue per GB chart – it plots the usage against the average revenue per SIM,
i.e. the ARPU.
Figure 16. Mobile data usage vs. total mobile service revenue per SIM
Of our markets, there are three where operators derive ARPUs much higher than elsewhere: Switzerland,
USA and Canada. In all these markets, regulators/CTIA have not yet reported 2020 data so the dots are for
2019. 2020 data would likely not have changed the outlier position of these markets as we continuously over
the years have seen that operators in these markets enjoy high ARPU even though mobile data usage isn’t
very high.
Operators in the upper left corner – Finland, Taiwan, Latvia, Lithuania, Bahrain and India – are being
the most generous with mobile data considering their ARPU. These countries form a nice line suggesting that
operators could expect to get rewarded with higher ARPU as usage grows.
But that’s regretfully not to overall trend: The adherence to the grey regression line is weak and it’s anyhow
not pointing in the north-easterly direction one would like to see – with more usage leading to higher ARPU.
NO
IE
AT
ES
KR
TR FR
2) AU
LT
NL
SG
UK
DK
1) SE
FI
DE
US
EE
LV
BEHK
PL
CH
IS
CA
IT
TW
GR
CN
IN
HR
MX
LU5) NZ
BH
R² = 0,0542
0
5
10
15
20
25
30
0 5 10 15 20 25 30 35
GB
pe
r S
IM (
incl.
M2
M)
pe
r m
on
th
Total mobile service revenue per SIM (incl. M2M) per month [EUR]
Highest ARPU yet lowest usage
Lowest ARPUyet highest usage
1) Excluding M2M SIMs not in country2) Q2 & Q4 annualised, upload excluded
5) Each year: 12 months ending June
15 EUR ARPU line
FY 2020
1H 2020 or FY 2019(latest available)

tefficient AB www.tefficient.com 9 July 2021 20
Did the pandemic make the Christmas tree unbalanced?
Now to our Christmas tree graph. It’s the graph were we ideally like to see the branches stretch to the right
since that means that the ARPU grew in the past year. That would demonstrate that the operators of a
country have been able to monetise the growth in data usage.
Figure 17. Development in mobile data usage vs. the development in ARPU – 2019 to 2020
In reality the branches stretch right in only 7 of 29 markets13
(24%). These seven are – from the top – Finland, Latvia,
Lithuania, Poland, India, Turkey and Portugal. In 22
markets (76%), the branches stretch left meaning that even
though data usage grew, ARPU fell. The ARPU erosion in
Singapore is unparalleled; above 20%.
ARPU fell because of Corona, right? Not really. Last year’s
Christmas tree didn’t look any better – see the miniature to the
right. Why aren’t we more successful as an industry?
13 The 29 markets for which regulators to date have reported the necessary underlying stats
NO
IE
AT
ES
KR
TR
9) PT
FR
2) AU
LT
NL
SG
UK
DK
1) SE
FI
DE
LV
BE
HK
PL
IS
TW
GR
CN
IN
HR
LU5) NZ
0
5
10
15
20
25
-30% -20% -10% 0% 10% 20% 30%
GB
pe
r S
IM (
incl.
M2
M)
pe
r m
on
th
Total mobile service revenue per SIM per month dev. 2019-2020 [local currency]
Decreasing ARPU Increasing ARPU
FY 2020
FY 2019
1) Excluding M2M SIMs not in Sweden2) Q2 & Q4 annualised, upload excluded
9) 2p/3p/4p revenue not included
tefficient AB www.tefficient.com 9 July 2021 21
It’s important to remember that Figure 17 depicts the development of a market as a whole. Individual
operators might not follow the country trend. In our operator report for the same time period – the situation
looks better as 39% of the operators could grow ARPU based on an increase in data usage. The comparable
figure for our countries is 24%. It suggests that smaller operators – with less weight in the country totals –
do better in Christmas tree graphs than larger operators.
5G could be the key to change the balance – by convincing the branches to grow to the right.
As shown, 5G has had a major impact on the data usage in Korea. But Korea doesn’t have a positive ARPU
development in Figure 17 – it’s -0.1%. One explanation is that Korea’s ARPU was heavily affected by a
government decision taken in 2017 to increase the SIM-only discount from 20% to 25%. This started to
have an effect on the ARPU by the end of 2017 and as the typical contract binding period on handset plans
is two years in Korea, the effect should have lasted until the end of 2019. The upside of the change has
been an equally significant improvement in churn, so it’s not all bad.
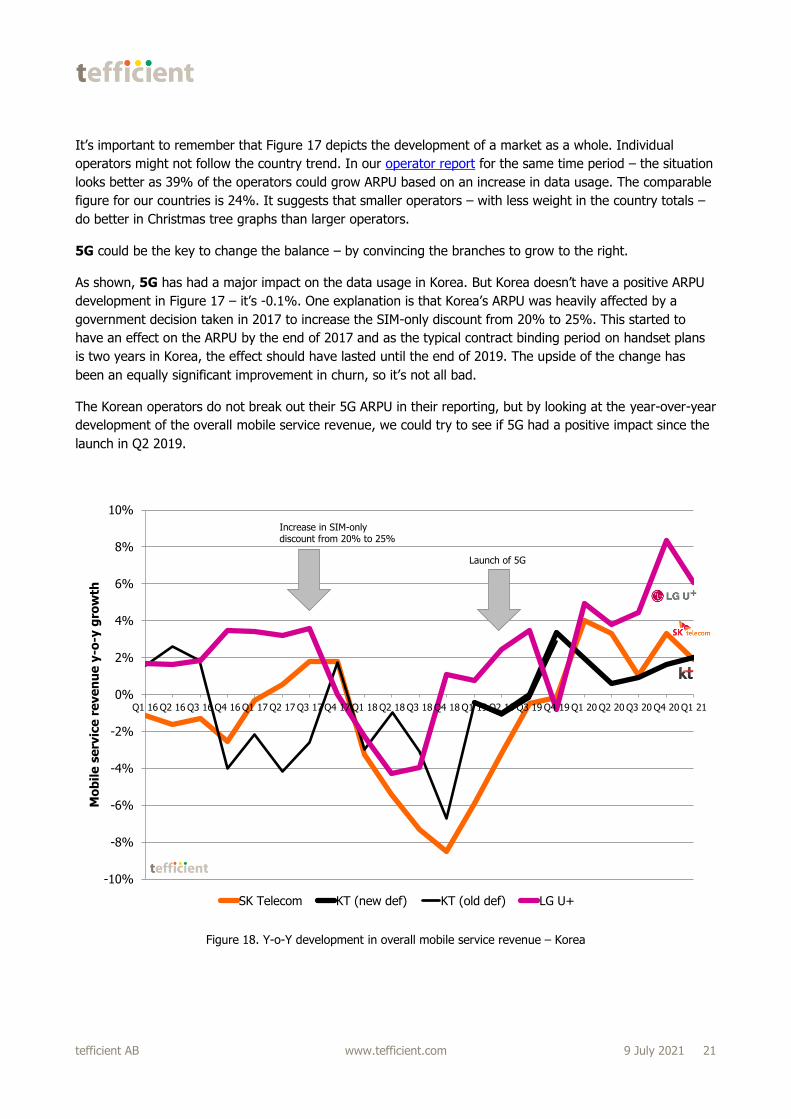
The Korean operators do not break out their 5G ARPU in their reporting, but by looking at the year-over-year
development of the overall mobile service revenue, we could try to see if 5G had a positive impact since the
launch in Q2 2019.
Figure 18. Y-o-Y development in overall mobile service revenue – Korea
-10%
-8%
-6%
-4%
-2%
0%
2%
4%
6%
8%
10%
Q1 16 Q2 16 Q3 16 Q4 16 Q1 17 Q2 17 Q3 17 Q4 17 Q1 18 Q2 18 Q3 18 Q4 18 Q1 19 Q2 19 Q3 19 Q4 19 Q1 20 Q2 20 Q3 20 Q4 20 Q1 21
Mo
bil
e s
erv
ice
re
ve
nu
e y
-o-y
gro
wth
SK Telecom KT (new def) KT (old def) LG U+
Increase in SIM-onlydiscount from 20% to 25%
Launch of 5G

tefficient AB www.tefficient.com 9 July 2021 22
From Figure 18 it’s clear that the increase in SIM-only discount (see the first arrow) had a quite negative
impact on the mobile service revenue when customers rather took the 25% SIM-only discount than
committing to binding contracts with subsidised handsets. At around the time of the second arrow (=5G
launch), the overall mobile service revenue started to grow again – LG U+ first, then KT and finally SK
Telecom.
There’s reason to be positive, but we should also realise that the negative effect of the
SIM-only discount increase effectively should have ended by the end of 2019. A cautious
conclusion is that 5G helped the Korean operators to get back on track. They have now
re-established the revenue growth they had prior to the increase in SIM-only
discount.
5G helped the
Korean
operators to re-
establish
growth

tefficient AB www.tefficient.com 9 July 2021 23
Conclusion
Mobile data usage is growing in all of the 44 countries covered by this analysis. The growth rates
are very different and so are the usage levels. We believe COVID-19 measures have increased the
spread. Finland tops the charts – with 24.4 GB per average SIM per month in 2020. If excluding
M2M, the usage grows to 28.8 GB per month. But in spite of 80% of non-M2M SIMs being
unlimited and three 5G networks covering at least 36% of the population, the data usage growth
rate isn’t particularly high in Finland – 33%. Usage in Croatia grew 111%. To determine usage is
no longer as simple as classifying a market as mature or maturing. The lowest usage is found in
Czech Republic, Portugal, Belgium and Germany, hardly any maturing markets.
Our analysis shows strong correlation between the data-only share of a country’s SIM base and
the average data usage. Latvia, Finland and Bahrain are the data-only powerhouses of the
world. In many markets, data-only’s share of total traffic grew – a trend that started in 2019,
before Corona. We attribute this to FWA.
While 4G doesn’t really drive data usage as such any longer, 5G is different. At least in South
Korea – still the only country with proper reporting on 5G. In Korea, 5G traffic surpassed the 4G
traffic in March 2021 and stands for the majority of the mobile data traffic since April 2021.
The data consumption per 5G subscription is about 2.4 times that of the average subscription –
27.4 GB per month. 5G seems to have helped Korean operators to re-establish mobile service
revenue growth overall.
Regardless of technology, data usage could be elevated by an increased data-only penetration
through fixed-line substitution. But a prerequisite for this – and for high data usage in general – is
that the total revenue per gigabyte is low.
This is the case in India, Latvia, Lithuania, Taiwan, Finland, Bahrain, China and Poland.
Canada, Belgium, New Zealand, Luxembourg and Germany represent the other end.
Low usage doesn’t necessarily mean low ARPU, though. Market ARPU is uncorrelated with usage.
Switzerland, USA and Canada have much higher ARPU than other countries in our analysis.
What is worrying is that only 7 of 29 markets could grow ARPU on the back of data usage
growth. It’s easy to blame Corona for it, but the percentage is actually similar to what we have
had in our previous country analyses. As an industry, we can do better.
International telco competitiveness specialist providing operators and suppliers with analysis, benchmarks and go-to-
market preparation. Expertise in data monetisation, customer loyalty, Nonstop Retention®, FMC, mobile video, fiber, Wi-
Fi, 5G.
www.tefficient.com