Mobile Computing / Mobile BI Market Study 2014
71
December 2014 Dresner Advisory Services, LLC 2014 Edition Mobile Computing / Mobile Business Intelligence Market Study Wisdom of Crowds ® Series Licensed to MicroStrategy
-
Upload
biboardorg -
Category
Software
-
view
356 -
download
5
Transcript of Mobile Computing / Mobile BI Market Study 2014

December 2014
Dresner Advisory Services, LLC
2014 Edition
Mobile Computing / Mobile Business Intelligence Market Study Wisdom of Crowds
®
Series
Licensed to MicroStrategy

DAS Mobile Computing / Mobile Business Intelligence Market Study 2014
COPYRIGHT 2014 DRESNER ADVISORY SERVICES, LLC Page | 2
Disclaimer:
This report should be used for informational purposes only. Vendor and product selections should be made based on
multiple information sources, face-to-face meetings, customer reference checking, product demonstrations, and
proof-of-concept applications.
The information contained in all Wisdom of Crowds® Market Study Reports reflects the opinions expressed in the
online responses of individuals who chose to respond to our online questionnaire and does not represent a scientific
sampling of any kind. Dresner Advisory Services, LLC shall not be liable for the content of Reports, study results, or for
any damages incurred or alleged to be incurred by any of the companies included in the Reports as a result of its
content.
Reproduction and distribution of this publication in any form without prior written permission is forbidden.

DAS Mobile Computing / Mobile Business Intelligence Market Study 2014
COPYRIGHT 2014 DRESNER ADVISORY SERVICES, LLC Page | 3
Contents Introduction .................................................................................................................................................. 5
About Howard Dresner and Dresner Advisory Services ............................................................................... 6
About Jim Ericson .......................................................................................................................................... 7
Benefits of the Study ..................................................................................................................................... 8
A Consumer Guide .................................................................................................................................... 8
A Supplier Tool .......................................................................................................................................... 8
Survey Method and Data Collection ............................................................................................................. 9
Data Collection .......................................................................................................................................... 9
Data Quality .............................................................................................................................................. 9
Executive Summary: .................................................................................................................................... 10
Study Demographics ................................................................................................................................... 12
Geography ............................................................................................................................................... 12
Functions ................................................................................................................................................. 13
Vertical Industries ................................................................................................................................... 14
Organization Size .................................................................................................................................... 15
Analysis and Trends .................................................................................................................................... 16
Mobile Computing .................................................................................................................................. 16
Mobile Application Priorities .............................................................................................................. 16
Mobile Platform Priorities ................................................................................................................... 18
Mobile Application Purchasing ........................................................................................................... 22
Native versus WebApps ...................................................................................................................... 24
In-house Development of Mobile Applications .................................................................................. 25
Mobile Business Intelligence .................................................................................................................. 26
Importance of Mobile BI ..................................................................................................................... 26
Cultural Preparedness for Mobile BI ................................................................................................... 31
Back-end Systems Support for Mobile BI............................................................................................ 36
Mobile BI Device Integration Requirements ....................................................................................... 38
Targeted Users for Mobile Business Intelligence ................................................................................ 39
Mobile Business Intelligence Adoption Through 2017 ....................................................................... 42
Exclusive Use of Business Intelligence on Mobile Devices ................................................................. 46

DAS Mobile Computing / Mobile Business Intelligence Market Study 2014
COPYRIGHT 2014 DRESNER ADVISORY SERVICES, LLC Page | 4
Mobile Business Intelligence Features ................................................................................................ 51
Mobile versus Server Resident Business Intelligence Apps and Data ................................................ 55
Benefits and Limitations of Mobile Business Intelligence .................................................................. 58
Business Intelligence Industry Mobile Capabilities and Plans .................................................................... 60
Mobile Business Intelligence Vendor Scores and Rankings .................................................................... 65
Appendix: Mobile BI Survey Instrument ..................................................................................................... 66

DAS Mobile Computing / Mobile Business Intelligence Market Study 2014
COPYRIGHT 2014 DRESNER ADVISORY SERVICES, LLC Page | 5
Introduction This year we celebrate the seventh anniversary of Dresner Advisory Services! Our thanks to all
of you that have been with us along the way—encouraging and challenging us!
Since our founding in 2007, we have strived to offer a fresh, real-world and alternative
perspective on the business intelligence (BI) market. We hope that you agree that we not only
have succeeded in doing so but have continued to “raise the bar”—offering increasingly
compelling research and greater value with each successive year!
To date, the Wisdom of Crowds family of reports remains unique in that it is the only
comprehensive research on BI usage and trends from the viewpoint of end users. By looking
first hand at the experience of IT and business users as well as industry implementation
consultants, we can better provide you, our readers, with the in-depth knowledge of the drivers
of BI, where and how companies use BI, and what likely will be the next trends on the horizon.
Since we began publishing industry research reports, we have expanded from only two reports
in 2010 to twelve reports in 2014. This includes Location Intelligence, Cloud BI (3rd annual),
Collaborative BI (3rd annual), our flagship Wisdom of Crowds® BI Market Study (5th annual), BI
Competency Center, Advanced & Predictive Analytics, Healthcare, BI Emerging Technologies
(2nd annual), Embedded BI (2nd annual) and Mobile Computing / Mobile BI Market Study (6th
annual).
To this end, we’ve added more resources to Dresner Advisory Services including the additions
of a research director, senior editor and statistician.
For this, our sixth Mobile Computing and Mobile Business Intelligence report, we continue to
evaluate how these technologies are taking hold and changing the nature of BI and work itself!
Like our other thematic research reports, Mobile BI explores user perceptions and intentions
and includes vendor rankings, making it a valuable tool for anyone considering investing in
Mobile BI products and services.
In closing, we wish to thank our clients, research community and colleagues for helping to make
2014 a very successful year at Dresner Advisory Services!
Thanks for your support!
Best,
Howard Dresner Chief Research Officer Dresner Advisory Services

DAS Mobile Computing / Mobile Business Intelligence Market Study 2014
COPYRIGHT 2014 DRESNER ADVISORY SERVICES, LLC Page | 6
About Howard Dresner and Dresner Advisory Services The DAS Embedded Business Intelligence Market Study was conceived, designed and
executed by Dresner Advisory Services, LLC—an independent advisory firm—and
Howard Dresner, its President, Founder and Chief Research Officer.
Howard Dresner is one of the foremost thought leaders in business intelligence and
performance management, having coined the term “Business Intelligence” in 1989. He
has published two books on the subject, The Performance
Management Revolution – Business Results through Insight
and Action (John Wiley & Sons, Nov. 2007) and Profiles in
Performance – Business Intelligence Journeys and the
Roadmap for Change (John Wiley & Sons, Nov. 2009). He
lectures at forums around the world and is often cited by the
business and trade press.
Prior to Dresner Advisory Services, Howard served as chief
strategy officer at Hyperion Solutions and was a research fellow at Gartner, where he
led its business intelligence research practice for 13 years.
Howard has conducted and directed numerous in-depth primary research studies over
the past two decades and is an expert in analyzing these markets.
Through the Wisdom of Crowds® Business Intelligence market research reports, we
engage with a global community to redefine how research is created and shared.
Landmark research reports include the:
- Wisdom of Crowds® Business Intelligence Market Study (Flagship)
- Advanced and Predictive Analytics Market Study
- Business Intelligence Competency Center Market Study
- Collaborative Business Intelligence Market Study
- Cloud Business Intelligence Market Study
- Mobile Computing / Mobile Business Intelligence Market Study
Howard (www.twitter.com/howarddresner) conducts a weekly Twitter “tweetchat” on
Fridays at 1:00 p.m. ET. The hashtag is #BIWisdom. During these live events the
#BIWisdom “tribe” discusses a wide range of business intelligence topics.
You can find more information about Dresner Advisory Services at
www.dresneradvisory.com.

DAS Mobile Computing / Mobile Business Intelligence Market Study 2014
COPYRIGHT 2014 DRESNER ADVISORY SERVICES, LLC Page | 7
About Jim Ericson Jim Ericson is a research director with Dresner Advisory Services.
Jim has served as a consultant and journalist who studies end-user management
practices and industry trending in the data and information management fields.
From 2004 to 2013 he was the editorial director at Information Management magazine
(formerly DM Review), where he created architectures for user and
industry coverage for hundreds of contributors across the breadth of
the data and information management industry.
As lead writer he interviewed and profiled more than 100 CIOs,
CTOs, and program directors in a 2010-2012 program called “25
Top Information Managers.” His related feature articles earned
ASBPE national bronze and multiple Mid-Atlantic region gold and
silver awards for Technical Article and for Case History feature
writing.
A panelist, interviewer, blogger, community liaison, conference co-chair, and speaker in
the data-management community, he also sponsored and co-hosted a weekly podcast
in continuous production for more than five years.
Jim’s earlier background as senior morning news producer at NBC/Mutual Radio
Networks and as managing editor of MSNBC’s first Washington, D.C. online news
bureau cemented his understanding of fact-finding, topical reporting, and serving broad
audiences.

DAS Mobile Computing / Mobile Business Intelligence Market Study 2014
COPYRIGHT 2014 DRESNER ADVISORY SERVICES, LLC Page | 8
Benefits of the Study
The DAS Mobile Computing / Mobile Business Intelligence Market Study provides a
wealth of information and analysis, offering value to both consumers and producers of
Business Intelligence technology and services.
A Consumer Guide
As an objective source of industry research, consumers use the DAS Mobile Computing
/ Mobile Business Intelligence Market Study to understand how their peers are
leveraging and investing in Business Intelligence and related technologies.
Using our unique vendor performance measurement system, users glean key insights
into mobile BI software supplier performance, enabling:
Comparisons of current vendor performance to industry norms
Identification and selection of new vendors
A Supplier Tool
Vendor Licensees use the DAS Mobile Computing / Mobile Business Intelligence
Market Study in several important ways:
External Awareness
Build awareness for the Business Intelligence market and supplier brand,
citing DAS Mobile Computing / Mobile Business Intelligence Market Study
trends and vendor performance
Create lead and demand-generation for supplier offerings through association
with DAS Mobile Computing / Mobile Business Intelligence Market Study
brand, findings, webinars, etc.
Internal Planning
Refine internal product plans and align with market priorities and realities as
identified in DAS Mobile Computing / Mobile Business Intelligence Market
Study
Better understand customer priorities, concerns, and issues
Identify competitive pressures and opportunities

DAS Mobile Computing / Mobile Business Intelligence Market Study 2014
COPYRIGHT 2014 DRESNER ADVISORY SERVICES, LLC Page | 9
Survey Method and Data Collection As with all of our Wisdom of Crowds® Market Studies we constructed a survey
instrument to collect data and used social media and crowd-sourcing techniques to
recruit participants.
Data Collection
Using a unique data collection platform for Mobile Computing / Mobile Business
Intelligence Market Study we were able to increase our sample year over year (fig. 1).
Figure 1 - Mobile computing / business intelligence market study data collection 2010 - 2014
Data Quality
We carefully scrutinized and verified all respondent entries to ensure that only qualified
participants were included in the study.
0
50
100
150
200
250
300
2010 2011 2012 2013 2014
Mobile Computing / Business Intelligence Market Study Data Collection 2010 - 2014

DAS Mobile Computing / Mobile Business Intelligence Market Study 2014
COPYRIGHT 2014 DRESNER ADVISORY SERVICES, LLC Page | 10
Executive Summary:
- In 2014, business intelligence for the first time represents the number-two priority
in mobile applications and trails only email.
- The most prioritized features for mobile BI include traditional: capabilities for
viewing charts and reports, selecting data, drilling down, and monitoring KPIs
and alerts are top user priorities.
- In 2014, multi-touch interface (dragging, multitasking, etc.) remained top
integration priorities followed by GPS and context awareness.
- A growing requirement for mobile business intelligence is better interaction and
the ability to select and drill data.
- Small organizations are the most ambitious drivers of most mobile applications
including business intelligence, and rank mobile BI more highly than larger peers.
- In 2014, Apple’s iOS phones and tablets remain the top priority, followed by
Android smartphones.
- Microsoft devices have gained some ground, though Apple remains the clear
leader; Surface tablets are now not far behind Android as a top-three pick among
vendor platforms.
- iOS use saturated and leveled off somewhat in the last two years as Google
Android shares grew larger.
- Organizations still rely strongly on Apple and Google stores for most of their
needs, though they want an enterprise application store and third-party consumer
app providers.
- Users in the Apple and Android world prefer native downloadable applications on
their devices. Among non-Apple/Android users, preference shifts toward browser
access.
- A significant minority of internal developer organizations are currently
building/deploying mobile apps for Apple iOS (> 40 percent), Android (30
percent) and, to some extent, Windows.
- Perceived value of mobile BI is steady and reached a new high in 2014; the
audience that considers mobile BI “critical” also reached a peak.
- Latin America and Asia Pacific, where the economics and cultural adoption of
mobile technologies grew most quickly, place a higher priority on mobile BI than
other regions.
- Across functions and vertical industries, roles and organizations with a strong
outward field presence or customer-facing presence are more likely to place a
higher priority upon mobile BI.
- Preparedness for mobile BI as a core tenet of organizational culture is strongest
in small organizations.

DAS Mobile Computing / Mobile Business Intelligence Market Study 2014
COPYRIGHT 2014 DRESNER ADVISORY SERVICES, LLC Page | 11
- Most organizations have chosen to stick with existing in-house enterprise
applications and services for mobile BI; about one-quarter use public cloud and
less than one-quarter use private cloud structures.
- Executives remain the top consumers and targets for mobile business
intelligence, but managers are now increasingly targeted.
- Penetration of mobile business intelligence remains modest: 20 percent report no
mobile capabilities whatsoever and more than 60 percent of organizations report
10 percent or fewer users with mobile access. Forward expectations are
ambitious by comparison.
- Small organizations are most ambitious in their current mobile BI deployments
and future plans.
- A majority of respondents believe fewer than 20 percent of their users will be
“mobile BI only” by 2016.
- “Mobile-only” BI expectations are no longer increasing. We believe organizations
are taking a balanced approach to usage.
- An organizational preference for storing apps and data in servers only (and not
locally on devices) has increased in every year of our study. North America most
strongly supports this trend.

DAS Mobile Computing / Mobile Business Intelligence Market Study 2014
COPYRIGHT 2014 DRESNER ADVISORY SERVICES, LLC Page | 12
Study Demographics As with all of our studies, we sought a rich cross-section of data across geographies,
functions, organization size, and vertical industries. We believe that, unlike other
industry research, we offer a more characteristic sample and better indicator of true
market dynamics.
We constructed cross-tab analyses using these demographics to identify and illustrate
important industry trends.
Geography
As in previous years, survey respondents reflect a wide array of geographies—including
27 percent from EMEA (22 countries) and 12 percent from APAC (8 countries).
Although North America represents the largest group, it is in itself diverse—representing
four Canadian provinces and a majority of U.S. states (fig. 2).
Figure 2 - Geographic distribution
55%
27%
12%
6%
0%
10%
20%
30%
40%
50%
60%
North America Europe, Middle East andAfrica
Asia/Pacific Latin America
Geographic Distribution

DAS Mobile Computing / Mobile Business Intelligence Market Study 2014
COPYRIGHT 2014 DRESNER ADVISORY SERVICES, LLC Page | 13
Functions
The IT function represents the largest single group of respondents—nearly 40 percent
of the sample. We also received strong participation from the executive management,
sales and marketing, finance and other functions (fig. 3).
This distribution across functions allows analyses to compare and contrast the
influence, plans, and priorities of the different departments within organizations.
Figure 3 - Functions represented
39%
23%
10% 9% 8%
2%
0%
5%
10%
15%
20%
25%
30%
35%
40%
45%
InformationTechnology (IT)
ExecutiveManagement
Sales andMarketing
Finance Research andDevelopment
(R&D)
Manufacturing
Functions Represented

DAS Mobile Computing / Mobile Business Intelligence Market Study 2014
COPYRIGHT 2014 DRESNER ADVISORY SERVICES, LLC Page | 14
Vertical Industries
We experienced broad vertical industry participation including technology, financial
services, healthcare, and retail segments. We allow and encourage the participation of
consultants—who often have deeper industry knowledge than their customer
counterparts. Third-party relationships give us insight into the partner ecosystem for BI
vendors (fig. 4).
Figure 4 – Respondents by vertical industry
17%
16%
9% 8%
6%
5% 4% 4%
3% 3% 3% 2% 2% 2%
0%
2%
4%
6%
8%
10%
12%
14%
16%
18%
20%
Respondents by Vertical Industry

DAS Mobile Computing / Mobile Business Intelligence Market Study 2014
COPYRIGHT 2014 DRESNER ADVISORY SERVICES, LLC Page | 15
Organization Size
We achieved a balanced mix of small, medium, and large organizations (fig. 5). This
year the largest organizations represent 40 percent of the sample, mid-sized
organizations represent 24 percent, and the smallest organizations represent 34
percent. As in all of our studies, we observe important differences by organization size.
Figure 5 – Respondents by organization size
34%
24%
16%
24%
0%
5%
10%
15%
20%
25%
30%
35%
40%
1-100 101 - 1000 1001 - 5000 More than 5000
Respondents by Organization Size

DAS Mobile Computing / Mobile Business Intelligence Market Study 2014
COPYRIGHT 2014 DRESNER ADVISORY SERVICES, LLC Page | 16
Analysis and Trends
Mobile Computing
In this section we focus upon several key factors related to the broader Mobile
Computing market including mobile application prioritization, mobile platform
prioritization, current mobile platform usage and plans, mobile device management use
/ plans, and native versus Web applications.
Mobile Application Priorities
In each of our last four annual studies we asked respondents to indicate which mobile
applications have the highest priority in their organizations. In 2014, mobile business
intelligence for the first time represents the number-two priority among organizations
sampled. Across the entire spectrum of mobile applications—including applications for
personal information management, CRM, and collaboration—business intelligence now
trails only email as a priority (fig. 6).
Figure 6 - Mobile application priorities 2011 - 2014
0 0.5 1 1.5 2 2.5 3 3.5 4
Personal or business banking via mobile
Mobile payments
Social media access (e.g., Twitter, LinkedIn,Facebook, Google+, Yelp)
ERP applications access
Map / directions
Video conferencing / chat
Collaboration framework
CRM applications access
Personal information management (contacts,calendaring & scheduling)
Business intelligence
Mobile Application Priorities 2011 - 2014
2011
2012
2013
2014

DAS Mobile Computing / Mobile Business Intelligence Market Study 2014
COPYRIGHT 2014 DRESNER ADVISORY SERVICES, LLC Page | 17
Small organizations are the most ambitious drivers of most mobile applications,
including mobile business intelligence; and small organizations rank mobile BI more
highly than large counterparts. By comparison, when we examine only large
organizations, business intelligence falls from the second to the third priority behind
personal information management. The small organization application preference gap
extends notably to collaboration frameworks, mapping, social media access, mobile
payments and mobile banking (fig. 7). Generally, large organizations move more slowly
than smaller counterparts and can be less tapped into user behaviors.
Figure 7 - Mobile application priorities by organization size
0
0.5
1
1.5
2
2.5
3
3.5
4
Mobile Application Priorities by Organization Size
1 - 100 101 - 1000 1001 - 5000 More than 5000

DAS Mobile Computing / Mobile Business Intelligence Market Study 2014
COPYRIGHT 2014 DRESNER ADVISORY SERVICES, LLC Page | 18
Mobile Platform Priorities
In this section (figs. 8, 9, 10, 11) we asked respondents about their adoption and
attitudes toward mobile device platforms with different measures of usage and future
plans.
In 2014 (as in 2011, 2012, and 2013), organizations tell us that Apple’s iOS devices are
and remain the current top priority, followed by Android smartphones (fig. 8). Following
the top three preferred platforms, the field trails off considerably. RIM use falls behind
Microsoft and the remaining vendors scuffle for attention.
Figure 8 – Mobile platform priorities
0% 10% 20% 30% 40% 50% 60% 70% 80% 90% 100%
RIM Playbook Tablet
Tizen (New Samsung OS)
Amazon Fire Phone
Firefox Mobile OS
BlackBerry (RIM) SmartPhone
Microsoft Windows Phone 8
Microsoft Surface Tablet
Google Android Tablet
Google Android Smartphone
Apple iPad Tablet
Apple iPhone
Total Percentage of Participants
Mobile Platform Priorities
1st
2nd
3rd
4th
5th
6th
7th
8th
9th
10th
11th

DAS Mobile Computing / Mobile Business Intelligence Market Study 2014
COPYRIGHT 2014 DRESNER ADVISORY SERVICES, LLC Page | 19
We also looked at the platforms actually in use today and planned for 2014.
Once again and by a good margin, Apple iPhones and tablets head the pack followed
by Android phones and tablets (fig. 9). Further, 2014 plans for Apple are slim due to
saturation. Microsoft devices gained some ground: Surface tablets are now not far
behind Android as a top-three pick among vendor platforms. It should be noted that a
good number of BlackBerry phones remain in use, though more than half of the
respondents report “no interest.”
Additional finding: Apple tablets previously held an edge over the iPhone in terms of
current usage/planning, but the two are now practically even in use. This may reflect the
general easing of tablet uptake compared to phones.
Figure 9 - Mobile platforms: In use and planned
0% 10% 20% 30% 40% 50% 60% 70% 80% 90% 100%
RIM Playbook Tablet
Amazon Fire Phone
Tizen (New Samsung OS)
Firefox Mobile OS
BlackBerry (RIM) SmartPhone
Microsoft Windows Phone 8
Microsoft Surface Tablet
Google Android Tablet
Google Android Smartphone
Apple iPad Tablet
Apple iPhone
% of Respondents By Platform
Mobile Platforms: In Use and Planned
In-use Planned: Next 12 months Planned: Next 24 months No interest
DAS Mobile Computing / Mobile Business Intelligence Market Study 2014
COPYRIGHT 2014 DRESNER ADVISORY SERVICES, LLC Page | 20
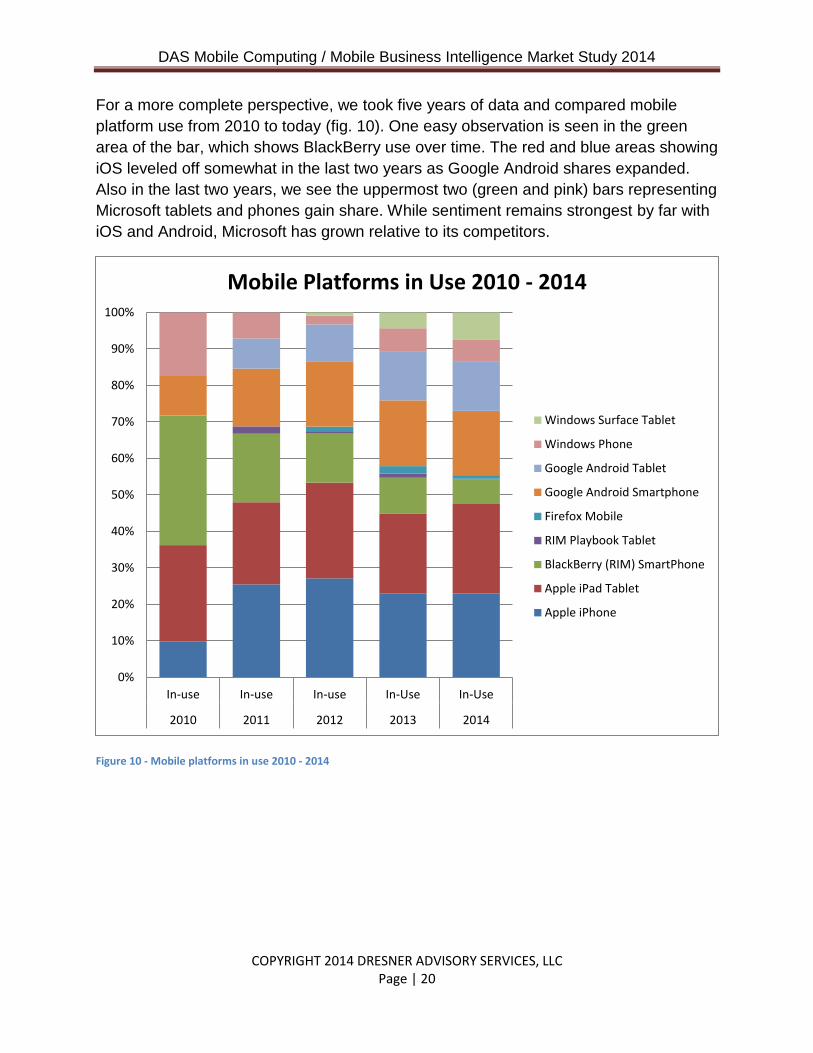
For a more complete perspective, we took five years of data and compared mobile
platform use from 2010 to today (fig. 10). One easy observation is seen in the green
area of the bar, which shows BlackBerry use over time. The red and blue areas showing
iOS leveled off somewhat in the last two years as Google Android shares expanded.
Also in the last two years, we see the uppermost two (green and pink) bars representing
Microsoft tablets and phones gain share. While sentiment remains strongest by far with
iOS and Android, Microsoft has grown relative to its competitors.
Figure 10 - Mobile platforms in use 2010 - 2014
0%
10%
20%
30%
40%
50%
60%
70%
80%
90%
100%
In-use In-use In-use In-Use In-Use
2010 2011 2012 2013 2014
Mobile Platforms in Use 2010 - 2014
Windows Surface Tablet
Windows Phone
Google Android Tablet
Google Android Smartphone
Firefox Mobile
RIM Playbook Tablet
BlackBerry (RIM) SmartPhone
Apple iPad Tablet
Apple iPhone

DAS Mobile Computing / Mobile Business Intelligence Market Study 2014
COPYRIGHT 2014 DRESNER ADVISORY SERVICES, LLC Page | 21
We used this same data to compare plans over the last five years and see that, in 2010,
plans for Apple iOS outpaced all others by a wide margin (fig. 11). By 2011 this shifted
in favor of Google devices. From 2012 on, 40 percent of respondents indicated plans for
Microsoft Surface and Windows phone devices. While plans do not always lead to
action, Microsoft is in the thinking of many organizations’ respondents as an addition or
alternative to other devices. In line with other findings, plans for RIM devices
(BlackBerry and Playbook) have consistently declined over time.
Figure 11 - Mobile platforms planned 2010 - 2014
0%
10%
20%
30%
40%
50%
60%
70%
80%
90%
100%
Planned Planned Planned Planned Planned
2010 2011 2012 2013 2014
Mobile Platforms Planned 2011 - 2014
Windows Surface Tablet
Windows Phone
Google Android Tablet
Google Android Smartphone
Firefox Mobile
RIM Playbook Tablet
BlackBerry (RIM) SmartPhone
Apple iPad Tablet
Apple iPhone
DAS Mobile Computing / Mobile Business Intelligence Market Study 2014
COPYRIGHT 2014 DRESNER ADVISORY SERVICES, LLC Page | 22
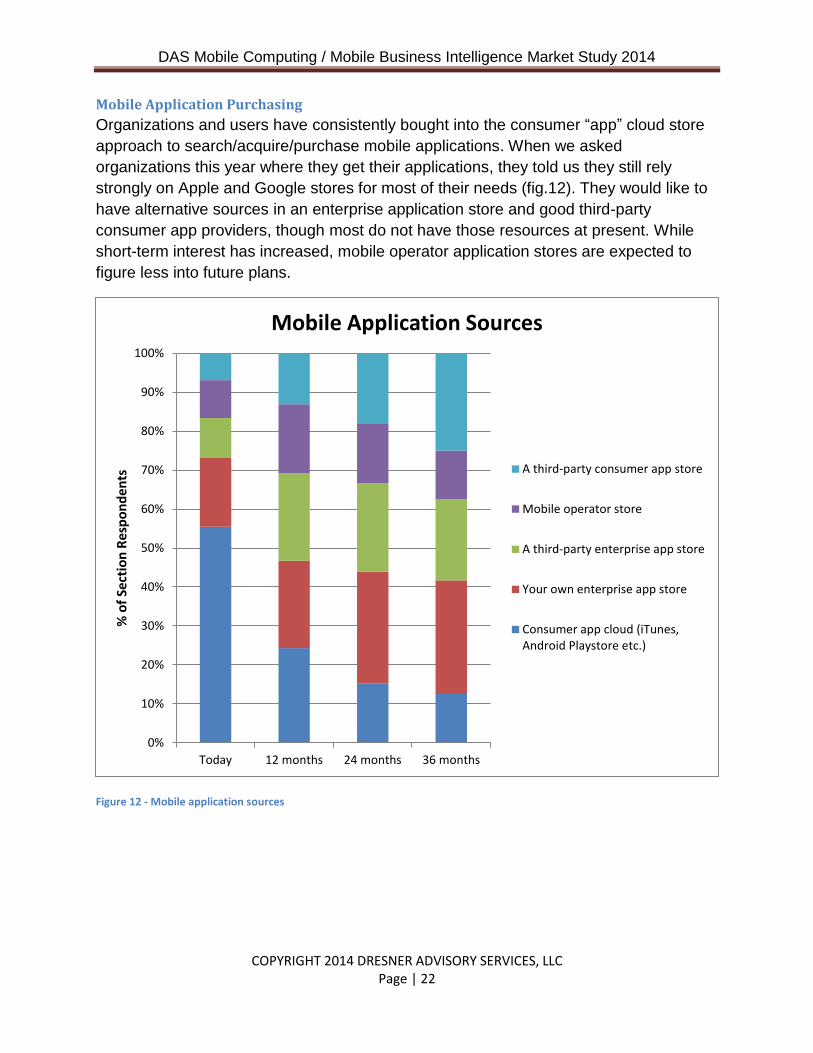
Mobile Application Purchasing
Organizations and users have consistently bought into the consumer “app” cloud store
approach to search/acquire/purchase mobile applications. When we asked
organizations this year where they get their applications, they told us they still rely
strongly on Apple and Google stores for most of their needs (fig.12). They would like to
have alternative sources in an enterprise application store and good third-party
consumer app providers, though most do not have those resources at present. While
short-term interest has increased, mobile operator application stores are expected to
figure less into future plans.
Figure 12 - Mobile application sources
0%
10%
20%
30%
40%
50%
60%
70%
80%
90%
100%
Today 12 months 24 months 36 months
% o
f Se
ctio
n R
esp
on
de
nts
Mobile Application Sources
A third-party consumer app store
Mobile operator store
A third-party enterprise app store
Your own enterprise app store
Consumer app cloud (iTunes,Android Playstore etc.)

DAS Mobile Computing / Mobile Business Intelligence Market Study 2014
COPYRIGHT 2014 DRESNER ADVISORY SERVICES, LLC Page | 23
Though organizations express a desire to move away from consumer app cloud stores,
they have not been able to do so and consumer apps have maintained a dominant
share throughout the last four years. The tendency to rely on the iOS or Android
consumer store faded slightly this year compared to 2013, not so much in favor of the
internal app store as toward other third parties. This equation is also driven by whether
independent vendors choose to offer apps directly (i.e., via HTML5) or through iOS and
Android app stores.
Figure 13 – App store preferences 2011 - 2014
55% 57% 58% 55%
15% 11% 12% 10%
13% 15% 18%
18%
7% 9% 6%
7%
10% 7% 6% 10%
0%
10%
20%
30%
40%
50%
60%
70%
80%
90%
100%
2011 2012 2013 2014
App Store Preferences 2011 - 2014
Third-party enterprise app store
Third-party consumer app store
Internal enterprise app store
Mobile operator store
Consumer app cloud (iTunes,Android Playstore, etc.)

DAS Mobile Computing / Mobile Business Intelligence Market Study 2014
COPYRIGHT 2014 DRESNER ADVISORY SERVICES, LLC Page | 24
Native versus WebApps
We asked respondents about their preference for native downloaded applications
versus browser apps using HTML or for blended/hybrid apps “wrapped” for consumer
app store distribution (fig. 14). Users in the Apple and Android world plainly prefer to
have native downloadable applications on their devices. Moving upward on the chart (to
non-Apple and Android platforms) the preference shifts toward browser access. The
current level of app development, consistency, and familiarity with Google and
especially Apple app stores amplifies this preference.
Figure 14 – Native apps versus WebApps
0% 10% 20% 30% 40% 50% 60% 70% 80% 90% 100%
Apple iPhone
Apple iPad Tablet
Google Android Smartphone
Google Android Tablet
Microsoft Surface Tablet
Microsoft Windows Phone 8
BlackBerry (RIM) SmartPhone
Tizen (New Samsung OS)
Firefox Mobile OS
Amazon Fire Phone
Native Apps versus WebApps
Blended/hybrid Web browser access Native, down-loadable applications

DAS Mobile Computing / Mobile Business Intelligence Market Study 2014
COPYRIGHT 2014 DRESNER ADVISORY SERVICES, LLC Page | 25
In-house Development of Mobile Applications
In 2013 we began asking respondents whether they were developing their own
applications in house. Where they are, a significant minority of internal developer
organizations in 2014 are developing for Apple iOS (> 40 percent), Android (30 percent)
and, to some extent, Windows (fig. 15). Somewhat equal future plans exist for the same
three platforms. There are very few plans for application development on other
platforms.
Figure 15 – Mobile in-house development
0% 10% 20% 30% 40% 50% 60% 70% 80% 90% 100%
RIM Playbook Tablet
Tizen (New Samsung OS)
Amazon Fire Phone
Firefox Mobile OS
BlackBerry (RIM) SmartPhone
Microsoft Windows Phone 8
Microsoft Surface Tablet
Google Android Tablet
Google Android Smartphone
Apple iPhone
Apple iPad Tablet
% of Respondents By Platform
Mobile In-house Development
Developing/already developed today Planned: Next 12 months
Planned: Next 24 months No plans to develop

DAS Mobile Computing / Mobile Business Intelligence Market Study 2014
COPYRIGHT 2014 DRESNER ADVISORY SERVICES, LLC Page | 26
Mobile Business Intelligence
In this section we focus on key factors related to mobile business intelligence including
its importance to organizations, perceived benefits and limitations, cultural
preparedness; back-end systems support, device integration preferences, plans for
adoption; exclusive mobile use; targeted user communities, and required business
intelligence features.
Importance of Mobile BI
Since 2010, when we chartered our first mobile business intelligence market study, we
have seen a steady perception of value among organizations we sampled (fig. 16). In
2013, the percentage of respondents calling mobile BI “critical” or “very important”
declined from 61 percent to 57 percent. In 2014, mean sentiment rebounded to a new
high and the audience that considers mobile BI “critical” also reached a peak. We would
describe the five-year range of change as narrow and the overall trend positive, while
acknowledging that attitudes about immediacy/criticality fluctuate as organizations move
from planning to deployment.
Figure 16 – Importance of mobile BI 2010 - 2014
2.45
2.5
2.55
2.6
2.65
2.7
2.75
2.8
0%
10%
20%
30%
40%
50%
60%
70%
80%
90%
100%
2010 2011 2012 2013 2014
Importance of Mobile BI - 2010 - 2014
Unimportant Somewhat important Very important Critical Mean

DAS Mobile Computing / Mobile Business Intelligence Market Study 2014
COPYRIGHT 2014 DRESNER ADVISORY SERVICES, LLC Page | 27
From a geographical perspective, Latin America and Asia Pacific place a higher priority
on mobile BI than other regions (fig. 17). These are the same regions where the
economics and cultural adoption of mobile technologies grew most quickly. The Europe,
Middle East, and Africa region also responds more positively than North America, where
hard infrastructure was more prominently developed. We believe that—like the leap-frog
effect of cell phones in developing nations—those without traditional BI may invest in
mobile BI first.
Figure 17 - Importance of mobile BI by geography
1
1.5
2
2.5
3
3.5
4
0%
10%
20%
30%
40%
50%
60%
70%
80%
90%
100%
Latin America Asia/Pacific Europe, MiddleEast and Africa
North America
Importance of Mobile BI by Geography
Critically important
Very important
Somewhat important
Not important
Mean

DAS Mobile Computing / Mobile Business Intelligence Market Study 2014
COPYRIGHT 2014 DRESNER ADVISORY SERVICES, LLC Page | 28
From a functional perspective, we find that audiences that are “nomadic” or spend more
time outside the four walls of the workplace are likely to place the greatest value on
mobile BI (fig. 18). Sales and executive management most reflect this demographic and
are typically the strongest use drivers of mobile BI in the organization. Conversely,
manufacturing, finance, and IT are more likely to prefer traditional native BI
environments in processes traditionally confined to the workplace.
Figure 18 - Importance of mobile BI by function
1
1.5
2
2.5
3
3.5
4
0%
10%
20%
30%
40%
50%
60%
70%
80%
90%
100%
Importance of Mobile BI by Function
Critically important
Very important
Somewhat important
Not important
Mean
DAS Mobile Computing / Mobile Business Intelligence Market Study 2014
COPYRIGHT 2014 DRESNER ADVISORY SERVICES, LLC Page | 29
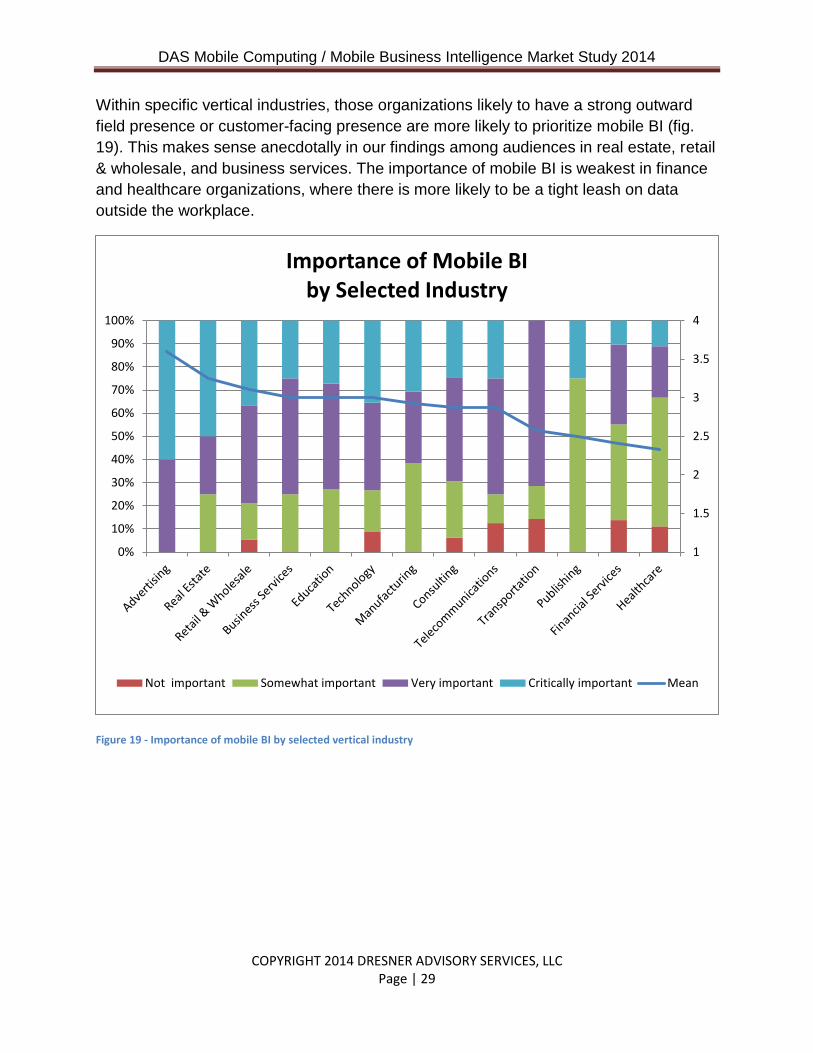
Within specific vertical industries, those organizations likely to have a strong outward
field presence or customer-facing presence are more likely to prioritize mobile BI (fig.
19). This makes sense anecdotally in our findings among audiences in real estate, retail
& wholesale, and business services. The importance of mobile BI is weakest in finance
and healthcare organizations, where there is more likely to be a tight leash on data
outside the workplace.
Figure 19 - Importance of mobile BI by selected vertical industry
1
1.5
2
2.5
3
3.5
4
0%
10%
20%
30%
40%
50%
60%
70%
80%
90%
100%
Importance of Mobile BI by Selected Industry
Not important Somewhat important Very important Critically important Mean

DAS Mobile Computing / Mobile Business Intelligence Market Study 2014
COPYRIGHT 2014 DRESNER ADVISORY SERVICES, LLC Page | 30
As is the case with other technology introductions, small organizations are most likely to
look to mobile BI to differentiate and achieve competitive edge (fig. 20). We also see a
familiar U-shaped or “ski jump” curve where importance ebbs among medium and some
larger organizations before increasing again with the largest.
Figure 20 - Importance of mobile BI by organization size
1
1.5
2
2.5
3
3.5
4
0%
10%
20%
30%
40%
50%
60%
70%
80%
90%
100%
1-100 101 - 1000 1001 - 5000 More than 5000
Importance of Mobile BI by Organization Size
Critically important
Very important
Somewhat important
Not important
Mean

DAS Mobile Computing / Mobile Business Intelligence Market Study 2014
COPYRIGHT 2014 DRESNER ADVISORY SERVICES, LLC Page | 31
Cultural Preparedness for Mobile BI
Mobile business intelligence introduces a different paradigm into the culture of users
that can shift the ways they use business intelligence to be successful (fig. 21).
Respondents tell us that the degree to which preparedness for mobile BI has become a
core tenet of organizational culture increased slightly in 2014. Those “completely
prepared” or “somewhat prepared” represent a large majority of respondents, which
indicates that organizations are more comfortable with the use or prospect of mobile BI
than in the past. The number of organizations completely unprepared for mobile BI is
less than 10 percent and may represent a static audience.
Figure 21 – Cultural preparedness for mobile BI – 2012 - 2014
2
2.2
2.4
2.6
2.8
3
3.2
3.4
0%
10%
20%
30%
40%
50%
60%
70%
80%
90%
100%
2012 2013 2014
Cultural Preparedness for Mobile BI 2012 - 2014
Completely prepared
Somewhat prepared
Somewhat unprepared
Completely unprepared
Mean

DAS Mobile Computing / Mobile Business Intelligence Market Study 2014
COPYRIGHT 2014 DRESNER ADVISORY SERVICES, LLC Page | 32
Geography is another strong indicator of cultural preparedness for mobile BI (fig. 22).
Latin America and Asia/Pacific organizations that led adoption of wireless protocols and
other mobility uses perceive themselves to be more culturally prepared for Mobile BI
than respondents in EMEA and North America.
Figure 22 - Cultural preparedness for mobile BI by geography 2014
1
1.5
2
2.5
3
3.5
4
0%
10%
20%
30%
40%
50%
60%
70%
80%
90%
100%
Asia/Pacific Latin America Europe, MiddleEast and Africa
North America
Cultural Preparedness for Mobile BI by Geography
Strongly agree
Somewhat agree
Somewhat disagree
Strongly disagree
Mean

DAS Mobile Computing / Mobile Business Intelligence Market Study 2014
COPYRIGHT 2014 DRESNER ADVISORY SERVICES, LLC Page | 33
The role/function that an individual plays within an organization maps to cultural
preparedness as it does to other indicators for mobile BI (fig. 23). Again, users with
roles that require them to be “nomadic” (outside of the office more than inside) tend to
be among the most prepared and used to using mobile technology as a regular part of
their jobs. Executives and sales & marketing are the most prepared; finance and IT are
the least prepared.
Figure 23 - Cultural preparedness for mobile BI by function
1
1.5
2
2.5
3
3.5
4
0%
10%
20%
30%
40%
50%
60%
70%
80%
90%
100%
Cultural Preparedness for Mobile BI by Function
Strongly agree
Somewhat agree
Somewhat disagree
Strongly disagree
Mean

DAS Mobile Computing / Mobile Business Intelligence Market Study 2014
COPYRIGHT 2014 DRESNER ADVISORY SERVICES, LLC Page | 34
Just as specific industries and roles impact cultural preparedness for mobile BI,
organization size also figures in the equation (fig. 24). The smallest of organizations
tend to be more mobile (nomadic), on average, than their larger counterparts. As such,
the move to mobile BI seems much more natural for small versus large organizations.
Together, about 80 percent of small and mid-sized organizations somewhat or
completely agree they are culturally prepared for mobile BI. Again, a U-shaped curve
describes weakening preparedness among mid-sized and some large organizations and
a rebound among the largest.
Figure 24 - Cultural preparedness for mobile BI by organization size
1
1.5
2
2.5
3
3.5
4
0%
10%
20%
30%
40%
50%
60%
70%
80%
90%
100%
1-100 101 - 1000 1001 - 5000 More than 5000
Cultural Preparedness for Mobile BI by Organization Size
Strongly agree
Somewhat agree
Somewhat disagree
Strongly disagree
Mean

DAS Mobile Computing / Mobile Business Intelligence Market Study 2014
COPYRIGHT 2014 DRESNER ADVISORY SERVICES, LLC Page | 35
Cultural preparedness across vertical industries does not follow a clear-cut trend,
though it is logical to think those industries with a strong outward presence should also
be the most attuned to mobile BI (fig. 25). Transportation, telecommunications, and high
tech (which tends to be a universal adopter) all report high cultural preparedness.
Anecdotally we know that retail has been an early adopter. As a rule we would expect
that industries most exposed to change and innovation (and least regulated in their
business processes) would also be the most ready for mobile BI, but we acknowledge
that culture is specific to unique organizations.
Figure 25 - Cultural preparedness for mobile BI by selected vertical industry
1
1.5
2
2.5
3
3.5
4
0%
10%
20%
30%
40%
50%
60%
70%
80%
90%
100%
Cultural Preparedness for Mobile BI by Selected Vertical Industry
Strongly disagree Somewhat disagree Somewhat agree Strongly agree Mean

DAS Mobile Computing / Mobile Business Intelligence Market Study 2014
COPYRIGHT 2014 DRESNER ADVISORY SERVICES, LLC Page | 36
Back-end Systems Support for Mobile BI
Given the enduring attention to cloud computing, we might have expected to see
significant movement in the back-end systems supporting mobile BI over time, but we
have not (fig. 26). While the percentages vary year over year, most organizations chose
to stick with existing in-house delivery of enterprise applications and services. About
one-quarter use public cloud and less than one-quarter support mobile BI with private
cloud-based structures. Our main takeaway is that about three-quarters have
consistently stayed with in-house systems, and we foresee a shift of uncertain duration
over time.
Figure 26 – Back-end systems supporting mobile BI 2011 - 2014
58%
55%
54%
58%
22%
23%
22%
24%
24%
22%
24%
17%
0% 10% 20% 30% 40% 50% 60% 70% 80% 90% 100%
2014
2013
2012
2011
Back-end Systems Supporting Mobile 2011 - 2014
Existing in-house enterprise applications and services Private cloud-based Public cloud-based

DAS Mobile Computing / Mobile Business Intelligence Market Study 2014
COPYRIGHT 2014 DRESNER ADVISORY SERVICES, LLC Page | 37
Not surprisingly, the smallest enterprises are more likely to embrace public cloud than
their larger counterparts and, in 2014, small-organization use of public back end
services outstripped in-house infrastructure (fig. 27). Small organizations have an
opportunity to try public cloud back-end systems institutionally and at low risk, a strategy
that is supported by the business models of a field of vendors. Mid-sized and large
organizations (and the overall sample) remain more likely to depend on enterprise
standards (and existing investments) for the time being. Without compelling motivation,
we anticipate this will change only slowly and incrementally over time.
Figure 27 – Back-end systems supporting mobile BI by organization size
0
0.5
1
1.5
2
2.5
3
Existing in-house enterpriseapplications and services
Private cloud-based/Software-as-a-service applications
Public cloud-based/Software-as-a-service applications
Back-end Systems Supporting Mobile BI by Organization Size
1-100 101 - 1000 1001 - 5000 More than 5000 Mean

DAS Mobile Computing / Mobile Business Intelligence Market Study 2014
COPYRIGHT 2014 DRESNER ADVISORY SERVICES, LLC Page | 38
Mobile BI Device Integration Requirements
Since 2012, we have asked participants to list their requirement for business
intelligence integration with mobile devices (fig. 28). In 2014, multi-touch interface
(dragging, multitasking etc.) remained top of mind followed by GPS and context
awareness. In total, BI integration priorities increased slightly across the board with the
exception of accelerometer and Google Glass technologies.
Figure 28 - Mobile BI device integration priorities 2013 - 2014
0
0.5
1
1.5
2
2.5
3
Mobile BI Device Integration Priorities 2013 - 2014
2013 2014

DAS Mobile Computing / Mobile Business Intelligence Market Study 2014
COPYRIGHT 2014 DRESNER ADVISORY SERVICES, LLC Page | 39
Targeted Users for Mobile Business Intelligence
As in all previous years, executives remain the top consumers and targets for mobile
business intelligence (fig. 29) followed by middle managers and, to a lesser extent, line
managers and individual contributors. Smaller percentages of respondents target
customers and suppliers and one-quarter consider customers primary targets; but
almost half say that mobile BI is “not applicable” to those constituents.
Figure 29 - Targeted users for mobile BI
0% 10% 20% 30% 40% 50% 60% 70% 80% 90% 100%
% of Section Respondents
Targeted Users for Mobile BI
Primary Secondary Not applicable

DAS Mobile Computing / Mobile Business Intelligence Market Study 2014
COPYRIGHT 2014 DRESNER ADVISORY SERVICES, LLC Page | 40
Though executives have consistently been the primary target for mobile BI (Figure 30),
the degree to which they are targeted has decreased in recent years while the targeting
of middle managers and (to some degree) line managers increased. In that target
audiences are a purposeful pursuit, we count it as good news that the use of mobile BI
is beginning to filter down in organizations. With the ubiquity of mobile devices among
knowledge workers and more flexible licensing options from vendors, we hope and
expect that a broader BI provisioning trend will continue.
Figure 30 - Primary targets for mobile BI 2010 - 2014
0%
10%
20%
30%
40%
50%
60%
70%
80%
90%
Executives Middlemanagers
Line managers Individualcontributors and
professionals
Customers Suppliers
Primary Targets for Mobile BI 2010 - 2014
2010 2011 2012 2013 2014

DAS Mobile Computing / Mobile Business Intelligence Market Study 2014
COPYRIGHT 2014 DRESNER ADVISORY SERVICES, LLC Page | 41
We also looked at targeted users by organization size (fig. 31). These results are
colored to the degree that small organizations are more dominated by executives and
larger organizations are more likely to have more roles. Still, very small organizations
are also the most likely to target customers. Very large organizations are more likely to
empower individual contributors and professionals attached to the organization.
Figure 31 - Mobile BI target users by organization size
0%
10%
20%
30%
40%
50%
60%
70%
80%
90%
100%
1-100 101 - 1000 1001 - 5000
Mobile BI Target Users by Organization Size
Executives
Middle managers
Line managers
Individual contributors andprofessionals
Customers
Suppliers

DAS Mobile Computing / Mobile Business Intelligence Market Study 2014
COPYRIGHT 2014 DRESNER ADVISORY SERVICES, LLC Page | 42
Mobile Business Intelligence Adoption Through 2017
In this section (figs. 32, 33, 34, 35) we look at current and planned adoption and
penetration of the user base for mobile BI.
In 2014, penetration of mobile business intelligence remains fairly modest: 20 percent
report no mobile capabilities whatsoever and more than 60 percent of organizations
report 10 percent or fewer users with mobile access (fig. 32). Looking forward,
deployment expectations are ambitious by comparison. Bullish plans are not unusual
and we consider 12-month plans most reliable based on allotted budgets; but future
expectations for mobile BI deployments are undeniably high.
Figure 32 - Mobile BI deployment plans through 2017
0%
10%
20%
30%
40%
50%
60%
70%
80%
90%
100%
Today In 12 months In 24 months In 36 months
Mobile BI Deployment Plans Through 2017
None 1% -10% 11 - 20% 21 - 40% 41 - 60% 61 - 80% 81% or more

DAS Mobile Computing / Mobile Business Intelligence Market Study 2014
COPYRIGHT 2014 DRESNER ADVISORY SERVICES, LLC Page | 43
Geographical deployment plans generally follow other geographical findings: Latin
America and Asia Pacific are more ambitious in current deployments and future plans
than North America and EMEA (fig. 33). That said, organizations in every region plan
significant increases in mobile BI deployments in the next 12 months.
Figure 33 - Mobile BI deployment plans through 2017 by geography
0%
10%
20%
30%
40%
50%
60%
70%
80%
90%
100%
Tod
ay
In 1
2 m
on
ths
In 2
4 m
on
ths
In 3
6 m
on
ths
Tod
ay
In 1
2 m
on
ths
In 2
4 m
on
ths
In 3
6 m
on
ths
Tod
ay
In 1
2 m
on
ths
In 2
4 m
on
ths
In 3
6 m
on
ths
Tod
ay
In 1
2 m
on
ths
In 2
4 m
on
ths
In 3
6 m
on
ths
Europe, Middle Eastand Africa
North America Asia/Pacific Latin America
Mobile BI Deployment Plans Through 2017 by Geography
81% or more
61 - 80%
41 - 60%
21 - 40%
11 - 20%
1% -10%
None

DAS Mobile Computing / Mobile Business Intelligence Market Study 2014
COPYRIGHT 2014 DRESNER ADVISORY SERVICES, LLC Page | 44
When we look at the upper two sections (light blue and orange bands) reflecting the
highest levels of penetration, it becomes plain that small organizations are the most
ambitious in their current mobile BI deployments and future plans (fig. 34). Fewer than
half of organizations with 1-100 employees report 10 percent or lower levels of
deployment today (compared to more than 70-75 percent of larger counterparts).
Figure 34 - Mobile BI deployment plans through 2017 by organization size
0%
10%
20%
30%
40%
50%
60%
70%
80%
90%
100%
Tod
ay
In 1
2 m
on
ths
In 2
4 m
on
ths
In 3
6 m
on
ths
Tod
ay
In 1
2 m
on
ths
In 2
4 m
on
ths
In 3
6 m
on
ths
Tod
ay
In 1
2 m
on
ths
In 2
4 m
on
ths
In 3
6 m
on
ths
Tod
ay
In 1
2 m
on
ths
In 2
4 m
on
ths
In 3
6 m
on
ths
1-100 101 - 1000 1001 - 5000 More than 5000
Mobile BI Deployment Plans Through 2017 by Organization Size
81% or more
61 - 80%
41 - 60%
21 - 40%
11 - 20%
1% -10%
None

DAS Mobile Computing / Mobile Business Intelligence Market Study 2014
COPYRIGHT 2014 DRESNER ADVISORY SERVICES, LLC Page | 45
All business functions sampled expect significant mobile BI deployment growth over the
next three years (fig. 35). Executive management, followed by sales and marketing are
the largest existing and planned audiences for mobile business intelligence. By contrast,
finance is the most underserved and conservative of the three groups, with limited plans
going forward. The IT function is only slightly more ambitious than finance.
Figure 35 - Mobile BI deployment plans through 2017 by function
0%
10%
20%
30%
40%
50%
60%
70%
80%
90%
100%
Tod
ay
In 1
2 m
on
ths
In 2
4 m
on
ths
In 3
6 m
on
ths
Tod
ay
In 1
2 m
on
ths
In 2
4 m
on
ths
In 3
6 m
on
ths
Tod
ay
In 1
2 m
on
ths
In 2
4 m
on
ths
In 3
6 m
on
ths
Tod
ay
In 1
2 m
on
ths
In 2
4 m
on
ths
In 3
6 m
on
ths
ExecutiveManagement
Sales and Marketing InformationTechnology (IT)
Finance
Mobile BI Deployment Plans Through 2017 by Function
81% or more
61 - 80%
41 - 60%
21 - 40%
11 - 20%
1% -10%
None

DAS Mobile Computing / Mobile Business Intelligence Market Study 2014
COPYRIGHT 2014 DRESNER ADVISORY SERVICES, LLC Page | 46
Exclusive Use of Business Intelligence on Mobile Devices
We asked respondents how many users will access BI exclusively through mobile
devices in the next 24 months. For about 65 percent of respondents, the answer is 20
percent or fewer (fig. 36). From another perspective, close to 20 percent of respondents
say 41 percent or more of their business intelligence users will be “mobile only” by
2016.
Figure 36 - Expected exclusive mobile BI usage by 2016
0%
5%
10%
15%
20%
25%
30%
35%
40%
Under 10% 11 - 20% 21 - 40% 41 - 60% 61 - 80% 81% or more
Expected Exclusive Mobile BI Usage by 2016

DAS Mobile Computing / Mobile Business Intelligence Market Study 2014
COPYRIGHT 2014 DRESNER ADVISORY SERVICES, LLC Page | 47
Expected exclusive mobile use of business intelligence has changed only slightly over
time and actually declined somewhat since 2013. We believe respondents are taking a
more balanced approach to BI usage habits (fig. 37). While some percentage of BI
users will surely become mobile-only consumers, this is not a one-way trend. Over time,
we would compare this pattern to consumer preferences for PCs, tablets, and phones.
Figure 37 – Expected exclusive mobile use of business intelligence 2011 - 2014
35%
31%
31%
37%
25%
29%
27%
26%
22%
21%
23%
18%
10%
8%
8%
10%
5%
6%
6%
5%
3%
6%
6%
4%
0% 10% 20% 30% 40% 50% 60% 70% 80% 90% 100%
2011
2012
2013
2014
Expected Exclusive Mobile Use of Business Intelligence 2011 - 2014
Under 10% 11 - 20% 21 - 40% 41 - 60% 61 - 80% 81% or more

DAS Mobile Computing / Mobile Business Intelligence Market Study 2014
COPYRIGHT 2014 DRESNER ADVISORY SERVICES, LLC Page | 48
As noted elsewhere, infrastructure investments as well as BI maturity/penetration in
different geographic regions influence exclusive mobile BI use. Current data tell us Latin
America and Asia Pacific users are much more likely to exclusively access business
intelligence applications and content via a mobile device by 2016 (fig. 38).
Figure 38 - Expected exclusive mobile use of business intelligence by 2016 by geography
0%
10%
20%
30%
40%
50%
60%
70%
80%
90%
100%
Latin America Asia/Pacific North America Europe, Middle Eastand Africa
Expected Exclusive Mobile Use of BI by 2016 by Geography
81% or more
61 - 80%
41 - 60%
21 - 40%
11 - 20%
Under 10%

DAS Mobile Computing / Mobile Business Intelligence Market Study 2014
COPYRIGHT 2014 DRESNER ADVISORY SERVICES, LLC Page | 49
Executive management and sales & marketing are the most likely functional candidates
for mobile-only use of business intelligence (fig. 39). This corresponds to other findings
about nomadic users and organizations with a strong external focus. Along with more
high-level penetration, executive and sales & marketing audiences have significantly
higher expectations of > 20 percent penetration than other roles. That said, all functional
audiences expect at least some mobile-only BI users by 2016.
Figure 39 – Expected exclusive mobile BI use of BI by 2016 by function
0%
10%
20%
30%
40%
50%
60%
70%
80%
90%
100%
Expected Exclusive Mobile Use of BI by 2016 by Function
81% or more
61 - 80%
41 - 60%
21 - 40%
11 - 20%
Under 10%

DAS Mobile Computing / Mobile Business Intelligence Market Study 2014
COPYRIGHT 2014 DRESNER ADVISORY SERVICES, LLC Page | 50
Small and mid-sized organizations appear to have the most optimistic plans for
exclusive mobile use of business intelligence, followed by the largest of organizations
(fig. 40). As with mobile business intelligence generally, the smallest organizations are
most likely to support mobile-only use.
Figure 40 - Expected exclusive mobile use of BI by 2016 by organization size
0%
10%
20%
30%
40%
50%
60%
70%
80%
90%
100%
1-100 101 - 1000 1001 - 5000 More than 5000
Expected Exclusive Mobile Use of BI by 2016 by Organization Size
81% or more
61 - 80%
41 - 60%
21 - 40%
11 - 20%
Under 10%

DAS Mobile Computing / Mobile Business Intelligence Market Study 2014
COPYRIGHT 2014 DRESNER ADVISORY SERVICES, LLC Page | 51
Mobile Business Intelligence Features
In 2014, the most prioritized features for BI include the most traditional: capabilities for
viewing charts and reports, selecting data, drilling down, and monitoring KPIs and alerts
are all top user priorities (fig. 41). Mean interest is somewhat lower but still important for
features including data refresh, component dashboards, guided analysis, drag and drop
and offline access. Social media analysis is currently a relatively unimportant feature for
mobile BI users.
Figure 41 - Mobile BI feature priorities
0
0.5
1
1.5
2
2.5
3
3.5
4
0%
10%
20%
30%
40%
50%
60%
70%
80%
90%
100%
Mobile BI Feature Priorities
Critical
Very important
Somewhat important
Not important
Mean

DAS Mobile Computing / Mobile Business Intelligence Market Study 2014
COPYRIGHT 2014 DRESNER ADVISORY SERVICES, LLC Page | 52
A trend among requirements for mobile business intelligence features has been toward
better interaction (and fewer static presentations). While viewing charts is paramount,
the ability to select and drill data has gathered importance (fig. 42). Demand for real-
time data refresh and data/dashboard assembly has also increased. We do not expect
average users to code on mobile devices anytime soon; but as requirements migrate
toward dynamic capabilities, we will see more traditional BI upgrades recast for mobile
devices.
Figure 42 - Mobile BI feature priorities 2010 - 2014
0.00
0.50
1.00
1.50
2.00
2.50
3.00
3.50
4.00
Mobile BI Feature Priorities 2010 - 2014
2010
2011
2012
2013
2014
Mean

DAS Mobile Computing / Mobile Business Intelligence Market Study 2014
COPYRIGHT 2014 DRESNER ADVISORY SERVICES, LLC Page | 53
Priorities for mobile business intelligence features are largely consistent across roles,
though specific BI apps can be tied to function. All audiences prioritize chart/report
viewing and the ability to select and filter data above all else (fig. 43). Manufacturing is
more interested in KPIs and refresh than drill-down navigation; sales & marketing has
outsized interest in offline access, transactional integration, and social media analysis.
Figure 43 - Mobile BI features by function
0
0.5
1
1.5
2
2.5
3
3.5
4
Mobile BI Features by Function
Executive Management Finance
Information Technology (IT) Manufacturing
Research and Development (R&D) Sales and Marketing
Mean
DAS Mobile Computing / Mobile Business Intelligence Market Study 2014
COPYRIGHT 2014 DRESNER ADVISORY SERVICES, LLC Page | 54
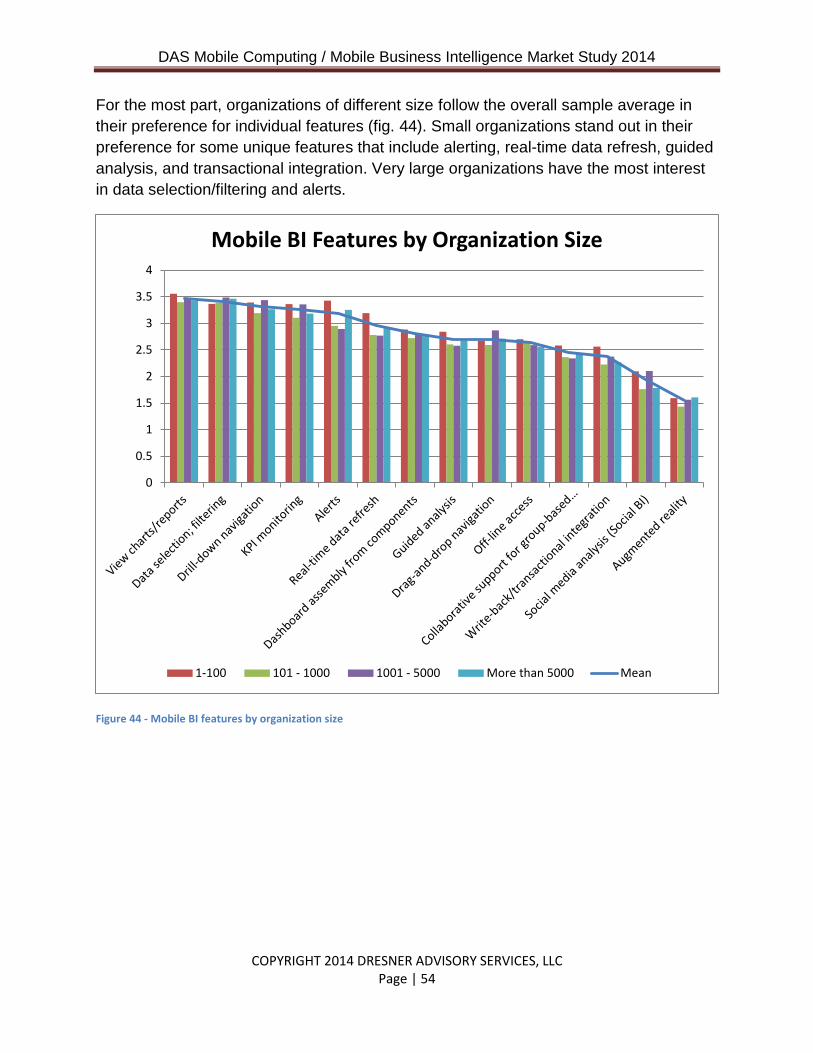
For the most part, organizations of different size follow the overall sample average in
their preference for individual features (fig. 44). Small organizations stand out in their
preference for some unique features that include alerting, real-time data refresh, guided
analysis, and transactional integration. Very large organizations have the most interest
in data selection/filtering and alerts.
Figure 44 - Mobile BI features by organization size
0
0.5
1
1.5
2
2.5
3
3.5
4
Mobile BI Features by Organization Size
1-100 101 - 1000 1001 - 5000 More than 5000 Mean

DAS Mobile Computing / Mobile Business Intelligence Market Study 2014
COPYRIGHT 2014 DRESNER ADVISORY SERVICES, LLC Page | 55
Mobile versus Server Resident Business Intelligence Apps and Data
We asked respondents where (device and/or server) they believe mobile applications
and data ought to reside. In a clear trend, the preference for storing apps and data in
servers only (and not locally on devices) has increased in every year of our study (fig.
45). Where some organizations resist the downloading of apps and data due to security
policies or concerns, others prefer central management/provisioning/access benefits,
while still others are restricted by regulatory requirements (as in banking and
healthcare). Regulated or not, there is an increasing tendency towards server-only
storage for mobile apps and data.
Figure 45 - Mobile versus server resident BI apps and data: 2011 - 2014
60%
50% 50%
40%
50% 51%
0%
10%
20%
30%
40%
50%
60%
70%
80%
90%
100%
2011 2012 2013
Mobile versus Server Resident BI Apps and Data: 2011 - 2014
Server only
Mobile device and server

DAS Mobile Computing / Mobile Business Intelligence Market Study 2014
COPYRIGHT 2014 DRESNER ADVISORY SERVICES, LLC Page | 56
North American respondents are most strongly in favor of server-only mobile BI data
environments (fig. 46). Half or more of respondents in EMEA and Latin America also
prefer mobile BI data server storage. Asia Pacific is the only region that supports a
mixed device and server environment for mobile BI data.
Figure 46 - Mobile versus server resident BI apps and data by geography
0%
10%
20%
30%
40%
50%
60%
70%
80%
90%
100%
North America Latin America Europe, MiddleEast and Africa
Asia Pacific
Mobile versus Server Resident BI Apps and Data by Geography
Server only
Mobile device and server

DAS Mobile Computing / Mobile Business Intelligence Market Study 2014
COPYRIGHT 2014 DRESNER ADVISORY SERVICES, LLC Page | 57
The requirement for app and data residency varies significantly by vertical industry—
and most certainly answers in part to regulation (fig. 47). As expected, healthcare—with
tight reins on sensitive personal data—is completely unlikely to allow device storage of
data, followed to a lesser extent by government. Other industries sampled are willing to
support a more balanced mix of device and server environments.
Figure 47 - Mobile versus server resident BI apps and data by vertical industry
0%
10%
20%
30%
40%
50%
60%
70%
80%
90%
100%
Mobile versus Server Resident BI Apps and Data by Vertical Industry
Mobile device and server Server only

DAS Mobile Computing / Mobile Business Intelligence Market Study 2014
COPYRIGHT 2014 DRESNER ADVISORY SERVICES, LLC Page | 58
Benefits and Limitations of Mobile Business Intelligence
Each year we ask respondents to describe the benefits and limitations of mobile
Business Intelligence. This year as last we organized these comments in two “word
clouds.”
The top perceived benefits associated with mobile BI include anywhere-access to data,
information, and business intelligence (fig. 48). Benefits have an affinity to the terms
critical, business, and decisions; and they cite KPIs, sales, and other users.
Figure 48 – Word cloud - benefits associated with mobile business intelligence

DAS Mobile Computing / Mobile Business Intelligence Market Study 2014
COPYRIGHT 2014 DRESNER ADVISORY SERVICES, LLC Page | 59
The top cited limitations associated with mobile BI include security and other risk
concerns, limited data volumes, technical limitations of mobile devices, and their ability
to perform analysis (fig. 49).
Figure 49 – Word cloud - limitations associated with mobile business intelligence

DAS Mobile Computing / Mobile Business Intelligence Market Study 2014
COPYRIGHT 2014 DRESNER ADVISORY SERVICES, LLC Page | 60
Business Intelligence Industry Mobile Capabilities and Plans By collecting data from 35 business intelligence vendors, we understand the current
state of the market and also have a view into future industry capabilities and therefore
can help user organizations plan for mobile BI with greater precision.
When we first conducted this research (2010), the majority of business intelligence
vendor organizations had not yet fully comprehended the shift towards mobile BI (fig.
50). Since that time, mobile BI has become a mainstay for the industry. That said, as
mobile BI features have become the norm, this requirement has lessened since 2012.
Figure 50 - Industry Importance of mobile BI: 2010 - 2014
0%
10%
20%
30%
40%
50%
60%
70%
80%
90%
100%
2010 2011 2012 2013 2014
Industry Importance of Mobile BI: 2010 - 2014
Critically important
Very important
Somewhat important

DAS Mobile Computing / Mobile Business Intelligence Market Study 2014
COPYRIGHT 2014 DRESNER ADVISORY SERVICES, LLC Page | 61
At this point, one can be fairly comfortable that almost all business intelligence vendors
offer support for Apple’s iPad tablet device, as this is the single most popular platform
for mobile BI today. Very good support can also be found for Apple’s iPhone and for
Google Android tablets and smartphones (fig. 54). Microsoft’s Windows 8 phone and
Surface tablet are seeing improved industry support and significant plans through 2016.
All other platforms, i.e., Amazon, Firefox, RIM/BlackBerry, enjoy less support.
Figure 51 - BI industry support for mobile platforms
0%
10%
20%
30%
40%
50%
60%
70%
80%
90%
100%
BI Industry Support for Mobile Platforms
No plans
Planned - 24 months
Planned - 12 months
Supported today

DAS Mobile Computing / Mobile Business Intelligence Market Study 2014
COPYRIGHT 2014 DRESNER ADVISORY SERVICES, LLC Page | 62
The development and support of native applications is a complex and costly process for
vendors. As such, most would prefer to use HTML5, which enjoys support across
mobile platforms. However, users continue to demand a native app experience—most
notably on the Apple iOS and Google Android platforms. Accordingly, industry support
for native apps remains strong on these mobile devices (fig. 55). Moving forward we
expect to see more apps using a hybrid approach with a native code wrapper around
standard HTML5.
Figure 52 - Industry support: Native versus Web applications
0.00%
10.00%
20.00%
30.00%
40.00%
50.00%
60.00%
70.00%
80.00%
90.00%
100.00%
Industry Support: Native versus Web Applications
Native, down-loadable apps - today HTML5/CSS3 - today Blended/hybrid - today

DAS Mobile Computing / Mobile Business Intelligence Market Study 2014
COPYRIGHT 2014 DRESNER ADVISORY SERVICES, LLC Page | 63
Industry support for mobile device integration, maps well to user requirements with both
ranking multi-touch as the first priority and location awareness as the second priority
(fig. 56). However, the industry has placed a greater emphasis upon camera integration
(#4 user feature) and Accelerometer integration (#7 user feature).
Figure 53 - Industry support for mobile device integration
0%
10%
20%
30%
40%
50%
60%
70%
80%
90%
100%
Industry Support for Mobile Device Integration
No plans
Planned - 24 months
Planned - 12 months
Supported today

DAS Mobile Computing / Mobile Business Intelligence Market Study 2014
COPYRIGHT 2014 DRESNER ADVISORY SERVICES, LLC Page | 64
We continue to see consistent year-over-year improvements in mobile BI feature
support, with availability for most features improving versus 2013 (Figure 57). While the
top six industry-supported mobile business intelligence features correspond to user
requirements, there are some areas of demand-side and supply-side mismatch. For
example, users place a higher priority upon alerting and dashboard assembly from
components and a lower priority upon social media analysis and guided analysis.
Figure 54 - Industry support for BI features
0%
10%
20%
30%
40%
50%
60%
70%
80%
90%
100%
Industry Support for BI Features
No plans
24 months
18 months
12 months
6 months
Today

DAS Mobile Computing / Mobile Business Intelligence Market Study 2014
COPYRIGHT 2014 DRESNER ADVISORY SERVICES, LLC Page | 65
Mobile Business Intelligence Vendor Scores and Rankings
This year we include 25 Business intelligence vendors in our mobile ratings (fig. 58). For
each vendor we considered mobile platform support and integration, business
intelligence features, and customer ratings. We weighted platform and feature scores
using user prioritizations, with a maximum possible score of 32.5 points.
Figure 55 – 2013 mobile BI vendor / product rankings
This model reflects only three dimensions of a BI vendor’s product capability and is only
intended to indicate a convergence of capabilities for mobile BI. Readers are
encouraged to use other tools to understand other dimensions of vendor capability,
such as our Wisdom of Crowds® Business Intelligence Market Study.
1
2
4
8
16
32MicroStrategy
SAPJedox
Qlik
Information Builders
Actuate
TIBCO
Oracle
GoodData
Dell
Pyramid Analytics
DundasDimensional InsightLogi Analytics
Tableau
Roambi
Phocas
BIME
Birst
InetSoft
SAS
BOARD
IBM
TARGITMicrosoft
2014 Mobile Business Intelligence Vendor Ratings
Platform Features Customer Total Score

DAS Mobile Computing / Mobile Business Intelligence Market Study 2014
COPYRIGHT 2014 DRESNER ADVISORY SERVICES, LLC Page | 66
Appendix: Mobile BI Survey Instrument

DAS Mobile Computing / Mobile Business Intelligence Market Study 2014
COPYRIGHT 2014 DRESNER ADVISORY SERVICES, LLC Page | 67

DAS Mobile Computing / Mobile Business Intelligence Market Study 2014
COPYRIGHT 2014 DRESNER ADVISORY SERVICES, LLC Page | 68

DAS Mobile Computing / Mobile Business Intelligence Market Study 2014
COPYRIGHT 2014 DRESNER ADVISORY SERVICES, LLC Page | 69

DAS Mobile Computing / Mobile Business Intelligence Market Study 2014
COPYRIGHT 2014 DRESNER ADVISORY SERVICES, LLC Page | 70

DAS Mobile Computing / Mobile Business Intelligence Market Study 2014
COPYRIGHT 2014 DRESNER ADVISORY SERVICES, LLC Page | 71