Mobile App Trends 2021: A focus on APAC
30
Mobile App Trends 2021: A focus on APAC
Transcript of Mobile App Trends 2021: A focus on APAC
Mobile App Trends 2021:
A focus on APAC
2Mobile App Trends 2021: A focus on APAC
Contents
Introduction ..................................................................................................................................................3
The verticals....................................................................................................................................................3
Industry trends and predictions .............................................................................................................4
Top 3 takeaways .......................................................................................................................................5
Methodology ...............................................................................................................................................6
Installs .................................................................................................................................................................7
Installs APAC Overall ..................................................................................................................................7
Install growth by vertical and country .................................................................................................8
Installs country vs. vertical .................................................................................................................... 10
Effective cost per install (eCPI) ............................................................................................................ 14
Paid vs. organic ............................................................................................................................................15
Reattributions share .................................................................................................................................. 16
Sessions and in-app patterns ...................................................................................................18
Sessions APAC Overall .............................................................................................................................18
Sessions country vs. vertical .................................................................................................................. 19
Average session length ........................................................................................................................... 24
Sessions per user per day .......................................................................................................................25
Time spent in-app ..................................................................................................................................... 26
Retention rates ....................................................................................................................................... 27
Partners per app ................................................................................................................................... 28
Conclusion .................................................................................................................................................. 29
3Mobile App Trends 2021: A focus on APAC
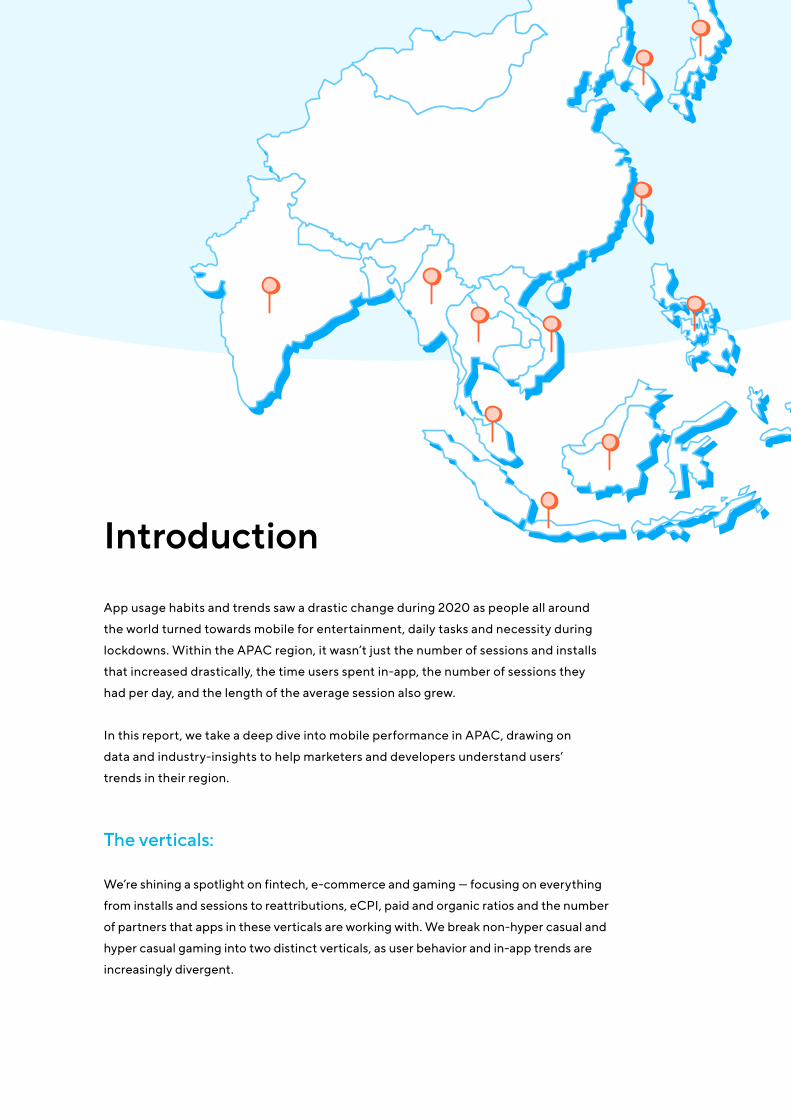
App usage habits and trends saw a drastic change during 2020 as people all around
the world turned towards mobile for entertainment, daily tasks and necessity during
lockdowns. Within the APAC region, it wasn’t just the number of sessions and installs
that increased drastically, the time users spent in-app, the number of sessions they
had per day, and the length of the average session also grew.
In this report, we take a deep dive into mobile performance in APAC, drawing on
data and industry-insights to help marketers and developers understand users’
trends in their region.
The verticals:
We’re shining a spotlight on fintech, e-commerce and gaming — focusing on everything
from installs and sessions to reattributions, eCPI, paid and organic ratios and the number
of partners that apps in these verticals are working with. We break non-hyper casual and
hyper casual gaming into two distinct verticals, as user behavior and in-app trends are
increasingly divergent.
Introduction
4Mobile App Trends 2021: A focus on APAC
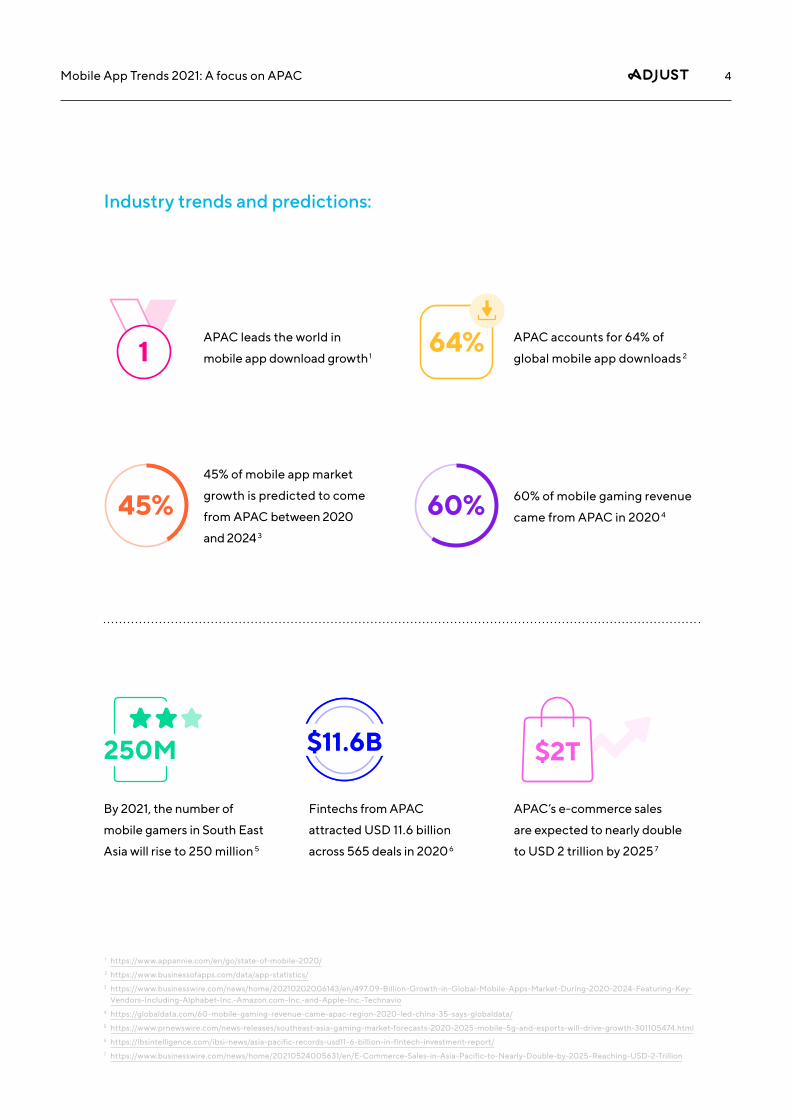
Industry trends and predictions:
1 https://www.appannie.com/en/go/state-of-mobile-2020/ 2 https://www.businessofapps.com/data/app-statistics/3 https://www.businesswire.com/news/home/20210202006143/en/497.09-Billion-Growth-in-Global-Mobile-Apps-Market-During-2020-2024-Featuring-Key- Vendors-Including-Alphabet-Inc.-Amazon.com-Inc.-and-Apple-Inc.-Technavio4 https://globaldata.com/60-mobile-gaming-revenue-came-apac-region-2020-led-china-35-says-globaldata/5 https://www.prnewswire.com/news-releases/southeast-asia-gaming-market-forecasts-2020-2025-mobile-5g-and-esports-will-drive-growth-301105474.html6 https://ibsintelligence.com/ibsi-news/asia-pacific-records-usd11-6-billion-in-fintech-investment-report/7 https://www.businesswire.com/news/home/20210524005631/en/E-Commerce-Sales-in-Asia-Pacific-to-Nearly-Double-by-2025-Reaching-USD-2-Trillion
APAC leads the world in
mobile app download growth1
45% of mobile app market
growth is predicted to come
from APAC between 2020
and 2024 3
60% of mobile gaming revenue
came from APAC in 2020 460% 45%
APAC accounts for 64% of
global mobile app downloads 2
By 2021, the number of
mobile gamers in South East
Asia will rise to 250 million 5
Fintechs from APAC
attracted USD 11.6 billion
across 565 deals in 2020 6
APAC’s e-commerce sales
are expected to nearly double
to USD 2 trillion by 2025 7
$11.6B250M $2T
1 64%
5Mobile App Trends 2021: A focus on APAC
Installs and sessions in APAC grew by 31% and 54% respectively from 2019 to 2020, and are continuing to grow in 2021, demonstrating that the industry is hanging onto users acquired during lockdown and continuing to bring new users in.
Almost all verticals grew in the countries analyzed — with fintech and hyper casual gaming backing up their impressive lockdown spikes with sustained growth in 2021.
Retention rates were very consistent throughout 2020 despite the impacts of the pandemic — in Q4, the day 30 average was 5.68%
1
2
3
Top 3 takeaways
6Mobile App Trends 2021: A focus on APAC
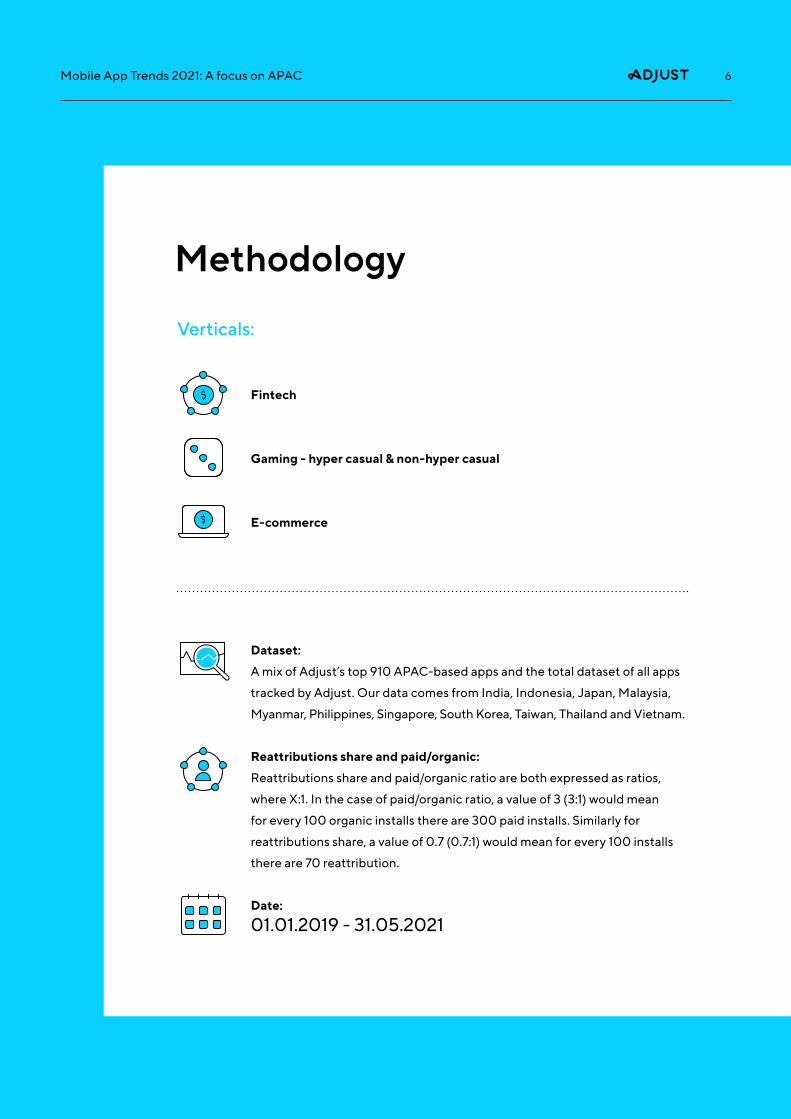
Methodology
Fintech
Gaming - hyper casual & non-hyper casual
E-commerce
Dataset:
A mix of Adjust’s top 910 APAC-based apps and the total dataset of all apps
tracked by Adjust. Our data comes from India, Indonesia, Japan, Malaysia,
Myanmar, Philippines, Singapore, South Korea, Taiwan, Thailand and Vietnam.
Reattributions share and paid/organic:
Reattributions share and paid/organic ratio are both expressed as ratios,
where X:1. In the case of paid/organic ratio, a value of 3 (3:1) would mean
for every 100 organic installs there are 300 paid installs. Similarly for
reattributions share, a value of 0.7 (0.7:1) would mean for every 100 installs
there are 70 reattribution.
Date:
01.01.2019 - 31.05.2021
Verticals:
7Mobile App Trends 2021: A focus on APAC
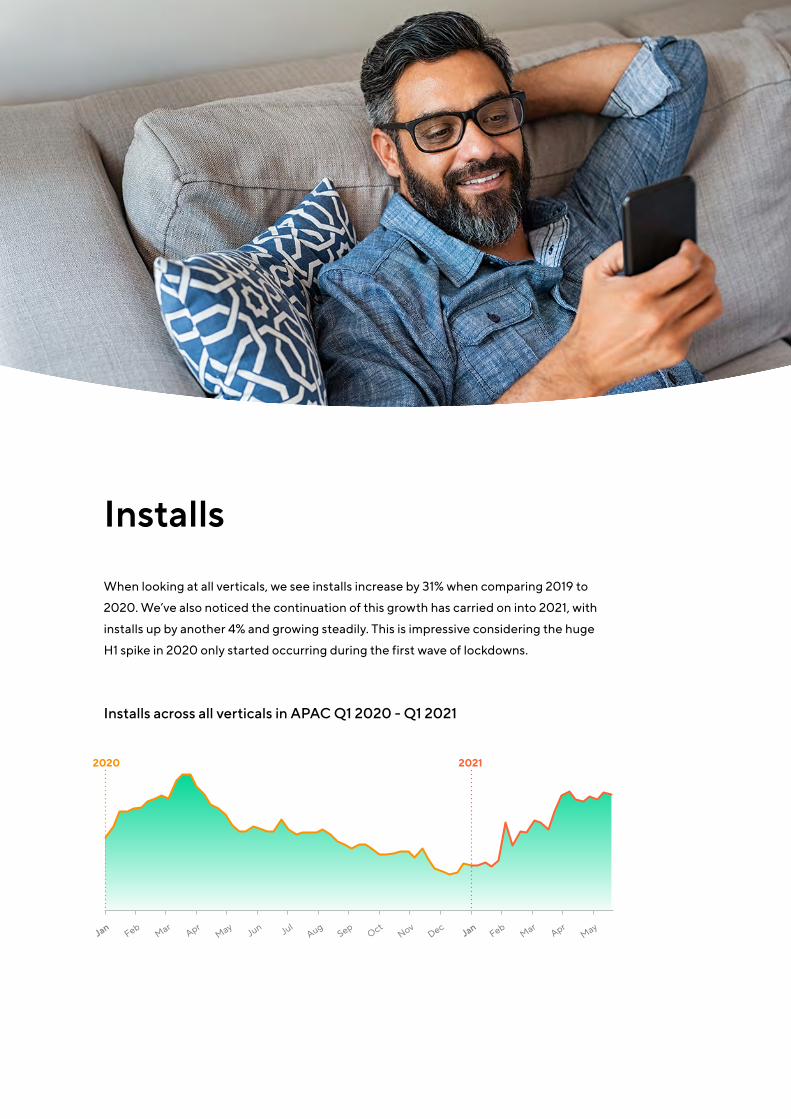
Installs
When looking at all verticals, we see installs increase by 31% when comparing 2019 to
2020. We’ve also noticed the continuation of this growth has carried on into 2021, with
installs up by another 4% and growing steadily. This is impressive considering the huge
H1 spike in 2020 only started occurring during the first wave of lockdowns.
Installs across all verticals in APAC Q1 2020 - Q1 2021
Jan JanFeb
FebMar
MarApr
AprMay
MayJun Jul
AugSep
OctNov
Dec
20212020
8Mobile App Trends 2021: A focus on APAC
27
2
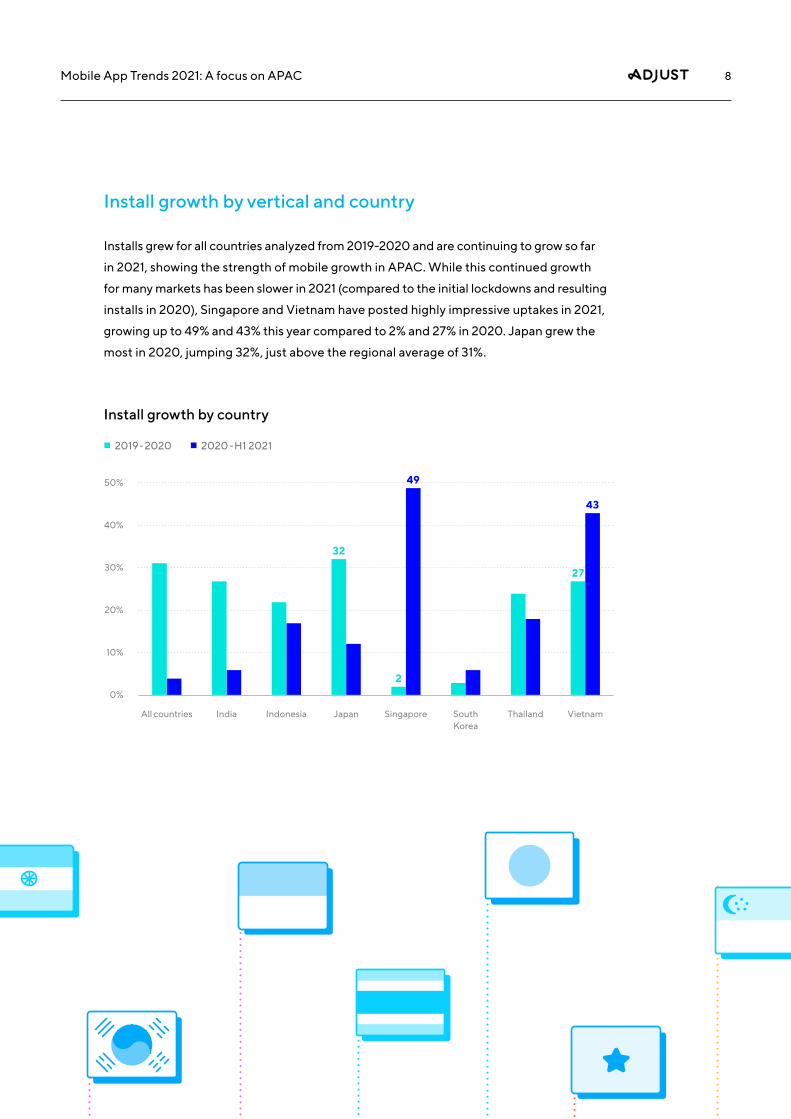
Install growth by vertical and country
Installs grew for all countries analyzed from 2019-2020 and are continuing to grow so far
in 2021, showing the strength of mobile growth in APAC. While this continued growth
for many markets has been slower in 2021 (compared to the initial lockdowns and resulting
installs in 2020), Singapore and Vietnam have posted highly impressive uptakes in 2021,
growing up to 49% and 43% this year compared to 2% and 27% in 2020. Japan grew the
most in 2020, jumping 32%, just above the regional average of 31%.
Install growth by country
2019-2020 2020-H1 2021
50%
40%
30%
20%
10%
0%
All countries India Indonesia Japan Singapore South Korea
Thailand Vietnam
32
49
43
9Mobile App Trends 2021: A focus on APAC
66
36
49
18
84
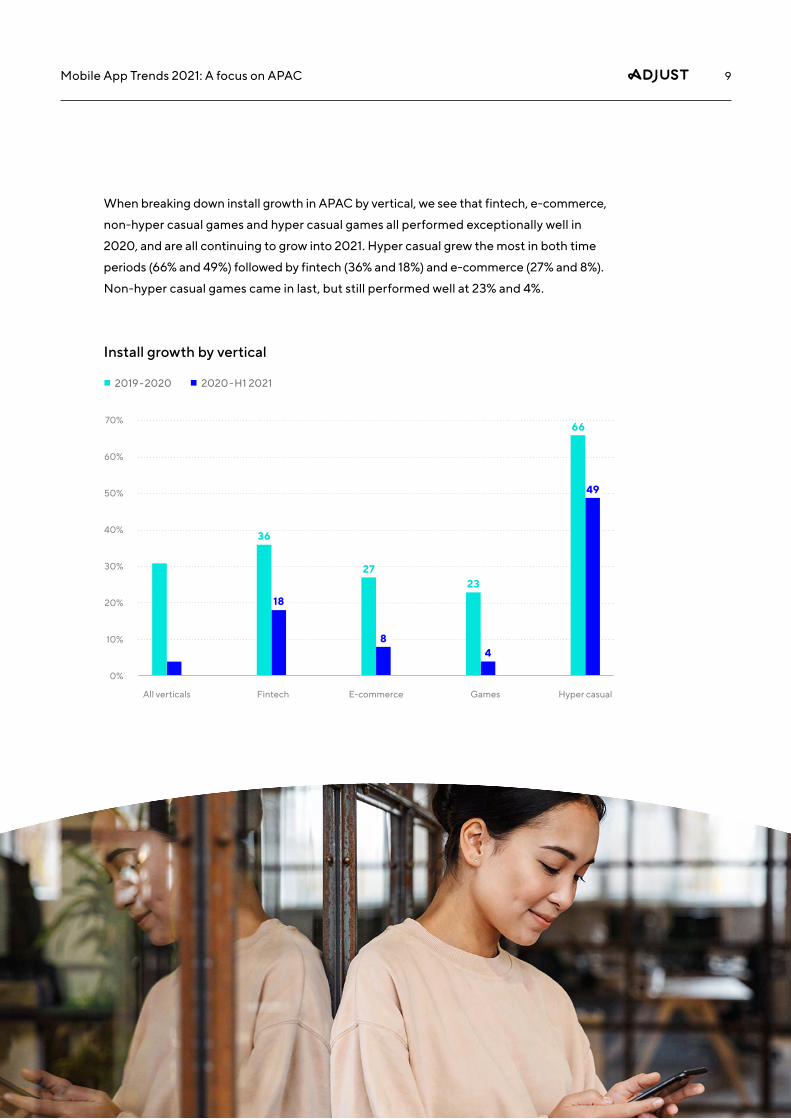
When breaking down install growth in APAC by vertical, we see that fintech, e-commerce,
non-hyper casual games and hyper casual games all performed exceptionally well in
2020, and are all continuing to grow into 2021. Hyper casual grew the most in both time
periods (66% and 49%) followed by fintech (36% and 18%) and e-commerce (27% and 8%).
Non-hyper casual games came in last, but still performed well at 23% and 4%.
Install growth by vertical
2019-2020 2020-H1 2021
70%
60%
50%
40%
30%
20%
10%
0%
All verticals Fintech E-commerce Games Hyper casual
2723
10Mobile App Trends 2021: A focus on APAC
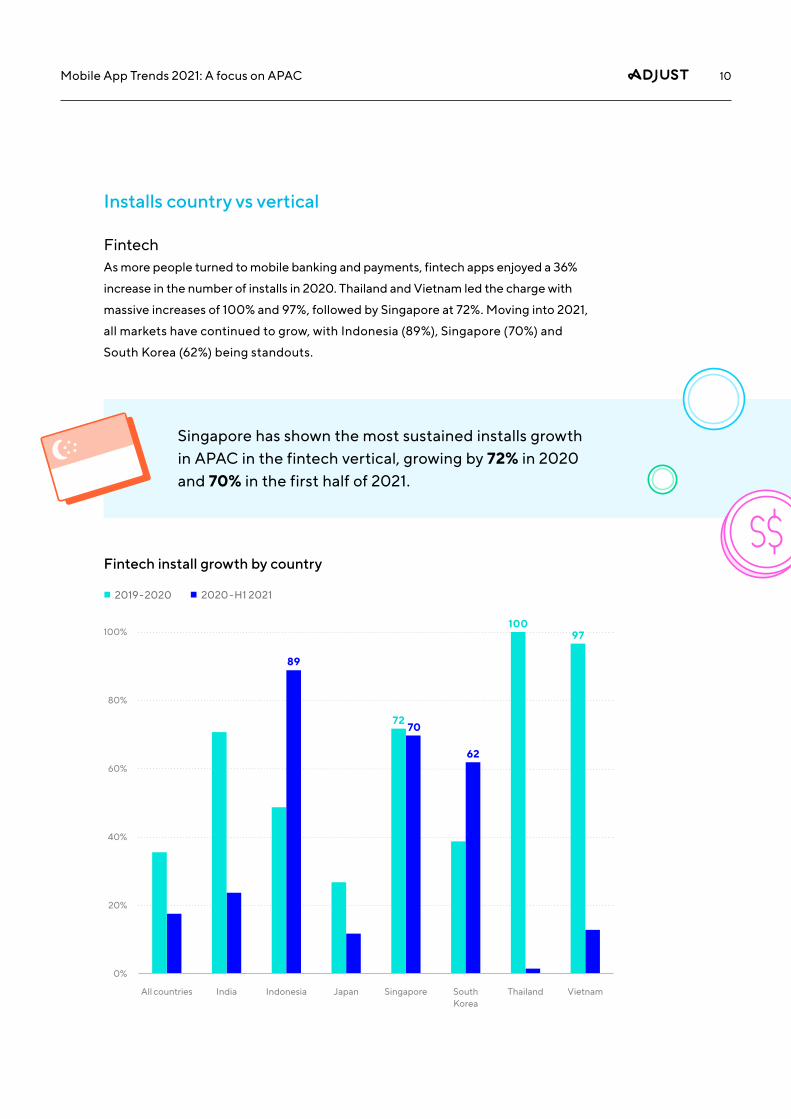
Installs country vs vertical
Fintech As more people turned to mobile banking and payments, fintech apps enjoyed a 36%
increase in the number of installs in 2020. Thailand and Vietnam led the charge with
massive increases of 100% and 97%, followed by Singapore at 72%. Moving into 2021,
all markets have continued to grow, with Indonesia (89%), Singapore (70%) and
South Korea (62%) being standouts.
Singapore has shown the most sustained installs growth in APAC in the fintech vertical, growing by 72% in 2020 and 70% in the first half of 2021.
Fintech install growth by country
2019-2020 2020-H1 2021
100%
80%
60%
40%
20%
0%
All countries India Indonesia Japan Singapore South Korea
Thailand Vietnam
97
72 70
62
89
100
11Mobile App Trends 2021: A focus on APAC
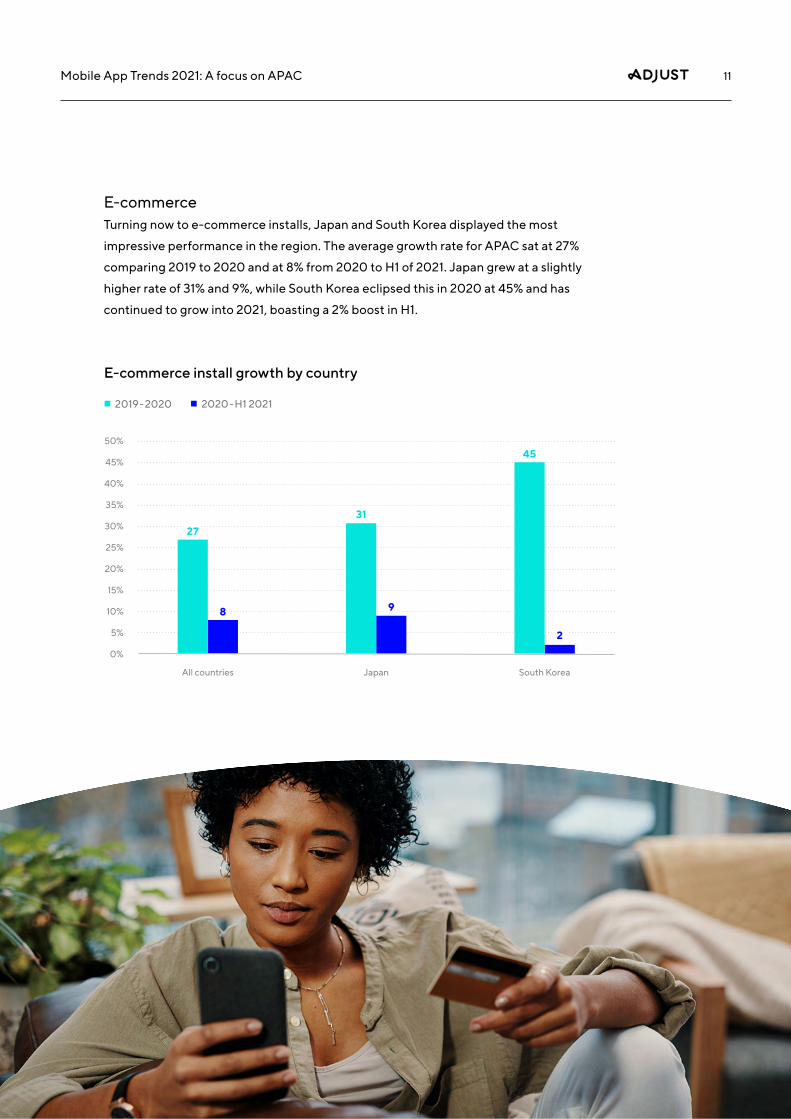
E-commerce Turning now to e-commerce installs, Japan and South Korea displayed the most
impressive performance in the region. The average growth rate for APAC sat at 27%
comparing 2019 to 2020 and at 8% from 2020 to H1 of 2021. Japan grew at a slightly
higher rate of 31% and 9%, while South Korea eclipsed this in 2020 at 45% and has
continued to grow into 2021, boasting a 2% boost in H1.
E-commerce install growth by country
2019-2020 2020-H1 2021
50%
45%
40%
30%
20%
25%
35%
10%
15%
5%
0%
All countries Japan South Korea
2731
45
8 9
2
12Mobile App Trends 2021: A focus on APAC
37
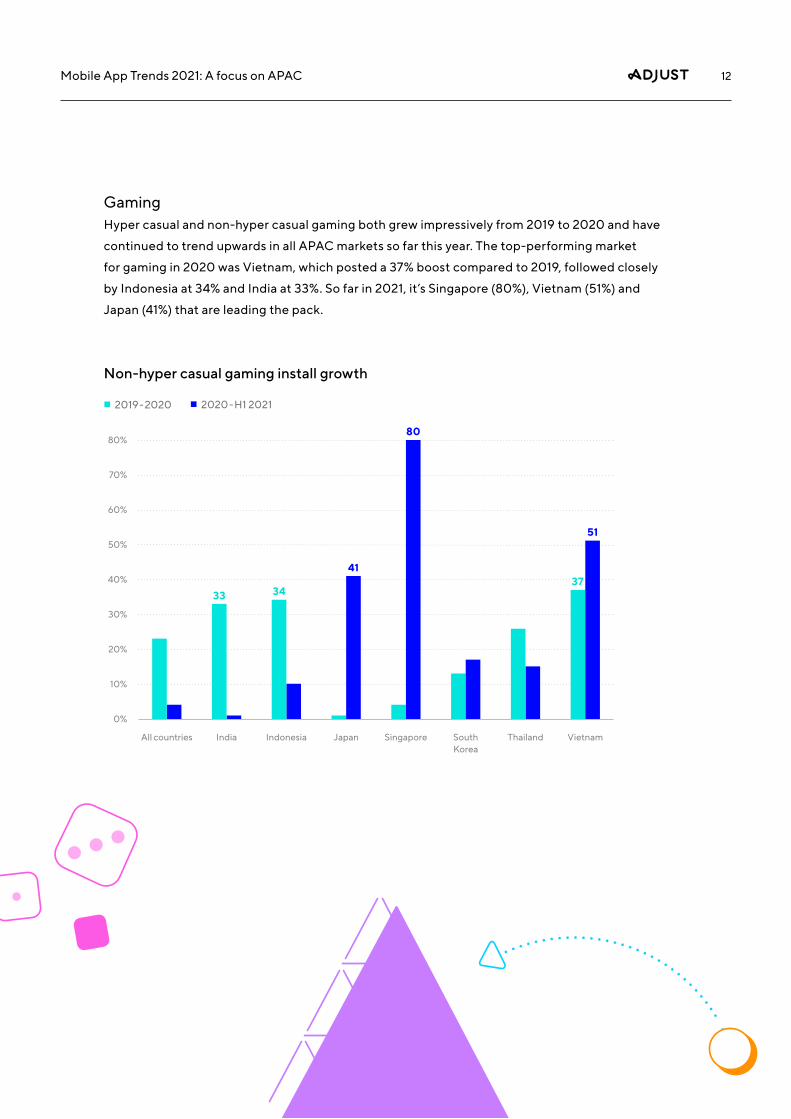
GamingHyper casual and non-hyper casual gaming both grew impressively from 2019 to 2020 and have
continued to trend upwards in all APAC markets so far this year. The top-performing market
for gaming in 2020 was Vietnam, which posted a 37% boost compared to 2019, followed closely
by Indonesia at 34% and India at 33%. So far in 2021, it’s Singapore (80%), Vietnam (51%) and
Japan (41%) that are leading the pack.
Non-hyper casual gaming install growth
2020-H1 20212019-2020
33 34
All countries India Indonesia Japan Singapore South Korea
Thailand Vietnam
51
41
8080%
70%
50%
30%
10%
60%
40%
20%
0%
13Mobile App Trends 2021: A focus on APAC
6164
56
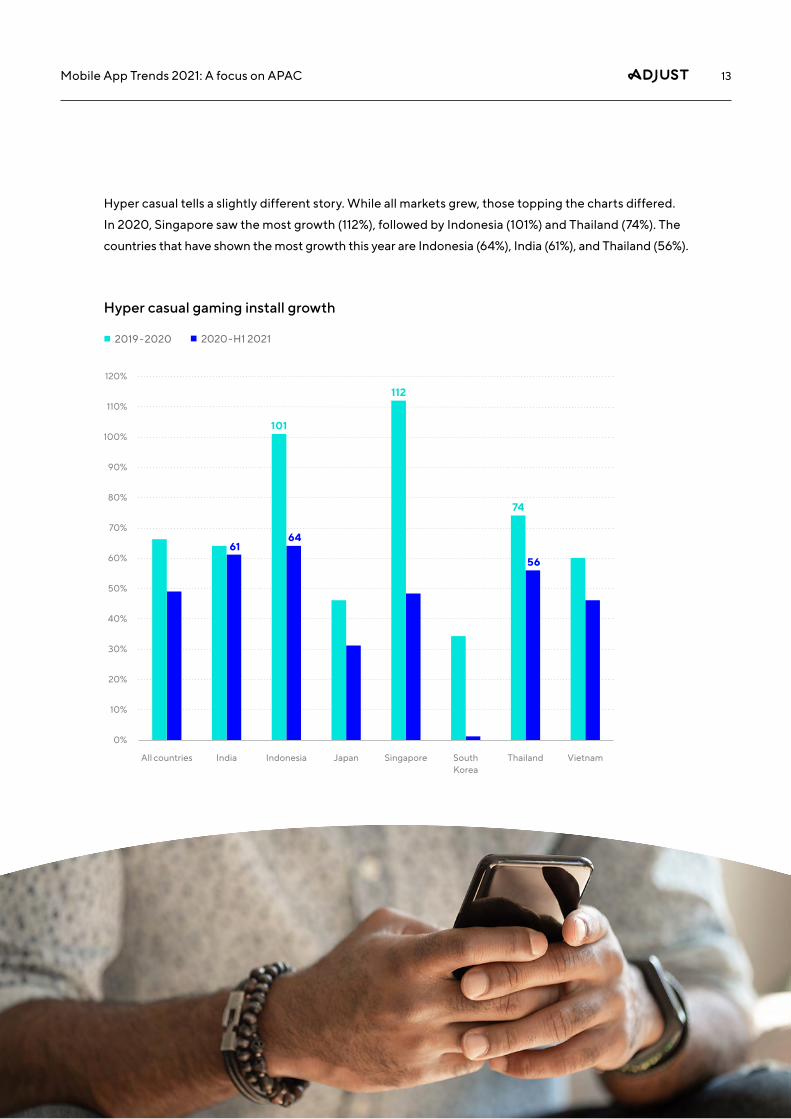
Hyper casual tells a slightly different story. While all markets grew, those topping the charts differed.
In 2020, Singapore saw the most growth (112%), followed by Indonesia (101%) and Thailand (74%). The
countries that have shown the most growth this year are Indonesia (64%), India (61%), and Thailand (56%).
74
112
101
Hyper casual gaming install growth
2020-H1 2021
All countries India Indonesia Japan Singapore South Korea
Thailand Vietnam
120%
80%
100%
110%
90%
70%
50%
30%
10%
60%
40%
20%
0%
2019-2020
14Mobile App Trends 2021: A focus on APAC
0.74
1.49
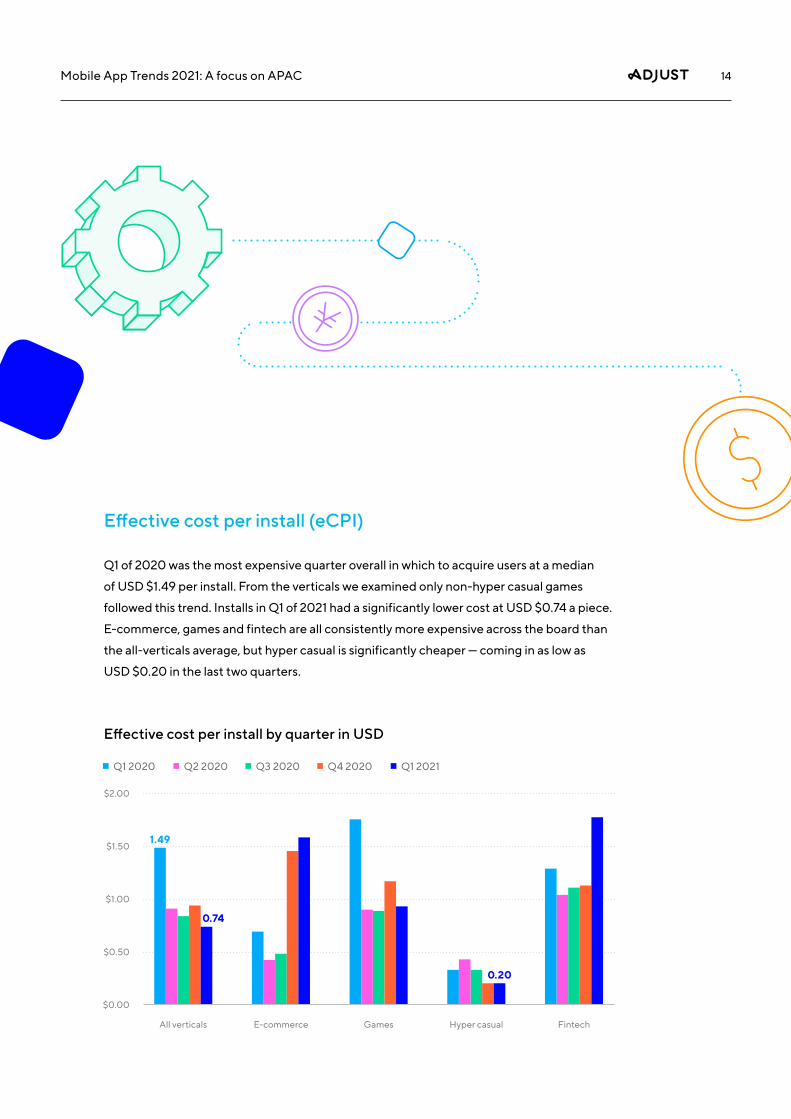
Effective cost per install (eCPI)
Q1 of 2020 was the most expensive quarter overall in which to acquire users at a median
of USD $1.49 per install. From the verticals we examined only non-hyper casual games
followed this trend. Installs in Q1 of 2021 had a significantly lower cost at USD $0.74 a piece.
E-commerce, games and fintech are all consistently more expensive across the board than
the all-verticals average, but hyper casual is significantly cheaper — coming in as low as
USD $0.20 in the last two quarters.
Effective cost per install by quarter in USD
$2.00
$1.50
$1.00
$0.50
$0.00
All verticals E-commerce Games Hyper casual Fintech
Q1 2020 Q2 2020 Q3 2020 Q4 2020 Q1 2021
15Mobile App Trends 2021: A focus on APAC
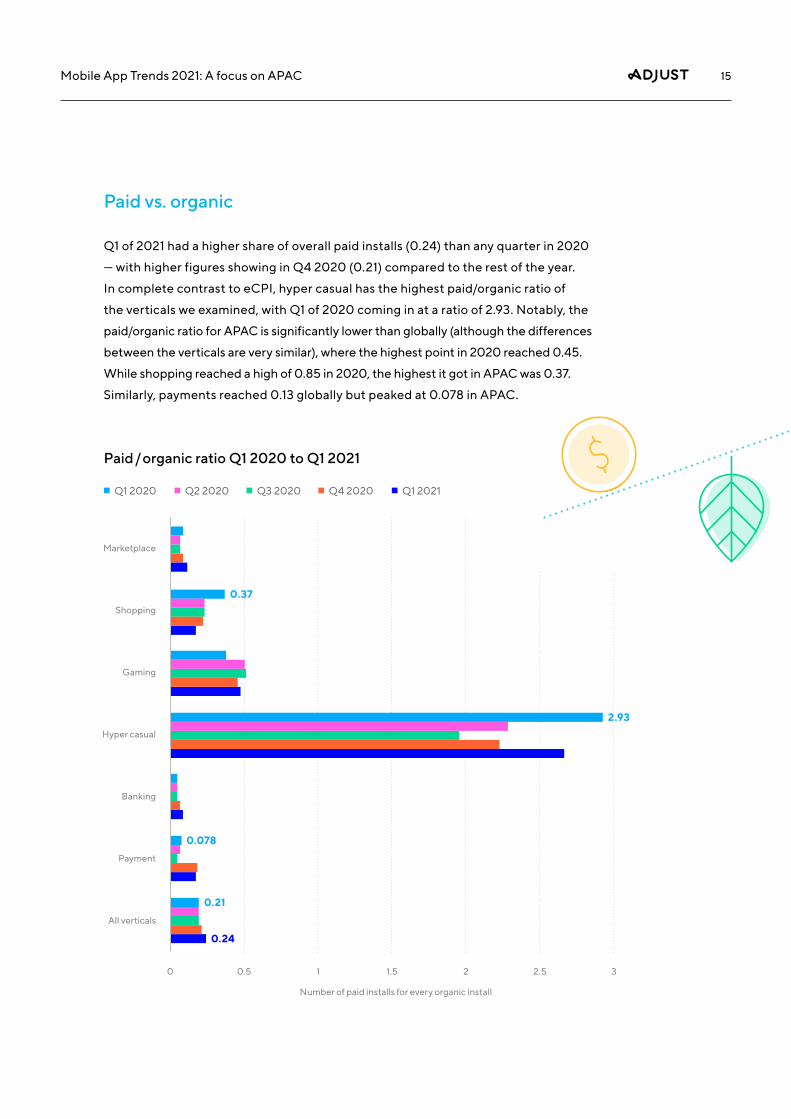
Q1 of 2021 had a higher share of overall paid installs (0.24) than any quarter in 2020
— with higher figures showing in Q4 2020 (0.21) compared to the rest of the year.
In complete contrast to eCPI, hyper casual has the highest paid/organic ratio of
the verticals we examined, with Q1 of 2020 coming in at a ratio of 2.93. Notably, the
paid/organic ratio for APAC is significantly lower than globally (although the differences
between the verticals are very similar), where the highest point in 2020 reached 0.45.
While shopping reached a high of 0.85 in 2020, the highest it got in APAC was 0.37.
Similarly, payments reached 0.13 globally but peaked at 0.078 in APAC.
Paid vs. organic
Paid / organic ratio Q1 2020 to Q1 2021
Marketplace
Shopping
Gaming
Hyper casual
Banking
Payment
All verticals
Number of paid installs for every organic install
0 0.5 1 1.5 2 2.5 3
0.078
2.93
0.37
0.21
0.24
Q1 2020 Q2 2020 Q3 2020 Q4 2020 Q1 2021
16Mobile App Trends 2021: A focus on APAC
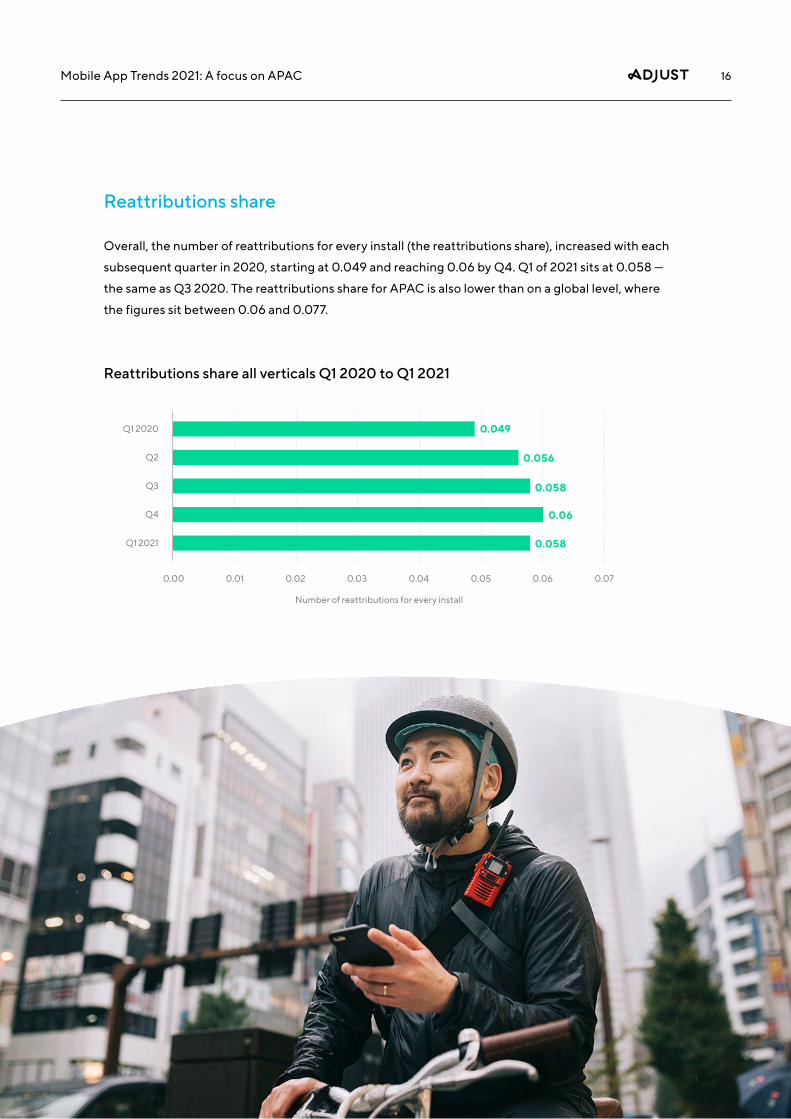
Reattributions share
Overall, the number of reattributions for every install (the reattributions share), increased with each
subsequent quarter in 2020, starting at 0.049 and reaching 0.06 by Q4. Q1 of 2021 sits at 0.058 —
the same as Q3 2020. The reattributions share for APAC is also lower than on a global level, where
the figures sit between 0.06 and 0.077.
Reattributions share all verticals Q1 2020 to Q1 2021
0.070.010.00 0.030.02 0.060.050.04
Number of reattributions for every install
Q1 2020
Q3
Q2
Q4
Q1 2021
0.049
0.058
0.06
0.058
0.056
17Mobile App Trends 2021: A focus on APAC
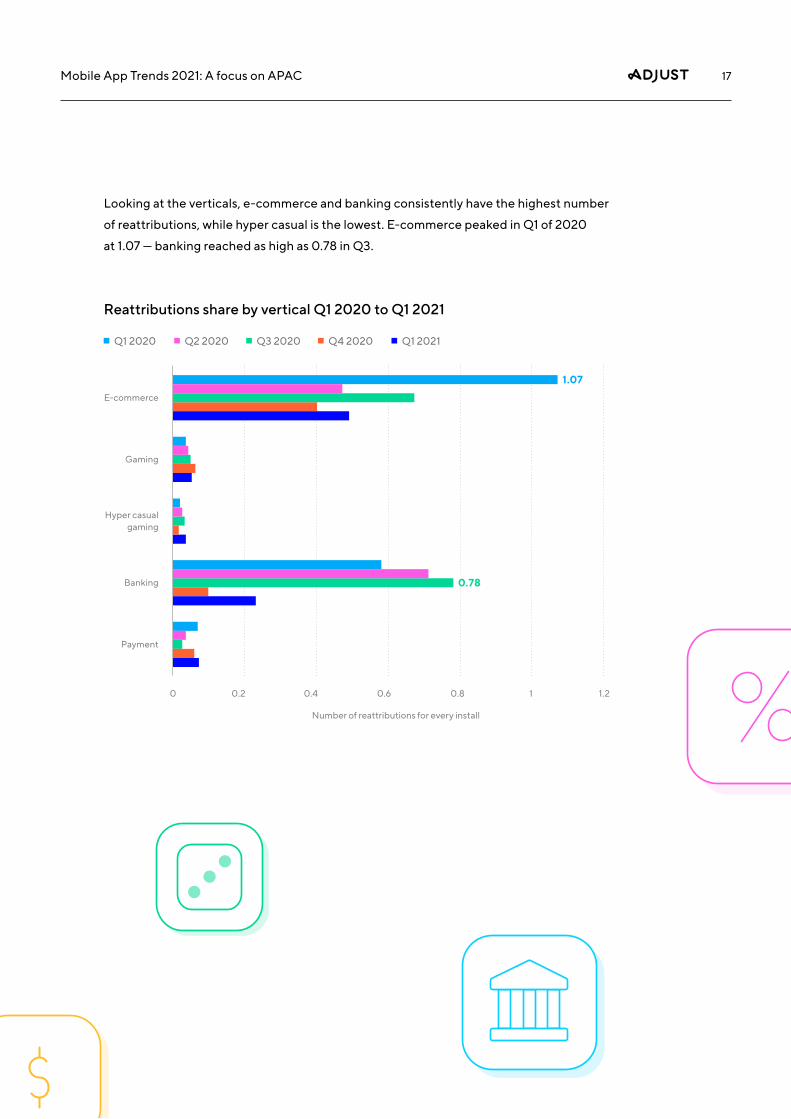
Looking at the verticals, e-commerce and banking consistently have the highest number
of reattributions, while hyper casual is the lowest. E-commerce peaked in Q1 of 2020
at 1.07 — banking reached as high as 0.78 in Q3.
Reattributions share by vertical Q1 2020 to Q1 2021
1.20 0.2 0.60.4 10.8
Number of reattributions for every install
Gaming
Hyper casual gaming
Payment
E-commerce
Banking
1.07
0.78
Q1 2020 Q2 2020 Q3 2020 Q4 2020 Q1 2021
18Mobile App Trends 2021: A focus on APAC
Sessions and in-app patterns
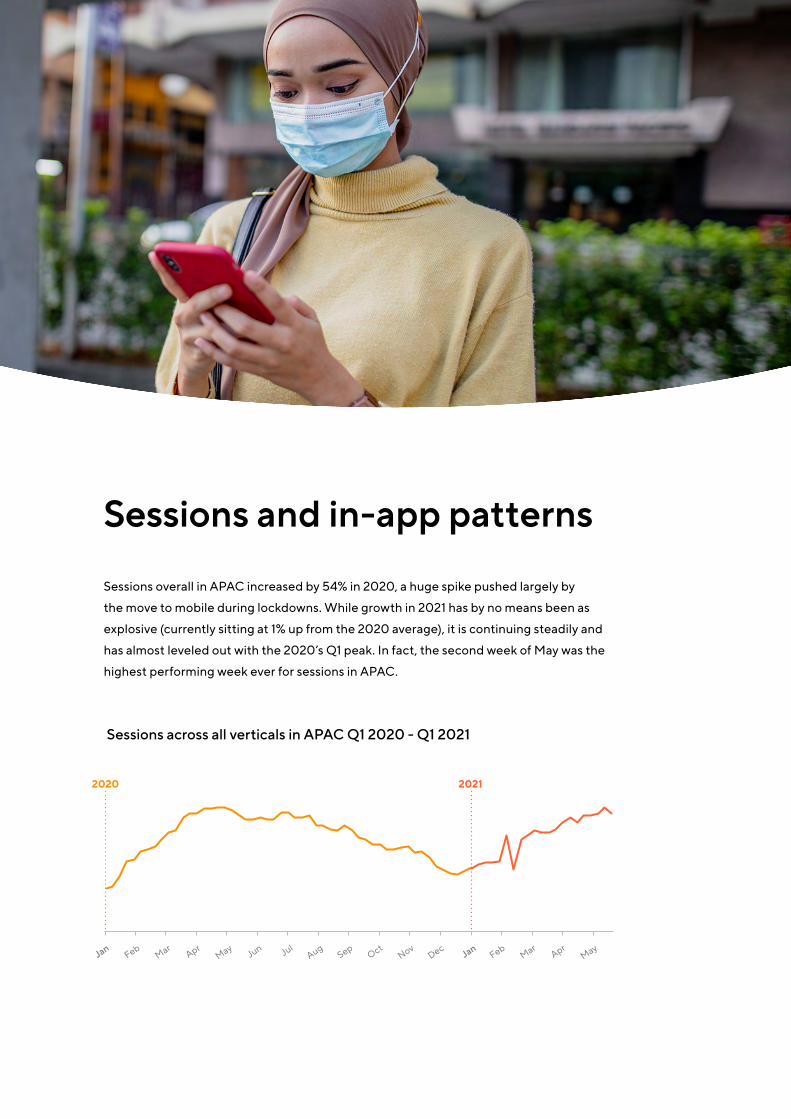
Sessions overall in APAC increased by 54% in 2020, a huge spike pushed largely by
the move to mobile during lockdowns. While growth in 2021 has by no means been as
explosive (currently sitting at 1% up from the 2020 average), it is continuing steadily and
has almost leveled out with the 2020’s Q1 peak. In fact, the second week of May was the
highest performing week ever for sessions in APAC.
Sessions across all verticals in APAC Q1 2020 - Q1 2021
Jan JanFeb
FebMar
MarApr
AprMay
MayJun Jul
AugSep
OctNov
Dec
20212020
19Mobile App Trends 2021: A focus on APAC
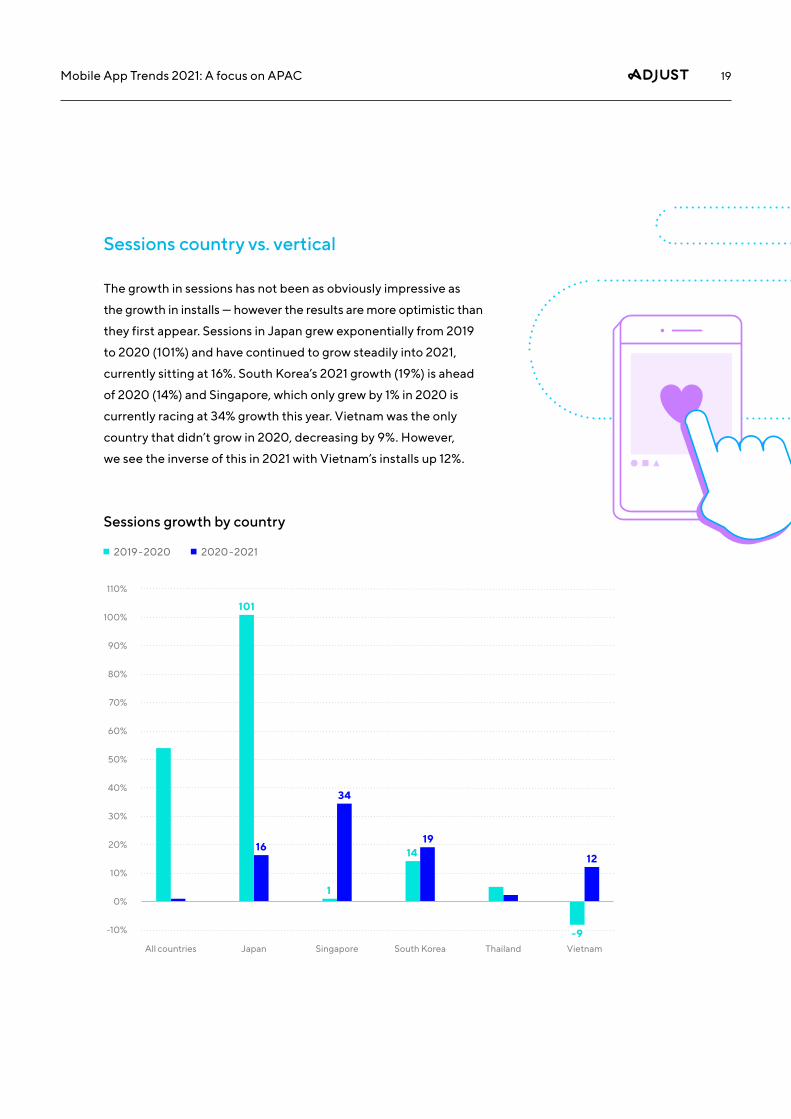
Sessions country vs. vertical
The growth in sessions has not been as obviously impressive as
the growth in installs — however the results are more optimistic than
they first appear. Sessions in Japan grew exponentially from 2019
to 2020 (101%) and have continued to grow steadily into 2021,
currently sitting at 16%. South Korea’s 2021 growth (19%) is ahead
of 2020 (14%) and Singapore, which only grew by 1% in 2020 is
currently racing at 34% growth this year. Vietnam was the only
country that didn’t grow in 2020, decreasing by 9%. However,
we see the inverse of this in 2021 with Vietnam’s installs up 12%.
Sessions growth by country
2019-2020 2020-2021
110%
100%
80%
90%
50%
70%
30%
60%
20%
40%
10%
-10%
0%
All countries Japan Singapore South Korea Thailand Vietnam
101
14
1
16
34
19
12
-9
20Mobile App Trends 2021: A focus on APAC
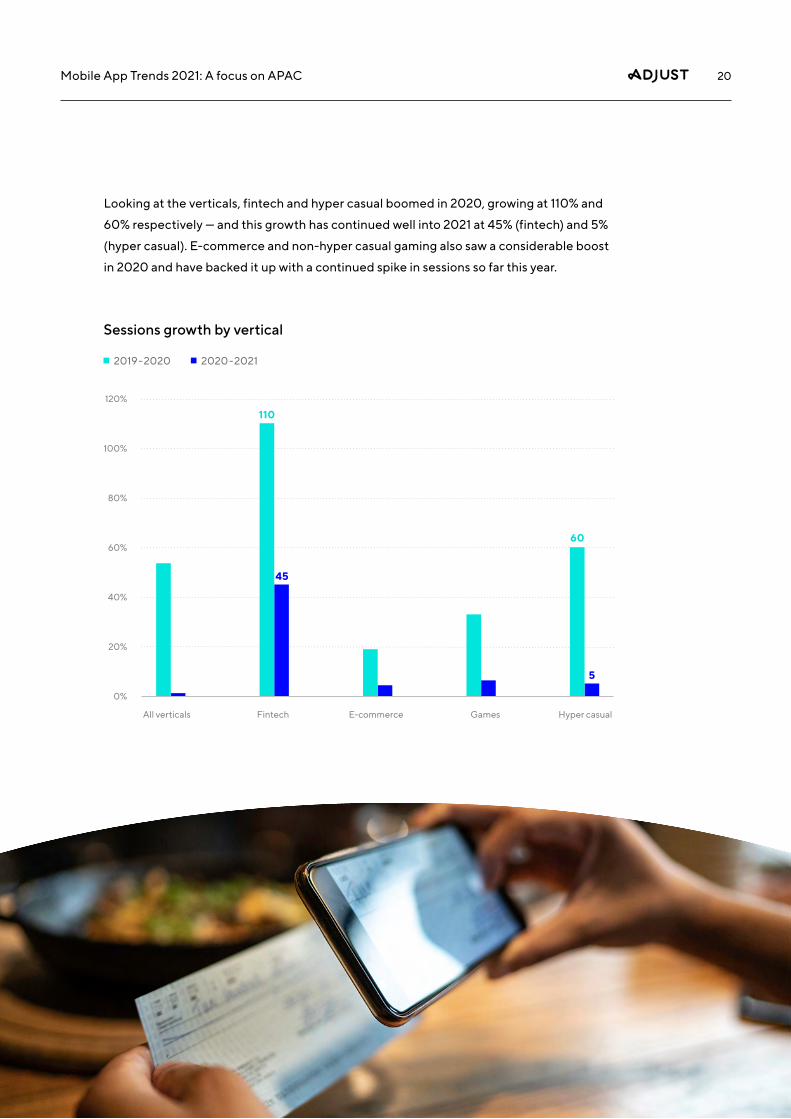
Looking at the verticals, fintech and hyper casual boomed in 2020, growing at 110% and
60% respectively — and this growth has continued well into 2021 at 45% (fintech) and 5%
(hyper casual). E-commerce and non-hyper casual gaming also saw a considerable boost
in 2020 and have backed it up with a continued spike in sessions so far this year.
Sessions growth by vertical
2019-2020 2020-2021
120%
100%
80%
60%
20%
40%
0%
110
60
45
5
All verticals Fintech E-commerce Games Hyper casual
21Mobile App Trends 2021: A focus on APAC
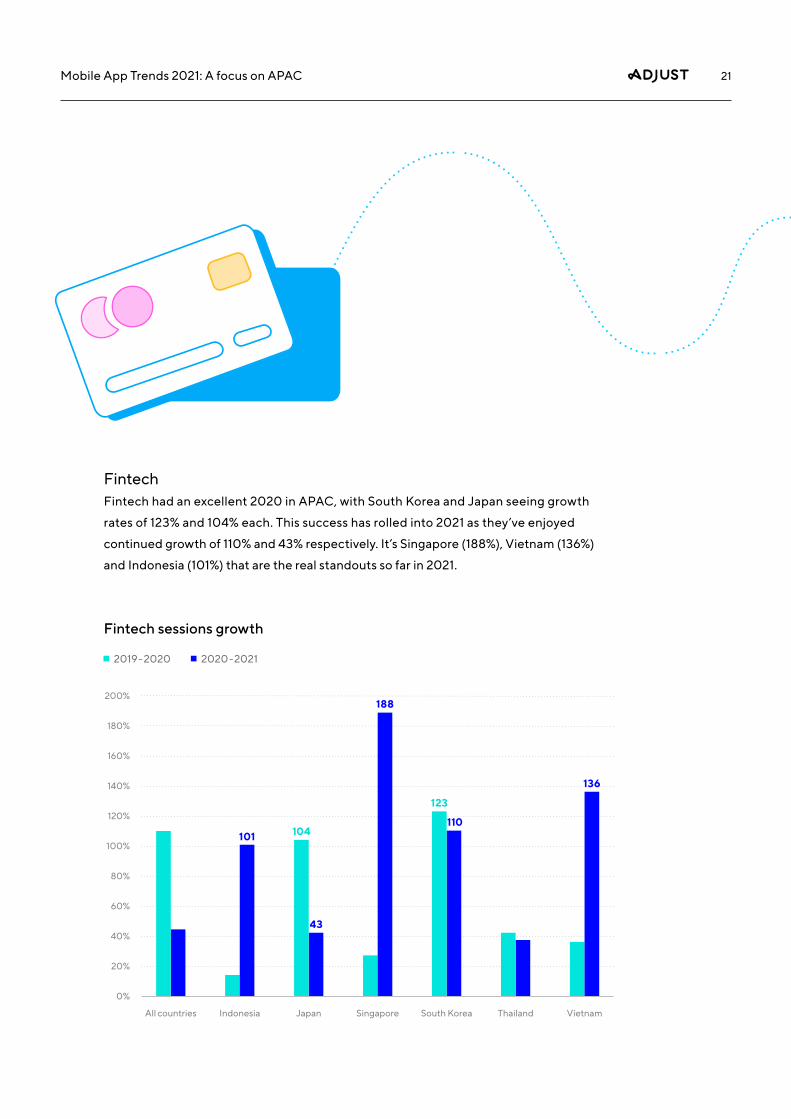
FintechFintech had an excellent 2020 in APAC, with South Korea and Japan seeing growth
rates of 123% and 104% each. This success has rolled into 2021 as they’ve enjoyed
continued growth of 110% and 43% respectively. It’s Singapore (188%), Vietnam (136%)
and Indonesia (101%) that are the real standouts so far in 2021.
Fintech sessions growth
2019-2020 2020-2021
200%
140%
120%
160%
180%
100%
80%
60%
20%
40%
0%
All countries Japan SingaporeIndonesia South Korea Thailand Vietnam
123
104110
188
136
101
43
22Mobile App Trends 2021: A focus on APAC
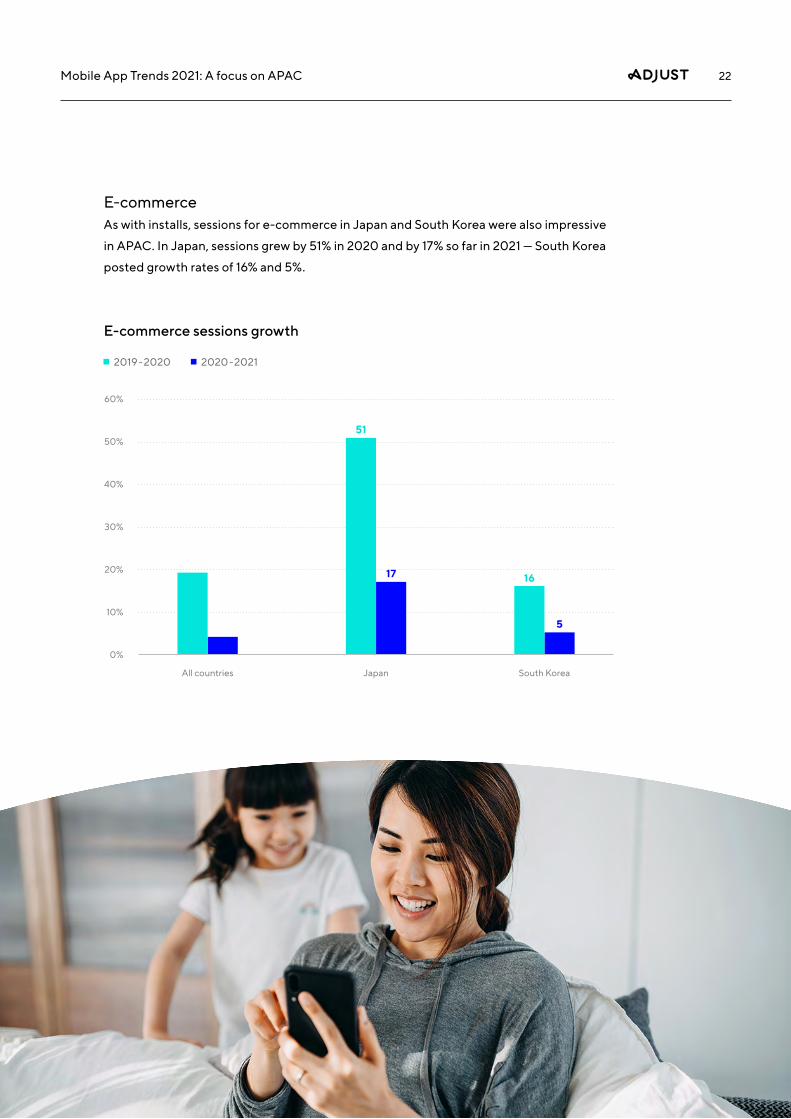
E-commerce As with installs, sessions for e-commerce in Japan and South Korea were also impressive
in APAC. In Japan, sessions grew by 51% in 2020 and by 17% so far in 2021 — South Korea
posted growth rates of 16% and 5%.
E-commerce sessions growth
2019-2020 2020-2021
60%
50%
40%
30%
20%
10%
0%
All countries Japan South Korea
51
1617
5
23Mobile App Trends 2021: A focus on APAC
All countries
Indonesia
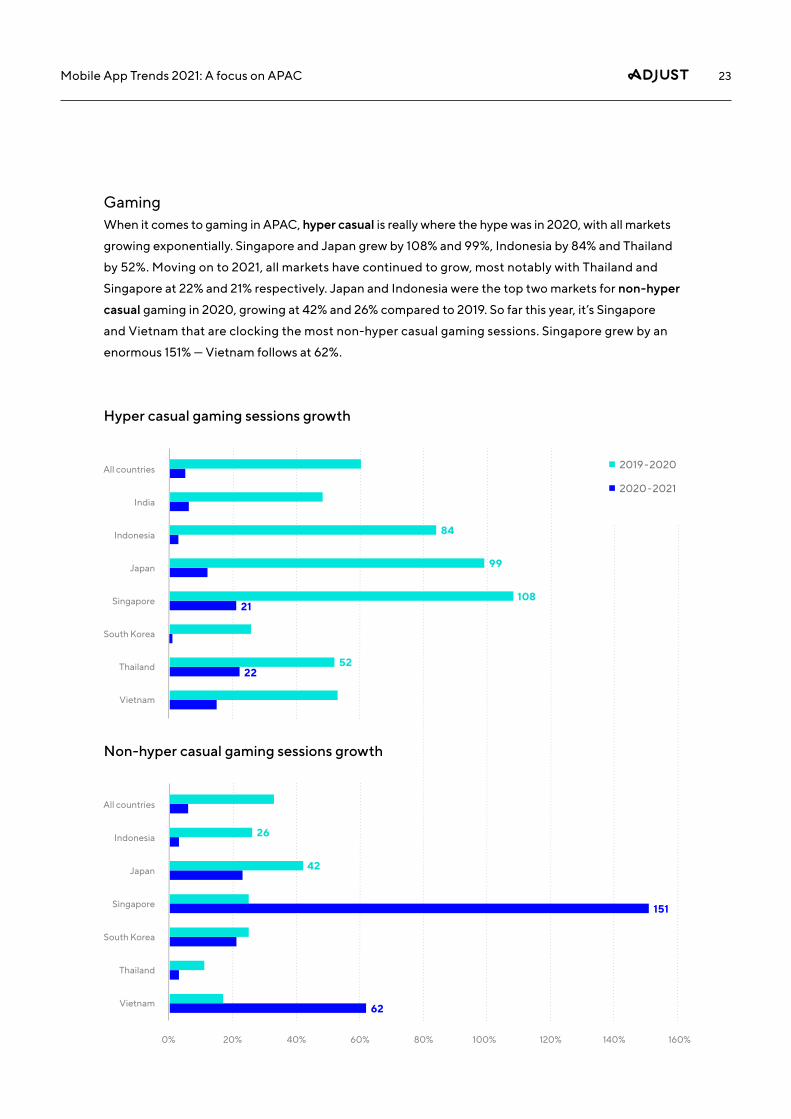
GamingWhen it comes to gaming in APAC, hyper casual is really where the hype was in 2020, with all markets
growing exponentially. Singapore and Japan grew by 108% and 99%, Indonesia by 84% and Thailand
by 52%. Moving on to 2021, all markets have continued to grow, most notably with Thailand and
Singapore at 22% and 21% respectively. Japan and Indonesia were the top two markets for non-hyper
casual gaming in 2020, growing at 42% and 26% compared to 2019. So far this year, it’s Singapore
and Vietnam that are clocking the most non-hyper casual gaming sessions. Singapore grew by an
enormous 151% — Vietnam follows at 62%.
Hyper casual gaming sessions growth
Non-hyper casual gaming sessions growth
2019-2020
2020-2021
140%120% 160%100%80%60%20% 40%0%
Japan
Singapore
South Korea
Thailand
Vietnam
108
99
52
26
42
84
21
22
151
62
All countries
Indonesia
India
Japan
Singapore
South Korea
Thailand
Vietnam
24Mobile App Trends 2021: A focus on APAC
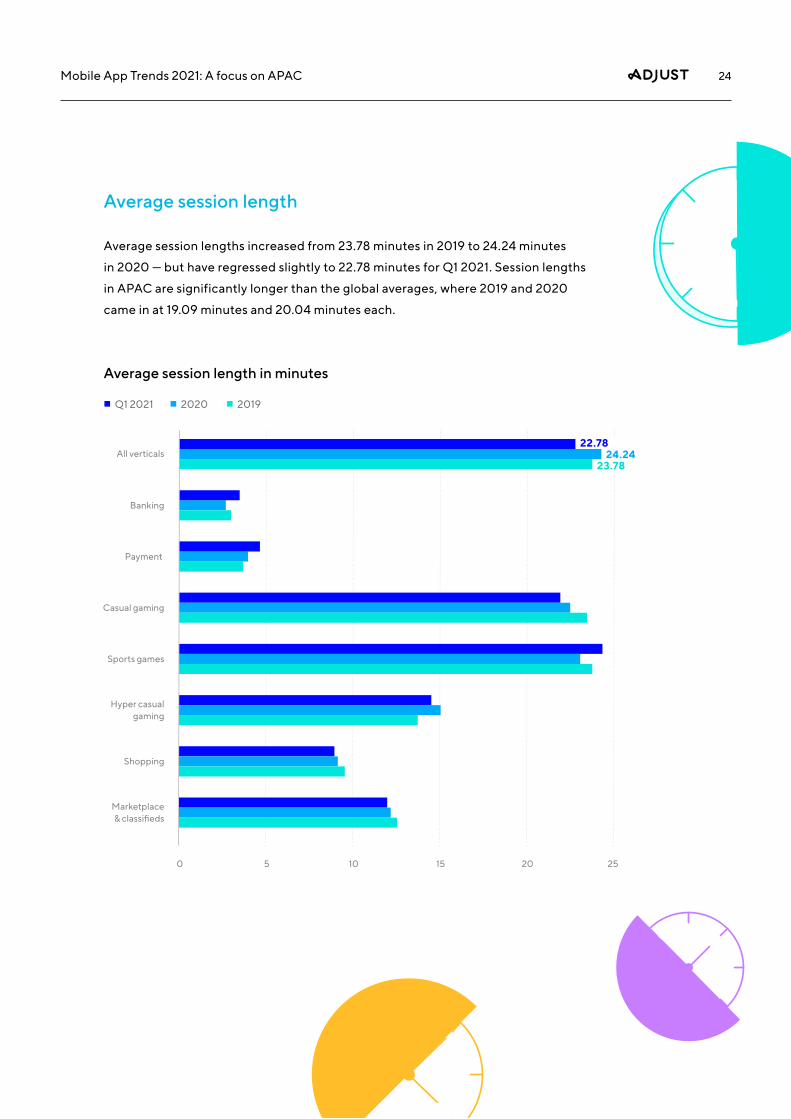
Average session length
Average session lengths increased from 23.78 minutes in 2019 to 24.24 minutes
in 2020 — but have regressed slightly to 22.78 minutes for Q1 2021. Session lengths
in APAC are significantly longer than the global averages, where 2019 and 2020
came in at 19.09 minutes and 20.04 minutes each.
Average session length in minutes
24.2423.78
22.78
Q1 2021 2020 2019
252010 1550
All verticals
Banking
Payment
Casual gaming
Sports games
Hyper casual gaming
Shopping
Marketplace & classifieds
25Mobile App Trends 2021: A focus on APAC
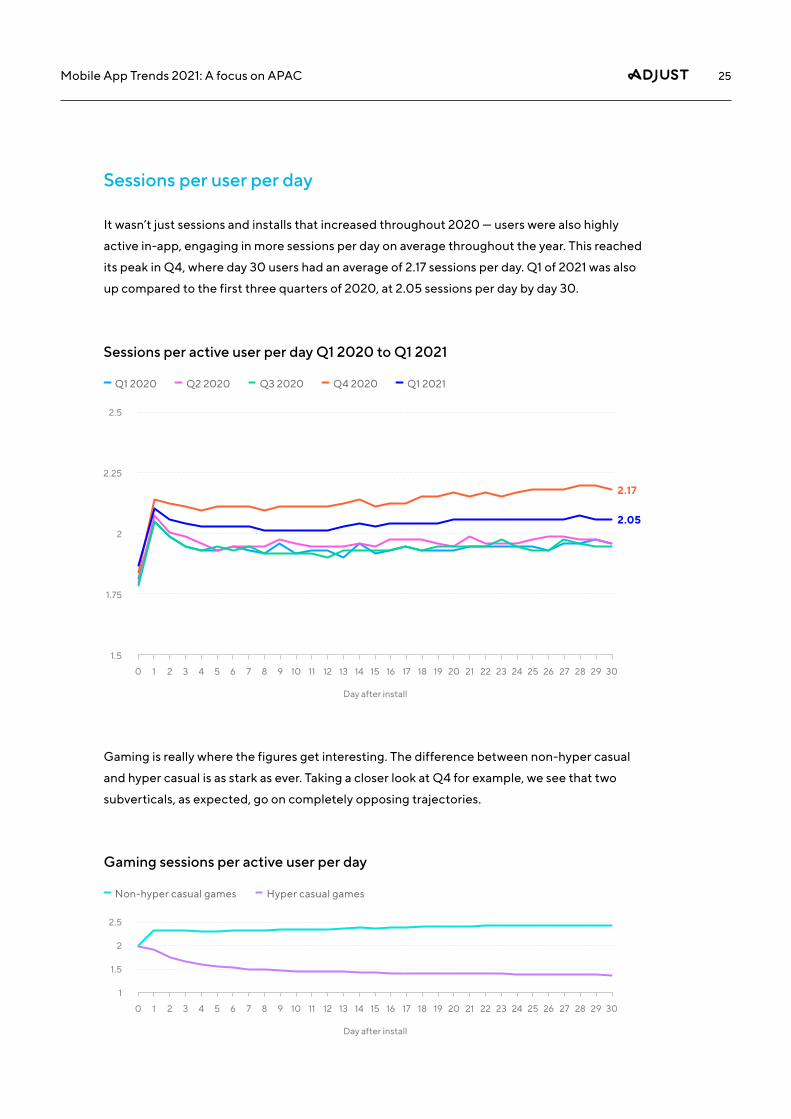
Sessions per user per day
It wasn’t just sessions and installs that increased throughout 2020 — users were also highly
active in-app, engaging in more sessions per day on average throughout the year. This reached
its peak in Q4, where day 30 users had an average of 2.17 sessions per day. Q1 of 2021 was also
up compared to the first three quarters of 2020, at 2.05 sessions per day by day 30.
Sessions per active user per day Q1 2020 to Q1 2021
Gaming sessions per active user per day
1
1
7
7
14
14
23
23
0
0
6
6
13
13
22
22
2
2
8
8
15
15
24
24
3
3
9
9
16
16
25
25
4
4
10
10
19
19
17
17
26
26
5
5
12
12
21
21
11
11
20
20
18
18
27
27
28
28
29
29
30
30
2.5
2.25
1.75
2.5
2
2
1.5
1
1.5
Q1 2020
Non-hyper casual games
Q2 2020 Q3 2020 Q4 2020 Q1 2021
Day after install
Day after install
2.17
2.05
Gaming is really where the figures get interesting. The difference between non-hyper casual
and hyper casual is as stark as ever. Taking a closer look at Q4 for example, we see that two
subverticals, as expected, go on completely opposing trajectories.
Hyper casual games
26Mobile App Trends 2021: A focus on APAC
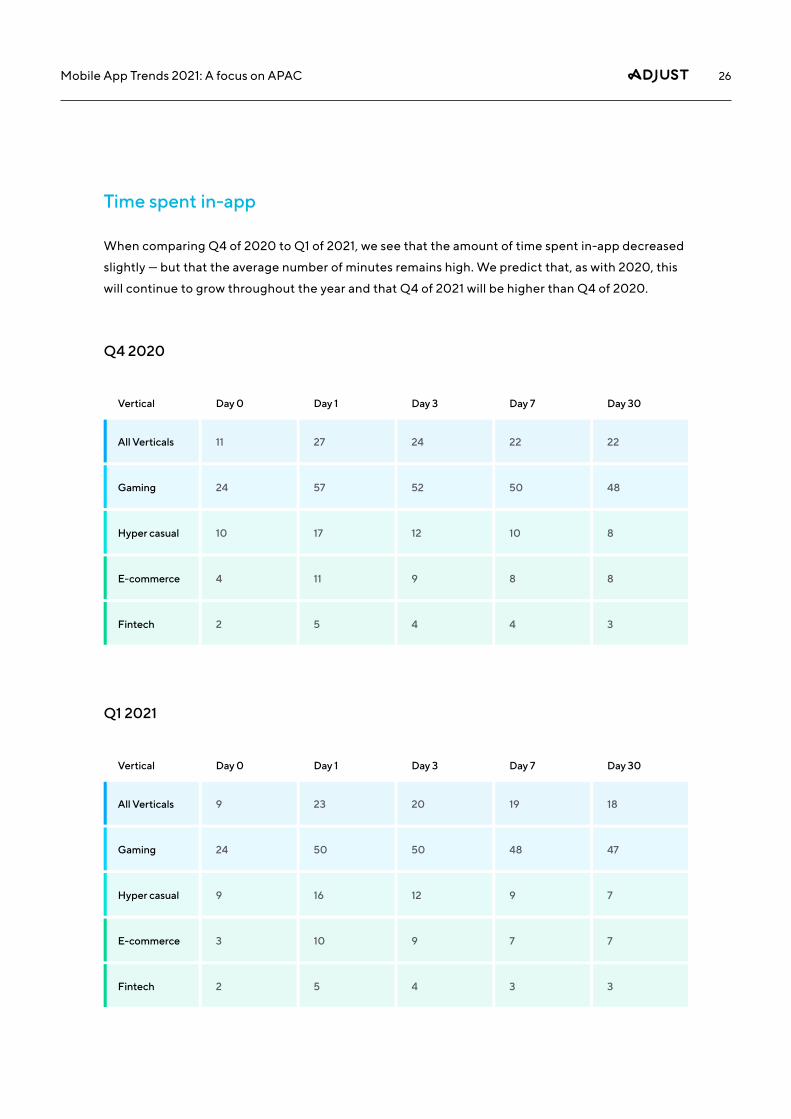
Time spent in-app
When comparing Q4 of 2020 to Q1 of 2021, we see that the amount of time spent in-app decreased
slightly — but that the average number of minutes remains high. We predict that, as with 2020, this
will continue to grow throughout the year and that Q4 of 2021 will be higher than Q4 of 2020.
Q4 2020
Q1 2021
Vertical
Vertical
All Verticals
All Verticals
Gaming
Gaming
Hyper casual
Hyper casual
E-commerce
E-commerce
Fintech
Fintech
Day 0
Day 0
11
9
24
24
10
9
4
3
2
2
Day 1
Day 1
27
23
57
50
17
16
11
10
5
5
Day 3
Day 3
24
20
52
50
12
12
9
9
4
4
Day 7
Day 7
22
19
50
48
10
9
8
7
4
3
Day 30
Day 30
22
18
48
47
8
7
8
7
3
3
27Mobile App Trends 2021: A focus on APAC
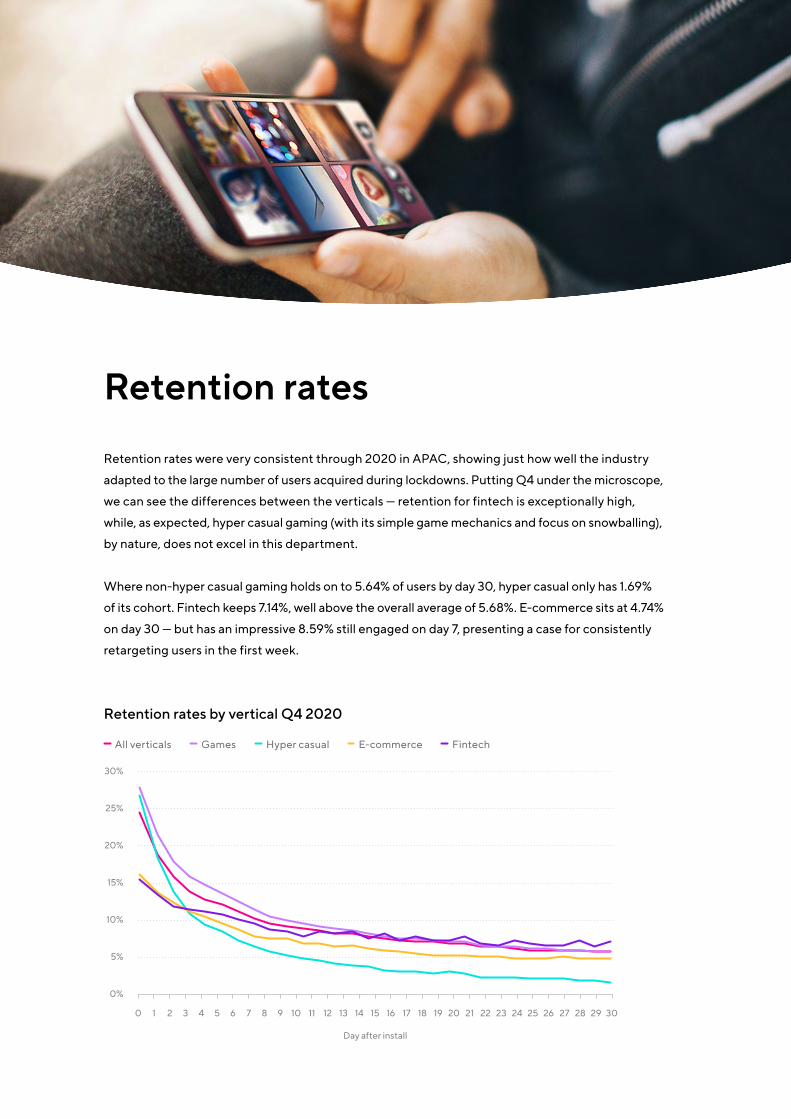
Retention rates
Retention rates were very consistent through 2020 in APAC, showing just how well the industry
adapted to the large number of users acquired during lockdowns. Putting Q4 under the microscope,
we can see the differences between the verticals — retention for fintech is exceptionally high,
while, as expected, hyper casual gaming (with its simple game mechanics and focus on snowballing),
by nature, does not excel in this department.
Where non-hyper casual gaming holds on to 5.64% of users by day 30, hyper casual only has 1.69%
of its cohort. Fintech keeps 7.14%, well above the overall average of 5.68%. E-commerce sits at 4.74%
on day 30 — but has an impressive 8.59% still engaged on day 7, presenting a case for consistently
retargeting users in the first week.
Retention rates by vertical Q4 2020
5%
1 7 14 230 6 13 222 8 15 243 9 16 254 10 1917 265 12 2111 2018 27 28 29 30
0%
10%
15%
20%
25%
30%
All verticals Games Hyper casual E-commerce Fintech
Day after install
28Mobile App Trends 2021: A focus on APAC
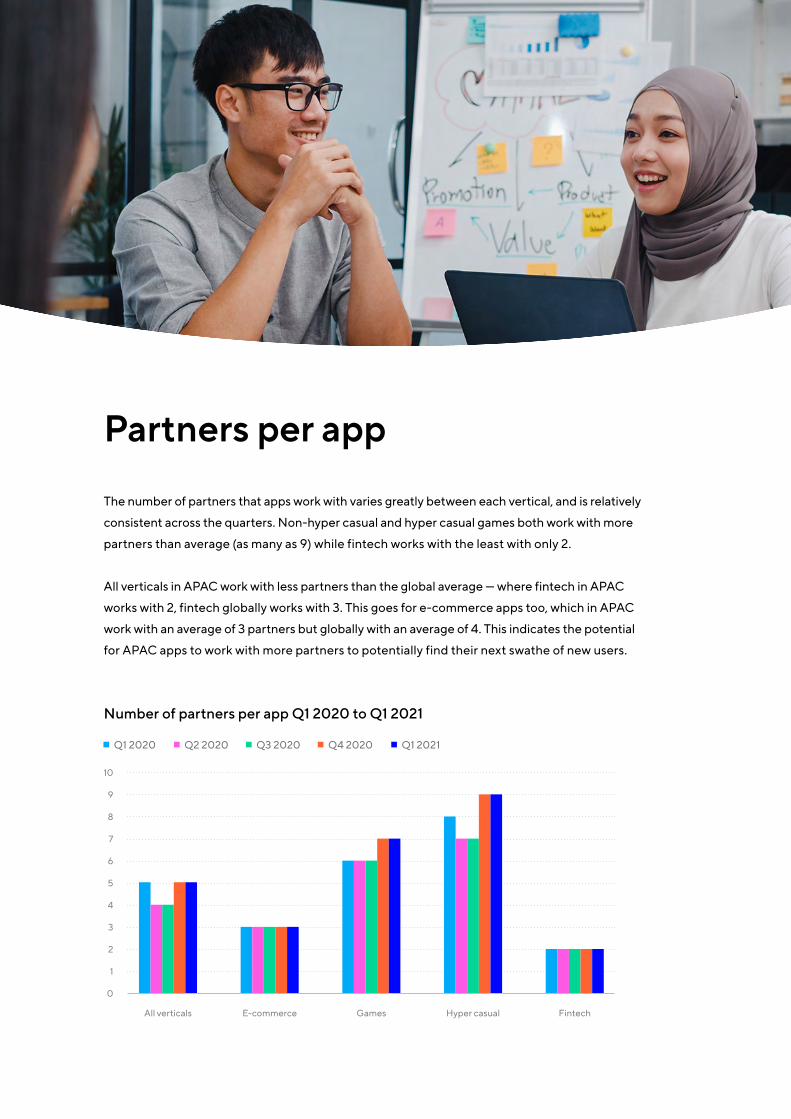
Partners per app
The number of partners that apps work with varies greatly between each vertical, and is relatively
consistent across the quarters. Non-hyper casual and hyper casual games both work with more
partners than average (as many as 9) while fintech works with the least with only 2.
All verticals in APAC work with less partners than the global average — where fintech in APAC
works with 2, fintech globally works with 3. This goes for e-commerce apps too, which in APAC
work with an average of 3 partners but globally with an average of 4. This indicates the potential
for APAC apps to work with more partners to potentially find their next swathe of new users.
Number of partners per app Q1 2020 to Q1 2021
10
9
8
7
6
5
4
3
2
1
0
All verticals E-commerce Games Hyper casual Fintech
Q1 2020 Q2 2020 Q3 2020 Q4 2020 Q1 2021
29Mobile App Trends 2021: A focus on APAC
Conclusion
The key to successfully marketing an app is understanding the nuances of the vertical
and subverticals in which it belongs. The differences on a sub-vertical level might be
exceedingly obvious — as with hyper casual gaming — but the user behaviors and in-app
patterns can also be deceptively subtle. The number of installs and sessions taking place
within a particular vertical or region is an important indicator of how popular or necessary
certain types of apps are, particularly as mobile adoption continues to rise in the APAC
region. But it’s the more granular data points that help you understand what users expect
and how you can optimize your in-app experience to better meet their needs.
Marketers will then be empowered to map their users’ journeys, which will in turn help
them to test and optimize campaigns to yield more impressive results.
More people in APAC are turning towards mobile and digital solutions for entertainment
and daily tasks than ever before. To truly stand out in this region, developers and marketers
need to be more data-driven, focus on perfecting their UX — and prepared to adapt to
the ever growing and changing mobile ecosystem.
With iOS 14.5+ redefining how we approach UA as an industry, and with Android 12 changes
on the horizon, the importance of A/B testing and gaining a deeper user understanding
are becoming increasingly important. It’s critical to have an expert understanding of UA
and to be laser-focused on user behaviors that lead to high lifetime value (LTV).
Marketers are then able to drill into and analyze the amount of time users:
• Spend in their apps
• When they’re coming back to their apps
• How many times they’re coming back per day
• When they’re dropping off
• What their pain points are
• How they behave depending on where they’ve been acquired
Adjust is the mobile marketing analytics platform trusted by growth-driven marketers
around the world, with solutions for measuring and optimizing campaigns and protecting
user data. Adjust powers thousands of apps with built-in intelligence and automation,
backed by responsive global customer support.
In 2021, Adjust was acquired by AppLovin, a leading marketing software company
providing developers with a powerful, integrated set of solutions to grow their mobile apps.
Learn more about Adjust at :
www.adjust.com
ABOUT ADJUST
adjust.com @adjustcom


![[WUNDERMAN] Digital Trends in APAC(Mar.2016)](https://static.fdocuments.in/doc/165x107/58f05bc21a28ab6e028b4617/wunderman-digital-trends-in-apacmar2016.jpg)