Mobile app Description characteristics · mobile app and mobile app developers have increasing...
48
The role of product characteristics on mobile app demand Master’s Thesis Marketing Erasmus School of Economics Name: Milena Alexova Student number: 358440 Supervisor: Vijay Hariharan Date: 07.08.2015 Place: Rotterdam
Transcript of Mobile app Description characteristics · mobile app and mobile app developers have increasing...
The role of product characteristics on mobile app
demand
Master’s Thesis
Marketing
Erasmus School of Economics
Name: Milena Alexova
Student number: 358440
Supervisor: Vijay Hariharan
Date: 07.08.2015
Place: Rotterdam
1
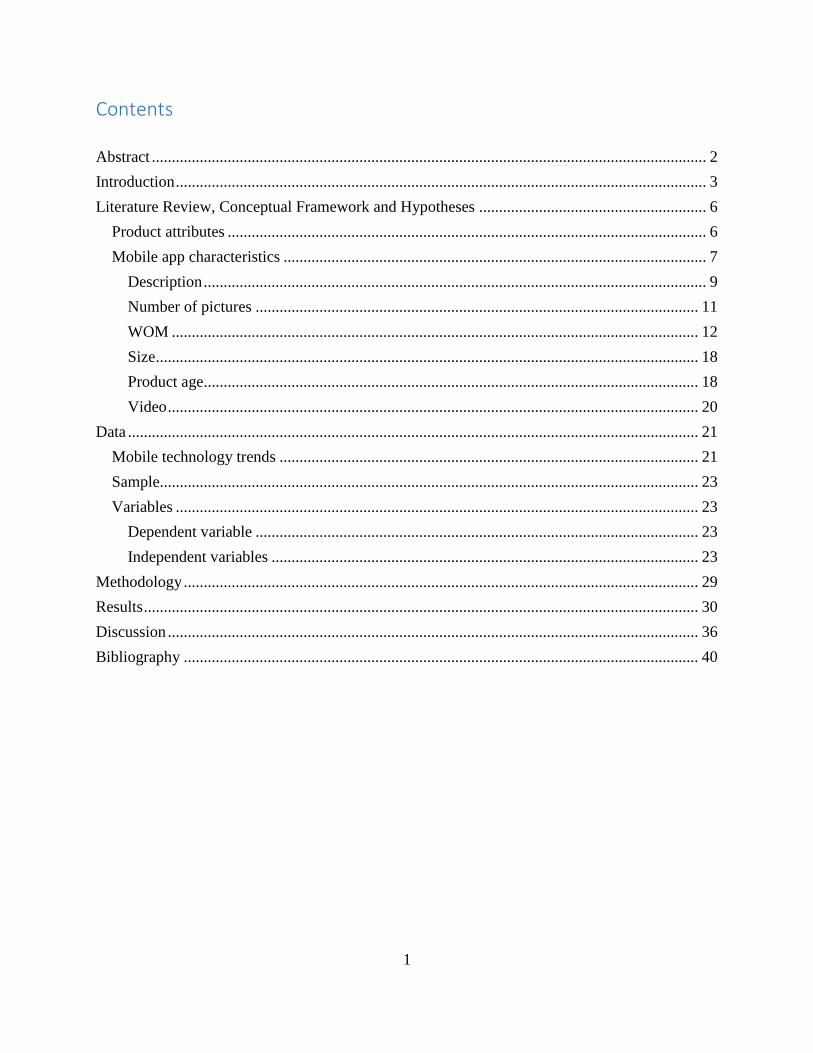
Contents
Abstract ........................................................................................................................................... 2
Introduction ..................................................................................................................................... 3
Literature Review, Conceptual Framework and Hypotheses ......................................................... 6
Product attributes ........................................................................................................................ 6
Mobile app characteristics .......................................................................................................... 7
Description .............................................................................................................................. 9
Number of pictures ............................................................................................................... 11
WOM .................................................................................................................................... 12
Size ........................................................................................................................................ 18
Product age............................................................................................................................ 18
Video ..................................................................................................................................... 20
Data ............................................................................................................................................... 21
Mobile technology trends ......................................................................................................... 21
Sample....................................................................................................................................... 23
Variables ................................................................................................................................... 23
Dependent variable ............................................................................................................... 23
Independent variables ........................................................................................................... 23
Methodology ................................................................................................................................. 29
Results ........................................................................................................................................... 30
Discussion ..................................................................................................................................... 36
Bibliography ................................................................................................................................. 40
2
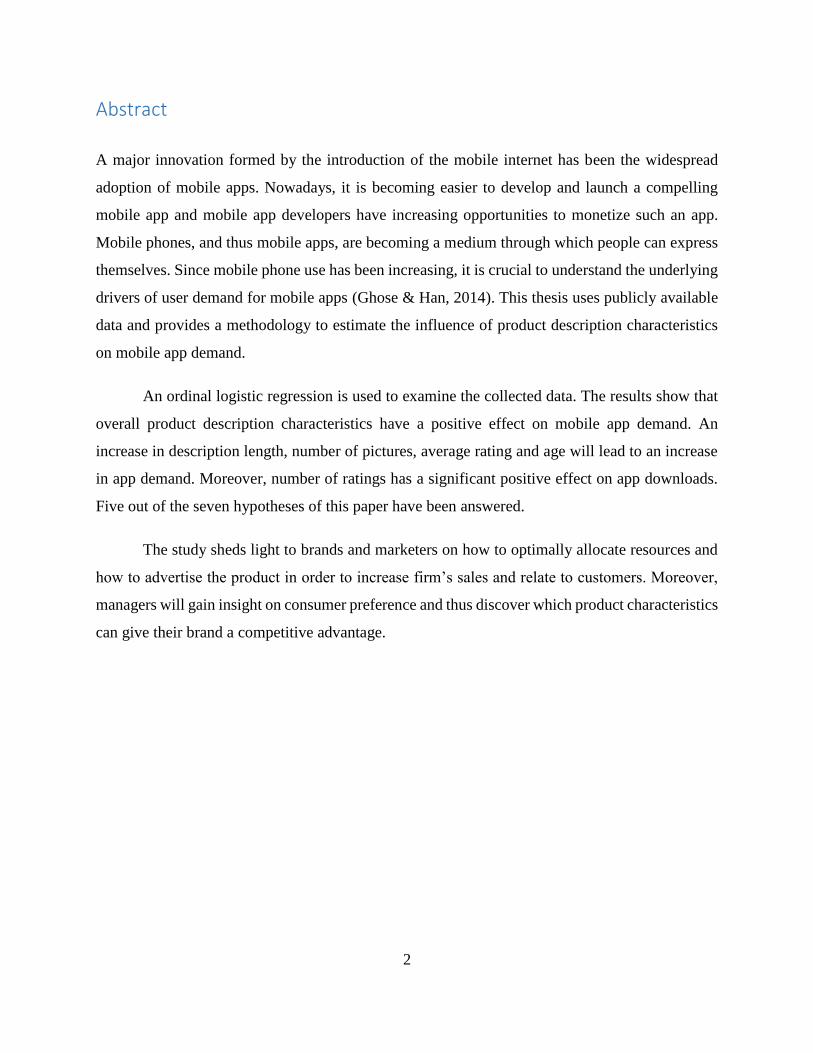
Abstract
A major innovation formed by the introduction of the mobile internet has been the widespread
adoption of mobile apps. Nowadays, it is becoming easier to develop and launch a compelling
mobile app and mobile app developers have increasing opportunities to monetize such an app.
Mobile phones, and thus mobile apps, are becoming a medium through which people can express
themselves. Since mobile phone use has been increasing, it is crucial to understand the underlying
drivers of user demand for mobile apps (Ghose & Han, 2014). This thesis uses publicly available
data and provides a methodology to estimate the influence of product description characteristics
on mobile app demand.
An ordinal logistic regression is used to examine the collected data. The results show that
overall product description characteristics have a positive effect on mobile app demand. An
increase in description length, number of pictures, average rating and age will lead to an increase
in app demand. Moreover, number of ratings has a significant positive effect on app downloads.
Five out of the seven hypotheses of this paper have been answered.
The study sheds light to brands and marketers on how to optimally allocate resources and
how to advertise the product in order to increase firm’s sales and relate to customers. Moreover,
managers will gain insight on consumer preference and thus discover which product characteristics
can give their brand a competitive advantage.
3
Introduction
More than a decade ago, mobile phones were used mainly for calling and messaging. Unlike today,
it was common to see groups of children playing on the streets. Active people wrote their to-do
tasks in agendas and diaries, and sports people tracked their daily performance using pen and
paper. However, technology has been rapidly developing over the past ten years and so has the
mobile phone. It is one of the few products that has gained global acceptance in a relatively short
period of time (Barnes & Scornavacca, 2004). Phones have become indispensable for many
consumers. They are no longer only a communication gadget, but also extend and express
individuality and personality (Sultan & Rohm, 2005; Grant & O’Donohoe, 2007). The highly
personalized nature of smartphones means that individuals decide what a smartphone means for
themselves (Jung, 2014). Mobile applications are a way to differentiate and modify a smartphone
by the individual’s activity and social life (Tossell, Kortum, Shepard, Rahmati, & Zhong, 2012).
Mobile devices are changing the way people think and function in their daily lives. A
smartphone is defined as a mobile phone, which has an operating system such as Android, Apple
iOS or Windows Mobile (Taylor & Levin, 2014). In 2014, 327.6 million smartphones (72% of all
mobile devices) were shipped globally (Mobile hardware statistics 2014, 2015).
The Internet has been increasingly used for roughly thirty years (Tanenbaum, 1996),
especially in the first decade of the new millennium. However, this trend has been surpassed by
the advent of mobile applications. New markets have been created through mobile apps. The
smartphone offers Internet connectivity and lets users install mobile applications (Taylor & Levin,
2014). Mobile apps now offer such activities as playing games, monitoring one’s health, and
reading e-books. New applications emerge constantly, while wireless networks have become more
available internationally. As a result usage time of mobile phones has been increasing (Garg &
Telang, 2013).
At the same time, phone companies have been increasingly competing to capture the most
market share with their product. This has helped the mobile phone industry evolve into a well-
developed marketplace. Today, it is hard to imagine what a smartphone does not have.
4
Nevertheless, the race continues: every year giants such as Samsung and Apple introduce new
models featuring new characteristics and apps.
Mobile apps are very engaging which increases customer appeal. Take for example Noom
Coach, a Health and Fitness app. It can be opened more than 5 times a day to write down meals,
activities, and access useful health articles. The usage of an app can be affected by many of its
characteristics – reviews (negative/positive), amount of reminders, etc. Customers keep and use
an app because they like how it performs, but they download an app by looking at the visual cues.
Well-made visuals attract users by making a great first impression (Mobile Apps: What Consumers
Really Need and Want, 2012).
The number of downloads represents the demand for a given app. However, data is limited
as companies such as Android and Apple, unlike Amazon, do not provide publicly available data
on the exact number of downloads of their apps. Nevertheless, similar to the example about
Amazon given by Telang and Garg (2011), publicly available data such as the range of downloads
will be used to represent demand.
Some research examined mobile app demand and the different characteristics that have an
impact on app downloads. However, what lacks from the literature is the influence of word of
mouth (WOM) on demand. Word of mouth has been considered a driver for consumer demand for
experience goods (Katz & Lazarsfeld, 1955). Moreover, often WOM can have such a large effect
on customers’ actions that they choose to ignore their own signals and fully rely on information
from others (Ellison & Fudenberg, 1995). Online review and rating systems provide consumers
with feedback from other users, allowing them to learn more about product quality. Thus, WOM
is particularly useful for experience goods such as mobile apps (Zhu & Zhang, 2006) and it is
important to examine the effect of WOM on app demand in collaboration with other app
characteristics.
There are very few papers that examine the relationship between different mobile app
description characteristics, especially WOM, in the Android store and their influence of the app
demand (downloads). A lot of papers look at the effect of online reviews on app demand (e.g.
Ghose & Han, 2014; Racherla, Furner, & Babb, 2012) and the effect of average rating on rank of
app downloads (Harman, Jia, & Zhang, 2012), but very few have looked at the effect of both
5
average rating and number of reviews on app demand (Pagano & Maalej, 2013). However, none
of these papers give a complete analysis of the overall effect of WOM on app demand. In other
words, none of these papers look at the effect of both valence and volume of WOM simultaneously
on app demand. Chia, Yamamoto and Asokan (2012) find that users are more likely to rate an app
which they have installed, meaning that there is a correlation between volume of WOM and
demand. However, it is of interest to find if volume of ratings can be a predictor for a higher app
demand. This thesis fills in a literature gap by presenting a unique combination of description
characteristics of a mobile app that has not been used in any other paper so far. Some attributes
have been included in Ghose and Han’s (2014) paper, who estimate demand for mobile
applications in a new economy. However, the authors do not examine the effect of volume of
ratings on the demand of mobile apps. The current dissertation adds the element word of mouth,
and especially the volume of ratings, which is considered to be highly relevant regarding their
influence on consumer behavior. Moreover, an ordinal logit model is used as the method for testing
the hypotheses, which has not been the choice of any other research with a similar topic. Thus, the
main question is formulated as follows:
What effect do product description characteristics, especially the number of ratings, have on
mobile app demand?
This study is beneficial to app developers and mobile companies to understand how
different characteristics of the mobile app, specifically WOM, drive consumer behavior,
engagement and loyalty. Also, it allows them to further develop the presentation of apps to users
and to examine users’ responses to in-app purchases and ads. Furthermore, a probable outcome is
higher demand, thus, higher revenues, as well as the results will shed light to brands on how to
optimally allocate resources. By understanding the importance of each product characteristic as
well as how they complement each other, app developers can be assured of competitive advantage.
Moreover, recommendations are provided on how to evaluate the performance of a certain mobile
app, how marketers can advertise in order to increase firm’s sales and at the same time relate to
customers.
Mobile phones are widely used and represent a huge marketing research opportunity for
marketers to reach and serve users (Baruçtu, 2007; Grant & O’Donohoe, 2007; Roach, 2009).
6
Marketing strategies can be applied after a comprehensive understanding of why and how
consumers may want to take part in mobile marketing. Smartphones also attract users because of
their add-on and personalization features (Muoio, 2009; Persaud & Azhar, 2012). Knowledge of
consumer preferences towards mobile app features can help app developers and designers to
improve the app characteristics and optimize the consumer’s experience. Moreover, marketers
can gain insight into consumer preference. Furthermore, analytics enhance advertisers’ abilities to
predict the popularity of apps and improve their merchandising, such as in-app ads and in-app
purchases (Ghose & Han, 2014).
In order to answer the research question, this paper is structured as follows. In section two,
past literature will be reviewed and the hypotheses of the paper will be presented. In section three,
the data, its origin and its extraction will be revealed, together with a methodology for creating
two ordered logit models. In the fourth section, the results will be analyzed and the hypotheses
will be tested. Last but not least, in the fifth section, a conclusion of the paper will be drawn,
including limitations, implications and further research possibilities.
Literature Review, Conceptual Framework and Hypotheses
In this section the paper is going to review the concepts of product attributes and characteristics,
and consumer behavior, concentrating on mobile applications, and derive the hypothesis that
follow from the research question.
Product attributes
Product attributes play a big role in consumer purchasing behavior. Several studies state that
physical attributes of a product such as size and color influence how customers perceive it
(Wheatley & Chiu, 1977). Cox (1962) and Gardner (1970), for example, find out that different
colors of ice cream and shirts affect perceptions of flavor and product quality respectively. Thus,
the physical appearance of a product creates the first impression of what it might deliver when
consumed.
Mehrabian and Russell (1974) come up with a framework that analyzes the effects of a
given environment on people’s behavior in that environment (Ha & Lennon, 2010). The authors
7
call this framework the Stimulus Organism Response (SOR) paradigm, which states that internal
states such as pleasure, arousal, and dominance are influenced by physical stimuli of the
environment such as color. The internal states serve as intermediary variables that affect consumer
responses (Mehrabian & Russell, 1974). Earlier studies find out that environmental stimuli in retail
stores and Web sites evoke pleasure and arousal which, on the other hand, resulted in an increase
in customer satisfaction and purchase behavior (Eroglu, Machleit, & Davis, 2003; Fiore, Jin, &
Kim, 2005).
Moreover, internal stimuli can be influence by the physical appearance of the product such
as layout. Ampuero and Vila (2006) investigate the role of packaging on consumer perception.
Packaging is important because it is the first thing that a consumer sees before making a decision
to purchase the product. Moreover, in an economy where self-service is leading, manufacturers
have the complicated task to make the packaging so that it captures the potential buyers’ attention
before brand selection (McDaniel & Baker, 1997).
Packaging may be the most essential element for communicating the product’s benefits
because it reaches many potential buyers who are actively engaged with it when looking for
information about the product (Ampuero & Vila, 2006). Thus, it is crucial to enhance
characteristics such as texts and images, communicate the right product values and achieve an
appropriate visual level (Nancarrow, Tiu Wright, & Brace, 1998).
Product attributes need careful attention as they form the first impression of the consumer.
Same as products in the store, mobile applications have a set of product features and characteristics
that influence users’ perception of the app before downloading it.
Mobile app characteristics
Information technologies and mobile devices are a growing trend. The usage of mobile phones and
tablets is rapidly increasing and there is a constant battle for market share between companies.
However, mobile devices become even more attractive with the addition of personalized features
such as mobile applications. As Wang, Liao and Yang (2013, p.13) state, the mobile app ‘is a new
ICT artifact’.
8
Specifically in the mobile technology context, several studies have used the perceived value
concept in order to research the adoption and usage of mobile technologies. For example, Kim and
Han (2009) investigate what drives the adoption of mobile data services and Kim, Chan and Gupta
(2007) study what motivates the adoption of mobile internet. The findings confirm that customers’
perceived value has an influence on its adoption and the customers’ usage behavior (Wang, Liao,
& Yang, 2013).
As part of their model, Wang et al. (2013) pay attention to functional value, which includes
the ‘utilitarian functions and services that a product can offer’. According to Tzeng (2011), the
value of a product is captured by its attributes such as features which can bring utilitarian
performance. Numerous scholars empirically find that there is a positive relationship between
functional value and consumers’ usage behavior of information systems or mobile services (Turel,
Serenko, & Bontis, 2007; Cheng, Wang, Lin, & Vivek, 2009). Moreover, Wang et al. (2013) find
evidence to support their hypothesis that functional value, thus product features, has a positive
effect on the behavioral intention to use mobile applications.
Ghose and Han (2014) present a theory-based structural model which examines the effect
of various mobile app characteristics and different categories on consumer demand for mobile
applications. The authors present the first formal model app demand estimation which is based on
observing consumers’ app downloading behavior. In their model, Ghose and Han (2014) include
attributes such as the presence of in-app purchases, number of apps by the same developer, number
of previous versions, price etc. The results of the analysis show that app demand increases with
the length of the description of the app, the number of pictures in the description, the number of
days since the app has been launched, and the volume and valence of user reviews. On the other
hand, the results show that app demand decreases with file size (Ghose & Han, 2014). Their
research comes close to what this paper aims to find out. However, this paper aims to conduct a
study only on the number of downloads of free mobile apps from two categories launched in the
Google Play store examining only variables in the description of the mobile app.
9
Description
The description is one of the most crucial elements when trying to influence and increase the
buyer’s likelihood to purchase a product. Consumers usually look for a specific type of information
and try to find it in the descriptive text. It is of interest to see if a longer description positively
affects consumer behavior or if a shorter and more concise description is a better choice. Moreover,
it is intriguing to see if there is a non-linear effect of the description length on the app demand.
Some research has been done on the length of journal texts, titles and abstracts. According
to White and Hernandez (1991) a tendency of longer and more complex titles of articles in journals
has arisen. Yitzhaki (1992, p.436) confirms that there is a trend towards longer texts and finds that
there is also a movement ‘towards more ‘significant’ words in titles of papers’ in various types of
journals for the period of 1940 to 1990. Moreover, in a more recent paper, Yitzhaki (2002)
hypothesizes that the higher number of words in paper titles leads to a higher number of ideas. The
results show that there is a moderate positive relationship between the number of a paper and the
number of words in a paper’s title (Yitzhaki, 2002).
Similar to the description of a product, the title and abstract of an article give an overview
of what the paper will be about. The title of a paper is an essential attribute because it draws the
attention of the reader (Yitzhaki, 2002). Stremersch, Verniers and Verhoef (2007) examine the
effects of domain and title length on the number of citations. On one side, the authors find that
larger domains lead to more citations (King J. , 1987). On the other side, they find no significant
correlation between the title length and the number of citations despite the fact that longer article
titles usually hint higher informativeness (Stremersch, Verniers, & Verhoef, 2007).
Not only do longer texts suggest a higher inflow of information which is presented more
efficiently, but also higher complexity. Gefen, Gefen and Carmel (2015) consider project length
and project success and state that a longer project is more likely to be more exhaustively described.
Moreover, a longer project is more likely to be well understood and more successful (Gefen, Gefen,
& Carmel, 2015). Thus, a longer text has the potential to deliver more information in a more
effective way, as well as bring more value to the customer and positively influence consumer
behavior.
10
Articles are only a small part of the products which text length attribute influences
consumer intentions and consumer behavior. Online stores also rely on elements like text as well
as visuals amongst many other. In an online environment, its layout characteristics are essential
for helping consumers form an opinion. Similar to packaging, texts, such as product descriptions,
and visuals, such as pictures, guide users through the process of building a first impression and
making a purchase decision (Van Rompay, De Vries, & Van Venrooij, 2010).
In a time where mobile applications are shifting the use of online stores, it is of interest to
explore the influence of text length on consumer behavior. Ghose and Han (2014) mention that
textual information enclosed in e-commerce websites affects consumer purchase decision. For
example, a study done by Decker and Trusov (2010) examines the relative effects of product
attributes on the overall evaluation of the products by using text mining. The authors use length of
the description of a mobile app as one of their independent variables and hypothesize there is a
relationship between description length and mobile app demand (Ghose & Han, 2014).
What is more, there is little information about the quadratic relationship between
description length and product demand. However, some studies have been done in a related sphere
of marketing. For example, Ransbotham, Kane and Lurie (2012) examine the relationship between
the number of contributors and content value. The authors find that there is a curvilinear
relationship between the two variables. The most valuable collaborative user-generated content is
generated at a certain number of contributors but not so much that it created information overload
(Ransbotham, Kane, & Lurie, 2012). Similarly, it is expected that after a certain number of lines
of the app description, the marginal utility of consumers will decrease and thus they will not
download apps with descriptions longer than a given threshold.
Literature on product attributes which confines the study of product attributes to mobile
applications is scarce and requires more investigation. Hence, the present study aims at filling
existing gaps in literature by fully exploring the impact of mobile app characteristics on mobile
app demand. Based on the existing literature on the positive and non-linear effects of text length
and number of words on consumer behavior, the following hypotheses are suggested:
H1a: A longer app description has a positive effect on mobile app downloads.
11
H1b: A non-linear relationship exists between the app description and app downloads.
Number of pictures
Another common characteristic that catches the consumers’ attention and helps them form an
opinion about the product is pictorial information.
As mentioned earlier, some scholars argue that internal states such as pleasure and arousal are
likely to influence customer approach behavior and intentions induced by an online store
environment (Wu, Cheng, & Yen, 2008; Ha & Lennon, 2010). Others state that in order to make
a purchase decision online, consumers cannot rely on all their five senses (Finn, Wang, & Frank,
2009). Rather, they are exposed to images and text descriptions, which increase the importance of
powerful web features (Koufaris, 2002).
The online store environment includes high task relevant cues such as online visual
merchandising (VMD) cues. Part of the VMD cues is pictorial information that directly relates to
the shopping goal of the consumer such as pictures of products in the store (Ha & Lennon, 2010).
Not only are customers interested in the product features mentioned in the description, but they
also want to see a visual representation of the product. Eroglu, Machliet and Davis (2001) discover
a potential relationship between the high task cues such as product images and buyers’ internal
states, which, on the other hand, influence consumer actions.
In the online world, the two elements that best represent the offered goods and services are text
and images. Through textual information, the whole description and details can be expressed and
communicated in a compelling manner. Pictures complement text and fill in the gaps for those
who cannot fully imagine how a product or its features look like. Moreover, pictures have an
allurement of their own which can instantly capture the consumers’ attention. Previous literature
has found that images of hotels affect consumer decisions on hotel reservations (Ghose, Ipeirotis,
& Li, 2012).
Similar to online stores, mobile apps often communicate their benefits though screenshots. A
screenshot of what the app looks like when downloaded delivers useful information and insight to
the consumer. It is also one of the main ways to capture the consumer’s attention and influence
12
their decision to download the app. Ghose and Han (2014) find a relationship between the number
of screenshots in the description of the mobile app and app demand.
Concluding from the existing literature, the expectation of the results is a positive correlation
between the number of screenshots and app demand. Comparable to description length, the number
of pictures is also thought to have a non-linear effect on app demand, since after a certain level of
screenshots, users get overloaded with pictures and their marginal utility decreases, leading to less
app downloads. Therefore, the second set of hypotheses of the paper are:
H2a: A higher amount of pictures has a positive effect on mobile app downloads.
H2b: A non-linear relationship exists between the number of pictures and app downloads.
WOM
Word of Mouth (WOM) is a key part for the success story of every product or brand. Scholars
agree that WOM is a powerful marketing tool and that is has a great impact on consumers
compared to other ways of marketing communication (Day, 1971; King, Racherla, & Bush, 2014).
Bass (1969) is among the first to look at how WOM was used to spread new information about a
product among non-adaptors in his diffusion model (Hu, Pavlou, & Zhang, 2006).
Although it is a vigorous means of communicating information, there have been equivocal
results about the impact of WOM on sales and consumers’ decisions. The majority of the literature
argues that word of mouth has a positive effect on consumer behavior and market outcome (Feick
& Price, 1987; Bowman & Narayandas, 2001; Anderson & Salisbury, 2003; Liu, 2006; Davis &
Khazanchi, 2007; Chen, Fay, & Wang, 2011). According to Katz and Lazarsfeld (1955) WOM has
the highest share of importance in having an impact on purchasing behavior of household hoods
and food. However, Van den Bulte and Lilien (2001) review the work of Coleman, Katz and
Menzel (1966) and find that it is not WOM that plays a main role in the adoption of tetracycline
among physicians, but marketing efforts are (Duan, Gu, & Whinston, 2008). Concluding from past
literature, it is more likely that WOM is a driver of product sales and customer purchase behavior.
With the vast development and implementation of information and communication
technologies, WOM has turned into a growing social phenomenon. With the help of the Internet,
13
consumers are forming communities where they share and ask for each other’s experiences on
different companies, products and services (Awad & Zhang, 2006). An increasing traffic is seen
on message boards, forums and other online sources of customer generated media, where
individuals seek communication with people outside their close circle (Dwyer, 2007). This ability
to interchange ‘opinions and experiences online is known as online word of mouth’ (eWOM), or
as others call it ‘buzz’ (Liu Y. , 2006) or ‘word of mouse’ (Dellarocas, 2003; Davis & Khazanchi,
2008, p. 130).
In an economy where self-service is leading, electronic WOM is becoming a popular and
important source of information for individuals. With the growth of communication technologies,
the scale and scope of WOM communication have drastically increased (Hu, Pavlou, & Zhang,
2006). The difference between digital WOM and traditional WOM is that online WOM takes place
in an anonymous online environment which allows customers to easily express both their negative
and positive opinions (Chatterjee, 2001). However, the advantage eWOM has is that it can reach
a high amount of consumers faster than traditional WOM (Davis & Khazanchi, 2008). Digital
WOM has important implications for marketers and managers because it can help firms with
product development, brand awareness and customer acquisition and retention (Hu, Pavlou, &
Zhang, 2006).
Online customer reviews (OCRs) are a form of online WOM and can be divided into two
segments – quantitative and qualitative (Sridhar & Srinivasan, 2012). Qualitative OCRs are
customer reviews which provide a text description of an experience or opinion. Quantitative OCRs
are customer ratings and summarize a consumer’s opinion into a single grade or rating, usually
pooled together into a summary statistic (Kostyra, Reiner, Natter, & Klapper, 2015). Users are
supplied with an excessive amount of product information over the Internet, which leads the
assumption that eWOM can have influence on consumer purchasing behavior and thus product
sales. However, there is little research on how such a relationship can be used to help firms gain
business advantage (Awad & Zhang, 2006).
OCRs influence consumers in two ways. Firstly, WOM can have an impact on consumers’
perception on product quality, which phenomenon is similar to the persuasive effect in advertising
literature. Duan, Gu and Whinston (2009) reveal that 22% of CNET users sort products by user
14
ratings. Secondly, based on previous research, reviews and ratings have a positive effect on product
sales (Duan, Gu, & Whinston, 2008).
Consumers highly rely on WOM and some authors suggest that it will replace traditional
advertising (Awad & Zhang, 2006). Empirical evidence suggests that there is a connection between
online WOM and sales (e.g. Vermeulen & Seegers, 2009; Zhu & Zhang, 2010). Numerous scholars
have investigated the impact of eWOM on product sales (Chatterjee, 2001; Chen, Fay, & Wang,
2004; Dellarocas, Awad, & Zhang, 2004; Godes & Mayzlin, 2004; Liu, 2006; Duan, Gu, &
Whinston, 2008; Forman, Ghose, & Wiesenfeld, 2008). However, a meta-analysis performed by
Floyd, Freling, Alhoqail, Cho and Freling (2014) adquately demonstrates that the resutls are
mixed. Some of the academic papers emphasize on the significant effect of WOM on product sales
and consumer decision making processes (Chen, Fay, & Wang, 2004), whereas others suggest that
the impact is negligible (Godes & Mayzlin, 2004; Liu, 2006; Duan, Gu, & Whinston, 2008) or
context dependent (Chatterjee, 2001, Li & Hitt, 2008). Although collectively this literature
provides a valuable insight within the context of online reviews and their impact, getting a better
grasp of the effects of OCRs depends on investigating the variation introduced by such differences.
Volume (number of reviews and number of ratings)
According to Lui (2006), volume represents the total amount of WOM interactions, meaning the
number of reviews (or comments from reviewers) and the number of ratings of a specific product
or service. Three main findings occur when examining the existing literature on volume of WOM.
Firstly, academics find that volume increases brand and product awareness (Awad & Zhang,
2006). Secondly, the majority of the literature also states that there is a positive relationship
between volume and product sales. Last but not least, some scholars find that there is no or
negligible effect of volume on sales.
The higher the number of product reviews online, the bigger the chance other consumers
will become aware of the product reviewed (Awad & Zhang, 2006). Thus, more online
conversations about a product lead to an increased awareness resulting in a change in sales
(Dellarocas, Zhang, & Awad, 2004; Godes & Mayzlin, 2004; Alvarez, Martin, & Casielles, 2007;
Davis & Khazanchi, 2008; Duan, Gu, & Whinston, 2008). For example, providing information
15
about a book’s characteristics can push consumers towards purchasing this book. Marketing
theorists, such as Keller (1993), would relate the review’s informative attribute to product or brand
awareness, and awareness is a key variable in the consideration set model of consumer decision
making.
Consumer awareness of a firm’s products contributes to the company by increasing overall
sales. Volume is said to create awareness amongst users, thus it should also be connected to the
increase of product sales. Over the past several years, a growing body of literature has emerged on
the impact of eWOM volume on sales. Some scholars suggest that the number of comments and
reviews influences the sales of a product (Godes & Mayzlin, 2004; Awad & Zhang 2006; Liu,
2006; Amblee & Bui 2007; Duan, Gu, & Whinston, 2008). Others find evidence that OCRs
significantly affect sales elasticity (Floyd, Freling, Alhoqail, Cho, & Freling, 2014). Another set
of academics find that purchasing decisions are highly influenced by eWOM (Mayzlin &
Chevalier, 2003; Godes & Mayzlin, 2004; Bounie, Bourreau, Gensollen, & Waelbroeck, 2005; Liu
2006). In the technology and mobile sector particularly, it is interesting to examine what the
relationship between digital WOM and number of downloads or app demand will be. Chia,
Yamamoto, & Asokan (2012) find that there is a strong correlation between the number of ratings
a mobile app has and its popularity. It is of interest for this paper to examine if digital WOM, both
customer reviews and ratings, also influences app demand.
WOM can be critical for building the demand for a product (Eliashberg, Elberse, &
Leenders, 2006). However, although an increase in the online reviews is highly correlated with an
increase in the buzz around the product, it is not certain that all products with user comments will
have increased sales (Davis & Khazanchi, 2008). There is also evidence that volume itself is
insufficient (Chintagunta, Gopinath, & Venkataraman, 2010) or with little persuasive effect for
movie sales (Duan, Gu, & Whinston, 2008).
Stemming from a thorough analysis of the existing literature and mixed results, it is of
interest to know what impact volume of online WOM has in the mobile technology industry. More
specifically, this paper focuses on mobile applications, thus the third hypothesis is as follows:
H3: A higher volume of online WOM positively affects mobile app demand.
16
3a: A higher number of consumer reviews has a positive effect on mobile app downloads.
3b: A higher number of consumer ratings has a positive effect on mobile app downloads.
Valence (average rating)
Valence is defined as the average rating of a product (Awad & Zhang, 2006). Ratings usually range
from a score of 0 to 5. However, the scale varies across different online marketplaces. As reviewed
by many, there is an emerging body of literature on the impact of valence on sales and consumer
purchasing behavior (Amblee & Bui, 2007). Ratings can be seen in websites reviewing movies,
games, even mobile applications. Although ratings have a straight-forward meaning, they still
interrupt user behavior (Dellarocas & Narayan, 2006). Moreover, there is a similarity between the
rating perception in apps and movies, as users perceive them as either very good or very bad
(Girardello & Michahelles, 2010).
Similar to volume, researchers have found that there are mixed results on the impact of
valence on sales. Most studies account for a significant positive effect of valence (Dellarocas,
Zhang, & Awad, 2004; Chevalier & Mayzlin, 2006; Clemons, Gao, & Hitt, 2006; Li & Hitt, 2008;
Dhar & Chang, 2009; Chintagunta, Gopinath, & Venkataraman, 2010; Cui, Lui, & Guo, 2012;
Sun, 2012; King, Racherla, & Bush, 2014). A one point increase in online consumer ratings for
video games, for example, increases video games sales by 4% (Zhu & Zhang, 2006). Kostyra,
Reiner, Natter and Klapper (2015) argue that valence reflects overall product quality and thus has
a positive impact on customer choice probability. Chen and Singh (2001) propose that the
importance of ratings is increasing because they help the community make decisions. Some
evidence suggests that out of all eWOM attributes, valence is the best predictor of sales
(Dellarocas, Awad, & Zhang, 2004).
On the other hand, a vast amount of literature also reaches the conclusion that online
consumer ratings have no or little impact on sales. For example, some studies show that valence
does not have an effect on product sales (Chen, Wu, & Yoon, 2004; Amblee & Bui, 2007; Davis
& Khazanchi, 2007; Amblee & Bui, 2011). Others conclude that valence has no predictive powers.
Ho-Dac, Carson and Moore (2013) reveal that valence increases the sales of weak brands, but has
no effect on the sales of strong brands (Ho-Dac, Carson, & Moore, 2013). Online consumer
17
reviews of books on Amazon.com do not affect book sales. These results imply that although
consumers are influenced by the awareness effect caused by WOM, they are not affected by the
persuasive effect of WOM (Duan, Gu, & Whinston, 2008).
When it comes to the mobile application marketplace, the situation can look a bit different.
Previous research has analyzed the effects of valence mostly on tangible products. Mobile
applications, however, differ from tangible products in two ways. First, most of the applications
are either a few dollars or free, with a revenue stream based on advertisements. Second, mobile
apps offer customers a free trial of the product before purchasing the whole version of the app.
These two differences represent the intangible nature of the mobile application market, which can
question the traditional assumptions of the effect of valence on product demand as there is little or
no financial interest to protect. Hyrynsalmi, Suominen, Seppänen and Määkilä (2013) find a
relationship between a high average of ratings and sales improvements. Others say that online user
ratings establish consumer’s net utility and willingness to pay in the mobile app market (Hao, Li,
Tan, & Xu, 2011).
In another paper, Hyrynsalmi and co-authors (2012) examine the relation between average
ratings and paid app downloads, as they assume that ratings are less relevant for free apps because
it is easier to download them than to go through the description. The authors find a significant
small negative correlation between valence and paid app downloads (Hyrynsalmi S. , Suominen,
Mäkilä, & Knuutila, 2012). The view is supported by the model of Lee and Raghu (2011) where
they suggest that valence is not likely to be influential to the sales performance. Similarly, Chia,
Yamamoto and Asokan (2012) find a weak negative correlation between average rating and app
popularity. Contradictory to the findings above, Pagano and Maalej (2013) find that higher ratings
lead to higher rank in ‘top lists’, which further results in higher download numbers.
Despite the extended literature review, no research has been conducted on the effect of
online user rating on free app download numbers. Hyrynsalmi, Suominen, Mäkilä and Knuutila
(2012) review the correlation between valence and paid apps, but the results for free apps might
be different because there is little financial interest to protect. This leads to the next hypothesis of
this paper:
H4: A higher valence positively affects mobile app demand.
18
Size
Characteristics vary with products but the most common are color, size and shape. With the
development of the mobile industry and the introduction of more sophisticated apps, the file size
of an app tends to increase. File size can increase because the application is more complex, it
conveys a higher amount of information, and graphics become more complicated and heavy.
However, the larger the size of the mobile app, the more time it takes to download and thus the
less comfortable it is for a consumer to download it. Nowadays, individuals use their phones
because they want to be efficient and spend their time in an effective way.
Mobile app file sizes vary with the different categories of apps. Lee and Raghu (2011)
examine top 300 apps in the US Apple store and they find that the average size of an app is 21.92
megabytes with a standard deviation of 71.76 megabytes.
There is little amount of research that has been conducted examining the effect of app size
on consumer behavior. Some find that the file size of mobile applications is positively correlated
with app sales (Lee & Raghu, 2011). Others show that there is an adverse effect between app size
and consumer’s app purchase decisions (Ghose & Han, 2014), and app size and bestseller rank
(Carare, 2012). Results demonstrate that a 10% increase in file size lead to a 1.1% decrease in app
demand, whereas a 10% increase in description length and adding one more screenshot lead to a
2.3% and 4.2% increase in app demand. Thus, app developers should consider providing enough
textual and visual information to customers in order to increase app demand (Ghose & Han, 2014).
Following prior research, longer wait times negatively relate to consumer behavior.
Nevertheless, it is of interest to observe what the effect of file size is on app demand, when all the
above-mentioned product characteristics are included as well. Thus, the fifth hypothesis is:
H5: A larger size of the app has a negative effect on mobile app downloads.
Product age
In everyday conversations, one can learn that usually an individual perceives a more mature
product (or higher product age) as a product with better quality. For example, some people identify
wine vintage (age) with better wine quality (Jackson, 2008) and also higher price (María Angulo,
19
María Gil, Gracia, & Sánchez, 2000). Moreover, a longer stay on the market can lead to higher
product awareness.
In the mobile technologies industry, the consumer’s perceptions are often not that different.
Whenever a new product or service comes out, sometimes consumers are hesitant in the beginning
to use or purchase it because they are afraid of experiencing unnoticed by the manufacturer
failures. Mobile applications are an example of a product, which age can affect consumer behavior.
App age is a product characteristic based on the number of days since the app was first
launched. Some scholars state that there exists a relationship between app age and app demand.
For example, Ghose and Han (2014) find a positive correlation between app age and app demand.
The results show that a 10% increase in the age of an app leads to a 1.7% increase in app demand.
Moreover, the authors discover that app age has a positive non-linear effect (Ghose & Han, 2014).
Carare (2012) finds that an increase in app age will result in a higher bestseller rank. Interestingly,
Bigné, Ruiz-Mafé and Sanz-Balz (2007) discover that age acts as a primary predictor of adoption
behaviors (Taylor & Levin, 2014). A positive relationship might exist because of the increased
awareness effects. Overall, results show that the maturity of apps plays an important role in
consumer’s app usage decisions (Ghose & Han, 2014).
However, other researchers report that age might have a negative effect on the dependent
variable. One side of the research shows that product app age has a negative association with
survival (Greenstein & Wade, 1998; Sorenson, 2000; Ruebeck, 2002; de Figueiredo & Kyle, 2006;
Khessina & Carroll, 2008; Jung, Baek, & Lee, 2012). Another side of the research exhibits that
app age has a small negative correlation with app utility (Kim, 2012).
Most of the literature researches either the effect of paid apps, or the effect of apps on utility
and bestseller rank. A prospective opportunity exists to examine the effect of size of free mobile
apps on the app demand, which leads to the sixth hypothesis of this paper:
H6: An older app will have more mobile app downloads than a younger app.
20
Video
The characteristics of experience goods are hard to examine for customers before they have
purchased the product. A type of information asymmetry occurs when a brand lacks the skills
necessary to provide high quality but yet claims to possess those skills (Mishra, Heide, & Cort,
1998; Eisenhardt, 1989). One possible solution is signaling (Kirmani & Rao, 2000). Thus, firms
use different kinds of signals in order to inform their potential customers about the existence,
characteristics and prices of the commodities they offer (Milgrom & Roberts, 1986). Quality
signals can be transferred in many different ways including advertising expenditures (Kirmani &
Rao, 2000). However, the analysis does not only apply to advertising expenditures, but any kind
of observable expenditure that does not directly provide information (Milgrom & Roberts, 1986).
With experience goods, Nelson (1970, 1974, 1978) explains that important elements of the
product’s quality are very hard to impossible to verify with the exception of actually using the
product. Therefore, the customer will not be directly informed of what he/she is buying which
makes the seller’s claims to be offering a high quality product unverifiable before purchase.
However, a key quality signal to customers is the simple fact that an experience good, such as a
mobile application, is advertised. Nelson focuses to provide a linkage with repeat purchases
because a high quality product is more likely to entice repeat purchases. Moreover, an initial sale
is of more value to a high quality brand which is willing to spend more money on advertising or
other types of enhancing the product’s popularity and quality deliverable characteristics, such as
provide a video, a longer description or more pictures in the case of mobile apps (Milgrom &
Roberts, 1986). Customers who are rational will realize that a brand will not spend money on
advertising or enhancing product characteristics unless the quality-related claims made by the firm
incurring such costs are actually true (Kirmani & Rao, 2000). Thus, there may be a relationship
between including an expenditure, or in otherwise providing a video in the description of an app,
and the app demand, leading to the seventh hypothesis of this paper:
H7: The presence of a video will increase mobile app demand.
21
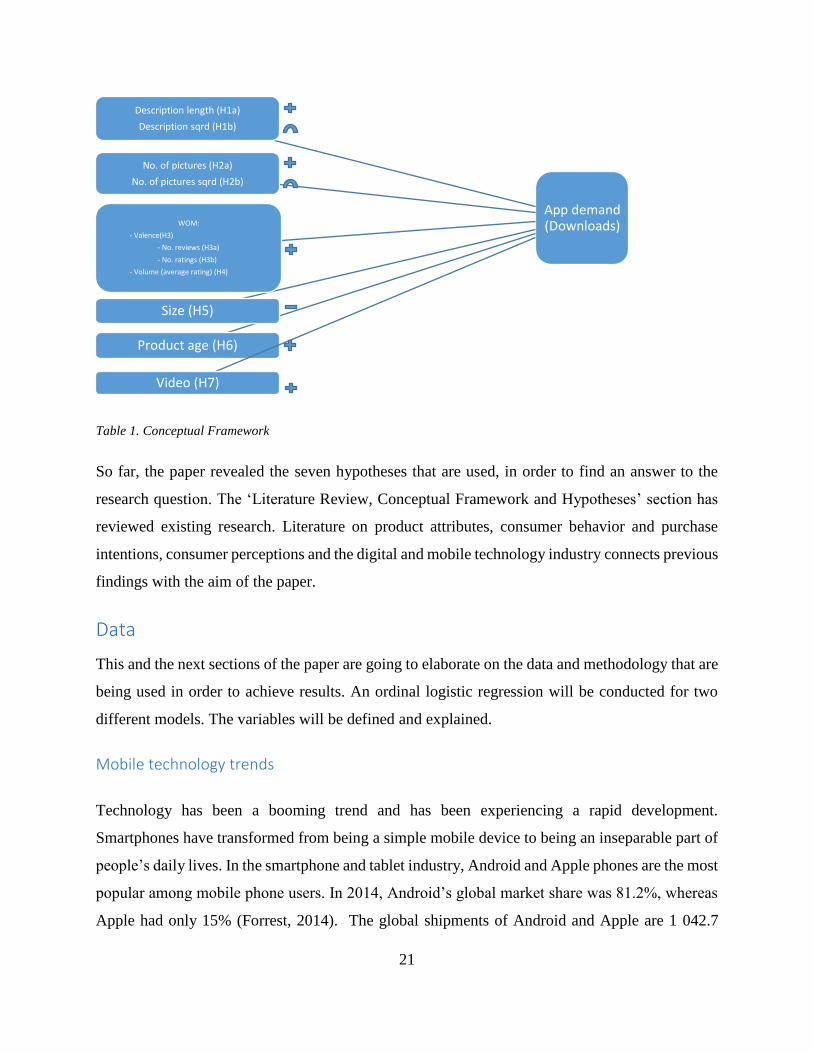
Table 1. Conceptual Framework
So far, the paper revealed the seven hypotheses that are used, in order to find an answer to the
research question. The ‘Literature Review, Conceptual Framework and Hypotheses’ section has
reviewed existing research. Literature on product attributes, consumer behavior and purchase
intentions, consumer perceptions and the digital and mobile technology industry connects previous
findings with the aim of the paper.
Data
This and the next sections of the paper are going to elaborate on the data and methodology that are
being used in order to achieve results. An ordinal logistic regression will be conducted for two
different models. The variables will be defined and explained.
Mobile technology trends
Technology has been a booming trend and has been experiencing a rapid development.
Smartphones have transformed from being a simple mobile device to being an inseparable part of
people’s daily lives. In the smartphone and tablet industry, Android and Apple phones are the most
popular among mobile phone users. In 2014, Android’s global market share was 81.2%, whereas
Apple had only 15% (Forrest, 2014). The global shipments of Android and Apple are 1 042.7
App demand (Downloads)
No. of pictures (H2a)
No. of pictures sqrd (H2b)
Description length (H1a)
Description sqrd (H1b)
Product age (H6)
Size (H5)
WOM:
- Valence(H3)
- No. reviews (H3a)
- No. ratings (H3b)
- Volume (average rating) (H4)
Video (H7)
22
million and 192.7 million units respectively for 2014 (Price, 2015). For the first quarter of 2015,
studies show that Android’s market share has fallen to 78%, whereas Apple’s global market share
has risen to 18.3% (IDC, 2015). Nevertheless, Android remains a market leader when looking at
market share and units sold. Therefore, the paper will concentrate on Android mobile phones.
Android’s mobile application store is called Google Play and is a ‘database of available
apps that allows the user to discover, download and install new apps onto their device’ (Wong,
2012; Magrath & McCormick, 2013, p.117). Android store is the world’s largest store for mobile
apps with 1.4 million applications available compared to the Apple store which has 1.2 million
applications as of May 2015 (Smith, 2015). Moreover, in July 2013 Google Play exceeded the
cumulate amount of 50 billion app downloads (Thornton, 2013). However, the total number of
apps available in the Google Play store is almost 1.6 million up to date (Number of Android
Applications, 2015). This amount of apps is achieved by 388 000 developers (Smith, 2015).
Two classes of apps exist – free and paid. Free apps are simplified versions of paid apps
and most of the times they display advertisements. Some developers have a preference towards
releasing free apps because they can collect profits from advertising (Carare, 2012). This paper is
going to examine mobile apps which are free in the Google Play store in the Netherlands.
Android’s share of free apps amounts at nearly 80% compared to the 60% of the Apple store for
2013 (Forrest, 2014). Developers may be choosing to launch their applications for free on the
Google Play store because Apple has a higher commission fee for every download.
Of interest are two categories of mobile apps – Games and Health and Fitness. Games was
one of the largest categories in Google Play in terms of device installs as of September, 2014,
resulting in 37% of all device installs in the whole store. Moreover, in the Top Overall section,
nearly 50% of the applications were games, generating 92% of the revenue for Google Play
(Mobile Apps in Numbers - Statistics and Trends, 2014). Thus, Games is a suitable choice for the
analysis of the research question because it is a widespread category, used by a diversified crowd
of people. Health and Fitness, on the other hand, is a growing category with a more narrowed set
of users. Nevertheless, the mHealth apps have more than doubled in the Apple and Android stores
for 2013 and 2014, reaching over 100 000 apps (research2guidance, 2014). Therefore, mHealth
applications are of interest because they are a rather small market but they are rapidly expanding.
23
Sample
Sample for the regression models is attained from a mobile analytics website called AppAnnie,
consisting of a variety of mobile app data. The data set is collected for the two app categories
mentioned above – Games and Health and Fitness. The first 300 free mobile applications on the
Dutch market are examined from both categories in the Google Play store. The data set includes
cross-sectional data that has been gathered over the period of 5th April 2015 until 14th May 2015
for a specific date, which is the 5th April 2015.
Variables
Dependent variable
An exhaustive list of app characteristics, which are provided to consumers when browsing the
Google Play store, is captured by the regression models. Dependent variable is mobile app demand
which is measured by app downloads. Since public data does not include the exact number of
downloads for a given app, download ranges are used instead. The lowest range (1) varies from
100 to 500 downloads and the highest range (13) varies from 100 000 000 to 500 000 000
downloads.
Independent variables
Independent variables are the app characteristics which are observed by the consumer while
looking at the app description, such as description length (description), number of pictures
(pictures), size of the app (size), number of ratings (ratings), average rating (average rating),
number of reviews (reviews) and launch date of the first version of the app (age). All of the
variables are continuous with the exception of average rating and video which are categorical. The
definition of the independent variables can be seen in Table 2. For description the number of lines
in the text description of the app is counted as they appear in the AppAnnie website. Number of
pictures exhibits the number of screenshots. It has been proven that information extracted from
images of hotels affects consumer decisions on hotel reservations (Ghose, Ipeirotis, & Li, 2012).
For both description length and number of pictures the non-linear effect is looked at, and thus two
new variables arise – description sqrd and pictures sqrd. Size represents the size of the app in
24
megabytes (MB). Ghose and Han (2014) state that with time, apps tend to increase in size which
also increases download time. The number of ratings the app has received is measured by ratings.
In Table 5, the coefficient for ratings is scaled by dividing the number by 1 000 000 in order to
receive an easier to review result. Moreover, the average rating is the score that users give to an
app representing how much they like or dislike it. The rating system in Google Play is on a 5-point
Likert scale, where 5 stars mean ‘very good’. Reviews consist of the number of comments the app
has received. Volume (ratings and reviews) and valence (average rating) control for word of
mouth effects. Next, the age of an app is measured by the difference between the launch date of
the app and the reference date – 5th April 2015. According to Ghose and Han (2014) a relationship
between age and app demand may exist because of awareness effects. The last independent
variable is the presence of video (video). Innovative variables such as a video presentation should
boost app demand (Luna-Nevarez & Hyman, 2012). Table 2 further explains each one of them.
Type of variable Variable description
Dependent variable
App Demand
Category of number of downloads/download range Categorical variable 1 if range in “100 – 500” 2 if range in “500 – 1 000” 3 if range in “1 000 – 5 000” 4 if range in “5 000 – 10 000” 5 if range in “10 000 – 50 000” 6 if range in “50 000 – 100 000” 7 if range in “100 000 – 500 000” 8 if range in “500 000 – 1 000 000” 9 if range in “1 000 000 – 5 000 000” 10 if range in “5 000 000 – 10 000 000” 11 if range in “10 000 000 – 50 000 000” 12 if range in “50 000 000 – 100 000 000” 13 if range in “100 000 000 – 500 000 000”
Independent variables
Description length Number of lines of the description of an app in AppAnnie Continuous variable Absolute number
Description squared Number of lines of the description of an app in AppAnnie squared Continuous variable
25
Absolute number
Number of pictures Number of pictures in the description of an app in AppAnnie Continuous variable Absolute number
Pictures squared
Number of pictures in the description of an app in AppAnnie squared Continuous variable Absolute number
Number of reviews Number of comments posted for an app in the Google Play store Continuous variable Absolute number
Number of ratings Number of ratings an app received Continuous variable Absolute number
Average rating Average rating of an app Categorical variable 1-5 Likert scale, 1 if “very bad”, 5 if “very good”
Size
Size of the app in megabytes (MB) Some sizes varied across devices. In such cases, the data was extracted from an HTC One M7 with Android operating system. Continuous variable Absolute number
Age
Number of days since it has first been released as of 14th May 2015. Continuous variable Absolute number
Video
Is there a demo video of the app in the description? Categorical variable Dummy variable 1 if “Yes”, 0 if “No”
Table 2. Description of variables
26
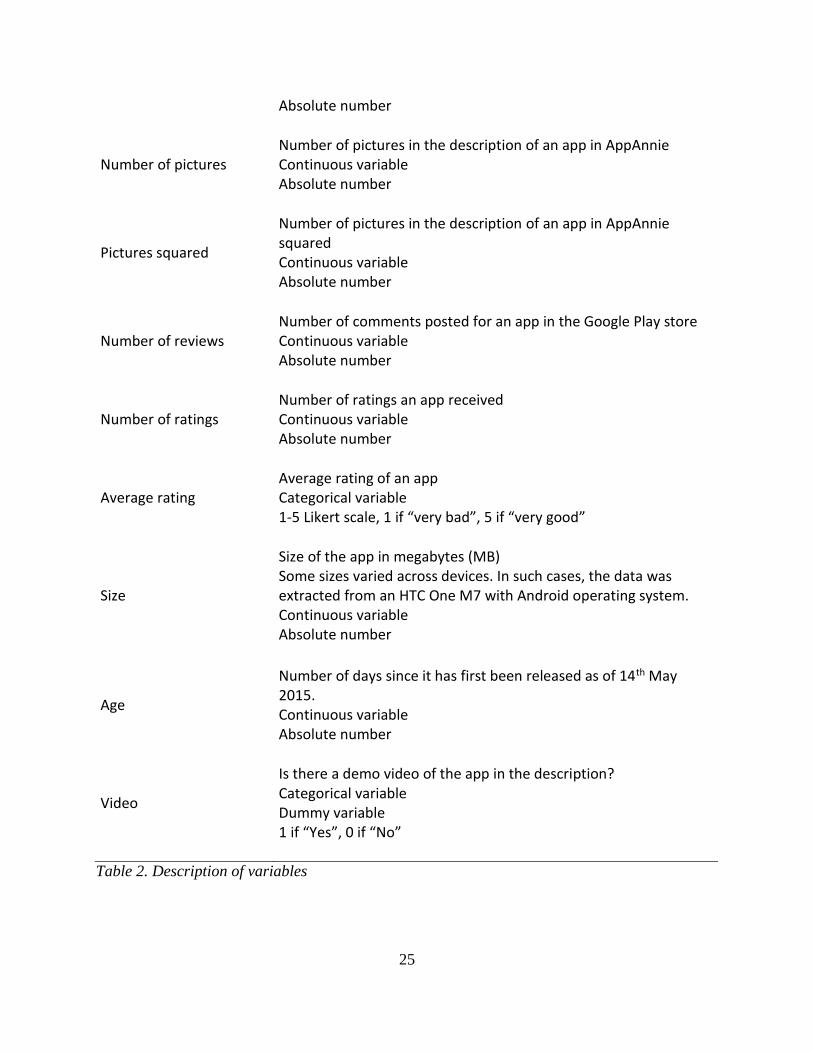
Picture 1. A screenshot of a Games app – number of pictures and presence/absence of video
(AppAnnie, 2015)
Picture 2. A screenshot of a Health and Fitness app – initial release date, average ratings, number
of ratings, size and downloads (AppAnnie, 2015)
27
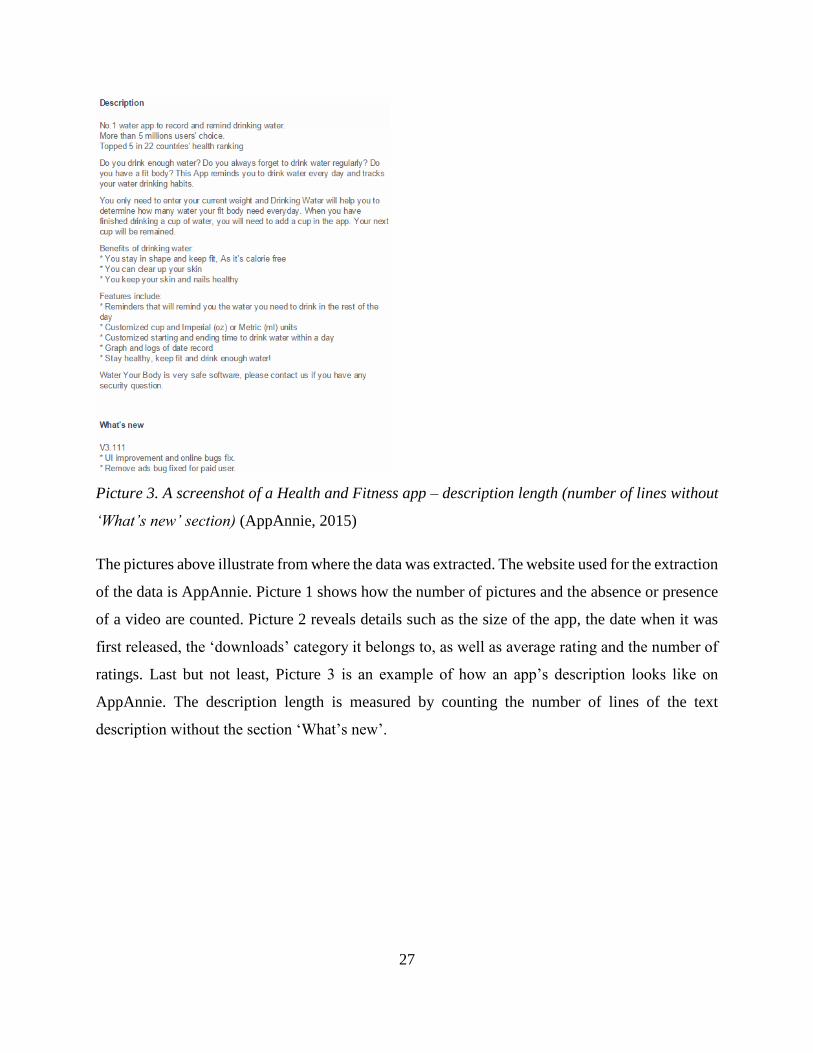
Picture 3. A screenshot of a Health and Fitness app – description length (number of lines without
‘What’s new’ section) (AppAnnie, 2015)
The pictures above illustrate from where the data was extracted. The website used for the extraction
of the data is AppAnnie. Picture 1 shows how the number of pictures and the absence or presence
of a video are counted. Picture 2 reveals details such as the size of the app, the date when it was
first released, the ‘downloads’ category it belongs to, as well as average rating and the number of
ratings. Last but not least, Picture 3 is an example of how an app’s description looks like on
AppAnnie. The description length is measured by counting the number of lines of the text
description without the section ‘What’s new’.
28
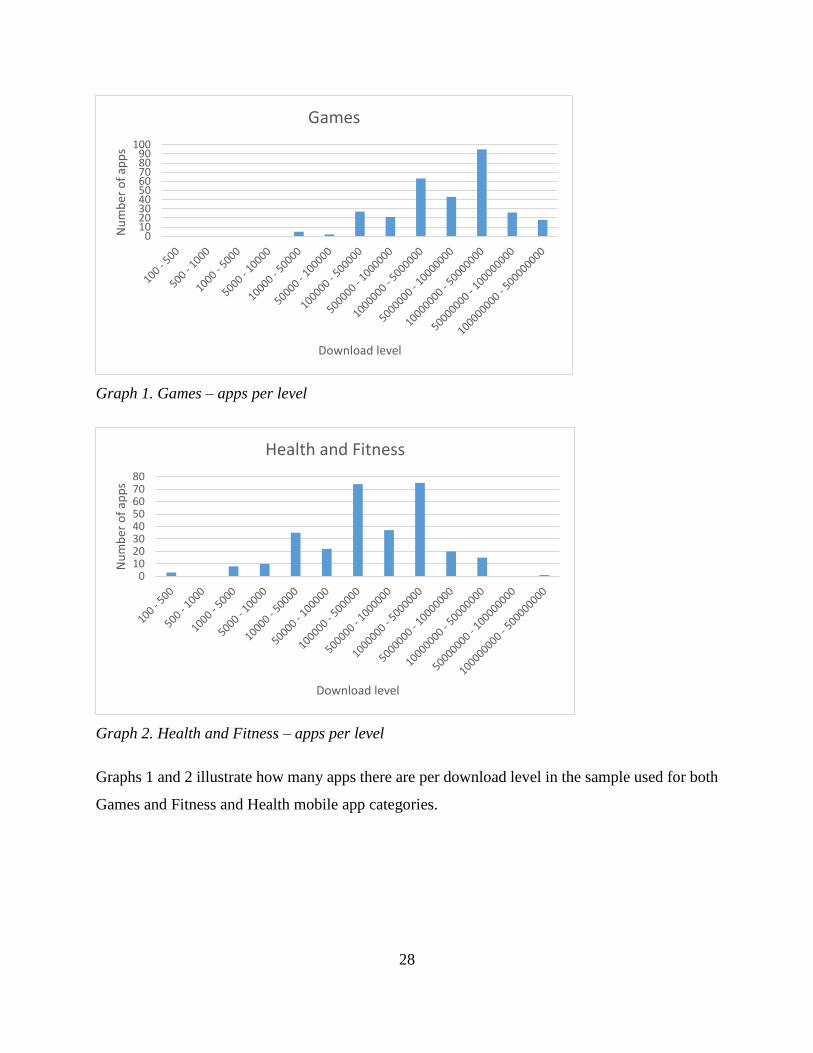
Graph 1. Games – apps per level
Graph 2. Health and Fitness – apps per level
Graphs 1 and 2 illustrate how many apps there are per download level in the sample used for both
Games and Fitness and Health mobile app categories.
0102030405060708090
100
Nu
mb
er o
f ap
ps
Download level
Games
01020304050607080
Nu
mb
er o
f ap
ps
Download level
Health and Fitness
29
Methodology
Since the dependent variable is ordinal, a linear regression will not be a suitable way to conduct
the present research. The drawback of multinomial regression model when having an ordinal
categorical variable is that the ordering of the categories is ignored (Benoit, 2012). An ordinal
variable is a variable which has a meaningful order, but no metric distance characteristics
(Janssens, Wijnen, De Pelsmacker, & Van Kenhove, 2008). For ordinal scales, it is best to use
methods that are more complex such as ordinal regression models. Thus, for testing the hypotheses
an ordinal logistic regression will be applied using the statistical tool SPSS.
The ordinal logistic regression allows to draw conclusions about how app downloads are
affected by the mobile app’s product attributes in the description. The significance and the
coefficients of the independent variables are used to estimate the effect of app description
characteristics on app downloads. The regression reveals the effect of one unit increase or decrease
of the independent variables on the odds of the dependent variable having a higher or lower value.
The most commonly used values for a significance level in statistical research are 1%, 5% and
10% (Lavrakas, 2008). This paper will use a significance level of 5%. Coefficients significant at a
10% significance level will be said to be partially significant. The summarized results of the ordinal
regression can be found in Table 7.
In the paper, two models will be used in order to test the hypotheses. The first model tests
the characteristics of Games mobile applications. The second model tests the characteristics of
Health and Fitness mobile applications. In order to understand how well the variables explain the
models, there are three choices for a suitable fit for the models. Cox and Snell’s and McFadden’s
R-squared are based on the log-likelihood of the model and the log-likelihood of the original
model, and the sample size. However, Field (2009) states that these statistics never reach their
theoretical maximum of 1. Therefore, the author introduces Nagelkerke’s R-squared and thus, the
interpretation of the results will be based on it as well (Field, 2009).
Last but not least, in order to follow how app demand is influenced by different variables,
the following equations (equation (1) and equation (2)) are worth mentioning:
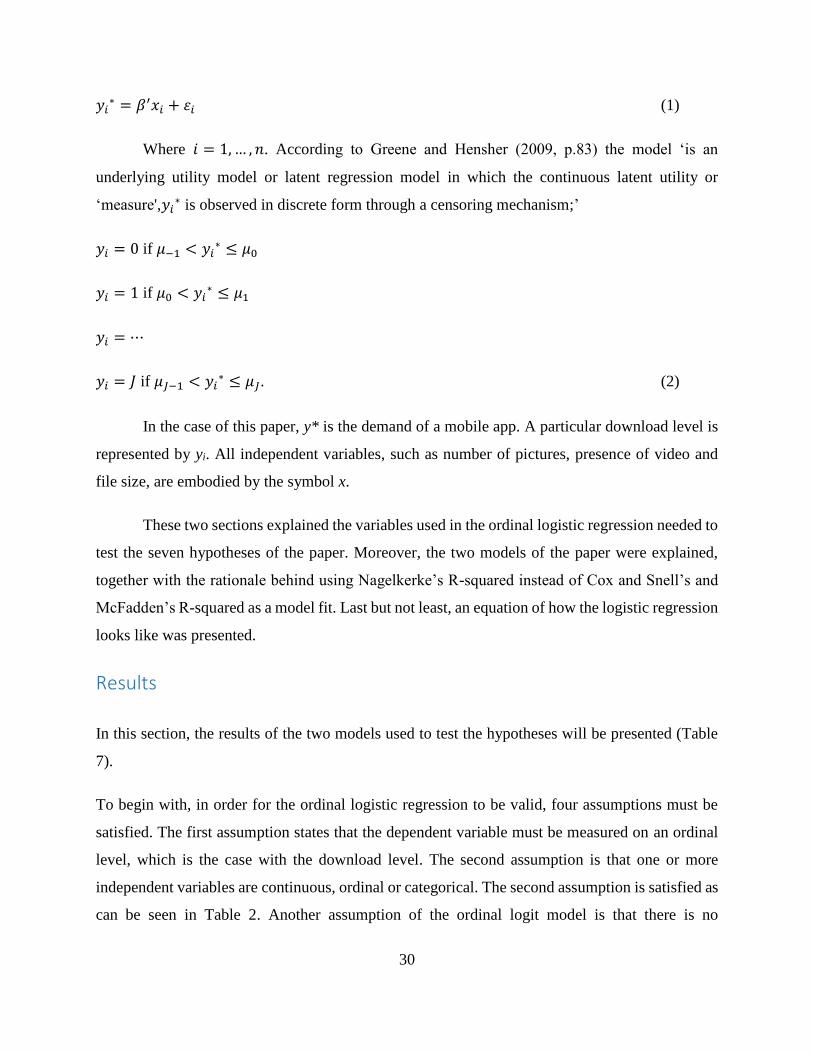
30
𝑦𝑖∗ = 𝛽′𝑥𝑖 + 𝜀𝑖 (1)
Where 𝑖 = 1,… , 𝑛. According to Greene and Hensher (2009, p.83) the model ‘is an
underlying utility model or latent regression model in which the continuous latent utility or
‘measure',𝑦𝑖∗ is observed in discrete form through a censoring mechanism;’
𝑦𝑖 = 0 if 𝜇−1 < 𝑦𝑖∗ ≤ 𝜇0
𝑦𝑖 = 1 if 𝜇0 < 𝑦𝑖∗ ≤ 𝜇1
𝑦𝑖 = ⋯
𝑦𝑖 = 𝐽 if 𝜇𝐽−1 < 𝑦𝑖∗ ≤ 𝜇𝐽. (2)
In the case of this paper, y* is the demand of a mobile app. A particular download level is
represented by yi. All independent variables, such as number of pictures, presence of video and
file size, are embodied by the symbol x.
These two sections explained the variables used in the ordinal logistic regression needed to
test the seven hypotheses of the paper. Moreover, the two models of the paper were explained,
together with the rationale behind using Nagelkerke’s R-squared instead of Cox and Snell’s and
McFadden’s R-squared as a model fit. Last but not least, an equation of how the logistic regression
looks like was presented.
Results
In this section, the results of the two models used to test the hypotheses will be presented (Table
7).
To begin with, in order for the ordinal logistic regression to be valid, four assumptions must be
satisfied. The first assumption states that the dependent variable must be measured on an ordinal
level, which is the case with the download level. The second assumption is that one or more
independent variables are continuous, ordinal or categorical. The second assumption is satisfied as
can be seen in Table 2. Another assumption of the ordinal logit model is that there is no
31
multicollinearity, which happens when two or more independent variables are highly correlated
with each other. This assumption will be tested further in the paper with a correlation matrix. Last
but not least, the assumption of proportional odds exists, which is satisfied when each independent
variable has an identical effect at each cumulative split of the dependent variable of the ordinal
regression (Ordinal Regression using SPSS Statistics, 2015). The last assumption will also be
tested below through the test of parallel lines in SPSS. However, the test for the proportional odds
assumption has been considered anti-conservative, meaning that it nearly always results in the
rejection of the assumption (Using Statistical Regression Methods in Educational Research, 2015;
O’Connell, 2006). Some say it is because the number of independent variables is large (Brant,
1990) or because one of the independent variables is continuous (Allison, 1999). Others state that
a reason can be large sample size (Clogg & Shihadeh, 1994).
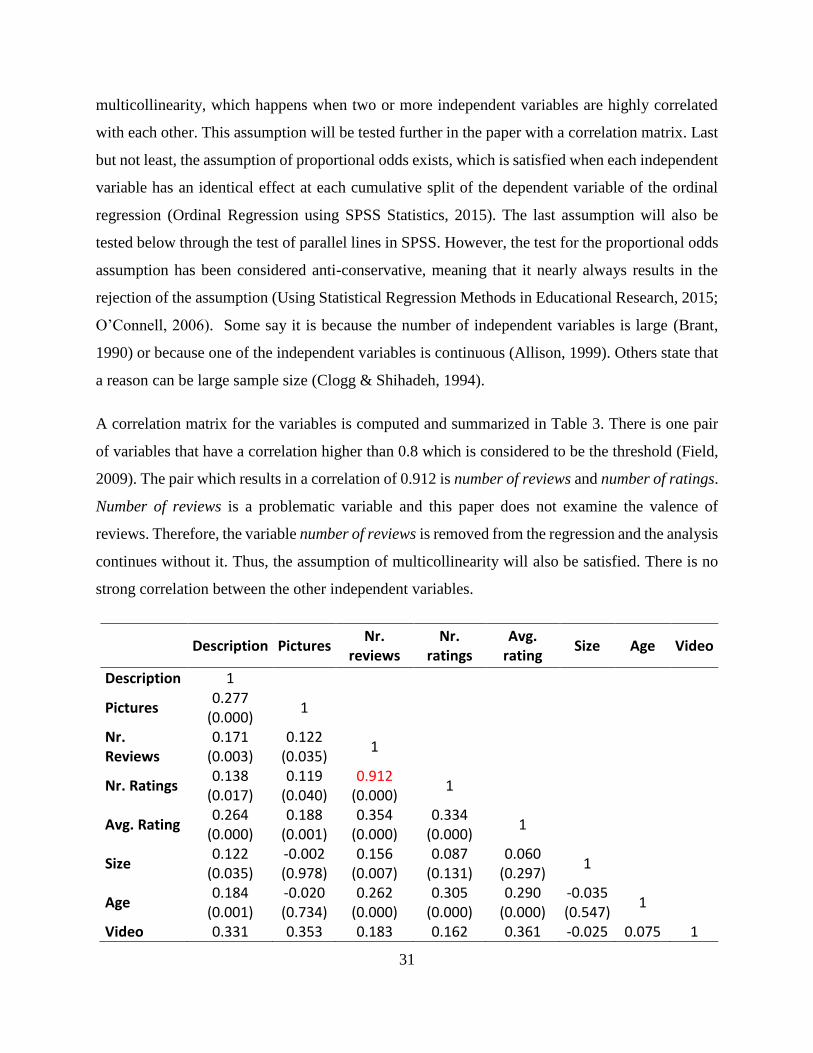
A correlation matrix for the variables is computed and summarized in Table 3. There is one pair
of variables that have a correlation higher than 0.8 which is considered to be the threshold (Field,
2009). The pair which results in a correlation of 0.912 is number of reviews and number of ratings.
Number of reviews is a problematic variable and this paper does not examine the valence of
reviews. Therefore, the variable number of reviews is removed from the regression and the analysis
continues without it. Thus, the assumption of multicollinearity will also be satisfied. There is no
strong correlation between the other independent variables.
Description Pictures Nr.
reviews Nr.
ratings Avg.
rating Size Age Video
Description 1
Pictures 0.277
(0.000) 1
Nr. Reviews
0.171 (0.003)
0.122 (0.035)
1
Nr. Ratings 0.138
(0.017) 0.119
(0.040) 0.912
(0.000) 1
Avg. Rating 0.264
(0.000) 0.188
(0.001) 0.354
(0.000) 0.334
(0.000) 1
Size 0.122
(0.035) -0.002 (0.978)
0.156 (0.007)
0.087 (0.131)
0.060 (0.297)
1
Age 0.184
(0.001) -0.020 (0.734)
0.262 (0.000)
0.305 (0.000)
0.290 (0.000)
-0.035 (0.547)
1
Video 0.331 0.353 0.183 0.162 0.361 -0.025 0.075 1

32
(0.000) (0.000) (0.001) (0.005) (0.000) (0.672) (0.194) Table 3. Correlation matrix
Next, Table 4 presents the model fitting information. The model fitting information is useful to
know whether the model improves the ability to predict the outcome. Looking at the 2 Log
Likelihood, it is important to see if there is a statistically significant improvement between using
just the intercept of the model to predict which category an app falls in, and actually including the
explanatory variables in the model. Both the model for Games and for Health and Fitness apps
have a statistically significant final 2 Log Likelihood. Thus, it can be concluded that the models
are being improved by including the explanatory variables in it.
Model -2 Log
Likelihood
Chi-Square Significance
Games Intercept only 1113.348
Final 824.998 288.350 0.000
Health and
Fitness
Intercept only 1198.571
Final 959.370 239.201 0.000
Table 4. Model fitting information
The Goodness-of-fit shows if the observed data are consistent with the model fitted to it. The null
hypothesis is that the model is a good fit, thus the outcome should not be significant in order for
the null hypotheses to not be rejected. The results in Table 5 show that both models are significant
which means that the data doesn’t fit the model that well. However, the test is very sensitive to
missing cells and large sample size. Nevertheless, looking at the Model Fitting Information, there
is enough information to suggest that there is an improvement of how well the data is predicting
the outcome.
Chi-Square Df Significance
Games Pearson 1.136 x 10¹² 2383 0.000
Health and Fitness Pearson 2.573 x 10¹⁴ 2981 0.000
Table 5. Goodness-of-fit
There are three Pseudo R-squared statistics which measure the strength of the association between
the dependent variable and the independent variables – Cox and Snell’s R-squared, Nagelkerke R-
squared and McFadden’s R-squared. As discussed in the Methodology section, the paper will use
the Nagelkerke R-squared for both models. Table 6 shows the results of the Pseudo R-squared
33
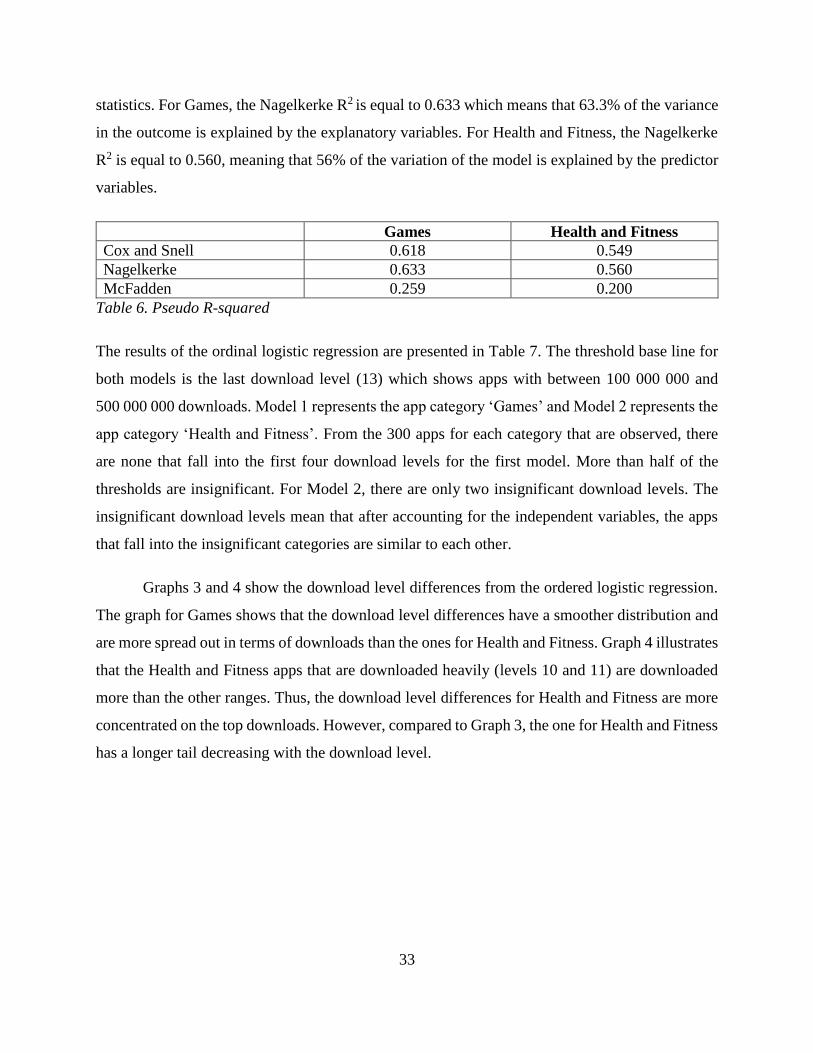
statistics. For Games, the Nagelkerke R2 is equal to 0.633 which means that 63.3% of the variance
in the outcome is explained by the explanatory variables. For Health and Fitness, the Nagelkerke
R2 is equal to 0.560, meaning that 56% of the variation of the model is explained by the predictor
variables.
Games Health and Fitness
Cox and Snell 0.618 0.549
Nagelkerke 0.633 0.560
McFadden 0.259 0.200
Table 6. Pseudo R-squared
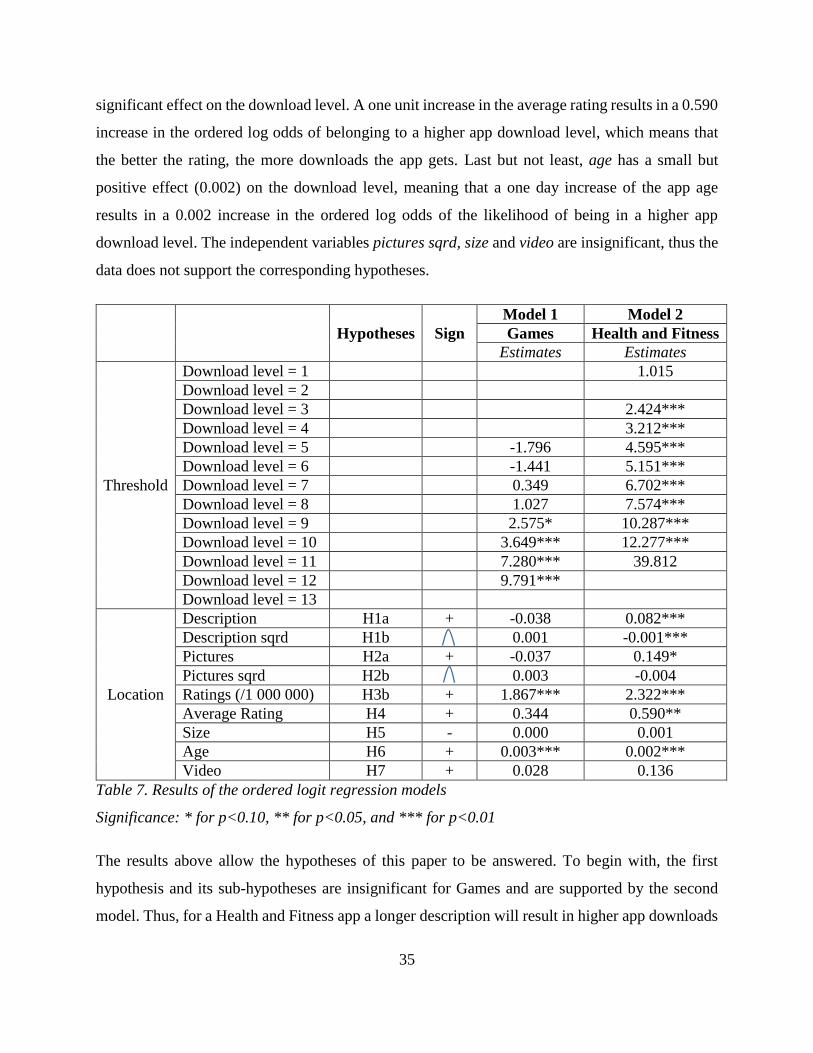
The results of the ordinal logistic regression are presented in Table 7. The threshold base line for
both models is the last download level (13) which shows apps with between 100 000 000 and
500 000 000 downloads. Model 1 represents the app category ‘Games’ and Model 2 represents the
app category ‘Health and Fitness’. From the 300 apps for each category that are observed, there
are none that fall into the first four download levels for the first model. More than half of the
thresholds are insignificant. For Model 2, there are only two insignificant download levels. The
insignificant download levels mean that after accounting for the independent variables, the apps
that fall into the insignificant categories are similar to each other.
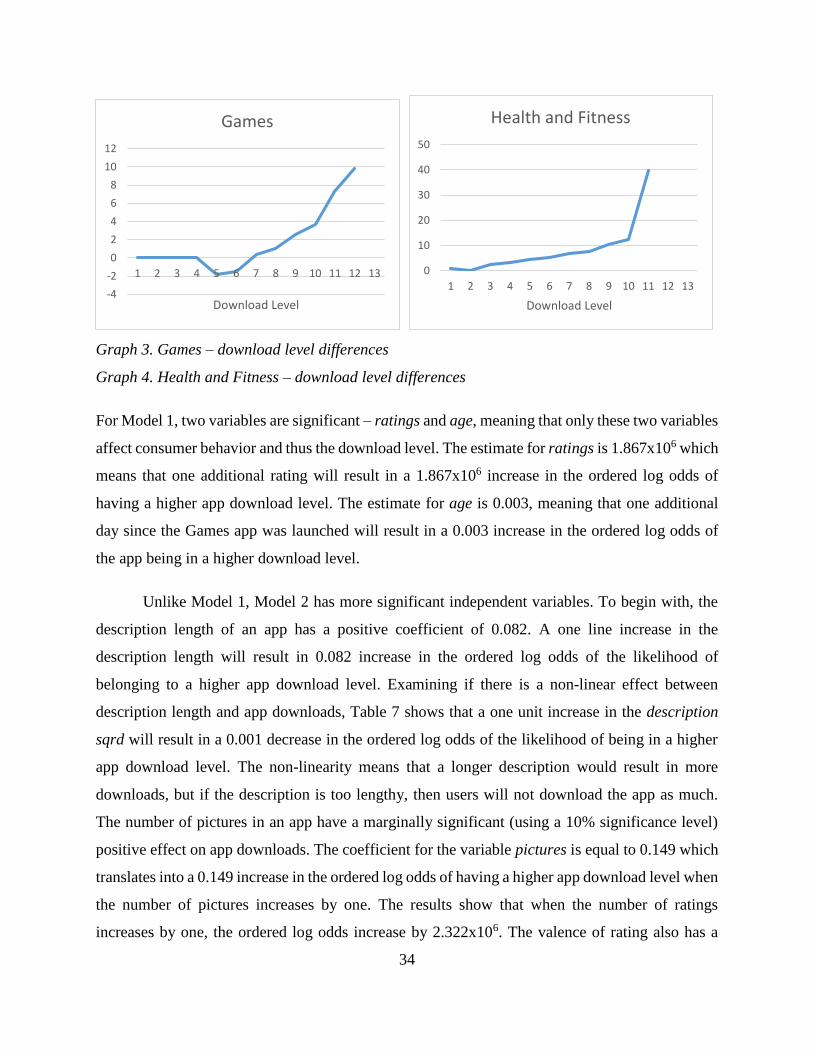
Graphs 3 and 4 show the download level differences from the ordered logistic regression.
The graph for Games shows that the download level differences have a smoother distribution and
are more spread out in terms of downloads than the ones for Health and Fitness. Graph 4 illustrates
that the Health and Fitness apps that are downloaded heavily (levels 10 and 11) are downloaded
more than the other ranges. Thus, the download level differences for Health and Fitness are more
concentrated on the top downloads. However, compared to Graph 3, the one for Health and Fitness
has a longer tail decreasing with the download level.
34
Graph 3. Games – download level differences
Graph 4. Health and Fitness – download level differences
For Model 1, two variables are significant – ratings and age, meaning that only these two variables
affect consumer behavior and thus the download level. The estimate for ratings is 1.867x10⁶ which
means that one additional rating will result in a 1.867x10⁶ increase in the ordered log odds of
having a higher app download level. The estimate for age is 0.003, meaning that one additional
day since the Games app was launched will result in a 0.003 increase in the ordered log odds of
the app being in a higher download level.
Unlike Model 1, Model 2 has more significant independent variables. To begin with, the
description length of an app has a positive coefficient of 0.082. A one line increase in the
description length will result in 0.082 increase in the ordered log odds of the likelihood of
belonging to a higher app download level. Examining if there is a non-linear effect between
description length and app downloads, Table 7 shows that a one unit increase in the description
sqrd will result in a 0.001 decrease in the ordered log odds of the likelihood of being in a higher
app download level. The non-linearity means that a longer description would result in more
downloads, but if the description is too lengthy, then users will not download the app as much.
The number of pictures in an app have a marginally significant (using a 10% significance level)
positive effect on app downloads. The coefficient for the variable pictures is equal to 0.149 which
translates into a 0.149 increase in the ordered log odds of having a higher app download level when
the number of pictures increases by one. The results show that when the number of ratings
increases by one, the ordered log odds increase by 2.322x10⁶. The valence of rating also has a
-4
-2
0
2
4
6
8
10
12
1 2 3 4 5 6 7 8 9 10 11 12 13
Download Level
Games
0
10
20
30
40
50
1 2 3 4 5 6 7 8 9 10 11 12 13
Download Level
Health and Fitness
35
significant effect on the download level. A one unit increase in the average rating results in a 0.590
increase in the ordered log odds of belonging to a higher app download level, which means that
the better the rating, the more downloads the app gets. Last but not least, age has a small but
positive effect (0.002) on the download level, meaning that a one day increase of the app age
results in a 0.002 increase in the ordered log odds of the likelihood of being in a higher app
download level. The independent variables pictures sqrd, size and video are insignificant, thus the
data does not support the corresponding hypotheses.
Hypotheses Sign
Model 1 Model 2
Games Health and Fitness
Estimates Estimates
Threshold
Download level = 1 1.015
Download level = 2
Download level = 3 2.424***
Download level = 4 3.212***
Download level = 5 -1.796 4.595***
Download level = 6 -1.441 5.151***
Download level = 7 0.349 6.702***
Download level = 8 1.027 7.574***
Download level = 9 2.575* 10.287***
Download level = 10 3.649*** 12.277***
Download level = 11 7.280*** 39.812
Download level = 12 9.791***
Download level = 13
Location
Description H1a + -0.038 0.082***
Description sqrd H1b 0.001 -0.001***
Pictures H2a + -0.037 0.149*
Pictures sqrd H2b 0.003 -0.004
Ratings (/1 000 000) H3b + 1.867*** 2.322***
Average Rating H4 + 0.344 0.590**
Size H5 - 0.000 0.001
Age H6 + 0.003*** 0.002***
Video H7 + 0.028 0.136
Table 7. Results of the ordered logit regression models
Significance: * for p<0.10, ** for p<0.05, and *** for p<0.01
The results above allow the hypotheses of this paper to be answered. To begin with, the first
hypothesis and its sub-hypotheses are insignificant for Games and are supported by the second
model. Thus, for a Health and Fitness app a longer description will result in higher app downloads
36
and a non-linear relationship exists between the description length and app demand. The second
hypothesis and its two sub-hypotheses have interesting outcomes. Both hypotheses 2a and 2b are
insignificant for the Games category. Hypothesis 2a is partially significant for the Health and
Fitness category at a 10% significance level, which means that the number of pictures have a
positive effect on app demand. However, this is not the case for hypothesis 2b since it is also
insignificant for Health and Fitness apps.
Regarding the volume of WOM, hypothesis 3a is no longer valid since there is a high
correlation between the number of reviews and the number of ratings, and Reviews was removed
from the ordered logistic regression. Hypothesis 3b is supported for both Games and Health and
Fitness categories, meaning that a higher rating will result in a higher app demand. This result is
particularly important because it supports the relevance of the paper. The valence of WOM, and
thus the forth hypothesis, is supported by Health and Fitness apps but is insignificant for the Games
category. Therefore, a higher average rating will result in a higher app demand.
Interestingly, the fifth and seventh hypotheses regarding the size of an app and the presence
of a video in the app description are insignificant for both Games and Health and Fitness, which
means that the data does not support these hypotheses. Last but not least, the sixth hypothesis
which states that app age has a positive impact on app downloads is supported by both Games and
Health and Fitness categories.
This section presented the ordered logit regression results of the paper. The results are fully
consistent with the third and sixth hypotheses for both app categories, and partially consistent with
the first, second and forth hypotheses for the Health and Fitness category.
Discussion
This thesis uses publicly available level data and provides a methodology to estimate the influence
of product description characteristics on mobile app demand. It fills in a literature gap by
presenting a unique combination of description characteristics of a mobile app that has not been
used in any other paper so far. Moreover, the research examines the effect of both valence and
volume of WOM on mobile app demand, which has not been done before. In total, 600 apps were
examined across two app categories – Games and Health and Fitness (top 300 each), which were
37
extracted for the Android Store for the Netherlands. Scholars have determined that researching
popular apps, which users appear to be using, would improve the study’s relevance to the field
(Cowan, et al., 2012).
From the analysis, it is found that the description length, number of pictures, number of
ratings, average rating and age have a positive effect on app download level for Health and Fitness
apps. For Games, the results show that number of ratings and age have a significant positive effect
on the app download level. An important result is that the volume of ratings has a positive
significant effect on app demand for both app categories. The results from this paper are consistent
with what earlier literature suggests regarding mobile apps and other products. Product description
characteristics have an overall positive influence on app demand, and thus are an important factor
and predictor for product demand. The findings can help firms understand how to manage and
implicate advertising in mobile app platforms.
Moreover, attributes such as the description length and the number of pictures in an app can
help app developers discover what levels influence consumer behavior best and thus improve the
visual cues of the app description in order to provoke more app downloads. According to Racherla,
Furner and Babb (2012) mobile apps that are user-centric, such as Games and Health and Fitness
in this case, and ones that help consumers better navigate information, can push consumer’s
purchase intentions towards a certain brand more effectively. Further implications and limitations
consist of improving mobile advertising as well as including another variable in order to better the
analysis of the results.
Firstly, an implication for brands is that mobile apps provide a channel to promote their
brand and sell their products. Mobile apps are an easy medium through which companies can reach
many potential consumers. Not only reach, but also targeting, engagement, viral and transaction
levels are higher than any other advertising medium (Murphy & Meeker, 2011). A specific feature
that is directly connected through mobile apps is the time spent by a consumer using a given app.
App developers and publishers are shifting from launching paid apps to including in-app purchases
and ad-supported business models. Time spent is relevant because the more time a consumer
spends using an app, the more likely he or she is to generate in-app advertising revenues and
purchases. Moreover, this would present an opportunity to increase consumer engagement with
38
the brand through the mobile app. Thus, it would be beneficial to examine how app description
characteristics in combination with time spent in mobile apps influences consumer demand.
Secondly, ratings can be used as a measure of quality and a predictor of future downloads.
However, Hyrynsalmi, et al. (2013) suggest that use of ratings is more complex and that there are
many different factors that can affect the final outcome. A finding of this study is that the number
of reviews and the number of ratings were correlated and thus number of reviews had to be
removed. It would be useful to further examine the relationship between volume and valence of
reviews and app demand in collaboration with the other variables. This would be helpful because
in a lot of the top ranked apps there are many negative and positive reviews which diminish the
power of average rating as an indicator. Nevertheless, user reviews are still of much help to app
developers as they allow for the fast gathering of feedback to improve the application (Hyrynsalmi,
et al., 2013).
A limitation of the data used in this paper is the fact that app-level data does not take into
account if multiple downloads of an app are derived from a single user through multiple mobile
devices or whether they are from numerous users (Ghose & Han, 2014). This can be improved by
having access to individual-level data and to the exact number of downloads for a certain app.
Furthermore, this paper uses download level as an estimation of mobile app demand. It would be
more beneficial and accurate if the actual downloads for every app are used. However, as
mentioned earlier, publicly available data does not include the exact number of downloads. This
is a limitation, because it makes the analysis less precise. For example, the download level 8 is
considered – it includes apps with downloads from 500 000 to 1 000 000 downloads. If an app has
500 001 downloads, it will be in the same pool as an app that is downloaded 900 000 times. Thus,
future research should focus and examine the effect of product description characteristics on exact
number of app downloads.
Some researchers claim that ratings are averaged over multiple releases of an app (Fu, et al.,
2013). However, the source used for the data extraction for the current paper does not include the
number of app versions. Future research can include the number of app versions as a control
variable although it is not a visual cue and thus will not be part of the app description
characteristics. Moreover, it is worthy to mention as a limitation that the success of the app may
39
be impacted if it is featured as a highlighted app or as an ‘app of the day’. Future research may
include variables that include if the app has been featured either on the Google Play Home Page
or only in Google Play.
Additionally, the analysis of this thesis is limited to Android apps in the Google Play store in
the Netherlands. Future studies may consider performing similar analyses of apps created for other
platforms such as Apple or Windows, as well as compare the current results to other countries in
and outside Europe.
Last but not least, an important limitation that the analysis of this paper experiences is that
there is a problem with endogeneity. Chia, Yamamoto and Asokan (2012) find that users are more
likely to rate an app which they have installed, meaning that there is a correlation between volume
of WOM and demand. Thus, although the current results find that ratings affect downloads, the
link may be the other way around.
40
Bibliography (2015, April 5). Retrieved from AppAnnie: https://www.appannie.com/apps/google-
play/app/com.etermax.preguntados.lite/
(2015, April 5). Retrieved from AppAnnie: https://www.appannie.com/apps/google-
play/app/com.popularapp.sevenmins/
(2015, April 5). Retrieved from AppAnnie: https://www.appannie.com/apps/google-
play/app/com.northpark.drinkwater/
Allison, P. D. (1999). Multiple regression: A primer. Pine Forge Press.
Alvarez, L. S., Martín, A. M., & Casielles, R. V. (2007). Relationship marketing and information
and communication technologies: Analysis of retail travel agencies. Journal of Travel
Research, 45(4), 453-463.
Amblee, N., & Bui, T. (2007). Freeware downloads: An empirical investigation into the impact
of expert and user reviews on demand for digital goods. AMCIS 2007 Proceedings, 21.
Ampuero, O., & Vila, N. (2006). Consumer perceptions of product packaging. Journal of
Consumer Marketing, 23(2), 100-112.
Anderson, E. W., & Salisbury, L. C. (2003). The formation of market-level expectations and its
covariates. Journal of Consumer Research, 30(1), 115-124.
Awad, N., & Zhang, J. (2006). A framework for evaluating organizational involvement in online
ratings communities. MWAIS 2006 Proceedings, 24, 141-147.
Barnes, S. J., & Scornavacca, E. (2004). Mobile marketing: the role of permission and
acceptance. International Journal of Mobile Communications, 2(2), 128-139.
Barutçu, S. (2007). Attitudes towards mobile marketing tools: A study of Turkish consumers.
Journal of Targeting, Measurement and Analysis for Marketing, 16(1), 26-38.
Bass, F. (1969). A New Product Growth Model for Consumer Durables. Management Science,
15, 215-227.
Benoit, K. (2012, August 22). Multinomial and Ordinal Logistic Regression. Retrieved from
Kenneth Benoit: http://www.kenbenoit.net/courses/ME104/ME104_Day8_CatOrd.pdf
Bigné, E., Ruiz-Mafé, C., & Sanz-Balz, S. (2007). Key Drivers of Mobile Commerce Adoption.
An Exploratory Study of Spanish Mobile Users. JTAER, 2(2), 48-60.
Böhmer, M., Hecht, B., Schöning, J., Krüger, A., & Bauer, G. (2011). Falling asleep with Angry
Birds, Facebook and Kindle: a large scale study on mobile application usage. ACM,
Proceedings of the 13th international conference on Human computer interaction with
mobile devices and services, 47-56.
Bounie, D., Bourreau, M., Gensollen, M., & Waelbroeck, P. (2005). The effect of online
customer reviews on purchasing decisions: The case of video games.
Bowman, D., & Narayandas, D. (2001). Managing customer-initiated contacts with
manufacturers: The impact on share of category requirements and word-of-mouth
behavior. Journal of Marketing Research, 38(3), 281-297.
Brant, R. (1990). Assessing proportionality in the proportional odds model for ordinal logistic
regression. Biometrics, 1171-1178.
Carare, O. (2012). The impact of bestseller rank on demand: evidence from the app market.
International Economic Review, 53(3), 717-742.
Chatterjee, P. (2001). Online reviews: do consumers use them? 129-134.
Chen, P. Y., Wu, S. Y., & Yoon, J. (2004). The impact of online recommendations and consumer
feedback on sales. ICIS 2004 Proceedings, 58, 711-724.
41
Chen, Y., Fay, S., & Wang, Q. (2003). Marketing implications of online consumer product
reviews. Business Week, 7150, 1-36.
Chen, Y., Fay, S., & Wang, Q. (2011). The role of marketing in social media: How online
consumer reviews evolve. Journal of Interactive Marketing, 25(2), 85-94.
Cheng, M. J., Wang, S. E., Lin, Y. J., & Vivek, S. D. (2009). Why do customers utilize the
internet as a retailing platform? A view from consumer perceived value. Asia Pacific
Journal of Marketing and Logistics, 21(1), 144-160.
Chevalier, J. A., & Mayzlin, D. (2006). The effect of word of mouth on sales: Online book
reviews. Journal of marketing research, 43(3), 345-354.
Chia, P. H., Yamamoto, Y., & Asokan, N. (2012). Is this app safe? A large scale study on
application permissions and risk signals. ACM, Proceedings of the 21st international
conference on World Wide Web, 311-320.
Chintagunta, P. K., Gopinath, S., & Venkataraman, S. (2010). The effects of online user reviews
on movie box office performance: Accounting for sequential rollout and aggregation
across local markets. Marketing Science, 29(5), 944-957.
Clemons, E. K., Gao, G. G., & Hitt, L. M. (2006). When online reviews meet
hyperdifferentiation: A study of the craft beer industry. Journal of Management
Information Systems, 23(2), 149-171.
Clogg, C. C., & Shihadeh, E. S. (1994). Statistical models for ordinal variables (Vol. 4). Sage
Publications.
Cowan, L. T., Van Wagenen, S. A., Brown, B. A., Hedin, R. J., Seino-Stephan, Y., Hall, P. C., &
West, J. H. (2012). Apps of steel: are exercise apps providing consumers with realistic
expectations? A content analysis of exercise apps for presence of behavior change theory.
Health Education & Behavior, 133-140.
Cox, D. F. (1962). The measurement of information value: A study in consumer decision-
making. Emerging concepts in marketing, 413-421.
Cui, G., Lui, H. K., & Guo, X. (2012). The effect of online consumer reviews on new product
sales. International Journal of Electronic Commerce, 17(1), 39-58.
Davis, A., & Khazanchi, D. (2007). The influence of online word of mouth on product sales in
retail e-commerce: an empirical investigation. AMCIS 2007 Proceedings, 176.
Davis, A., & Khazanchi, D. (2008). An empirical study of online word of mouth as a predictor
for multi‐product category e‐commerce sales. Electronic Markets, 18(2), 130-141.
Day, G. S. (1971). Attitude change, media and word of mouth. Journal of Advertising Research,
31-40.
de Figueiredo, J. M., & Kyle, M. K. (2006). Surviving the gales of creative destruction: The
determinants of product turnover. Strategic Management Journal, 27(3), 241-264.
Decker, R., & Trusov, M. (2010). Estimating aggregate consumer preferences from online
product reviews. International Journal of Research in Marketing, 27(4), 293-307.
Dellarocas, C. (2003). The digitization of word of mouth: Promise and challenges of online
feedback mechanisms. Management science, 49(10), 1407-1424.
Dellarocas, C., & Narayan, R. (2006). What motivates consumers to review a product online? A
study of the product-specific antecedents of online movie reviews. Proceedings of the
International Conference on Web Information Systems Engineering (WISE06).
Dellarocas, C., Awad, N., & Zhang, X. (2004). Exploring the value of online reviews to
organizations: Implications for revenue forecasting and planning. ICIS 2004 Proceedings,
30.
42
Dhar, V., & Chang, E. A. (2009). Does chatter matter? The impact of user-generated content on
music sales. Journal of Interactive Marketing, 23(4), 300-307.
Duan, W. G., & Whinston, A. B. (2009). Informational cascades and software adoption on the
internet: an empirical investigation. Mis Quarterly, 23-48.
Duan, W., Gu, B., & Whinston, A. B. (2008). Do online reviews matter?—An empirical
investigation of panel data. Decision support systems, 45(4), 1007-1016.
Dwyer, P. (2007). Measuring the value of electronic word of mouth and its impact in consumer
communities. Journal of interactive marketing, 21(2), 63-79.
Eisenhardt, K. M. (1989). Agency Theory: An Assessment and Review. Academy of
Management Review, 57-74.
Eliashberg, J., Elberse, A., & Leenders, M. A. (2006). The motion picture industry: Critical
issues in practice, current research, and new research directions. Marketing Science,
25(6), 638-661.
Ellison, G., & Fudenberg, D. (1995). Word-of-mouth communication and social learning. The
Quarterly Journal of Economics, 93-125.
Eroglu, S. A., Machleit, K. A., & Davis, L. M. (2003). Empirical testing of a model of online
store atmospherics and shopper responses. Psychology & Marketing, 20(2), 139-150.
Feick, L. F., & Price, L. L. (1987). The market maven: A diffuser of marketplace information.
The Journal of Marketing, 83-97.
Field, A. (2009). Discovering statistics using SPSS. Sage publications.
Finn, A., Wang, L., & Frank, T. (2009). Attribute perceptions, customer satisfaction and
intention to recommend e-services. Journal of Interactive Marketing, 23(3), 209-220.
Fiore, A. M., Jin, H. J., & Kim, J. (2005). For fun and profit: Hedonic value from image
interactivity and responses toward an online store. Psychology & Marketing, 22(8), 669-
694.
Floyd, K., Freling, R., Alhoqail, S., Cho, H. Y., & Freling, T. (2014). How online product
reviews affect retail sales: A meta-analysis. Journal of Retailing, 90(2), 217-232.
Forman, C., Ghose, A., & Wiesenfeld, B. (2008). Examining the relationship between reviews
and sales: The role of reviewer identity disclosure in electronic markets. Information
Systems Research, 19(3), 291-313.
Forrest, C. (2014, September 3). Google Play v Apple App Store: The battle for the mobile app
market. Retrieved from TechRepublic: http://www.techrepublic.com/article/google-play-
v-apple-app-store-the-battle-for-the-mobile-app-market/
Fu, B., Lin, J., Li, L., Faloutsos, C., Hong, J., & Sadeh, N. (2013). Why people hate your app:
Making sense of user feedback in a mobile app store. Proceedings of the 19th ACM
SIGKDD international conference on Knowledge discovery and data mining, 1276-1284.
Gardner, D. M. (1970). An Experimental Investigation on the Price Quality Relationship.
Journal of Retailing (46), 39-40.
Garg, R., & Telang, R. (2013). Inferring app demand from publicly available data. MIS
Quarterly 37.4, 1253-1264.
Gefen, D., Gefen, G., & Carmel, E. (2015). How project description length and expected
duration affect bidding and project success in crowdsourcing software development.
Journal of Systems and Software, 1-10.
Ghose, A., & Han, S. P. (2014). Estimating demand for mobile applications in the new economy.
Management Science, 60(6), 1470-1488.
43
Ghose, A., Ipeirotis, P. G., & Li, B. (2012). Designing ranking systems for hotels on travel
search engines by mining user-generated and crowdsourced content. Marketing Science,
31(3), 493-520.
Girardello, A., & Michahelles, F. (2010). Explicit and Implicit Ratings for Mobile Applications.
GI Jahrestagung (1), 606-612.
Godes, D., & Mayzlin, D. (2004). Using online conversations to study word-of-mouth
communication. Marketing science, 23(4), 545-560.
Goh, K. Y., Chu, J., & Wu, J. (2015). Mobile Advertising: An Empirical Study of Temporal and
Spatial Differences in Search Behavior and Advertising Response. Journal of Interactive
Marketing, 30, 34-45.
Grant, I., & O’Donohoe, S. (2007). Why young consumers are not open to mobile marketing
communication. International Journal of Advertising, 26(2), 223-246.
Greene, W. H., & Hensher, D. A. (2009). Modelling ordered choices. Mimeo, New York: Stern
School of Business.
Greenstein, S. M., & Wade, J. B. (1998). The product life cycle in the commercial mainframe
computer market, 1968-1982. The RAND Journal of Economics, 772-789.
Ha, Y., & Lennon, S. J. (2010). Online visual merchandising (VMD) cues and consumer
pleasure and arousal: purchasing versus browsing situation. Psychology & Marketing,
27(2), 141-165.
Hao, L., Li, X., Tan, Y., & Xu, J. (2011). The economic role of rating behavior in third-party
application market. Proceedings of Thirty Second International Conference on
Information Systems, ICIS 26, 1-15.
Harman, M., Jia, Y., & Zhang, Y. (2012). App store mining and analysis: MSR for app stores.
Proceedings of the 9th IEEE Working Conference on Mining Software Repositories (pp.
108-111). IEEE Press.
Ho-Dac, N. N., Carson, S. J., & Moore, W. L. (2013). The effects of positive and negative online
customer reviews: do brand strength and category maturity matter? Journal of Marketing,
77(6), 37-53.
Hu, N., Pavlou, P. A., & Zhang, J. (2006). Can online reviews reveal a product's true quality?:
empirical findings and analytical modeling of Online word-of-mouth communication.
Proceedings of the 7th ACM conference on Electronic commerce, 324-330.
Hyrynsalmi, S. A., Suominen, A. R., Seppänen, M. A., & Määkilä, T. (2013). The relevance of
customer reviews in the mobile application marketplaces. Technology and Innovation in
the Emerging Markets Economy, Proceedings of 22nd International Conference of the
International Association for Management of Technology. Coral Gables, FL: IAMOT.
Hyrynsalmi, S., Suominen, A., Mäkilä, T., & Knuutila, T. (2012). The emerging mobile
ecosystems: An introductory analysis of Android Market. 21st International Conference
on Management of Technology (IAMOT 2012), International Association for
Management of Technology (March 2012).
IDC. (2015, May). Smartphone OS Market Share, Q1 2015. Retrieved from IDC:
http://www.idc.com/prodserv/smartphone-os-market-share.jsp
Jackson, R. S. (2008). Wine science: principles and applications. San Diego: Academic press.
Janssens, W., Wijnen, K., De Pelsmacker, P., & Van Kenhove, P. (2008). Marketing research
with SPSS. Essex: Pearson.
Jung, E. Y., Baek, C., & Lee, J. D. (2012). Product survival analysis for the App Store.
Marketing Letters, 23(4), 929-941.
44
Jung, Y. (2014). What a smartphone is to me: understanding user values in using smartphones.
Information Systems Journal, 24(4), 299-321.
Katz, E., & Lazarsfeld, P. F. (1955). Personal Influence, The part played by people in the flow of
mass communications. New Brunswick: Transaction Publishers.
Keller, K. L. (1993). Conceptualizing, measuring, and managing customer-based brand equity.
Journal of Marketing, 1-22.
Khessina, O. M., & Carroll, G. R. (2008). Product demography of de novo and de alio firms in
the optical disk drive industry, 1983-1999. Organization Science, 19(1), 25-38.
Kim, B., & Han, I. (2009). What drives the adoption of mobile data services? An
approach from a value perspective. Journal of Information Technology, 24(1), 35-45.
Kim, H. W., Chan, H. C., & Gupta, S. (2007). Value-based adoption of mobile internet: an
empirical investigation. Decision Support Systems, 43(1), 111-126.
Kim, M. J. (2012). The interdependence between smartphones and applications: The role of
platforms. University of Minnesota Applied Microeconomics Workshop.
King, J. (1987). A review of bibliometric and other science indicators and their role in research
evaluation. Journal of information science, 13(5), 261-276.
King, R. A., Racherla, P., & Bush, V. D. (2014). What we know and don't know about online
word-of-mouth: A review and synthesis of the literature. Journal of Interactive
Marketing, 28(3), 167-183.
Kirmani, A., & Rao, A. R. (2000). No pain, no gain: A critical review of the literature on
signaling unobservable product quality. Jounal of Marketing, 66-79.
Kostyra, D. S., Reiner, J., Natter, M., & Klapper, D. (2015). Decomposing the effects of online
customer reviews on brand, price, and product attributes. International Journal of
Research in Marketing, 1-13.
Koufaris, M. (2002). Applying the technology acceptance model and flow theory to online
consumer behavior. Information systems research, 13(2), 205-223.
Lavrakas, P. J. (2008). Encyclopedia of survey research methods. Thousand Oaks: Sage
Publications.
Lee, G., & Raghu, T. S. (2011). Product Portfolio and Mobile Apps Success: Evidence from App
Store Market. AMCIS, 2011 Proceedings - All Submissions, Paper 444.
Li, X., & Hitt, L. M. (2008). Self-selection and information role of online product reviews.
Information Systems Research, 19(4), 456-474.
Li, X., & Wu, L. (2014). Herding and Social Media Word-of-Mouth: Evidence from Groupon.
Liu, X., Jia, H., & Guo, C. (n.a.). Smartphone and Tablet Application (App) Life Cycle
Characterization via Apple App Store Rank.
Liu, Y. (2006). Word of mouth for movies: Its dynamics and impact on box office revenue.
Journal of marketing, 70(3), 74-89.
Luna-Nevarez, C., & Hyman, M. R. (2012). Common practices in destination website design.
Journal of destination marketing & management, 1(1), 94-106.
Magrath, V., & McCormick, H. (2013). Marketing design elements of mobile fashion retail apps.
Journal of Fashion Marketing and Management: An International Journal, 17(1), 115-
134.
María Angulo, A., María Gil, J., Gracia, A., & Sánchez, M. (2000). Hedonic prices for Spanish
red quality wine. British Food Journal, 102(7), 481-493.
Mayzlin, D., & Chevalier, J. A. (2003). The effect of word of mouth on sales: Online book
reviews. New Haven: Yale School of Management.
45
McDaniel, C., & Baker, R. C. (1997). Convenience food packaging and the perception of
product quality. Journal of Marketing, 57-58.
Mehrabian, A., & Russell, J. A. (1974). An approach to environmental psychology. Cambridge,
MA, US: MIT Press.
Milgrom, P., & Roberts, J. (1986). Price and advertising signals of product quality. The Journal
of Political Economy, 796-821.
Mishra, D. P., Heide, J. B., & Cort, S. G. (1998). Information Asymmetry and Levels of Agency
Relationships: Theory and Empirical Evidence. Journal of Marketing Research, 277-295.
Mobile Apps in Numbers - Statistics and Trends. (2014, September 4). Retrieved from Go Globe:
http://www.go-globe.hk/blog/mobile-apps-numbers/
Mobile Apps: What Consumers Really Need and Want. (2012). Retrieved from Dynatrace:
https://info.dynatrace.com/rs/compuware/images/Mobile_App_Survey_Report.pdf
Mobile hardware statistics 2014. (2015, January 6). Retrieved from MobiForge:
http://mobiforge.com/research-analysis/mobile-hardware-statistics-2014
Muoio, K. (2009, February 12). Key Trends in Mobile Content Usage & Mobile Advertising.
Retrieved from comScore:
http://www.comscore.com/Media/Files/Presentations/2009/Key-Trends-in-Mobile-
Content-Usage-Mobile-Advertising-PDF
Murphy, M., & Meeker, M. (2011, October 2). Top Mobile Internet Trends. Retrieved from First
Edition Design:
http://www.firsteditiondesign.com/kpcbtop10mobiletrends021011finalpdf-
110210002130-phpapp02.pdf
Nancarrow, C., Tiu Wright, L., & Brace, I. (1998). Gaining competitive advantage from
packaging and labelling in marketing communications. British Food Journal, 100(2),
110-118.
Nelson, P. (1970). Information and consumer behavior. The Journal of Political Economy, 311-
329.
Nelson, P. (1974). Advertising as information. The Journal of Political Economy, 729-754.
Nelson, P. (1978). Advertising as information once more. Washington: American Enterprise Inst.
Number of Android Applications. (2015, June 25). Retrieved from AppBrain:
http://www.appbrain.com/stats/number-of-android-apps
O'Connell, A. A. (2006). Logistic regression models for ordinal response variables (No. 146).
Sage Publications.
Ordinal Regression using SPSS Statistics. (2015). Retrieved from Laerd Statistics:
https://statistics.laerd.com/spss-tutorials/ordinal-regression-using-spss-statistics.php
Pagano, D., & Maalej, W. (2013). User feedback in the appstore: An empirical study.
Requirements Engineering Conference (RE), 2013 21st IEEE International, 125-134.
Persaud, A., & Azhar, I. (2012). Innovative mobile marketing via smartphones: are consumers
ready? Marketing Intelligence & Planning, 30(4), 418-443.
Price, R. (2015, February 2). Android just achieved something it will take Apple years to do.
Retrieved from Business Insider: http://uk.businessinsider.com/android-1-billion-
shipments-2014-strategy-analytics-2015-2?r=US
Racherla, P., Furner, C., & Babb, J. (2012). Conceptualizing the Implications of Mobile App
Usage and Stickiness: A Research Agenda. Available at SSRN 2187056.
Ransbotham, S., Kane, G. C., & Lurie, N. H. (2012). Network characteristics and the value of
collaborative user-generated content. Marketing Science, 31(3), 387-405.
46
research2guidance. (2014). mHealth App Developer Economics 2014. 1-43.
Roach, G. (2009). Consumer perceptions of mobile phone marketing: a direct marketing
innovation. Direct marketing: an international journal, 3(2), 124-138.
Ruebeck, C. S. (2002). Interfirm competition, intrafirm cannibalisation and product exit in the
market for computer hard disk drives. Economic and Social Review, 33(1), 119-132.
Smith, J. (2015, January 13). Google Play overtakes App Store in amount of apps. Retrieved
from iDownloadBlog: http://www.idownloadblog.com/2015/01/13/study-google-play-
overtakes-app-store-in-amount-of-apps/
Sorenson, O. (2000). Letting the market work for you: An evolutionary perspective on product
strategy. Strategic Management Journal, 21(5), 577-592.
Sridhar, S., & Srinivasan, R. (2012). Social influence effects in online product ratings. Journal of
Marketing, 76(5), 70-88.
Stremersch, S., Verniers, I., & Verhoef, P. C. (2007). The quest for citations: Drivers of article
impact. Journal of Marketing, 71(3), 171-193.
Sultan, F., & Rohm, A. (2005). The coming era of" brand in the hand" marketing. MIT Sloan
Management Review, 47(1), 83.
Tanenbaum, A. S. (1996). Computer Networks. Prentice Hall.
Taylor, G. D., & Levin, M. (2014). Predicting mobile app usage for purchasing and information-
sharing. International Journal of Retail & Distribution Management, 42(8), 759-774.
Telang, R., & Garg, R. (2011). Estimating app demand from publicly available data. Pittsburgh:
Heinz College.
Thornton, D. (2013, July 19). Google Play Files Past 50 Billion App Downloads and 1.5M
activations per day. Retrieved from Beginners Tech: http://beginnerstech.co.uk/google-
play-flies-past-50-billion-app-downloads-and-1-5m-activations-per-day/
Tossell, C. C., Kortum, P., Shepard, C., Rahmati, A., & Zhong, L. (2012). An empirical analysis
of smartphone personalisation: measurement and user variability. Behaviour &
Information Technology, 31(10), 995-1010.
Turel, O., Serenko, A., & Bontis, N. (2007). User acceptance of wireless short messaging
services: Deconstructing perceived value. Information & Management, 44(1), 63-73.
Tzeng, J. Y. (2011). Perceived values and prospective users’ acceptance of prospective
technology: The case of a career eportfolio system. Computers & Education, 56(1), 157-
165.
Using Statistical Regression Methods in Education Research. (2015). Retrieved from ReStore:
National Centre for Research Methods :
http://www.restore.ac.uk/srme/www/fac/soc/wie/research-new/srme/modules/mod5/4/
Van den Bulte, C., & Lilien, G. L. (2001). Medical innovation revisited: Social contagion versus
marketing effort. American Journal of Sociology, 106(5), 1409-1435.
Van Rompay, T. J., De Vries, P. W., & Van Venrooij, X. G. (2010). More than words: on the
importance of picture–text congruence in the online environment. Journal of Interactive
Marketing, 24(1), 22-30.
Vermeulen, I. E., & Seegers, D. (2009). Tried and tested: The impact of online hotel reviews on
consumer consideration. Tourism Management, 30(1), 123-127.
Wang, H. Y., Liao, C., & Yang, L. H. (2013). What affects mobile application use? The roles of
consumption values. International Journal of Marketing Studies, 5(2), 11-22.
47
Wheatley, J. J., & Chiu, J. S. (1977). The Effects of Price, Store Image, and Product and
Respondent Characteristics on Perceptions of Quality. Journal of Marketing Research 14
(2), 181-186.
White, A., & Hernandez, N. R. (1991). Increasing field complexity revealed through article title
analyses. Journal of the American Society for Information Science, 42(10), 731-734.
Wong, S. H. (2012). Which platform do our users prefer: website or mobile app? Reference
Services Review, 40(1), 103-115.
Wu, C. S., Cheng, F. F., & Yen, D. C. (2008). The atmospheric factors of online storefront
environment design: An empirical experiment in Taiwan. Information & Management,
45(7), 493-498.
Yitzhaki, M. (1992). The variation in informativity of titles of research papers with time and
field. Cognitive Paradigms in Knowledge Organisation, 401-418.
Yitzhaki, M. (2002). Relation of the title length of a journal article to the length of the article.
Scientometrics, 54(3), 435-447.
Zhu, F., & Zhang, X. (2006). The influence of online consumer reviews on the demand for
experience goods: The case of video games. ICIS 2006 Proceedings, 25.
Zhu, F., & Zhang, X. (2010). Impact of online consumer reviews on sales: The moderating role
of product and consumer characteristics. Journal of marketing, 74(2), 133-148.