MNI Russia Consumer Report
56
MNI Russia Consumer Report June 2014 Insight and data for better decisions
-
Upload
mni-indicators-deutsche-boerse-group -
Category
Economy & Finance
-
view
152 -
download
1
Transcript of MNI Russia Consumer Report

MNI Russia Consumer Report June 2014
Insight and data for better decisions

2 MNI Russia Consumer Report - June 2014
About MNI Indicators Insight and data for better decisions
MNI Indicators offers unique macro-economic data and insight to businesses and the investment community. We produce data and intelligence that is unbiased, pertinent and responsive. Our data moves markets.
Specialising in business and consumer focused macro-economic reports, we give our customers the ability to make timely and relevant decisions. We strive to provide up-to-date information on business and consumer confidence on the economy.
MNI Indicators publishes data on a monthly basis. Our indicators are based on a unique and proprietary methodology and are designed to present an advance picture of the economic landscape as perceived by businesses and consumers every month.
Our monthly reports explore attitudes, perspectives and confidence across different countries and regions. They deliver in-depth analysis, highlight changing patterns and how these can affect potential developments in business and consumer activities.
MNI Indicators is part of MNI, a leading provider of news and intelligence. MNI is a wholly owned subsidiary of Deutsche Börse Group, one of the largest worldwide exchange organisations.
Written and researched byPhilip Uglow, Chief EconomistShaily Mittal, Economist
MNI Indicators | Deutsche Börse Group Westferry House11 Westferry CircusLondon E14 4HETel: +44 (0)20 7862 7444Email: [email protected]
www.mni-indicators.com@MNIIndicators
Copyright© 2014 MNI Indicators | Deutsche Börse Group. Reproduction or retransmission in whole or in part is prohibited except by permission. All rights reserved.
Release TimeEmbargoed until 9:45 a.m. Moscow timeJuly 7, 2014

3MNI Russia Consumer Report - June 2014
MNI Russia Consumer Report - June 2014Contents
4 Editorial
6 Executive Summary
12 Economic Landscape
16 Indicators
17 MNI Russia Consumer Indicator
24 Personal Finances
26 Business Conditions
29 Durable Buying Conditions
30 Employment Outlook
31 Prices Sentiment
34 Interest Rates Expectations
35 Real Estate Investment
38 Car Purchase
40 Consumer Indicator - Regions
43 Consumer Indicator - Income Groups 44 What the Panel Said
46 Data Tables
54 Methodology

Spitzzeile Titel4
Russia’s suspension from the G8 club in March has left it side lined on the world stage, hurt its political standing and damaged its prospects for growth.
Out of the Club
5MNI Russia Consumer Report - June 2014
Russia’s suspension from the G8 club in March has left it side lined on the world stage, hurt its political standing and damaged its prospects for growth. Russia enjoyed its membership of the G8 group of countries for 17 years, but was frozen out after Moscow annexed Crimea, a move that threatened international stability and security. Adding insult to injury, the G8 had been due to meet in Sochi in early June, where President Putin could showcase Russia’s Olympic achievements. Instead it was held in Brussels, and although Putin was physically absent from the meeting, he was the main topic of conversation.
Russia has tried to downplay the importance of it being barred from the G8 pointing to other supranational bodies as being more significant. “If our Western partners believe that such format is no longer needed, let it be so,” Russia’s foreign minister Sergei Lavrov said earlier this year. “We aren‘t clinging for that format, and we won‘t see a big problem if there are no such meetings for a year, or a year-and-half,” he added.
Russia still remains part of the G20 a group that has grown in importance having effectively taken over the role from the G7 of ensuring international financial stability. Its members make up two thirds of the world’s population and account for 85% of global GDP. As emerging markets continue to strengthen then so too will the G20, especially if China chooses to take a greater role. But in spite of the growing importance of the G20, the political power of the G7 remains a force to be reckoned with. In spite of Russia’s public antipathy to being left out in the cold, being forced out of the G8 is a reflection of a loss of power and influence on the world stage.
President Putin, having seen the negative impact of the Ukraine crisis on domestic growth, has already started to adopt a slightly more conciliatory tone. Sanctions from the EU and US may be reasonably limited, but our business and consumer surveys show the negative impact they’re having. The Russian President’s historic deal with the Chinese to supply gas is supposed to show the West that Russia has friends and growth prospects in the East, but it remains very reliant on Europe.
What Russia needs is more trade and business links with both the East and West, but a continued stand-off over Ukraine will do nothing but hurt its growth prospects further. Russia may not be too concerned about not being part of the G8, but from an economic point of view, it would certainly help if it came in from the cold.
Shaily MittalPhilip UglowMNI Indicators

MNI China Consumer Report - July 20136
Russian consumer sentiment rose for the first time in five months, although it was still considerably below the level seen a year earlier given the significant weakening in growth and ramifications of Russia’s military action in Crimea.
Executive Summary

7MNI Russia Consumer Report - June 2014
Russian consumer sentiment recovered slightly after hitting a record low in May, helped by increased optimism about the climate for purchasing household goods and a moderate recovery in expectations for business conditions.
The MNI Russia Consumer Indicator rose 2.2% on the month to 89.1 in June from 87.2 in May. This was the first gain in five months, although consumer sentiment was still 9.6% below the level seen a year earlier given the significant weakening in growth and ramifications of Russia’s military action in Crimea. The European Union and United States have again threatened to enforce harsher sanctions against the Russian economy unless it backs peace efforts in eastern Ukraine.
The rise in the MNI Russia Consumer Indicator was led by all major regions apart from the Urals, where sentiment declined to the lowest since the start of the survey. In Urals, confidence declined to 75.3 from 83.3 in May. Consumers were highly pessimistic about the coming 12 months, with all three forward looking components declining on the month.
Consumer sentiment fell among the youngest age group but rose in older age groups.
Consumer confidence increased in low income groups while it declined slightly in high income households in June. On average, though, the level of confidence remains greater for higher income households.
Respondents were slightly more confident about their finances in the current month while expectations for the next 12 months declined to the lowest level on record.
Consumers were more confident about the current business climate and were more hopeful about business conditions over the short and long term, although overall consumers’ views on business remained pessimistic.
Consumers’ confidence to purchase big ticket items rose to the highest since February. This was the first time in four months the indicator has been above the 100 breakeven level and was the strongest of all the components in June.
High prices remained a serious concern among consumers in June as their dissatisfaction with the current level of prices increased significantly, and expectations for inflation rose to a series high.
Since October, most respondents expected prices to rise between 11-24% over the next year, but this has changed in the past three months. The proportion of respondents who thought prices would rise by over 25% represented the majority, likely due to fears that the depreciation in the currency will adversely impact inflation.
Consumers’ expectations for interest rates on house and car loans rose for the third consecutive month to a new series high in June.
The Car Purchase Indicator also rose slightly from a record low in May as a rise in car buying expectations outweighed a record hike in expectations for the price of gasoline.
MNI Russia Consumer Indicator - Components
Per
sona
l Fin
ance
: C
urre
nt
Per
sona
l Fin
ance
s:
Exp
ecta
tions
Dur
able
Buy
ing
Con
ditio
ns
Bus
ines
s C
ondi
tions
in
1 Ye
ar
Bus
ines
s C
ondi
tions
in
5 Ye
ars
0
100

8 MNI Russia Consumer Report - June 2014
All Russia - Overview
Apr-14 May-14 Jun-14Highest
Since Lowest
Since 3-Month Average
Monthly Change
Monthly % Change
MNI Russia Consumer Indicator 88.5 87.2 89.1 Feb-14 - 88.3 1.9 2.2%
Current Indicator 90.2 87.3 91.1 Feb-14 - 89.5 3.8 4.3%
Expectations Indicator 87.4 87.1 87.8 Mar-14 - 87.4 0.7 0.8%
Personal Finance: Current 83.7 79.6 80.3 Apr-14 - 81.2 0.7 1.0%
Personal Finance: Expected 93.4 95.0 91.5 - series low 93.3 -3.5 -3.7%
Business Condition: 1 Year 77.8 77.7 80.7 Feb-14 - 78.7 3.0 3.8%
Business Condition: 5 Years 91.1 88.6 91.2 Jan-14 - 90.3 2.6 2.9%
Durable Buying Conditions 96.8 95.1 101.8 Feb-14 - 97.9 6.7 7.1%
Current Business Conditions Indicator 95.7 85.5 91.0 Apr-14 - 90.7 5.5 6.4%
Real Estate Investment Indicator 107.2 108.0 108.2 Mar-14 - 107.8 0.2 0.2%
Car Purchase Indicator 82.2 79.3 79.8 Apr-14 - 80.4 0.5 0.6%
Employment Outlook Indicator 90.9 87.8 87.5 - Feb-14 88.7 -0.3 -0.3%
Inflation Expectations Indicator 144.2 144.6 146.3 series high - 145.0 1.7 1.1%
Current Prices Satisfaction Indicator 67.5 73.4 65.0 - series low 68.6 -8.4 -11.4%
Interest Rates Expectations Indicator 122.3 126.0 126.8 series high - 125.0 0.8 0.6%

9MNI Russia Consumer Report - June 2014
All Russia - Summary2013 2014
Jun Jul Aug Sep Oct Nov Dec Jan Feb Mar Apr May Jun
MNI Russia Consumer Indicator 98.5 99.5 99.9 97.4 99.4 94.8 95.7 99.3 94.1 89.1 88.5 87.2 89.1
Current Indicator 98.4 100.5 99.2 95.8 99.2 94.3 95.7 102.0 98.6 89.4 90.2 87.3 91.1
Expectations Indicator 98.6 98.8 100.3 98.4 99.5 95.1 95.7 97.5 91.2 88.8 87.4 87.1 87.8
Personal Finance: Current 99.5 103.2 102.1 95.3 91.0 92.0 92.5 99.3 87.3 79.5 83.7 79.6 80.3
Personal Finance: Expected 102.4 103.4 104.9 105.4 101.2 101.7 101.9 101.2 96.3 96.3 93.4 95.0 91.5
Business Condition: 1 Year 97.8 95.9 98.7 96.1 101.5 94.9 94.4 95.1 87.8 79.4 77.8 77.7 80.7
Business Condition: 5 Years 95.7 97.2 97.5 93.7 95.8 88.7 90.8 96.4 89.4 90.7 91.1 88.6 91.2
Durable Buying Conditions 97.2 97.8 96.2 96.3 107.4 96.6 98.9 104.7 109.9 99.3 96.8 95.1 101.8
Current Business Conditions Indicator 97.7 95.4 95.6 97.6 94.5 97.4 94.9 100.3 97.5 99.2 95.7 85.5 91.0
Real Estate Invest-ment Indicator 107.9 105.3 108.5 108.0 113.0 108.4 106.9 112.1 111.4 110.0 107.2 108.0 108.2
House Price Expec-tations 122.9 120.7 128.4 121.6 127.7 121.6 130.9 135.7 139.0 140.1 137.7 139.3 139.5
House Buying Sen-timent 100.5 96.6 96.7 101.8 109.8 105.0 92.1 99.7 96.8 87.3 84.5 82.6 83.6
House Selling Sen-timent 99.8 101.4 99.5 99.3 98.4 101.5 102.3 99.0 101.6 97.4 100.7 97.8 98.5
Car Purchase Indi-cator 87.5 86.2 88.4 85.7 85.1 81.9 81.0 83.3 88.3 85.1 82.2 79.3 79.8
Car Purchase Expec-tations 107.5 101.0 109.4 107.1 101.4 98.9 98.2 104.4 110.5 106.0 103.8 99.1 103.0
Price of Gasoline Expectations 132.4 128.6 132.7 135.6 131.3 135.2 136.2 137.7 133.8 135.8 139.4 140.5 143.4
Employment Outlook Indicator 99.1 97.1 97.5 99.9 100.4 98.1 98.2 87.2 86.5 92.9 90.9 87.8 87.5
Inflation Expectations Indicator 133.2 136.1 139.4 135.7 139.7 136.8 138.2 136.9 140.9 139.2 144.2 144.6 146.3
Current Prices Satisfac-tion Indicator 86.0 73.9 85.9 85.6 80.5 73.5 71.8 69.4 74.4 76.3 67.5 73.4 65.0
Interest Rates Expecta-tions Indicator 112.3 114.1 113.2 111.1 115.6 115.5 114.9 115.9 122.6 119.2 122.3 126.0 126.8

All Russia - Records2013- Current
Minimum Maximum Mean Median
MNI Russia Consumer Indicator 87.2 99.9 95.4 97.3
Current Indicator 87.3 102.0 95.6 96.0
Expectations Indicator 87.1 100.3 95.2 97.9
Personal Finance: Current 79.5 103.2 92.1 93.6
Personal Finance: Expected 91.5 109.2 100.9 101.8
Business Condition: 1 Year 77.7 101.5 91.4 95.0
Business Condition: 5 Years 88.6 98.0 93.4 93.3
Durable Buying Conditions 92.9 109.9 99.1 97.5
Current Business Conditions Indicator 85.5 100.3 95.2 95.8
Real Estate Investment Indicator 105.3 113.0 108.5 108.0
House Price Expectations 117.9 140.1 129.5 128.0
House Buying Sentiment 82.6 109.8 95.8 97.2
House Selling Sentiment 97.4 102.3 99.7 99.4
Car Purchase Indicator 79.3 88.4 84.6 85.4
Car Purchase expectations 98.2 110.5 104.2 104.3
Price of Gasoline expectations 128.6 143.4 135.1 135.3
Employment Outlook Indicator 86.5 100.5 95.2 97.8
Inflation Expectations Indicator 130.7 146.3 138.6 138.3
Current Prices Satisfaction Indicator 65.0 86.0 76.5 75.3
Interest Rates Expectations Indicator 111.1 126.8 118.5 117.6
10 MNI Russia Consumer Report - June 2014

Russian consumer sentiment recovered slightly in June after hitting a record low in May...
... as there was an increase in optimism about the climate for purchasing household goods and a moderate recovery in expectations for business conditions.

Spitzzeile Titel12
The stand-off with the west over the situation in Ukraine continues to dominate the news.
Economic Landscape
13MNI Russia Consumer Report - June 2014
The stand-off with the west over the situation in Ukraine continues to dominate the news. Tensions escalated further when Russian energy producer Gazprom cut off natural gas supplies to Ukraine following non-payment of a $2 billion bill. The EU has urged Russia to calm tensions, warning that they would otherwise introduce fresh restrictions on trade with Russia, possibly including sector-wide sanctions.
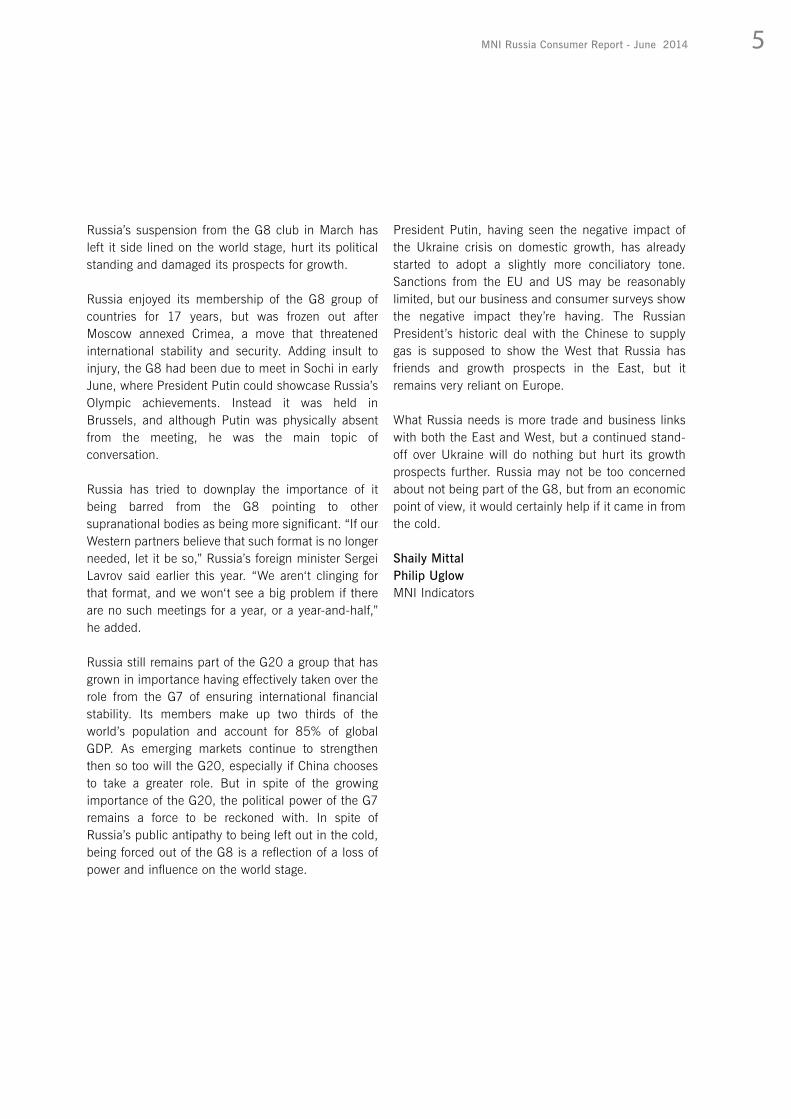
The Russian economy faces numerous issues ranging from weakening of the rouble, spiralling prices and stalled growth. Consumer price inflation rose in May at the fastest pace since August 2011, leaving the central bank little option to maintain a tightening bias with a real risk of a further hike in rates should inflation continue to increase. More positively, industrial production picked up in May and manufacturing output posted the highest growth in six months. The rouble has gained slightly from the previous month, but is still 5% down on the year.
Low economic growthEconomic growth remained extremely weak at the beginning of 2014, slowing to 0.9% in Q1 compared with a year earlier, down from growth of 2% in Q4 2013 and 1.3% in Q1 2013. Capital investment contracted by 4.8% in Q1 compared with a year earlier. Consumption remained relatively firm, but it reflected a one-off public sector pay increase and so is unlikely to be sustained.
Russian ministers had predicted GDP growth of 2.5% this year before the Ukrainian turmoil. However, this has been dramatically reduced to just 0.5%, following paltry growth of 1.3% in 2013. Central Bank governor Elvira Nabiullina also revised the growth rate for 2014 to 0.4%, below the government’s forecast, though expected a slight acceleration in the second half of the year.
The International Monetary Fund thinks that Russia is already in recession, amid warnings from US and EU
leaders that they are ready to take further action against Russia if there isn’t a de-escalation in the situation with Ukraine.
Industrial production expands in MayIndustrial production accelerated by 2.8% on the year in May, up from 2.4% in April due to a rise in the manufacturing output. Manufacturing expanded by 4.4% on the year in May, the highest in six months, and up from growth of 3.9% growth in April. Mining and quarrying, slowed to 0.9% on the year in May compared with growth of 1.1% in the previous month. Utilities output continued to contract for the seventh consecutive month, although the pace of decline slowed to a fall of 0.5% on the year from a decline of 1.9% in the previous month.
In the first five months of 2014, industrial production grew 1.7% on the year after contracting 0.6% in the same period a year ago. The economy ministry
Economic Growth
-15%
-10%
-5%
0%
5%
10%
15%
2007 2008 2009 2010 2011 2012 2013
GDP Growth y/y %
Source: Federal State Statistics Service of Russia
14 MNI Russia Consumer Report - June 2014
expects industrial output to increase by about 1% this year after it failed to grow in 2013.
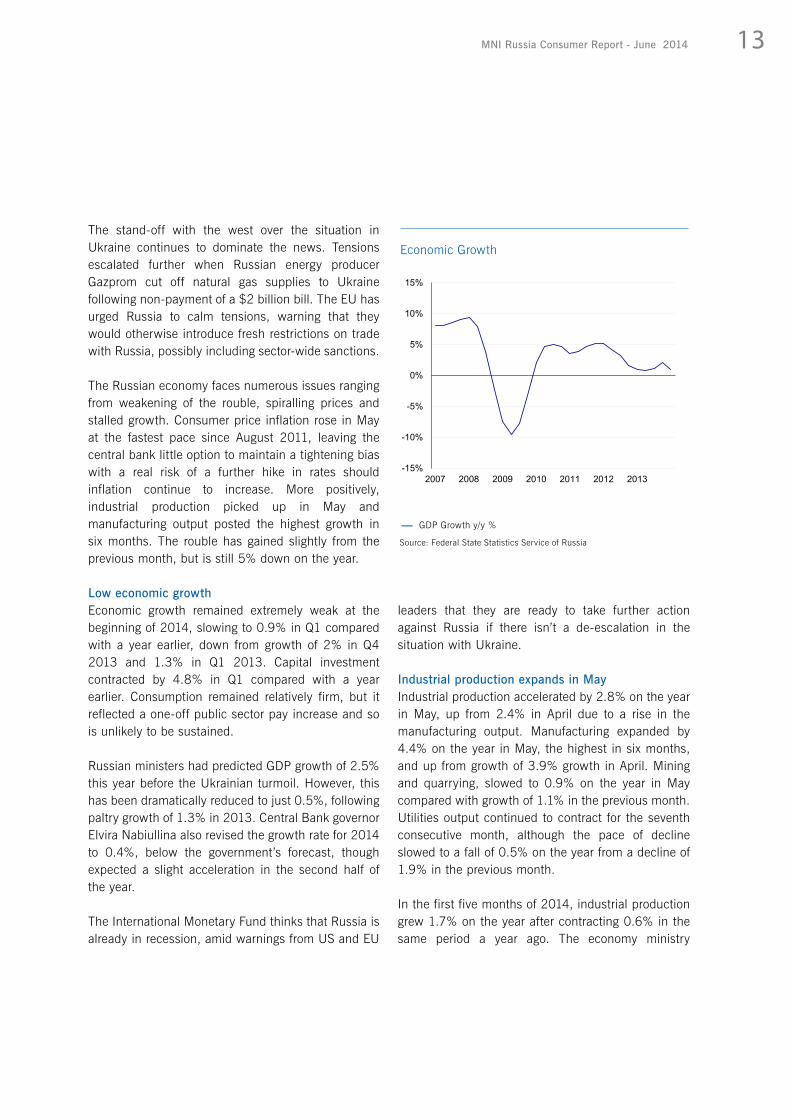
Car sales decelerate in MayIn May, 201,487 cars were sold, 12.2% below the level in the same month a year earlier, according to the Association of European Businesses (AEB). Higher inflation and a weaker rouble have negatively impacted consumer spending. The pace of the decline in car sales had eased until March when sales declined by just 0.4%, but the market is showing signs of distress again. The five months to May saw a decline of 5.6% in car sales compared with the same period a year earlier.
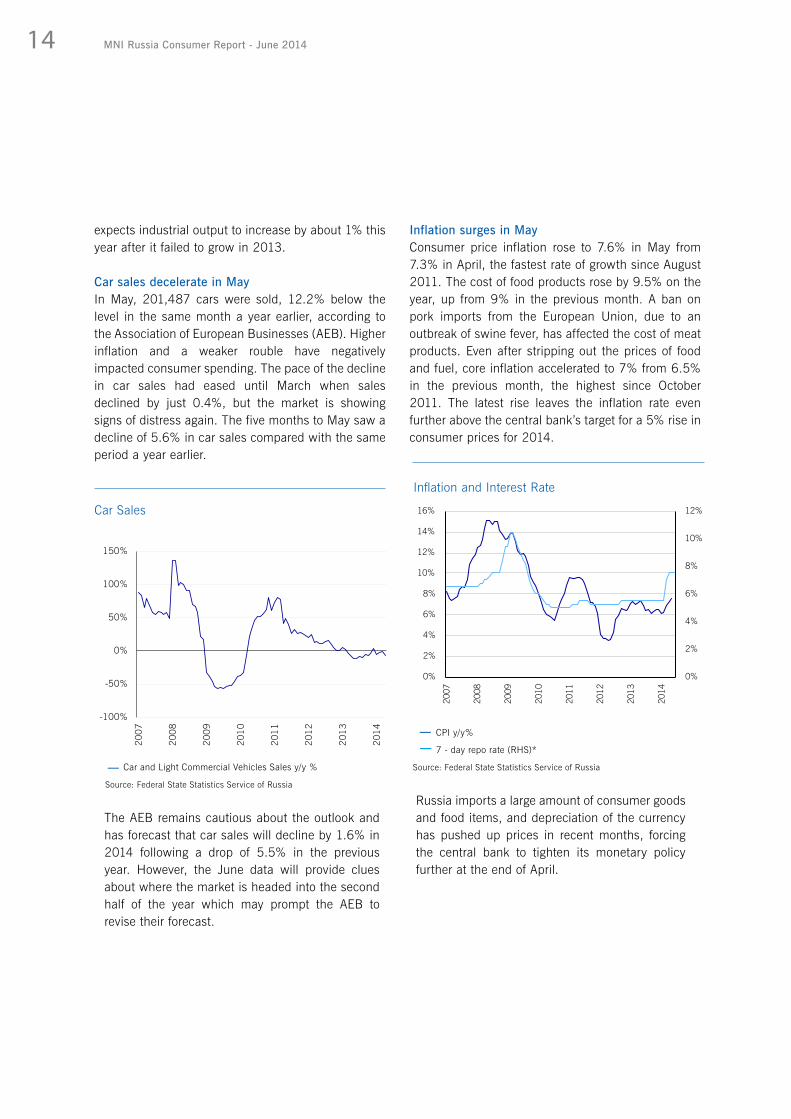
Inflation surges in MayConsumer price inflation rose to 7.6% in May from 7.3% in April, the fastest rate of growth since August 2011. The cost of food products rose by 9.5% on the year, up from 9% in the previous month. A ban on pork imports from the European Union, due to an outbreak of swine fever, has affected the cost of meat products. Even after stripping out the prices of food and fuel, core inflation accelerated to 7% from 6.5% in the previous month, the highest since October 2011. The latest rise leaves the inflation rate even further above the central bank’s target for a 5% rise in consumer prices for 2014.
The AEB remains cautious about the outlook and has forecast that car sales will decline by 1.6% in 2014 following a drop of 5.5% in the previous year. However, the June data will provide clues about where the market is headed into the second half of the year which may prompt the AEB to revise their forecast.
Russia imports a large amount of consumer goods and food items, and depreciation of the currency has pushed up prices in recent months, forcing the central bank to tighten its monetary policy further at the end of April.
Inflation and Interest Rate
CPI y/y%
7 - day repo rate (RHS)*
Source: Federal State Statistics Service of Russia
0%
2%
4%
6%
8%
10%
12%
0%
2%
4%
6%
8%
10%
12%
14%
16%
2007
2008
2009
2010
2011
2012
2013
2014
Car Sales
-100%
-50%
0%
50%
100%
150%
2007
2008
2009
2010
2011
2012
2013
2014
Car and Light Commercial Vehicles Sales y/y %
Source: Federal State Statistics Service of Russia
15MNI Russia Consumer Report - June 2014
the corridor where it carries out no interventions to 5.1 roubles from 3.1 roubles. This makes the rouble more flexible within its floating corridor, which presently stretches from 36.40 to 43.40 against the basket, with no central bank interventions at all in a broad range in the middle of this corridor. The move is part of the bank’s aim to adopt inflation targeting from the start of next year. It was forced to pause the shift towards inflation targeting in early March in order to halt the rouble’s decline after Russia annexed Crimea.
Trade surplus narrows in MayRussia’s trade surplus narrowed to $18.7 billion in May, from $19.8 billion a month earlier, although above $14.1 billion recorded a year earlier.
Exports increased to $44.7 billion in May, 9% above the same period a year ago, although below April’s reading of $47.6 billion. Imports declined for the fifth consecutive month to $26 billion, down by 2.3% on the year and almost 6% below April’s reading of $27.6 billion.
Key policy rate unchangedOn June 16, the Russian central bank left its benchmark interest rate at 7.5% as expected. The bank cited continued concerns about high rate of inflation, and cautioned that further rate hikes were possible if inflation remained above the target. The central bank last hiked rates in April by 50 basis points to 7.5% due to the greater than expected impact of the rouble devaluation on inflation.
The recent rate hikes are yet to have an impact on inflation and the Central Bank is open to further rate hikes if price rise remain above the target.
Depreciation in the roubleThe rouble has been one of the most volatile emerging market currencies in 2014 due to alarming levels of capital flowing out of the country following Russia’s annexation of Crimea. In June, the rouble was 5.1% below the level seen in the same period a year ago. However, the rouble has strengthened somewhat over the past two months as international tensions have calmed slightly.
Foreign exchange reserves in Russia decreased to $467.2 billion in May from $472.3 billion in April as the country has tried to protect the rouble from capital flight.
Capital outflows from Russia’s private sector stood at $63.7 billion in Q1 2014 owing to the financial instability. This compared with an outflow of $59.7 billion during the whole of 2013. About $7.4 billion left Russia in May, down from $8.8 billion in the previous month. The bank expects $90 billion in net outflow this year, which seems to be overly optimistic.
The central bank reduced the intervention threshold for moving the rouble’s floating corridor against a dollar-euro basket to $1 billion from $1.5 billion. It also reduced the amount of daily interventions by $100 million, and widened the range in the middle of

MNI China Consumer Report - July 201316
The MNI Russia Consumer Indicator declined for the fourth consecutive month and confidence was well below the level seen at the start of the year as concerns about Russia falling into recession have mounted.
Indicators
17MNI Russia Consumer Report - June 2014
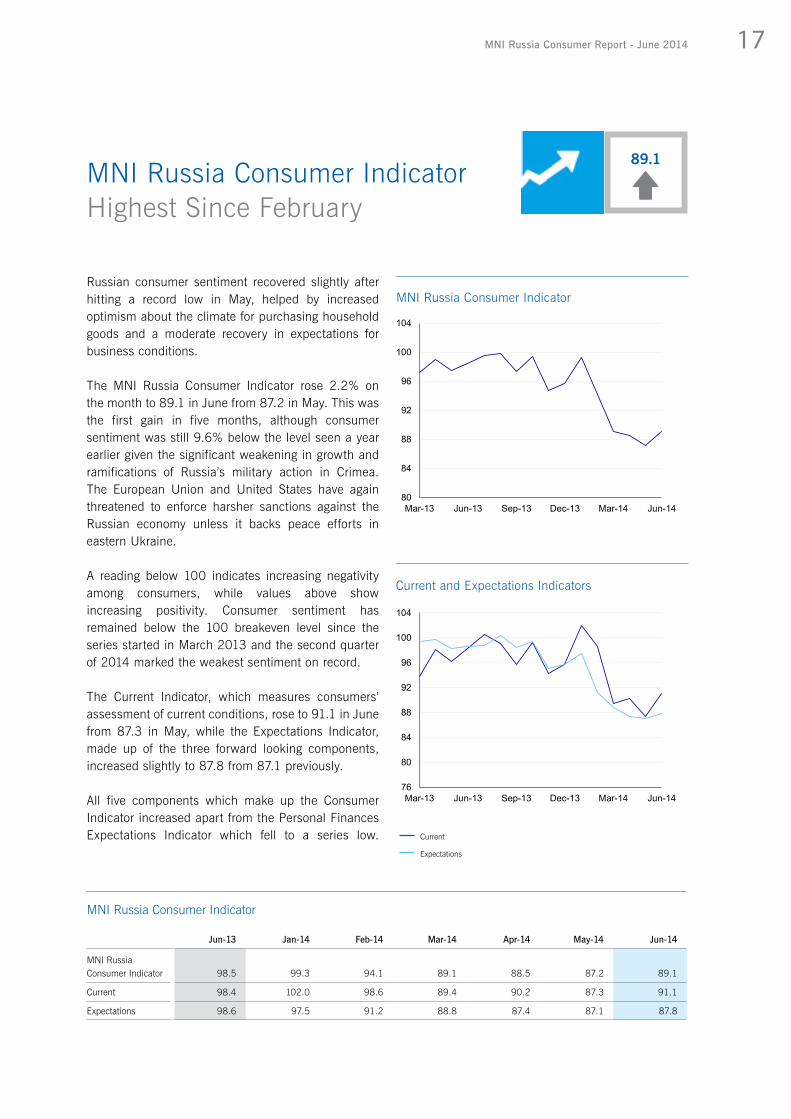
Russian consumer sentiment recovered slightly after hitting a record low in May, helped by increased optimism about the climate for purchasing household goods and a moderate recovery in expectations for business conditions.
The MNI Russia Consumer Indicator rose 2.2% on the month to 89.1 in June from 87.2 in May. This was the first gain in five months, although consumer sentiment was still 9.6% below the level seen a year earlier given the significant weakening in growth and ramifications of Russia’s military action in Crimea. The European Union and United States have again threatened to enforce harsher sanctions against the Russian economy unless it backs peace efforts in eastern Ukraine.
A reading below 100 indicates increasing negativity among consumers, while values above show increasing positivity. Consumer sentiment has remained below the 100 breakeven level since the series started in March 2013 and the second quarter of 2014 marked the weakest sentiment on record.
The Current Indicator, which measures consumers’ assessment of current conditions, rose to 91.1 in June from 87.3 in May, while the Expectations Indicator, made up of the three forward looking components, increased slightly to 87.8 from 87.1 previously.
All five components which make up the Consumer Indicator increased apart from the Personal Finances Expectations Indicator which fell to a series low.
89.1MNI Russia Consumer Indicator Highest Since February
MNI Russia Consumer Indicator
Jun-13 Jan-14 Feb-14 Mar-14 Apr-14 May-14 Jun-14
MNI Russia Consumer Indicator 98.5 99.3 94.1 89.1 88.5 87.2 89.1
Current 98.4 102.0 98.6 89.4 90.2 87.3 91.1
Expectations 98.6 97.5 91.2 88.8 87.4 87.1 87.8
80
84
88
92
96
100
104
Mar-13 Jun-13 Sep-13 Dec-13 Mar-14 Jun-14
MNI Russia Consumer Indicator
76
80
84
88
92
96
100
104
Mar-13 Jun-13 Sep-13 Dec-13 Mar-14 Jun-14
Current and Expectations Indicators
Current
Expectations

18 MNI Russia Consumer Report - June 2014
89.1
91.1
87.8
Total Indicator Current Indicator Expectations Indicator
All Russia
94.4
99.1
91.3
Total Indicator Current Indicator Expectations Indicator
Central Russia
87.8
77.9
94.5
Total Indicator Current Indicator Expectations Indicator
West Siberian
93.2
96.1
91.2
Total Indicator Current Indicator Expectations Indicator
Volga
75.3
83.1
70.1
Total Indicator Current Indicator Expectations Indicator
Urals
87.2
78.7
92.8
Total Indicator Current Indicator Expectations Indicator
North Caucasus

19MNI Russia Consumer Report - June 2014
Consumers, though, felt slightly better about their current financial situation.
The Durable Buying Conditions Indicator contributed the most to the rise in the headline indicator, putting it back above the average for the series of 99.1.
RegionsThe rise in the MNI Russia Consumer Indicator was led by all major regions apart from the Urals, where sentiment declined to the lowest since the start of the survey. In Urals, confidence declined to 75.3 from 83.3 in May. Consumers were highly pessimistic about the coming 12 months, with all three forward looking components declining on the month. There was a sharp jump in consumers’ Current Personal Finances although buying conditions fell to the lowest since January. Among the top five regions, respondents from Central Russia had the strongest consumer sentiment on the month.
Respondents from the Volga region posted a significant jump of 21.1% in consumer sentiment, with the indicator increasing to the highest since January.
AgeConsumer sentiment fell among the youngest age group but rose in older age groups. Consumer confidence in the youngest group hit a record low in June. The Consumer Indicator for the 18-34 year age range declined to 88.1 from 89.5 in May. All five components of the Consumer Indicator fell, apart from Business Conditions in Five Years. Consumers’ perceptions of current and future Personal Finances hit a series low and their willingness to buy large household goods dropped to the lowest since November 2013.
0.2
-0.8
0.7
0.6
1.5
Personal Finances: Current
Personal Finances: Expected
Business Conditions: 1 Year
Business Conditions: 5 Years
Durable Buying Conditions
Consumer Indicator: Contribution to Monthly Change (% pt.)

20 MNI Russia Consumer Report - June 2014
Consumer sentiment among 35-54 year olds rose for the first time in four months to 90.6 in June from 85.1 in May. There was a sharp uptick in consumers’ Current Personal Finances and their propensity to purchase big ticket items. Respondents were least confident about Business Conditions in Five Years with the indicator falling to a series low in June.
For the oldest age range, 55-65 year olds, consumer confidence rose to the highest since March, to 88.3 in June from 83.7 in May. Consumers were highly dissatisfied with their Personal Finances, both current and expected. In spite of this, they witnessed a sharp rise in the Durable Buying Conditions Indicator which rose above the 100 expansion/contraction level to the highest since January. Consumers were also more hopeful about Business Conditions, as seen by double digit rises in both short and long term expectations.
IncomeConsumer confidence increased in low income groups while it declined slightly in high income households in June.
The Consumer Indicator for households with an average annual income of over INR 432,000 declined to 97.1 from 97.7 in May, the first fall in three months. For households with an average annual income under INR 432,000, the indicator rose 4.5% on the month to 84.3 from 80.6 in May.
Compared with the previous year, confidence was 1.6% lower among higher income households, while for lower income households it was 11.7% lower. On average, though, the level of confidence remains greater for higher income households. Our survey shows that low income households have been hit the most while wealthier ones have not been impacted much by the current political and economic tension.
89.1
88.1
90.6
88.3
All 18-34 35-54 55-64
Consumer Indicator: Age Groups

21MNI Russia Consumer Report - June 2014
84.3
84.8
83.9
Total Indicator Current Indicator Expectations Indicator
< RUB 480,000 Per Annum
97.1
101.6
94.0
Total Indicator Current Indicator Expectations Indicator
> RUB 480,000 Per Annum
MNI Russia Consumer IndicatorIncome Groups
22 MNI Russia Consumer Report - June 2014
MNI Russia Consumer IndicatorMain Cities
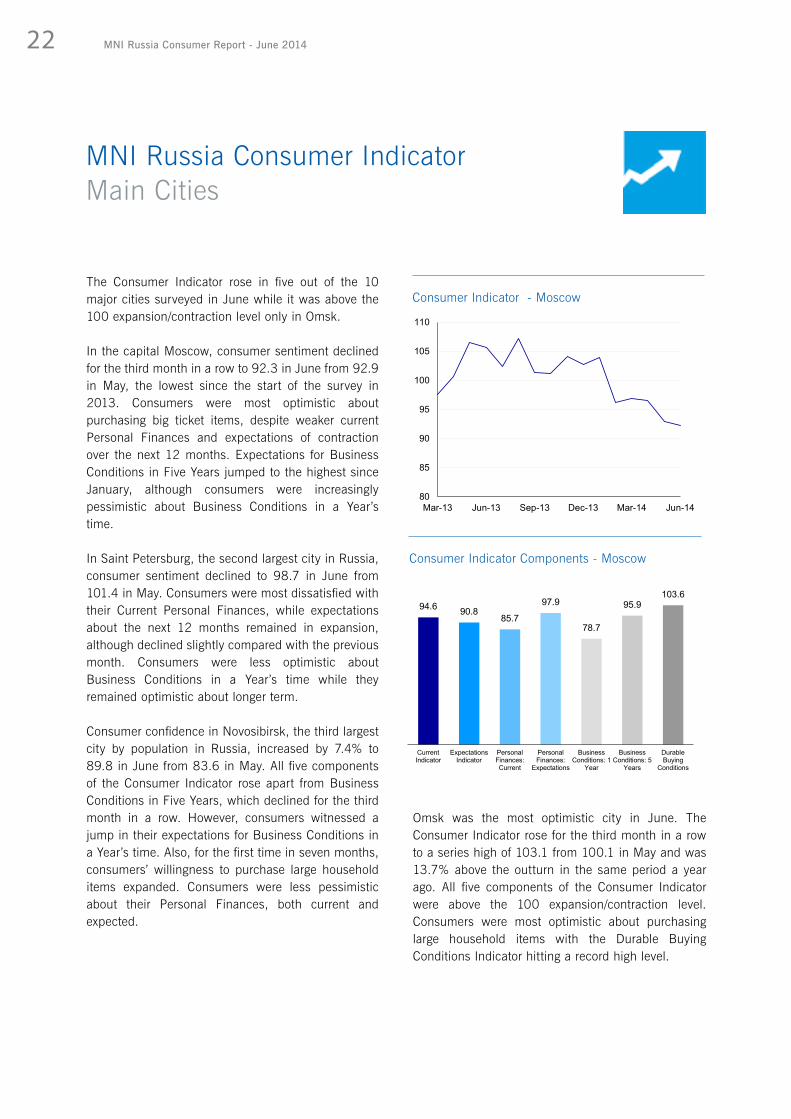
The Consumer Indicator rose in five out of the 10 major cities surveyed in June while it was above the 100 expansion/contraction level only in Omsk.
In the capital Moscow, consumer sentiment declined for the third month in a row to 92.3 in June from 92.9 in May, the lowest since the start of the survey in 2013. Consumers were most optimistic about purchasing big ticket items, despite weaker current Personal Finances and expectations of contraction over the next 12 months. Expectations for Business Conditions in Five Years jumped to the highest since January, although consumers were increasingly pessimistic about Business Conditions in a Year’s time.
In Saint Petersburg, the second largest city in Russia, consumer sentiment declined to 98.7 in June from 101.4 in May. Consumers were most dissatisfied with their Current Personal Finances, while expectations about the next 12 months remained in expansion, although declined slightly compared with the previous month. Consumers were less optimistic about Business Conditions in a Year’s time while they remained optimistic about longer term.
Consumer confidence in Novosibirsk, the third largest city by population in Russia, increased by 7.4% to 89.8 in June from 83.6 in May. All five components of the Consumer Indicator rose apart from Business Conditions in Five Years, which declined for the third month in a row. However, consumers witnessed a jump in their expectations for Business Conditions in a Year’s time. Also, for the first time in seven months, consumers’ willingness to purchase large household items expanded. Consumers were less pessimistic about their Personal Finances, both current and expected.
80
85
90
95
100
105
110
Mar-13 Jun-13 Sep-13 Dec-13 Mar-14 Jun-14
Consumer Indicator - Moscow
94.6 90.885.7
97.9
78.7
95.9103.6
CurrentIndicator
ExpectationsIndicator
PersonalFinances:Current
PersonalFinances:
Expectations
BusinessConditions: 1
Year
BusinessConditions: 5
Years
DurableBuying
Conditions
Consumer Indicator Components - Moscow
Omsk was the most optimistic city in June. The Consumer Indicator rose for the third month in a row to a series high of 103.1 from 100.1 in May and was 13.7% above the outturn in the same period a year ago. All five components of the Consumer Indicator were above the 100 expansion/contraction level. Consumers were most optimistic about purchasing large household items with the Durable Buying Conditions Indicator hitting a record high level.

23MNI Russia Consumer Report - June 2014
80
85
90
95
100
105
Mar-13 Jun-13 Sep-13 Dec-13 Mar-14 Jun-14
Consumer Indicator - Saint Petersburg
70
80
90
100
110
Mar-13 Jun-13 Sep-13 Dec-13 Mar-14 Jun-14
Consumer Indicator - Novosibirsk
94.6
101.5
91.6
103.6
94.9
106.2
97.5
CurrentIndicator
ExpectationsIndicator
PersonalFinances:Current
PersonalFinances:
Expectations
BusinessConditions: 1
Year
BusinessConditions: 5
Years
DurableBuying
Conditions
Consumer Indicator Components - Saint Petersburg
89.2 90.1
77.0
90.3 89.5 90.6101.5
CurrentIndicator
ExpectationsIndicator
PersonalFinances:Current
PersonalFinances:
Expectations
BusinessConditions: 1
Year
BusinessConditions: 5
Years
DurableBuying
Conditions
Consumer Indicator Components - Novosibirsk

MNI Russia Consumer Report - June 201424
Respondents were slightly more confident about their finances in the current month while expectations for the next 12 months declined to the lowest level on record.
The Current Personal Finances Indicator, which measures whether a household is better or worse off than a year ago, rose to 80.3 in June from 79.6 in May. In spite of the month’s gain, the indicator was 19.3% below the levels seen in the previous year.
Out of those who reported that their financial conditions improved, the majority cited better income as the main reason, although fewer than the previous month. However, a growing proportion gave credit to better family expenses.
Consumers have been hit by higher inflation and the weaker rouble this year which has impacted their personal disposable income, savings and their ability to purchase goods. In June, 98.6% of respondents spent 70-100% of their monthly household income on daily expenses, the highest since the start of the survey, while 79.3% of respondents said they were saving between just 1-29% of their monthly household income.
Expected Personal Finances, which measures whether households think their finances will be better in a year’s time, declined to a record low level of 91.5 in June from 95.0 in the previous month. It was the fifth month that expectations have been below the 100 breakeven mark.
80.3Personal Finances Expectations Hit Record Low
Personal Finances
Jun-13 Jan-14 Feb-14 Mar-14 Apr-14 May-14 Jun-14
Current 99.5 99.3 87.3 79.5 83.7 79.6 80.3
Expectations 102.4 101.2 96.3 96.3 93.4 95.0 91.5
50
60
70
80
90
100
110
120
Mar-13 Jun-13 Sep-13 Dec-13 Mar-14 Jun-14
Personal Finances
Current
Expectations
25.9%
8.9%65.2%
0.1%
Current Financial Situation Compared with 1 Year Ago (% of Households)
Much Better
A Little Better
Same
A Little Worse
Much Worse
Don‘t Know/No Answer

MNI Russia Consumer Report - June 2014 25
0.1%
1.3%
98.6%
Daily Expenses (% of Households)
20.5%
79.3%
0.2%
Monthly Household Income Used for Savings (% of Households)
93.4%
5.2% 1.4%
Monthly Household Income Used for Large Loan Repayment (% of Households)
47.6%52.4%
Monthly Household Income Used for Investments(% of Households)
How Households Spend their Money
0% - 29% of Income
30% - 49% of Income
0% of Income
1% - 29% of Income
0% of Income
1% - 29% of Income
0% of Income
1% - 29% of Income
50% - 69% of Income
70% - 100% of Income
30% - 49% of Income
50% - 100% of Income
30% - 49% of Income
50% - 100% of Income
30% -49% of Income
50% - 100% of Income

MNI Russia Consumer Report - June 201426
Consumers were more confident about the current business climate and were more hopeful about business conditions over the short and long term, although overall consumers’ views on business remained pessimistic. The Current Business Conditions Indicator, which measures respondents’ views on the state of business compared with a year earlier, rose for the first time in three months to 91.0 in June from 85.5 in May. Hit by sanctions amid the Ukraine crisis, current business sentiment has declined considerably since the start of the year and was almost 7% below the same period a year ago.
About 23% of respondents thought conditions were “poor” or “very poor” while 66.1% of them thought they were “only fair”. Increasing concerns that wider sanctions could be levied against Russian businesses has dented their perceptions.
The Indicator for Business Conditions in One Year rose 3.8% on the month to 80.7 in June from 77.7 in May, the highest since February. The majority of those who expected business conditions to be better in a year’s time cited economic development as the main reason.
91.0Business ConditionsLonger Term Expectations Highest Since January
Business Conditions
Jun-13 Jan-14 Feb-14 Mar-14 Apr-14 May-14 Jun-14
Current 97.7 100.3 97.5 99.2 95.7 85.5 91.0
In 1 Year 97.8 95.1 87.8 79.4 77.8 77.7 80.7
In 5 Years 95.7 96.4 89.4 90.7 91.1 88.6 91.2
83
85
87
89
91
93
95
97
99
101
103
Mar-13 Jun-13 Sep-13 Dec-13 Mar-14 Jun-14
Current Business Conditions Indicator
50
60
70
80
90
100
110
Mar-13 Jun-13 Sep-13 Dec-13 Mar-14 Jun-14
Expected Business Conditions
1 Year
5 Years
MNI Russia Consumer Report - June 2014 27
Business Conditions in 1 Year
Government/Policy
Econ. Development
Income/Employment
Resource/Environment
Social Stability/ Security
Events
Government/Policy
Econ. Development
Income/Employment
Resource/Environment
Social Stability/ Security
Events
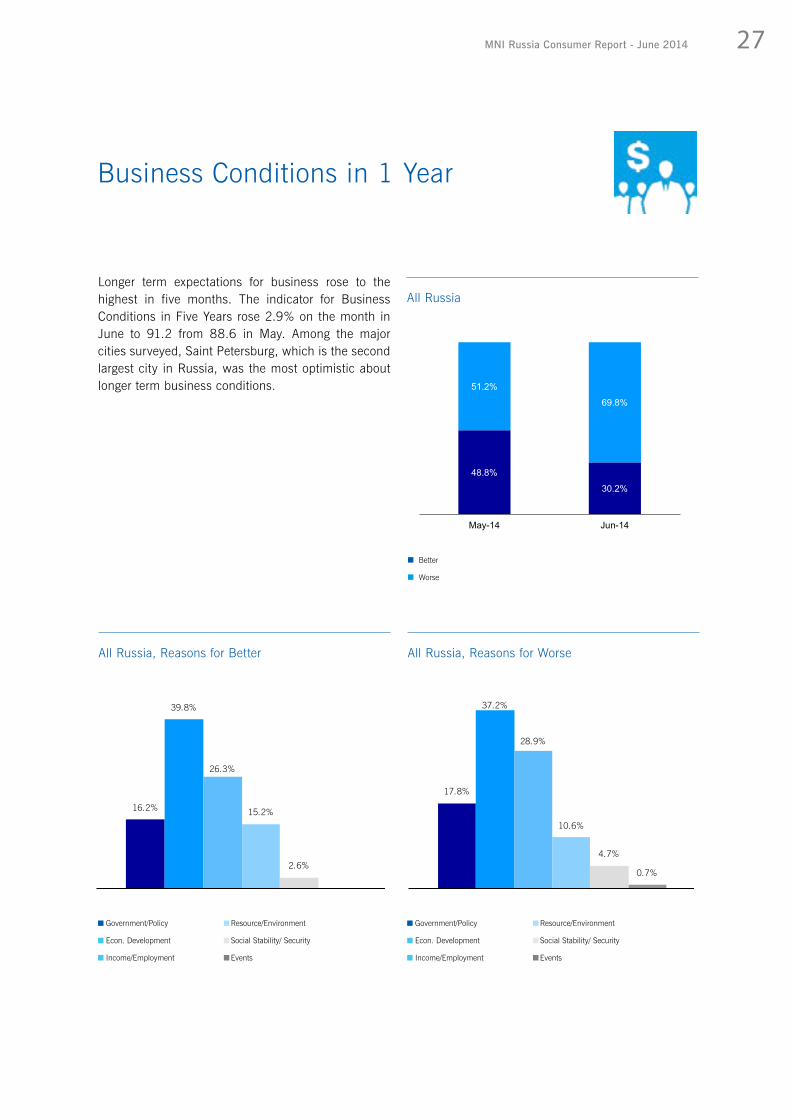
16.2%
39.8%
26.3%
15.2%
2.6%
All Russia, Reasons for Better
17.8%
37.2%
28.9%
10.6%
4.7%
0.7%
All Russia, Reasons for Worse
48.8%
30.2%
51.2%
69.8%
May-14 Jun-14
All RussiaLonger term expectations for business rose to the highest in five months. The indicator for Business Conditions in Five Years rose 2.9% on the month in June to 91.2 from 88.6 in May. Among the major cities surveyed, Saint Petersburg, which is the second largest city in Russia, was the most optimistic about longer term business conditions.
Better
Worse

MNI Russia Consumer Report - June 201428
Business Conditions in 1 YearRegions
Central NorthCaucasus
Urals Volga WestSiberian
Reasons for Better(% of Respondents)
28.4% 28.2%
9.2%
59.5%
27.5%
71.6% 71.8%
90.8%
40.5%
72.5%
Central North Caucasus Urals Volga West Siberian
Business Expectations: Worse or Better?(% of Respondents)
Central NorthCaucasus
Urals Volga WestSiberian
Reasons for Worse (% of Respondents)
Better
Worse
Government/Policy
Econ. Development
Income/Employment
Resource/Environment
Social Stability/ Security
Events
Government/Policy
Econ. Development
Income/Employment
Resource/Environment
Social Stability/ Security
Events
29MNI Russia Consumer Report - June 2014
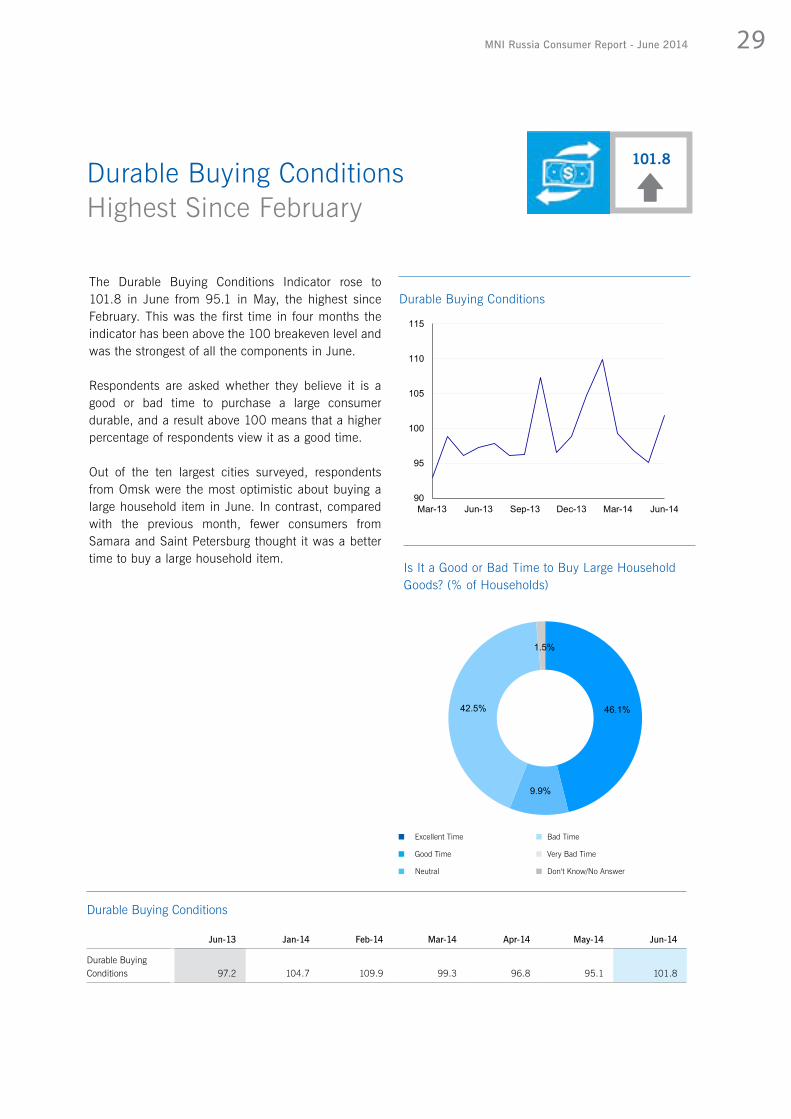
The Durable Buying Conditions Indicator rose to 101.8 in June from 95.1 in May, the highest since February. This was the first time in four months the indicator has been above the 100 breakeven level and was the strongest of all the components in June. Respondents are asked whether they believe it is a good or bad time to purchase a large consumer durable, and a result above 100 means that a higher percentage of respondents view it as a good time.
Out of the ten largest cities surveyed, respondents from Omsk were the most optimistic about buying a large household item in June. In contrast, compared with the previous month, fewer consumers from Samara and Saint Petersburg thought it was a better time to buy a large household item.
Durable Buying Conditions Highest Since February
Durable Buying Conditions
Jun-13 Jan-14 Feb-14 Mar-14 Apr-14 May-14 Jun-14
Durable Buying Conditions 97.2 104.7 109.9 99.3 96.8 95.1 101.8
101.8
90
95
100
105
110
115
Mar-13 Jun-13 Sep-13 Dec-13 Mar-14 Jun-14
Durable Buying Conditions
46.1%
9.9%
42.5%
1.5%
Is It a Good or Bad Time to Buy Large Household Goods? (% of Households)
Excellent Time
Good Time
Neutral
Bad Time
Very Bad Time
Don‘t Know/No Answer

30 MNI Russia Consumer Report - June 2014
The outlook for the employment market deteriorated further in June, albeit only marginally as consumers’ concerns over the state of the economy mounted.
The Employment Outlook Indicator, which measures opinion on the outlook for the employment market over the next 12 months fell to 87.5 in June from 87.8 in May, the lowest reading since February. The labour market has deteriorated significantly in 2014, with the Employment Outlook Indicator hitting a series low in the second quarter of the year.
Respondents from the North Caucasus were the most optimistic and the only one for which the indictor was above the 100 expansion/contraction level. In contrast, there was a sharp decline in the employment outlook in the Urals region where the proportion of respondents who were unsure about the labour market also rose significantly.
Official statistics showed that the unemployment rate declined in May to 4.9% from 5.3% in April. But results from the June edition of our sister survey on Russian Businesses showed that companies’ hiring declined for the first time in five months and that they were also less optimistic about employment conditions in the next three months.
Employment OutlookLowest Since February
Employment Outlook
Jun-13 Jan-14 Feb-14 Mar-14 Apr-14 May-14 Jun-14
Employment Outlook 99.1 87.2 86.5 92.9 90.9 87.8 87.5
75
80
85
90
95
100
105
Mar-13 Jun-13 Sep-13 Dec-13 Mar-14 Jun-14
Employment Outlook Indicator
8.9%
57.3%
28.0%
2.9%
2.9%
Employment Outlook for the Next 12 Months (% of Households)
87.5
Much Better
A Little Better
Same
A Little Worse
Much Worse
Don‘t Know/No Answer

31MNI Russia Consumer Report - June 2014
High prices remained a serious concern among consumers in June as their dissatisfaction with the current level of prices increased significantly, and expectations for inflation rose to a series high.
The Current Prices Satisfaction Indicator fell to 65.0 in June from 73.4 in May. It lies well below the average of 76.5 for the past 12 months and the series average. A figure below 100 indicates wider dissatisfaction with the current level of prices. The further below 100, the greater the dissatisfaction. The indicator has remained below 100 since the survey started in March 2013 and in June, it was 24.4% below the same period a year earlier.
Official data showed that consumer price inflation rose to 7.6% in May from 7.3% in April, the fastest rate of growth since August 2011. The cost of food products rose by 9.5% on the year, up from 9% in the previous month. A ban on pork imports from the European Union, due to an outbreak of swine fever, hasn’t helped and has pushed up the cost of meat products. The latest rise leaves the inflation rate even further above the central bank’s target of 5% for 2014.
Expectations for inflation in 12 months’ time rose in June to 146.3 from 144.6 in May, the highest reading since the start of the survey. This was the third month in a row that an increasing number of respondents expected prices to rise over the coming 12 months. The Russian central bank has raised official interest
Prices SentimentDissatisfaction at Record High Levels
Prices Sentiment
Jun-13 Jan-14 Feb-14 Mar-14 Apr-14 May-14 Jun-14
Satisfaction with Current Prices 86.0 69.4 74.4 76.3 67.5 73.4 65.0
Inflation Expec-tations 133.2 136.9 140.9 139.2 144.2 144.6 146.3
60
65
70
75
80
85
90
Mar-13 Jun-13 Sep-13 Dec-13 Mar-14 Jun-14
Satisfaction with Current Prices Indicator
126
131
136
141
146
151
Mar-13 Jun-13 Sep-13 Dec-13 Mar-14 Jun-14
Inflation Expectations Indicator
65.0

32 MNI Russia Consumer Report - June 2014
2.9%
41.3%
38.0%
17.4%
0.3%
Satisfaction with Current Prices (% of Households)
Very Satisfied
Quite Satisfied
So So
Not Very Satisfied
Not Satisfied At All
Don‘t Know/No Answer
16.9%
59.7%
21.9%
0.9% 0.7%
Inflation Expectations in 12 Months (% of Households)
Much Higher
A Little Higher
Same
A Little Lower
Much Lower
Don‘t Know/No Answer
rates by 200 basis points to 7.5% since the start of 2014 in a bid to both control inflation and to stabilise the currency. While governor Elvira Nabiullina has said that the current monetary policy may achieve the bank’s medium-term inflation goals, the central bank has made it clear that it will tighten monetary policy stance further should inflation remain too high.
Since October, most respondents had expected prices to rise between 11-24% over the next year, but this has changed in the past three months. The proportion of respondents who thought prices would rise by over 25% represented the majority, likely due to fears that the depreciation in the currency will adversely impact inflation.
RegionsSatisfaction with Current Prices declined in all regions apart from West Siberia, where it rose for the first time in three months. There was a large drop in satisfaction levels in Urals and Volga, the former being the least satisfied with the current level of prices.
Consumers from Volga, North Caucasus and Urals reported lower expectations for future prices. Respondents from the Urals region had the highest inflationary expectations over the next 12 months.
Prices SentimentRegions

33MNI Russia Consumer Report - June 2014
65.0 66.872.4
42.046.0
92.1
All Russia Central NorthCaucasus
Urals Volga WestSiberian
Current Prices Satisfaction Indicator
146.3 149.7
123.9
157.7 153.0 147.3
All Russia Central NorthCaucasus
Urals Volga WestSiberian
Inflation Expectations Indicator
All Russia Central NorthCaucasus
Urals Volga WestSiberian
Satisfaction with Current Prices (% of Households)
Very Satisfied
Quite Satisfied
Neutral
Not Very Satisfied
Not Satisfied At All
Don‘t Know/No Answer
Central NorthCaucasus
Urals Volga WestSiberian
Expected Change in Prices in 1 Year(% of Households)
Much Higher
A Little Higher
Same
A Little Lower
Much Lower
Don‘t Know/No Answer

34 MNI Russia Consumer Report - June 2014
The Interest Rate Expectations Indicator rose for the third consecutive month to a new series high of 126.8 in June compared with 126.0 in the previous month.
The indicator has remained above 100 since the survey started in March 2013, indicating that more households expected interest rates to rise than fall in the coming year, with the second quarter of 2014 marking the highest on record.
On June 16, the Russian central bank left its benchmark interest rate at 7.5% as expected. The bank cited continued concerns about the high rate of inflation, and cautioned that further rate hikes were possible if inflation remained above the target. The central bank last hiked the key rate in April by 50 basis points to 7.5%, citing the greater than expected impact of the rouble devaluation on inflation.
Survey participants forecasting that interest rates on home and car loans would be higher in a year’s time rose to 45% in June from 43.7% in May. The percentage of respondents expecting interest rates would be the same fell further to almost 45% from 47.9% in May, the lowest since 2013.
Interest Rate ExpectationsHits a New Record High
Interest Rate Expectations
Jun-13 Jan-14 Feb-14 Mar-14 Apr-14 May-14 Jun-14
Interest Rate Expectations 112.3 115.9 122.6 119.2 122.3 126.0 126.8
126.8
100
110
120
130
Mar-13 Jun-13 Sep-13 Dec-13 Mar-14 Jun-14
Interest Rate Expectations Indicator
13.7%
31.3%44.9%
5.1%
5.0%
Expected Change in Interest Rate in 1 year (% of Households)
Much Higher
A Little Higher
Same
A Little Lower
Much Lower
Don‘t Know/No Answer

35MNI Russia Consumer Report - June 2014
While general levels of confidence rose in June, consumers’ confidence about the real estate market remained broadly stable for the second consecutive month. The Real Estate Investment Indicator, which is made up of three components (House Price Expectations, House Buying Sentiment and House Selling Sentiment), stood at 108.2 in June compared with 108.0 in May.
The House Price Expectations component, which measures the outlook for prices over the coming six months, remained stable, posting a reading of 139.5 in June compared with 139.3 in May.
Consumers’ sentiment about purchasing a house rose for the first time in five months, albeit only slightly. House Buying Sentiment, a measure of whether it is a good time in the next six months to buy a home, rose to 83.6 in June from 82.6 in May.
House Selling Sentiment, a measure of whether it is a good time in the next six months to sell a house, stood at 98.5 in June compared with 97.8 in May. The measure has a negative impact on the Real Estate Investment Indicator.
Real Estate Investment Remains Broadly Stable
Real Estate Investment Sentiment
Jun-13 Jan-14 Feb-14 Mar-14 Apr-14 May-14 Jun-14
Real Estate Invest-ment Sentiment 107.9 112.1 111.4 110.0 107.2 108.0 108.2
Price Expectations 122.9 135.7 139.0 140.1 137.7 139.3 139.5
House Buying 100.5 99.7 96.8 87.3 84.5 82.6 83.6
House Selling 99.8 99.0 101.6 97.4 100.7 97.8 98.5
108.2
100
102
104
106
108
110
112
114
Mar-13 Jun-13 Sep-13 Dec-13 Mar-14 Jun-14
Real Estate Investment Indicator
0.1
0.3
-0.2
House Price Expectations
House Buying Sentiment
House Selling Sentiment
Real Estate Investment Indicator: Contribution to Monthly Change (% pt.)

36 MNI Russia Consumer Report - June 2014
105
110
115
120
125
130
135
140
145
Mar-13 Jun-13 Sep-13 Dec-13 Mar-14 Jun-14
Real Estate Prices: Expected Changes
108.0
139.3
82.697.8
108.2
139.5
83.698.5
Real EstateInvestmentIndicator
House PriceExpectations
House BuyingSentiment
House SellingSentiment
Real Estate Investment Indicator - Components
All Russia Central NorthCaucasus
Urals Volga
Expected Changes in Real Estate Prices in the Next 6 months (% of Households)
Real Estate InvestmentComponents and Balances
RegionsThe Real Estate Investment Indicator improved in the Volga region, remained broadly stable in Urals and West Siberian regions and declined in the Central and North Caucasus.
Consumers in the Volga region recorded a jump in housing sentiment with the Real Estate Investment Indicator rising above the 100 expansion/contraction level for the first time in three months. Consumers’ sentiment about buying a house rose considerably and many expected higher house prices in the coming six months.
In Central Russia, real estate investment sentiment declined to the lowest since December as consumers’ sentiment for purchasing a house weakened, while they were keener on selling a house.
May 2014
June 2014
Go Up Dramatically
Go Up Slightly
Stay the Same
Gow Down Slightly
Go Down Sharply
Don‘t Know/No Answer

37MNI Russia Consumer Report - June 2014
80
85
90
95
100
105
110
115
Mar-13 Jun-13 Sep-13 Dec-13 Mar-14 Jun-14
House Buying Sentiment
90
95
100
105
Mar-13 Jun-13 Sep-13 Dec-13 Mar-14 Jun-14
House Selling Sentiment
33.2%
5.2%
30.0%
0.5%
22.0%
9.2%
Reasons for Buying Houses (% of Households)
14.9%
61.1%
16.8%
0.6%6.6%
Timing for Selling Houses (% of Households)
Excellent Time
Good Time
Neutral
Bad Time
Very Bad Time
Don‘t Know/No Answer
Prices
Income/Purchasing Power
Investment Value
Policy/Interest Rate
Supply and Quality
Others

38 MNI Russia Consumer Report - June 2014
The Car Purchase Indicator rose slightly from a record low in May as a rise in car buying expectations outweighed a record hike in expectations for the price of gasoline. The Indicator rose to 79.8 from 79.3 in the previous month, although was still down nearly 9% compared with a year ago.
The Car Purchase Expectations component, which gauges whether consumers believe it is a good or bad time to purchase a car over the next 12 months, rose for the first time in four months after falling below the 100 expansion/contraction line in May. There was a shift in consumers’ perception from seeing it as a “bad” or an “okay” time to buy a car to a “good” one, as the component rose 4% to 103.0 in June from 99.1 in May.
Of those consumers who felt it was a good time to purchase a car, there was a significant increase in the number of respondents who cited income and purchasing power as the main reason. The majority of consumers gave credit to better supply and quality for their willingness to purchase a car.
According to the Association of European Businesses, sales of new cars declined 12.2% on the year in May and were 11.1% below April’s total. Higher inflation and a weaker rouble have negatively impacted consumer spending on cars.
About three-quarters of consumers thought the price of gasoline would rise in the next 12 months. Expectations for the Price of Gasoline increased to 143.4 in June from 140.5 in May, the highest reading since the start of the survey.
Car Purchase Expectations for Gasoline Prices Hit Record High
70
80
90
100
Mar-13 Jun-13 Sep-13 Dec-13 Mar-14 Jun-14
Car Purchase Indicator
80
90
100
110
120
130
140
150
Mar-13 Jun-13 Sep-13 Dec-13 Mar-14 Jun-14
Car Purchase Indicator - Components
Car Purchase Expectations
Price of Gasoline
Car Purchase Sentiment
Jun-13 Jan-14 Feb-14 Mar-14 Apr-14 May-14 Jun-14
Car Purchase Sentiment 87.5 83.3 88.3 85.1 82.2 79.3 79.8
Car Purchase Expectations 107.5 104.4 110.5 106.0 103.8 99.1 103.0
Price of Gasoline 132.4 137.7 133.8 135.8 139.4 140.5 143.4
79.8

39MNI Russia Consumer Report - June 2014
111.6
75.2
103.2111.4
80.5
Central NorthCaucasus
Urals Volga WestSiberian
Car Purchase Expectations - Regions
All Russia Central NorthCaucasus
Urals Volga WestSiberian
Reasons for a Bad Time to Buy a Car(% of Households)
Prices
Income/Purchasing Power
Policy/Interest Rate
Supply and Quality
Cost of Use/Upkeep
Others
Reasons for a Good Time to Buy a Car(% of Households)
All Russia Central NorthCaucasus
Urals Volga WestSiberian
Prices
Income/Purchasing Power
Policy/Interest Rate
Supply and Quality
Cost of Use/Upkeep
Others
13.3%
61.1%
13.1%
0.9%
11.6%
Expected Change in the Price of Gasoline (% of Households)
Go Up Dramatically
Go Up Slightly
Stay the Same
Gow Down Slightly
Go Down Sharply
Don‘t Know/No Answer

40 MNI Russia Consumer Report - June 2014
MNI Russia Consumer Indicator Regions
78.7
92.8
77.6
101.1
78.1
99.2
79.8
CurrentIndicator
ExpectationsIndicator
PersonalFinances:Current
PersonalFinances:
Expectations
BusinessConditions: 1
Year
BusinessConditions: 5
Years
DurableBuying
Conditions
Consumer Indicator Components: North Caucasus
75
80
85
90
95
100
105
110
Mar-13 Jun-13 Sep-13 Dec-13 Mar-14 Jun-14
Consumer Indicator: North Caucasus
77.9
94.5
75.8
106.9
77.6
98.8
79.9
Current Indicator
Expectations Indicator
Personal Finances: Current
Personal Finances:
Expectations
Business Conditions: 1
Year
Business Conditions: 5
Years
Durable Buying
Conditions
Consumer Indicator Components: West Siberian
70
80
90
100
110
Mar-13 Jun-13 Sep-13 Dec-13 Mar-14 Jun-14
Consumer Indicator: West Siberian

41MNI Russia Consumer Report - June 2014
96.1 91.2
53.9
81.2
113.2
79.4
138.3
CurrentIndicator
ExpectationsIndicator
PersonalFinances:Current
PersonalFinances:
Expectations
BusinessConditions: 1
Year
BusinessConditions: 5
Years
DurableBuying
Conditions
Consumer Indicator Components: Volga
60
70
80
90
100
110
120
Mar-13 Jun-13 Sep-13 Dec-13 Mar-14 Jun-14
Consumer Indicator: Volga
99.191.3 90.3
97.0
83.393.6
107.8
CurrentIndicator
ExpectationsIndicator
PersonalFinances:Current
PersonalFinances:
Expectations
BusinessConditions: 1
Year
BusinessConditions: 5
Years
DurableBuying
Conditions
Consumer Indicator Components: Central
90
95
100
105
110
Mar-13 Jun-13 Sep-13 Dec-13 Mar-14 Jun-14
Consumer Indicator: Central

42 MNI Russia Consumer Report - June 2014
Much Better
A Little Better
About the Same
A Little Worse
Much Worse
Don‘t Know/No Answer
Much Better
A Little Better
About the Same
A Little Worse
Much Worse
Don‘t Know/No Answer
83.1
70.1
80.9
68.1
55.2
86.9 85.3
CurrentIndicator
ExpectationsIndicator
PersonalFinances:Current
PersonalFinances:
Expectations
BusinessConditions: 1
Year
BusinessConditions: 5
Years
DurableBuying
Conditions
Central NorthCaucasus
Urals Volga WestSiberain
Consumer Indicator Components: Urals
Interest Rates Expectations Indicator (% of Households)
70
75
80
85
90
95
100
105
Mar-13 Jun-13 Sep-13 Dec-13 Mar-14 Jun-14
Central NorthCaucasus
Urals Volga WestSiberian
Consumer Indicator: Urals
Employment Indicator Outlook for the Next 12 Months (% of Households)

43MNI Russia Consumer Report - June 2014
MNI Russia Consumer Indicator Income Groups
74.6
88.3
76.1
87.4 94.9
PersonalFinances:Current
PersonalFinances:
Expectations
BusinessConditions: 1
Year
BusinessConditions: 5
Years
DurableBuying
Conditions
< RUB 480,000 - Components
80.6
77.1
82.9
84.384.8
83.9
Total Indicator Current Indicator Expectations Indicator
< RUB 480,000 Per Annum
89.795.2
88.698.3
113.4
PersonalFinances:Current
PersonalFinances:
Expectations
BusinessConditions: 1
Year
BusinessConditions: 5
Years
DurableBuying
Conditions
> RUB 480,000 - Components
97.7
103.9
93.6
97.1
101.6
94.0
Total Indicator Current Indicator Expectations Indicator
> RUB 480,000 Per Annum
May 2014
June 2014
May 2014
June 2014

MNI Russia Consumer Report - June 201444
A selection of comments from the panel of consumers surveyed over the past month.
What the Panel Said

MNI Russia Consumer Report - June 2014 45
“It is a better situation at work, they pay more regularly now.”
“Maintenance of car is not expensive.”
“Expenses for everyday consumption of fresh fruits and vegetables, transportation were higher.”
“Business conditions are pressed, financial position of employees is worsening.”
“Rich people become richer, poor people become poorer.”
“The government solves its own problems, not the problems of its people.”
“If one loses his job, to find a new one is very hard.”
“Home mortgage is too expensive.”
“For a purchase of household equipment, one should wait for seasonal or holiday discounts.”
“Many imported cars are on sale.”
“Business may be closed soon.”
“Prices grow faster than my salary.”
“If you need something, better to buy it shortly, otherwise it will be more expensive.”

MNI China Consumer Report - July 201346
A closer look at the data from the June consumer survey.
Data Tables
47MNI Russia Consumer Report - June 2014
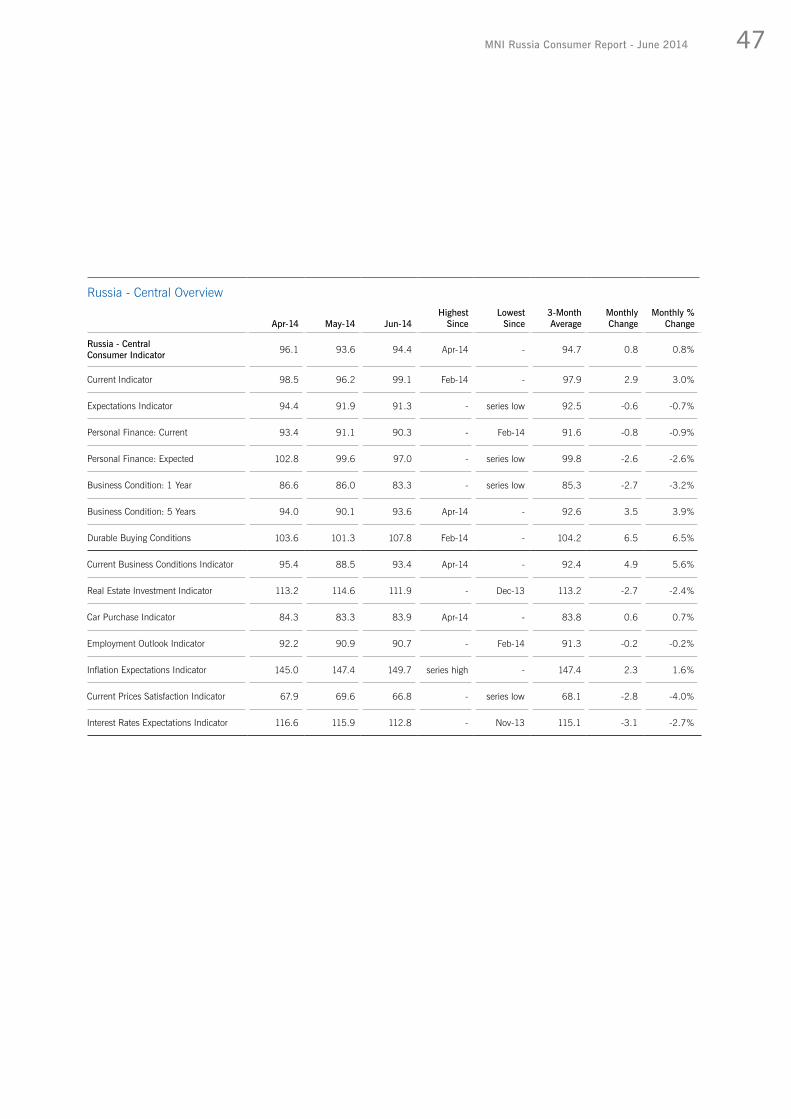
Russia - Central Overview
Apr-14 May-14 Jun-14Highest
Since Lowest
Since 3-Month Average
Monthly Change
Monthly % Change
Russia - Central Consumer Indicator 96.1 93.6 94.4 Apr-14 - 94.7 0.8 0.8%
Current Indicator 98.5 96.2 99.1 Feb-14 - 97.9 2.9 3.0%
Expectations Indicator 94.4 91.9 91.3 - series low 92.5 -0.6 -0.7%
Personal Finance: Current 93.4 91.1 90.3 - Feb-14 91.6 -0.8 -0.9%
Personal Finance: Expected 102.8 99.6 97.0 - series low 99.8 -2.6 -2.6%
Business Condition: 1 Year 86.6 86.0 83.3 - series low 85.3 -2.7 -3.2%
Business Condition: 5 Years 94.0 90.1 93.6 Apr-14 - 92.6 3.5 3.9%
Durable Buying Conditions 103.6 101.3 107.8 Feb-14 - 104.2 6.5 6.5%
Current Business Conditions Indicator 95.4 88.5 93.4 Apr-14 - 92.4 4.9 5.6%
Real Estate Investment Indicator 113.2 114.6 111.9 - Dec-13 113.2 -2.7 -2.4%
Car Purchase Indicator 84.3 83.3 83.9 Apr-14 - 83.8 0.6 0.7%
Employment Outlook Indicator 92.2 90.9 90.7 - Feb-14 91.3 -0.2 -0.2%
Inflation Expectations Indicator 145.0 147.4 149.7 series high - 147.4 2.3 1.6%
Current Prices Satisfaction Indicator 67.9 69.6 66.8 - series low 68.1 -2.8 -4.0%
Interest Rates Expectations Indicator 116.6 115.9 112.8 - Nov-13 115.1 -3.1 -2.7%

48 MNI Russia Consumer Report - June 2014
Russia - Urals Overview
Apr-14 May-14 Jun-14Highest
Since Lowest
Since 3-Month Average
Monthly Change
Monthly % Change
Russia - Urals Consumer Indicator 77.4 83.3 75.3 - series low 78.7 -8.0 -9.6%
Current Indicator 81.0 78.9 83.1 Feb-14 - 81.0 4.2 5.3%
Expectations Indicator 75.1 86.2 70.1 - series low 77.1 -16.1 -18.8%
Personal Finance: Current 62.5 58.0 80.9 Feb-14 - 67.1 22.9 39.4%
Personal Finance: Expected 88.4 86.5 68.1 - series low 81.0 -18.4 -21.2%
Business Condition: 1 Year 64.6 81.0 55.2 - series low 66.9 -25.8 -31.9%
Business Condition: 5 Years 72.2 91.2 86.9 - Apr-14 83.4 -4.3 -4.8%
Durable Buying Conditions 99.5 99.8 85.3 - Jan-14 94.9 -14.5 -14.5%
Current Business Conditions Indicator 72.8 75.8 84.5 Mar-14 - 77.7 8.7 11.6%
Real Estate Investment Indicator 108.4 109.7 110.1 Mar-14 - 109.4 0.4 0.4%
Car Purchase Indicator 84.4 76.6 75.0 - series low 78.7 -1.6 -2.0%
Employment Outlook Indicator 70.8 76.2 69.3 - series low 72.1 -6.9 -9.0%
Inflation Expectations Indicator 152.3 158.4 157.7 - Apr-14 156.1 -0.7 -0.4%
Current Prices Satisfaction Indicator 62.2 63.4 42.0 - series low 55.9 -21.4 -33.8%
Interest Rates Expectations Indicator 126.5 133.4 149.9 series high - 136.6 16.5 12.3%

49MNI Russia Consumer Report - June 2014
Russia - Volga Overview
Apr-14 May-14 Jun-14Highest
Since Lowest
Since 3-Month Average
Monthly Change
Monthly % Change
Russia - Volga Consumer Indicator 78.7 76.9 93.2 Jan-14 - 82.9 16.3 21.1%
Current Indicator 98.1 99.8 96.1 - Mar-14 98.0 -3.7 -3.7%
Expectations Indicator 65.8 61.7 91.2 Jan-14 - 72.9 29.5 47.8%
Personal Finance: Current 94.8 92.0 53.9 - series low 80.2 -38.1 -41.4%
Personal Finance: Expected 47.5 83.7 81.2 - Apr-14 70.8 -2.5 -3.0%
Business Condition: 1 Year 53.8 54.3 113.2 Dec-13 - 73.8 58.9 108.5%
Business Condition: 5 Years 96.0 47.2 79.4 Apr-14 - 74.2 32.2 68.2%
Durable Buying Conditions 101.5 107.6 138.3 Jan-14 - 115.8 30.7 28.5%
Current Business Conditions Indicator 107.8 47.7 84.7 Apr-14 - 80.1 37.0 77.7%
Real Estate Investment Indicator 92.5 99.5 106.7 Mar-14 - 99.6 7.2 7.2%
Car Purchase Indicator 83.0 95.8 84.6 - Apr-14 87.8 -11.2 -11.6%
Employment Outlook Indicator 93.4 62.7 73.5 Apr-14 - 76.5 10.8 17.3%
Inflation Expectations Indicator 181.5 171.6 153.0 - Jan-14 168.7 -18.6 -10.8%
Current Prices Satisfaction Indicator 42.3 91.3 46.0 - Apr-14 59.9 -45.3 -49.6%
Interest Rates Expectations Indicator 129.4 158.0 151.5 - Apr-14 146.3 -6.5 -4.1%

50 MNI Russia Consumer Report - June 2014
Russia - North Caucasus Overview
Apr-14 May-14 Jun-14Highest
Since Lowest
Since 3-Month Average
Monthly Change
Monthly % Change
Russia - North CaucasusConsumer Indicator 83.4 83.9 87.2 Feb-14 - 84.8 3.3 3.9%
Current Indicator 72.7 73.0 78.7 Feb-14 - 74.8 5.7 7.8%
Expectations Indicator 90.6 91.1 92.8 Feb-14 - 91.5 1.7 1.8%
Personal Finance: Current 69.8 73.1 77.6 Jan-14 - 73.5 4.5 6.3%
Personal Finance: Expected 101.3 101.5 101.1 - Feb-14 101.3 -0.4 -0.4%
Business Condition: 1 Year 71.7 72.7 78.1 Feb-14 - 74.2 5.4 7.4%
Business Condition: 5 Years 98.9 99.2 99.2 - Apr-14 99.1 0.0 0.0%
Durable Buying Conditions 75.6 73.0 79.8 Mar-14 - 76.1 6.8 9.3%
Current Business Conditions Indicator 103.9 102.9 103.0 Apr-14 - 103.3 0.1 0.0%
Real Estate Investment Indicator 98.5 100.9 97.1 - Dec-13 98.8 -3.8 -3.8%
Car Purchase Indicator 63.7 67.1 67.5 Mar-14 - 66.1 0.4 0.6%
Employment Outlook Indicator 100.6 100.4 100.2 - Mar-14 100.4 -0.2 -0.2%
Inflation Expectations Indicator 125.2 125.6 123.9 - Feb-14 124.9 -1.7 -1.3%
Current Prices Satisfaction Indicator 72.3 72.9 72.4 - Apr-14 72.5 -0.5 -0.7%
Interest Rates Expectations Indicator 104.8 104.3 101.6 - Sep-13 103.6 -2.7 -2.6%

51MNI Russia Consumer Report - June 2014
Russia - West Siberian Overview
Apr-14 May-14 Jun-14Highest
Since Lowest
Since 3-Month Average
Monthly Change
Monthly % Change
Russia - West SiberianConsumer Indicator 94.6 77.1 87.8 Apr-14 - 86.5 10.7 13.9%
Current Indicator 88.6 60.8 77.9 Apr-14 - 75.8 17.1 28.0%
Expectations Indicator 98.6 87.9 94.5 Apr-14 - 93.7 6.6 7.4%
Personal Finance: Current 87.3 59.0 75.8 Apr-14 - 74.0 16.8 28.6%
Personal Finance: Expected 108.6 106.0 106.9 Apr-14 - 107.2 0.9 0.8%
Business Condition: 1 Year 88.2 58.9 77.6 Apr-14 - 74.9 18.7 31.8%
Business Condition: 5 Years 99.0 98.9 98.8 - Feb-14 98.9 -0.1 -0.1%
Durable Buying Conditions 89.8 62.7 79.9 Apr-14 - 77.5 17.2 27.5%
Current Business Conditions Indicator 98.6 99.4 98.0 - series low 98.7 -1.4 -1.4%
Real Estate Investment Indicator 105.7 95.4 96.3 Apr-14 - 99.1 0.9 0.9%
Car Purchase Indicator 86.3 61.9 70.3 Apr-14 - 72.8 8.4 13.6%
Employment Outlook Indicator 98.3 99.1 99.2 Mar-14 - 98.9 0.1 0.1%
Inflation Expectations Indicator 118.4 117.9 147.3 series high - 127.9 29.4 24.9%
Current Prices Satisfaction Indicator 91.8 90.7 92.1 Jun-13 - 91.5 1.4 1.5%
Interest Rates Expectations Indicator 145.8 148.9 148.4 - Apr-14 147.7 -0.5 -0.3%

52 MNI Russia Consumer Report - June 2014
All Russia - Overview by Age
Apr-14 May-14 Jun-14Highest
Since Lowest
Since 3-Month Average
Monthly Change
Monthly % Change
Age 18-34
MNI Russia Consumer Indicator 92.4 89.5 88.1 - series low 90.0 -1.4 -1.6%
Current Indicator 92.6 90.9 87.4 - series low 90.3 -3.5 -3.9%
Expectations Indicator 92.2 88.5 88.5 Apr-14 - 89.7 0.0 0.0%
Personal Finance: Current 86.5 84.7 79.4 - series low 83.5 -5.3 -6.3%
Personal Finance: Expected 99.1 99.0 95.2 - series low 97.8 -3.8 -3.7%
Business Condition: 1 Year 82.0 78.6 75.4 - series low 78.7 -3.2 -4.0%
Business Condition: 5 Years 95.5 88.0 94.9 Apr-14 - 92.8 6.9 7.8%
Durable Buying Conditions 98.7 97.1 95.4 - Nov-13 97.1 -1.7 -1.8%
Age 35-54
MNI Russia Consumer Indicator 85.5 85.1 90.6 Feb-14 - 87.1 5.5 6.4%
Current Indicator 88.3 84.4 96.7 Jan-14 - 89.8 12.3 14.6%
Expectations Indicator 83.6 85.6 86.5 Mar-14 - 85.2 0.9 1.1%
Personal Finance: Current 81.2 74.2 84.5 Jan-14 - 80.0 10.3 14.0%
Personal Finance: Expected 89.5 90.0 91.3 Mar-14 - 90.3 1.3 1.5%
Business Condition: 1 Year 74.5 77.6 84.6 Feb-14 - 78.9 7.0 9.0%
Business Condition: 5 Years 86.8 89.3 83.7 - series low 86.6 -5.6 -6.2%
Durable Buying Conditions 95.4 94.6 108.8 series high - 99.6 14.2 15.1%
Age 55-64
MNI Russia Consumer Indicator 85.5 83.7 88.3 Mar-14 - 85.8 4.6 5.6%
Current Indicator 88.5 80.5 87.5 Apr-14 - 85.5 7.0 8.6%
Expectations Indicator 83.5 85.8 88.9 Mar-14 - 86.1 3.1 3.6%
Personal Finance: Current 82.3 74.1 71.4 - series low 75.9 -2.7 -3.7%
Personal Finance: Expected 86.8 94.1 79.0 - series low 86.6 -15.1 -16.0%
Business Condition: 1 Year 74.0 74.2 87.6 Mar-14 - 78.6 13.4 18.0%
Business Condition: 5 Years 89.8 89.0 100.0 Sep-13 - 92.9 11.0 12.4%
Durable Buying Conditions 94.7 87.0 103.7 Jan-14 - 95.1 16.7 19.1%

53MNI Russia Consumer Report - June 2014
All Russia - Overview by Income
Apr-14 May-14 Jun-14Highest
Since Lowest
Since 3-Month Average
Monthly Change
Monthly % Change
< RUB 480,000 Per Annum
MNI Russia Consumer Indicator 84.2 80.6 84.3 Mar-14 - 83.0 3.7 4.5%
Current Indicator 85.1 77.1 84.8 Apr-14 - 82.3 7.7 9.9%
Expectations Indicator 83.6 82.9 83.9 Mar-14 - 83.5 1.0 1.2%
Personal Finance: Current 77.0 70.2 74.6 Apr-14 - 73.9 4.4 6.3%
Personal Finance: Expected 87.2 92.8 88.3 - Apr-14 89.4 -4.5 -4.8%
Business Condition: 1 Year 71.0 68.2 76.1 Feb-14 - 71.8 7.9 11.6%
Business Condition: 5 Years 92.7 87.9 87.4 - Nov-13 89.3 -0.5 -0.5%
Durable Buying Conditions 93.2 84.1 94.9 Mar-14 - 90.7 10.8 12.8%
> RUB 480,000 Per Annum
MNI Russia Consumer Indicator 92.6 97.7 97.1 - Apr-14 95.8 -0.6 -0.7%
Current Indicator 94.6 103.9 101.6 - Apr-14 100.0 -2.3 -2.2%
Expectations Indicator 91.2 93.6 94.0 Feb-14 - 92.9 0.4 0.4%
Personal Finance: Current 90.5 94.7 89.7 - Mar-14 91.6 -5.0 -5.2%
Personal Finance: Expected 100.0 97.2 95.2 - series low 97.5 -2.0 -2.0%
Business Condition: 1 Year 84.9 94.6 88.6 - Apr-14 89.4 -6.0 -6.4%
Business Condition: 5 Years 88.7 89.1 98.3 Nov-13 - 92.0 9.2 10.3%
Durable Buying Conditions 98.7 113.1 113.4 Feb-14 - 108.4 0.3 0.3%

54 MNI Russia Consumer Report - June 2014
Methodology
The MNI Russia Consumer Sentiment Survey is a wide ranging monthly survey of consumer confidence across Russia.
Data is collected through computer aided telephone interviews (CATI), with each interviewee selected randomly by computer. At least 1,000 interviews are conducted each month.
The survey adopts a similar methodology to the University of Michigan survey of U.S. consumer sentiment.
The MNI Russia Consumer Indicator is derived from five questions, two on current conditions and three on future expectations:
1) Current personal financial situation compared to a year ago2) Current willingness to buy major household items3) Personal financial situation one year from now4) Overall business conditions one year from now5) Overall business conditions for the next 5 years
Indicators relating to specific questions in the report are diffusion indices with 100 representing a neutral level, meaning positive and negative answers are equal. Values above 100 indicate increasing positivity while values below show increasing negativity.

Insight and data for better decisions
Discovering trends in Emerging MarketsMNI’s Emerging Markets Indicators explore attitudes, perspectives and confidence in Russia, India and China. Our data and monthly reports present an advance picture of the economic landscape as perceived by businesses and consumers.
Our indicators allow investors, economists, analysts, and companies to identify economic trends and make informed investment and business decisions. Our data moves markets.
www.mni-indicators.com

Published byMNI Indicators | Deutsche Börse GroupWestferry House11 Westferry CircusLondon E14 [email protected]@MNIIndicators
Copyright© 2014 MNI Indicators | Deutsche Börse Group. Reproduction or retransmission in whole or in part is prohibited except by permission. All rights reserved.