MMarket-led solutions for fiarket-led solutions for fi … not only adds complexity to the credit...
79
RISK MANAGEMENT MicroSave Market-led solutions for financial services Market-led solutions for financial services OPTIMISING PERFORMANCE AND EFFICIENCY SERIES
Transcript of MMarket-led solutions for fiarket-led solutions for fi … not only adds complexity to the credit...

RISK MANAGEMENT
MicroSaveMarket-led solutions for fi nancial servicesMarket-led solutions for fi nancial services
OPTIMISING PERFORMANCE AND EFFICIENCY SERIES
INSPIRATION:“A WORLD IN WHICH ALL PEOPLE
HAVE ACCESS TO HIGH-QUALITY AFFORDABLE MARKET-LED FINANCIAL SERVICES”
MISSION: “STRENGTHENING THE CAPACITY OF
FINANCIAL SERVICE PROVIDERS TO DELIVER MARKET-LED FINANCIAL SOLUTIONS”
MicroSave’s
3
MicroSaveMarket-led solutions for fi nancial servicesMarket-led solutions for fi nancial services
OPTIMISING PERFORMANCE AND EFFICIENCY SERIES
Presents
RISK MANAGEMENT
The Optimising Performance and Effi ciency Series brings together key insights and ideas on specifi c topics, with the clear objective of providing microfi nance practitioners with practical and actionable advice. Based on MicroSave’s acclaimed Briefi ng Notes and India Focus Notes series, the Optimising Performance and Effi ciency Series provides succinct guidance on a variety of topics from product innovation to delivery system optimisation. Each of the booklets addresses a key topic that can transform a microfi nance institution for the better. The Series will help improve microfi nance institutions’ double bottom line – both the business and its social performance.
Also in this series…Individual Lending• E/M-Banking• Savings• Product Development•

1. Risk Management: The Need, Approach and Challenges 1
2. Proactive Risk Management: Lessons for Microfi nance Institutions 7Lynn Pikholz and Pamela Champagne
3. Implementing Risk Management at MicroSave’s PartnerMicrofi nance Institutions 11Pamela Champagne and Lynn Pikholz
4. Institutionalising Risk Management for MFIs: Framework and Challenges 17Trevor Mugwanga
5 Process Mapping for Risk Management and Process Improvement 23Pamela Champagne
6 Process Mapping in Practice 29Henry Sempangi, David Cracknell, Madhurantika Moulick and Hermann Messan
7 Internal Controls in Small/Medium MFIs 33Soumya Harsh Pandey
8. Loan Portfolio Audit in Practice 37Manoj K. Sharma and Graham A.N. Wright
9. Benefi ts of Loan Portfolio Audit 41Swandip Sinha
10. Establishing a Credit Administration & Control Unit 45Robert Dressen and Samson Odele
11. Risks and Challenges in Individual Lending 49Sandeep Panikkal, Venkata N.A. and T.V.S. Ravi Kumar
12. Diagnosing Financial Stress in Group Lending Methodology 53Venkata N.A., Veena Yamini A. & Suresh K. Krishna
13 Why Do Microfi nance Clients Take Multiple Loans? 57Venkata N.A. & Veena Yamini A.
14 Delinquency in Self-Help Groups 61B. Anjaneyulu and L.B. Prakash
15 Provisioning for Loan Impairment in MFIs 65Raj Kumar and Anil Paul
16 The Global Financial Crisis and Indian Microfi nance 69Amit Garg and Diana Lewin
TABLE OF CONTENTS
1
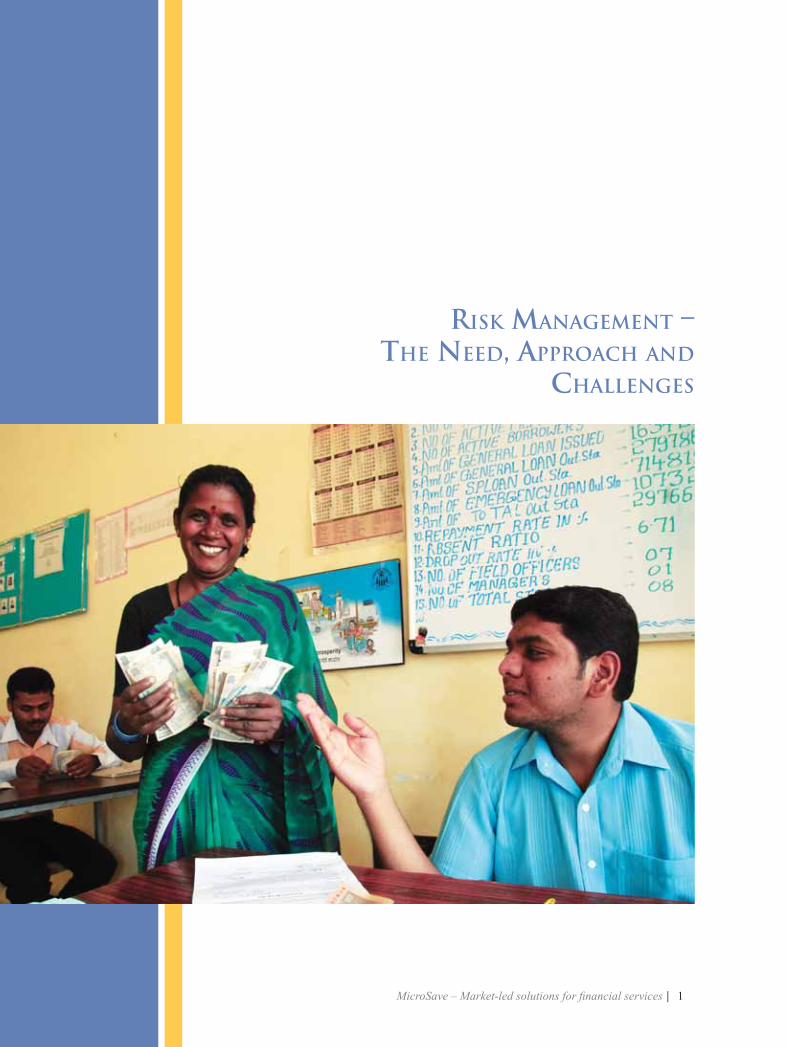
RISK MANAGEMENT – THE NEED, APPROACH AND
CHALLENGES
2
Risk is an ‘uncertainty of outcome that affects the objectives’ that is a two-sided coin, on one side it has threat, and on the other it has opportunity.
Risk is inherent to any business and microfi nance institutions are no exception. What makes microfi nance special is absence or near absence of traditional risk mitigation mechanisms like collaterals and guarantees. Management of Credit Risk, therefore, becomes extremely important for microfi nance institutions (MFIs). The monitoring, analysis and management of credit risk under group or individual lending models is core to the effective functioning of an MFI. MicroSave has developed a series of tools to help with this including:
• An approach to assessing group stress and detect early warning signs of likely default; • Toolkits on delinquency management for group-based and individual lending; • Toolkits on individual lending for training credit offi cers and credit managers; and • The acclaimed loan portfolio audit that has become the industry standard for all banks lending to
MFIs in India.
All MFIs in general and more particularly the MFIs that have transformed from social development background face Operational Risks. Failure of a particular process, staff and client frauds, MIS failure are some of the risks that are common and have a direct bearing on the day to day functioning of the MFIs. As a strategy to respond to operational risk for MFIs, MicroSave has developed a four-tiered approach to process mapping for risk analysis comprising:
1. The fl owchart depicting the process; 2. The text process description; 3. The analysis of risks in each step of the operation; and4. The risk mitigation tactics (controls).
This allows organisations to examine their processes for risks (both covered and not covered by the current process), to analyse how risks are affected by changing the steps, and to understand (from a risk perspective) why certain steps are performed. Introducing process improvements is closely linked to identifying and managing risks and balancing the risk mitigation tactics with effi ciency in order to optimise the risk/effi ciency trade-off.
In the recent times, the MFIs (particularly nascent ones) have been shifting away from the traditional grant funds and are increasingly relying on the commercial bank funding. Increasing integration of the microfi nance sector with the mainstream fi nancial sector, together with diversifi cation into new geographies not only adds complexity to the credit and operational risks but also create additional risks in the microfi nance risk landscape. These additional risks that need proactive management are interest rate, liquidity and foreign exchange fl uctuation, which can be collectively categorised as Financial Risks.
In addition, there is always a risk of failure of the strategic choices made by the MFIs. Mission drift, competition, product development and governance are the issues that have come to the fore in the MFIs. Therefore, there is a need for additional emphasis on Strategic Risks within MFIs. A proactive and systematic management of all these strategic risks are important for the growth and sustainability of an MFI. MicroSave’s Institutional and Product Development Risk Analysis Toolkit provides an approach to managing the risks inherent in change and introducing new products. MicroSave’s Risk Management for MFIs’ Toolkit developed with support from Standard Chartered Bank provides a comprehensive risk analysis and management framework to help fi nancial institutions manage strategic and institutional risk in rapidly evolving landscapes.

3
Risks are hardly isolated; they are mostly interrelated. One risk will have a bearing on many other risks. An important aspect of understanding risks is developing an understanding of the interrelationships between them. Sometimes, a signifi cant event triggers reassessment of risks across the entire MFI (i.e. across functions and product lines) precisely because of the interrelationships between different risks and the multiple impacts that a single event can cause.
The risks above can be of many types given the specifi cation and implications of the microfi nance industry. Thus in such a scenario the identifi cation of risk and adopting an appropriate mitigation strategy can be a complex task. It needs skills, preparation and commitment.
The booklet is divided into four broad categories of risks which MFIs face:
1. Institutional Risk Management2. Operational Risk Management and Process Mapping3. Credit Risk Management and Loan Portfolio Audit4. Financial Risk Management
INSTITUTIONAL RISK MANAGEMENT
1. Proactive Risk Management - Lessons for Microfi nance Institutions This note discusses the role of proactive risk management as an essential element to the long-
term sustainability of a microfi nance institution, which helps in early warning system for potential problems, effi cient use of capital, and successful new product development and rollout. It also provides lessons relating to required organisational change, risk management feedback loop, importance of periodic risk management reviews, unforeseen events, counterparty risks, risks related to human resources and suitable product development risks.
2. Implementing Risk Management at MicroSave’s Partner Microfi nance Institutions Recognising the need for proactive risk management the present note throws light on risk management
in MFIs. It is based upon a study undertaken by MicroSave and ShoreBank on the current status of risk management in four of MicroSave’s Action Research Partner (ARP) organisations. The note describes the risk identifi cation process, management and measurement of risks. It addresses issues like – managing risks and the process of institutionalising risk management and monitoring of risk management programme. The note suggests that the MicroSave’s “Toolkit for Institutional and Product Development Risk Analysis” if rigorously applied, will help in the early detection and management of risks, especially in the development of new products.
3. Institutionalising Risk Management for MFIs – Framework and Challenges This note is based on MicroSave’s experience in developing risk management policies with its
Action Research Partners (ARPs). It underlines a number of aspects that institutions seeking to adopt effective, proactive and integrated risk management must address—oversight shifts, formalising policies of risk management, enhancing scope of risks, proactive anticipation, monitoring and prevention of risks. Strategy, structures, processes and infrastructure are the essential components of risk management process of an MFI, mentions the note. It also suggests integrating process mapping and risk analysis and highlights the role of internal audit in the management of risks.
4
OPERATIONAL RISK MANAGEMENT & PROCESS MAPPING 4. Process Mapping for Risk Management and Process Improvement Process Maps are visual representations of a process, that use symbols, arrows, and concise wording
to show inputs, outputs, tasks performed, and task sequence. The note discusses in detail about constructing process maps for risk analysis and process improvements in ten steps. These steps are— identifying and prioritising operational gaps, choosing processes to be mapped, assembling an appropriate team, defi ning processes and objectives of mapping, data collection, construction and validation of maps, analysis on risks and process improvements, should be and could be maps, distribution of fi ndings and implementation. The symbols, process description, risks at each step, and risk mitigation tactics (controls) are four tiers through which the risks are analysed and suggestions are developed therein. The note also talks about various considerations in institutionalising process mapping, which are management thoughts, level of participation, time consuming and type of people engaged.
5. Process Mapping in Practice This note discusses process mapping - a technique that makes workfl ows visible. A process map is a
fl owchart that shows who is doing what, with whom, when, for how long and with what documents. This note outlines the steps in process mapping which include - identifying and prioritising operational gaps. It documents the benefi ts of process mapping, explores the challenges and suggests ways to overcome them.
6. Internal Control in Small/Medium MFIs The note provides a practical approach, based on COSO framework, for small/medium MFIs to put
in place an effective internal control system. The functional areas that internal audit and control cover like: fi nancial transactions, operations, adherence to mission, have a direct relationship with different types of risks for an MFI. For small and medium MFIs, managing these risks become more complex as systems are still evolving, processes are individual driven, procedures are sidelined, they face human resource constraints and affordability issues etc. It advocates that it is essential to have a system of sound internal audit and control at every stage of institutional growth, though setting up such a system may appear complex and costly. There are innovative and cost effective ways through which such a system could be built based on the elements of proper internal control and ownership at all levels within the organisation.
CREDIT RISK MANAGEMENT & LOAN PORTFOLIO AUDIT 7. Loan Portfolio Audit in Practice This note talks about the signifi cance of loan portfolio audit as an essential feedback to the
stakeholders in order to understand the risks in the MFI’s loan portfolio and the systems/procedures used to mitigate this risk. It explains in details the process for conducting loan portfolio audit which includes sample selection, verifi cation of loan management processes and documentation to check for consistency and completeness, and looking at portfolio management policies, systems and procedures in relation to international best practices. The note also brings forth the issues arising out of a loan portfolio audit like non existence clients, mismatches in records, rescheduling and practices without the management’s approval.
5
8. Benefi ts of Loan Portfolio Audit This note highlights the key benefi ts which Loan Portfolio Audit (LPA) has produced and has
been prepared with the objective of further promoting its adoption amongst Indian MFIs. The note mentions the points which helped the MFIs which opted for LPA in India. Some of the benefi ts are—pin-pointing gaps in policy and procedure and solutions for these, identifying internal audit and control system risks and ways of reducing these, solving gaps related to MIS, supplementing rating reports, establishing transparency and enabling fund raising. However, the note reminds of the fact that LPA is primarily a diagnostic tool used to help MFIs target capacity building/institutional strengthening efforts and it does not use the fi ndings to judge the quality of an MFI.
9. Establishing a Credit Administration & Control Unit Credit administration and credit controls are the two key components in the active management
support of the frontline credit processes of making individual loans and client management. This note demonstrates the ways to organise a Credit Administration Unit (CAU), when an organisation grows in terms of volume and outreach. Contextualising the growth scenario, the note outlines regulatory requirements and geographical expansion as the key reasons that lead to implementation of credit administration and control. It highlights the essential components of a lending institution’s credit roles and summarises factors for right credit administration and controls. The note also puts forward the staffi ng pattern and delves into roles and responsibilities of the staff in CAU.
10. Risks and Challenges in Individual Lending Many Indian microfi nance institutions (MFIs) introduced the Individual Lending (IL) methodology
as a natural progression from the group lending methodology. The lure of “big ticket” loans and higher profi tability is attracting growth oriented MFIs to aggressively push for IL without considering the inherent risks. IL has its own idiosyncratic needs like cash fl ow based lending; analysing business needs and risks; bringing fl exibility in product features; building staff capacities and processes that must be followed for successful implementation. This IFN examines these issues and makes recommendations for MFIs considering individual lending.
11. Diagnosing Financial Stress in Group Lending Methodology The recent past has seen instances in the south of India where groups refuse en masse to repay,
which has, unsurprisingly, challenged MFI operations. The reasons for this are many, including the competitive environment, multiple borrowing, the perceived threat from MFIs to the SHG movement and the increasing attention being focused on the sector. This focus note presents the learning from a study conducted by MicroSave in collaboration with Grameen Koota to look at the group lending methodology and assess the drivers of fi nancial stress in the kendras, and if/how this can be diagnosed.
12. Why Do Microfi nance Clients Take Multiple Loans? This Focus Note (a) presents the rationale and impact for multiple borrowings from a client
perspective; and (b) discusses how the MFI and its leaders perceive the issue and its implications. It is diffi cult to attribute multiple borrowings just to unmet demand for credit from borrowers, or to dumping of loans by the MFIs on clients well versed with the MFI methodology. However, MFIs can reduce the incidence of multiple borrowing. The appropriateness of disbursement timing can be improved through studying microenterprise cash fl ows by type, and changing operational policies to reduce mismatches between client cash fl ows and the timing of loan cycles.
6
13. Delinquency in Self-Help Groups This IFN focuses on identifying delinquency in SHGs, delinquency management and current
delinquency management prevention strategies currently being undertaken by banks, SHPIs and MFIs. The note provides practical recommendations on the need to track individual repayment behaviour along with group repayments. There is also need for periodic SHG performance assessment and portfolio quality monitoring. In addition the note also describes group member’s psychology of paying less attention to internal loan repayment as compared to loans taken from external borrowers (fi nancial institutions – banks, SHPIs, MFIs). Peer pressure and other informal means of ensuring repayments by group members also provide an overview to delinquency mitigation strategies at group level. As far as the banks are concerned, the provision of subsequent bank loans acts as a pressure for group members to make timely repayments. There is a need to better repayment discipline towards internal loans, unless addressed could later affect the repayment of SHG’s external borrowings.
14. Provisioning for Loan Impairment in MFIs Maintaining adequate reserves to cushion against future loan losses has again been highlighted in
the wake of recent fi nancial crisis. This India Focus Note delves into the importance of this for the microfi nance sector, highlights current challenges, and possible ways forward in provisioning for loan losses for Indian MFIs.
FINANCIAL RISK MANAGEMENT 15. The Global Financial Crisis and Indian Microfi nance This note summaries the impact of current global fi nancial crisis on Indian microfi nance sector
and analyses the response of various stakeholders.The note also suggests various risk mitigation strategies specifi cally for small and medium size MFIs to reduce their vulnerability to such economic shocks in the future.
7
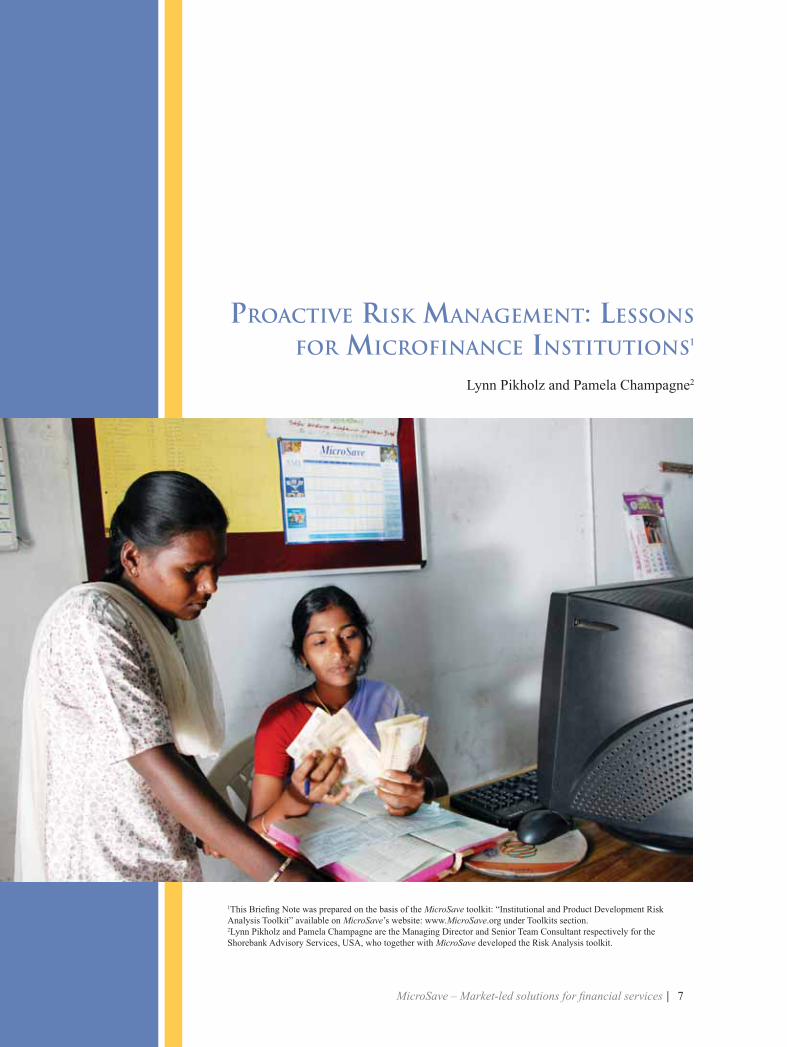
1This Briefi ng Note was prepared on the basis of the MicroSave toolkit: “Institutional and Product Development Risk Analysis Toolkit” available on MicroSave’s website: www.MicroSave.org under Toolkits section.2Lynn Pikholz and Pamela Champagne are the Managing Director and Senior Team Consultant respectively for the Shorebank Advisory Services, USA, who together with MicroSave developed the Risk Analysis toolkit.
PROACTIVE RISK MANAGEMENT: LESSONS FOR MICROFINANCE INSTITUTIONS1
Lynn Pikholz and Pamela Champagne2

8
3More information on the Basel II accord is available on the Basel Committee’s website: www.bis.org
INTRODUCTION
The increased emphasis on risk management in microfi nance institutions (MFIs) refl ects a fundamental shift among managers and regulators to better anticipate risks, rather than just react to them. Under Basel II banks must meet a series of qualitative standards including, the existence of an independent risk control and audit function and effective use of risk reporting systems.3
Proactive risk management is essential to the long-term sustainability of a microfi nance institution. It lays out the general framework for identifying, assessing, mitigating and monitoring risk in the MFI as a whole. A key management responsibility is to provide reasonable assurance that the MFI’s business is adequately controlled, and until it has embraced risk management at an institutional level, there is very little chance that the MFI’s product-level risk management strategies can succeed.
Effective risk management has several benefi ts:
• Early warning system for potential problems: Less time fi xing problems means more time for production and growth.
• Effi cient use of capital: Risk management allows management to qualitatively measure risk, fi ne-tune the capital adequacy ratio, and evaluate the impact of potential shocks to the fi nancial system or institution.
• Successful new product development and roll-out: Systematically addressing the risks inherent in new-product development and roll-out can result in enhanced corporate reputation, improved customer loyalty, easier cross-selling of services, and better knowledge for developing future business.
Risk management is either nonexistent or a fl edgling process in most organisations. Rapid growth, new market and new product introductions, and major organisational and structural changes should all trigger an institutional risk analysis. Below is a brief discussion of some risk management lessons, based on a review of four of MicroSave’s Action Research Partners. These institutions exemplify different institutional cultures, styles and maturity, and are facing different product development challenges.
A comprehensive approach to risk management reduces the risk of loss, builds credibility in the marketplace, and creates new opportunities for growth.
Organisational Change – Organisations deal with growth, new markets, new products, and other changes in a variety of ways, including recruiting new staff, hiring consultants, using cross-functional teams and outsourcing. The Project Management Process is a useful tool to help fast growing, resource-short organisations, schedule multiple tasks and projects concurrently, prioritise human resources, and manage growth. Risks are better managed when there is a clear line of responsibility to a particular individual. The project management process also helps facilitate proactive management of product or project risks.
Proactive Risk Management – Most project development teams make two timing mistakes. One is waiting until late in the project before assessing and managing risk. Late discovery of potential problems precludes solutions that would have been available earlier and is more disruptive to the schedule because less time is available to fi nd solutions.
The second mistake is letting risk management lapse. MFIs are often very diligent at identifying

9
risks and building some risk management deliverables at the early stage of the project. However, as they proceed to the ‘real work’ of product development they neglect risk management. As a result, when problems occur, they are in the same position as those who never identifi ed risks. Good project management includes explicit risk identifi cation and mitigation tasks at every stage.
PERIODIC RISK MANAGEMENT REVIEWS
Periodic risk management reviews and appropriate mitigation strategies can help organisations recognise signs of stress before risks get out of control. Signs of stress, however, can also indicate the failure of risk planning and mitigation. Typical signs of stress include high dropout, default, or turnover rates; an increase in subsidised funding; a decrease in the effi ciency ratio; an increase in the average cost per loan; erratic cash management; and reported lapses in security. SPECIAL EVENT OR SIGNIFICANT CHANGE TRIGGERS
Signifi cant changes within the MFI should also trigger an updated institution-wide and cross-functional risk analysis. Examples of special event drivers for risk management reviews include a changed operating environment, new product lines, new or revamped information systems, and rapid growth.
Counterparty Risk - It is important to identify stakeholders and third parties that can have a strategic and often detrimental impact on the organisation’s business, profi tability and reputation early in the process. Strategies should be developed to mitigate this risk at an institutional level.
Human Resources - Many organisations focus on either the technical aspects of the product development process or the market product drivers, ignoring human resource issues until too late. This puts extraordinary pressure on budgets and the training department. Examples of risks associated with human resource management include insuffi cient or mismanaged staff resources; insuffi cient staff skills; a fl ood of new hires who may bring with them incompatible and/or undesirable cultures and methodologies; and loss of key staff.
Product Development - Because much of the effort that goes into new product development is technical and systems-driven, there is a tendency to ignore non-technical risks. The opposite is true in customer and market-led organisations, which may pay less attention to operational and systems issues. Cross-functional teams are needed to provide both soft and hard skills during development4. Other issues to consider include communications, information systems, training, product costing and pricing, and internal audit and controls.
RISK MANAGEMENT FEEDBACK LOOP
Step 6: Revise policies &
procedures
Step1: Identify, assess and
prioritise risks
Step 3: Design policies
and procedures to mitigate risks
Step 4: Implement and
assign responsibility
Step 2: Develop strategies
and policies to measure risk
Step 5: Test effectiveness
and evaluate results
4For more on the systematic product development process see MicroSave’s Briefi ng Note # 14 Wright, Graham A.N. “The Systematic Product Development Process” available on MicroSave’s website under Briefi ng Notes section.

10
GUIDELINES FOR SETTING UP A SUCCESSFUL RISK MANAGEMENT (RM) PROCESS
1. Lead from the top2. Incorporate RM into systems design3. Keep it simple4. Involve all levels of staff5. Align RM goals with individual goals6. Address the most important risks fi rst7. Assign responsibilities and set monitoring schedule8. Design informative management reporting to board 9. Develop effective mechanisms to evaluate internal controls10. Manage risk continuously using a risk management feedback loop
CONCLUSION
The key to fulfi lling the responsibility of providing reasonable assurance to stakeholders that the MFI’s business is adequately controlled is the development of a comprehensive system of management controls, accounting and internal controls, security procedures, and other risk controls. MFIs committed to proactively managing risks need to establish a risk control structure which defi nes the roles and responsibilities of managers and board members with respect to managing risk.
Note: The risk management tools developed by the authors and MicroSave are evolving as we learn more from the fi eld and as more MFIs give us feedback. The tools are particularly geared to comprehensive risk management and new product roll-out in MFIs. They can be found on MicroSave’s website www.MicroSave.org.
The authors welcome comments and feedback: [email protected]; [email protected]
11
IMPLEMENTING RISK MANAGEMENT AT MicroSave’S PARTNER
MICROFINANCE INSTITUTIONS
Pamela Champagne and Lynn Pikholz5
5Pamela Champagne and Lynn Pikholz are Senior Consultants for Shorebank Advisory Services, USA, and President, Shore-Cap Exchange, who together with MicroSave developed the Risk Analysis toolkit.

12
INTRODUCTION
Risk management is at the core of the Basel II guidelines and essential to optimising the performance of microfi nance institutions (MFIs). Recognising the need for proactive risk management, MicroSave and ShoreBank Advisory Services studied the current state of risk management in four of MicroSave’s Action Research Partner (ARP) organisations6. Based on that study, a toolkit to assist MFIs to establish risk management function, with emphasis on managing risk during new product development, was developed and fi eld-tested at three ARPs.
All three ARPs did not have a formal, centralised risk management function. The fi rst step was to get buy-in from the Managing Director of each institution to begin to construct a risk management system. The Managing Director selected a team and a leader to drive the process.
Built on the risk management feedback loop7, each ARP began by identifying all risks within their organisation, assessing frequency and impact, and prioritising risks. The priority risks were analysed to determine risk drivers. Risks were then assigned “risk owners” – senior staff responsible for monitoring the frequency of the risk through appropriate indicators and thresholds for risk tolerances. Finally tactics to mitigate these institutional level risks were developed.
Thereafter, product operational risks and risk drivers were specifi cally identifi ed. These risks were assessed for frequency and impact, and mitigating tactics were developed. As new products are ready to be launched, the ARPs assessed the adequacy of the pilot test phase’s risk management systems, and developed additional stress indicators for rollout. ARPs discovered that the product operational risk tools can be used retrospectively to assess risk management as well as during product development, and plan to apply these tools to their existing products.
Introducing a formalised risk management approach within an organisation represents a signifi cant culture change. ARP managers knew their problems and risks, but had not thought of their problems from a risk perspective, nor did they perceive themselves to be “risk owners”. When asked to identify risks, managers frequently responded “We don’t have that problem” – probably because the risk was believed to be well-managed.
However, this does not remove the risk. Once managers have ownership, they need the tools to help manage their risks, to put the theory into practice. Participating ARPs felt MicroSave’s “Toolkit for Institutional and Product Development Risk Analysis” allowed them to do so. One CEO commented that senior managers are now thinking in terms of risks, showing the beginning of a risk culture change and ownership.
IDENTIFYING RISKS
Risk analysis involves the identifi cation of the risk components by answering the following questions:
• What is the risk event? • What drives it? and • How it can be monitored?
MFIs need to identify risk drivers, since it is the drivers that must be addressed. One symptom (high
6See MicroSave Briefi ng Note # 23, Pikholz and Champagne, “Proactive Risk Management: Lessons for Microfi nance Institutions” available on MicroSave’s website in the Briefi ng Notes section.7See MicroSave Briefi ng Note # 23
13
default rate), can represent one of several risk events (concentration of loan portfolio in one sector, clients do not or will not pay etc.), each of which may have a different set of risk drivers (drop in commodity price/increased cost of raw materials, inadequate monitoring procedures, poor client selection etc.). Each driver calls for a different mitigation strategy. Strengthening the MFI’s recovery procedures will not reduce the risk of a drop in prices in an industry that the MFI has invested heavily in.
ARPs used internal management reports, internal audit reports, strategic plans, and fi nancial data on losses as a basis for risk identifi cation. Other sources for identifying institutional risk included external audit reports, consultant reports, donor evaluation reports, ALCO, and the MicroSave Toolkit itself (which lists common risks).
MEASURING RISK
The importance of risk events varies according to the probability of frequency and impact of occurrence. These risk assessments should determine the priority with which an MFI allocates its resources to managing these risks. Whether the degree to which a risk is currently occurring within the organisation is considered a problem depends on the risk assessement and the related threshold.
MFIs need to answer the questions: Can an institution accept certain levels of risk? If so, what are those levels and how can they be measured? The symptom that a risk is occurring (high default rate) in turn becomes a possible indicator (PAR30) used to measure and monitor the level of risk. When a risk is being managed, it is likely that the symptoms will subside. In this manner, the symptom becomes an indicator that risk exposure is reduced. While this is reassuring, it does not answer the question, have we managed this risk suffi ciently?
The use of indicators is extremely helpful in answering this question. Without data, MFIs cannot manage risk and cannot devise appropriate controls. Risks can be measured quantitatively and/or qualitatively, and both types of measurements are needed in order to provide balance. The indicators must be relevant to what is being measured. The measurements selected should be valid, objective and verifi able. One ARP derived its risk indicators from its business plan for next year.
Data that is routinely and automatically collected as part of the MFI’s on-going activities is the most accurate. Data generated by anecdotal methods does not guarantee valid and/or objective results. If a valid quantitative measure is not available, the MFI should consider developing a small research study in order to assess how well the risk is being managed. This would most likely be needed to understand customer-related risk events.
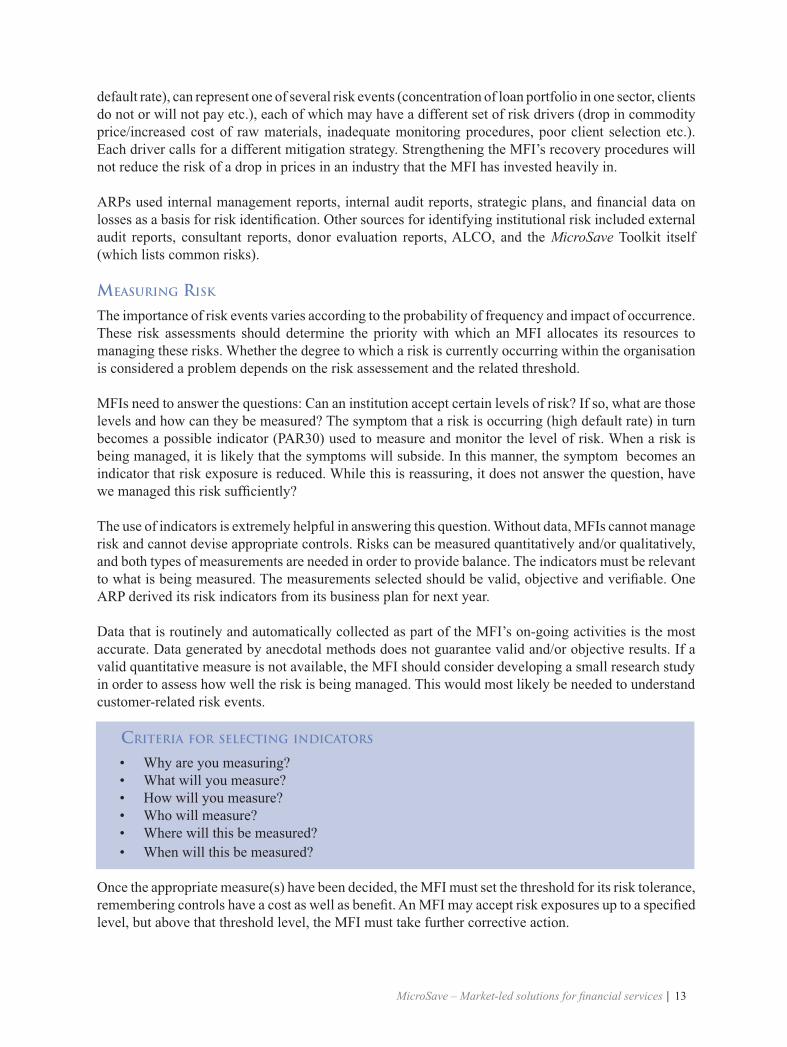
CRITERIA FOR SELECTING INDICATORS
• Why are you measuring?• What will you measure?• How will you measure?• Who will measure?• Where will this be measured?• When will this be measured?
Once the appropriate measure(s) have been decided, the MFI must set the threshold for its risk tolerance, remembering controls have a cost as well as benefi t. An MFI may accept risk exposures up to a specifi ed level, but above that threshold level, the MFI must take further corrective action.
14
If the risk trend is not decreasing and is still operating outside of the desired thresholds, the identifi ed risk drivers must be re-examined. If the real cause of the risk event has not been properly identifi ed, then the tactics are unlikely to be effective since they are addressing the wrong driver.
INSTITUTIONALISING RISK MANAGEMENT
Senior management and the Board of Directors are responsible for risk management, but the actual administration of a risk management programme is delegated. It is a line function within the MFI’s structure. Someone must be responsible for monitoring the risk management programme, ensuring that:
• Risk owners and high level monitors are reviewing their risks at the intended frequencies; • Reviews in response to trigger events or special events are in fact performed; • Risk measurements are taken, compared to thresholds and corrective action is taken if indicated; • Risk policies and procedures are documented and updated; and • Risk owners are sensitised and trained.
In short, someone needs to be responsible for ensuring that the risk management feedback loop steps occur.
Who should be responsible depends on the size of the organisation. Larger organisations that face a complexity of risks should have their own Risk Manager, in a separate unit, department or group, who reports to the CEO and to the Board of Directors. The Risk Manager is a senior position within the organisation. As a result of the pilot, one ARP establishing a new Risk and Compliance Department, and will hire a Risk Manager specialist.
In smaller organisations, the Risk Manager may not be a full time job, but vested within an existing department of the bank. The question is, what is a suitable department? The Credit Department has often been the repository of risk management, and consequently has focused on just credit risk with respect to the loan portfolio, not even credit risk in its broader implications (e.g. settlement risk).
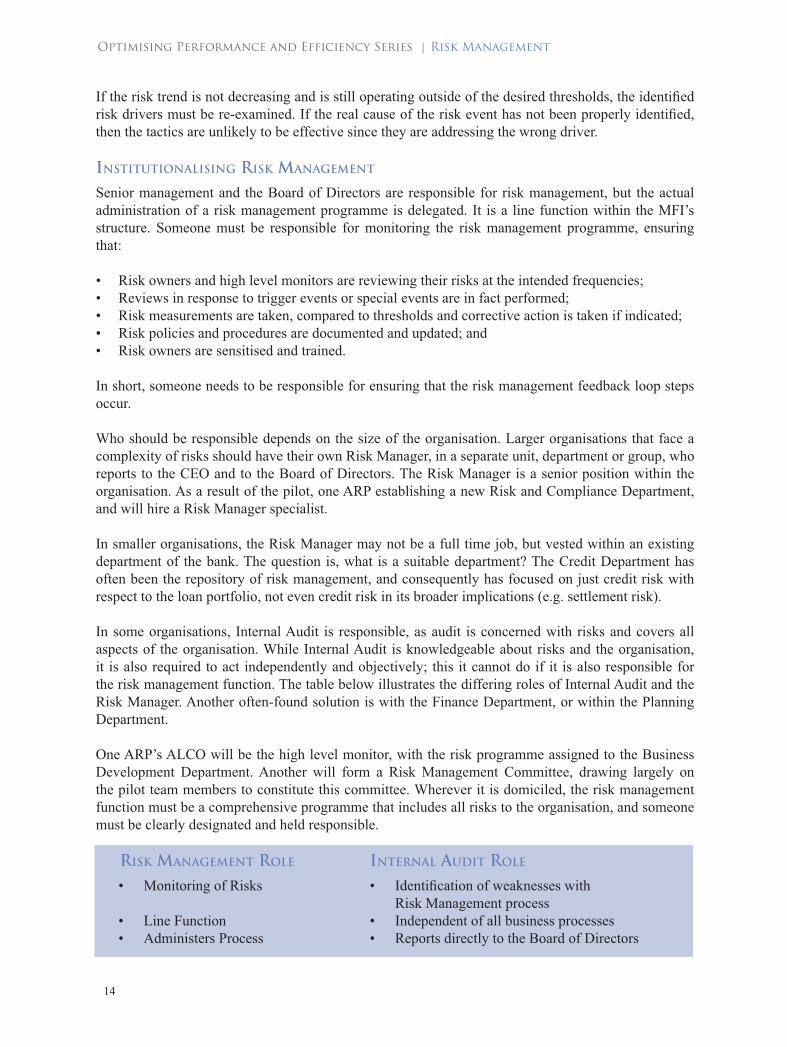
In some organisations, Internal Audit is responsible, as audit is concerned with risks and covers all aspects of the organisation. While Internal Audit is knowledgeable about risks and the organisation, it is also required to act independently and objectively; this it cannot do if it is also responsible for the risk management function. The table below illustrates the differing roles of Internal Audit and the Risk Manager. Another often-found solution is with the Finance Department, or within the Planning Department.
One ARP’s ALCO will be the high level monitor, with the risk programme assigned to the Business Development Department. Another will form a Risk Management Committee, drawing largely on the pilot team members to constitute this committee. Wherever it is domiciled, the risk management function must be a comprehensive programme that includes all risks to the organisation, and someone must be clearly designated and held responsible.
RISK MANAGEMENT ROLE INTERNAL AUDIT ROLE
• Monitoring of Risks • Identifi cation of weaknesses with Risk Management process • Line Function • Independent of all business processes• Administers Process • Reports directly to the Board of Directors
15
CONCLUSION
The risk management tools developed are dynamic, and change as the MFI cycles through the steps of the feedback loop. The MicroSave “Toolkit for Institutional and Product Development Risk Analysis” helps guide an MFI through the risk identifi cation process, management, and measurement of their risks. Early indications based on the pilot test reveal that the tools, if rigorously applied, will help in the early detection and management of risks, especially in the development of new products.


17
INSTITUTIONALISING RISK MANAGEMENT FOR MFIS –
FRAMEWORK AND CHALLENGES Trevor Mugwanga

18
WHY RISK MANAGEMENT?Risk management (RM) is an integral part of a fi nancial institution’s strategic decision-making process which ensures that its corporate objectives are consistent with an appropriate risk return trade-off. Risks taken should be identifi ed, measured, monitored and managed within a robust, proactive and integrated risk management framework. In doing so, the institution seeks to avoid exposure to risks that are not essential to its core business and reduce its exposure to those that are inherent in its business. To this end, it should continuously adapt its risk management policies, guidelines, and processes to reduce exposure to risks within approved risk limits.
This Briefi ng Note is based on MicroSave’s experience in developing risk management policies within its Action Research Partners (ARPs).
RISK MANAGEMENT - A PARADIGM SHIFT
Institutions seeking to adopt effective, proactive and integrated RM must address a number of aspects:
• Oversight shifts from management or lower to joint board and senior management stewardship in the form of active risk ownership and response at management level and in charters, committees, policy setting and board review activities.
• Policies for risk management become more formal and documented. All MicroSave’s Action Research Partners (ARPs) now have a risk policy and some have detailed risk manuals.
• Scope of Actively Managed Risks expands from primarily fi nancial, regulatory and compliance risks to include all business risks.
• Action focus shifts from reactive or crisis management focus to proactive anticipation, monitoring and prevention.
• Extent of involvement across the institution expands from limited to involvement of most staff.
SCALE AND COMPLEXITY OF RISK MANAGEMENT IN MFIS The complexity of a fi nancial institution’s risk management programme (RMP) depends on size, organisational structure, product range, regulation, the extent of regulatory requirements, the risk management skill set, the MIS and industry trends. Regulated MFIs are primarily subject to supervisory requirements (Pillar II) of the Basel II Capital Accords.
COMPONENTS OF A RISK MANAGEMENT PROGRAMME Effective RM is achieved through a well structured Risk Management Programme (RMP). An RMP consists of several elements:
Strategy: Strategy includes agreeing and articulating objectives and direction, risk appetite, culture and risk management policy.
Structure: RM structure consists of skills and capabilities, board and senior management oversight, organisational structure, risk ownership, institution-wide roles and responsibilities, reporting structure independent review and internal audit. Processes: RM processes entail activities within the RM feedback loop: (Identifi cation, Assessment/ Measurement, Mitigation (procedures & manuals and activities) and Monitoring / reporting). Key to this is issue escalation (red fl ags) and redress.

19
Infrastructure: Infrastructure consists of physical enablement for RM and includes MIS, controls limit structure and physical business continuity arrangements, for example off-site disaster recovery facilities.
WHERE SHOULD THE RM FUNCTION BE DOMICILED?The ARPs adopted various alternatives in housing RM:Internal Audit Department: FINCA’s relatively strong audit department directed the setting up of RM. Whilst this may suffi ce as a starting point for an MFI, it should be devolved in due course as RM needs to be independently audited on a regular basis. The self-audit pitfall can be mitigated through regular external reviews.
Risk Management Committee: A management level RM committee such as adopted by U-Trust has the advantage of cross functional constitution which aids objectivity. Its principal drawback is the fact that its business is conducted in scheduled meetings which may result in diffi culty in sustaining a proactive approach.
TYPICAL RM ORGANISATIONAL STRUCTURE

20
RM as an Additional Role for a Functional Head:Kenya Post Offi ce Savings Bank’s (KPOSB) head of Business Development and Planning was tasked with day to day RM coordination. A functional head, for example the head of fi nance or operations, can effectively double as the head of RM provided he/she possesses the requisite RM skills, has time, and the management of risks in this unit is subjected to regular objective external reviews.
RM Department: Equity Bank has a RM department entirely dedicated to RM and reporting to the CEO and the board’s risk committee. Whilst this is the ideal option, it may require considerable resource outlay which the MFI may not be able to expend. This should be considered on the basis of an objective cost benefi t assessment as the institution grows.
INTEGRATING PROCESS MAPPING & RISK MANAGEMENT
Equity Bank and KPOSB have experienced dedicated teams that regularly subject product and non product processes and procedures to risk based process mapping. Institutions can derive immense value from an RMP underpinned by institutionalised process mapping. Once risks associated with product, and non product related processes, are identifi ed, the level of risks can be assessed and the extent to which the institution wants to mitigate these risks can be determined. Product risk management addresses risks beyond those in product processes.
PROJECT MANAGEMENT
A number of the ARPs have had to reactively address signifi cant increases in institutional risk caused by poorly managed IT implementations, running numerous projects at the same time and failing to pilot test new products. Projects can increase institutional risk and thus should be conducted through a well structured project management methodology. This includes a high-level project sponsor driving each project, assisted by a technical expert and team with scheduled activities and ongoing performance measurement against set goals.
ROLE OF INTERNAL AUDIT IN RISK MANAGEMENT
A relatively strong internal audit function is a prerequisite in instituting effective RM. The role of internal audit in an effective RMP entails:
• Assessing the effectiveness of risk identifi cation • Giving assurance that risks are correctly assessed (scored) by management for prioritisation• Evaluating appropriateness and conformity of risk responses to the institution’s policies• Reviewing management of key risks by managers and the resulting controls instituted • Evaluating the ongoing monitoring and reporting of key risks by managers to directors
Risk Based Audit: The role of audit in institutionalising RM ideally necessitates transition from substantive to risk based approaches to auditing. Risk based auditing has a wider scope than traditional audit as it moves beyond fi nancial, regulatory and compliance aspects to all business activities. Other implications include a shift from cyclical plan of audits to audit priority and frequencies determined by risk levels in risk registers compiled by management detailing pre-assessment of risk levels. Risk based auditing goes beyond confi rming that internal controls are operating to providing opinion as to whether risks are being managed to acceptable levels.
Central banks are moving towards risk based auditing, but the institutions they are auditing have taken time to adopt similar approaches. Failure to present regulatory inspectors with internally audited risk assessments have resulted in cumbersome and unduly adversarial inspection exercises.

21
TYPICAL CHALLENGES IN SETTING UP EFFECTIVE RMPS
Strategy: Risk management is often seen as a regulatory requirement, rather than a strategic tool, resulting in limited buy in and understanding by staff. ARPs have had variable success in getting risk owners to actively manage risk and coordinate efforts in an integrated, team-based manner.
Structural issues: Ineffective board involvement and oversight often due to minimal fi nancial management, literacy, inadequate separation of functional departments and, inadequate skills often exacerbated by scarcity of skilled people to recruit from the market are common structural impediments to setting up an effective RMP. Others include weak job descriptions and differentiation at both departmental and individual levels; poor institutional performance management systems and culture; and inadequate internal audit capacity. ARPs must further increase the capacity of audit to match its expanded role. This is evidenced by ARPs with a weaker function, where RM has lacked timely, objective review for the benefi t of the board and other stakeholders.
Processes: Typical process weaknesses include inadequate functional operational policies and manuals and internal control environment. Whilst all the ARPs were able to enlist professional help to design structures, policies and manuals to satisfy regulatory requirements, few have been able to fully implement and actively update them.
Infrastructure: The ARPs are considerably challenged in ensuring adequacy of appropriate facilities and resources, for example MIS and business continuity facilities.


23
PROCESS MAPPING FOR RISK MANAGEMENT
AND PROCESS IMPROVEMENT8
Pamela Champagne9
8This Briefi ng Note was prepared on the basis of MicroSave’s: “Process Mapping” Toolkit available on MicroSave’s website: www.MicroSave.org under Toolkits section.9Pamela Champagne is a Senior Team Consultant for the Shorebank Advisory Services, USA, who together with MicroSave and Women’s World Banking developed the Process Mapping toolkit.
24
INTRODUCTION
Process mapping is a powerful management tool that looks beyond an organisation’s functional boundaries in order to reveal its core processes and how the different parts work together to serve customers. Process Maps are visual representations of a process that use symbols, arrows, and concise wording to show inputs, outputs, tasks performed, and task sequence.
PROCESS MAP SYMBOLS TELL THE READER:• What is happening?• When it is happening?• Who is doing it?• Where it is happening?• How long does it take?• How it is being done?
USES FOR PROCESS MAPS
Process mapping has broad applicability to many business functions, such as risk analysis, process improvement, training, developing activity-based costing system, documenting procedures, visualising future-state processes before changing current-state processes and, new product development. Process maps can be used to document three states: as is maps the current process as it is practiced; should be maps how procedures and processes should be performed as set out in the MFI’s formal procedural manuals; could be maps how the process would look after making process improvements.
RISK ANALYSIS
MicroSave has developed a four-tiered approach to process mapping for risk analysis: the symbols, the process description, the risks at each step, and the risk mitigation tactics (controls) each form a tier. This allows organisations to examine their processes for risks (both covered and not covered by current processing activities), how risks are affected by changing the steps, and understanding (from a risk perspective) why certain steps are performed. Introducing process improvements is closely linked to identifying risks, balancing optimum effi ciency with effectiveness in meeting corporate objectives. A process, such as a savings withdrawal, may be very effi cient if a teller is allowed to pay upon presentation of a passbook and withdrawal slip, yet the institution may not have the tolerance for the losses it may incur as a result of not introducing certain controls, such as teller limits, customer identifi cation, and posting controls to ensure the correct account and amount are entered to accounting systems.
SIX STEPS TO CONSTRUCTING PROCESS MAPS FOR RISK ANALYSIS
1. Draw fl ow chart of process2. Describe process outlined in fl ow chart3. Isolate risks associated with process4. Evaluate risks for potential impact and likely frequency5. Identify high impact and frequency risks6. Identify control mechanisms to cover risks
25
TEN STEPS TO CONSTRUCTING PROCESS MAPS FOR RISK ANALYSIS AND PROCESS IMPROVEMENTS
To gain signifi cant benefi ts of a mapping exercise, MFIs must devote suffi cient time and resources. It is better to map one process well with demonstrable outputs than many with no clear outputs.
1. Identify and prioritise operational gaps. How do you determine what are your key processes and where to begin? Identifying the problems within a function is a good starting point. These problems probably represent risk to the MFI in the form of customer dissatisfaction, ineffi ciencies, and errors. Process mapping allows you to look for the cause of problems, using a process perspective, eliminating internal politics and personalities from the problem-solving exercise. Once you know what is causing the problem, you can fi x it. Without knowing the cause, you are only addressing symptoms.
2. Choose process to be mapped based on prioritised operational gaps. People selected to do the maps tend to select the processes they are involved in, thus mapping resources may not be devoted to processes that are in the best interests of the organisation to improve. Obtain management approval of the priorities.
3. Assemble an appropriate team. People are busy with their daily duties and cannot always allocate the time required to create a map. They must have the approval of their senior managers to allocate required time. The “right” people on the team include all levels, from very junior, to senior staff involved in the process, with as much cross-functionality as dictated by the process itself.
4. Defi ne process to be mapped and mapping objectives. What are the start and end points to the process? What state (“as is, should be and could be”) are you mapping? Why are you mapping this process? Your intended audience and use dictates the level of detail required to be put in the map.
5. Gather required data. Process maps will only be as good as the techniques used to produce the maps. Sources of data include:
• Interview everyone who touches the process. Leave assumptions and preconceptions behind, ask open-ended questions, and conduct interviews in a non-threatening environment.
• Observation Maps refl ect a process as if a single transaction were occurring. Observation shows up where delays occur in the process, such as the batching of work before sending it to the next step. Use of a Mystery Shopper is an additional technique.
• Documents Identify, review, and follow the documents from where they enter the process, how they are used during the process, and how they exit the process. Forms drive processes. An examination of credit fi les will show you what forms are used, who signs them, and how they are used in the process; this is especially important when mapping a loan process, since the process occurs over a much longer span of time than can be observed from start to fi nish.
6. Construct and Validate Maps. Using a software programme such as Visio reduces the actual time spent placing symbols in a map. Validation techniques include:
• Triangulate results using techniques listed in Step 5 so that the accuracy of the map is con-fi rmed by three sources.
• Perform a walk-through of the map, explaining it to someone who was not involved in creat-ing the map to point out fl aws in the construction of the map itself.
• External review by someone experienced in process mapping.
26
7. Analyse Process Map for Risks and Process Improvements.
• What may seem very effi cient on paper may not be in fact. This dimension becomes clear when time is added to the map. Show the minimum (optimal) time for each task, then show total time from start to fi nish; the difference is caused by delays and represents the process improvement opportunity.
• Internal auditors a good source for identifying risks, as is Tool 3a in MicroSave’s Institutional and Product Risk Toolkit for product related processes.
• Broader risks that exist throughout the process become redundant to list at every step. Focus on the risks pertinent to that activity. Ask how often it occurs or what is its impact.
• Internal control questionnaires are a good source for control tactics (see Appendix in Risk Toolkit).
• Make sure process improvements address problems.• Conduct interviews from the customer point of view (What does the customer do next?), not
the staff point of view.• Why is work batched? Batching is a source of delay. If you know why it is batched, then you
have a better opportunity for eliminating that delay.
8. Analysis of Should Be and Could Be Maps. There is usually not much point in mapping “should be” if such a map is not already in existence at
the time an as-is map is commissioned, unless management really needs to see where deviations to policy are occurring.
(Such a comparison is also an important internal audit technique.) One of the most compelling reasons to construct an as-is map is when certain institutional stresses have caused problems or lead you to suspect that processes are not functioning as they should be. It is then just as effi cient and effective to derive the could be map from the as-is map.
• Could be maps may not look very different from the as-is maps, as what improves the process is not a step, but an improved physical environment, form, or equipment. For example, non-standard layouts for branches may mean that a process that works well in one branch may not work as well in another branch.
9. Summarise and Distribute Findings.
• Expressing results quantitatively, such as reduced cycle time, number of times customer must return to the bank to complete a loan, reduced number of handoffs (touch points that provide an opportunity to redeploy staff or increase staff utilisation) will get management’s attention. You need to be able to measure what you want to improve.
• Quality measurements accompanied by quantity measures (error rate vs. transactions posted rate) balances effi ciency and effectiveness.
10. Implement Process Improvements. Begin with a pilot test, monitor and evaluate results of pilot to ensure that processes are improved and no new risks emerge, then (and only then) roll out new process.
27
TIPS
• Add a tier to your map for analysis points, as problems are pointed out along the way.• Experience in mapping and in processes is a big help.• Different processes have different degrees of complexity. Loan processes tend to be lengthy, while
savings processes tend to be shorter and less complex. The same techniques that work for one process may not be as well suited for another process.
• Doing “quick win” process improvements could preclude longer-term redesign that may ultimately yield greater benefi ts to the organisation.
CONSIDERATIONS IN INSTITUTIONALISING MAPPING
• People are too busy in their daily work; this is not a part-time task initially.• People trained won’t necessarily be the ones doing the maps.• Requires management thought.• Levels of people involved may impact degree and quality of participation – junior staff may
not speak out freely in front of their supervisors.


29
PROCESS MAPPING IN PRACTICE Henry Sempangi, David Cracknell,
Madhurantika Moulick and Hermann Messan
30
WHAT IS PROCESS MAPPING
Process mapping10 is a technique that makes workfl ows visible. A process map is a fl owchart that shows who is doing what, with whom, when, for how long and with what documents11. It shows how operational decisions are made and the sequence of events.
MicroSave goes beyond drawing fl owcharts, adopting a four-tier approach. The four tiers are, the fl owchart, a description of the process, potential risks in the process and possible controls. This approach enables effi ciency and internal controls to be carefully balanced, to the benefi t of the institution and its customers.
STEPS IN PROCESS MAPPING12
Identifying and prioritising operational gaps
1. Choose processes to be mapped2. Select people for the process mapping exercise3. Defi ne process along with process mapping objectives4. Gather data5. Construct “As Is” map6. Analyse “As Is” map7. Analyse “Could Be” and “Should Be” maps8. Summarise and distribute fi ndings10. Getting into action – testing new processes
BENEFITS OF PROCESS MAPPING
Action Research Partners report extremely positive results from mapping processes. In many institutions this may refl ect the prior absence of a mechanism to review processes holistically combined with the organic growth of processes over time. The speed at which visible effi ciency gains can be realised suggests that signifi cant benefi ts can be derived from a fi rst round of process mapping. Benefi ts reported operate at strategic, managerial and operational levels.
Risk Management: Risks are quickly identifi ed and appropriate responses designed. Risk mitigation tactics can be monitored and assessed. Tanzania Postal Bank for example is using process mapping to strengthen their management of credit risk.
Human Resource Management: There is usually improved assignment of tasks between individuals. Assessment of process related blockages can lead to reallocation of staff, and process improvements resulting in more effi cient use of staff.
Standardisation of Practices: Process maps act as reference points for day-to-day work, they are easy to refer to, read and understand. To encourage standardisation, Equity Bank placed process maps on its intranet system.
Feedback Loop: Properly drawn maps identify information fl ows to and from management and thereby can guide and improve decision-making. 10This Briefi ng Note is based on a paper of the same name available on MicroSave’s website www.MicroSave.org under the Studies section.11For guidance on how to produce process maps MicroSave has produced a toolkit “Process Mapping for Financial Institutions”, which is available on the website under the Toolkits section. 12See Briefi ng Note # 29 “Process Mapping for Risk Management and Process Improvement”, available on the website under the Briefi ng Notes section.
31
Customer Service: Almost all Action Research Partners have reported improvements in service levels. Process mapping improves service levels through examining processes for bottlenecks, delays, preventable errors, role ambiguity, duplications, unnecessary handovers and cycle time. Kenya Post Offi ce Savings Bank has implemented changes that have signifi cantly reduced congestion in their banking halls.
Change Management: Process and many non-process areas that require change are identifi ed. Process related changes can be tested prior to institution-wide implantation, increasing the chance of successful change being introduced.
Activity Based Costing: A detailed understanding of processes facilitates the creation of an appropriate activity dictionary for Activity Based Costing (ABC) and Standardisation of the application of processes makes the results of ABC more representative.
Cost Control: Process mapping enables procedure related bottlenecks to be identifi ed and removed. For Commercial Microfi nance Limited (CMF) in Uganda the decision to simplify loan application procedures saved staff and clients, time and money. FINCA Uganda reports improved effi ciency with a slowing in the rate of staff recruitment.
Banking and MIS: Process mapping is a frequent starting point for system audits. FINCA Uganda used process mapping to identify weaknesses in their banking system and to guide system related improvements. CMF were able to document and improve their disaster recovery procedures.
Staff Performance and Training: Process mapping enables the creation of performance standards by determining how long a particular process should take and through encouraging consistency in application it makes it easier to identify staff performing above or below expectations. Through streamlining processes and removing excessive handovers, it can improve the attribution of performance. As a visual tool, process maps can replace pages of text and signifi cantly shorten procedure manuals. Equity Bank already uses the fi rst two tiers of the process map – the fl owchart and its description to teach procedures to new and existing staff.
Reduced Documentation: Most Action Research Partners report signifi cant reductions in documentation. CMF consolidated information requirements into a single loan agreement thereby reducing duplication of information in the process.
New Product Development: Process mapping enables new product procedures to be adapted from existing procedures or developed from scratch and changed easily before they are written into policies and procedure manuals. FINCA Tanzania has used process mapping to develop and document new procedures around individual lending products.
STEP-BY-STEP CHALLENGES AND TIPS
Choosing processes: Linked processes represent a signifi cant challenge in determining which processes to map. For example, U-Trust wanted to improve liquidity management, but fi rst had to determine which of its many interrelated processes to concentrate upon.
Team Composition: Selecting the right team to produce and analyse the initial “As Is” maps is critical. Team members need to include implementers of processes. Having a member of senior management as a core member of the team increases the likelihood of the recommendation being implemented
32
by management but carries the risk that the senior manager may not commit adequate time to the assignment itself. When Equity decided to process map the entire institution it quickly realised this was a much more involving exercise than mapping an individual process. Establishing appropriate teams was key to success. Functional teams comprised of end users created the initial “As Is” Maps. Working teams, comprised of supervisors and managers reviewed the maps. A senior management team then developed “Could Be” maps. External consultants and experts advised on compliance and risk management.
Gathering data – what, where, how: To map a process completely it often needs to be studied from various perspectives. A range of approaches was used which included interviews with staff and customers, direct observation of processes, review of internal audit reports, reference to existing procedures and reference to job descriptions. Respondents sometimes detail processes as they believe they should operate, rather than as they actually operate. Direct observation is an essential control. The process of developing the maps is time consuming; each map can take several days to generate. So teams had to have relative freedom from existing responsibilities.
Gathering Data - Capturing Non-Process Benefi ts: When the process mapping team is gathering data and making observations, non-process benefi ts will be identifi ed. Although capturing non-process benefi ts is not the core objective of process mapping, the team should document observations and make appropriate recommendations. CMF’s team improved signage, notice boards and queue management systems.
Construction of Maps: Consistency in drawing maps between team members is diffi cult to maintain, with variance in symbols for uncommon activities, deciding on the level of detail to analyse sub-processes, the extent and placement of text on the map, and the degree of detail in the description accompanying the map.
Analyse Maps: Once “As Is” maps have been drawn they should be carefully analysed to ensure processes operate as described; to ensure that if necessary two or more “As Is” maps are drawn to describe major variations and that risks within processes are correctly identifi ed. At this stage, senior management involvement is essential, in the words of one respondent “it was diffi cult to get enough time from some senior managers, so we consistently had to fall back on the core team and did not produce the best results.” Analysis of maps should be a participatory process, while performing risk analysis inputs should be taken from those operating and supervising the process. Senior management must be involved as they have a responsibility to maintain a balance between control and functionality. Internal audit and risk managers should also be involved.
Constructing “Should Be” Maps: In some cases “Should Be” maps indicated that multiple and fundamental changes to existing processes were necessary. In this case, a graduated approach that implemented “quick wins” fi rst was often necessary to maintain momentum behind the change process.
Testing new processes: Pilot tests enable major changes to be tested for unanticipated consequences. They provide information on the best way to implement changes and the extent to which reversion to previous procedures is likely.
In Summary: Carefully analysed process maps bring effi ciency and risk management gains that to date outweigh the signifi cant investment in time and resources required to generate the maps. Consider it now!
33
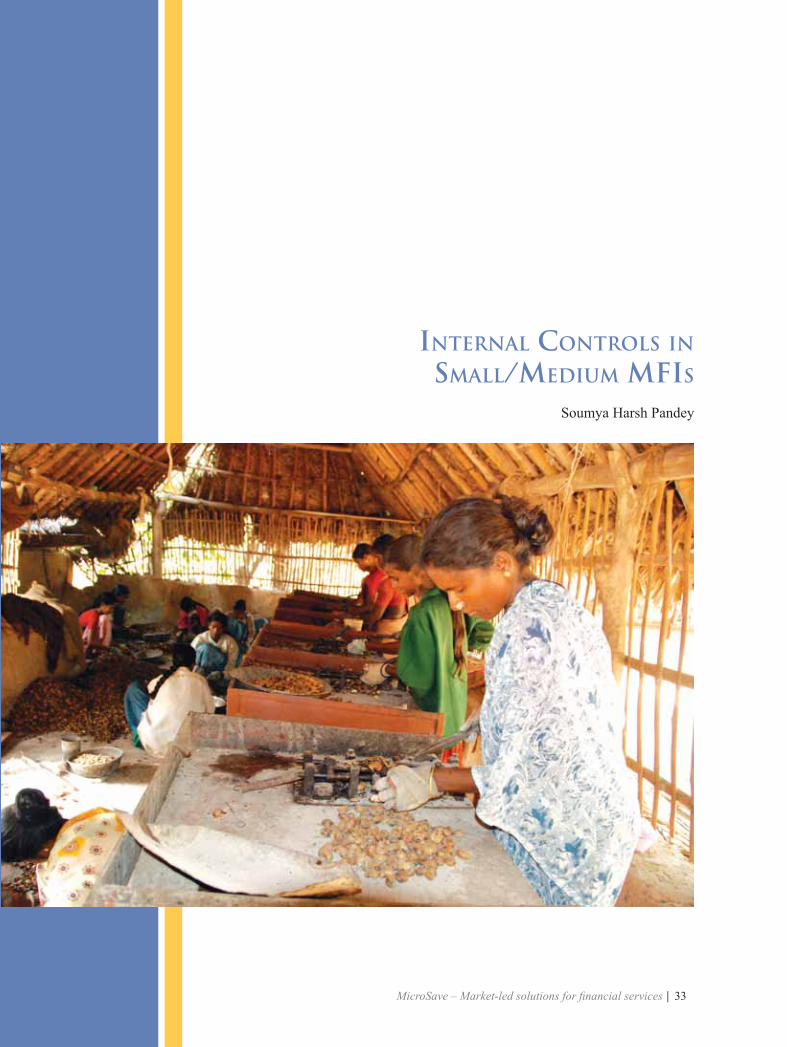
INTERNAL CONTROLS IN SMALL/MEDIUM MFIS
Soumya Harsh Pandey
34
13In 1992, the Committee of Sponsoring Organisations of the Treadway Commission (COSO) developed a model for evaluating internal controls. Ref URL: http://www.coso.org,13/12/07.14See Internal Audit and Controls toolkit of MicroSave – available on www.MicroSave.org
BACKGROUND
The COSO framework13 defi nes internal control as “a process, effected by an entity’s board of directors, managements, and other personnel, designed to provide reasonable assurance for the achievement of organisational objectives under: Effectiveness and effi ciency of operations; Reliability in fi nancial reporting and Compliance with applicable rules and procedures”.
For microfi nance institutions (MFIs), audit and internal control should cover: (a) fi nancial transactions, (b) operations, and (c) adherence to mission. Financial controls and transactions are reviewed to ensure their accuracy, completeness and compliance to statutory norms. At the operational level, adherence to organisational policies and procedures are the main areas of review. For MFIs with poverty alleviation as a key objective, verifi cation of mission adherence may also be made through the audit process. These functional areas have a direct relationship with different types of risks for a MFI, broadly categorised as: (a) Institutional Risk, (b) Operational Risk, (c) Financial Management Risk and (d) External Risk14.
For small and medium, MFIs managing risk becomes more complex as systems are still evolving. Moreover, these MFIs are led by an individual or built around a few trusted employees. In the initial phase, there is also a tendency to sideline procedures because (a) they appear to slow down the speed of decision making and business expansion; and (b) they appear to be costly. However, ignoring internal controls exposes an MFI to risks that can have deep and debilitating impacts on operations. Affordability and human resource constraints are other reasons why small and medium MFIs do not set up internal control systems. Though, in the long run, incremental costs of poor internal controls become much higher than anticipated initial savings.
BASICS OF RISK MANAGEMENT
Risk management does not mean removing all risks but rather optimising the risk-reward or risk-effi ciency trade-off. Risk management activities broadly take place simultaneously at different hierarchical levels:
• Strategic level: Encompasses risk management functions performed by senior management and Board of Directors. Risk management function at this level includes approval of policies, monitoring risk indicators and assessing compliance.
• Senior/Middle Management Level: Encompasses risk management within a business area or across business lines. Risk management at this level includes identifi cation of risks, developing policies, assigning responsibilities, implementing policies and monitoring compliance.
• Junior staff Level: Involves risk management activities performed by individuals where risks actually occur. Risk management in these areas includes implementing and compliance with polices and procedures, and providing suggestions and feedback to further improve the policies and processes.
In addition to its internal control department which periodically tests and reports on the effectiveness of internal controls, Equity Bank in East Africa has a Compliance Department that supplements Internal Audit by continuously assisting the bank’s functional units and Branch outlets to assess process risks and effi ciencies and refi ne or reengineer them through process mapping.

35
Thus risk management is not an individual function but is carried out by employees throughout the organisation.
HOW TO SETUP EFFECTIVE CONTROL
The COSO framework says that for effective control, the following fi ve components work to achieve organisation’s mission, strategy and related business objectives:
1. Control Environment2. Risk Assessment3. Control Activities4. Information and Communication5. Monitoring
However, for upcoming MFIs it is often diffi cult to understand where to start from, and how to set up a control environment that would make these components work together to establish a system of sound internal control. There is no single answer to this question and different organisations practice different methods for establishing a system of internal controls. Nevertheless, some MFIs fi nd it is useful to start with the identifi cation of fundamental processes and the risks involved in each step of a process – usually through “Process Mapping”. Once such risks have been identifi ed a monitoring tool for internal control can be developed to measure these risks. One of the tools most commonly used by MFIs is a checklist covering the identifi ed risks. Any deviation from performance indicators is a cause of concern requiring correction. In addition, process maps analyse what controls should be in place to encourage the desired results. Some of the controls used by MFIs include - putting check points in processes, segregation of duties, incentives, penalties, written warnings, etc.
DRISHTEE which is working through village-based IT kiosks to deliver microfi nance services to its clients found non compliance issues with some of its key organisational procedures. To further probe into the risk associated with their systems, they carried out a Process Mapping exercise for all their major processes.
The identifi cation of the risk was the starting point in understanding issues related to internal control for DRISHTEE. This further helped them in developing a monitoring tool to manage risk in their operations.
While setting up controls it is also important to ensure compliance by regular monitoring follow ups so that there are no surprises at the end of the year. Most small/medium organisations fail to do this, often because of resource constraints or for the want of monitoring systems. However, these are relatively easy to do; most of the MFIs use shadowing of fi eld staff and non participatory observance of processes at the Branch as a tool to understand non-compliance of organisational policies and procedures. The observer for these activities is taken up on a rotation basis from a pool of experienced fi eld staff. For compliance with accounting polices it is often the Branch Accountant of different Branch or an Accountant at the Head Offi ce who visits the Branch on a regular basis. To facilitate the process as well as to bring standardisation in the monitoring procedure, monitoring staff is often provided with a checklist of things to observe and a reporting format. The reports generated through regular monitoring checks then need to be communicated to the senior management for corrective action.

36
It is also important to understand the difference between regular audits and monitoring especially in the context of auditors’ independence and reporting to the Board. Monitoring is a continuous process and deals primarily with operational issues whereas internal audit is carried out as per the audit plan and covers activities related to all aspects of MFI operations and fi nance. Again, reporting on a monitoring report is usually made to the Operations Manager or the Regional Managers overseeing the operations so that corrective action is taken almost immediately. The reporting of the internal audit should be directly to the Board, though reports may also have references to the monitoring report on important compliance related issues.
AROHAN, a microfi nance institution working in Kolkata (India), is in an expansion phase. An expansion in operations for Arohan means setting up new Branches and adding more services to its present offering. Promoters of Arohan felt that setting up new Branches without strong monitoring and control systems runs the risk of dilution of operational processes and procedures. As a precaution they have set up a monitoring unit within Arohan which regularly visits its Branches and monitors various Branch level processes and the performance of employees. The monitoring team at Arohan comprises of senior staff from different Branches who work on a rotation basis.
Reports of Monitoring offi cers are updated on a weekly basis by the Manager Operations and necessary corrective action is taken almost immediately.
Another important point to consider in terms of reporting is that in upcoming MFIs there is usually no internal audit department. In such a case, some MFIs outsource this activity to external auditors who schedule their audits as per the agreement with the MFI. However, in such a case: (a) the TOR must be clearly defi ned, particularly in terms of objective of the audit, sample size and frequency of audit (b) internal audit is not carried out by the auditor who performs the statutory annual audit to prevent any bias.
In terms of compliance it is equally important to ensure that the staff of the MFI also understand issues to take necessary corrective measures. Mechanisms for sharing such information could be through monthly meetings, or more simply by having compliance registers at the Branches. To further facilitate the process, a track of previous compliance issues should be maintained listing out what has been complied with and what work still needs to be completed.
CONCLUSION:It is essential to have systems of sound internal audit and control at every stage of institutional growth. Though setting up such a system may appear complex and costly but there are innovative and cost effective ways though which such a system could be built based on the elements of proper internal control and ownership at all levels within the organisation.
37
LOAN PORTFOLIO AUDIT IN PRACTICE
Manoj K. Sharma and Graham A.N. Wright
38
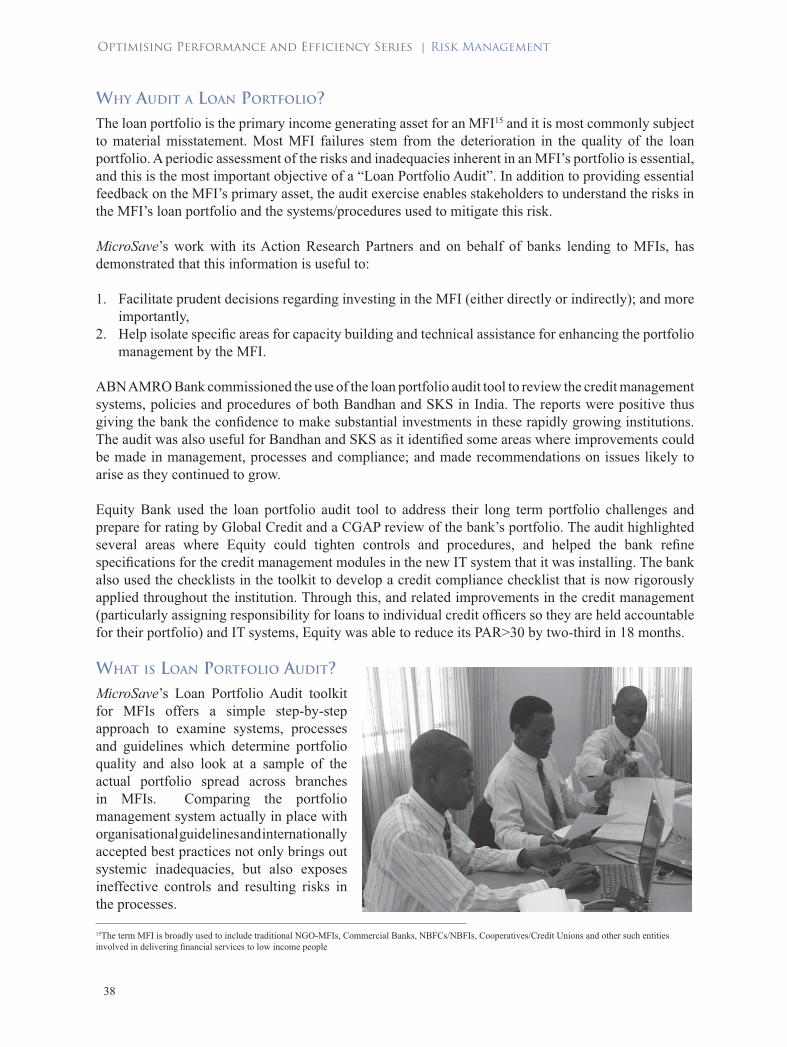
WHY AUDIT A LOAN PORTFOLIO?The loan portfolio is the primary income generating asset for an MFI15 and it is most commonly subject to material misstatement. Most MFI failures stem from the deterioration in the quality of the loan portfolio. A periodic assessment of the risks and inadequacies inherent in an MFI’s portfolio is essential, and this is the most important objective of a “Loan Portfolio Audit”. In addition to providing essential feedback on the MFI’s primary asset, the audit exercise enables stakeholders to understand the risks in the MFI’s loan portfolio and the systems/procedures used to mitigate this risk.
MicroSave’s work with its Action Research Partners and on behalf of banks lending to MFIs, has demonstrated that this information is useful to:
1. Facilitate prudent decisions regarding investing in the MFI (either directly or indirectly); and more importantly,
2. Help isolate specifi c areas for capacity building and technical assistance for enhancing the portfolio management by the MFI.
ABN AMRO Bank commissioned the use of the loan portfolio audit tool to review the credit management systems, policies and procedures of both Bandhan and SKS in India. The reports were positive thus giving the bank the confi dence to make substantial investments in these rapidly growing institutions. The audit was also useful for Bandhan and SKS as it identifi ed some areas where improvements could be made in management, processes and compliance; and made recommendations on issues likely to arise as they continued to grow.
Equity Bank used the loan portfolio audit tool to address their long term portfolio challenges and prepare for rating by Global Credit and a CGAP review of the bank’s portfolio. The audit highlighted several areas where Equity could tighten controls and procedures, and helped the bank refi ne specifi cations for the credit management modules in the new IT system that it was installing. The bank also used the checklists in the toolkit to develop a credit compliance checklist that is now rigorously applied throughout the institution. Through this, and related improvements in the credit management (particularly assigning responsibility for loans to individual credit offi cers so they are held accountable for their portfolio) and IT systems, Equity was able to reduce its PAR>30 by two-third in 18 months.
WHAT IS LOAN PORTFOLIO AUDIT?MicroSave’s Loan Portfolio Audit toolkit for MFIs offers a simple step-by-step approach to examine systems, processes and guidelines which determine portfolio quality and also look at a sample of the actual portfolio spread across branches in MFIs. Comparing the portfolio management system actually in place with organisational guidelines and internationally accepted best practices not only brings out systemic inadequacies, but also exposes ineffective controls and resulting risks in the processes.
15The term MFI is broadly used to include traditional NGO-MFIs, Commercial Banks, NBFCs/NBFIs, Cooperatives/Credit Unions and other such entities involved in delivering fi nancial services to low income people

39
The sample audit of the portfolio investigates actual portfolio quality, and compares this with the portfolio quality being reported. In assessing portfolio quality, emphasis is placed on fl ow of cash in quantitative terms and the time lag between cash fl ow at various stages. Thus the loan portfolio audit will help an MFI to:
• Understand the real risks in its portfolio and to mitigate them;• Locate process and systems fl aws affecting portfolio quality; • Isolate systems fl aws creating unnecessary risk that could be avoided at a reasonable cost;• Identify areas to improve internal controls to protect the loan portfolio;• Increase effi ciency by streamlining and improving portfolio monitoring; and• Specify processes/systems that need to be strengthened or reengineered for better portfolio
management.
HOW DO YOU CONDUCT A LOAN PORTFOLIO AUDIT?Before commencing the loan portfolio audit, sample branches have to be identifi ed. Sample size depends on the size of the MFI and the purpose of the audit exercise (general audit of the MFI or specifi c study directed at a region/selected branches), as well as the fi nancial and human resources available to the audit team. The sampling methodology can consider issues like urban/rural branches, operational regions, representation of different loan products in the portfolio, etc.
The fi rst step in the loan portfolio audit exercise is to trace a sample of loans (initially 50-100, but this may be extended in the event of irregularities being detected) from Head Offi ce downwards through the branch accounts to borrowers’ accounts/passbooks. This is then followed up by tracing another sample from the borrowers’ passbooks upwards through branch accounts to the Head Offi ce. The auditors look at consistency in cash fl ows as reported in different records and also look at the dates on which money has been transferred as well as the consistency in dates across records.
Subsequently, for the loan accounts sampled, the audit process looks at cross verifying the loan disbursements/ repayments with other accounting records like cash book, receipts and vouchers and also verifi es the records with entries in the loan ledgers. The next step involves verifi cation of loan management processes and documentation to check for consistency and completeness, and to compare it with international best practices. The loan portfolio audit exercise pays special attention to roll-over and restructuring of loans as a means for hiding delinquency. Towards the end, the audit exercise looks at portfolio management policies, systems and procedures to ensure that they are in line with best practices. To ensure that adequate safeguards are built into the system, the internal and external controls used to manage the loan portfolio are also reviewed as part of the loan portfolio audit exercise.
ISSUES THAT TYPICALLY ARISE FROM A LOAN PORTFOLIO AUDIT
Loan portfolio audits often reveal some of the following issues:
1. Amount sanctioned or disbursed is more, or less, than the amount actually sanctioned or disbursed as refl ected in the borrower’s passbook.
2. Loans have been disbursed before or after the date stated in the MFI records, or have not been disbursed at all.
3. Repayment schedules do not exist for loans, or they keep changing.4. Instalment amounts received are more, or less, when compared to the amount due.5. Higher/lower interest is being charged as compared to interest rate quoted in the offer letter.6. “Ghost” (non existent) clients are taking loans.

40
In a Self-Help Group (SHG) Federation in North India, the loan portfolio audit toolkit revealed the extent of hidden and latent delinquencies, thus enabling management to take stock of the situation and initiate remedial measures.
In another large SHG federation, in South India, the model under the mutually aided cooperative society had delinquencies at different levels. Thus, while the reported PAR was less than 10%, actual levels were upward of 30%. The delinquency at the level of the borrowers was very high, as was refl ected in the repayments made to the local federations. However, these delinquencies were being ‘made up’ by the local federations in their repayments to the state unit. This problem came out in the loan portfolio audit exercise.
In an Indian MFI, the loan portfolio audit highlighted the “ever-greening” of loans by sanctioning repeat loans in the guise of emergency loans. This practice adopted at the fi eld level did not have approval from the management and would have affected portfolio quality adversely in the long run.
CONCLUSION
Traditional ratings often fail to explore the primary asset of MFIs in enough detail. MicroSave’s loan portfolio audit has almost always uncovered important issues in the management, control and policies of loan portfolios – thus allowing MFIs to respond to them. The loan portfolio audit has proved a valuable tool both for investors in MFIs, as well as MFIs committed to optimising their primary asset – their loan portfolio.
41
BENEFITS OF LOAN PORTFOLIO AUDIT FOR MFIS
Swandip Sinha

42
“Loan Portfolio Audit brought to the surface many of the problems we thought we had. Once we saw our problems clearly it was easy to address them. It saved time, money and a lot of reputation”.
– Mr. K.C Mallick, Director BISWA, Orissa, when contacted four months after LPA was completed
“Do you want a Loan Portfolio Audit?” is often met with questions such as: “We already have a top notch credit rating, why again Loan Portfolio Audit (LPA)?” and “What are the benefi ts?” Concerns emerge too, for example “Are there any ‘side effects’?”; “What if LPA stumbles on our portfolio incidents last month?” and “Should we open our trade secrets?” The more curious want to know, “Can it help us raise funds?”; “Will our staff learn from it?” and “Will we have assistance to implement the results?”
In the year 2007, MicroSave India conducted the LPAs of seven large Indian MFIs16 and the benefi ts of these were greatly appreciated. On the other hand, because the clients wanted the LPA reports to be confi dential, the knowledge of these benefi ts is not widely appreciated within the microfi nance community. Further, since the ‘Audit’ in LPA asserts its invasive nature, MFIs are usually deterred from voluntarily opting for this exercise. Thus, it is not surprising that most of the support for LPA has come from banks lending to the MFIs17. To start with, they viewed LPA as an appealing addition to their routine due diligence processes for client MFIs. However, in practice, the tool has produced much more, and is now also regarded as the main foundation for extending capacity building support. This note highlights the key benefi ts which LPA has produced so far and has been prepared with the objective of further promoting its adoption amongst Indian MFIs.
WHAT IS A LOAN PORTFOLIO AUDIT?The loan portfolio is the primary income-generating asset for MFIs but is often subject to misstatement. Most failures amongst fi nancial institutions stem from the deterioration in the quality of the loan portfolio. An LPA provides an assessment of the risks inherent in a fi nancial institution’s portfolio and the controls the MFI uses to manage them. LPAs are therefore extremely useful for investors seeking a more detailed understanding of the key asset of the MFIs in which they are placing their money (debt or equity). But, well conducted, LPAs provide immensely valuable information for the MFIs too.
HOW HAS LPA HELPED THE CLIENT MFIS? • Pin-pointed gaps in policy and procedure and solutions for these: MFIs often have an inkling of
gaps in their procedures and systems, but do not have supporting evidence to pin-point the causes. LPA has assisted MFIs to precisely identify the root cause of problems by detecting and investigating real cases such as: a) disbursement of loans without necessary approvals and in violation of the approval limits; b) not tracking and using credit history for making credit decisions; c) approving loans in spite of poor group ratings and d) disbursing parallel loans to the same group. The MFIs found that that they could use the real evidence of the problems and fi ne tune their internal controls to make their systems water tight.
• Identifi ed internal audit and control system risks and ways of reducing these: Most MFIs tend to feel safe once they have a functional internal audit unit that generates regular reports. LPA uncovered
16Including Bandhan-West Bengal, SKS-Andhra Pradesh, Cashpor-Uttar Pradesh, BWDA-Tamil Nadu and BISWA-Orissa17Increasingly ABN AMRO, Axis, Standard Chartered Banks and SIDBI are insisting on Loan Portfolio Audits of MFIs in which they are making larger investments

43
cases, undetected by routine internal audits and also examined why internal audit had missed these gaps. A variety of reasons for undetected risk emerged, and these included: a) horizontal portfolio growth of the MFI outpacing the internal audit unit’s growth; b) frequent turnover of internal audit staff; c) narrowly focused audit procedures; and d) weak auditors’ training systems.
• Solved gaps related to the MIS: As in the case of internal audit, MFIs often believe that their computerised MIS is an automatic solution to all reporting challenges. LPA pointed out the need for valuable modifi cations such as: a) aligning the reporting frequency to the repayment frequency; b) modifying the software to refl ect changes in policy; c) enhancing the quality of credit history reports; d) strengthening the loan tracking system; e) reconciling mismatches between Head Offi ce and fi eld level portfolio records; f) minimising time delay in reporting repayments deposited at the branch level and g) avoiding parallel computerised and manual MIS.
• Assisted tailor-made solutions instead of generic ones: For example, one MFI had suspected fraud as the reason behind the spurt in recent delinquency levels in remote branches and had increased the frequency of monitoring visits to these branches. LPA revealed that the main reasons why the centralised MIS reported higher delinquency levels, was the information asymmetry between the Head Offi ce and the fast expanding branch network in remote areas. Because of rapidly changing policies, the delinquency ratios at the Head Offi ce were being calculated using new rules that had not yet been communicated properly to the branches.
Similarly, in order to improve effi ciency, one MFI had designed an incentive system which revolved around enhancing outreach and minimising delinquency, without giving adequate weight to the quality of processing, documentation, follow up and customer service. LPA revealed that following the implementation of this incentive system, rate of loan utilisation checks had plummeted leading to serious client-level frauds.
• Supplemented rating reports: Contrary to rating exercises which are designed to comment on the overall creditworthiness of MFI and appeal to funders, LPA is aimed at the MFI itself for use as a capacity building tool to improve its performance. A LPA report is a vital supplement to a rating report and often a reality check for the rating. In this context, it is noteworthy that because of the anomaly between the budget/time resource constraints and the volume of work involved, rating methodologies often rely on data reported in by the MIS and the audit systems of the MFI, which themselves are sometimes imperfect. In the case of one MFI, more elaborate and in-depth analysis by LPA revealed that the actual portfolio at risk was ten times higher that the rating report estimates … the rating given was clearly optimistic and misleading for the MFI, as well as those lending to it. On the basis of the LPA, the MFI was able to make signifi cant progress in strengthening its systems and real institutional creditworthiness.
• Established transparency and enabled fund raising: Armed with a LPA report one of the MFIs has already raised capacity building funds from a European Donor. Moreover, LPAs have boosted MFIs’ image as transparent and creditworthy institutions and have been invariably followed up by higher levels of credit supply to such MFIs. Of late, growing numbers of debt and equity investors have also shown a keen interest in the LPA reports – LPA reports provide important documentation for their internal credit committees, and thus allow them to increase the volume of credit they can offer to MFIs.
• Assisted capacity building inputs negotiation with service providers: Often MFIs are unable to clearly identify, prioritise and articulate their specifi c capacity building needs to technical service
44
providers resulting in generic inputs from the latter, which have a limited impact. On the other hand, an LPA report can enable a MFI to better negotiate a customised capacity building package, resulting is higher levels of effectiveness, effi ciency and impact of such inputs. In one particular MFI, MicroSave India itself followed up the LPA with technical assistance for process mapping, which resulted in the restructuring of the operations of the institution to enable its rapid but secured growth.
CONCLUSION
Financial institutions investing in MFIs use the LPA to gain a better understanding of its primary asset and, in particular, what is necessary to do to protect and strengthen the quality of that asset. An LPA provides valuable insights that other quicker assessment tools do not – thus allowing the MFI and its investors to focus on how best to support the institution.
Since LPA is primarily a diagnostic tool used to help MFIs target capacity building/institutional strengthening efforts, it does not use the fi ndings to judge the quality of an MFI. Instead, the focus is on determining why gaps have occurred and how can these be solved. The ‘Audit’ word in LPA is the fi rst step in the entire exercise and is used to diagnose the gaps. Consequently, the MFIs with an open attitude to the tool, who articulated their problems and participated in uncovering gaps, have benefi ted the most. MicroSave India hopes that with the popularity of the tool, MFIs can internalise the concepts and use these as an in-house means to improve their performance, and thus their creditworthiness with the banks that want to increase their lending to them.
45
ESTABLISHING A CREDIT ADMINISTRATION & CONTROL UNIT
Robert Dressen and Samson Odele

46
WHAT ARE CREDIT ADMINISTRATION AND CREDIT CONTROLS?Credit administration and credit controls are the two key components in the active management support of the frontline credit processes of making individual loans and client management. Credit administration (organising and managing credit processes) and credit controls (tools for minimising and managing risks) are both essential to manage portfolio quality and to operate effi ciently. This handout demonstrates how to organise a Credit Administration Unit (CAU), and the accompanying handout 9.2 explains the functions of a CAU.
WHY IS IT IMPORTANT TO THINK ABOUT CREDIT ADMINISTRATION AND CREDIT CONTROLS?As fi nancial institutions grow in terms of volume, diversity, and complexity; risks increase disproportionately and it becomes increasingly challenging to analyse and manage credit portfolios. Institutions grow in terms of the number and size of loans, diverse products and clients, multiple locations and more employees, and more complex processes and procedures. At the same time, larger fi nancial institutions are often subject to increased regulatory, governance, transparency requirements and have rapidly changing risk profi les as they grow and become more formalised. One of the most effective ways to address a larger institution’s new reality where pro-active risk management is critical is to create a dedicated CAU and expand and upgrade credit controls.
ESSENTIAL COMPONENTS OF A LENDING INSTITUTION’S CREDIT ROLES
Credit Approvals Credit Administration Credit Controls(Making the loan) (Managing the Portfolio) (Minimising the Risk)
• Client selection• Credit analysis• Loan approval• Loan disbursement• Client monitoring• Loan repayment• Gathering, analysing,
and presenting the data
• Gathering, analysing, and presenting the data (reporting)
• Monitoring the loan portfolio
• Maintaining fi les and databases
• Administering credit processes and action plans
• Using the credit controls
• Policies and procedures• Management information
systems• Internal controls• Compliance checks• Limits, terms and quotas
(LTQs)
WHAT IS THE RIGHT CREDIT ADMINISTRATION AND CONTROL STRUCTURE FOR AN INSTITUTION?Every fi nancial institution needs to have some of the functions of credit administration and some credit controls. Beyond a certain size, an institution will need a dedicated credit administration unit and a full set of credit controls. The choice of the right credit administration and control structure for an institution depends on multiple factors, such as:
• Organisation type: e.g. specialised microfi nance institutions, units of commercial banks, savings and credit cooperatives, fi nance companies
• Organisation structure: branches and regions; centralised or decentralised • Size: number of clients and loans; number of branches and loan offi cers• Regulatory status: Compared to non-regulated institutions, regulated institutions have complex
compliance requirements, particularly in relation to reporting and maintaining prudential standards..

47
• Products: More numerous and more complex products require closer monitoring and more management.
• Risk profi les: Risks – credit, fi nancial, operating, product, economic – increase as a portfolio and institution grow.
BASIC CREDIT ADMINISTRATION UNIT STRUCTURE (HEAD OFFICE)
NB: The head offi ce structure can be replicated at a regional as well as branch level, if appropriate. In smaller institutions, there may be a full contingent of dedicated staff but the functions of the CAU should be assigned to someone.
HOW SHOULD ONE STAFF A CAU?Typical job positions, roles and responsibilities in a CAU include:
Credit Administration Manager – coordinates and manages the activities and staff of the CAU; provides the director of credit with all necessary information and operational support; organises and oversees action plans and compliance to credit policies, procedures, and processes; assures interface with other operating units of the institution.
Reports Coordinator - gathers and organises credit related data, especially consolidation of reports; prepares management reports and regulatory compliance reports; maintains fi les and records; keeps calendar of credit activities.
48
Portfolio Analyst - monitors the loan portfolio; analyses data identifying trends, problems; prepares analytical reports and makes recommendations for actions; prepares documents for regular portfolio reviews; and assists the manager.
Compliance Coordinator – conducts regular reviews of credit departments in branches and makes recommendations for changes; provides support to credit managers and loan offi cers; monitors compliance to policies/ procedures and limits/targets/quotas; coaches loan offi cers and provides training support in use and implementation of policies and procedures.

49
RISKS AND CHALLENGES IN INDIVIDUAL LENDING
Sandeep Panikkal, Venkata N.A. and T.V.S. Ravi Kumar
50
INTRODUCTION
Many Indian microfi nance institutions (MFIs) introduced the individual lending (IL) methodology as a natural progression from the group lending methodology. MFIs want to grow their portfolios quickly while satisfying the needs of mature clients, some of whom demand larger loans that are not met by group lending norms. As a result, several MFIs have developed and expanded IL portfolios very rapidly.
Interestingly, as banks and non banking fi nancial companies (NBFCs), the traditional providers of IL products, have become more cautious due to the perceived higher risk in IL, MFIs are aggressively increasing their IL portfolios. There is a risk that some of the clients fi ltered out by banks and NBFCs on the basis of their dubious credit worthiness may take loans from MFIs with less stringent appraisal, monitoring and control systems, thus exposing the MFIs to higher risk.
The main aim of this note is to review the risks observed in the IL products offered in India, and offer strategies to mitigate them.
RISKS IN THE IMPLEMENTATION OF INDIVIDUAL LENDING
Preference of Collateral Based Lending: All Indian MFIs’ IL programmes claim to lend based on cash fl ow. But in practice, many MFIs are substituting cash fl ow-based lending for taking collaterals like gold or real estate. Collateral-based lending raises several issues including valuation, monitoring, recovery, and liquidation. There is also the added risk to ensure effective assessment of the quality of the gold and then storing it securely.
Poor Product Design: IL in most Indian MFIs tend to replicate the pattern of standard fi xed loan amounts that increase with each loan cycle, rather than the loan amount refl ecting the actual need of the client’s business. Fixed loan amounts for each loan cycle is likely to lead to under-lending to some clients and over lending to others.
Also, while designing the IL product, MFIs tend to copy the features of competitors’ products rather than designing the product based on clients’ needs and preferences. Copying products and launching them without proper research in often very different market conditions could lead to poor uptake of the product and increased delinquency by essentially dissatisfi ed clients.
Weak Underwriting Process: Key reasons why MFIs do not conduct rigorous cash fl ow analysis include:
• Limited capacity of their staff;• Sales-focused incentive schemes that reward large scale disbursements; and• Highly ambitious strategic plans often developed for private equity investors, who are in a hurry to
exit.
Since sound cash fl ow-based lending takes time, even trained staff may often cut corners in this critical area.
An MFI working in South India since 2005 started its IL product with huge fanfare in 2007 to diversify its product range and deepen its market penetration. The MFI approached IL as a separate product of its microfi nance operations, and recruited new staff to run the new department.

51
However, the MFI had to withdraw the IL product in less than a year. The following problems were experienced:
• The new staff were not properly trained, which resulted in poor client selection, poor cash fl ow assessment, inadequate credit analysis and faulty loan structuring.
• The time gap from loan application to loan disbursement was too long, extending up to 2-3 months.
• The organisation tried to continue with its existing JLG monitoring system which resulted, in hobbling efforts of fi eld staff to read early warning signals of problems.
Not Establishing Credit Histories: The pressure for growth has led some MFIs to offer IL to new clients or to clients who have only completed one loan cycle and thus have no substantive credit history. Credit discipline of such clients is also suspect. This, in the absence of a thorough cash fl ow analysis signifi cantly increases the programme’s credit risk.
Loan Appraisal/Approval Dependent on One Person: Even for IL, the branch managers are generally performing the loan appraisals and the approvals, as in group lending. Since the loan amounts are generally high and their sanctioning is largely dependent on the wisdom of one person there is the risk of delinquencies/ defaults due to poor client appraisal. There is a general tendency to approve larger amount loans to mature clients irrespective of their business, even when their cashfl ows are not adequate to repay the loan.
WHO SHOULD CONSIDER INTRODUCING IL?MFIs may want to consider introducing IL if they:
• Have good performance in group lending for 3-4 years• Want to minimise multiple borrowing among their customers due to insuffi cient loan amounts• Are facing rising dropouts because good members are leaving due to delinquent members• Are interested in diversifying their product offerings to the micro-enterprise segment• Have the institutional commitment and will to make cash fl ow based lending work• Have strong internal audit and controls, and sound governance structures and systems• Have adequate funds to fi nance the larger loans entailed• Have the MIS to manage this, more complex, lending
RISK MITIGATION
Design Product and Terms Around Needs: To design the IL product, MFIs must conduct market research to understand clients’ needs and preferences. MFIs must pilot test the newly designed IL product before roll-out.
To scale up IL, product innovation should address clients’ business needs. For example, during the monsoons in agrarian areas, people buy goods on credit from shops. This reduces the cash fl ows of shop keepers, making it diffi cult for them to repay loans. Likewise, during harvest, marriage and festival seasons, cash fl ows increase, allowing shopkeepers to repay more. Flexible repayment schedules may be more effective in these cases. BASIX has been successfully offering cash fl ow based repayments for their repeat loan customers.
It may be appropriate to have cycle-based loan ceilings, and within this limit, clients should be given

52
loans as per their business needs. Loan amounts should be ideally equal to 2 to 3 rotations of the client’s working capital. After starting with working capital loans, MFIs can then move to fi nancing capital investments of mature clients for longer periods.
Allow for Emergencies: Cash fl ow based lending, based on analysing the business and household cash fl ows are central to IL. Some proportion of the client’s total net income should remain after loan repayments as a cushion to meet business and household emergencies. This portion ranges between 50% and 75%, depending on the organisation and environment. This adjusted repayment capacity indicates the maximum amount that the client can afford per period towards a loan repayment. Multiplied by the number of payments, it provides the total maximum loan plus interest amount.
Loan Committee: The loan should be approved by a loan committee to lessen the risk of depending on one person’s perspective. Typically, the loan committee should not be chaired by the loan appraiser. Ideally, the committee may comprise of 2-3 staff involved in direct appraisals (two from different branches/areas) and one either from the area or regional level and an additional from fi nance (in some larger cases), if needed. The loan committees may be held at the branch level, area level and region level depending on the loan amount, but should meet on a regular basis to ensure rapid assessment and disbursement of loans.
Human Resources: MFIs must invest in their human resource capacities by hiring staff with the required capacities and providing appropriate training to existing staff before introducing an IL programme. Staff involved in IL need to have the capacity to conduct cash fl ow analysis and business analysis in the fi eld. They must also be able to identify various risks in the client’s business. Head offi ce staff must have market research, piloting and product development skills – or buy them in.
Delinquency Management: All the risk mitigation strategies mentioned above are part of the fi rst step in delinquency management – prevention. The other two facets of delinquency management, monitoring and response/action, must also be addressed. Unlike group lending wherein delinquency management measures are built into the model, IL offers no such cushion. In the absence of any collateral (in most cases) it becomes all the more important to have prompt and rigorous (but non-intimidating) delinquency management systems18.
Last Resort Methods: Many MFIs require a guarantor or some collateral like post dated cheques or jewellery to take an individual loan. If any client fails to repay, the immediate resort is to contact the guarantor to repay the loan as promised, or to liquidate/activate the collateral. These options provide some legal and psychological comfort in the absence of group guarantee.
CONCLUSION
The lure of “big ticket” loans and higher profi tability is attracting growth oriented MFIs to aggressively push for IL without considering the inherent risks. IL has its own idiosyncratic needs like cash fl ow based lending; analysing business needs and risks; bringing fl exibility in product features; building staff capacities and processes that must be followed for successful implementation19.
18 Refer MicroSave toolkit on Delinquency Management for IL MFIs 19 MicroSave’s Individual Lending toolkits for Credit Managers and for Credit Offi cers are available on www.MicroSave.org

53
DIAGNOSING FINANCIAL STRESS IN GROUP METHODOLOGY
Venkata N.A., Veena Yamini A. and Suresh K. Krishna

54
INTRODUCTION
Micro credit evolved and became successful on the basis of its group lending methodology, with “peer pressure” and “joint liability” as the building blocks. Now, four decades after its beginnings, the group methodology is under scrutiny, especially in India, with many stakeholders (particularly elements in the political and religious establishments) alleging that it is causing fi nancial (and indeed other) stress to the women clients. The recent past has seen instances in the south of India where groups refuse en masse to repay, which has, unsurprisingly, challenged MFI operations. The reasons for this are many, including the competitive environment, multiple borrowing20, the perceived threat from MFIs to the SHG movement and the increasing attention being focused on the sector.
This triggered Grameen Koota (GK)21 to look at their group lending methodology from a different perspective, and to ask questions about the fi nancial stress levels of the kendras22, if and how this can be diagnosed. MicroSave as the technical support partner, designed and jointly conducted a research study, “The Voice of the Kendras: Diagnosing Internal Stress”, to answer these questions.
The objective of the study23 was to identify the fi nancial stress of members, sources/reasons for this stress and indicators for measuring it, and to identify strategies for mitigating fi nancial stress amongst kendra members. This focus note presents the learnings from the study, and authors’ experience in the sector.
KEY FINDINGS
For the purpose of the research, and for this focus note, fi nancial stress is defi ned as: “a diffi culty that causes worry due to the fi nancial factors”. Financial stress is caused by a combination of factors that affects individuals, groups and kendras differently.
Delinquencies within kendras are one of the major sources of stress for members. Other life cycle and seasonality related issues also affect members’ income and expenditure patterns and add to the fi nancial stress.
1. Delinquency Related Stress Factors: In the majority of cases, the amount due from delinquent member(s) must be repaid by other group/
kendra members. If the delinquent amount is low, (usually) 2 to 3 group members take the burden of repayment; if the amount is high then all the group/kendra members contribute equally.
Financial stress also varies according to the time/season members have to pay for delinquent member, the amount and the seasonality of their business, and when the delinquency occurred.
Migration without notice (leaving other members to make the repayments) and over-indebtedness due to multiple borrowing are the major causes of serious delinquency in kendras, as well as their major causes of fi nancial stress.
The selection of inappropriate members, leading to delinquency, also causes stress. Recruitment of people who could not be trusted with debt in the fi rst place, and/or cannot attend meetings regularly, affects the kendra’s chances of getting subsequent loans, further adding to the pressure.
At times, to access multiple loans, entire kendras/ groups enroll en masse in several MFIs. In this
20See MicroSave India Focus Note 33 “Why Do Microfi nance Clients Take Multiple Loans?”21Grameen Koota, a division of Grameen Financial Services Private Limited22Kendra is a kin to a Centre in Grameen model23The study was conducted in 8 districts in Karnataka, covering 13 branches, 65 kendras and 341 respondents.

55
case, if any member becomes delinquent or defaults, the stress levels of other members can become very high as they often have to pay the delinquent amount on behalf of the delinquent/ defaulting member to many (or all) MFIs in which they have enrolled.
2. Life Cycle Event Related Stress Factors Unsurprisingly, major life cycle events such as marriage, education of children, business start up
or expansion, house construction, festivals etc. cause fi nancial stress. However, this is not just due to the size of the expense. For instance, some very high costs (like house construction, maternity, business expansion, higher education etc.) can involve relatively low fi nancial stress, as timelines are predictable, relatively long and fl exible. This gives members the ability to mobilise more resources, more systematically under conditions that entail less pressure.
3. Seasonality Related Stress Factors Income, expenditure patterns in certain months causes fi nancial stress. For instance, the month
of June is the most diffi cult for many GK members. In this month, members face very high costs for children’s education, and take credit to meet these costs - school fees, books, uniforms etc. These loans must be repaid from other income, as the investment in education does not add to their immediate earning capability. June is also the period in the year when many members face very low levels of household income.
INDICATORS FOR MEASURING FINANCIAL STRESS
Identifying indicators that give an ‘instant’ measure of fi nancial stress of members is easier said than done. However, during the study some observations were made in terms of which factors, if tracked over a period of time (combined with some qualitative research inferences, of course), can portend the building up pressure within the kendras.
• Delinquent payments and defaults can be due to reasons such as: to attend emergencies; over indebtedness due to multiple borrowings; family problems; loss of wages/business; dearth of an earning member of the family; emergency expenses; and wilful defaults. This will add to more fi nancial stress if: (a) the burden is huge and (b) the entire burden falls only on a few members.
• Drop outs that lead to delinquencies and vice versa are potential source of stress. Delinquency and default problems often exacerbate drop out problems since the group/kendra members have to pay to the MFI on behalf of delinquent members. And, of course, clients dropping out
56
often leaving without paying. So it is worth investigating the reasons for such drop outs and to analyse the resultant fi nancial stress levels.
• Group/kendra’s behaviour in terms of who takes responsibility for making up delayed or delin-quent payments, whether only a few members take up the responsibility all the time or all the members share the burden equally, also affects stress.
ROLE OF KENDRAS IN MANAGING STRESS
One major lesson that emerged from the study was also that kendras have their own coping mechanisms in terms of paying for the delinquencies and for managing fi nancial stress. Kendras are capable of learning and improving over time, and MFIs could play a key role in facilitating this process.
Some of the strategies adopted by kendras included: careful selection of new members (by checking candidate’s income sources, livelihoods sources, family background, family support etc); conducting their own loan utilisation checks; expelling the delinquent members; sanctioning loans in subsequent loan cycles based on the member capacity; reducing loan sizes as penalty; and (as a last resort) recommending to the MFI to stop loans to delinquent members.
Kendras vary widely on two critical dimensions that affect their performance in managing delinquency. These are: the quality of their leadership and their capacity to collectively learn from experience based on a certain level of mutual trust (‘social capital’).
CONCLUSION
Kendras that manage fi nancial stress best are those that anticipate these events in advance; while those that experience the greatest fi nancial stress are those that least expected them. Delinquencies due to migration without notice, and over-indebtedness owing to multiple borrowing, are major causes of fi nancial stress. If MFIs can study such delinquencies and observe any pattern, this type of research might identify ways for MFIs to increase awareness and preparedness of its kendras in future.
Also, it is important to note that many of the largest sources of fi nancial stress faced by kendras are (to a large extent) within the control of kendras and their leaders. Hence, MFIs should attempt to facilitate kendra empowerment, decision-making and action.

57
WHY DO MICROFINANCE CLIENTS TAKE MULTIPLE LOANS?Venkata N.A. and Veena Yamini A.
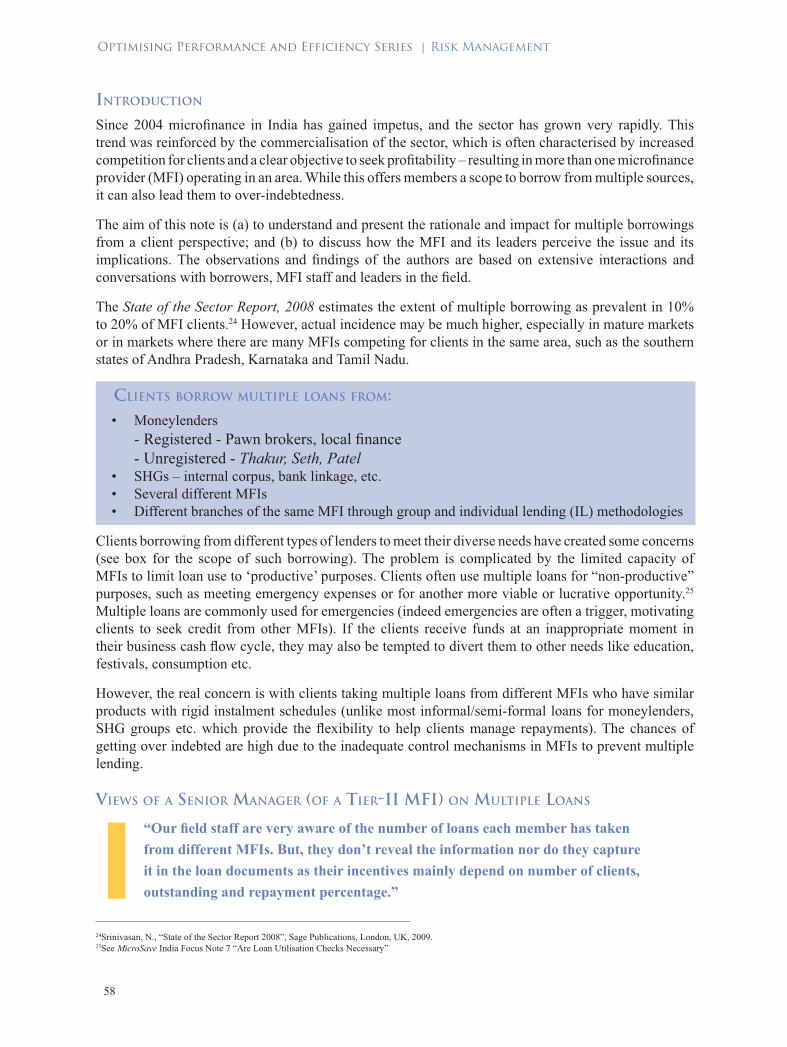
58
INTRODUCTION
Since 2004 microfi nance in India has gained impetus, and the sector has grown very rapidly. This trend was reinforced by the commercialisation of the sector, which is often characterised by increased competition for clients and a clear objective to seek profi tability – resulting in more than one microfi nance provider (MFI) operating in an area. While this offers members a scope to borrow from multiple sources, it can also lead them to over-indebtedness.
The aim of this note is (a) to understand and present the rationale and impact for multiple borrowings from a client perspective; and (b) to discuss how the MFI and its leaders perceive the issue and its implications. The observations and fi ndings of the authors are based on extensive interactions and conversations with borrowers, MFI staff and leaders in the fi eld.
The State of the Sector Report, 2008 estimates the extent of multiple borrowing as prevalent in 10% to 20% of MFI clients.24 However, actual incidence may be much higher, especially in mature markets or in markets where there are many MFIs competing for clients in the same area, such as the southern states of Andhra Pradesh, Karnataka and Tamil Nadu.
CLIENTS BORROW MULTIPLE LOANS FROM:• Moneylenders - Registered - Pawn brokers, local fi nance - Unregistered - Thakur, Seth, Patel• SHGs – internal corpus, bank linkage, etc.• Several different MFIs• Different branches of the same MFI through group and individual lending (IL) methodologies
Clients borrowing from different types of lenders to meet their diverse needs have created some concerns (see box for the scope of such borrowing). The problem is complicated by the limited capacity of MFIs to limit loan use to ‘productive’ purposes. Clients often use multiple loans for “non-productive” purposes, such as meeting emergency expenses or for another more viable or lucrative opportunity.25 Multiple loans are commonly used for emergencies (indeed emergencies are often a trigger, motivating clients to seek credit from other MFIs). If the clients receive funds at an inappropriate moment in their business cash fl ow cycle, they may also be tempted to divert them to other needs like education, festivals, consumption etc.
However, the real concern is with clients taking multiple loans from different MFIs who have similar products with rigid instalment schedules (unlike most informal/semi-formal loans for moneylenders, SHG groups etc. which provide the fl exibility to help clients manage repayments). The chances of getting over indebted are high due to the inadequate control mechanisms in MFIs to prevent multiple lending.
VIEWS OF A SENIOR MANAGER (OF A TIER-II MFI) ON MULTIPLE LOANS
“Our fi eld staff are very aware of the number of loans each member has taken from different MFIs. But, they don’t reveal the information nor do they capture it in the loan documents as their incentives mainly depend on number of clients, outstanding and repayment percentage.”
24Srinivasan, N., “State of the Sector Report 2008”, Sage Publications, London, UK, 2009.25See MicroSave India Focus Note 7 “Are Loan Utilisation Checks Necessary”

59
From the client’s perspective there are quite a number of reasons for taking multiple loans including:
• Receiving inadequate loans for business expansion as the loans are based on loan cycles rather than cash fl ow;
• Repayment of existing (high interest) loans with money lenders;• Borrowing to meet other requirements such as marriage, funeral, construction of house, health,
education etc; • For starting another business by the member/spouse/children;• On-lending (like money lenders) to neighbours/friends;• Purchasing gold jewellery in order to create savings;• Unexpected receipt of loans (while already in debt) from banks/ government; and• Repayment of existing loans with other MFIs/ SHGs.
A study conducted at Ramanagaram26 for three months period, shows that 19 of the 20 households involved in the study were indebted to more than 2 MFIs/SHGs; 10 households to more than 4 MFIs/SHGs; and 2 households to a total of 7 MFIs. One of the common reasons cited for multiple borrowings was the inadequate loan size. 10 of the 20 households were spending more on loan repayments than on food. An analysis conducted by GFSPL27 in Kolar showed that 11% of the MFI clients have loan accounts with 2 or more MFIs, with 20% of total loan amount disbursed is to clients with accounts in multiple MFIs.
A recent study28 on stress levels of kendras (centres) conducted at Grameen Koota suggested that over the years, the older kendras have learned to manage stress by adopting improved strategies. For example: hanging on as the member gradually pays off her loans; managing the delayed payments for the delinquent client; saving up amounts as small as Rs.10 per member per week to manage large delinquencies; starting group-based income generating activities that help them generate income and build affi nity; adopting more rigorous member selection practices; checking loan utilisation even when it is not required; and not permitting members to join who are members of too many other MFIs.
From the MFIs’ perspective, there are quite a number of potential ways for multiple borrowing to happen:
• MFIs’ aggressive growth plans force poaching the existing clients of other MFIs as the members have proved their credit history and they have fair knowledge of joint liability group norms and credit discipline;
• Clients do not reveal their borrowings/membership with other providers (and also MFIs do not share the information with other MFIs);
• Loan sizes are based on cycle rather than cash fl ow; • Different members from the same family or household take loans;• Borrowers avail multiple loans by taking advantage of multiple spellings/names on multiple identity
cards;• Front line staff want to reach their monthly targets and thus ignore multiple borrowing;• Front line staff do not reveal that the member has already taken multiple loans from different
institutions as they do not get any incentives for revealing this information.
26Kamath, Rajalaxmi, Arnab Mukherji and Smita Ramanathan, “Ramanagaram Financial Diaries: Loan Repayments and Cash Patterns of the Urban Slums”, IIM-B Working Paper No. 268.27Grameen Financial Services Private Ltd. for the Association of Karnataka Microfi nance Institutions (AKMI). 28Excerpts taken from the report ‘The Voice of the Kendras: Diagnosing Internal Stress’ a research conducted by teams of Grameen Koota and MicroSave in June and July 2009.
60
IMPLICATIONS
When borrowers resort to multiple borrowings to smooth their cash fl ows, they must bear a heavy burden.29 This includes: transaction, opportunity costs and time spent in various group meetings; household over indebtedness; stress of meeting multiple loan payment schedules; increased risk of inability to pay; stress of increasingly unstable joint liability agreements; and ultimately the risk of defaulting. For MFIs, there is a high risk of default and drop out, and a risk that staff and operational resources may be shifted to areas where a proliferation of MFIs is eroding portfolio quality.
CONCLUSION
It is diffi cult to attribute such multiple borrowings just to unmet demand for credit from borrowers, or to dumping of loans by the MFIs on clients well versed with the MFI methodology.30 However, MFIs can reduce the incidence of multiple borrowing. The appropriateness of disbursement timing can be improved through studying microenterprise cash fl ows by type, and changing operational policies to reduce mismatches between client cash fl ows and the timing of loan cycles. Another strategy is to implement individual cash fl ow-based lending. This entails a special product design of which the terms and conditions are based on the actual needs of the clients’ business; offer differential loan tenure and repayment schedules for each borrower based on cash fl ows; specialised recruiting, training and incentivising of a person only for cash fl ow analysis and develop specialised underwriting tools, analysis, process and approval.
At policy level, MFIs can: (a) initiate state level MFI-forums like Association of Karnataka Microfi nance Institutions (AKMI) and share data about delinquent clients and areas of multiple loans; (b) also to adjust their fi eld offi cers’ targets to be more realistic, and (c) graduate clients with need and good credit history to individual lending with higher ticket size.
29Krishnaswamy, Karuna, “Competition and Multiple Borrowing in the Indian Microfi nance Sector”, IFMR-CMF Working Paper, September 2007.30Srininvasan R. and Rajyalaxmi Kamath, “Microfi nance in India: Small, Ostensibly Rigid and Safe”, IIM-B Working Paper, 2009.

61
DELINQUENCY IN SELF-HELP GROUPS
B. Anjaneyulu and L.B. Prakash
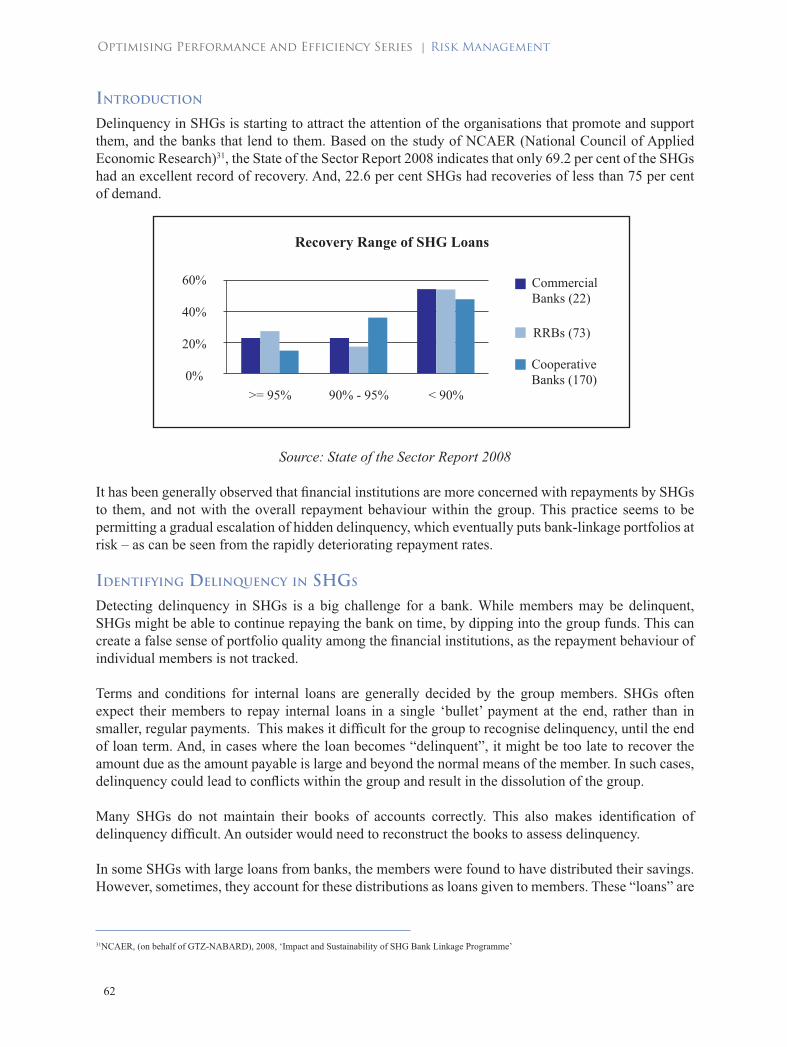
62
INTRODUCTION
Delinquency in SHGs is starting to attract the attention of the organisations that promote and support them, and the banks that lend to them. Based on the study of NCAER (National Council of Applied Economic Research)31, the State of the Sector Report 2008 indicates that only 69.2 per cent of the SHGs had an excellent record of recovery. And, 22.6 per cent SHGs had recoveries of less than 75 per cent of demand.
Source: State of the Sector Report 2008
It has been generally observed that fi nancial institutions are more concerned with repayments by SHGs to them, and not with the overall repayment behaviour within the group. This practice seems to be permitting a gradual escalation of hidden delinquency, which eventually puts bank-linkage portfolios at risk – as can be seen from the rapidly deteriorating repayment rates.
IDENTIFYING DELINQUENCY IN SHGS
Detecting delinquency in SHGs is a big challenge for a bank. While members may be delinquent, SHGs might be able to continue repaying the bank on time, by dipping into the group funds. This can create a false sense of portfolio quality among the fi nancial institutions, as the repayment behaviour of individual members is not tracked.
Terms and conditions for internal loans are generally decided by the group members. SHGs often expect their members to repay internal loans in a single ‘bullet’ payment at the end, rather than in smaller, regular payments. This makes it diffi cult for the group to recognise delinquency, until the end of loan term. And, in cases where the loan becomes “delinquent”, it might be too late to recover the amount due as the amount payable is large and beyond the normal means of the member. In such cases, delinquency could lead to confl icts within the group and result in the dissolution of the group.
Many SHGs do not maintain their books of accounts correctly. This also makes identifi cation of delinquency diffi cult. An outsider would need to reconstruct the books to assess delinquency.
In some SHGs with large loans from banks, the members were found to have distributed their savings. However, sometimes, they account for these distributions as loans given to members. These “loans” are
31NCAER, (on behalf of GTZ-NABARD), 2008, ‘Impact and Sustainability of SHG Bank Linkage Programme’

63
not repaid, and are not considered as delinquent loans. From an accounting angle, the SHG still has a corpus comprising of members savings and accumulated surplus, while in reality, the corpus is reduced/non-existent32.
In addition to hiding internal delinquencies, poor record-keeping creates a second problem. It hides situations in which the group is de-capitalised or operating only as a shell, to access external loans. From the perspective of a bank, this is a more serious problem – one which is likely to lead to rising delinquencies in the bank’s portfolio.
DELINQUENCY MANAGEMENT BY SHGS SHG members feel that internal loans taken from the group can be repaid any time, as other members understand their diffi culty. Therefore, seniority is given to other loans (banks, MFIs etc.) where the lenders do not “understand” and insist on on-time repayment.33
SHGs use peer pressure to ensure repayment from members. When a member does not repay on time, the group generally asks the delinquent member to repay at the earliest. When the group begins to view the loan as seriously delinquent, the members go to the borrower’s home and pressure her and her family to repay.34
Though arrears are high among internal loans of SHGs, this does not necessarily translate into a high default rate. Almost all SHGs are successful in the eventual collection of loans owed by members. This is because, for many poor members, cash fl ows do not correspond to monthly loan instalment schedules, but rather depend on seasonal income such as agriculture and animal husbandry.35
However, over a period of time, having a repayment schedule and not adhering to it could lead to credit indiscipline in repayment of not only internal loans, but also external loans, particularly when the loan sizes become large and where the SHGs do not have adequate buffer of internal funds to tide over internal delinquencies.
CURRENT DELINQUENCY PREVENTION STRATEGIES
BanksThe anticipation of a subsequent and a larger loan from the bank motivates the group to repay a bank loan, and the risk of an adverse credit history acts as a disincentive to the group to default. Government schemes (such as reimbursement of interest paid above 3% paid on SHG-bank linkage loans repaid on-time in Andhra Pradesh), also motivate the SHGs to repay on time.
Prior to lending, banks assess SHGs by using the Critical Rating Index (CRI)36 or a similar quality assessment tool. Most banks also ensure that the groups get loans as a multiple of their accumulated savings (approved multipliers typically range from 1:1 up to 1: 8, at the discretion of the banker). Thus, the prospect of a subsequent and larger credit motivates the SHGs to make regular repayment of existing loans.
32It is also misleading to mention the corpus as available, in SHG Balance Sheet.33Competition in Microfi nance – a study by APMAS in Guntur district, Andhra Pradesh.34For more examples see Self-Help Groups in India: A Study of Lights and Shades 35L.B. Prakash. Value for Money – Cost of Promoting SHGs Consultative Group to Assist the Poor (CGAP), Occasional Paper No. 12, Aug 2007.36Critical Rating Index (CRI) has been designed by the NABARD, and circulated to all the banks to assess the SHG prior to lending
64
SHPIs and MFIs Peer pressure is the dominant method adopted by self-help promoting institutions (SHPIs) and MFIs in addressing delinquency in SHGs (e.g., Indira Kranti Padham (IKP) in AP and Chaitanya promoted Federations in Maharashtra).
• The Mutual Benefi t Trusts (MBTs) supported by Chennai-based Sarvodaya Nano-Finance Ltd. suspend fresh loans to all SHGs in a village when one SHG is seriously delinquent. This triggers pressure on the delinquent group for immediate loan repayment, and has ensured high repayment performance.
• BWDA Finance Limited (BFL) based in Tamil Nadu conducts internal auditing and rating of all SHGs prior to receiving loan applications. The leader of the SHG gets 0.5% of the loan amount as incentive, if repayment is on-time during the entire term of the loan. The branch staff also receive an incentive for on-time repayment by the SHG.
• The SHG Federations promoted by Chaitanya, an NGO in Maharashtra, use clusters and federations to put pressure on delinquent SHGs. Federation staff conduct regular auditing and rating of SHGs prior to accepting loan applications.
CONCLUSION
Some fi nancial institutions are advancing loans to SHGs, based on the repayment performance, without reviewing the SHG’s internal repayment performance. Where a member fails to pay, the group repays the loan from its internal funds – savings and reserves. While this is in line with the group concept, it buries the problem, and the fi nancial institution might be lending to a group of defaulting members, of whom it is not even aware!
In the case of SHGs, many fi nancial institutions seem to be focussing on managing delinquency while the focus should be on detection and prevention. New measures must be taken to ensure that SHGs that receive loans are capable of repaying them.
Banks have to make it mandatory to assess the group performance before sanctioning a loan, and not just decide on the basis of previous loan repayment. As with the best performing Joint Liability Group-based MFIs, SHPIs, MFIs and banks may have to create systems to track repayment behaviour of the individual members within the groups, and not just repayment by SHG as a whole.
Periodical monitoring of the SHG performance and portfolio quality will provide insights to the potential delinquency problems. SHPIs have to promote simple and compulsory book keeping system in the SHGs and encourage the SHGs to update their books regularly. This will help all, the SHGs, the SHPI and the lending institutions to assess the functioning of the SHGs and take an informed decision.
SHGs seem to be able to collect internal loans from their members, though based on a quite different logic of timeliness and repayment discipline than that of a bank. But the “indiscipline” in repaying internal loans, unless addressed could later affect the repayment of the SHG’s external borrowings.

65
PROVISIONING FOR LOAN IMPAIRMENT IN MFIS37
Raj Kumar and Anil Paul
37This IFN uses the terminology suggested by the SEEP network for loan loss provision and loan loss reserve as used generally in India
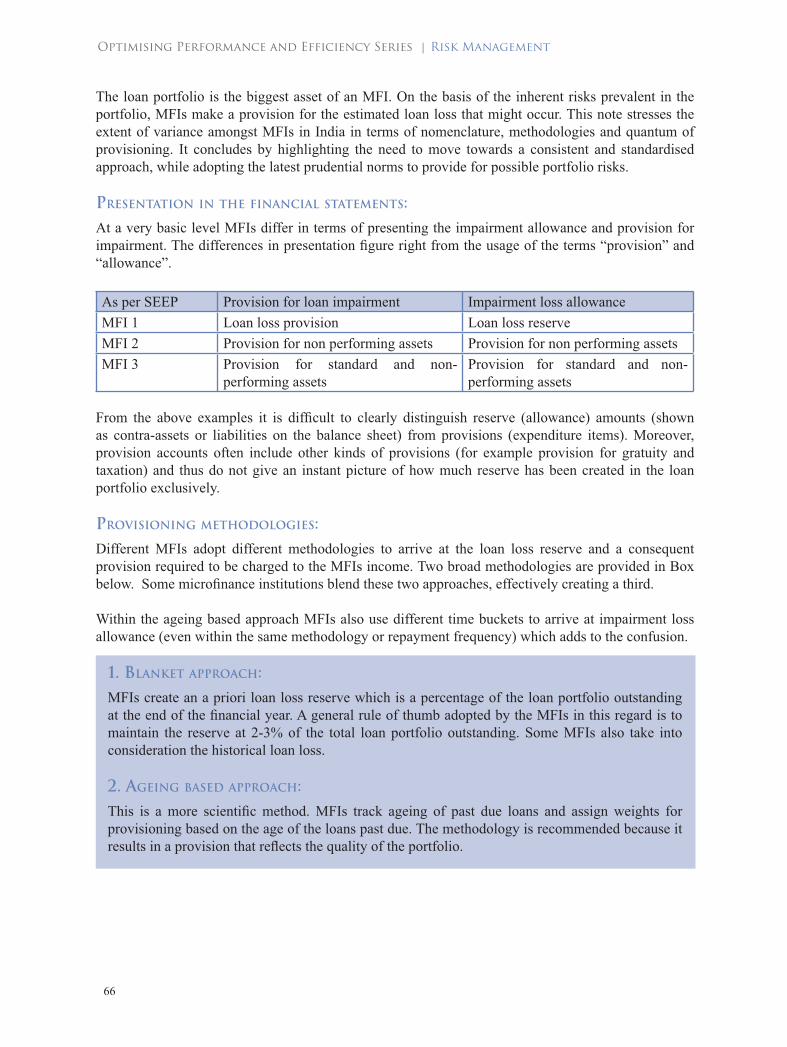
66
The loan portfolio is the biggest asset of an MFI. On the basis of the inherent risks prevalent in the portfolio, MFIs make a provision for the estimated loan loss that might occur. This note stresses the extent of variance amongst MFIs in India in terms of nomenclature, methodologies and quantum of provisioning. It concludes by highlighting the need to move towards a consistent and standardised approach, while adopting the latest prudential norms to provide for possible portfolio risks.
PRESENTATION IN THE FINANCIAL STATEMENTS: At a very basic level MFIs differ in terms of presenting the impairment allowance and provision for impairment. The differences in presentation fi gure right from the usage of the terms “provision” and “allowance”.
As per SEEP Provision for loan impairment Impairment loss allowanceMFI 1 Loan loss provision Loan loss reserveMFI 2 Provision for non performing assets Provision for non performing assetsMFI 3 Provision for standard and non-
performing assetsProvision for standard and non-performing assets
From the above examples it is diffi cult to clearly distinguish reserve (allowance) amounts (shown as contra-assets or liabilities on the balance sheet) from provisions (expenditure items). Moreover, provision accounts often include other kinds of provisions (for example provision for gratuity and taxation) and thus do not give an instant picture of how much reserve has been created in the loan portfolio exclusively.
PROVISIONING METHODOLOGIES:Different MFIs adopt different methodologies to arrive at the loan loss reserve and a consequent provision required to be charged to the MFIs income. Two broad methodologies are provided in Box below. Some microfi nance institutions blend these two approaches, effectively creating a third.
Within the ageing based approach MFIs also use different time buckets to arrive at impairment loss allowance (even within the same methodology or repayment frequency) which adds to the confusion.
1. BLANKET APPROACH: MFIs create an a priori loan loss reserve which is a percentage of the loan portfolio outstanding at the end of the fi nancial year. A general rule of thumb adopted by the MFIs in this regard is to maintain the reserve at 2-3% of the total loan portfolio outstanding. Some MFIs also take into consideration the historical loan loss.
2. AGEING BASED APPROACH: This is a more scientifi c method. MFIs track ageing of past due loans and assign weights for provisioning based on the age of the loans past due. The methodology is recommended because it results in a provision that refl ects the quality of the portfolio.

67
REGULATORY REQUIREMENTS:Indian Accounting Standard AS4 deals with the provision for loan impairment38. The Guide also refers to recommendatory standard AS30 according to which the provision should be calculated as the difference between the loan’s carrying amount and the present value of estimated future cash fl ows at the original effective interest rate on the loan.
The Reserve Bank of India has prescribed minimum provision requirements for advances of NBFCs39
by classifying them based on the time that they are overdue. An asset becomes non-performing when instalment and/or interest of a term loan is overdue for a period of six months or more. RBI has laid down the following criteria for classifi cation of various types of advances, including the term loan:
1. Sub-standard asset: a non-performing asset for a period not exceeding 18 months. 10% provision is required
2. Doubtful asset: which remains a sub-standard asset for a period exceeding 18 months. 100% provision (on unsecured loans) required
3. Loss assets: asset where loss has been identifi ed by the bank or internal or external auditors or the RBI inspection that the amount has not been written off wholly. 100% provision is required
The practice of provisioning varies across the Section 25 Companies, Trusts, Societies and Cooperatives as there are no statutory guidelines available. Therefore, the MFIs follow either the blanket approach or arrival at the reserve requirement through the ageing analysis of the loans, which in many cases again differs based on the delivery methodology (individual/JLG) and the repayment term (weekly/monthly).
RATING FRAMEWORKS MFI evaluation frame works and rating agencies use loan portfolio quality as one of the criteria for assessing MFIs’ performance. Due to the variance in the treatment of provision for loan impairment all these frameworks make adjustments to the fi nancial statements to enable comparisons among the different institutions. For example, CAMEL performs six adjustments, one of which is provision for loan impairment.
INDUSTRY BENCH MARKS
Sa-Dhan40 considers loan loss reserve as a rough indicator of the overall quality of the portfolio and as a measure of an MFI’s strategy to tackle current and future delinquency. According to Sa-Dhan, normally sustainable institutions have a loan loss reserve less than or equal to 3%. However, there are yet no clear guidelines on how to calculate the reserve requirement for different methodologies.
SEEP network41offers a portfolio ageing schedule on which to create a reserve; adopted by some MFIs. The age brackets for provisioning are 0 days, 1-30 days, 31-60 days, 61-90 days, 91-180 days, 181-365 days and greater than 365 days. However provisioning rates vary widely across the brackets.
The MicroBanking Bulletin42 considers any loan “at risk” when payment is over 90 days late. It
38The explanation of AS4 in the Technical Guide on Accounting for Microfi nance Institutions published by The Institute of Chartered Accountants of India recommends an ageing analysis to make provisions based on their loan repayment cycle etc. with NBFCs subject to the prudential norms issued by the RBI.39RBI Notifi cation No. DNBS. 193 DG(VL)-2007 dated February 22 , 200740Sa-Dhan Microfi nance Manager Series:- Technical Note #4 “How to use the Loan Loss Ratio in Microfi nance”.41Referenced from SEEP network and Alternative Credit Technology, LLC publication ”Measuring Performance of Microfi nance Institutions: A framework of Reporting, Analysis and Monitoring”.42Microbanking Bulletin, Issue 17, Autumn 2008.

68
provisions 50% of the outstanding balance for loans between 90 and 180 days late, and 100% for loans over 180 days. In case of re-fi nance or rescheduling of delinquent loans due to high probability of default, 50% of all rescheduled balances are taken as provision. All loans are fully written off within one year of their becoming delinquent.
IMPLICATIONS: It is apparent that the provision for loan impairment helps to assess the true profi tability of an MFI. An inappropriate provisioning method will likely distort the asset quality and fi nancial performance. MFIs use inconsistent language to defi ne loan loss provision and also use different methods to calculate loan loss. Differing provisioning methodologies and bases of presentation will not allow comparability between different MFIs and therefore will make it diffi cult for lenders and investors to take sound decisions. This is also likely to result in an erosion of investor confi dence in the way MFIs report their profi tability.
The absence of clear reserve standards has both internal and external implications. One, it poses a systemic risk to the sector as a whole. Much microfi nance is still delivered through MFIs which are not regulated. RBI’s provisioning norms are not applicable to them. Given that non-collaterised lending requires higher risk reserves, it is important to agree upon common standards of provisioning. This should include not only common terminology, but also loan portfolio classifi cation and provisioning required in each classifi cation. To this end, even for the NBFC MFIs, the RBI-prescribed provisioning requirements may not be suffi cient. The microfi nance sector will need to develop its own provisioning norms.
Minimum standards must easily meet the regulatory requirements prescribed by the RBI (in case of NBFC MFIs), and yet provide adequate cover for risk. The minimum standards must be responsive to diverse lending methodologies and repayment frequencies. These standards should also adopt counter-cyclical provisioning. The G-20 Working Group on Enhancing Sound Regulation and Strengthening Transparency recently recommended that loan loss provisions should be built up while the economy is healthy in order to enhance the ability of fi nancial institutions to withstand the impact of economic downturns. The Reserve Bank has been encouraging banks to build fl oating provisions as a buffer for the possible stress on asset quality later.43 This is surely appropriate for MFIs as well. Minimum adequate provisioning standards will not only hedge against the individual institutional risk at the MFI level, but also the potential collective systemic risk in the sector. A standardised approach will allow MFIs to benchmark their own performance against peers while enhancing the confi dence of lenders and investors in the sector. MFIs would, of course, still be free to provision beyond the minimum standards.
The sooner the Indian microfi nance sector comes together to create some consistency and clarity on terminology and standards, the better for all involved.
43Annual Policy Statement for the Year 2009-10 by Dr. D. Subbarao Governor, Reserve Bank of India. Date of Publish: May 11, 2009
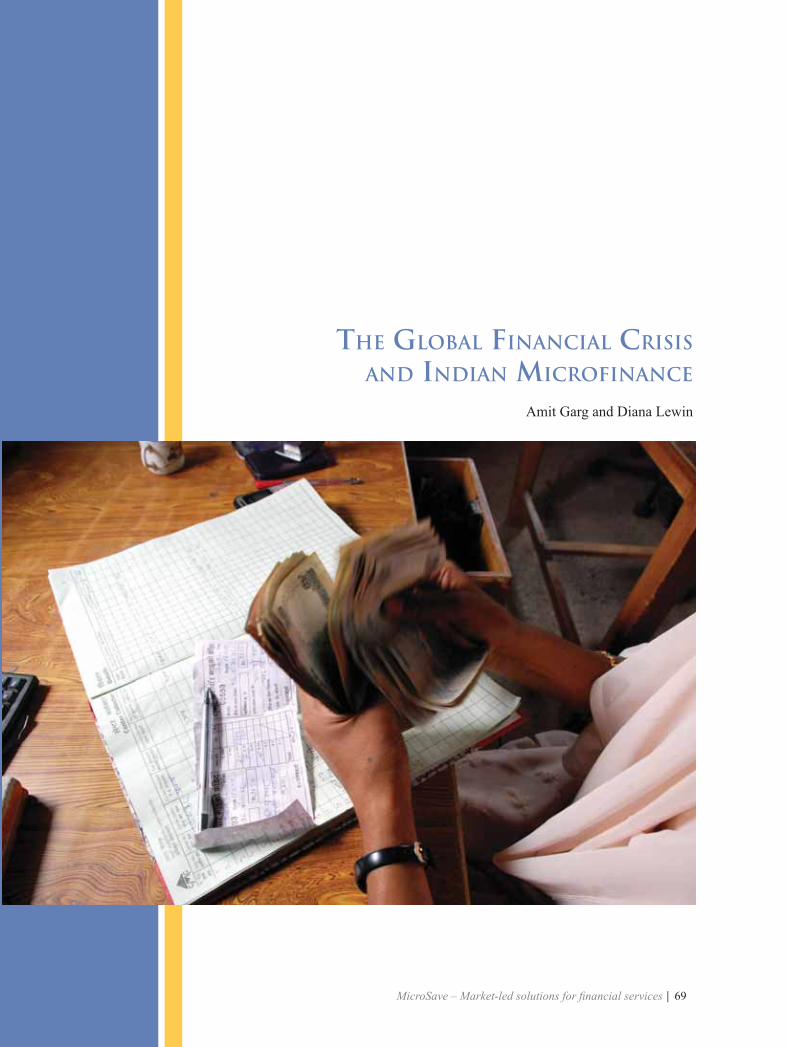
69
THE GLOBAL FINANCIAL CRISIS AND INDIAN MICROFINANCE
Amit Garg and Diana Lewin
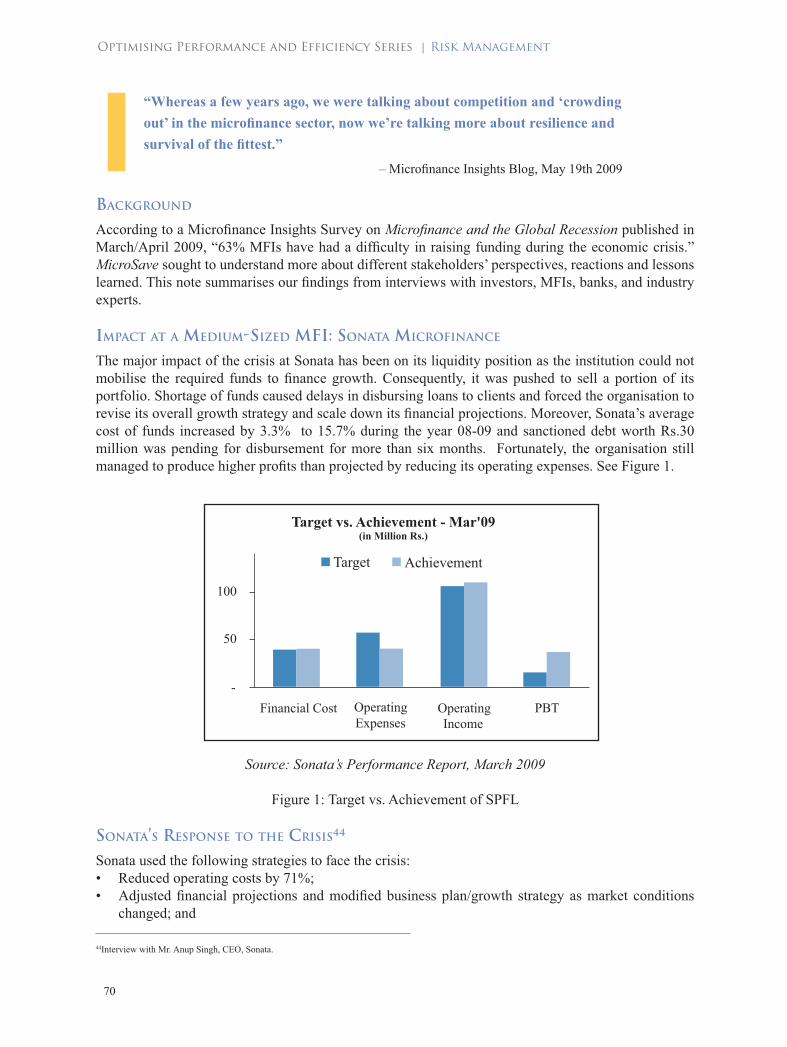
70
“Whereas a few years ago, we were talking about competition and ‘crowding out’ in the microfi nance sector, now we’re talking more about resilience and survival of the fi ttest.”
– Microfi nance Insights Blog, May 19th 2009
BACKGROUND According to a Microfi nance Insights Survey on Microfi nance and the Global Recession published in March/April 2009, “63% MFIs have had a diffi culty in raising funding during the economic crisis.” MicroSave sought to understand more about different stakeholders’ perspectives, reactions and lessons learned. This note summarises our fi ndings from interviews with investors, MFIs, banks, and industry experts.
IMPACT AT A MEDIUM-SIZED MFI: SONATA MICROFINANCE
The major impact of the crisis at Sonata has been on its liquidity position as the institution could not mobilise the required funds to fi nance growth. Consequently, it was pushed to sell a portion of its portfolio. Shortage of funds caused delays in disbursing loans to clients and forced the organisation to revise its overall growth strategy and scale down its fi nancial projections. Moreover, Sonata’s average cost of funds increased by 3.3% to 15.7% during the year 08-09 and sanctioned debt worth Rs.30 million was pending for disbursement for more than six months. Fortunately, the organisation still managed to produce higher profi ts than projected by reducing its operating expenses. See Figure 1.
Source: Sonata’s Performance Report, March 2009
Figure 1: Target vs. Achievement of SPFL
SONATA’S RESPONSE TO THE CRISIS44
Sonata used the following strategies to face the crisis:• Reduced operating costs by 71%;• Adjusted fi nancial projections and modifi ed business plan/growth strategy as market conditions
changed; and
44Interview with Mr. Anup Singh, CEO, Sonata.

71
• Managed scarce on-lending resources by prioritising repeat loans to existing clients over fi rst loans to new clients. This will contribute to long term portfolio quality and income as the assurance of repeat loans is the main driver of good repayment rates. However, this has resulted in only 81% target achievement for number of clients in March 2009, even when targets had been revised down in October 2008.
IMPACT ON INVESTORS
Indian microfi nance investors have seen their investees affected by the crisis.45 DiA Vikas Capital Pvt. Ltd. (DiA) had to lobby with banks to provide funds for its start-up partners and leverage their capital investment. DiA also began offering subordinated debt46 to its partners so they could further increase leverage. This enabled most of them to add 3-4 new funders and to enhance credit exposure from existing funders. Further, DiA provided short term loans to its partners, particularly start-ups, which enabled them to grow steadily and become attractive candidates for debt funding from mainstream fi nancial institutions.
MITIGATION STRATEGIES
The microfi nance sector has to prepare well in advance to reduce its vulnerability to economic shocks. Below are suggestions from various experts on how MFIs might build resilience.
CAPITAL STRUCTURING & FINANCIAL MANAGEMENT47
• Diversify Debt Sources: Due to scarce on-lending resources, many MFIs had to adapt to the stricter terms imposed by lenders (increased cash collateral, reduced repayment frequency, personal guarantee requirement, portfolio buy-outs, and increased interest rates, among others). By diversifying sources, MFIs can reduce dependency on a single source and achieve greater bargaining power to determine the terms of loans. A good mix of public and private sector banks with varying debt exposure would further reduce the risk.
• Reduce Financial Risk by Decreasing Leverage/Increasing Equity: As part of their diversifi cation strategy, MFIs should focus on increasing equity. Indian microfi nance is characterised by its high leverage and high off-balance sheet obligations, which means that most MFIs have acquired fi xed debt obligations that must be paid irrespective of the income generated by the organisation in any year. At times of crisis (and indeed in times of signifi cantly lower than expected revenues), debt-obligations and dependence on lenders can hamper growth, achievement of mission/vision, and even can threaten the existence of the MFI. By increasing equity, the MFI obtains a cushion to fund its operations during the bad times and to absorb possible losses; the MFI reduces dependence on external sources and risk of default, and most importantly, it increases chances of survival.
• Reduce Refi nancing Risk by Increasing the Term of Debt: Refi nancing risk is the possibility that an MFI will not be able to obtain new sources of funds as the old ones mature, or that the sources obtained will come at a higher cost, adversely affecting net income. Increasing the term of the loans is one way to reduce this risk, as there are fewer chances that the loan will mature at the time of a crisis. However, the strategy also has a cost: when market rates go down, the MFI may fi nd itself with higher cost of funds than its competitors.
• Improve Asset-Liability Management: MFIs should engage in better Asset Liability Management practices by looking at their liquidity maturity buckets to fi nd gaps between cash infl ows and outfl ows at different points in time. Accordingly, the organisation can structure its debt loans to
45Interview with Mr. Saneesh Singh, Executive Director, DiA Vikas Capital Pvt. Ltd, a subsidiary of Opportunity International Australia.46A subordinated loan is “debt over which senior debt takes priority. In the event of bankruptcy, subordinated debt-holders receive payment only after senior debt is paid off in full.” Source: Glossary, CFA Program Curriculum Level II, 2008.47See MicroSave’s Basic Financial Management & Ratio Analysis and Institutional and Product Risk Analysis toolkits.
72
be received on dates with negative cash-fl ows. MFIs need to stress the importance of on-time negotiation with bankers to ensure adequate funding availability. Bandhan uses at least one quarter advanced planning for obtaining funds48.
SIDBI’S INITIATIVES TO AID THE SECTOR49
SIDBI has a mandate to increase the liquidity in the microfi nance sector. For this purpose, it has invested in MFIs through three investment vehicles50. Starting in the fi nancial year 2008-2009, SIDBI has begun syndicating loans for MFIs. This means that, in addition to its own lending, SIDBI arranges funds from different institutions to its investees for a fee ranging from 0.5% to 1%. So far, SIDBI has entered one syndication agreement with SKS to obtain Rs.1,000 crore. The syndicated loan should result in reduced cost of funding for the MFI51 and ease access to variety of funding sources.
MEASURE GROWTH
“MFIs should not take for granted that money will come... growth may be fi nite.”52 Organisations should emphasise sustainability and measured growth, and should carefully consider the cost of their expansion strategies. Saturation of existing operational areas before large-scale horizontal expansion may be a better growth strategy, reducing cost and increasing effi ciency in caseload and overall management.
STRENGTHEN GOVERNANCE
All rating agencies and investors pay great attention to the quality of governance of MFIs. Below are key indicators of sound governance which may ease fundraising efforts:
• Presence of experienced microfi nance practitioners and bankers in the Board of Directors,• Involvement and effi ciency,• Quality and track record of senior management, and• Issues of transparency, disclosure and audit.
REDUCE OPERATING COSTS THROUGH EFFICIENT SYSTEMS OR TECHNOLOGY LEVERAGE53
In the era of intensifying competition, most MFIs have focused on rapid growth as their core strategy. But too often limited attention is given to quality of operations and products, which are the core of any MFI. Sound and effi cient operations and strengthened systems have three effects. First, they reduce operating costs; second, they boost the confi dence of funding institutions as they see better security of their investments; and third, they help in maintaining better portfolio quality, thus increasing revenues. Optimising processes (and where appropriate, leveraging technology) can help in reducing operating costs and bringing effi ciency. In addition, reduced operating costs can set off some losses arising due to increased fi nancial cost.
48Interview with Finance Team, Bandhan.49Interview with SIDBI offi cials at SIDBI’s Lucknow offi ce. 50In FY 08-09, SIDBI has subscribed Rs.32crore in MFI’s equity/quasi equity through three types of investment vehicles: pure equity for well performing NBFCs, convertible term loan, and transformation loan.51Loan Market Guide, S&P, October 2008.52Interview with Mr. Manoj Sharma, Director, MicroSave.53See MicroSave’s toolkits on Process Mapping and MIS for MFIs.

73
ENHANCE VALUE PROPOSITION54
In times of crises, with increasing cost of capital and narrowing margins, only the fi ttest may survive. This means that MFIs must re-consider their value proposition in light of client’s needs. An MFI which serves the needs of its target market will see continued revenue fl ow by retaining clients. MFIs should revise their strategic business plans and develop a strategy to attain sustainable competitive advantage.55
CONCLUSION
In the Indian context, the fi nancial crisis has challenged the assumption of unlimited fund availability that has sustained growth higher than 70 per year in the last 3 years.56 It is now time for MFIs to emphasise on issues of quality (and to focus less on quantity): quality of products, quality of management, and quality of governance. Hopefully, Indian MFIs will take advantage of this low period to strengthen their systems and plan for future market-led growth
54See MicroSave’s Market Research for MicroFinance toolkit. 55See MicroSave’s Strategic Business Planning toolkit. 56Bharat Microfi nance Reports - Quick Data (2008 and 2009).

INST
ITU
TIO
NA
L D
EV
EL
OPM
EN
T
Cor
pora
te B
rand
and
Iden
tity
Stra
tegi
c B
usin
ess
Plan
ning
• M
arke
t Res
earc
h fo
r Mic
ro
Fina
nce
• St
rate
gic
Mar
ketin
g fo
r M
FIs
• Pr
oduc
t Mar
ketin
g St
rate
gy•
Cor
pora
te B
rand
and
Id
entit
y•
Cus
tom
er S
ervi
ces f
or
Fina
ncia
l Ins
titut
ions
•
Proc
ess M
appi
ng•
Cap
ital S
truct
urin
g &
Eq
uity
Val
uatio
n
• M
arke
t Res
earc
h fo
r Mic
roFi
nanc
e •
Qua
ntita
tive
Mar
ket R
esea
rch
Met
hods
•
Cos
ting
and
Pric
ing
of F
inan
cial
Se
rvic
es•
Proc
ess M
appi
ng•
Inst
itutio
nal a
nd P
rodu
ct D
evel
opm
ent
Ris
k A
naly
sis
• In
divi
dual
Len
ding
for M
anag
ers
• In
divi
dual
Len
ding
for C
redi
t Offi
cers
•
Plan
ning
, Con
duct
ing
and
Mon
itorin
g Pi
lot T
ests
: Sav
ings
Pro
duct
s•
Plan
ning
, Con
duct
ing
and
Mon
itorin
g Pi
lot T
ests
: Loa
n Pr
oduc
ts•
Prod
uct R
oll-O
ut
• M
arke
t Res
earc
h fo
r Mic
roFi
nanc
e •
Cus
tom
er S
ervi
ces f
or F
inan
cial
In
stitu
tions
• Pr
oces
s Map
ping
• Lo
an P
ortfo
lio A
udit
• In
tern
al A
udit
& C
ontro
ls•
Fina
ncia
l and
Acc
ount
ing
Syst
ems
• Fi
nanc
ial M
anag
emen
t and
Rat
io A
naly
sis
• A
dvan
ced
Acc
ount
ing
for M
FIs
• M
anag
emen
t Inf
orm
atio
n Sy
stem
s for
M
FIs
• D
elin
quen
cy M
anag
emen
t for
Gro
up-b
ased
M
FIs
• H
uman
Res
ourc
e M
anag
emen
t•
Des
igni
ng a
nd Im
plem
entin
g St
aff
Ince
ntiv
e Sc
hem
es•
Trai
ning
of T
rain
ers
• B
ranc
h M
anag
ers’
Trai
ning
Prod
uct D
evel
opm
ent
and
Prom
otio
n
Gov
erna
nce
Prod
uct D
eliv
ery
and
Cus
tom
er S
ervi
ce
Soci
al P
erfo
rman
ce M
anag
emen
tTi
er 1
St
rate
gies
Tier
2St
rate
gies

Kenya Offi ceShelter Afrique House, Mamlaka Road,P.O. Box 76436, Yaya 00508,Nairobi, Kenya.Tel: +254-20-2724801 / 2724806Fax: +254-20-2720133Mobile: +254-0733-713380
Uganda Offi cePlot 119, Kira Road,P. O. Box 7184,Kampala, Uganda.Tel. +256-312-260225Mobile: +256-0772-426708
Manila Offi ceUnit 202, Residencia 8888,Pearl Drive, Ortigas Center,Pasig City, Metro Manila,Philippines.Mobile: +63-917-597-7789Landline: (632) 577-0187
India - Head Offi ceB-52, Kapoorthala Crossing,Mahanagar Extension, Mahanagar,Lucknow-226006, UP, India.Tel: +91-522-2335734Fax: +91-522-4063773
India - Delhi Offi ce396, DDA Flats, Sector 22, Dwarka, New Delhi-110045, India.
India - Hyderabad Offi ce23, Sai Enclave, Road No. 12, Banjara Hills, Hyderabad-500034, AP, India. Tel: +91-40-23386140
MicroSaveMarket-led solutions for fi nancial servicesMarket-led solutions for fi nancial services
E-Mail: [email protected] . Website: www.MicroSave.org