mLLETIN 135 /HAWAII AGRICULTURAL EXPERIMENT … · At present, there is no readily accessible...
88
mLLETIN 135 /HAWAII AGRICULTURAL EXPERIMENT STATION /UNIVERSITY OF HAWAII
Transcript of mLLETIN 135 /HAWAII AGRICULTURAL EXPERIMENT … · At present, there is no readily accessible...
mLLETIN 135 /HAWAII AGRICULTURAL EXPERIMENT STATION /UNIVERSITY OF HAWAII

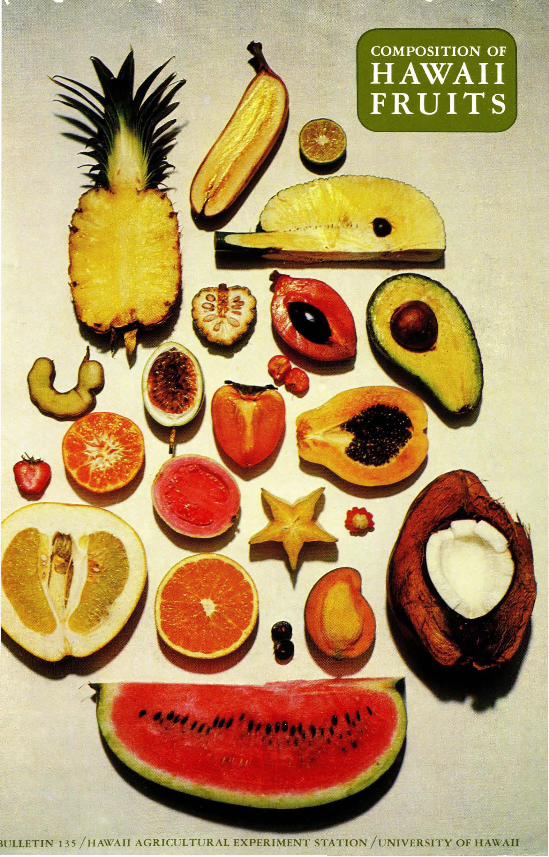
Pineapple
Orange
Cover photogroph courtesy of R. Wenkom.
Carambola

COMPOSITION OF HAWAII FRUITS
NAO S. WENKAM
and
CAREY D. MILLER
UNIVERSITY OF HAWAIl
COLLEGE OF TROPICAL AGRICULTURE
HAWAll AGRICULTURAL EXPERIMENT STATION
HONOLULU, HAWAII
BULLETIN No. 135DECEMBER 1965


CONTENTS
INTRODUCTION
SOURCES OF DATA
EXPERIMENTAL PROCEDURE
Preparation and Sampling.Analytical Methods
MoistureProtein .Fat .Crude Fiber.Total Ash .Calcium.Phosphorus.Iron.CaroteneThiamineRiboflavinNiacin .Ascorbic Acid
Conversion Factors and Notes on NutrientsProtein, Carbohydrate, and Food EnergyVitamin A Value .Calcium, Phosphorus, and Iron
DESCRIPTION AND NUTRITIVE VALUE
RESULTS AND DISCUSSION.
Comparison with Fruits Grown ElsewhereAscorbic Acid Variation .
SUMMARY AND CONCLUSIONS.
ApPENDIX: DESCRIPTION AND TREATMENT OF SAMPLES
LITERATURE CITED
INDEX
Tables
PAGE
78
8
8
999999999
10101010
10101011
11
11
2728
28
29688385
Table 1. Composition of Hawaii fruits, per 100 grams of edible portion 30Table 2. Composition of Hawaii fruits, in household units and common portions 36Table 3. Composition of Hawaii fruits, in 100-calorie portions . 50Table 4. Portions considered refuse and percentage of refuse 64Table 5. Variation in the ascorbic acid content of mango varieties 66Table 6. Ascorbic acid variations in mangos of the Haden and Joe Welch
varieties . 67Table 7. Changes in ascorbic acid content of fruit during ripening 67

ACKNOWLEDGMENTS
The authors acknowledge the help of the staff of the Department of Horticulture, in locating and supplying many fruits for analyses. We especially thankDr. Richard A. Hamilton, Professor of Horticulture, who brought to ourattention some new fruits, supplied us with many samples, and checked thescientific names and descriptions. We are grateful to the personnel of theUniversity of Hawaii Cooperative Extension Service and the Kona Branch Station, and the many people who supplied fruits from their gardens.
We are indebted to Dr. Florence Pen (deceased, 1958) and Mrs. FlorenceKee Ng for about half of the unpublished analytical work from the Departmentof Foods and Nutrition, and to Mrs. Mildred Ige for assistance in the calculations.
The people who prepared the publications listed under sources of data (p. 8)have also contributed to this bulletin.
THE AUTHORS
NAG S. WENKAM is Assistant Nutritionist at the Hawaii Agricultural Experiment Station and Assistant Professor of Nutrition, University of Hawaii.
CAREY D. MILLER is Professor Emeritus of Foods and Nutrition, Universityof Hawaii.

COMPOSITION OF HAWAII FRUITS
NAO S. WENKAM and CAREY D. MILLER
INTRODUCTION
Hawaii residents are fortunate in having available many fruits of tropicaland semitropical origin, in addition to the familiar mainland fruits. This publication brings together data on food energy, proximate composition, threeminerals, and five vitamins in about 60 fruits. Coconuts and macadamia nuts,though not classed as fruits, have been included. This publication has beenprepared in response to repeated requests from nutritionists, doctors, dietitians,homemakers, educators, and other allied workers who are concerned with thenutritive value of foods in Hawaii, Asia, and other Pacific-basin countries.
Most of the fruits included have been introduced into the Hawaiian Islandssince their discovery by Captain Cook; only the mountain apple, ohelo berry,and some of the bananas are indigenous species. Introduction of new varietiesand a few species continues. The fruits analyzed include the most importantones grown in Hawaii and some of the less important.
At present, there is no readily accessible publication on the composition offruits grown in Hawaii, as data have been lacking, or information previouslyavailable is out of print or in libraries only. Since this bulletin is of a technicalnature it will be most valuable as a reference.
Fruits are essential for a good diet as a source of vitamins, organic acids,basic ash, and roughage. Attention should be given to the high nutritive valueof some easily grown and generally available Hawaii fruits such as avocado,papaya, guava, mango, and acerola. The greater use of fruits, especially fordesserts and between-meal snacks in place of high-carbohydrate sweets anddrinks, is highly recommended.
7

SOURCES OF DATA
The food composition values are from chemical analyses and vitamin assaysoriginating in the Department of Foods and Nutrition,l University of Hawaii,under the direction of one of the authors (CDM), with a few exceptions. Aboutone-half of the figures are unpublished data-the work of Dr. Florence Pen,Mrs. Florence Kee Ng, and Mrs. Nao Sekiguchi Wenkam.
The other half are based on the original analytical data, determined for pastHawaii Agricultural Experiment Station publications, which were still availablefor use. About two-thirds of the published values are from analyses done forTechnical Bulletin 30, Vitamin Values of Foods Used in Hawaii (18), and aboutone-third are from the proximate composition and mineral analyses done forBulletin 77, Some Fruits of Hawaii (17). A small portion is taken from "TheComposition of Hawaiian Fruits and Nuts," in the Report of the Hawaii Agricultural Experiment Station (27).2 Parts of the data for coconut were taken fromBulletin no, Some Tropical South Pacific Island Foods (20), and for macadamianut from "Nutritive Value of Macadamia Nuts" (15). Most of the descriptivematerial is taken from Fruits of Hawaii (16).
To simplify the main tables, only one figure is given for each nutrient,although more than one assay may have been made. When analyses for a singlefruit were done on more than one sample, i.e., vitamin values on one sampleand the remaining nutrients on another sample, then the values were recalculatedto a single moisture basis. Where more than one assay was done for a nutrient,adjusted mean averages are reported, except in a few cases where the combinedjudgment of the authors indicated that one or more should be omitted. Samplesof each fruit are described in the Appendix.
EXPERIMENTAL PROCEDURE
Preparation and Sampling
The edible portions only were used for analyses. A list of the fruits analyzed,with a description of sample size, condition of fruit, portion considered refuse,and percentage of refuse, is given in the Appendix and in table 4.
In general, preparation involved washing the fruit with tap water and dryingwith cheesecloth or with an electric fan. The edible portions were thoroughlymixed and subsamples withdrawn for the individual nutrient analyses in amanner most conducive to the retention of each nutrient. For large items suchas pineapples, papayas, avocados, etc., opposite lengthwise sectors were taken,cut into I-inch pieces, thoroughly mixed, and subsamples taken for eachnutrient.
I Now called the Division of Nutrition, Department of Home Economics.2 The analytical methods used for the latter two publications (17 and 27) were essentially
those of the official chemists ar that time.
8

Analytical Methods
Moisture. The percentage of moisture of fruits was determined in duplicate ortriplicate. From 5 to 50 grams of comminuted sample were dried for 48 hoursin an electric oven at 70°C or lower. The samples were held in vacuo in a desiccator over silica gel for another 24 hours. Loss in weight was reported as moisture.
Protein. The Winkler boric acid modification of the Kjeldahl method wasused (11). The organic nitrogen is converted to NH3, which combines withH 2S04 to form (NH412S04; NH3 is liberated by NaOH and combines withboric acid to form ammonium borate. This is measured by standard HCl. Thefactor 6.25 was applied to convert the nitrogen content to protein for all fruits
Fat. Ether extract was determined by the 1955 Association of Official Agricultural Chemists method for plants (1). The dry material was extracted withanhydrous ethyl ether for 4 hours in the Goldfisch fat extraction apparatus andthe extract dried at 100°C to constant weight. Fat includes, in addition to thetrue fats, various fatty acids, sterols, chlorophyll, and other substances of similarsolubility.
Crt/de Fiber. Crude fiber was determined by the 1955 Association of OfficialAgricultural Chemists method for plants (1). The ether extract residue wastreated with boiling acid and with alkali for 30 minutes each. The residue wasdried to constant weight at 110°C, weighed, ignited, and the loss in weightreported as crude fiber. It is made up largely of cellulose, hemicellulose, andlignin.
Total Ash. This refers to the total mineral matter residue after ignltion of thesample. Samples of fresh material, weighing from 100 to 200 grams, were ashedin tared silica dishes in an electric mume at about 525°C until a white or lightgray ash was obtained, then cooled in a desiccator and weighed to determinetotal ash. When iton was to be determined, a reagent blank and recovery samplewere added. Each ash was dissolved in HC! (1+1) and filtered. The residue andashless filter paper were reheated in the mume until a white ash was obtained.This was treated like the first ash, added to the filtrate, and made to volume.Aliquots were used for calcium and iron determinations.
Calcium. A modification of the McCrudden method for calcium, by Ingolsand Murray (7), as recommended by the Human Nutrition Research Branch,Agricultural Research Service, U.S. Department of Agriculture (28), was used.
Phosphorus. A modification of the Fiske and Subbarow method (5), recommended by the Human Nutrition Research Branch, Agricultural Research Service, U.S. Department of Agriculture (28), was used.
Iron. Utilizing the ash solutions and blanks prepared as outlined under totalash, iron was estirr.ated by the Saywell and Cunningham o-phenanthrolinecolorimetric method (26).
9

Carotene (provitamin A). The chromatogtaphic method described by theAssociation of Vitamin Chemists (2) was used with slight modifications. Thisprocedure depends upon the separation of the biologically active carotenoidpigments from the nonactive pigments in an extract by an adsorbent withvarying affinities for the different pigments. The extracting solvents were 1%alcoholic potassium hydroxide, acetone, and petroleum ether (B.P. 60°-70°C)in equal proportions; the adsorbent, a 1:1 mixture of magnesium oxide andHyflo Super-Cel; and the eluent, 3 to 10% acetone in petroleum ether. The colorintensity was measured in an Evelyn colorimeter, using a 440 m}.! filter, and thecarotene concentration determined by reference to a calibration curve (90% betaand 10% alpha-carotene mixture dissolved in petroleum ether). Three to 20 gramsof sample were assayed in triplicate with a fourth aliquot for a recovery test.
Thiamine. The thiochrome procedure outlined by the Association of VitaminChemists (2) was used. This procedure depends upon the oxidation of thiamineto thiochrome, which fluoresces in ultraviolet light. Under standard conditionsand in the absence of other fluorescing substances, the fluorescence is proportional to the thiochrome present and hence to the thiamine in the originalsolution. Triplicate aliquots and a recovery test were done on each sample.
Riboflavin. The fluorometric method outlined by the Association of VitaminChemists (2) was used. Riboflavin fluoresces and the intensity of fluorescenceis proportional to the concentration in dilute solutions. Riboflavin is measuredin terms of the difference between the fluorescence before and after chemicalreduction. Triplicate aliquots and a recovery test were done on each sample.
Niacin. The microbiological assay method, as given by the Association ofVitamin Chemists (2), was used to determine niacin. The method is based onthe observation that certain microorganisms require specific vitamins for growth.Using a medium complete in all requirements except niacin, the growthresponses of Lactobacillm arabinosus are compared quantitatively in standardsolutions and in sample extracts. The acid produced by the organism is measuredto determine the extent of growth and thereby the amount of vitamin in thesample extracts. Duplicate aliquots and a recovery test were done on each sample.
Ascorbic Acid. Reduced ascorbic acid was determined by the dye (2, 6-dichlorophenolindophenol) visual titration method or photoelectric colorimeter methodas given by the Association of Vitamin Chemists (2). The method is based uponthe reduction of the dye by an acid solution of ascorbic acid. In the absence ofinterfering substances, the capacity of a sample extract to reduce a standardsolution of the dye is directly proportional to the ascorbic acid content. Duplicate aliquots were done on each sample.
Conversion Factors and Notes on Nutrients
Protein, Carbohydrate, and Food Energy. Protein values were calculated fromthe total nitrogen content by applying the conversion factor of 6.25, as theproteins in fruits contain 16 percent nitrogen (13).
10

Carbohydrate, representing total carbohydrate by difference, was calculatedby subtracting the sum of the percentages of water, protein, fat, and ash from100 percent. It does not represent carbohydrate as defined chemically. The termincludes sugars and starches, which the body uses almost completely; fiber andpentosans, which are used less completely; and organic acids, which are notcarbohydrates in the chemical sense.
Food energy, expressed in terms of the large or kilogram calorie, wascalculated using the factors 3.36, 8.37, and 3.60 for protein, fat, and totalcarbohydrate, respectively, as recommended by the U.S. Department of Agriculture (13). For lime juice, the factor 2.70 for total carbohydrate was used.For coconut and macadamia nut, the factors 3.47 and 4.07 were used forprotein and total carbohydrate, respectively.
Vitamin A Value. The values for vitamin A are expressed in micrograms orInternational Units. Since plants contain no preformed vitamin A, the valuesare derived from the carotenoid pigments. One microgram of the yellowpigments, presumably biologically active carotenoids, was considered to beequivalent to 1 International Unit of vitamin A. It was the opinion of one ofthe authors (CDM) that this factor gave figures more nearly representative ofthe true nutritional values than to consider 0.6 microgram of pigments asequivalent to 1 International Unit, for the following reasons: (1) the methodused does not differentiate between beta-carotene, its isomers, cryptoxanthin,and some other pigments which have a lower biological value than beta-carotene, or have no vitamin A value (2, 3); (2) the utilization (absorption and conversion) of the pigments by the animal body is influenced by a number ofother factors in the diet (23); (3) the utilization of carotene in foods, in a series ofhuman digestive experiments, was found to be so poor that a standard for carotene three times that for vitamin A was recommended (6); and (4) the AdvisoryCommittee for the Food Composition Table for Use in Latin America (9) recommended that 0.9 microgram of carotene, when the isomers of carotene areunspecified, be used for the conversion of 1 International Unit of vitamin A.
Calcium, Phosphorus, and Iron. The mineral contents in the tables representthe total amounts of minerals as determined analytically; no attempt was madeto determine their availability.
DESCRIPTION AND NUTRITIVE VALUE
A brief description of each fruit is given. Most are familiar fruits, but a feware somewhat uncommon. For more detailed descriptions, publications onpomology should be consulted.
The nutritive value of the fruit samples is discussed. Fruits are no longerclassed as luxuries, for it has been recognized, with the discovery of vitamins,that man is dependent upon fruits for some vitamins, especially ascorbic acid.They are also important sources of organic acids, basic ash, and roughage.
11

Some fruits furnish only small amounts of nutrients, but the variety of flavor,texture, and color combines to make them a refreshing addition to any diet.
Most fruits analyzed have a relatively high moisture content. In this study,some contain over 90% water (more than milk or apple juice), e.g., acerola,carambola, grapefruit, mountain apple, roselle, strawberry, tangerine, and watermelon. On the other hand, avocado, banana, breadfruit, cherimoya, and greensapote have less water than most fruits, about 70%, and ripe tamarind, about 35%.
Most fruits contribute less than 2% protein. Only tamarind contains 3%,but this fruit is consumed infrequently and in small quantities in Hawaii.
The fat content is less than 1% with the notable exception of the avocados,which show a range of 10 to 25%. The highest value is found in the Beardslee,a Guatemalan-West Indian hybrid avocado.
The carbohydrate values range from 6% in items such as avocado andwatermelon to 30 or 35% in banana and breadfruit. The carbohydrate is presentmostly as starches and utilizable sugars. Cellulose and other forms of carbohydrate which are not well utilized are represented by the crude fiber value.
Calories are derived mainly from carbohydrates, as most fruits are low inprotein and fat. Compared with equal weights of other foods, many fruits(e.g., acerola, the citrus fruits, mountain apple, strawberry, and watermelon)contribute fewer calories-an important consideration in reducing diets.
Fruits on the whole are poor sources of calcium, phosphorus, and iron.Nutritionists recommend that the daily diet of an adult male aged 25 shouldsupply 0.8 gram of calcium and 10 milligrams of iron (21). The body requiresat least as much phosphorus as calcium; but, generally, if dietary calcium andprotein are adequate, the phosphorus requirement also will be covered (21).For comparison of the fruits in this bulletin, the following arbitrary scale hasbeen used to rate the mineral content (16).
RATING
MINERAL
Good Fair Poor
Calciummilligrams per 100 grams ofedible fruit
more than less than30 15 to 30 15
Phosphorus
Iron
more than40
more than1.0
12
25 to 40
0.5 to 1.0
less than25
less than0.5

Cactus fruit, green sapote, whole red Cattley guava, macadamia nut, mulberry, papaya, and tamarind are good sources of calcium, containing over30 milligrams per 100 grams. The Beardslee and Nabal avocados, breadfruit,coconut cream, macadamia nut, poha, sweetsop, and tamarind are good sourcesof phosphorus. Iron is high in carissa, coconut cream, whole common guava,macadamia nut, mulberry, and strawberry. Although tamarind contains largequantities of calcium and phosphorus, this fruit is not widely used-and thenin such small quantities-that its total contribution to the diet is negligible ascompared to such fruits as papaya which may be eaten every day.
The National Research Council recommends that the daily diet of a 25-yearold man should supply 5,000 International Units of vitamin A, 1.2 milligramsof thiamine, 1.7 milligrams of riboflavin, 19 milligrams of niacin equivalents,and 70 milligrams of ascorbic acid. For the needs of different age groups ofmen, women, and children, consult the NRC recommendations (21). Forcomparison of fruits in this bulletin, the following arbitrary scale has beenused to rate the vitamin content (16).
RATINGVITAMIN
Excellent Good Fair Poor
milligrams per 100 grams ofedible fruitVitamin A value* more than less than
1.0 0.5 to 1.0 0.1 to 0.5 0.1
Thiamine more than less than0.2 0.1 to 0.2 0.05 to 0.1 0.05
Riboflavin more than less than0.2 0.1 to 0.2 0.05 to 0.1 0.05
Niacin more than less than2.0 1.0 to 2.0 0.5 to 1.0 0.5
Ascorbic acid more than less than40 25 to 40 10 to 25 10
*One milligram = 1000 micrograms
Fruits have no vitamin A, but those having yellow, orange, or red colorcontain carotenoid pigments. These can be changed by the body to vitamin Aand are referred to as provitamin A. This term is used in this bulletin to indicatethe vitamin A value. Foods with no color, such as lychee, are assumed to havelittle or no vitamin A value. Excellent sources of provitamin A are the Beardsleeavocado, loquat, Haden and Pirie mangos, papaya, yellow passion fruit, poha,
13

and Surinam cherry. Good sources of provitamin A are Nabal avocado, Popoulubanana, green sapote, orange, purple passion fruit, persimmon, and tangerine.
On the whole, fruits are poor sources of the B vitamins when comparedwith other food groups. Macadamia nut is an excellent source of thiamine;good sources are breadfruit, cherimoya, orange, poha, sweetsop, tamarind, andtangerine. For riboflavin, excellent sources are the Beardslee avocado andtamarind. Eight others-Nabal avocado, Maiamaoli banana, cherimoya, macadamia nut, mulberry, purple passion fruit, yellow passion fruit, and soursopare good sources. Only the yellow passion fruit is an excellent source of niacin.Twelve others-Hulumanu avocado, breadfruit, cherimoya, green sapote,common guava, Kwai Mi lychee, macadamia nut, purple passion fruit, poha,soursop, tamarind, and wi-apple-are good dietary sources of niacin.
Fruits make their greatest contribution as a source of ascorbic acid. Acerolais probably the most potent source, containing 50 times as much as an equalweight of a good orange. Also, some guavas contain 7 or 8 times as muchvitamin C as the orange. Some other fruits that are superior sources of ascorbicacid are carissa, grapefruit, ketambilla, lychee, orange, papaya, poha, strawberry, and wi-apple. In addition, cactus fruit, carambola, green sapote, redCattley guava, Java plum, lime, mulberry, purple passion fruit, pummelo,sweetsop, and tangerine are good dietary sources of this vitamin.
Acerola (Malpighia glabra)
Description. This small, cherrylike fruit, which is native to tropical andsubtropical America, is often referred to as the Barbados, the West Indian, orthe Puerto Rican cherry. The fruit is borne on short stems on a shrublike treewhich will grow to approximately 12 feet in height. The fruit varies in sizefrom about VI to 1 inch in diameter, and weighs from 2 to 10 grams. The thinskin may be light reddish-yellow or deep red when ripe. The flesh is usuallyof a reddish-yellow hue, although some types with dark-red skins also havedark-red flesh. The three-winged seeds are large in comparison to the flesh, butbecause they are light and pithy they constitute only about 20% of the weight.The fruit is sweet to acid in taste (depending upon the genetic type), withno distinct or pronounced flavor. Some think the flavor of the thoroughly ripeacerola and the fresh, raw juice made from it resembles that of tart strawberries. Although commonly called a cherry, the odor and flavor of cookedacerola are more like those of tart apples or crab apples than cherries. Malicacid, the only organic acid (other than ascorbic acid) which acerola contains,is also the principal acid in apples (25).
Nutritive Value. Acerola is an exceptionally rich source of ascorbic acid. Itcontains approximately 30 to 50 times as much ascorbic acid as orange juice onan equal weight basis, so that one or two cherries, depending on the size andon the concentration of ascorbic acid, will furnish sufficient vitamin C to supplythe recommended daily allowance.
14

Avocado (Persea americana and P. drymifolia)
Description. There are three races of avocados represented in Hawaii, withthe following characteristics:
(1) West Indian race. Summer and fall maturing; fruit large; skin smoothand leathery in texture, and not more than ?16 inch in thickness.
(2) Guatemalan race. Winter and spring maturing; fruit large; skin roughand woody in texture, and ?16 to ~ inch in thickness.
(3) Mexican race. Leaves and immature fruit anise-scented; fruit small;skin smooth and thin.
Many of the avocados found in Hawaii are of hybrid origin and may not bereadily identifiable with the three races. The fruit is pear-shaped, round orobovoid, and sometimes weighs more than 3 pounds. The green skin, whichchanges in some varieties to red, purple, or purplish-black as the fruit matures,varies from smooth to warty in texture. The yellow or light-green flesh whichsurrounds the single large seed is smooth in texture. The best varieties have verylittle fiber in the flesh and a characteristic nutty flavor.
Nutritive Value. With the exception of the olive, no other fruit contains aslarge a percentage of fat as the avocado. The fat content varies from 9 to over25%, according to variety and race.
In experiments on human digestion, the digestibility of the oils in freshavocados was first found to be 93.7% (12), a value comparable to that for butter,but later experiments gave a value of 82.5% (4).
Avocados are a fair to good source of phosphorus, a good source of provitamin A, riboflavin, and niacin.
Banana (Musa spp.)
Description. The banana is now one of the best-known fruits throughout theworld. Of the common varieties, the cylindrical fruit varies in size from thesmall Chinese (Cavendish), 4 to 5 inches in length, to the large Bluefields(Gros Michel), 8 to 9 inches in length. The tough outer peel, though commonlyyellow, may also be greenish-yellow or reddish-brown when ripe. The edibleportion is generally creamy white in color, or creamy pink in some varieties.Dessert bananas may be eaten raw or cooked, but the plantains are morepalatable after being cooked.
Nutritive Value. Greater use should be made of bananas because they areeconomical, nutritious, and available everywhere in Hawaii. In the half-ripestage, one-half to one-third of the total carbohydrate may be in the form ofstarch and may cause digestive disturbances. When fully ripe, practically all thecarbohydrate is in the form of sugars, and the fruit is readily digested evenby infants.
Steaming whole cooking bananas for 20 minutes did not reduce the vitamincontent appreciably (18).
15
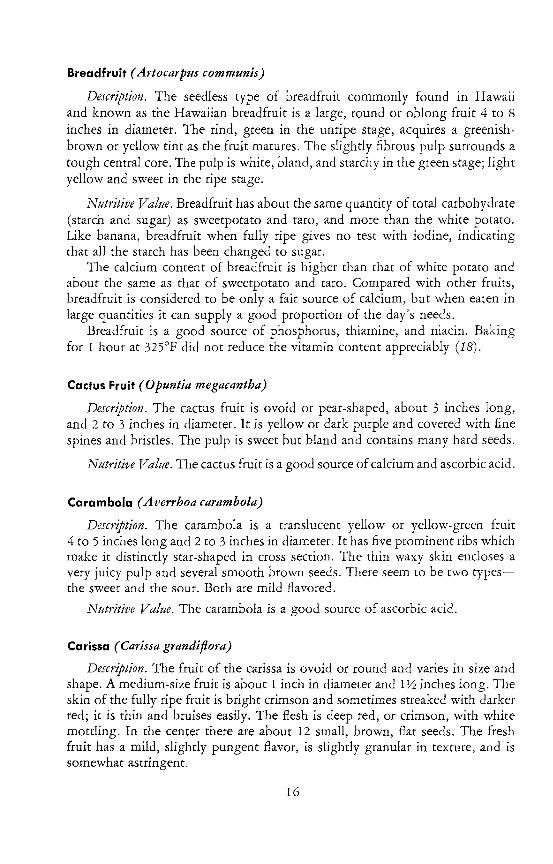
Breadfruit (Artocarpus communis)
DeJcription. The seedless type of breadfruit commonly found in Hawaiiand known as the Hawaiian breadfruit is a large, round or oblong fruit 4 to 8
inches in diameter. The rind, green in the unripe stage, acquires a greenishbrown or yellow tint as the fruit matures. The slightly fibrous pulp surrounds atough central core. The pulp is white, bland, and starchy in the green stage; lightyellow and sweet in the ripe stage.
Nutritive Value. Breadfruit has about the same quantity of total carbohydrate(starch and sugar) as sweetpotato and taro, and more than the white potato.Like banana, breadfruit when fully ripe gives no test with iodine, indicatingthat all the starch has been changed to sugar.
The calcium content of breadfruit is higher than that of white potato andabout the same as that of sweetpotato and taro. Compared with other fruits,breadfruit is considered to be only a fair source of calcium, but when eaten inlarge quantities it can supply a good proportion of the day's needs.
Breadfruit is a good source of phosphorus, thiamine, and niacin. Bakingfor 1 hour at 32SoP did not reduce the vitamin content appreciably (18).
Cactus Fruit (Opuntia megacantha)
DeJcription. The cactus fruit is ovoid or pear-shaped, about 3 inches long,and 2 to 3 inches in diameter. It is yellow or dark purple and covered with finespines and bristles. The pulp is sweet but bland and contains many hard seeds.
Nutritive Vallie. The cactus fruit is a good source of calcium and ascorbic acid.
Carambola (Averrhoa carambola)
DeJcription. The carambola is a translucent yellow or yellow-green fruit4 to 5 inches long and 2 to 3 inches in diameter. It has five prominent ribs whichmake it distinctly star-shaped in cross section. The thin waxy skin encloses avery juicy pulp and several smooth brown seeds. There seem to be two typesthe sweet and the sour. Both are mild flavored.
Nutritive Value. The carambola is a good source of ascorbic acid.
Carissa (Carissa grandiflora)
DeJcription. The fruit of the carissa is ovoid or round and varies in size andshape. A medium-size fruit is about 1 inch in diameter and 1Y2 inches long. Theskin of the fully ripe fruit is bright crimson and sometimes streaked with darkerred; it is thin and bruises easily. The flesh is deep red, or crimson, with whitemottling. In the center there are about 12 small, brown, flat seeds. The freshfruit has a mild, slightly pungent flavor, is slightly granular in texture, and issomewhat astringent.
16

When bruised, broken, or cut, the fruit and branches exude a white latexthat is harmless, except that it may be irritating if it comes in contact with the eye.
Nutritive Value. The carissa has relatively large quantities of sugar andsufficient acid and pectin to make a good jelly. It is an excellent source ofascorbic acid, containing somewhat more than the average orange, and a goodsource of iron.
Cherimoya (Annona cherimola)
Description. The cherimoya is a green, heart-shaped fruit, 3 to 7 inches long,and has a smooth custardlike consistency. It contains ftom a few to manydark-brown seeds. The pulp is white, well flavored, slightly acid, with acharacteristic pattern of rounded protuberances and indentations over thesurface of the skin.
Nutritive Value. The cherimoya is a good source of thiamine, riboflavin,and niacin.
Coconut (Cocos nucifera)
Description. The coconut is the large, one-seeded fruit of the coco palm.The endosperm within the nut is the edible portion. A fibrous husk enclosesthe brown, hard-shelled nut, which is usually 4 to 5 inches in diameter.
G. P. Wilder states: "After being fertilized by the adjacent staminate flowers,the hollow interior of the shell becomes filled with sweet water. The sphericalfruits gradually increase to from 4 to 8 inches in diameter. The endosperm, atfirst an opaque, jellylike substance, forms in the inner walls of the shell, andgradually absorbs the water; it attains a firm thickness of from 0.25 to 0.5 inch.This is known as the 'coconut meat' and forms an important article of diet forthe Polynesian people." (29).
In the early stages the meat is soft and jellylike. Later, the meat becomescrisp and firm. In this bulletin, the watery liquid within the coconut is called"water" and the juice obtained by squeezing the grated coconut meat is called"cream."
Nutritive Value. The chemical composition of the edible portion of thecoconut varies with the stage of development.
Immature nuts contain from 300 to 700 milliliters of water, and the averagepH is 4.7 (17). The meat begins to form when the nut is 6 months old; that is,6 months after the spathe has opened. As the meat develops, its water contentgtadually decreases, the fat and total ash increase, and the protein and sugarcontent show less marked changes (8). The mature nuts contain a relativelylarge amount (5.4%, fresh weight) of crude fiber (27).
Analyses of expressed coconut cream show it to be high in fat (25 and 35%)and low in protein (3 and 4%). It is a good source of phosphorus and iron. Ithas been pointed out that neither coconut water nor coconut cream is comparable to lOW'S milk in organic nutrients or calcium or phosphorus content (14).
17

Fig (Ficus carica)
Description. The leading variety of fig grown in Hawaii is known as theTurkish Brown or Brown Turkey, commonly called Turkey. It is pear-shaped,lY2 to 3 inches in diameter, and of mahogany-red color if exposed to the sun.
The thin, easily bruised skin encloses a soft, pinkish-white pulp and manytiny seeds. The fruit matures from a large number of small flowers whichdevelop within a protecting shell. This accounts for the small hollow in thecenter of the pulp, around which can be seen a layer of seeds and tiny driedflowers. The flavor is sweet and pleasing.
Nutritive Value. Brown Turkey figs are a fair to poor source of all theminerals and vitamins studied.
Grape, Isabella (Vitis labrusca X V. vinifera)
Description. The Isabella grape is an American type slipskin grape. Thebunches are from 4 to 6 inches long and are very firmly packed. When ripe, theindividual grapes are a deep purple-black with a light-blue bloom, and areabout Y2 inch in diameter.
Nutritive Value. Grapes have a distinctive flavor and refreshing qualities.The acids of Concord grapes (a related variety) consist of approximately 60%malic acid and 40% tartaric acid, a large portion of which exists in the form ofalkali salts (22). Isabella grapes are a poor to fair source of the minerals andvitamins studied.
Grapefruit (Citrus paradisi)
Description. The grapefruit is globose, yellowish-green in color, and 3 to
4 inches in diameter. The pulp is pale yellow, greenish-yellow, or pink, and iscomposed of large distinct sacs; it varies in degree of juiciness and acidityaccording to variety and environment. The term pomelo is sometimes used instead of grapefruir, but the latter term has come to be the one most favored.(See also Pummelo, p. 25.)
Nutritive Value. The grapefruit is an excellent source of ascorbic acid.
Green Sapote (Calocarpum viride)
Description. The green sapote fruit resembles some persimmons, ovoid andpointed at the blossom end. It is 3 to 4 inches in length and tawny brown incolor when mature. The fruit is astringent when green but sweet when thoroughlyripe.
Nutritive Value. The green sapote is a good source of calcium, provitamin A,niacin, and ascorbic acid.
Guava, Cattley (Psidium cattleianum)
Dercripfion. In addition to the common guava, there are two kinds of strawberry~guavas in Hawaii-the dark-red strawberry guava (Psidittm cattleianum)
18

and the yellow (Psidium cattleianum var. lucidum). The fruit is round, and }.j to1Yz inches in diameter. The center of the fruit is filled with a very juicy pulp andnumerous small, hard seeds. It has a sweet and somewhat acid flavor. Theyellow Cattley guava resembles the red but is a larger fruit.
Nutritive Value. The Cattley guava is a good source of ascorbic acid andcalcium.
Guava, Common (Psidium guajava)
Description. The guava is a medium-size, round or lemon-shaped fruit, lYz to3Yz inches in diameter, with a thick, coarse, edible rind surrounding a mass ofseeds imbedded in a firm, soft pulp. The flesh color varies from white to yellowto red. Though the fruit may be either sweet or sour, it always has a distinctcharacteristic flavor and aroma.
Nutritive Value. The guava is a good source of niacin. The fruits varygreatly in ascorbic acid content, some having 2 to 5 times as much as others,but all may be considered excellent sources of this vitamin. The thick rindportion contains more ascorbic acid than the pulp and seeds, because there isa greater proportion of the rind than pulp in each guava, and because the rindis richer in ascorbic acid per unit of weight (19).
Java Plum (Eugenia cuminii)
Description. The Java plum, or jambolan, is a small, dark-maroon or purplefruit about the size and shape of an olive. There are at least two types in Hawaii,one with small, somewhat irregular-shaped fruit and one with slightly larger,symmetrical, olive-shaped fruit. The smaller variety has purple flesh, and thelarger type has whitish flesh. The white-fleshed Java plum is sweeter and lessastringent than the purple-fleshed variety. The astringent quality is believed tobe due to the presence of tannins (16).
Nutritive Value. The Java plum is a good source of ascorbic acid.
Ketambilla (Dovyalis hebecarpa)
Description. In size and shape the ketambilla resembles a small plum orcherry. It is globose and varies from Yz to slightly more than 1 inch in diameter.The ketambilla has a thin, tough, deep-purple skin covered with short, graygreen hairs which give it a velvety or frosted appearance. There are 9 to 12 smallseeds imbedded in the fibrous, deep-maroon or purple flesh. It has a strong acidflavor and stains a deep red or purple. The fruits hang by short stems on theunderside of the thorny branches ofa shrub that grows to a height of 10 to 15 feet.
Nutritive Value. The ketambilla is an excellent source of ascorbic acid.
19

Lime (Citrus aurantiifolia)
Description. The acid lime is a small citrus fruit of characteristic flavor.Several varieties are grown successfully in Hawaii. The common Chinese lime,also known as Mexican, or Key, lime is a small, globose or ovoid fruit about1Y2 to 2Y4 inches in diameter. Its thin skin varies in color from light yellow togreen. The flesh, yellow-green and very juicy, contains large quantities ofcitric acid.
Nutritive Value. The small quantities of limes used in the average diet maketheir nutritive value of minor importance. They yield an alkaline ash in thebody because their high acidity is due to citric acid and its basic salts. They aregood antiscorbutics, though the different varieties vary somewhat in theircontent of ascorbic acid.
Loquat (Eriobotrya japonica)
Description. The yellow, downy, loquat fruit is globose or ovoid, from lY2 to2Y2 inches long. The white or yellow flesh enclosing a few large seeds has apleasant acid flavor. Ripe clusters are sold in the markets.
Nutritive Value. The loquat is an excellent source of provitamin A. Althoughits acidity might suggest to some that it should be a good source of ascorbicacid, two samples showed only traces of ascorbic acid, which is confirmed bypublished values (9).
Lychee (Litchi chinensis)
Description. The lychee is a small, ovoid fruit about lY2 inches in diameter.The outer shell-like covering is red and the flesh surrounding the single brownseed is translucent white. The size of the seed varies considerably. The sweetand slightly acid flavor of the fresh lychee reminds many people of the Muscatgrape. The dried fruits, known as "lychee nuts," are very different from thefresh, bearing somewhat the same relationship to the fresh fruits as raisins tograpes.
Nutritive Value. Of the two varieties analyzed, the Brewster and Kwai Mi,the latter is considered superior in flavor and quality, although it is a smallerfruit. Both are excellent sources of ascorbic acid. Kwai Mi is a good source ofmacm.
Macadamia Nut (Macadamia integrifolia)
Description. The macadamia nut is enclosed in a smooth, extremely hardshell. Although the raw, white kernel has a delicious flavor, resembling hazelnutsor almonds, cooking in hot oil enhances the flavor. Consequently, practicallyall commercial macadamia nuts in Hawaii are marketed cooked, with orwithout salt.
Nutritive Value. Like all nuts, macadamia nuts are a concentrated food, lowin moisture and high in fat, protein, and carbohydrate. They are a good source
20

of calcium, phosphorus, and iron, and of the B vitamins, thiamine, riboflavin,and niacin.
Mango (Mangifera indica)
Description. Many recognized varieties of mangos as well as unnamed hybridsare grown in Hawaii. In general, the mango can be described as a medium-sizefruit from 2 to 4 inches in diameter and from 3 to 7 inches in length. The skin,which is smooth and thick, is strong enough in some varieties to be pulled fromthe flesh when the fruit is ripe. In most varieties, as the fruit matures, the greenskin changes to more brilliant colors-purplish-red shading to green, deepcrimson, or yellow with red spots.
The flesh varies in color from pale lemon to deep apricot. In the mostprized varieties, it is juicy, smooth, and free from fiber. The flavor, which variesgreatly, may be insipid or sweet, or reminiscent of turpentine. In the bettervarieties, the flavor and texture are excellent. Though sometimes comparedto good peaches, mangos have a characteristic, delicious flavor of their own.
Nutritive Value. Mangos have sufficient yellow pigment to make them goodto excellent sources of provitamin A. Different varieties of mangos vary greatlyin ascorbic acid content. For example, two favorites, the Pirie and Haden, areonly fair sources, whereas others, including some of the common types, areexcellent sources of ascorbic acid. All varieties tested contained more ascorbicacid in the green stage than in the half-ripe stage and more in the half-ripe stagethan in the ripe stage (table 7). For detailed information regarding the ascorbicacid content of various varieties of mangos grown in Hawaii, see table 5.
Mountain Apple (Eugenia malaccensis)
Description. The mountain apple is an ovoid fruit from 2 to 3 inches long. Ithas a very thin, crimson skin shading to pink or white. The crisp, white fleshis juicy and of pleasant though not distinctive flavor. Each fruit contains oneor two large, brown seeds. The fruit is easily bruised and stains the handsdeep purple.
Nutritive Value. The mountain apple is a poor to fair source of the mineralsand vitamins studied.
Mulberry (Morus nigra)
Description. The black mulberry, a native of Persia and the Caucasus, is asmall fruit that varies greatly in size but rarely exceeds 1y,j inches in length andYz inch in diameter. Perhaps due to lack of cross pollination, it often appears inHawaii in a seedless form, which may become a permanent variety. The seedlesstype is an excellent, well-flavored, subacid fruit that should be more widelycultivated. Mulberry trees will grow to a height of 20 to 30 feet in Hawaii, but
21

for fruit production they may be trimmed to the size of a small tree or even ashrub and used as a hedge. The best guality fruit is produced when the tree iswell trimmed and well watered.
Nutritive Value. The mulberry is a good source of calcium, iron, riboflavin,and ascorbic acid.
Ohelo Berry (Vaccinium reticulatum)
Description. The ohelo belongs to the cranberry family. Its fruit is globose,red or yellow in color, mayor may not be covered with bloom, and contains aconsiderable number of small, flattened seeds. The size varies from ~ to Y2 inchin diameter. It is edible either raw or cooked.
Nutritive Value. Ohelo berries are a poor to fair source of the minerals andvitamins studied.
Orange (Citrus sinensis)
Description. Several varieties of oranges have been introduced into Hawaii.At the present time, the Washington Navel is the principal variety grown commercially. This orange is medium to large in size, with the characteristic navelon the blossom end. In Hawaii's climate the skin does not develop the brightorange color seen in cooler climates. The flesh is juicy and varies from acid tosweet according to maturity.
Nutritive Value. The food composition of the Hawaii-grown oranges issimilar to that of oranges grown on the Mainland. They are a good source ofprovitamin A and thiamine, and an excellent source of ascorbic acid.
Papaya (Carica papaya)
Description. The papaya is a melonlike fruit which varies greatly in size andshape. The Solo variety is a small fruit from 3 to 5 inches in diameter. The skinis smooth and thin, shading from green to deep orange. The flesh varies inthickness from 1 to 2 inches and from pale yellow to deep salmon-pink in color.Numerous round, black, wrinkled seeds, each enclosed in a gelatinous membrane, cling to the inner wall. The flavor and odor of the fruit are distinctive.The white latex that exudes from the leaves, stems, and unripe fruit is veryirritating if it comes in contact with the eye.
Nutritive Value. Green, unripe papaya contains papain, a protein-splittingenzyme, but the ripe fruit is believed to contain little or none of this enzyme.The papain is probably not of any nutritional significance in aiding the digestionof protein, but it may be the reason that a few people experience some digestivedistress after eating papaya.
The Solo variety is a good source of calcium and an excellent source ofprovitamin A and ascorbic acid.
Weekly tests were made for a year on the ascorbic acid content of Solopapayas from two localities on Oahu, Poamoho and Kailua. The ascorbic acid
22

content ranged from 60 to 122 milligrams per 100 grams, mean 84 milligrams(19). In papaya, ascorbic acid increases as the fruit ripens. When the skin isdark green and the flesh pale yellow, the fruit contains only 60 to 70% as muchascorbic acid as when ripe (table 7).
Passion Fruit (Passifiora edulis)
Description. The passion fruit is a medium-size oval fruit from 2 to 3 incheslong. There are three types common in Hawaii, the purple (Passiflora edulis) , theyellow (Passiflora edtdis forma flavicarpa), and the orange (Passiflora /igu/aris),commonly called sweet granadilla or water lemon. Several other species areseen only occasionally. In these three types, the brittle shell encloses a juicy,yellow pulp and many small seeds. Although the shell dries up and becomeswrinkled after the fruit has matured, the pulp remains in good condition forseveral weeks.
Nutritive Value. The juice of the yellow passion fruit is an excellent sourceof provitamin A and niacin and a good source of riboflavin.
The juice of the purple passion fruit is a good source of provitamin A,riboflavin, niacin, and ascorbic acid.
The passion fruit juice keeps well because of its natural high acidity. Theacidity of the purple and yellow juices was found to be 2.3 and 3.9%, respectively, calculated as citric acid (17).
Persimmon (Diospyros kaki)
Description. The persimmon fruits are ovoid to flattened globose, orange-redor yellow in color, thin-skinned, and 2 to 3 inches in diameter. The fruits ofmost varieties are astringent when green, sweet when thoroughly ripe, andcontain one to ten large, flattened seeds. Some are seedless.
Nutritive Value. The persimmon is a good source of provitamin A.
Pineapple (Ananas comosus)
Description. The pineapple is a collection of small fruits, so it is called amultiple fruit. In the flower stage, the corollas are separate but the ovaries arefused, giving the appearance of a cluster of flowers on a single stalk.
The mature pineapple, a large fruit shaped like a pine cone, is about 6 to
10 inches in height and weighs 5 to 8 pounds. It grows on a stalk, or peduncle,that is a continuation of the plant stem of the low, cactuslike pineapple plant.The tough and horny rind is composed of small hexagonal sections, fittedtogether like pieces of tile. Each of these sections marks a botanically individualfruit.
The skin of a ripe pineapple may be deep yellow, chocolate-green, or mottledgreen and brown. The flesh is very juicy and has a somewhat fibrous texture.
23

It varies in color from pale to deep yellow. The edible portion surrounds atough central core, which was originally the flower stalk.
Nutritive Value. The pineapple has long been valued for its distinctiveflavor and refreshing qualities. Fresh, ripe pineapple is a good source of sugar.The Smooth Cayenne variety is a poor to fair source of the minerals and vitaminsstudied. The Pineapple Research Institute of Hawaii is developing new varietiesthat contain larger quantities of ascorbic acid than the Smooth Cayenne.
Of the nonvolatile acids in pineapple juice, about 87% is citric and about13% is I-malic (22).
Some people find that eating large quantities of fresh pineapple causes asoreness of the mouth and esophagus. It has been suggested that this irritationmay result from the combined action of the acid, the protein-splitting enzyme(bromelin), and the calcium oxalate crystals.
Pineapple does not increase in sweetness after it is harvested because thereis no starch stored in the fruit which will change to sugar. The sugars are formedin the leaves of the pineapple plant and transferred to the fruit. Pineapple isusually sweeter in the summer months, when the days are longer and the sunshine more abundant.
Plum, Methley (Prunus cerasifera X P. salicina)
Description. The only variety of plum grown extensively at higher elevationsin Hawaii is the Methley. The fruits vary in shape; some are globose, and otherstend to be slightly ovoid with a distinct point at the blossom end. The size alsovaries, but good plums are 1liz to 2 inches in diameter.
The dark-red skin has a light bloom and the flesh, which is a rich red color,adheres rather tightly to the seed. When picked prematurely, the plums may bevery sour, but when fully ripe the flesh is sweet, though tart, and of good flavor.The skin, like that of many other plums, is bitter.
Nutritive Value. The Methley plum is a poor source of the minerals andvitamins studied.
Poha (Physalis peruviana)
Description. The poha is a small, yellow-green or orange fruit resemblinga cherry in size and shape. It is enclosed in a thin, cream-colored, paperlikehusk. The skin of the fruit is thin and waxy and surrounds a juicy pulp whichcontains many small seeds. The poha, also called Cape gooseberry or husktomato, is related to the ground cherry.
Nutritive Value. Pohas are a good source of phosphorus. They are anexcellent source of provitamin A and ascorbic acid, and a good source ofthiamine and niacin.
24

Pummelo or Shaddock (Citrus grandis)
Description. The pummelo fruit is globose to pear-shaped, 5 to 7 inches indiameter, with thick, smooth, pale-yellow skin. The pulp is often dry, subacid,and yellow or slightly pink in color. This fruit should not be confused withpomelo, for which grapefruit is the preferred term.
Nutritive Value. The pummelo is an excellent source of ascorbic acid.
Roselle (Hibiscus sabdariffa)
Description. The roselle is an annual plam that commonly grows to a heightof 5 to 8 feet in Hawaii. The fleshy, bright-red calyx is the portion of the plantthat is used as a fruit.
Nutritive Value. The roselle is very acid to taste and has little or no sugar.It is a poor to fair source of the vitamins studied.
Soursop (Annona muricata)
Description. The soursop is a large, irregularly heart- or kidney-shaped fruit.A single fruit may weigh 5 pounds or more and measure 10 inches or more inlength. The thick skin, or rind, is a deep green and covered with numerous,soft, curved spines. The flesh resembles cotton soaked in a sweet, aromaticliquid. The pulp contains many shiny, brown seeds.
Nutritive Value. The juicy pulp of soursop is a good source of riboflavinand niacin.
Strawberry (Fragaria spp.)
Description. The cultivated strawberry is a juicy, red fruit which grows on alow, herbaceous plant. Structurally, it is an enlarged fleshy receptacle fromYz to 1)4 inches in diameter, on the outside of which are imbedded many smallseeds. The flavor combines acidity and sweetness in proportions pleasing tomost people. Some varieties are more strongly flavored than others.
Nutritive Value. Strawberries are a good source of iron. The value is higherthan that reported in the literature. Local strawberries of an unknown varietyare an excellent source of ascorbic acid.
Surinam Cherry (Eugenia uniflora)
Description. The Surinam cherry is a small bright-red fruit about 1 inch indiameter, oblate in form, and conspicuously eight-ribbed. When ripe, it variesin color from a glistening light red to a very dark red. The flesh surrounding thesingle, large seed is soft and juicy. The fruit from most plants is distinctly acidand slightly bitter, but some plants produce subacid, sweet fruit.
25

Nutritive Value. The acidity of Surinam cherries is great compared with otherfruits in this series; it is exceeded only by the tamarind and the yellow passionfruit. Two samples of expressed juice had pH values of 2.7 and 3.0 (17).
Surinam cherries are an excellent source of provitamin A.
Sweetsop (Annona squamosa)
Description. The sweetsop fruit is ovoid and covered with large knobs whichseparate into sections when ripe. The pulp is creamy white, granular, and sweetwith a pleasant flavor.
Nutritive Value. The sweetsop is a good source of phosphorus. It is a goodsource of thiamine and ascorbic acid.
Tamarind (Tamarindus indica)
Description. The fruit of the tamarind tree consists of a brittle brown pod,varying from 2 to 6 inches in length and from Yz to 1 inch in width. The podencloses a very sticky, acid pulp which surrounds from 1 to 12 shiny, brownseeds. In maturity, the edible pulp shrinks slightly from the pod.
Nutritive Value. Analyses from the Department of Foods and Nutritionindicate that tamarind pulp, as compared with all other fruits, has an unusuallyhigh acid and high sugar content. The acid is reported to be largely tartaric (24).The acid of the sample analyzed in this department was calculated as 14%tartaric, or as 12% citric acid. One investigator (24) reports an invert sugarcontent of 41.2% for tamarind pulp, and analyses from this department show acarbohydrate by difference of 59.8%. The calcium and the phosphorus contentare also unusually high; the value of 0.113% for calcium is one of the highestreported in the literature for any fruit and is equivalent to that reported forsome vegetables. Whether the calcium is well utilized by humans is unknown.The ripe tamarind is a good source of thiamine and niacin, and an excellentsource of riboflavin. Though its high acidity might suggest to some that itshould be a good source of ascorbic acid, numerous tests of the fruit in boththe ripe and green stages have shown the variety grown in Hawaii to containtrace amounts only.
Tangerine (Citrus reticulata)
Description. The tangerine fruit is flattened-globose, 2 to 3 inches in diameter,with a loose skin which may shade from green to orange in color at maturity.The flesh is orange-colored, sweet, and usually contains numerous seeds.
Nutritive Value. The tangerine is a good source of provitamin A, thiamine,and ascorbic acid.
26

Watermelon ( Citrullus vulgaris)
Description. The watermelon, a large, smooth, green melon, is cultivated inmany sections of the world. The rind varies from Ys to 1Yz inches in thicknessand, from the outside in, shades from green to white to pink in color. The crisp,juicy, pink flesh contains many flat, slippery, black or white seeds. In goodmelons, the flavor is delicate, sweet, and refreshing. The watermelons grown inHawaii average from 10 to 30 pounds. The Chilean Black Seeded variety has athin rind. The Charleston Gray, a larger variety, has a thicker rind, from Yz to1 inch in thickness.
Nutritive Value. Watermelons, like strawberries and mountain apples, contain 90% or more of water and 7 to 8% of carbohydrate in the form of sugar.Watermelons are a poor to fair source of the minerals and vitamins studied.
Wi-apple (Spondias cytherea)
Description. The wi-apple is apple-shaped, 2 to 3 inches long, and paleyellow in color when ripe. The yellow fibrous pulp surrounds a large centralpit which contains seeds.
Nutritive Value. The wi-apple is a good source of niacin and an excellentsource of ascorbic acid.
RESULTS AND DISCUSSION
The tables present values for nutrients that are of importance in evaluatingdiets and planning meals. These nutrients are: protein; fat; and carbohydrate;two minerals-calcium and iron; and five vitamins-vitamin A, thiamine,riboflavin, niacin, and ascorbic acid. The percentage of water, the food energyexpressed in calories, and the phosphorus values are also shown.
Table 1 gives the food composition per 100-gram quantities of the edibleportion, the unit widely used in research.
In table 2, the quantities of nutrients are expressed in household units andcommon portions, a form useful to dietitians, doctors, nutritionists, and homemakers. The size measurement is for each fruit "as purchased," abbreviated AP,and the weight in grams for the "edible portion" as described. But in a fewcases inedible parts are included in the description (e.g., acerola, grape, androselle, 1 cup AP, and grapefruit, Yz medium AP), in which case the weightincludes the inedible parts. The nutritive value is for the edible portion only.
In table 3, the 100-calorie portion is the basis for the amount of food listed.This unit is commonly used by the Hawaii Cooperative Extension Serviceagents, as it is easily understood by a wide group of women.
Table 4 presents the portions considered refuse and percentage of refuse.In using tables of food composition such as these, it is important to remem
ber that variations exist in the amounts of nutrients present in different samples
27

of the same kind of food. The nutrients are affected by many factors, such asenvironment (i.e., soil and climate), cultural practices, genetics, and treatmentafter harvest (i.e., storage conditions or processing). Thus, the history of thesample is a useful adjunct to the table (see Appendix). However, in terms ofpractical nutrition, for the average individual who eats a good variety of foods,variations in composition are usually not significant. Transportation and refrigeration have enabled most people to include foods from different areas in theirdiet, and farming and marketing practices have been improved in order to
supply the best quality foods to the consumer.
Comparison with Fruits Grown Elsewhere
Because there are many inquiries as to whether the nutrltlve values ofHawaii-grown fruits are equivalent to those of fruits grown elsewhere, comparisons were made where possible with values published in the Food ComposhionTable for Use in Latin America (9) and Composition of Foods Used in Far EasternCountries (10). The compilers of these two publications used original analyses,which in their judgment were considered reliable in calculating the representativevalues.
To make a comparison, an arbitrary means of measuring differences wasdevised on the basis of the Recommended Dietary Allowances (21) abbreviated toRDA. For vitamins, differences greater than one-twentieth of the RDA wereconsidered to be nutritionally significant. One-twentieth of the RDA is, forvitamin A, 250 micrograms; thiamine, 0.06 milligram; riboflavin, 0.08 milligram;niacin, 1.0 milligram; and ascorbic acid, 4 milligrams.
For minerals in fruits, differences large enough to rate one source good andanother source poor (p. 12) were arbitrarily considered real differences. Thesewere: for both calcium and phosphorus, 15 milligrams; and for iron, 0.5 milligram.
On this basis, the following published values were greater than those foundin this study: the calcium content of cherimoya and tangerine; the iron incactus fruit, Java plum, and ketambilla; and the ascorbic acid in ketambilla andpineapple. Values of Hawaii-grown fruits which were greater than thosereported in the literature were as follows: vitamin A value of green sapote,loquat, orange, poha, Surinam cherry, and tangerine; the calcium in tamarind;and the iron in strawberry.
The data presented in this bulletin offer scientific evidence that the nutritivevalues of fruits grown in Hawaii are comparable to those of fruits grownelsewhere, based on the arbitrary criteria used.
Ascorbic Acid Variation
The variations existing in the nutrient content of different vanetles andsamples of the same kind of fruit and at different stages of maturity are wellillustrated by the ascorbic acid studies on mangos (tables 5,6, and 7, pp. 66-67).
28
One variety contained more than 20 times as much ascorbic acid as anothervariety (table 5). Not only was there variation between varieties, but individualfruits of the same variety showed wide variations (table 6). The data given intable 7 show that all varieties of mangos tested had more ascorbic acid in thegreen and half-ripe stages than in the ripe. On the other hand, in papayas andpohas, there was an increase in ascorbic acid as the fruit ripened.
SUMMARY AND CONCLUSIONS
About 41 species of fruits were studied, but often a number of horticulturalvarieties of the same species were analyzed separately so that the total numberof samples was about 60. The fruits, of tropical, semitropical, and Asian origin,as well as some common American fruits, were all grown in Hawaii. Nutrientsstudied were: protein; fat; carbohydrate; three minerals-calcium, phosphorus,and iron; and five vitamins-vitamin A, thiamine, riboflavin, niacin, and ascorbic acid. Percentage of water and the food energy expressed in calories are given.
The analytical methods used and the conversion factors are described.A brief description and the nutritive value of each fruit are given.
The major results are summarized in three tables-in lOa-gram quantitiesfor research workers; in household units and common portions for doctors,dietitians, and nutritionists; and in lOO-calorie portions for homemakers. Foreach nutrient studied, there are brief discussions regarding the best sourcesfor each nutrient. For each fruit studied, comparisons are made with valuesreported in standard tables.
It is reaffirmed that the nutritive values of Hawaii-grown fruits are ingeneral agreement with values reported for fruits grown elsewhere. A numberof Hawaii-grown fruits, namely, acerola, common guava, Brewster lychee, andpapaya, are superior to citrus fruits as sources of ascorbic acid.
29

TABLE 1. Composition of Hawaii fruits, per 100 grams of edible portion l
ITEMNo. Fruit
TotalMois- Food Carbo-ture Energy Protein Fat hydrate
per-cent calories grams grams grams
1 Acerola 91.10 31 0.68 0.19 7_58
2345
AvocadoBeardslee 67.49 233Hulumanu 82.79 103Kahaluu . 68.96 221NabaL. 69.91 209
0.27 25.18 5.801.47 9.26 5.691.25 23.49 5.561.03 21.80 6.33
Carissa . 81.88 68
Cherimoya 68.71 110
BananaDessert
Bluefields (Gros Michel) 71.05 102Brazilian ("Apple") 66.94 118Chinese (Cavendish) .. 79.22 72Lacatan 63.09 130Williams Hybrid 71.33 100
Plantain (Cooking)Largo 64.05 127Maiamaoli 67.17 115Popoulu 67.40 114
Breadfruit, flpe 61.77 134
Cactus FruiL. 84.61 53
0.36 0.87 16.45
1.54 0.13 28.95
0.30 33.500.04 30.870.04 30.36
0.18 36.77
0.09 13.76
0.90 7.52
0.07
0.79
0_85
1.280.931.16
1.46 0.22 26.470.87 0.36 31.071.75 0.18 18.031.19 0.18 34.551.08 0.13 26.56
37Carambola t 90.23
14
111213
18
6789
10
15
16
17
192021
CoconutCream, prepared with wateL 65.70 252Cream, prepared without wateL 53.90 346Water, from nuts with soft spoon-meat 93.78
3.21 24.88 5.184.28 34.68 5.99
0.47 26.96
0.21 12.96
0.19 16.90
22
23
24
25
Fig 85.73
Grape, Isabella_ ___ 82.25
Grapefruit.. 91.56
Green Sapote___________________ 69.76
51
64
31
107
0.69
0.45
0.55
1.73
0.30 7.32
'See foornotes, page 34.30

VitaminPhos- A Thia- Ribo· Ascorbic ITEM
Fiber Ash Calcium phorus Iron Value mine flavin Niacin Acid No.
milli- milli- milli· mlcro- milli· milli- milli- milli-grams grams grams grams grams grams grams grams grams grams
0.60 0.45 8.7 16.2 0.17 408 0.028 0.082 0.34 2330 1
1.18 1.25 4.7 79.6 0.62 2080 0.039 0.217 0.79 2.3 21.55 0.79 7.8 34.1 0.54 0.025 0.094 1.23 31.80 0.70 7.8 21.4 0.40 119 7.5 42.02 0.93 10.6 41.9 0.37 802 0.089 0.142 5.5 5
0.57 0.80 4.4 23.1 0.27 172* 0.030 0.044 0.70 6 60.68 0.76 7.0 30.4 0.28 158 0.041 0.076 0.59 14.6 70.25 0.82 2.0 13.4 0.35 82* 0.026 0.041 0.61 8 80.31 0.99 6.6 22.5 0.30 77 9.6 90.11 0.90 5.0 17.5 0.49 88 0.044 0.045 0.69 5.1 10
0.43 0.87 4.3 20.5 0.54 273 0.038 0.064 0.43 17.5 110.31 0.99 3.7 26.3 0.45 388 0.054 0.119 0.65 15.2 120.33 1.04 1.2 26.0 0.30 711 0.060 0.071 0.66 14.5 13
1.45 1.21 20.8 48.3 0.26 41* 0.116 0.063 1.54 20.5 14
1.94 0.75 42.8 9.2 0.26 trace 0.015 0.026 0.36 25.4 15
1.47 0.50 0.9 11.1 0.06 21 0.040 0.044 0.71 35 16
0.77 0.44 11.3 7.0 1.31 24 0.037 0.063 0.24 55.5 17
0.67 8.9 23.8 0.25 0 0.112 0.112 1.02 12.2 18
1.03 16.3 100.0 1.64 0 0.026 trace 0.76 2.8 191.15 10.7 122.1 2.28 0 0.030 trace 0.89 2.8 200.41 16.4 13.5 0.07 0 trace trace trace 21
0.89 0.41 28.3 21.2 0.16 65 0.036 0.039 0.34 2 22
0.20 0.21 7.5 15.9 0.22 104 0.075 0.049 0.19 2 23
0.31 0.27 21.8 16.6 0.09 0 0.052 0.025 0.25 53.9 24
0.11 1.08 34.8 20.3 0.42 730 trace 0.051 1.57 29.2 25
(Continued)31

TABLE 1. Composition of Hawaii fruits, per 100 grams of edible portion (Continued)!
ITEM
No. Fruit
TotalMois- Food Carbo-ture Energy Protein Fat hydrate
per-cent calories grams grams grams
262728
GuavaCattley
Red, seeds removed __ .... _._ .... __ ... . 84.31Red, whole 81.64Yellow, seeds removed 83.40
66 0.46 0.38 16.91
0.22 9.07
0.08 9.66
0.02 15.050.20 18.91
0.06 7.81
0.39 10.57
0.06 12.180.08 12.70
0.22 17.700.29 20.77
0.01 8.33
0.64 11.10
0.38
0.55
0.390.55
0.33
1.44
0.390.40
9.23 78.21 9.97
0.53
0.52
0.28 (0.1) 14.790.75 0.24 16.76
0.60 0.07 14.24
1.50 0.13 11.42
0.750.94
30
36
37
4648
46
5672
47
24
47
5565
54
6880
___________________________ 86.80_________________________ 86.25
_____ 84.12______________ 79.97
Mountain Apple_. 91.54
Mulberry________________________________________ __ 86.91
Ohelo Berry___________ __ 90.07
Orange ._. 89.38
Papaya, SoloHermaphrodite _Pistillate .._
Macadamia Nut, cooked 1.19 727
MangoHaden . _Pirie _
Lime, JuICe________ 90.86
LoquaL . 87.26
LycheeBrewster.._. 80.96Kwai Mi . . 77.63
CommonSeeds removed t-----------------------------.- 84.35Whole 81.75
Java Plum 84.76
KetambiJlaPulp 86.39Whole . 86.01
4546
3233
34
35
3637
38
31
3940
41
42
43
44
2930
4748
Passion FruitPurple, JUlce 85.62Yellow, juice ._ 84.94
5153
0.390.67
0.05 13.600.18 13.72
'See footnotes, page 34_32

VitaminPhos- A Thia- Ribo- Ascorbic ITEM
Fiber Ash Calcium phorus Il'\}n Value mme flavin Niacin Acid No.
milli- milli- milli- mlcro- milli- milli- milli- milli-grams grams grams grams grams grams grams grams grams grams
145 0.034 0.029 0.64 33 266.06 0.61 34.4 19.7 0.27 27
trace 0.029 0.031 0.42 21.0 28
2.38 0.48 14.6 15.5 0.29 109 0.056 0.060 1.28 100 296.84 0.50 9.5 21.6 1.49 0.037 0.053 0.61 70-350 30
1.72 0.33 2.0 13.4 0.27 0 trace 0.24 31 31
0.13 0.56 8.2 12.0 0.45 32237 0.012 0.052 0.25 66.3 33
0.05 0.27 9.4 8.5 0.11 0.020 0.034 0.23 25.1 * 34
0.83 0.48 9.3 10.9 0.14 1122 0.019 0.024 0.18 trace 35
0.54 0.37 10.4 22.3 0.16 0 0.015 0.060 0.69 80.8* 360.16 0.37 3.9 34.6 0.37 0 0.035 0.084 1.91 40.2 37
1.84 1.40 53.4 240.8 1.99 0 0.216 0.119 1.60 38
0.54 0.42 8.1 10.4 0.16 3813* 0.041 0.057 0.30 15.1 390.70 0.37 6.0 14.7 0.16* 4735* 0.081 0.060 0.46 15 40
0.80 0.26 7.0 13.0 0.38 0 0.029 0.036 0.24 23.4* 41
0.96 0.69 39.4 38.0 1.85 15 0.029 0.101 0.62 36.4 42
1.32 0.26 7.2 10.1 0.09 498 0.017 0.036 0.27 6 43
0.18 0.33 23.1 20.5 0.20 646 0.104 0.086 0.34 50.5 44
0.58 0.57 29.9 11.6 0.19 1093 0.027 0.043 0.33 84 450.60 0.57 40.9 15.5 0.21 2034 0.020 0.040 0.39 74.1 46
0.04 0.34 3.6 12.5 0.24 717 trace 0.131 1.46 29.8 470.17 0.49 3.8 24.6 0.36 2410 trace 0.101 2.24 20 48
(Continued)33

TABLE 1. Composition of Hawaii fruits, per 100 grams of edible portion (Continued)!
TotalITEM Mois· Food Carho·No. Fruit ture Energy Protein Fat hydrate
per·cent calorieJ grams grams gramJ
49 Persimmon, Hachiya..... _.. -------._---- 78.67 76 0.53 0.15 20.31
50 Pineapple, Smooth Cayenne........................ 85.54 52 0.45 0.21 13.51
51 Plum, Methley...... _.. _..._.......... _.............. _...... 88.70 40 0.55 0.06 10.42
52 Poha..._............_.................._.......................... 81.57 64 1.93 0.15 15.49
53 Pummelo or Shaddock........................._...... 89.94 34 0.76 0.04 8.78
54 RoseIIe.......................................... _............... 90.96 34 0.96 0.64 6.93
Soursop55 Juice.......................................................... 82.1856 Pulp ............._.................._......................... 80.11 71 0.69 0.39 18.23
57 Strawberry................................................._.. 90.51 33 0.76 0.18 8.12
58 Surinam Cherry........_......................_............ 89.03 39 0.46 0.05 10.22
59 Sweetsop...................................................... 75.97 86 1.89 0.57 20.82
60 Tamarind ...................................................... 33.89 230 3.28 0.50 59.76
61 Tangerine...................................................._. 90.13 34 0.71 0.05 8.78
Watermelon62 Charleston Gray...................................... 92.64 26 0.51 0.05 6.5463 Chilean Black Seeded............................. 90.20 34 0.90 0.11 8.42
64 Wi.apple ............... _...................................... 85.94 50 0.53 0.28 12.83
INote: "Trace" indicates that values were less than «) 10 micrograms for vitamin A value;< 0.010 milligram for thiamine and riboflavin; < 0.10 milligram for niacin; < 1 milligramfor ascorbic acid.
"0" in the vitamin A value column indicates that in the absence of any yellow pigment itwas assumed that no carotene or other usable carotenoid pigments were present.
"-" indicates that no determinations were made.Figure in parentheses (p. 32, fat for guava) was estimated in order to supply a carbohydrate
figure.
* Moisture content not determined, bur assumed to be similar to value given in moisturecolumn.
t Minerals determined on juice; other nutrients on pulpt Vitamin values are for mixed seedling types; vitamin A value varies with color; typical
ascorbic acid value given.
34

VitaminPhos- A Thia- Ribo- Ascorbic ITEM
Fiber Ash Calcium phorus Iron Val'.Ie mine flavin Niacin Acid No.~------.
mtlli- milli- milli- mlcro- milli- milli- milli- milli-grams grelffls grams grams grams grams grams grams grams grams
0.34 0.34 5.9 19.0 0.17 985 trace 0.060 0.18 7.3 49
0.50 0.29 18.4 11.5 0.26 trace 0.085 0.036 0.24 10.1 50
0.89 0.27 5.1 12.6 0.14 85 0.012 0.033 0.37 3.2 51
3.17 0.87 7.2 47.4 0.93 1598* 0.166 0.051 1.78* 42 52
0.18 0.48 7.4 20.8 0.15 0 0.034 0.027 0.22 39.9 53
1.14 0.51 172 0.011 0.028 0.31 12.0 54
0 0.067 0.120 1.52 16.4 550.95 0.58 8.8 29.0 0.82 56
0.98 0.43 20.9 29.4 2.54 11 0.020 0.040 0.27 62.2 57
0.33 0.24 6.6 8.7 0.14 1120 0024 0.054 0.23 18.8 58
1.41 0.75 17.0 53.6 0.30 0 0104 0.057 0.89 35.9 59
1.79 2.57 113.5 95.4 0.60 0 0.154 0.216 1.28 trace 60
0.02 0.33 13.6 13.0 0.21 830 0.105 0.022 0.16 30.8 61
0.05 0.26 1.3 7.0 0.20 179 0.040 0.Q18 7.3 620.10 0.37 6.2 17.0 0.17 464 0.038 0.040 0.20 6 63
0.83 0.42 10.1 21.6 0.31 360* 0.052 0.015 1.33 50.6* 64
35

TAfiLE 2. Composition of Hawaii fruits, in household units and common portions*
TotalITEM Mois- Fooel Carbo-No. Fruit anel Approximate Measure! Weight wre Energy Protein Fat hydrate
._----
per-grams cent calories grams grams grams
Acerola1 1 medium, Ys"XYs" AP, pitted __ 6 91.10 2 0.04 0.01 0.452 1 cup, medium AP____ 122 91.10 30 0.67 0.19 7.43
Avocado, Beardslee3 Yz small, 4"X3Ys" AP,
peeled and pitted _____ 167 67.49 389 0.45 42.05 9.694 Yz medium, 4W'X4" AP,
peeled and pitted___________ 202 67.49 471 0.55 50.86 11.725 Yz large, 5"X4H;" AP,
peeled and pitted _________________ 249 67.49 580 0.67 62.70 14.446 1 cup, Yz" cubes ____ ------ ______ 0 ____ ··- 150 67.49 350 0.40 37.77 8.707 1 cup, pulp _____________________ ______ 230 67.49 536 0.62 57.91 13.34
Avocado, Hulumanu8 Yz medium, 7" length AP,
peeled and pitted ____ ----- 222 82.79 229 3.26 20.56 12.63
Avocado, Kahaluu9 Yz small, 3Ys"X3\!,i" AP,
peeled and pitted_________________ 131 68.96 290 1.64 30.77 7.2810 Yz medium, 4"X3Yz" AP,
peeled and pitted____________ 152 68.96 336 1.90 35.70 8.4511 Yz large, 4Ys"X3Ys" AP,
peeled and pitted _________________ 186 68.96 411 2.32 43.69 10.3412 1 cup, Yz" cubes _____
~ - - - ~ - -- - - - ------- 150 68.96 332 1.88 35.24 8.3413 1 cup, pulp ____ .------_ .. _---- 225 68.96 497 2.81 52.85 12.51
Avocado, Nabal14 Yz medium, 4\-4"x4" AP,
peeled and pitted____________________ 217 69.91 454 2.24 47.31 13.74
Banana, Bluefields (Gros Michel)15 1 small, 5%"X1Yz" AP, peeled__ 79 71.05 81 1.15 0.17 20.9116 1 medium, 6Yz"X 1Ys" AP,
peeled ____________________________________ 117 71.05 119 1.71 0.26 30.9717 1 large, 8\-4"XIYs" AP, peeled __ 145 71.05 148 2.12 0.32 38.3818 1 cup, \!,i" slices _________________ 153 71.05 156 2.23 0.34 40.5019 1 cup, pulp __ - -------.--------- 225 71.05 230 3.28 0.50 59.56
Banana, Brazilian CApple")20 1 small, 4W'X1Yz" AP, peeled __ 54 66.94 64 0.47 0.19 16.7821 1 medium, 5~"Xl~" AP,
peeled_ --._------------ ----------------- 70 66.94 83 0.61 0.25 21.7522 1 large, 6Ys"XIW' AP, peeled____ 130 66.94 153 1.13 0.47 40.3923 1 cup, \!,i" slices ____ 140 66.94 165 1.22 0.50 43.50
* See footnotes, page 48.36

VitaminPhos- A Thia- Ribo- Ascotbic ITEM
Fiber Ash Calcium phorus Iron Value mine flavin Niacin Acid No.
Inter-milli- mil/i- milli- national milli- milli- milli- milli·
grams grams grams grams grams Units grams grams grams grams
0.04 0.03 0.5 1.0 0.01 24 trace trace trace 140 10.59 0.44 8.5 15.9 0.17 400 0.027 0.080 0.33 2283 2
1.97 2.09 7.8 132.9 1.04 3474 0.065 0.362 1.32 3.8 3
2.38 2.52 9.5 160.8 1.25 4202 0.079 0.438 1.60 4.6 4
2.94 3.11 11.7 198.2 1.54 5179 0.097 0.540 1.97 5.7 51.77 1.88 7.0 119.4 0.93 3120 0.058 0.326 1.18 3.4 62.71 2.88 10.8 183.1 1.43 4784 0.090 0.499 1.82 5.3 7
3.44 1.75 17.3 75.7 1.20 0.056 0.209 2.73 8
2.36 0.92 10.2 28.0 0.52 156 9.8 9
2.74 1.06 11.9 32.5 0.61 181 11.4 10
3.35 1.30 14.5 39.8 0.74 221 14.0 112.70 1.05 11.7 32.1 0.60 179 11.2 124.05 1.58 17.6 48.2 0.90 268 16.9 13
4.38 2.02 23.0 90.9 0.80 1740 0.193 0.308 11.9 14
0.45 0.63 3.5 18.2 0.21 136 0.024 0.035 0.55 5 15
0.67 0.94 5.1 27.0 0.32 201 0.035 0.051 0.82 7 160.83 1.16 6.4 33.5 0.39 249 0.044 0.064 1.02 9 170.87 1.22 6.7 35.3 0.41 263 0.046 0.067 1.07 9 181.28 1.80 9.9 52.0 0.61 387 0.068 0.099 1.58 14 19
0.37 0.41 3.8 16.4 0.15 85 0.022 0.041 0.32 7.9 20
0.48 0.53 4.9 21.3 0.20 III 0.029 0.053 0.41 10.2 210.88 0.99 9.1 39.5 0.36 205 0.053 0.099 0.77 19.0 220.95 1.06 9.8 42.6 0.39 221 0.057 0.106 0.83 20.4 23
(Continued)
37

TABLE 2. Composition of Hawaii fruits, in household unrts and common portions (Continued)
TotalITEM Mois- Food Carbo-Na. Fruit and Approximate Measure! Weight ture Energy Protein Fat hydrate
per-grams cent calories grams grams grams
Banana, Chinese (Cavendish)24 1 small, 4%"XIW' AP, peeled.. 50 79.22 36 0.88 0.09 9.0225 1 medium, 5y.j"X1Yz" AP,
peeled ...................................... 63 79.22 45 1.10 0.11 11.3626 1 large, 7"X1Yz" AP, peeled..... 80 79.22 58 1.40 0.14 14.4227 1 cup, y.j" slices .......................... 142 79.22 102 2.48 0.26 25.6028 1 cup, pulp................................. 165 79.22 119 2.89 0.30 29.75
Banana, Lacatan29 1 medium, 6"X1Yz" AP, peeled.. 110 63.09 143 1.31 0.20 38.00
Banana, Williams Hybrid30 1 medium, 6Yz"X1y.j" AP,
peeled ...................................... 137 71.33 137 1.48 0.18 36.39
Banana (Plantain), Largo31 1 medium, 7"X2Yz" AP, peeled.. 140 64.05 178 1.79 0.42 46.90
Banana (Plantain), Maiamaoli32 1 medium, 7Yz"X2Ys" AP,
peeled .............................._.._... 236 67.17 271 2.19 0.09 72.85
Banana (Plantain), Popoulu33 1 medium, 5Ys"X2Yz" AP,
peeled ....._ 238 67.40 271 2.76 0.10 72.26
Breadfruit, ripe34 y.j small, 4Ys"X4Ys" AP, peeled. 96 61.77 129 0.07 0.17 35.3035 Va medium, 5}.4"X5y,j" AP,
peeled ...................................... 100 61.77 134 0.07 0.18 36.7736 1 cup, pulp..........._._ ........ 220 61.77 295 0.15 0.40 80.89
Cactus Fruit37 1 medium. 3y.j"X2Ys" AP,
peeled ......._... __ 143 84.61 76 1.13 0.13 19.68
Carambola2
38 1 medium, 5"X3" AP,seeds removed ..._................_... 193 90.23 71 1.64 1.74 14.51
Carissa39 1 medium, 1Yz"X1Ys" AP,
seeds removed......._..._............ 13 81.88 9 0.05 0.11 2.1440 1 cup, Ys" slices..................._..... 150 81.88 102 0.54 1.30 24.68
* See footnotes, page 48.38

VitaminPhos- A Thia- Ribo- Ascorbic ITEM
Fiber Ash Calcium phorus Iron Value mine flavin Niacin Acid No.
Inter·milli· milli- milli. national mil/i· mzlli- milli- milli-
grams grams grams grams grams Units grams grams grams grams
0.12 0.41 1.0 6.7 0.18 41 0.013 0.020 0.30 4 24
0.16 0.52 1.3 8.4 0.22 52 0.016 0.026 0.38 5 250.20 0.66 1.6 10.7 0.28 66 0.021 0.033 0.49 6 260.36 1.16 2.8 19.0 0.50 116 0.037 0.D58 0.87 11 270.41 1.35 3.3 22.1 0.58 135 0.043 0.068 1.01 13 28
0.34 1.09 7.3 24.8 0.33 85 10.6 29
0.15 1.23 6.8 24.0 0.67 121 0.060 0.062 0.95 7.0 30
0.60 1.22 6.0 28.7 0.76 382 0.053 0090 0.60 24.5 31
0.73 2.34 8.7 62.1 1.06 916 0.127 0.281 1.53 35.9 32
0.79 2.48 2.9 61.9 0.71 1692 0.143 0.169 1.57 34.5 33
1.39 1.16 20.0 46.4 0.25 39 0.111 0.060 1.48 19.7 34
1.45 1.21 20.8 48.3 0.26 41 0.116 0.063 1.54 20.5 353.19 2.66 45.8 106.3 0.57 90 0.255 0.139 3.39 45.1 36
2.77 1.07 61.2 13.2 0.37 trace 0.021 0.037 0.51 36.3 37
2.84 0.96 1.7 21.4 0.12 41 0.077 0.085 1.37 68 38
0.10 0.06 1.5 0-9 0.17 trace trace trace trace 7.2 391.16 0.66 17.0 10.5 1.96 36 0.056 0.094 0.36 83.2 40
(Continued)39

TABLE 2. Composition of Hawaii fruits, in household units and common portions (Continued:
TotalITEM Mois- Food Carbo·No. Fruit and Approximate Measure! Weight ture Energy Protein Fat hydrate
per-grams cent calories grams grams grams
Cherimoya41 1 large, S"X37/s" AP,
peeled and seeds removed ____ 547 68.71 602 8.42 0.71 158.36
Coconut Cream42 prepared with water
1 cup____________________________________________ 229 65.70 577 7.35 56.98 11.86
Coconut Cream43 prepared without water
1 cup___________ -- -.---~. --~- ----- --- --- 232 53.90 803 9.93 80.46 13.90
Coconut Water44 from nuts with soft spoon-meat
1 cup_________- - - -_._. ------------ -------- -~- -- ~ 284 93.78
Fig45 1 medium, 2~"X2" AP______________ 52 85.73 27 0.36 0.11 6.7446 1 large, 2Yz"X2~" AP________________ 70 85.73 36 0.48 0.15 9.07
Grape, Isabella47 1 cup, skin and seeds removed __ 286 82.25 183 1.29 0.54 48.3348 1 cup, whole AP ________________ 153 82.25 67 0.47 0.20 17.58
Grapefruit49 1 medium, 2~"X3Yz" AP,
peeled and membranesremoved ______________________________ 134 91.56 42 0.74 0.40 9.81
50 Yz medium AP_________________ 110 91.56 21 0.37 0.20 4.9051 1 cup, sections,
membranes removed __ 202 91.56 63 1.11 0.61 14.79
Green Sapote52 1 medium, 4"X3~" AP,
peeled and seeds removed ____ 225 69.76 241 3.89 1.06 60.66
Guava, Cattley, Red3
53 1 medium, ~"x Ys" AP______________ 5 81.64 3 0.02 0.02 0.8554 1 cup pulp and shell,
seeds removed _______________________ 244 84.31 161 1.12 0.93 41.26
Guava, CattIey, Yellow55 1 medium, Ys"Xl" AP,
seeds removed ________________________ 8 83.4056 1 cup pulp and shell,
seeds removed ________________________ 244 83.40
.. See footnotes, page 48.40

VitaminPhos· A Thia· Ribo· Ascorbic ITEM
Fiber Ash Calcium phorus Iron Value mme flavin Niacin Acid No.
Inter·milli· milli· milli· national milti· milli· milli· milli·
grams grams grams grams grams Units grams grams grams grams
3.66 48.7 130.2 1.37 0 0.613 0.613 5.58 66.7 41
2.36 37.3 229.0 3.76 0 0.060 trace 1.74 6.4 42
2.67 24.8 283.3 5.29 0 0.070 trace 2.06 6.5 43
Ll6 46.6 38.3 0.20 0 trace trace trace 44
0.46 0.21 14.7 11.0 0.08 34 0.019 0.020 0.18 1 450.62 0.29 19.8 14.8 0.11 46 0.025 0.027 0.24 1 46
0.57 0.60 21.4 45.5 0.63 297 0.214 0.140 0.54 6 470.21 0.22 7.8 16.5 0.23 108 0.078 0.051 0.20 2 48
0.42 0.36 29.2 22.2 0.12 0 0.070 0.034 0.34 72.2 490.21 0.18 14.6 1Ll 0.06 0 0.035 0.017 0.17 36.1 50
0.63 0.55 44.0 33.5 0.18 0 0.105 0.050 0.50 108.9 51
0.25 2.43 78.3 45.7 0.95 1642 trace 0.115 3.53 65.7 52
0.30 0.03 1.7 1.0 0.01 trace trace trace trace 2 53
354 0.083 0.071 1.56 81 54
trace trace trace trace 1.7 55
trace 0.071 0.076 1.02 51.2 56
(Continued)
41

TABLE 2. Composition of Hawaii fruits, in household units and common portions (Continued)
TotalITEM Mois- Food Carbo-Na. Fruit and Approximate Measure l Weight ture Energy Protein Fat hydrate
per-grams cent ralories grams grams grams
Guava, Common57 1 medium, 2Y2"X2~" AP_________ 112 81.75 73 0.84 0.27 18.7758 1 medium, 2Yz"X2y.j" AP,
seeds removed 4 ______________________ 90 84.35 50 0.25 (0.1) 13.3159 1 cup, pulp and shell,
seeds removed 4 ______________________ 165 84.35 91 0.46 (0.2) 24.40
Java Plum60 1 cup, pitted____________________________ 135 84.76 73 0.81 0.09 19.22
Ketambilla5
61 1 cup, pulp_________________________________ 234 86.39 110 3.51 0.30 26.7262 1 cup, whole ______________________________ 128 86.01 60 1.92 0.17 14.62
Lime, juice63 1 cup_____________________________________________ 250 90.86 60 1.32 0.02 20.82
Loquat64 1 medium, 2y.j"Xl%,' AP,
peeled and pitted ____________________ 25 87.26 12 0.13 0.16 2.78
Lychee, Brewster65 1 medium, 1Yz"X1y.j" AP,
peeled and pitted____________________ 13 80.96 9 0.10 0.03 2.3066 1 cup, peeled and pitted____________ 190 80.96 129 1.42 0.42 33.63
Lychee, Kwai Mi67 1 medium, 1Ys"X1Ys" AP,
peeled and pitted___________________ 11 77.63 9 0_10 0.03 2_2868 1 cup, peeled and pitted____________ 190 77.63 152 1.79 0.55 39.46
Macadamia Nut, cooked69 1 small, 1'8" X 1'8"__________________________ 2 1.19 15 0.18 1.56 0.2070 1 medium, 1'8" X "JIs" ____________________ 4 1.19 29 0.37 3.13 0.4071 1 large, ~"X 1"____________________________ 6 1.19 44 0.55 4.69 0.6072 1 cup____________________________________________ 134 1.19 974 12.37 104.80 13.36
Mango, Haden73 1 small, 3Ys"X3" AP,
peeled and pitted________ 174 84.12 97 0.68 0.03 26.1974 1 medium, 31'8"X3y.j" AP,
peeled and pitted___________ 228 84.12 128 0.89 0.05 34.3175 1 large, 4"X3Yz" AP,
peeled and pitted_________________ 295 84.12 165 1.15 0.06 44.4076 1 cup, Yz" cubes__________________________ 170 84.12 95 0.66 0.03 25.58
* See footnotes, page 48.42

VitaminPhos- A Thia- Ribo- Ascotbic ITEM
Fiber Ash Calcium phorus Iron Value mine flavin Niacin Acid No.
Inter-milli- milli- milli- national milli- milli- milli- milli-
grams grams grams grams grams Units grams grams grams grams
7.66 0.56 10.6 24.2 1.67 0.041 0.059 0.68 78-392 57
2.14 0.43 13.1 14.0 0.26 98 0.050 0.054 1.15 90 58
3.93 0.79 24.1 25.6 0.48 180 0.092 0.099 2.11 165 59
2.32 0.45 2.7 18.1 0.36 0 trace 0.32 36 60
0.30 1.31 19.2 28.1 1.05 555 0.028 0.122 0.58 155.1 61303 0.015 0.067 0.32 84.9 62
0.12 0.68 23.5 21.2 0.28 0.050 0.085 0.58 62.8 63
0.21 0.12 2.3 2.7 0.04 280 trace trace trace trace 64
0.07 0.05 1.4 2.9 0.02 0 trace trace trace 10.5 651.03 0.70 19.8 42.4 0.30 0 0.028 0.114 1.31 153.5 66
0.02 0.04 0.4 3.8 0.04 0 trace trace 0.21 4.4 670.30 0.70 7.4 65.7 0.70 0 0.066 0.160 3.63 76.4 68
0.04 0.03 1.1 4.8 0.04 0 trace trace trace 690.07 0.06 2.1 9.6 0.08 0 trace trace trace 700.11 0.08 3.2 14.4 0.12 0 0.013 trace trace 712.47 1.88 71.6 322.7 2.67 0 0.289 0.159 2.14 72
0.94 0.73 14.1 18.1 0.28 6635 0.071 0.099 0.52 26.3 73
1.23 0.96 18.5 23.7 0.36 8694 0.093 0.130 0.68 34.4 74
1.59 1.24 23.9 30.7 0.47 11248 0.121 0.168 0.88 44.5 750.92 0.71 13.8 17.7 0.27 6482 0.070 0.097 0.51 25.7 76
(Continmd)43

TABLE 2. Composition of Hawaii fruits, in household units and common portions (Continued)'
TotalITEM Mois- Food Catbo-No. Fruit and Approximate Measure' Weight ture Energy Protein Fat hydrate
per-grams cent calories grams grams grams
Mango, Pirie77 1 small, 2Ys"X2},l" AP,
peeled and pitted____________________ 112 79.97 81 0_62 0.22 21.1878 1 medium, 3Ys"X3Ys" AP,
peeled and pitted____________________ 172 79.97 124 0.95 0.34 32.5379 1 large, 3YsI X3Ys" AP,
peeled and pitted_____________ ._____ 238 79.97 171 1.31 0.48 45.0180 1 cup, Yz" cubes__________________________ 160 79.97 115 0.88 0.32 30.26
Mountain Apple81 1 medium, 2I XLVs" AP, pitted __ 56 91.54 17 0.18 0.03 4.3782 1 cup, Yz" cubes__________________________ 147 91.54 44 0.49 0.09 11.48
Mulberry83 1 cup____________________ -----------------_.-- .. 140 86.91 64 2.02 0.55 14.80
Ohelo Berry84 1 cup______________________
-------_._-----_.---- 140 90.07 50 0.53 0.31 12.70
Orange85 1 small, 2YsI X2},l" AP,
peeled and membranesremoved __________________________________ 96 89.38 36 0.53 0.08 9.27
86 1 medium, 31 X3" AP,peeled and membranesremoved __________________________________ 135 89.38 50 0.74 0.11 13.04
87 1 large, 3YzI X3Ys" AP,peeled and membranesremoved _________________________________ 219 89.38 81 1.20 0.18 21.16
88 1 cup, sections____________________________ 190 89.38 70 1.04 0.15 18.35
89Papaya, Solo, Hermafhroditt
Yz small, 4Ys"X3Yz' AP,skin and seeds removed ________ 97 86.80 45 0.38 0.06 11.81
90 Yz medium, 51 X4" AP,skin and seeds removed ________ 144 86.80 66 0.56 0.09 17.54
91 Yz large, 5Ys I X4Ys" AP,skin and seeds removed ________ 202 86.80 93 0.79 0.12 24.60
92 1 cup, Yz" cubes__________________________ 140 86.80 64 0.55 0.08 17.0593 1 cup, pulp________________________________ 232 86.80 107 0.90 0.14 28.26
Papaya, Solo, Pistillate94 Yz medium, 4YzI X4;,q" AP,
skin and seeds removed ________ 230 86.25 110 0.92 0.18 29.21Passion Fruit, Purple, juice
95 1 cup____________________________________ 247 85.62 126 0.96 0.12 33.59
* See footnotes, page 48.44

VitaminPhos· A Thia· Ribo· Ascorbic ITEM
Fiber Ash Calcium phorus Iron Value mine flavin Niacin Acid No.
Inter·mil/i· milli· mi/li- national milli- milli· mllli· milli·
grams grams grams grams grams Units grams grams grams grams
0.78 0.41 6.7 16.5 0.18 5303 0.091 0.067 0.52 17 77
1.20 0.64 10.3 25.3 0.28 8144 0.139 0.103 0.79 26 78
1.67 0.88 14.3 35.0 0.38 11269 0.193 0.143 1.09 36 791.12 0.59 9.6 23.5 0.26 7576 0.130 0.096 0.74 24 80
0.45 0.15 3.9 7.3 0.21 0 0.016 0.020 0.13 13.1 811.18 0.38 10.3 19.1 0.56 0 0.043 0.053 0.35 34.4 82
1.34 0.97 55.2 53.2 2.59 21 0.041 0.141 0.87 51.0 83
1.85 0.36 10.1 14.1 0.13 697 0.024 0.050 0.38 8 84
0.17 0.32 22.2 19.7 0.19 620 0.100 0.083 0.33 48.5 85
0.24 0.45 31.2 27.7 0.27 872 0.140 0.116 0.46 68.2 86
0.39 0.72 50.6 44.9 0.44 1415 0.228 0.188 0.74 110.6 870.34 0.63 43.9 39.0 0.38 1227 0.198 0.163 0.65 96.0 88
0.56 0.55 29.0 11.3 0.18 1060 0.026 0.042 0.32 81 89
0.84 0.82 43.1 16.7 0.27 1574 0.039 0.062 0.48 121 90
1.17 1.15 60.4 23.4 0.38 2208 O.os5 0.087 0.67 170 910.81 0.80 41.9 16.2 0.27 1530 0.038 0.060 0.46 118 921.35 1.32 69.4 26.9 0.44 2536 0.063 0.100 0.77 195 93
1.38 1.31 94.1 35.6 0.48 4678 0.046 0.092 0.90 170.4 94
0.10 0.84 8.9 30.9 0.59 1771 trace 0.324 3.61 73.6 95
(Continued)45

TABLE 2. Composition of Hawaii fruits, in household units and common portions (Continued
TotalITEM Mois- Food Carbo-No. Fruit and Approximate Measure! Weight ture Energy Protein Fat hydrate
per-grams cent calories grams grams grams
Passion Fruit, Yellow, juice96 1 cup_____________.____ ._________________________ 247 84.94 131 1.65 0.44 33.89
Persimmon, Hachiya97 1 medium, 2Yz"X2Yz" AP,
peeled _____________________________ 136 78.67 103 0.72 0.20 27.62
Pineapple, Smooth Cayenne98 1 wedge, Ys of medium, 7" X
5)4" AP, peeled and cored ___ 148 85.54 77 0.67 0.31 19.9999 1 slice of medium, yg" thick,
peeled and cored____________________ 159 85.54 83 0.72 0.33 21.48100 1 cup, Yz" cubes_.________________________ 170 85.54 88 0.76 0.36 22.97
Plum, Methley101 1 medium, 1');,:;"XH4" AP,
pitted___________________ .______________ 46 88.70 18 0.25 0.03 4.79102 1 cup, slices _______________________________ 162 88.70 65 0.89 0.10 16.88
Poha103 1 cup, husks removed ________________ 140 81.57 90 2.70 0.21 21.69
Pummelo or Shaddock104 1 medium, 5Yz"x5Yz" AP,
peeled and membranesremoved _________________________________ 609 89.94 207 4.63 0.24 53.47
105 1 cup, sections ___________________________ 190 89.94 65 1.44 0.08 16.68
Roselle106 1 cup, whole AP __________________. 57 90.96 12 0.34 0.22 2.43
Soursop6107 1 medium, 7"X5)4" AP,
peeled and strained________________ 625 82.18 444 4.31 2.44 113.94108 1 cup, pulp______________
~ ----- --~~--.- 225 80.11 160 1.55 0.88 41.02
Strawberry109 1 cup____________________________________________ 150 90.51 50 1.14 0.27 12.18
Surinam Cherry110 1 medium, Ys"XIYs" AP, pitted 6 89.G3 2 0.03 trace 0.61III 1 cup, pitted____________________________ 172 89.03 67 0.79 0.09 17.58
Sweetsop112 1 medium, 2Ys"X3)4" AP,
peeled and seeds removed ____ 155 75.97 133 2.93 0.88 32.27113 1 cup, pulp__________________________________ 250 75.97 215 4.72 1.42 52.05
* See footnotes, page 48.46

VitaminPhos- A Thia- Ribo- Ascorbic ITEM
Fiber Ash Calcium phorus Iron Value mIne flavin Niacin Acid No.
Inter-mllll· milll· mjJli· national ml/Ii· mill/· mill/· mdll·
grams grams grams grams grams Units grams grams grams grams
0.42 1.21 9.4 60.8 0.89 5953 trace 0.249 5.53 49 96
0046 0.46 8.0 25.8 0.23 1340 trace 0.082 0.24 9.9 97
0.74 0.43 27.2 17.0 0.38 trace 0.126 0.053 0.36 14.9 98
0.80 0.46 29.3 18.3 0.41 trace 0.135 0.057 0.38 16.1 990.85 0.49 31.3 19.6 0.44 trace 0.144 0.061 0.41 17.2 100
0.41 0.12 2.3 5.8 0.06 39 trace 0.015 0.17 1.5 1011.44 0.44 8.3 20.4 0.23 138 0.019 0.053 0.60 5.2 102
4.44 1.22 10.1 66.4 1.30 2237 0.232 0.071 2.49 59 103
1.10 2.92 45.1 126.7 0.91 0 0.207 0.164 1.34 243.0 1040.34 0.91 14.1 39.5 0.28 0 0.065 0.051 0.42 75.8 105
0040 0.18 60 trace 0.010 0.11 4.2 106
55.0 181.2 5.12 0 0.419 0.750 9.50 102.5 1072.14 1.30 19.8 65.2 1.84 0 0.151 0.270 3.42 36.9 108
1.47 0.64 31.4 44.1 3.81 16 0.030 0.060 0.40 93.3 109
0.02 0.01 0.4 0.5 0.01 67 trace trace trace 1.1 1100.57 0.41 11.4 15.0 0.24 1926 0.041 0.093 0.40 32.3 111
2.19 1.16 26.4 83.1 0.46 0 0.161 0.088 1.38 55.6 1123.52 1.88 42.5 134.0 0.75 0 0.260 0.142 2.22 89.8 113
(Continued)47

TABLE 2. Composition of Hawaii fruits, in household units and common portions (Continued)
TotalITEM Mois· Food Carbo·No. Fruit and Approximate Measure! Weight ture Energy Protein Fat hydrate
per·cent calories grams grams gram!
Tamarind114 1 medium, 3"Xl" AP,
peeled and seeds removed .... 2 33.89 5 0.07 0.01 1.20115 1 cup, pulp......... -----_. __ 6_._----------. 120 33.89 276 3.94 0.60 71.71
Tangerine116 1 medium, 1~"X2Ys" AP,
peeled and membranesremoved .................................. 91 90.13 31 0.65 0.05 7.99
117 1 cup, sections............................ 192 90.13 65 1.36 0.10 16.86
Watermelon, Charleston Gray118 1 wedge, ~ of 1811z"xSW'
melon AP, rind removed ...... 520 92.64 135 2.65 0.26 34.01119 1 cup, liz" cubes ........................ 150 92.64 39 0.76 0.08 9.S1
Watermelon, Chilean Black Seeded120 1 wedge, \{6 of 914"X9Yz"
melon AP, rind removed .. _... 260 90.20 88 2.34 0.29 21.S9121 1 cup, liz" cubes......................... 150 90.20 51 1.35 0.16 12.63
Wi-apple122 1 medium, 2~"X2Yz" AP,
peeled, pitted, and fibersremoved .............................. _... 96 85.94 48 0.51 0.27 12.32
*Note: "Trace" indicates that values were less than «) 10 International Units for vitamin Avalue; < 0.010 milligram for thiamine and riboflavin; < 0.10 milligram for niacin; < 1 milligramfor ascorbic acid.
"a" in the vitamin A value column indicates that in the absence of any yellow pigment itwas assumed that no carotene or other usable carotenoid pigments were present.
"-" indicates that no determinations were made.Figures in parentheses (p. 42, fat for guava) were estimated in order to supply a carbohydrate
figure.
! The size of the fruits, shown as length times diameter in inches, includes the skin, i.e., aspurchased, abbreviated AP. The weight and nutritive values are for the edible portion of thefruit as described, i.e., peeled and pitred, or 'h" cubes, etc., with a few exceptions. See page 27.
2 Minerals determined on juice; other nutrients on pulp.3 Vitamin values determined on fruit with seeds removed; other values on whole fruit.4 Vitamin values are averages for mixed seedling types; vitamin A value varies with color;
typical ascorbic acid value given.5 Vitamin values determined on whole fruit; other values on pulp.6 Vitamin values determined on pulp; other values on juice.
48

VitaminPhos- A Thia- Ribo- Ascorbic ITEM
Fiber Ash Calcium phorus Iron Value mine flavin Niacin Acid No.
Inter-milli- milli- milli- national milli- milli- milli- milli-
grams grams grams grams grams Units grams grams grams grams
0.04 0.05 2.3 1.9 0.01 0 trace trace trace trace 1142.15 3.08 136.2 114.5 0.72 0 0.185 0.259 1.54 trace 115
0.02 0.30 12.4 11.8 0.19 755 0.096 0.020 0.15 28.0 1160.04 0.63 26.1 25.0 0.40 1594 0.202 0.042 0.31 59.1 117
0.26 1.35 6.8 36.4 1.04 931 0.208 0.094 38.0 1180.08 0.39 2.0 10.5 0.30 268 0.060 0.027 11.0 119
0.26 0.96 16.1 44.2 0.44 1206 0.099 0.104 0.52 16 1200.15 0.56 9.3 25.5 0.26 696 0.057 0.060 0.30 9 121
0.80 0.40 9.7 20.7 0.30
49
346 0.050 0.014 1.28 48.6 122

TABLE 3. Composition of Hawaii fruits, in 100-calorie portions*
TotalITEM Mois- Carbo·No. Fruit and Approximate Measure! Weight ture Protein Fat hydrate
per·grams cent grams grams grams
Acerola.. ______ .. ______________________ ._____________________.. __ 322 91.10 2.19 0.61 24.4154 medium, Ys"XYs" AP, pitted3Y3 cups, medium AP
2 Avocado, Beardslee_______ .. ____________________________ 43 67.49 0.12 10.83 2.49Ys small, 4"X3Ys" AP, peeled and pittedY3 cup, Yz" cubes3 tablespoons, pulp
3 Avocado, Hulumanu______________ --_.-.- ..._---------- 97 82.79 1.43 8.98 5.52~ medium, 7" length AP,
peeled and pitted
4 Avocado, Kahaluu ______________________.. ________ .. ____ 45 68.96 0.56 10.57 2.50Ys large, 4yg"X3Ys" AP,
peeled and pittedY3 cup, Yz" cubes3 tablespoons, pulp
5 Avocado, NabaL_________________________ .. ______ ..__.. __ 48 69.91 0.49 10.46 3.04Ys medium, 4W'x4" AP,
peeled and pitted
6 Banana, Bluefields (Gras Michel) ________ 98 71.05 1.43 0.22 25.941~ small, 5Ys"X1Yz" AP, peeled'}4 medium, 6Yz"x 1Ys" AP, peeledY3 large, 8]4"XUil" AP, peeled% cup, ~" slicesYz cup, pulp
7 Banana, Brazilian CApple") ______________________ 85 66.94 0.74 0.31 26.411Yz small, 4W'X1Yz" AP, peeled1~ medium, 5W'X1W' AP, peeled% large, 6Ys"X1W' AP, peeled% cup, ~" slices
8 Banana, Chinese (Cavendish) ____________________ 139 79.22 2.43 0.25 25.062'}4 small, 4W'Xl14" AP, peeled2~ medium, 5~"xglz"AP, peeled1'}4 large, 6"x1Yz" AP, peeled1 cup, ~" slices'}4 cup, pulp
* See footnotes. page 62.50

VitaminPhos· A Thia· Ribo· Ascorbic ITEM
Fiber Ash Calcium phorus Iron Value mine flavin Niacin Acid No.
Inter·milli· milli- milli· national milli· milli· milli· milli·
grams grams grams grams grams Units grams grams grams grams
1.93 1.45 28.0 52.2 0.55 1314 0.090 0.264 1.09 7503 1
0.51 0.54
1.50 0.77
0.81 0.32
0.97 0.45
0.56 0.78
0.58 0.65
0.35 1.14
2.0
7.6
3.5
5.1
4.3
6.0
2.8
34.2 0.27
33.1 0.52
9.6 0.18
20.1 0.18
22.6 0.26
25.8 0.24
18.6 0.49
894 0.017 0.093 0.34
0.024 0.091 1.19
54
385 0.043 0.068
169 0.029 0.043 0.69
134 0.035 0.065 0.50
114 0.036 0.057 0.85
1.0
3.4
2.6
6
12.4
11
2
3
4
5
6
7
8
51(Continued)

TABLE 3. Composition of Hawaii fruits, in 100-calorie portions (Continued) *
TotalITEM Mois· Carbo-No. Fruit and Approximate Measure l Weight ture Protein Fat hydrate
per-grams cent grams grams grams
9 Banana, Lacatan.........___________ ._.. ____________________ 77 63.09 0.92 0.14 26.60V3 medium, 7"X1Y2" AP, peeled
10 Banana, Williams Hybrid_..________________________ 100 71.33 1.08 0.13 26.56~ medium, 6Y2"X1 " AP, peeled
11 Banana (Plantain), Largo ____..._______________ 79 64.05 1.01 0.24 26.46Y2 medium, 7"x2Y2" AP, peeled
12 Banana (Plantain), Maiamaoli _____ 87 67.17 0.81 0.03 26.8610 medium, 7Y2"X2Ys" AP, peeled
13 Banana (Plantain), Popoulu________________________ 88 67.40 1.02 0.04 26.7210 medium, 5Ys"X2Y2" AP, peeled
14 Breadfruit, ripe______.______________________________________ 75 61.77 0.05 0.14 27.5814 small, 4Ys"X4Ys" AP, peeled10 cup, pulp
15 Cactus Fruic__________________ .___________ _.v ______________ 189 84.61 1.49 0.17 26.01110 medium, 314"X2Ys" AP, peeled
16 Carambola2 _______________________._.________________________ 270 90.23 2.30 2.43 20.30110 medium, 5"X3" AP, seeds removed
17 Carissa____________________________________________________________ 147 81.88 0.53 1.28 24.1811 medium, 1Y2"X1Ys" AP,
seeds removed1 cup, Ys" slices
18 Cherimoya ____________________________________________________ 91 68.71 1.40 0.12 26.34Pi large, 5"X3Ys" AP,
peeled and seeds removed
19 Coconut Cream__________________ 40 65.70 1.28 9.95 2.07prepared with water3 tablespoons
20 Coconut Cream ________________________ 29 53.90 1.24 10.06 1.74prepared without water2 tablespoons
• See footnotes, page 62.52

-----"
VitaminPhos- A Thia- Ribo- Ascorbic ITEM
Fiber Ash Calcium phorus Iron Value mIne flavin Niacin Acid No.
Inter-mHIi- milli- milli- national milli· milli- milli- milli-
grams grams grams grams grams Units grams grams grams grams
0.24 0.76 5.1 17.3 0.23 59 7.4 9
0.11 0.90 5.0 17.5 0.49 88 0.044 0.045 0.69 5.1 10
0.34 0.69 3.4 16.2 0.43 216 0.030 0.051 0.34 13.8 11
0.27 0.86 3.2 22.9 0.39 338 0.047 0.104 0.57 13.2 12
0.29 0.92 1.1 22.9 0.26 626 0.053 0.062 0.58 12.8 13
1.09 0.91 15.6 36.2 0.20 31 0.087 0.047 1.16 15.4 14
3.67 1.42 80.9
3.97 1.35 2.4
1.13 0.65 16.6
17.4 0.49 trace 0.028 0.049 0.68
30.0 0.16 57 0.108 0.119 1.92
10.3 1.93 35 0.054 0.093 0.35
48 15
95 16
81.6 17
0.61
0.41
0.33
8.1
6.5
3.1
21.7 0.23
40.0 0.66
35.4 0.66
o 0.102 0.102 0.93
o 0.010 trace 0.30
o trace trace 0.26
53
11.1 18
1.1 19
trace 20
(Continued)

TABLE 3. Composition of Hawaii fruits, in lOO-calorie portions (Continued) *
TotalITEM Mois- Carbo-No. Fruit and Approximate Measure l Weight ture Protein Fat hydrate
per-grams cent grams grams grams
21 Fig__________________________________________________________________ 196 85.73 1.35 0.41 25.404 medium, 2:4"X2" AP3 large, 2Y2"X2:4" AP
22 Grape, Isabella__________________________ .___________________ 156 82.25 0.70 0.30 26.36Y2 cup, skin and seeds removed1 cup, whole AP
23 GrapefruiL___________________________________________________ 322 91.56 1.77 0.97 23.572Y2 medium, 2%"X3Y2" AP,
peeled and membranes removed1Y2 cups, sections
24 Green Sapote________________________________________________ 93 69.76 1.61 0.44 25.07Y3 medium, 4"X3%" AP,
peeled and seeds removed
25 Guava, Cattley, Red3______~_._--- - - ------._._- - --.-- 152 81.64 0.70 0.58 25.70
30 medium, %"X Ys" AP
26 Guava, Common, seeds removed 4______________ 182 84.35 0.51 (0.2) 26.921 cup, pulp and shell2 medium, 2Y2"X2:4" AP
27 Guava, Common, whole ___________________________ 154 81.75 1.16 0.37 25.811Y3 medium, 2Y2"X2:4" AP
28 Java Plum________________---~- - - - - - ---- __ A - ____ - - ___ __ ~ • •• __ • 185 84.76 1.11 0.13 26.34
1Y3 cups, pitted
29 Ketam billa5_________________________________ ____ 0 ___ • __ --- •• 213 86.39 3.20 0.28 24.321 cup, pulp
30 Lime, juice____________________________________________________ 417 90.86 2.21 0.04 34.74B-3 cups
31 LoquaL________________________________________ ._ 0·' ____ ____ ~ ___ 213 87.26 1.11 1.36 23.649 medium, 2:4"X1%,' AP,
peeled and pitted
* See footnotes, page 62.54

VitaminPhos- A Thia- Ribo- Ascorbic ITEM
Fiber Ash Calcium phorus Iron Value mine flavin Niacin Acid No.
Inter-milli- milli- milli- national milli- milli- milli- milli-
grams grams grams grams grams Units grams grams grams grams
1.74 0.80 55.5 41.6 0.31 127 0.071 0.076 0.67 4 21
0.31 0.33 11.7
1.00 0.87 70.2
0.10 1.00 32.4
9.21 0.93 52.3
4.33 0.87 26.6
24.8 0.34
53.5 0.29
18.9 0.39
29.9 0.41
28.2 053
162 0.117 0.076 0.30
o 0.167 0.081 0.80
679 trace 0.047 1.46
220 0.052 0.044 0.97
198 0.102 0.109 2.33
3 22
173.6 23
27.2 24
50 25
182 26
10.53 0.77 14.6 33.3 2.29 0.057 0.082 0.94 108-539 27
:>'.18 0.61 3.7 24.8 0.50 0 trace 0.44 50 28
0.28 1.19 17.5 25.6 0.96 505 0.026 0.111 0.53 141.2 29
0.21 1.13 39.2 35.4 0.46 0.083 0.142 0.96 104.7 30
1.77 1.02 19.8 23.2 0.30 2390 0.040 0.051 0.38 trace 31
55(Continued)

TABLE 3. Composition of Hawaii fruits, in 100-calorie portions (Continued) *
TotalITEM Mois· Carbo-No. Fmit and Approximate Measure' Weight ture Protein Fat hydrate
per·grams cent grams grams grams
32 Lychee, Brewster__________________________________________ 147 80.96 1.10 0.32 26.0211 medium, 1Yz"XB-:j" AP,
peeled and pitted3,-:j cup, peeled and pitted
33 Lychee, K wai Mi ___________________________._____________. 125 77.63 1.18 0.36 25.9611 medium, 1Ys"X1Ys" AP,
peeled and pitted¥3 cup, peeled and pitted
34 Macadamia Nut, cooked._.___________._____._. ___.._. 14 1.19 1.29 10.95 1.407 small, 5jg" X 5jg"4 medium, 5jg"x 7is"2 large, 3,-:j"x1"
35 Mango, Haden..... __ ._____________________________________. 179 84.12 0.70 0.04 26.941 small, 3Ys"X3" AP, peeled and pitted% medium, 35jg"X3Y:i" AP,
peeled and pitted¥3large, 4"X3Yz" AP, peeled and pitted1 cup, Yi' cubes
36 Mango, Pirie __________ ._______________________ ._... _.. ______ 139 79.97 0.76 0.28 26.281Y:i small, 25jg"X2W' AP,
peeled and pitted3,-:j medium, 3Ys"X3Ys" AP,
peeled and pittedYz large, 35jg"X3Ys" AP,
peeled and pitted3,-:j cup, Yz" cubes
37 Mountain Apple ____ ---------------.------_.- 333 91.54 1.10 0.20 26.016 medium, 2"XLYs" AP, pitted2];3 cups, Yz" cubes
38 Mulberry________ ----------------------- -------------------- - 217 86.91 3.12 0.85 22.941Yz cups
39 Ohelo Berry ------.-----------_._-- 278 90.07 1.06 0.61 25.212 cups
* See footnotes, page 62.56

VitaminPhos- A Thia- Ribo- Ascorbic ITEM
Fiber Ash Calcium phorus Iron Value mine flavin Niacin Acid No.
Inter-milli- mi//i- mil/i- national mi//i- milli- milli- milli-
grams grams grams grams grams Units grams grams grams grams
0.79 0.54 15.3 32.8 0.24 0 0.022 0.088 1.01 118.8 32
0.20 0.46
0.26 0.20
4.9
7.5
43.2 0.46
33.7 0.28
o
o
0.044 0.105 2.39
0.030 0.017 0.22
50.2 33
34
0.97 0.75 14.5 18.6 0.29 6825 0.073 0.102 0.54
0.97 0.51 8.3 20.4 0.22 6582 0.113 0.083 0.64
2.66 0.87 23.3 43.3 1.27 0 0.097 0.120 0.80
2.08 1.50 85.5 82.5 4.01 33 0.063 0.219 1.35
3.67 0.72 20.02 28.] 0.25 1384 0.047 0.100 0.75
57
27 35
21 36
77.9 37
79.0 38
17 39
(Continued)

TABLE 3. Composition of Hawaii fruits, in lOO-calorie portions (Continued)*
TotalITEM Mois- Carbo-No. Fruit and Approximate Mea,ure ' Weight ture Protein Fat hydrate
per-grams cent grams grams grams
40 Orange__________________________________________________________ 270 89.38 1.48 0_22 26.083 small, 2YsI X2%" AP,
peeled and membranes removed2 medium, 31 X3" AP,
peeled and membranes removed1Ji.i large, 3YzI X3Ys" AP,
peeled and membranes removed1Yz cups, sections
41 Papaya, Solo, Hermaphrodite____________________ 217 86.80 0.85 0.13 26.431 small, 4Ys"X3Yz" AP,
skin and seeds removedY4 medium, 5"X4" AP,
skin and seeds removedYz large, 5YsI X4Ys" AP,
skin and seeds removed1Yz cups, Yz" cubes1 cup, pulp
42 Papaya, Solo, Pistillate________________________________ 208 86.25 0.83 0.17 26.42Yz medium, 4YzI X4Ji.i" AP,
skin and seeds removed
43 Passion Fruit, Purple, juice______ ---------------- 196 85.62 0.76 0.10 26.66
44 Passion Fruit, Yellow, juice____ . -----------._-_.-- 189 84.94 1.27 0.34 25.93% cup
45 Persimmon, Hachiya____________________________________ 132 78.67 0.70 0.20 26.811 medium
46 Pineapple, Smooth Cayenne______________________ 192 85.54 0.86 0.40 25.94Pi medium, 7"X5W' AP,
peeled and cored1Ji.i cups, Yz" cubes
47 Plum, Methley______________________________________________ 250 88.70 1.38 0.15 26.055 medium, 1%I X 1%" AP, pitted1Yz cups, slices
* See footnotes, page 62.58

VitaminPhos- A Thia- Ribo- Ascorbic ITEM
Fiber Ash Calcium phorus Iron Value mine flavin Niacin Acid No.
Inter-milli- milli- mil/i- national milli- milli- mil/i- milli-
grams grams grams grams grams Units grams grams grams grams
0.49 0.89 62.4 55.4 0.54 1744 0.281 0.232 0.92 136.4 40
I .26 1.24 64.9
1.25 1.19 85.1
0.08 0.67 7.1
0.32 0.93 7.2
0.45 0.45 7.8
0.96 0.56 35.3
2.22 0.68 12.8
25.2 0.41 2372 0.059 0.093 0.72
32.2 0.44 4231 0.042 0.083 0.81
24.5 0.47 1405 trace 0.257 2.86
46.5 0.68 4555 trace 0.191 4.23
25.1 0.22 1300 trace 0.079 0.24
22.1 0.50 trace 0.163 0.069 0.46
31.5 0.35 212 0.030 0.082 0.92
59
182 41
154.1 42
58.4 43
38 44
9.6 45
19.4 46
8.0 47
(Continued)

TABLE 3. Composition of Hawaii fruits, in 100-calorie portions (Continued) *
TotalITEM Mois- Carbo-No. Fruit and Approximate Measure! Weight ture Protein Fat hydrate
per-grams cent grams grams grams
48 Poha......................_....................................... 156 81.57 3.01 0.23 24.161 cup
49 Pummelo or Shaddock_............................... 294 89.94 2.23 0.12 25.81Yz medium, 5Yz"X5Yz" AP,
peeled and membranes removed1Yz cups, sections
50 Roselle ........................_................................. 482 90.96 2.82 1.88 20.375 cups, whole AP
51 Soursop6........................................................ 141 82.18 0.97 0.55 25.70~ medium, 7"X5~" AP,
peeled and strained% cup, pulp
52 Strawberry_.............__............_......................... 303 90.51 2.30 0.55 24.602 cups
53 Surinam Cherry............_................._............. 256 89.03 1.18 0.13 26.1643 medium, Ys"XIYs" AP, pitted1Yz cups, pitted
54 Sweetsop.................._..................................... 116 75.97 2.19 0.66 24.151'4 medium, 2Ys"X3~" AP,
peeled and seeds removedYz cup, pulp
55 Tamarind ......................................_............... 43 33.89 1.41 0.22 25.7022 medium, 3"Xl" AP,
peeled and seeds removed113 cup, pulp
56 Tangerine...................................................... 294 90.13 2.09 0.15 25.813~ medium, lW'X2Ys" AP,
peeled and membranes removed1Yz cups, sections
* See footnotes, page 62.60

VitaminPhos- A Thia- Ribo- Ascotbic ITEM
Fibet Ash Calcium phoms Iron Value mine flavin Niacin Acid No.---------------------------------------
blter-milli- milli- milli- national milli- milli- milli- milli-
grams grams grams grams grams Units grams grams grams grams
4.95 1.36 11.2 73.9 1.45 2493 0.259 0.080 2.78 66 48
0.53 1.41 21.8 61.2 0.44 0 0.100 0.079 0.65 117.3 49
3.35 1.50 506 0.032 0.082 0.91 35.3 50
1.34 0.82 12.4 40.9 1.16 0 0.094 0.169 2.14
2.97 1.30 63.3 89.1 7.70 33 0.061 0.121 0.82
0.84 0.61 16.9 22.3 0.36 2867 0.061 0.138 0.59
1.64 0.87 19.7 62.2 0.35 0 0.121 0.066 1.03
0.77 1.11 48.8 41.0 0.26 0 0.066 0.093 0.55
0.06 0.97 40.0 38.2 0.62 2440 0.309 0.065 0.47
61
23.1 51
188.5 52
48.1 53
41.6 54
trace 55
90.6 56
(Continued)

TABLE 3. Composition of Hawaii fruits, in 100-calorie portions (Continued) *
ITEMNo. Fruit and Approximate Measure 1
Mois-Weight ture Protein
TotalCarbo-
Fat hydrate
57
58
59
per-grams cent grams grams grams
Watermelon, Charleston Gray________________ 385 92.64 1.96 0.19 25.18% wedge, '/16 of 18Vi"x8\4"
melon AP, rind removed2Vi cups, Vi" cubes
Watermelon, Chilean Black Seeded ________ 294 90.20 2.65 0.32 24.751 wedge, '/16 of 9W'X9Vi"
melon AP, rind removed2 cups, Vi" cubes
Wi-apple________________________________________________________ 200 85.94 1.06 0.56 25.662 medium, 2%"X2Vi" AP, peeled,
pitted, and fibers removed
*Note: "Trace" indicates that values were less than «) 10 International Units for vitamin Avalue; < 0.010 milligram for thiamine and riboflavin; < 0.10 milligram for niacin; < 1 milligramfor ascorbic acid.
"0" in the vitamin A value column indicates that in the absence of any yellow pigmentit was assumed that no carotene or other usable carotenoid pigments were present.
"-" indicates that no determinations were made.Figure in parentheses (p. 54, fat for guava) was estimated in order to supply a carbohydrate
figure_
1 The size of the fruits, shown as length times diameter in inches, includes the skin, i.e., aspurchased, abbreviated AP. The weighr and nutritive values are for the edible portion of thefruit as described, i.e., peeled and pirted or W' cubes, etc., with a few exceptions. See page 27_The measure for each fruit has been rounded so that fractions of fruits or cups are in fourthsor thirds. If more accurare figures are required, use table 1 or 2_
2 Minerals determined on juice; other nutrients on pulp.3 Vitamin values determined on fruit with seeds removed; other values on whole fruit.4 Vitamin values are averages for mixed seedling types; viramin A value varies with color;
typical ascorbic acid value given.5 Vitamin values determined on whole fruit; other values on pulp.6 Vitamin values determined on pulp; orher values on juice.
62

VitaminPhos- A Thia- Ribo- Ascorbic ITEM
Fiber Ash Calcium phorus Iron Value mme flavin Niacin Acid No.
Inter-milli- milli· milli- national milli- milli- milli· milli-
grams grams grams grams grams Units grams grams grams grams
0.19 1.00 5.0 27.0 0.77 689 0.154 0.069 28.1 57
0.29 1.09 18.2
1.66 0.84 20.2
50.0 0.50 1364
43.2 0.62 720
63
0.112 0.118 0.59
0.104 0.030 2.66
18 58
101.2 59

TABLE 4. Portions considered refuse and percentage of refuse
FRUIT
PORTIONS CONSIDERED
REFUSE
PERCENTAGE
OF REFUSE
__38_ 1
55
_ seed and stem end _
_______skin, seeds, and bud end ____bud end _
_ __skin, seeds, and pulp _
__ seeds, stem and blossom ends___.20_ stem and blossom ends__ 3
______seed___________________ __19
_ skin and seed______35___________ skin and seed_ 24
________skin and seed___ 25_skin and seed______ 30
Acerola _
AvocadoBeardslee__HulumanuKahaluu _NabaL
BananaDessert
Bluefields (Gros Michel)_skin 32Brazilian ("Apple")___ _ skin_________ __ __34Chinese (Cavendish)_ __skin_____ __ 34Lacatan_______skin_30Williams Hybrid___skin___ --35
Plantain (Cooking)Largo___________skin__ ------------39Maiamaoli skin__ 26Popoulu___ _ skin__ __ 15
Lreadfruit, ripe__ __skin, stem, and core____ 23Cactus Fruit______________skin, stem and bud ends __ 5Carambola, pulp___seeds_________ 5Carissa____________ _________seeds 7Cherimoya_________ __skin and seeds__ 35Coconut, cream_ ___shell, water, and residue___ 75Fig________ stem end_______________ _ 2Grape, Isabella _ ____skin, seeds, and stem __ 32GrapefruiL__ _ skin, seeds, and membranes__..40Green Sapore___ _ skin and seeds_____________ __ 29
GuavaCattley
Red, seeds removed___ __seeds, stem and blossom ends____ 17Red, whole_______________ stem and blossom ends___________ __ 3Yellow, seeds removed seeds, stem and blossom ends___ __ 13
CommonSeeds removed _Whole _
Java Plum__Ketambilla
Pulp _Whole _
Lime, juice _
(Continued)64

TABLE 4. Portions considered refuse and percentage of refuse (Continued)
FRUIT
PORTIONS CONSIDERED
REFUSE
PERCENTAGE
OF REFUSE
__________skin, seeds, and stem end AO
.44-- - --- ---------------------_37
none_
_skin and seeds__skin and seeds
__skin and seed__ ..44________skin and seed_ __ _ .38
________________ 0
__ __skin, seeds, and fibers 50skin and seeds____ 34stem and cap_____ _ 3_seed, stem and blossom ends 22
__skin and seeds____ .45__seeds and pod___ 69___skin, seeds, and membranes__ 32
Loquat__Lychee
Brewster. _Kwai Mi_
Macadamia NUL
MangoHaden_skin and seed_ _-----33Pirie___skin and seed _ _________34
Mountain Apple__seed and stem end ---- 13Mulberry________none___ 0Ohelo Berry____none__ 0Orange_____skin, seeds, and membranes_ _A9Papaya, Solo
HermaphroditePistillate _
Passion FruitPurple, juice_skin, seeds, and pulp__ ______66Yellow, juice__ __skin, seeds, and pulp 60
Persimmon, Hachiyaskin________________________ __18Pineapple, Smooth Cayenne___skin, crown, and core_A4Plum, Methley__seed______ 7Poha__ ___husks______ _ 6Pummelo or Shaddock. __skin, seeds, and membranes____A4Roselle___seed pods and stem____ ------------------39Soursop
Juice __Pulp _
Strawberry__Surinam Cherry__Sweetsop _Tamarind __Tangerine_Watermelon
Charleston Gray__ skin and seeds_____ _ -------37Chilean Black Seeded __ skin and seeds________37
Wi-apple___________ __ _____skin, seed, and fibers .34
65
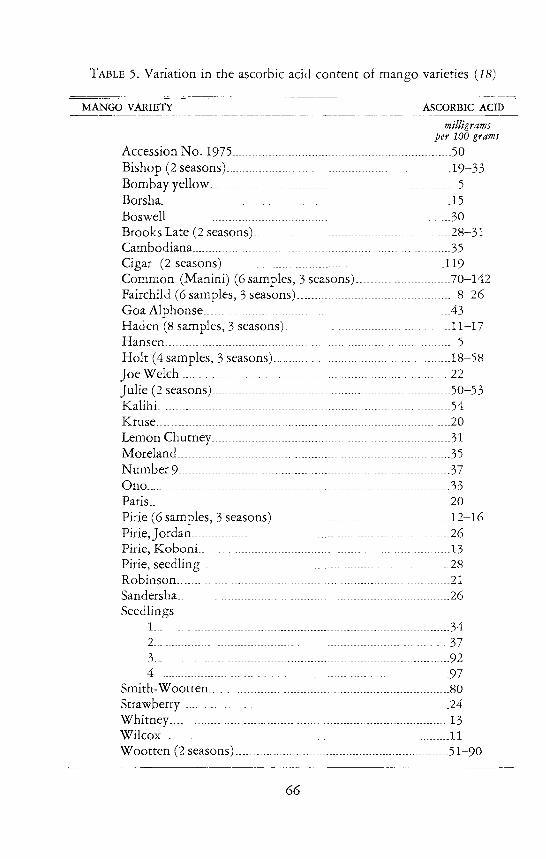
TABLE 5. Variation in the ascorbic acid content of mango varieries (18)
~~~_,c~~~ -~=_--,,~~,==,,_----==~_~-----========
MANGO VARIETY ASCORBIC ACID
milligramsper 100 grams
50-_19-33_ __ 5
_15___ 30
_ 28-31___ 35_119_.70-142
8-26--------- -_.43
__11-17_ 5_18-58
22________50-53
__54__20
__ ___31
-- __ 35- ---------_37
-_33__20
_12-16___ 26
---- --- -------13__ 28
21____26
Accession No. 1975 __ _ _
Bishop (2 seasons)Bombay yellow _Borsha__
BoswellBrooks Late (2 seasons)_Cambodiana _Cigar (2 seasons) _ _ _Common (Manini) (6 samples, 3 seasons) __Fairchild (6 samples, 3 seasons) _Goa Alphonse_________
Haden (8 samples, 3 seasons)_Hansen _
Holt (4 sampIes, 3 seasons)Joe Welch_Julie (2 seasons)Kalihi__ _ __Kruse__ _
Lemon Chutney_Moreland _
Number 9Gno _Paris__ __ _ __ _ _
Pirie (6 samples, 3 seasons)Pirie, Jordan _Pirie, Koboni __Pirie, seedlingRobinson _Sandersha_Seedlings
L__ _ 34
2__________________ ----373___ - - - - - ------ ------- 924 --- ---------- -- - _ --97
Smith-W ootten___ _________80Strawberry________ __________________24Whitney___________ __13Wilcox 11
Wootten (2 seasons) ---------------------------- 51-90------------ -------
66

TABLE 6. Ascorbic acid variations in mangos of the Haden andJoe Welch varieties (18)
JOE WELCH HADEN
Weight, I Ascorbic
I
Weight, AscorbicSample AP*
IAcid Sample AP* Acid
---~-_._~-
milligrams I milligrams
I
grams per 100 grams grams per 100 gramsL_ 328 28.9 L 326 8.72 ---------1 404 26.6 2 333 10.63______ 437 21.4 I 3-- - 350 10.0-------.-- -
II
4__ 377 27.4 4__ _._. 377 7.35__ 430 23.5 5__ ------ 372 8.76__ 357 21.6 I, 6__ ---- .. 390 9.67_____ 390 22.6
i' 7_____ 322 9.4--- II8_ 508 23.7 i' 8__ 263 13.5--- ----- I: .. -.-. ------"---
9- 463 26.2 I: 9- - 293 9.1----
!I- .... ---_.
10__ ! 473 21.9 'I 10_ 248 13.3Mean_ 24.4 I Mean __
-------110.0I: -------
S.D.t- I 2.69:1
S.D.t- 1.99,S.E.t I ! 0.85 S·E.t 0.63
i
., -- --- -----
I i,* AP = "As Purchased." t S.D. = Standard Deviation. :t S.E. = Standard Error.
TABLE 7. Changes in ascorbic acid content of fruit during ripening (19)
FRUIT GREEN HALF-RIPE RIPE
MangoCigar..Common (Manini)Fairchild _Haden__Indian race_Itamaracca __Number 9Philippine type __PiriePirie, seedling_Sandersha _Smith-Wootten _Strawberry_____ _Wootten _
PapayaSeries 1 (large-fruit type) _Series 2 (Solo)_____ _
Poha _
ascorbic acid,milligrams per 100 grams
154 119188 145 114
31 1942 14
61 5653 40
43 37 3025 15
60 50 1460 2833 26
105 7942 24
103 63
40 53 6872 95 10231 36 42
67

APPENDIX:
DESCRIPTION AND TREATMENT OF SAMPLES
The history (origin, cultural practices, handling after harvest, etc.) andpreparation are given for most of the samples. Locations of sources are for theisland of Oahu (City & County of Honolulu) unless stated otherwise. Theweights of samples in pounds are as purchased, and dimensions are given aslength by width or diameter. In general, preparation involved washing the fruitwith tap water and drying with cheesecloth or with an electric fan. All analysesand assays were done on the edible portions only. For percentage of refuse andportions considered refuse see table 4. An electric blender was used for comminuting and mixing the edible portions unless otherwise stated.
Complete descriptions of samples were not available in the data books forsome of the earlier publications. If a description is not given, it should beunderstood that (1) the sample was of good market quality, (2) the variety wasunknown if not listed, and (3) portions taken for assays constituted representative sampling of the whole.
To simplify the main tables, only one figure is given for each nutrient,although analyses may have been done on several samples of a fruit. In thesecases, values were recalculated to a single moisture basis and mean averagesare reported. This accounts for slight differences between these and somepublished figures.
Acerola
Sample 1. Two pounds of fruits from Station Farm, Manoa Valley. Sizerange, Ys to 1 inch in diameter. Ripened at room temperature, refrigeratedovernight. All edible portion blended. Ascorbic acid, thiamine, riboflavin,carotene, and phosphorus assayed.
Sample 2. About 2 pounds of fruits, harvested 2 days later, ftom same source.Same treatment. Proximate composition, calcium, iron, and niacin determined.
Avocado, Beardslee
Sample. Three fruits, weighing S pounds, from Manoa Valley. Size range,Sx4Yz to Sy,jx4y,j inches. Ripened at room temperature. Flesh yellow, smooth,and buttery. All nutrients assayed.
Avocado, Hulumanu
Sample 1. Three fruits, weighing 3% pounds, from Station Farm, Kona,Hawaii. Size range, 6Yz to 8 inches in length. Ripened at room temperature,refrigerated 2 days. Poor quality, flesh slightly bitter and stringy. All edibleportion blended. Thiamine, riboflavin, and niacin assayed (18).
Sample 2. Nine fruits, weighing 12Yz pounds, from Hawaiian AvocadoCompany, Pupukea. One-quarter of each fruit used and mashed with silverfork. Proximate composition and minerals determined (17).
68

Avocado, Kahaluu
Sample. Six fruits, weighing S?4 pounds, from Station Farm, Kona, Hawaii.Size range, 3Ysx3~ to 4Ysx3Ys inches. Ripened at room temperature, refrigerated as they ripened. Excellent quality. Opposite quarters cut into I-inch cubes.Carotene, ascorbic acid, proximate composition, and minerals determined.
Avocado, Nabal
Sample 1. Six fruits, weighing 8 pounds, from Station Farm, Kona, Hawaii.Size range, 4x3Ys to 4Y:2x4~ inches. Ripened at room temperature. Excellentquality. Opposite quarters cut into I-inch cubes. All vitamins except niacinassayed.
Sample 2. Four fruits, weighing 4Y:2 pounds, from Laie. All edible portionmashed with fork. Proximate composition and minerals determined (17).
Banana, Bluefields (Gros Michel)
Sample 1. Three fruits, weighing 1\4 pounds, grown at Waimanalo, purchased at market. Average length, 7 inches. Skin yellow with some brownflecks. All edible portion blended. Thiamine, riboflavin, and niacin assayed (18).
Sample 2. Four fruits of similar description used for carotene (18).Sample 3. Eight fruits from one hand, from Kaneohe. Ascorbic acid
assayed (19).Sample 4. Twelve fruits, weighing 3Y:2 pounds, grown at windward Oahu,
purchased at market. All edible portion mashed with silver fork. Proximatecomposition and minerals determined (17).
Banana, Brazilian (IfApplelf)
This variety is often erroneously called "Apple" banana in Hawaii.Sample 1. Ten fruits from one hand, weighing 3 pounds, grown in Honolulu.
Size range, 6xl?4 to 7x2 inches. Good quality. All edible portion blended.All vitamins determined (18).
Sample 2. Five fruits, weighing lY:2 pounds, grown at windward Oahu,purchased at market. Ripened at room tempetature. Edible portion mashedwith silver fork. Proximate composition and minerals determined (17).
Banana, Chinese (Cavendish)
Sample 1. Five fruits, weighing 1?4 pounds, from Station Farm, ManoaValley. Average size, 6Y:2xIY:2 inches. Yellow with brown specks. All edibleportion blended. Thiamine, riboflavin, and niacin determined (18).
Sample 2. Seven fruits from same source, ripened at room temperature. Alledible portion blended and used for carotene determination (18).
Sample 3. Eight fruits from one hand, from Poamoho. Ascorbic acidassayed (19).
69

Sample 4. Twenty-five fruits from three hands, weighing 7 pounds, grownin Manoa Valley, purchased at market. Size range, 5X1Ys to 6Yzx1Yz inches.Ripened at room temperature. Good quality. Half of each hand blended andminerals determined.
Sample 5. Proximate composition determined (27).
Banana, Lacatan
Sample 1. Sixteen fruits from one hand, weighing 6 pounds, from StationFarm, Poamoho. Size range, 6x1Ys to 6Yzx1'y.j inches. Ripened at room temperature. Excellent quality. Eight fruits blended. Carotene and ascorbic aciddetermined.
Sample 2. Seventeen fruits from one bunch, weighing 4 pounds, from samesource as sampIe 1. Size range, 4Yz X1Ys to 5Ys X 1Ys inches. Ripening processhastened by use of a ripening agent. Good quality. All edible portion blended.Proximate composition and minerals determined.
Banana, Williams Hybrid
Sample. Thirty fruits from two hands, weighing 14 pounds, from StationFarm, Poamoho. Size range, 6X1Yz to 7x1% inches. Ripened at room temperature. Excellent quality. longitudinal half of each banana blended. All nutrientsdetermined.
Banana (Plantain), Largo
Sample 1. Nine fruits, weighing 5 pounds, from Station Farm, Kona,Hawaii. Size range, 6%X2Y:i to 7Y:ix2'y.j inches. Ripened at room temperature.All edible portion blended. All nutrients, except crude fiber and fat, determined.
Sample 2. Twenty-four fruits, weighing 7Y3 pounds, from one bunch,weighing 9Yz to 10 pounds, grown at Station Farm, Honolulu. Flesh chopped.Crude fiber and fat determined (17).
Banana (Plantain), Maiamaoli
Sample. Seven fruits, weighing 5 pounds, from Station Farm, Kona, Hawaii.Average size, 7Yzx2Ys inches. Ripened at room temperature, refrigerated 4 days.All edible portion blended. All nutrients determined.
Banana (Plantain), Popoulu
Sample 1. Five fruits from three hands of one bunch, weighing 1Yz pounds,from Station Farm, Poamoho. Size range, 4Y:ix1}4 to 4YzX2Ys inches. Fleshpinkish-yellow. All edible portion blended. All vitamins determined (18).
70

Sample 2. Four fruits, from one bunch, weighing 2Yz pounds, from StationFarm, Kana, Hawaii. Size range, 5Yzx2Yz to 5~X2Yz inches. Ripened at roomtemperature. All edible portion blended. Proximate composition and mineralsdetermined.
Breadfruit, Ripe
Sample 1. One fruit from tree on University campus. Ripened at roomtemperature, refrigerated 2 days. Thiamine and riboflavin assayed (18).
Sample 2. One fruit from tree on University campus. Ripened at roomtemperature. Chopped and used for carotene assay (18).
Sample 3. Three fruits, weighing 5\0 pounds, from University campus.Size range, 4x4~ to 5Yzx4Yz inches. Ripened at room temperature. Half ofeach fruit used for ascorbic acid and niacin assay (18).
Sample 4. Four, two, and three fruits, weighing 7Yz, 6Yz, and 7 pounds,respectively, from three different trees on University campus. Ripened at roomtemperature. Portions from each used for ascorbic acid assay. Mean ascorbicacid value adjusted for moisture content and averaged with value from sample 3.
Sample 5. Seven fruits from Nuuanu Valley. Chopped. Proximate composition and minerals determined (17).
Cactus Fruit
Sample 1. Twenty-eight fruits, weighing 5Yz pounds, from Waianae foothills.Average size, 3Y:4X2 inches. Refrigerated overnight. Thorns scraped off andedible portion blended. Ascorbic acid, thiamine, riboflavin, and niacin assayed(18).
Sample 2. Eight fruits from same source, prepared as in sample 1, used forcarotene assay (18).
Sample 3. Eleven fruits, weighing 4 pounds, from one plant at AlewaHeights. Size range, 2~X2Y:4 to 3YzX2Yz inches. All edible portion blended andfrozen. Proximate composition and minerals determined.
Carambola
Sample 1. Eighteen fruits, weighing 3Y:4 pounds, from one tree, Honolulu.Size range, 2:v"Xl~ to 3Yzx2Yz inches. Cut and blended. Carotene, thiamine,riboflavin, and niacin assayed (18).
Sample 2. Three lots of three or four fruits each, from different sources,different years. One lot sweet, one semisweet, and one sour. Ascorbic acidassayed. Mean value reported (19).
SampIe 3. Proximate composition determined (27).Sample 4. Twenty-eight fruits, weighing 3 pounds, from Station Farm,
Honolulu. Fruit cut into pieces and juice expressed through six thicknessesof cheesecloth. Minerals determined (17).
71

Carissa
Sample 1. Sixty-four fruits, weighing 2 pounds, from Wilhelmina Rise. Sizerange, 1JAXYs to 2x1Yz inches. All cut and mixed. All vitamins assayed (18).
Sample 2. Five to 6 pounds from Kamehameha Heights. Size range, 1x% to1Ysx1Yz inches. Refrigerated 2 days. About 2 pounds selected at random forsample. Electric grinder used for comminuting. Proximate composition andminerals determined.
Cherimoya
Sample 1. Five fruits, weighing 6 pounds, from Station Farm, Kona, Hawaii.Carters, Chaffey, and Bay varieties with two, two, and one fruit, respectively.Size of Bay, the largest, 3X3Ys inches. All varieties combined. All vitamins,minerals, and protein determined.
Sample 2. Fat determined (27).
Coconut Cream (20)
Nuts gathered over a 4-week period from two adjoining private gardens inManoa Valley husked and examined. Twenty-one heavy nuts selected from alot of 40 for grating. Water drained through pierced eyes, then nuts crackedinto halves. Coconut meat grated, without removal from shell, on a Polynesiangrater, within 3 hours. Entire amount of approximately 7500 grams mixed anddivided into two equal lots, from which two coconut cream samples prepared.
Sample 1. To the first lot 4% cups of drained water from 21 coconuts addedand thoroughly mixed by kneading with hands. About 2-cup quantities placedin one thickness of cheesecloth in a 2-quart, screw-type household press, andas much cream expressed as possible. Cream expressed from entire first lotyielded 2000 milliliters. All nutrients except crude fiber determined.
Sample 2. To the second lot no water added. Cream expressed in samemanner as in sample 1. Cream expressed from entire second lot yielded 1200milliliters. All nutrients except crude fiber determined.
Coconut Water
Sample 1. Sixteen immature nuts from trees on University campus. Yellowgreen husks removed and nuts stored 3 days at 3°C. Water obtained by piercingeyes, filtered before assay. B vitamins determined (18).
Sample 2. Immature nuts from trees on Waialae Golf Course. Top of huskchopped off and small piece of soft shell cut away. Coconut water siphonedoff through glass tube into beaker. Minerals determined (17).
Fig
Sample 1. Two pounds of fruits from one tree in Manoa Valley. Averagesize, 2JAX2Ys inches. All blended. Carotene, thiamine, riboflavin, and niacinassayed (18).
Sample 2. Two lots of four figs each, different years. Ascorbic acid assayed.Mean value reported (19).
72

Sample 3. Eighteen fruits from Punaluu. Chopped for proximate composition, but left whole for ash and mineral determinations (17).
Grape, Isabella
Sample 1. Sixteen bunches, 30 to 40 grapes per bunch, weighing 3 pounds,Oahu-grown. Average size, ~x1'8 inch. Skin and seeds removed. Carotene,thiamine, riboflavin, and niacin determined (18).
Sample 2. Sample taken from several clusters of one lot. Ascorbic acidassayed on pulp only (19).
Sample 3. One bunch, weighing 3 pounds, from Manoa Valley. Fruitsqueezed from skin, and seeds removed with ivory-tipped forceps. Pulp shreddedwith silver fork. Aliquot for iron sample ashed without drying. Proximatecomposition and other minerals determined on material which had been driedat low temperature for several days (17).
Grapefruit
Sample. Twelve fruits, weighing 6 pounds, from Kona, Hawaii, purchasedat market. Size range, 2~x3Y.:i to 2~x3~ inches. Yellow-green skin with darkspots, pale yellow pulp. Membranes removed from all sections and pulpthoroughly mixed. All nutrients determined.
Green Sapote
Sample. Thirty-five fruits, weighing 13 pounds, from Station Farm, Kona,Hawaii. Size range, 3~X2~ to 4X3~ inches. Ripened at room temperatureand refrigerated as they ripened. Sixteen fruits of best quality and same stageof ripeness cut into I-inch cubes. Cut surfaces oxidized. All nutrients determined.
Guava, Cattley, Red
Sample 1. One pound of fruits from Tantalus. Size range, 1'8 to 1 inch indiameter. Pulp scooped out from fruit, and seeds removed by pressing throughsieve. Pulp and shells combined and blended for thiamine, riboflavin, andniacin assays (18).
Sample 2. One and one-half pounds of fruits from Koolau foothills nearLaie. Size range, 1'8 to lY.:i inches in diameter. Whole fruit used but seeds notground. Carotene assayed (18).
Sample 3. Two lots of 10 and 11 fruits each, from two sources. Ascorbicacid assayed. Mean value reported (19).
Sample 4. Five pounds of fruits from Tantalus. Size range, 1 to 1\;2 inchesin diameter. Fruit chopped and dried. Proximate composition and mineralsdetermined. Iron sample taken from slices from several fresh guavas (17).
Guava, Cattley, Yellow
Sample 1. Three and one-third pounds of fruits from Manoa Valley. Sizerange, y,j to 1 inch in diameter. Refrigerated 2 days. Pulp scooped out from
73

fruit and seeds removed by pressing through sieve. Pulp and shells combinedand blended. Thiamine, riboflavin, niacin, and carotene assayed (18).
Sample 2. One pound of fruits from same source, prepared as in sample 1.Size range, 1 to 1Yz inches in diameter. Ascorbic acid assayed (18).
Guava, Common, Seeds Removed
Sample 1. Twelve fruits, weighing 2 pounds, from Station Farm, Poamoho.Size range, 1% to 2Yz inches in length. Sour, red pulp; small fruit. Pulp pressedthrough sieve; seed-free pulp and shells blended. Thiamine, riboflavin, andniacin assayed (18).
Sample 2. Nine fruits of similar description and from same source, preparedas in sample 1, used for carotene assay (18).
Sample 3. Six fruits, weighing 2Yz pounds, from Station Farm, Poamoho.Size range, 2~ to 3~ inches in length. Fairly sweet, white pulp, yellow shell.Prepared as in sample 1. Thiamine, riboflavin, and niacin assayed (18).
Sample 4. Ten fruits of same description and from same source as sample 3,prepared as in sample 1, used for carotene assay (18).
Sample 5. Six fruits, weighing 2Yz pounds, from Station Farm, Poamoho.Size range, 2% to 3% inches in length. Fairly sweet, pink pulp, green shell.Prepared as in sample 1. Thiamine, riboflavin, and niacin assayed (18).
Sample 6. Nine fruits of same description and from same source as sample 5,prepared as in sample 1, used for carotene assay (18).
Vitamin values reported are adjusted mean values of samples 1 through 6.A typical value for ascorbic acid is given.Sample 7. Three fruits from Manoa Valley. Lengthwise section of a fruit
taken for each determination; seeds carefully removed and cleaned of alladhering flesh before being discarded. Proximate composition and mineralsdetermined (17).
Guava, Common, Whole
Sample 1. Seventeen fruits, weighing 3% pounds, from Station Farm, Poamoho. Size range, 2x1Ys to 4Yzx2Ys inches. Pink pulp, yellow shell. Fruits cutinto sections; seeds part of sample but did not break during analyses. Thiamine,riboflavin, and niacin assayed (18).
Sample 2. One hundred samples from different areas on Oahu. Ascorbicacid assayed. Range of values reported (19).
Sample 3. Twelve fruits, weighing 2 pounds, from Waimanalo. Fruit chopped,except aliquot used for iron determination, which consisted of representativeslices cut from several guavas. Proximate composition and minerals determined(17).
Java Plum
Sample 1. Eight and three-fourths pounds of fruits from Manoa Valley.Average size, 1VB X Ys inches; purple skin, white flesh, good quality. All edibleportion blended. Thiamine and niacin determined (18).
74

Sample 2. Four pounds of fruits from same source as sample 1 used forcarotene assay. Prepared as in sample 1 (18).
Sample 3. One sample of 10 small and 10 large, white-fleshed fruits fromMolokai. Ascorbic acid assayed (19).
Sample 4. Fruits from Kailua. Proximate composition and minerals determined.
Ketambilla
Sample 1. Two and one-third pounds of fruits, grown on Oahu. Averagesize, 3;4xYs inch. Some very ripe, some slightly green. All edible portionblended. All vitamins assayed (18).
Sample 2. One and one-fourth pounds of fruits from Waipahu. Size range,Y:2XYs to Ysx% inch. Slightly green fruits. All frozen. All blended and filteredthrough coarse cloth, known locally as "poi cloth." Juice only used. Proximatecomposition and minerals determined.
Lime, Juice
Sample 1. Two and three-fourths pounds of fruits, Mexican variety, purchased at market. Size range, 1~ to 1% inches in diameter. Juice filtered throughone thickness of cheesecloth. Thiamine, riboflavin, and niacin determined (18).
Sample 2. Thirty-seven fruits, Kusaie variety, weighing 2 pounds, purchasedat market. Size range, 1~X1 to l%xl% inches. Prepared as in sample 1.Ascorbic acid determined (18).
Sample 3. Protein, fiber, and ash determined (27).Sample 4. Twenty-two fruits, Kusaie variety, weighing 2 pounds, from
Station Farm, Manoa. Collected from one tree over a period of 1 week. Sizerange, 1~X1Ys to 1YRxl% inches. Prepared as in sample 1. Minerals and fatdetermined.
Loquat
Sample 1. Twenty-one fruits, weighing 1Yz pounds, from Kula, Maui. Sizerange, l%xlYs to 2~xIY8 inches. Refrigerated over weekend. Good quality.Peeled and blended. Vitamins and minerals determined.
Sample 2. Seven pounds of fruits from same source as sample 1. Size range,l%xIY:2 to 2Y:2x2 inches. Refrigerated overnight. All peeled, quartered, andmixed thoroughly. Vitamins and minerals determined.
Adjusted mean values of samples 1 and 2 reported.Sample 3. Proximate composition determined (27).
Lychee, Brewster
Sample 1. Three and one-half pounds of fruits from Station Farm, Poamoho.Thiamine, niacin, and riboflavin assayed (18).
Sample 2. Nine and 13 fruits from same source as sample 1, a year apart,used for ascorbic acid (18).
Sample 3. Five pounds of fruits from Station Farm, Poamoho. Size range,
75

l¥SXlYs to lYsxlU; inches. Edible portion blended and frozen. Proximate composition and minerals determined.
Lychee, Kwai Mi
Sample 1. Three pounds of fruits from lower Nuuanu Valley. Size range,l¥SxlYs to lY2xH:i inches. Harvested night before analyses started. Half ofeach fruit used. Ascorbic acid, thiamine, riboflavin, and niacin assayed.
Sample 2. Three and one-half pounds of fruits from Station Farm, Honolulu.Edible portion dried for several days at low temperature. Sample for irondetermination used without drying. Proximate composition and mineralsdetermined (17).
Macadamia Nut
Sample 1. Roasted, salted nuts packed by the Hawaiian Macadamia NutFactory. Salt removed from nuts. Cut and mixed. B vitamins determined (18).
Sample 2. Roasted, unsalted nuts from two 12-ounce jars from same sourceas sample 1. Cut into very thin slices with stainless steel knife on bakeliteboard, and mixed. Proximate composition and minerals determined (15).
Sample 3. Three 12-ounce jars of nuts of same description and source assample 2, obtained 3 months later. Proximate composition and mineralsdetermined (15).
Adjusted mean values of samples 2 and 3 reported.
Mango, Haden
Sample 1. Three fruits, weighing 2 pounds, from Station Farm, Poamoho.Size range, 3 to 4Y2 inches in length. Ripened at room temperature. All edibleportion blended. Thiamine, riboflavin, and niacin assayed (18).
Sample 2. Three fruits, weighing 2 pounds, from Kauai. Size range, 3 to4Y2 inches in length. Ripened at room temperature. All edible portion blended.Riboflavin and niacin assayed (18).
Adjusted mean values of samples 1 and 2 reported.Sample 3. Three fruits from Station Farm, Poamoho. Carotene assayed (18).Sample 4. Ten fruits, each assayed for ascorbic acid. Mean value reported (18).Sample 5. Fifteen fruits, weighing 10 pounds, from 10 trees at Station Farm,
Poamoho. Size range, 3%x3~ to 4Y2x3Ys inches. Ripened at room temperature.All edible portion blended. Proximate composition and minerals determined.
Mango, Pirie
Sample 1. Seven fruits, weighing 3 pounds, from Station Farm, Poamoho.Size range, 3 to 3Y2 inches in length. Ripened at room temperature. All edibleportion blended. Thiamine, riboflavin, and niacin assayed (18).
Sample 2. Three fruits from same source as sample 1. Carotene assayed(18).
Sample 3. Two to four fruits from three sources, 3 seasons. Ascorbic acidassayed. Mean value reported (19).
76

Sample 4. Ten fruits, weighing 4Y3 pounds, from Station Farm, Honolulu.Ripened at room temperature and refrigerated 2 days. Sliced and chopped.Proximate composition, calcium, and phosphorus determined (17).
Sample 5. Iron assayed on another sample, 1 week later (17).
Mountain Apple
Sample 1. Three pounds of fruits from Manoa Valley, purchased at market.Size range, lYzXl~ to 2xlYz inches. Chopped coarsely. Thiamine and niacinassayed (18).
Sample 2. Twelve fruits, weighing 1 pound, from same source as sample 1.Riboflavin assayed (18).
Sample 3. Ten fruits from Nuuanu Valley. Ripened at room temperaturefor 2 days, refrigerated overnight. Ascorbic acid assayed (18).
Sample 4. Twenty-nine fruits, weighing 4 pounds. Slices dried in electricoven on enamel triJ.ys at temperature under 65°C. Proximate composition andminerals determined. For iron determination, fresh sample used (17).
Mulberry
Sample 1. One and one-half pounds of fruits from Makiki. All blended.All vitamins determined (18).
Sample 2. Two pounds of fruits from Ewa Refrigerated over weekend.Excellent quality, all blended. Proximate composition and minerals determined.
Ohelo Berry
Sample 1. Two and one-third pounds of fruits from Hawaii National Park,Hawaii, via airfreight. Size range, ~ to Yz inch in diameter. Good quality.Carotene, thiamine, riboflavin, and niacin assayed (18).
Sample 2. Two lots from Volcano District, Hawaii, 2 seasons. Ascorbicacid assayed. Mean value reported(19).
Sample 3. Four pounds of fruits from Hawaii National Park, Hawaii, viaairfreight. Size range, ~xl4 to YzxYz inch. Frozen upon receipt. All blended.Proximate composition and minerals determined.
Orange
Sample 1. Seven fruits, weighing 3 pounds, purchased at market. Size,3x3Yz inches. Skin and membranes removed from sections, and pulp blended.Carotene, thiamine, riboflavin, and niacin assayed (18).
Sample 2. Five fruits, weighing 1Yz pounds, from Kona, Hawaii, purchasedat market. Slightly sour. Average size, 2~X2:Y;; inches. Prepared as in sample 1.Ascorbic acid assayed (18).
Sample 3. Twelve fruits from Kealakekua, Hawaii. Sections without surrounding membranes used. Not possible to chop or mash sections withoutlosing comparatively large quantities of juice, so true composite sample notprepared. Where more than one section used, these taken from several differentfruits. Proximate composition and minerals determined (17).
77

Papaya, Solo, Hermaphrodite
Sample 1. Four fruits, weighing 2Y2 pounds, from Station Farm, Poamoho.Size range, 4Y2 to 5Y2 inches in length. Edible portion blended. Thiamine,riboflavin, and niacin assayed (18).
Sample 2. Five fruits, weighing 5~ pounds, purchased at market. Thiamine,riboflavin, niacin, and carotene assayed (18).
Adjusted mean values of samples 1 and 2 reported for B vitamins.Sample 3. Forty-five samples from Station Farm, Poamoho, and 40 samples
from Kailua, collected at weekly intervals over period of 1 year, except formonth of August. Ascorbic acid assayed. Mean value reported (19).
Sample 4. Five fruits, weighing 5 pounds, from Station Farm, Waimanalo.Size range, 4~x3 to 5~x4 inches. Ripened at room temperature. Each fruitquartered, then one slice from each quarter pooled and blended. Proximatecomposition and minerals determined.
Papaya, Solo, Pistillate
Sample 1. Four fruits, weighing 3~ pounds, from Station Farm, Poamoho.Size range, 31'2 to 4 inches in length. All edible portion blended. Thiamine,riboflavin, and niacin assayed (18).
Sample 2. Five fruits, weighing 81'2 pounds, from Station Farm, Waimanalo.Ripened at room temperature. Each fruit quartered, then one slice from eachquarter pooled and blended. Proximate composition, minerals, ascorbic acid,and carotene assayed.
Passion Fruit, Purple, Juice
Sample 1. Five and one-half pounds of fruits from Kokee, Kauai. Size range,l~XI1'2 to 2xlYs inches. Ripened at room temperature. Pulp and seedssqueezed through two thicknesses of cheesecloth. All vitamins assayed (18).
Sample 2. Eighty-six fruits, weighing 7 pounds, from Station Farm, Kona,Hawaii. Fruit cut in half, pulp and seeds removed from shell with silver spoon.Pulp and seeds squeezed through four thicknesses of cheesecloth. Protein andminerals determined (17).
Sample 3. Fifteen fruits, from Kokee, Kauai. Size range, l1'2xl1'2 to l~xI1'2
inches. Prepared as in sample 1. Fat and crude fiber determined.
Passion Fruit, Yellow, Juice
Sample 1. Sixty-three fruits, weighing 6 pounds, from Oahu. Harvestedover a 3-week period and refrigerated until analyzed. Pulp and seeds squeezedthrough two thicknesses of cheesecloth. Thiamine, riboflavin, niacin, andcarotene assayed (18).
Sample 2. Two lots, four fruits each, from two sources, 2 seasons. Ascorbicacid assayed. Mean value reported (19).
78

Sample 3. Eight 8-ounce jars of juice from Station Food Processing Laboratory. Juice prepared in pilot-plant juicer, pulp and juice separated from seedsand frozen in plastic bags for 4 months. One bag thawed to fill jars and refrozenbefore being transferred to Foods and Nutrition Department. Proximatecomposition and minerals determined.
Persimmon, Hachiya
Sample. Thirteen seedless fruits, weighing 5 pounds, grown on Maui,purchased at market. Size range, 2Yix2Yi to 3X2~ inches. Ripened at roomtemperature. Peeled, separated into sections, cut crosswise, and mixed. Allnutrients determined.
Pineapple, Smooth Cayenne
Sample 1. Three fruits from Pineapple Research Institute of Hawaii, Honolulu. Cross-section slices taken from fruits and blended. Riboflavin and niacinassayed (18).
Sample 2. Three fruits from Pineapple Research Institute of Hawaii, Honolulu. Opposite longitudinal quarters used. Thiamine, carotene, and ascorbic acidassayed (18).
Sample 3. Four fruits, weighing 28 pounds, grown at Wahiawa. Size range,8Yz to 9Yz inches in length, 5 to 6 inches in diameter. Edible portion diced.Proximate composition and minerals determined (17).
Plum, Methley
Sample 1. Forty-five fruits, weighing 2 pounds, from Kokee, Kauai, purchased at market. Size range, 1Ys Xl Ys to 1Yz Xl YH inches. Edible portion, including skin, cut from seeds. Thiamine, niacin, and carotene assayed (18).
Sample 2. Forty pounds of fruits from Kokee, Kauai. About 5 poundsrandomly picked for analyses. Size range, ly,jxlYs to l~XIYs inches. Skinremoved and analyzed separately from flesh; flesh blended. Proximate composition and minerals determined separately on skin and flesh but calculated forwhole fruit. Ascorbic acid and riboflavin assayed on whole fruit.
Poha
Sample 1. One pound of fruits grown on Hawaii, purchased from wholesaler.All edible portion blended. Thiamine and riboflavin assayed (18).
Sample 2. Two pounds of fruits from same source as sample 1. Size range,berries, Ysx Ys to ~ x~ inch. All edible portion blended. Niacin and caroteneassayed (18).
Sample 3. Two lots of eight or nine representative berries each, fromVolcano Disttict, Hawaii. Ascorbic acid assayed 36 hours after harvest. Meanvalue reported (19).
Sample 4. Two 4-pound lots of fruits from Kona, Hawaii, 3 months apart.Proximate composition, calcium, and phosphorus determined on material which
79

had been dried for several days at low temperature and ground in a glass mortar.Fresh material without previous drying ashed for iron determinations (17).
Pummelo or Shaddock
Sample 1. Two fruits, weighing 7 pounds, grown in Manoa Valley. Size,6Y2x5 and 6Y2x6 inches. Juicy and sour. Skin and membranes removed andpulp blended. Riboflavin and niacin assayed (18).
Sample 2. Three fruits, weighing 811z pounds, from Station Farm, Poamoho.Thiamine assayed (18).
Sample 3. Three fruits, weighing 7Y2 pounds, from Station Farm, Poamoho.Size range, 5~x5Y2 to 5Y2x5% inches. Ripened at room temperature. Skin andmembranes removed. Proximate composition, minerals, and ascorbic aciddetermined.
Roselle
Sample 1. Six pounds of fruits from Station Farm, Manoa Valley. Sizerange, lx% to 2xl~ inches. Only calyxes used. Cut coarsely and mixed.Thiamine, riboflavin, niacin, and carotene assayed (18).
Sample 2. One pound of fruits from same source as sample 1. Calyxes cutcoarsely. Ascorbic acid assayed (18).
Sample 3. Proximate composition determined (27).
Soursop
Sample 1. Two fruits, weighing 4 pounds, grown in Honolulu. Size range,5Y2x4Y2 to 8Y2x3Y2 inches. One fruit riper than other. Fruit pulp first pressedthrough colander, then squeezed through cheesecloth. Ascorbic acid, thiamine,riboflavin, and niacin assayed (18).
Sample 2. One fruit, weighing 4Y3 pounds, from Station Farm, Honolulu.Size, llx5Y2 inches. Ripened at room temperature. Fruit peeled, seeds removed,and flesh sliced and chopped. Proximate composition and minerals determined(17).
Strawberry
Sample 1. Two pounds of fruits grown at Kaneohe, purchased from wholesaler. Size range, Y2x% to lY:ixl inch. Good quality. Cut coarsely. All vitaminsassayed (18).
Sample 2. One pound of fruits from Kaneohe. Chopped. Proximate composition and minerals determined (17).
Surinam Cherry
Sample 1. Two %-pound samples of fruits harvested 4 days apart at StationFarm, Poamoho. Average size, Ysxl inch. Good quality. Riboflavin, niacin, andascorbic acid assayed on one sample, thiamine and carotene on other (18).
80

Sample 2. One and one-half pounds of fruits from Station Farm, Honolulu.Proximate composition and minerals determined (17).
Sweetsop
Sample 1. Five fruits, weighing 2 pounds, from Alewa Heights. Size range,2Yzx2% ro 2% x3Y4 inches. Ripened at room temperature, refrigerated as theyripened. Three good, two fair quality. All edible portion blended. Ascorbicacid, thiamine, riboflavin, and niacin determined.
Sample 2. One fruit weighing 1 pound from same tree as sample 1. Size,3%x4Y4 inches. Excellent quality. Edible portion blended. Minerals determined.
Sample 3. Proximate composition determined (27).Sample 4. Proximate composition determined (27).Adjusted mean values of samples 3 and 4 used.
Tamarind
Sample 1. Nine pounds of fruits from trees in Manoa Valley. Average size,4x% inches. Fair quality. Edible portion scraped from seeds. Thiamine, riboflavin, niacin, and ascorbic acid assayed (18).
Sample 2. Four and one-half pounds of fruits from tree at Punahou School.Shell removed from fruit, sticky pulp scraped from seeds. Proximate composition and minerals determined (17).
Tangerine
Sample 1. Twelve fruits, weighing 3 pounds, grown in Puna, Hawaii,obtained through wholesaler. Size range, lYzX2Ys to 1%x2Yz inches. Goodquality. Refrigerated 1 week. Fruits peeled, membranes removed from eachsection, and pulp from entire sample mixed. Ascorbic acid, thiamine, riboflavin,and calcium assayed.
Sample 2. Twenty-four fruits, weighing 5Yz pounds, Hawaii-grown, purchased at market. Size range, lYsx2Yz to lYsx2% inches. Good quality. Refrigerated overnight. Prepared as in sample 1. Carotene, niacin, phosphorus, iron,and proximate composition determined.
Watermelon, Charleston Gray
Sample. Five melons, weighing 120 pounds, from Station Farm, Waimanalo.Size range, 14Yzx7Yz to 20x9 inches. Excellent quality. Refrigerated 4 days.Edible portion from opposite one-eighth longitudinal sections blended. Allnutrients except niacin determined.
Watermelon, Chilean Black Seeded
Sample 1. Four I-pound wedges from two melons grown at Kahuku,purchased at market. Good quality. Riboflavin and niacin assayed (18).
81

Sample 2. Three melons from Waimanalo, medium-size, with green skin,black seeds. Wedges taken from each, totaling 4 pounds. Thiamine and carotene assayed (18).
Sample 3. Two melons, one each from Maui and Oahu. Ascorbic acidassayed on flesh from stem ends, centers, and bud ends. Mean of 14 assaysreported (19).
Sample 4. Two melons, weighing 38 pounds, from wholesaler. Flesh diced.Proximate composition and minerals determined (17).
Wi-apple
Sample 1. Eight fruits, weighing 3 pounds, from tree in Honolulu. Sizerange, 2Y-4 to 3Y-4 inches in length. Ripened at room temperature. All edibleportion blended. Thiamine, riboflavin, and niacin assayed (18).
Sample 2. Thirteen fruits from same source as sample 1. Carotene andascorbic acid assayed (18).
Sample 3. Thirteen fruits, weighing 4V2 pounds, from tree in Honolulu.Size range, 2Ysx2Ys to 3x2Ys inches. Foley food mill used to prepare pulp.Protein, ash, and minerals determined.
Sample 4. Proximate composition determined (27).Adjusted mean protein and ash values reported.
82

LITERATURE CITED
(1) ASSOCIATION OF OFFICIAL AGRICULTURAL CHEMISTS.
1955. OFFICIAL METHODS OF ANALYSIS. 8th ed. Washington, D. C. 1008 pp.
(2) ASSOCIATION OF VITAMIN CHEMISTS, INC.
1951. METHODS OF VITAMIN ASSAY. 2nd ed. Interscience Publishers, Inc., New
York. 301 pp.
0) CALLISON, E. C.1953. COMPARISON OF CHEMICAL ANALYSIS AND BIOASSAY AS MEASURES OF
VITAMIN A VALUE: YELLOW CORN MEAL.]' Nutr. 50: 85-100.
(4) DEUEL, H.]., and A. D. HOLMES.
1920. DIGESTIBILITY OF AVOCADO AND CERTAIN OTHER OILS. Science 51:
397-398.
(5) FISKE, C. H., and Y. SUBBAROW.
1925. THE COLORIMETRIC DETERMINATION OF PHOSPHORUS. J. BioI. Chern.
66: 375-400.
(6) HUME, E. M., and H. A. KREBS.
1949. VITAMIN A REQUIREMENT OF HUMAN ADULTS: EXPERIMENTAL STUDY
OF VITAMIN A DEPRIVATION IN MAN. Med. Res. Council Spec. Rept.,
Series 264. 145 pp.
(7) INGOLS, R. S., and P. E. MURRAY.
1949. UREA HYDROLYSIS FOR PRECIPITATING CALCIUM OXALATE. Analyt. Chern.
21: 525-527.
(8) ISLES, T. V. Y.
1915. CHEMICAL CHANGES IN THE RIPENING COCONUT. Philippine Agr. and
Forester 4: 109-115.
(9) LEUNG, WOOT-TsUEN Wu, and M. FLORES.
1961. FOOD COMPOSITION TABLE FOR USE IN LATIN AMERICA. Interdepartmental
Committee on Nutrition for National Defense, National Institutes of
Health, Bethesda, Maryland, U.S.A. 145 pp.
(10) ---, R. K. PECOT, and B. K. WATT.
1952. COMPOSITION OF FOODS USED IN FAR EASTERN COUNTRIES. U.S. Dept.
Agr. Handbk. 34. 62 pp.
(11) MARKLEY, K. S., and R. M. HANN.
1925. A COMPARATIVE STUDY OF THE GUNNING-ARNOLD AND WINKLER BORIC
ACID MODIFICATIONS OF THE KJELDAHL METHOD FOR THE DETERMINA
TION OF NITROGEN.]' Assoc. Offic. Agr. Chern. 8: 455-567.
(12) MATTILL, H. A.
1916. THE DIGESTIBILITY OF THE FAT OF THE AVOCADO. California Avocado
Assoc. Yrbk. Pp. 93-95.
(13) MERRILL, A. L., and B. K. WATT.
1955. ENERGY VALUE OF FOODS ... BASIS AND DERIVATION. U.S. Dept. Agr.
Handbk. 74. 105 pp.
(14) MILLER, C. D.
1929. FOOD VALUES OF BREADFRUIT, TARO LEAVES, COCONUT AND SUGAR CANE
Bernice P. Bishop Museum Bull. 64. 23 pp.
83

(15)
1961. NUTRITIVE VALUE OF MACADAMIA NUTS. California Macadamia Soc.
Yrbk. 7: 46-47.
(16) --, K. BAZORE, and M. BARTOW.
1965. FRUITS OF HAWAII. 4th ed. Univ. Hawaii Press, Honolulu. ix+229 pp.
(17) --, K. BAZORE, and R. C. ROBBINS.
1936. SOME FRUITS OF HAWAII: THEIR COMPOSITION, NUTRITIVE VALUE AND
USE IN TESTED RECIPES. Hawaii Agr. Exp. Sta. Bull. 77. 133 pp.
(18) ---, B. BRANTHOOVER, N. SEKIGUCHI, H. DENNING, and A. BAUER.
1956. VITAMIN VALUES OF FOODS USED IN HAWAII. Hawaii Agr. Exp. Sta. Tech.
Bull. 30. 94 pp.
(19) ---, L.ioUIS, and K. YANAZAWA.
1947. VITAMIN VALUES OF FOODS IN HAWAII. Hawaii Agr. Exp. Sta. Tech.
Bull. No.6. 56 pp.
(20) MURAL, M., F. PEN, and C. D. MILLER.
1958. SOME TROPICAL SOUTH PACIFIC ISLAND FOODS. Hawaii Agr. Exp. Sta.
Bull. 110. Univ. Hawaii Press, Honolulu. xii + 159 pp.
(21) NATIONAL ACADEMY OF SCIENCES-NATIONAL RESEARCH COUNCIL.
1964. RECOMMENDED DIETARY ALLOWANCES. 6th rev. ed. Washington, D. C.PubI. 1146. vii+59 pp.
(22) NELSON, E. K.1925. THE NON-VOLATILE ACIDS OF THE STRAWBERRY, THE PINEAPPLE, THE
RASPBERRY, AND THE CONCORD GRAPE. ]. Amer. Chern. Soc. 47:
1177-1179.
(23) NUTRITION REVIEWS.
1954. CAROTENE UTILIZATION. 12: 59-60.
(24) PRATT, D. S., and]. 1. DEL ROSARIO.
1913. PHILIPPINE FRUITS: THEIR COMPOSITION AND CHARACTERISTICS. Philip
pine]. Sci. 8: Sec. A, 59-80; illus.
(25) SANTINI, R., JR.
1953. IDENTIFICATION AND DETERMINATION OF POLYBASIC ORGANIC ACIDSPRESENT IN WEST INDIAN CHERRIES (Malpighia puncifolia L.) AND IN
THREE VARIETIES OF GUAVA (Psidium guajava). J. Agr. Univ. Puerto
Rico 37: 195-198.
(26) SAYWELL, L. G., and R. B. CUNNINGHAM.
1937. DETERMINATION OF IRON: COLORIMETRIC O-PHENANTHROLINE METHOD.
Indus. Engin. Chern., Analyt. Ed. 9: 67-69.
(27) THOMPSON, A. R.
1915. THE COMPOSITION OF HAWAIIAN FRUITS AND NUTS. In: REPORT OF THE
HAWAII AGRICULTURAL EXPERIMENT STATION. 1914. U.S. Govt. Printing
Office, Washington, D. C. Pp. 62-73.
(28) UNITED STATES DEPARTMENT OF AGRICULTURE, AGRICULTURAL RESEARCH
SERVICE, HUMAN NUTRITION RESEARCH BRANCH.
1952. Personal communication.
(29) WILDER, G. P.
1931. FLORA OF RAROTONGA. Bernice P. Bishop Museum Bull. 86. 113 pp.;illus.
84

Acerolacomposition, 30, 36, 50desctiption and nutritive value, 14refuse, 64sample description, 68
Analytical methods, 9-10
Ascorbic acidanalytical method, 10in fruit during ripening, 67in Haden and Joe Welch mangos, 67in mango varieties, 66scale for rating, 13variation, 28-29...;
Ash, totalanalytical method, 9
Avocadocomposition, 30, 36, 50description and nutritive value, 15refuse, 64sample description, 68-69
Bananacomposition, 30, 36-38, 50~52
description and nutritive value, 15refuse, 64sample description, 69-71
Breadfruitcomposition, 30, 38, 52description and nutritive value, 16refuse, 64sample description, 71
Cactus Fruitcomposition, 30, 38, 52description and nutritive value, 16refuse, 64sample description, 71
Calciumanalytical method, 9scale for rating, 12
Carambolacomposition, 30, 38, 52description and nutritive value, 16refuse, 64sample description, 71
Carbohydratecalculation, 10-11
Carissacomposirion, 30, 38, 52description and nutritive value, 16-17refuse, 64sample descriprion, 72
Caroreneanalytical method, 10conversion factor to viramin A value, 11scale for rating, 13
INDEX
Cherimoyacomposition, 30, 40, 52description and nutritive value, 17refuse, 64sample description, 72
Coconut, cream and watercomposition, 30, 40, 52description and nutritive value, 17refuse, 64sample description, 72
Comparison with fruits grown elsewhere, 28
Composition, rabIes, 30, 36, 50
Conclusions, 29
Conversion factors, 10-11
Crude fiberanalytical method, 9
Data, sources of, 8
Description, 11see also listing under each fruit, pp, 14-27,and in Appendix, pp. 68-82
Experimental procedure, 8-11
Fatanalytical merhod, 9
Figcomposition, 30, 40, 54description and nutritive value, 18refuse, 64sample description, 72-73
Food energycalculation, 10-11
Grape, Isabellacomposition, 30, 40, 54description and nutritive value, 18refuse, 64sample description, 73
Grapefruitcomposition, 30, 40, 54description and nutritive value, 18refuse, 64sample description, 73
Green Saporecomposition, 30, 40, 54description and nutririve value, 18refuse, (,4sample description, 73
Guava, Cattley, Red and Yellowcomposition, 32, 40, 54description and nutntive value, 18-19refuse, 64sample description, 73-74
85

Guava, Commoncomposition, 32, 42, 54description and nutritive value, 19refuse, 64sample description, 74
Ironanalytical method, 9scale for rating, 12
Java Plumcomposition, 32, 42, 54description and nutritive value, 19refuse, 64sample description, 74-75
Ketambillacomposition, 32, 42, 54description and nutritive value, 19refuse, 64sample description, 75
Limecomposition, 32, 42, 54description and nutritive value, 20refuse, 64sample description, 75
Literature cited, 83-84Loquat
composition, 32, 42, 54description and nutritive value, 20refuse, 65sample description, 75
Lycheecomposition, 32, 42, 56description and nutritive value, 20refuse, 65sample description, 75-76
Macadamia Nutcomposition, 32, 42, 56description and nutritive value, 20-21refuse, 65sample description, 76
Mangoascorbic acid changes in ripening, 67ascorbic acid in Haden and Joe Welch, 67ascorbic acid in mango varieties, 66composition, 32, 42-44, 56description and nutritive value, 21refuse, 65sample description, 76-77
Minerals, 12-13see also listings under Calcium, Phosphorus,and Iron
Moistureanalytical method, 9
86
Mountain Applecomposition, 32, 44, 56description and nutritive value, 21refuse, 65sample description, 77
Mulberrycomposition, 32, 44, 56description and nutritive value, 21-22refuse, 65sample description, 77
Niacinanalytical method, 10scale for rating, 13
Nutritive value, summary, 11-14see also description for each fruit, pp. 14-27
Ohelo Berrycomposition, 32, 44, 56description and nutritive value, 22refuse, 65sample description, 77
Orangecomposition, 32, 44, 58description and nutritive value, 22refuse, 65sample description, 77
Papayaascorbic acid changes in ripening, 67composition, 32, 44, 58description and nutritive value, 22-23refuse, 65sample description, 78
Passion Fruitcomposition, 32, 44-46, 58description and nutritive value, 23refuse, 65sample desctiption, 78-79
Persimmoncomposition, 34, 46, 58description and nutritive value, 23tefuse, 65sample description, 79
Phosphorusanalytical method, 9scale for rating, 12
Pineapplecomposition, 34, 46, 58desctiption and nutritive value, 23-24tefuse, 65sample description, 79
Plum, Methleycomposition, 34, 46, 58description and nuttitive value, 24tefuse, 65sample description, 79

Pohaascorbic acid change in ripening, 67composition, 34, 46, 60description and nutritive value, 24refuse, 65sample description, 79-80
Proteinanalytical method, 9conversion facror, 10
Pummelo or Shaddockcomposition, 34, 46, 60description and nutritive value, 25refuse, 65sample description, 80
Refuse, table, 64-65
Results and discussion, 27-29
Riboflavinanalytical method, 10scale for rati ng, 13
Rosellecomposition, 34, 46, 60description and nutritive value, 25refuse, 65sample desctiption, 80
Samples analyzed, 68--82Jee alJo description for each fruit, pp. 14--27
Shaddock, Jee Pummelo
Soursopcomposition, 34, 46, 60description and nutritive value. 25refuse, 65sample description, 80
Strawberrycomposition, 34, 46, 60description and nutritive value, 25refuse, 65sample description, 80
Summary, 29
87
Surinam Cherrycomposition, 34, 46, 60description and nutritive value, 25-26refuse, 65sample description, 80-81
Sweetsopcomposition, 34, 46, 60description and nutririve value, 26refuse, 65sample description, 81
Tables, Jee listing in Contents, p.
Tamarindcomposition, 34, 48, 60description and nutritive value, 26refuse, 65sample description, 81
Tangerinecomposition, 34, 48, 60description and nutritive value, 2(,refuse, 65sample description, 81
Thiamineanalytical method, 10scale for rating. 13
Vitamin A value, see Carotene
Vitamin C, see Ascorbic acid
Watermeloncomposition, 34, 48, 62description and nutritive value, 27refuse, 65sample description, 81-82
Wi-applecomposition, 34, 48, 62description and nutritive value, 27refuse, 65sample description, 82

UNIVERSITY OF HAWAIICOLLEGE OF TROPICAL AGRICULTURE
HAWAII AGRICULTURAL EXPERIMENT STATIONHONOLULU, HAWAII
THOMAS H. HAMILTONPresident of the University
C. PEAIRS WILSONDean of the College and
Director of the Experiment Station
G. DONALD SHERMANAssociate Director of the Experiment Station