
MÄLARDALEN UNIVERSITY - DiVA portalmdh.diva-portal.org/smash/get/diva2:433705/FULLTEXT01.pdf ·...
57
MÄLARDALEN UNIVERSITY School of Sustainable Development of Society and Technology MIMA-International Marketing Master Thesis in Business Studies 15 higher education credits Advanced Level 2011 2011-05-30 ORGANIC FOOD CONSUMERS’ LIFESTYLE IN SWEDEN Authors: Namik Akman (1983-09-06) Akapon Tongprasert (1983-01-13) Supervisor: Jean-Charles Languilaire Examiner: Ole Liljefors
Transcript of MÄLARDALEN UNIVERSITY - DiVA portalmdh.diva-portal.org/smash/get/diva2:433705/FULLTEXT01.pdf ·...

MÄLARDALEN UNIVERSITY
School of Sustainable Development of Society and Technology MIMA-International Marketing Master Thesis in Business Studies 15 higher education credits Advanced Level 2011
2011-05-30
ORGANIC FOOD CONSUMERS’ LIFESTYLE IN SWEDEN
Authors: Namik Akman (1983-09-06) Akapon Tongprasert (1983-01-13)
Supervisor: Jean-Charles Languilaire Examiner: Ole Liljefors

i
Acknowledgement
Our master thesis is conducted as a part of International Marketing program at Mälardalen
University during the year 2011 in Sweden.
First of all, we are very grateful to our supervisor, Jean Charles Languilaire for the guidance,
patience, encouragement and everything that help us to complete this master thesis.
We also would like to thanks to our families, friends for support and encouragement since the
first date of study until graduation.
Lastly, special thanks to all respondents in Sweden who gave their precious time to
participate in our research.
We hope our effortful study will help any interested people to fully benefit from our research
paper.
ii
Abstract
Organic food market is very challenging in Europe and growing rapidly as consumers are
concerned about health and environment particularly Sweden is one of the greenest countries.
Many of previous researches have been done on attitudes toward organic food consumption
based on demographics data. This paper presents the relationship between lifestyle which is a
part of psychographics and organic food consumption in Sweden. Quantitative data is
collected by survey method consisting of structured question and analyzed the relationship of
lifestyle and organic food consumption by regression analysis.
The result shows that there is the significant relationship between organic food consumption
and lifestyle. There are also relationships between organic food consumption age, gender,
education, income, and perceived risks but we cannot find its relationship with motivation
factor that are health concern, environmental concern and values.
Keyword; organic food, lifestyle

Contents
Acknowledgement ................................................................................................................. i
Abstract ................................................................................................................................ ii
1. Introduction ....................................................................................................................... 1
1.1 Background ................................................................................................................. 1
1.2 Problem discussion ...................................................................................................... 2
1.3 Purpose ........................................................................................................................ 3
1.4 Methodology ............................................................................................................... 3
1.5 Audience ..................................................................................................................... 4
1.6 Limitation .................................................................................................................... 4
1.7 Structure of Research ................................................................................................... 5
2. Theoretical Framework ..................................................................................................... 6
2.1 Lifestyle ...................................................................................................................... 6
2.1.1 Lifestyle Analysis ..................................................................................................... 7
2.1.2 The Value and Lifestyles System (VALS) ................................................................. 8
2.3 Consumption and Demographic ................................................................................. 10
2.3.1 Social class, Income, and Education ........................................................................ 10
2.3.2 Age ......................................................................................................................... 11
2.3.3 Gender .................................................................................................................... 11
2.4 Motivation and Consumption ..................................................................................... 11
2.5 Conceptual framework ............................................................................................... 12
3. Method ............................................................................................................................ 14
3.1 Data Collection .......................................................................................................... 14
3.1.1 Primary Data Collection .......................................................................................... 14
3.1.1.1 Questionnaire ....................................................................................................... 14
3.1.1.2 Sample Selection .................................................................................................. 15
3.1.1.3 Process of Collection ........................................................................................... 16
3.1.2 Secondary Data ....................................................................................................... 16
3.2 Interpretation and analysis method ............................................................................. 17
3.2.1 Regression Analysis ................................................................................................ 17
3.2.2 Descriptive statistics ............................................................................................... 17
3.2.2.1 Univariate Analysis .............................................................................................. 18
3.3 Validity and Reliability .............................................................................................. 19
3.3.1 External validity...................................................................................................... 20
3.3.2 Internal Validity ...................................................................................................... 20
3.3.3 Internal reliability ................................................................................................... 20
3.3.4 External reliability .................................................................................................. 21
3.4 Ethical considerations ................................................................................................ 21
4. Empirical Findings .......................................................................................................... 22
4.1 Organic food consumer .............................................................................................. 22
4.2 The motivational factors ............................................................................................ 23
4.2.1 Price ....................................................................................................................... 23
4.2.2 Availability ............................................................................................................. 23
4.2.3 Values ..................................................................................................................... 24
4.2.4 Health concern ........................................................................................................ 24
4.2.5 Environmental concern ........................................................................................... 25
4.3 Demographic Factor .................................................................................................. 25
4.3.1 Gender .................................................................................................................... 25
4.3.2 Age ......................................................................................................................... 26
4.3.3 Education ................................................................................................................ 26
4.3.4 Income .................................................................................................................... 27
5. Analysis .......................................................................................................................... 28
5.1 Descriptive Analysis .................................................................................................. 28
5.1.1 Demographic data ................................................................................................... 28
5.2 Model Summary ........................................................................................................ 32
5.2.1 Interpretation of coefficients ................................................................................... 34
5.2.2 Lifestyle .................................................................................................................. 34
5.2.3 Demographic variables............................................................................................ 35
5.2.4 Motivation variables ............................................................................................... 35
6. Conclusion ...................................................................................................................... 37

Appendix 1 Questionnaire Swedish Version ........................................................................ 39
Appendix 2 Questionnaire English Version ......................................................................... 42
Appendix 3 Encoding variables to stata .............................................................................. 45
Bibliography ....................................................................................................................... 46

List of Figures
Figure 2.1 Lifestyle Element AIOs……………………………………………………………8
Figure 2.2 VALS………………………………………………………………………………9
Figure 2.3 Conceptual Framework…………………………………………………………..13
Figure 4.1 Number of organic food consumer from survey…………………………………22
Figure 4.2 Lifestyle of organic food consumer in Sweden…………………………………..22
Figure 4.3 Price………………………………………………………………………………23
Figure 4.4 Availability……………………………………………………………………….23
Figure 4.5 Values…………………………………………………………………………….24
Figure 4.6 Health concern……………………………………………………………………24
Figure 4.7 Environmental concern…………………………………………………………...25
Figure 4.8 Gender…………………………………………………………………………….25
Figure 4.9 Age………………………………………………………………………………..26
Figure4.10 Education………………………………………………………………………...26
Figure 4.11 Income…………………………………………………………………………..27
Figure 5.1 Gender by frequency……………………………………………………………..28
Figure 5.2 Age by frequency, mean, variance, standard deviation………………………….29
Figure 5.3 Education by frequency, mean, variance, standard deviation……………………30
Figure 5.4 Income by frequency, mean, variance, standard deviation…………………..…..30
1
1. Introduction
The first chapter begins with a brief background of organic food in Sweden. Thereafter the
previous studies about organic food are reviewed. Those organic food studies will be
presented as well as discussed in problem discussion.
1.1 Background
Organic food is considered healthier than conventional food since it does not include
pesticides, chemical fertilizers or genetically modified organisms (The business of food,
2011). Organic food is distinguished from non-organic food by the methods used in their
production and processing, rather than by observable or testable characteristics. Although
there is no single international organic production regulation, all generally accepted organic
rules prohibit use of synthetic fertilizers, pesticides, growth regulators, and livestock feed
additives, and requiring long-term soil management, emphasis on animal welfare, and
extensive record keeping and planning. Certain activities such as use of genetically modified
stock, application of sewage sludge to organic acreage, and food irradiation are also
prohibited. (Lohr, 2001)
Environmental and health issues have become popular in Europe since mid-1980s (Greenan
& McIvor, 1997) and the concept of “organic food'' seems to be well known by many
consumers (Magnusson et al. 2001; Von Alvensleben R. , 1998). Issues such as quality and
safety in food attract consumer interest and affect buying behavior (Laroche et al., 2001).
According to Browne et al (2000), the growing interest in ethical production has been both
consumer-driven and trade-driven and growth in organic farming in the EU has consistently
been around 25 percent per year during the 1990s, and similar expansion is reported in the
US (Lampkin, 1999). Countries that have a significant presence in the food processing
industry, such as Germany, Italy, Sweden, and France, also face greater demand for organic
ingredients (Lohr, 2001).
The organic market in Sweden has developed rapidly from the early eighties (The Swedish
Market for Organic Food, 1999) since Sweden is well-known to be a clean and environmental
friendly country. Its inhabitants try as well to be involved in this matter (Menuet, 2010).The
Swedish government has also enacted a plan to convert 10% of the country's arable land to
ecological or organic agriculture (Sweden, Agriculture).
According to the report of Organic Farming in the European Union, published in 2005 by
European Commissions, Denmark is ranked first among EU countries by average consumer
spending on organic products with more than €60 per head. Sweden is the runner-up with €45
(Consumer demand, 2005). In 2010 total organic food sales increased 11% in Sweden while
2
the conventional food sales stagnated under the same period. Organic food sales has escalated
and reached the market share of 3.1 % including all food sales in the same year (Ekologisk
mat fortsätter öka i Sverige, 2011).
1.2 Problem discussion
In the majority of organic food studies, many consumers indicate that they have a preference
and an interest for organically produced food (Ekelund, 1989; Misra et al ,1991; Wandel &
Bugge, 1997). However, the proportion of consumers who purchase organic food on a regular
basis is still low (Grunert, 1993; Wandel & Bugge, 1997; Von Alvensleben R. , 1998)
There are a number of studies which show that European consumers of organic products are
mainly young people (<45 years) (Haest, 1990; Menghi, 1997; Wier & Smed, 2000). It is
revealed that young consumers buy because of environmental as well as health reasons, and
adult consumers buy because of health concerns (Von Alvensleben & Altmann, 1986;
Wandel & Bugge, 1995). Most consumer surveys demonstrate that the major motive for
buying organic foods seems to be health-related (Von Alvensleben R. , 1998; Ekelund, 1989;
Huang, 1996; Wandel & Bugge,1997).Whereas environmental concern is not as strong a
motive as health concern (Von Alvensleben R. , 1998; Huang, 1996). Wandel & Bugge
(1997), Von Alvensleben R. (1998) also conclude that the young people are more concerned
about environment than adult consumers but are less willing to pay for organic food due to
limited purchasing power while adults are more health conscious and willing to pay more for
organic food.
The demographic profile seems to affect consumer attitudes and consumption towards
organic food (Tsakiridou et al., 2008). As we can see that Organic food consumption are
mainly influenced by gender, age, income, level of education and the number of children in
the household (Wandel & Bugge, 1997; Magnusson et al., 2001; Wier et al, 2003). Mathisson
& Schollin (1994) and Wandel & Bugge (1997) show that women tend to be more interested
in organic food than men and the people with higher education seem to be more willing to
pay more for organic food (Jolly, 1991; Wandel & Bugge,1997).
There are also the number of organic food studies identifying other factors that affect organic
food consumption. According to Jolly (1991), Magnusson et al, (2001),Mathisson & Schollin
(1994) ,Roddy et al (1996) show the main obstacles of buying are the higher price and limited
availability whereas other factors such as satisfaction with conventional food, lack of trust
and lack of perceived value are also the hindrance behind consumption (Davies et al,1995;
Magnusson et al, 2001; Fotopoulos & Krystallis, 2002) even though neither demographic nor
psychographic profile show its affect to these factors.
The organic food studies mentioned above emphasize on the influence of demographic
factors and consumer attitudes towards organic food. Nevertheless in order to understand
more about consumer behavior, psychographic factors should also be considered as
consumers can have different lifestyles even if they share same age or gender. Solomon
(2007) argues that consumers’ lifestyle is the key to marketing strategies as psychographics
3
goes beyond simple demographics in helping marketers to understand and reach different
consumer segment and refers lifestyle to a pattern of consumption reflecting a person’s
choices of how he or she spends time and money. Zakowska-Biemans (2011) suggests in
limitation of her organic food research that the choice of validated scale items related to food
choice and food related lifestyle was limited and there is a need to further exploration of food
related lifestyle.
Corresponding to Zakowska-Biemans (2011), most of organic food studies we have found are
mostly done on attitudes which are based on demographics data, yet no one studies the
influence of lifestyle or psychographics in order to explain behavior of organic food
consumers. Most of organic food studies mentioned earlier also have been done in other
European countries. Magnusson et al (2001) who conduct the study in Sweden point out in
their Swedish organic food studies only about the results of purchasing criteria, and the
relationship between demographics and attitudes toward organic food. Therefore our research
purpose studying about the influence of the lifestyle toward organic food in Sweden is new.
Demographics can only tell us who the buyer is rather than telling why they buy like
psychographics do, therefore this is the justification of the research topic to understand the
lifestyle of organic food consumer in Swedish market. Thus, we can formulate strategic
question as:
How can lifestyle segmentation benefit organic food market in Sweden?
1.3 Purpose
The purpose of the paper is to investigate the relationships between lifestyle and organic food
consumption in Sweden
1.4 Methodology
By conducting a research the researcher can choose between qualitative and quantitative
method. Qualitative method involves the gathering of a lot of information from few
examination units through interviews and observations while quantitative method entails that
the researcher collects information from many research methods through, for instance
questionnaires (Halvorsen, 1992). Nykiel (2007) suggests that quantitative research has two
distinct advantages. The first is the results can be easily converted to numerical data and if it
is conducted properly the results are statistically reliable. The second advantage is the
researcher can be more objective about the findings of the research. Quantitative research can
also be utilized by testing hypotheses in experiments because of its ability to measure data
using statistics (Nykiel, 2007). The main disadvantage of quantitative research is that the
context of the observation or experiment is disregarded. Another disadvantage is quantitative
research does not examine things in their natural setting or discuss them as qualitative
research does (Jones, 2011). In our case we ask people pre-structured questions but we do not
let them express themselves freely so miss other opinions.
4
After discussion according to our overall purpose is to investigate whether lifestyle affects
consumption in Swedish organic food market, the quantitative is applied and thus the
questionnaires are conducted in accordance to the purpose that we want to observe the
correlation between the lifestyle of consumers and their organic food consumption. As a
result structured approach is defined for our research which mean that we take our research
based on a preliminary theories related to our subject and use structure to guide research and
data collection process whereas ground approach is to explore without preliminary theory
which then enables researcher to emerge theory from what they have on research materials
(Fisher, 2007). As our purpose comes from knowledge of previous researches and based on
existing theories, we study from those and move toward concrete empirical evidence obtained
from data collection then analyze the findings in relation to theories by deduction. We do not
want to generalize our findings to the entire consumer but rather observe some organic food
consumers on the Swedish market, therefore ground approach is not concerned and
quantitative is our method due to we use statistics to analyze data to answer purpose.
1.5 Audience
This research aims to gain knowledge of consumer psychographics to be able to understand
more effectively the consumer behavior about organic food consumption in Sweden.
Academics who investigate the relationship between lifestyle and consumption (especially
organic food) can benefit from this paper. Same idea is also applicable for other products and
lifestyle. A secondary group who might benefit from the information in this paper can be
marketers who can use this information to define the target market and market them
effectively rather than using demographics alone.
1.6 Limitation
As every academic paper our paper has also limitations and weak points. Because of
information about population of organic food consumer in Sweden is not available we could
only collect data from 143 respondents by using convenience sampling thus it results in
sampling bias and the results from study can differ with the results from entire population.
With more respondents we would have a larger sample which is more reliable statistically.
We wish to have collected data from all around Sweden not only Stockholm and Västerås so
that we could have a better distributed data.
5
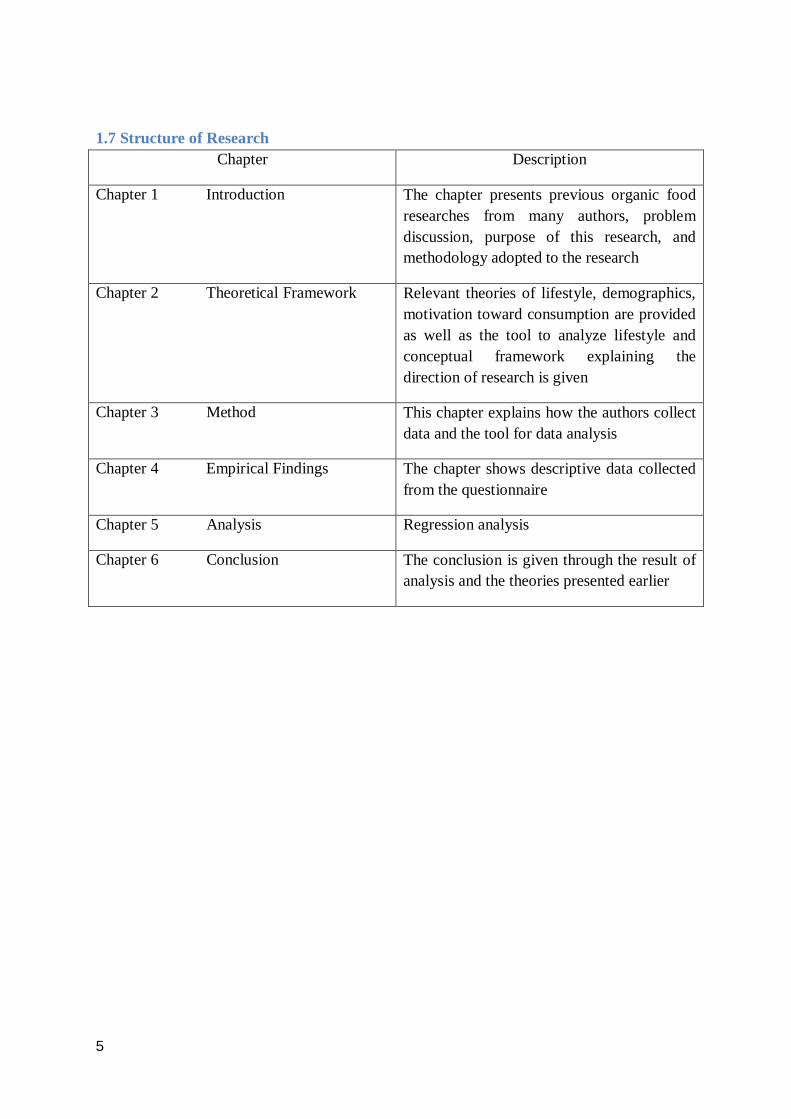
1.7 Structure of Research
Chapter Description
Chapter 1 Introduction The chapter presents previous organic food
researches from many authors, problem
discussion, purpose of this research, and
methodology adopted to the research
Chapter 2 Theoretical Framework Relevant theories of lifestyle, demographics,
motivation toward consumption are provided
as well as the tool to analyze lifestyle and
conceptual framework explaining the
direction of research is given
Chapter 3 Method This chapter explains how the authors collect
data and the tool for data analysis
Chapter 4 Empirical Findings The chapter shows descriptive data collected
from the questionnaire
Chapter 5 Analysis Regression analysis
Chapter 6 Conclusion The conclusion is given through the result of
analysis and the theories presented earlier

6
2. Theoretical Framework
The previous chapter introduces how important of lifestyle may have in order to understand
deeper organic food consumer rather than demographic alone as well as the motive to
consumption. Chapter two presents relevant theories used to apply with this thesis aiming the
readers to know more about lifestyle and its benefit to marketing as well as relevant theories
that are used to analyze lifestyle of organic food consumers in Sweden. Motivation as the
factor that affects consumption is also presented.
2.1 Lifestyle
Lifestyle is a mode of living reflected in consumers’ unique patterns of activities, interests,
and opinion (Evans et al, 2009). It refers to pattern of consumption reflecting a person’s
choices of how they spend time and money and makes statement about who they are, as well
as the types of people which they desire to identify (Solomom, 2007).
The lifestyle is one of the most widely used concepts in modern marketing activities. It
provides a way to understand consumers’ everyday needs and wants, and to allow product or
service to be positioned in terms of how it will allow a person to pursue a desired lifestyle
(Michman & Mazze, 2009)
Solomon (2007) explains the way marketer can use lifestyle information as a tool for market
segmentation in varieties of ways such as to define target markets by allowing marketer to go
beyond simple demographic, to position the product by allowing marketer to emphasize
features of the product that fit in with a person’s lifestyle, to better communicate product
attributes by offering a very useful input to advertising creators who must communicate about
products and such insight improves the ability to talk to consumers, and to develop overall
strategy.
Understanding how a product fits, or does not into consumers’ lifestyles allows the marketer
to identify new product opportunities, media strategies, and create environments most
consistent with consumption patterns. For example, when new product is positioned to be
premium product, is it always to target on rich consumers? What about the consumers who
perceive themselves or have self-concept as same as product image? It gives a better insight
into why people consume particular products for another example there is not only
demographic difference between women who often buy latest fashion clothes and those who
do not. Thus, in the lifestyle research we can ask respondents to judge a statement like “I
want to be considered as fashionable” ones who often buy may rate strongly agree but who
do not may give disagree then we can understand what is the reason behind consumption.
Thus, it is worth to understand consumers’ lifestyles because it enables to develop deeper
insights into consumer behavior by looking at how consumers spend their time and what they
think of various elements of their environment such as their attitudes, activities, interests, and

7
opinions. It can also get a closer idea of consumers' motives, feelings and beliefs because
lifestyle is reflections of self-concept (Evans et al, 2009).
2.1.1 Lifestyle Analysis
Psychographics is an approach used to define and measure the lifestyles of consumers. Most
contemporary psychographic research attempts to group consumers according to the
combinations of three variables of lifestyle known as AIOs (activities, interests, opinions)
(Solomom, 2007). Because of AIOs are the three components of lifestyle (Hoyer & Maclnnis,
2001) psychographic research has been used with AIO to measure how people spend their
time and money (Gunter & Furnham, 1992). Plummer (1974) describes that it is a popular
method used by advertisers and marketers because it can provide more information about
consumers than basic demographic variables. The results can help marketers to predict the
needs of consumers more accurately and better formulate their marketing strategy.
Figure 2.1 shows the content of each category in AIOs such as researchers can ask the
question concerning hobbies to measure people’s activities, fashion to measure interests, and
politics to measure opinions. This figure is only example to see what kind of subject to be
asked to measure people’s activity, interest, and opinion.
Figure2.1 source William D.W.& Douglas J.T.”activities,interests,opinions” Journal of
advertising research (1971)
Like in our questionnaire the statements regarding activities, interests, and opinions are
asked. (see appendix 1) For example, the statement like “I’d like to try new things” is to
measure about their activity, “I dress more fashionable than most people” is to measure about
their interest, and “I consider myself an intellectual” is to measure their opinions.
Life Style Elements AIOs
Activities Interests Opinions
Work Family social issue
Hobbies Home Politics
social event Job Business
Vacation Community Economics
Entertainment Recreation Education
club membership Fashion Product
Community Food Future
Shopping Media Themselves
Sport Achievement Culture

8
2.1.2 The Value and Lifestyles System (VALS)
The acronym VALS is a psychographic segmentation. It was developed in 1970s and
inaugurated in 1978 by Arnold Mitchell at SRI International. VALS places U.S. adult
consumers into one of eight segments based on their responses to the VALS questionnaire.
The main dimensions of the segmentation framework are primary motivation (the horizontal
dimension) and resources (the vertical dimension). The VALS approach is derived from a
theoretical base in Maslow's work (1954). It has since been reworked to enhance its ability to
predict consumer behavior. Segmentation research based on VALS is a product of SRI
Consulting Business Intelligence. (Lawson & Todd, 2002)
Figure 2.2 VALS
Source http://www.strategicbusinessinsights.com/vals/ustypes.shtml
According to the VALS Framework in figure 2.2, groups of people are arranged in a category
and are based on two dimensions. The horizontal dimension represents primary motivations
and includes three distinct types namely ideals, achievements, and self-expressions.
• Ideals: Consumers driven by knowledge and principles are motivated primarily by ideals.
These consumers include groups called Thinkers and Believers.
9
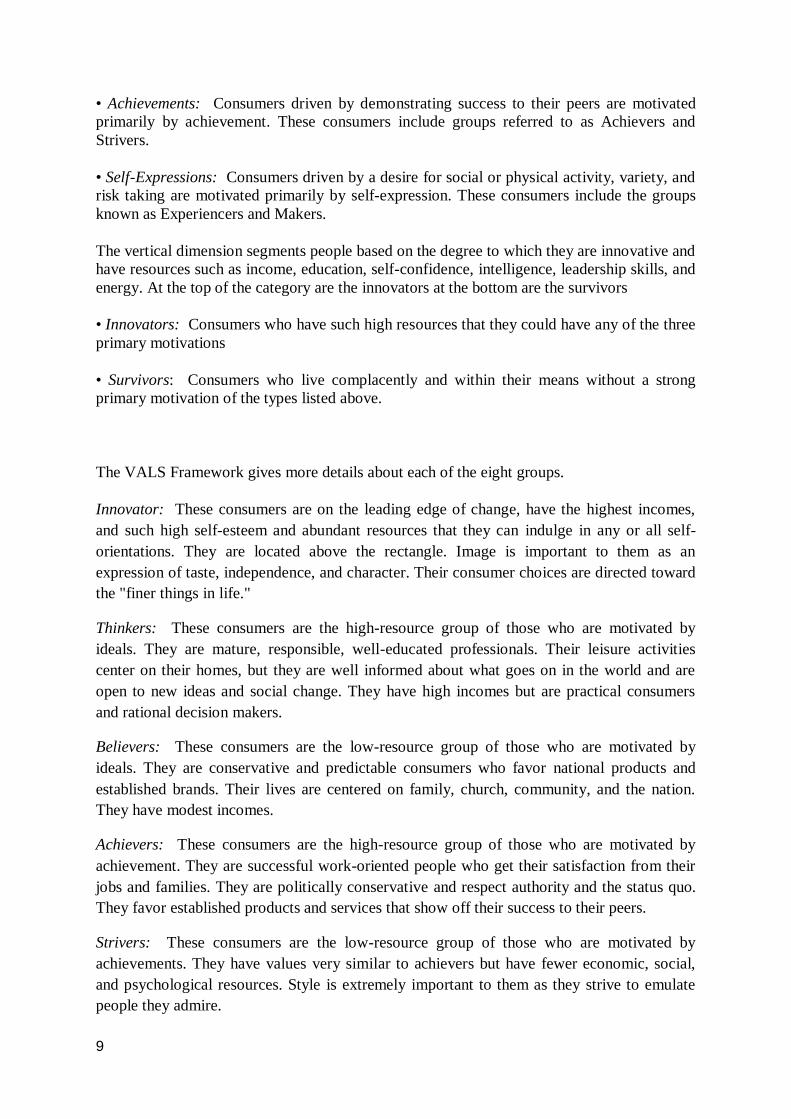
• Achievements: Consumers driven by demonstrating success to their peers are motivated
primarily by achievement. These consumers include groups referred to as Achievers and
Strivers.
• Self-Expressions: Consumers driven by a desire for social or physical activity, variety, and
risk taking are motivated primarily by self-expression. These consumers include the groups
known as Experiencers and Makers.
The vertical dimension segments people based on the degree to which they are innovative and
have resources such as income, education, self-confidence, intelligence, leadership skills, and
energy. At the top of the category are the innovators at the bottom are the survivors
• Innovators: Consumers who have such high resources that they could have any of the three
primary motivations
• Survivors: Consumers who live complacently and within their means without a strong
primary motivation of the types listed above.
The VALS Framework gives more details about each of the eight groups.
Innovator: These consumers are on the leading edge of change, have the highest incomes,
and such high self-esteem and abundant resources that they can indulge in any or all self-
orientations. They are located above the rectangle. Image is important to them as an
expression of taste, independence, and character. Their consumer choices are directed toward
the "finer things in life."
Thinkers: These consumers are the high-resource group of those who are motivated by
ideals. They are mature, responsible, well-educated professionals. Their leisure activities
center on their homes, but they are well informed about what goes on in the world and are
open to new ideas and social change. They have high incomes but are practical consumers
and rational decision makers.
Believers: These consumers are the low-resource group of those who are motivated by
ideals. They are conservative and predictable consumers who favor national products and
established brands. Their lives are centered on family, church, community, and the nation.
They have modest incomes.
Achievers: These consumers are the high-resource group of those who are motivated by
achievement. They are successful work-oriented people who get their satisfaction from their
jobs and families. They are politically conservative and respect authority and the status quo.
They favor established products and services that show off their success to their peers.
Strivers: These consumers are the low-resource group of those who are motivated by
achievements. They have values very similar to achievers but have fewer economic, social,
and psychological resources. Style is extremely important to them as they strive to emulate
people they admire.
10
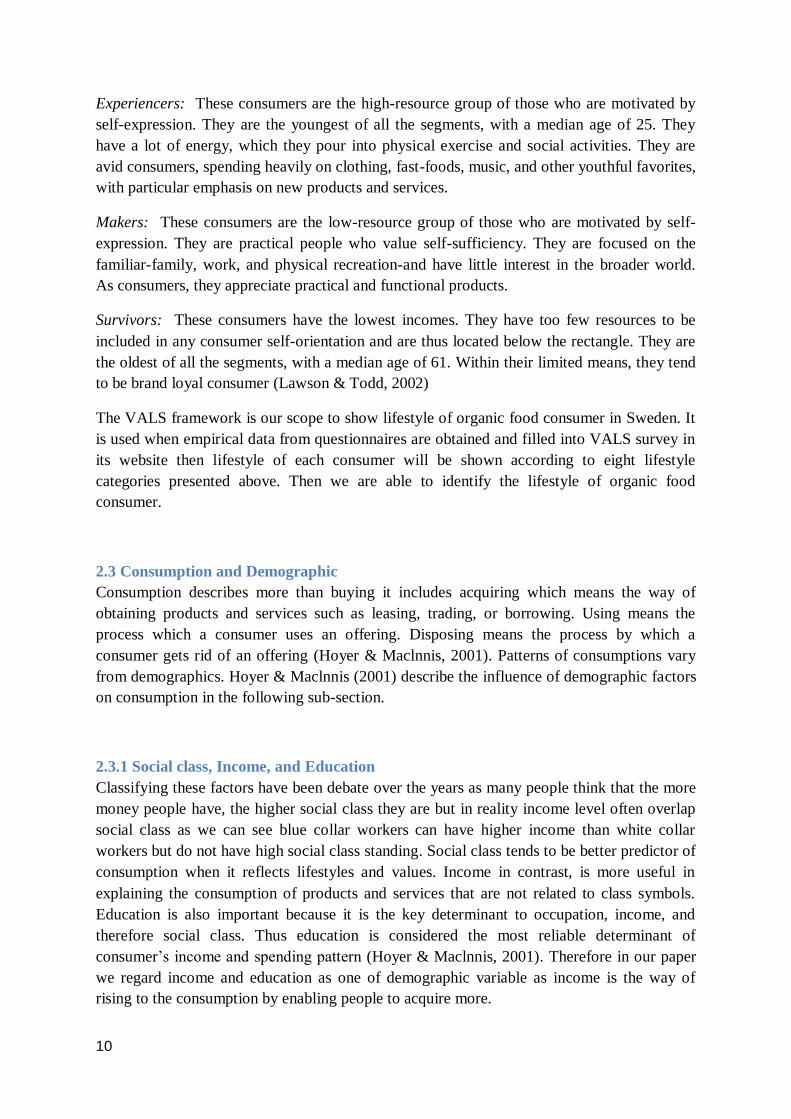
Experiencers: These consumers are the high-resource group of those who are motivated by
self-expression. They are the youngest of all the segments, with a median age of 25. They
have a lot of energy, which they pour into physical exercise and social activities. They are
avid consumers, spending heavily on clothing, fast-foods, music, and other youthful favorites,
with particular emphasis on new products and services.
Makers: These consumers are the low-resource group of those who are motivated by self-
expression. They are practical people who value self-sufficiency. They are focused on the
familiar-family, work, and physical recreation-and have little interest in the broader world.
As consumers, they appreciate practical and functional products.
Survivors: These consumers have the lowest incomes. They have too few resources to be
included in any consumer self-orientation and are thus located below the rectangle. They are
the oldest of all the segments, with a median age of 61. Within their limited means, they tend
to be brand loyal consumer (Lawson & Todd, 2002)
The VALS framework is our scope to show lifestyle of organic food consumer in Sweden. It
is used when empirical data from questionnaires are obtained and filled into VALS survey in
its website then lifestyle of each consumer will be shown according to eight lifestyle
categories presented above. Then we are able to identify the lifestyle of organic food
consumer.
2.3 Consumption and Demographic
Consumption describes more than buying it includes acquiring which means the way of
obtaining products and services such as leasing, trading, or borrowing. Using means the
process which a consumer uses an offering. Disposing means the process by which a
consumer gets rid of an offering (Hoyer & Maclnnis, 2001). Patterns of consumptions vary
from demographics. Hoyer & Maclnnis (2001) describe the influence of demographic factors
on consumption in the following sub-section.
2.3.1 Social class, Income, and Education
Classifying these factors have been debate over the years as many people think that the more
money people have, the higher social class they are but in reality income level often overlap
social class as we can see blue collar workers can have higher income than white collar
workers but do not have high social class standing. Social class tends to be better predictor of
consumption when it reflects lifestyles and values. Income in contrast, is more useful in
explaining the consumption of products and services that are not related to class symbols.
Education is also important because it is the key determinant to occupation, income, and
therefore social class. Thus education is considered the most reliable determinant of
consumer’s income and spending pattern (Hoyer & Maclnnis, 2001). Therefore in our paper
we regard income and education as one of demographic variable as income is the way of
rising to the consumption by enabling people to acquire more.

11
2.3.2 Age
Hoyer & Maclnnis (2001) describe that age is the basic logic that people in same age have
similar life experience and therefore share many common needs which in turn to the similar
consumption patterns. For teens, they strive to a distinct identity and self-image they want to
be independent but not too far from the group or being rejected so most of their consumption
patterns are affected by friends. Thus teens can be trendsetters especially in fashion area.
Many products and services are made in the teen years can achieve their loyalty when they
move to adulthood.
Generation X, the people who were born from 1965 to 1976 the feature of this group is a
general feeling of alienation and resentment due to difficulty in advancement or unable to
match or surpass their parent’s success. This feeling can lead into consumption patterns
(Hoyer & Maclnnis, 2001).
Baby Boomers are who born between 1946-1964 these groups have high economic power.
Because they are segmented in greatest economics they are the target for many products and
services. They are obsessed with aging and are prime market of maintaining youthful
appearance product and service that good for health. Many of them are in dual-career family
so the need for child care products and services are increasingly demanded (Hoyer &
Maclnnis, 2001)
The young again and grey market (age 50-older) the young again usually think that they are
younger than cognitive age so that leads to active lifestyle and they also have considerable
discretionary income whereas the gray markets are people over 65 the offering like medical
care and healthier lifestyles have increased the size of this group. They are self-sufficient in
most activities like preparing foods, shopping (Hoyer & Maclnnis, 2001).
2.3.3 Gender
Gender is obvious that males and females can differ in traits, attitudes, and activities so that
can affects in consumption. In general men are more competitive, independent, externally
motivated, and willing to take risks while women are more operative, interdependent,
internally motivated and risk avoidance. Men are more sensitive to personally relevance but
women are to both personally and relevant to others. Men are also sensitive to positive
motivation and base decision on experience and reputation while women show a tendency to
negative motivation and price is important when making decision. Finally, men and women
tend to have different eating patterns such as women are more likely to engage in
compensatory eating which means they eat to make up for deficiency or depression (Hoyer &
Maclnnis, 2001).
2.4 Motivation and Consumption
Hoyer & Mclinnis (2001) define motivation as an inner state of arousal with aroused energy
directed to achieving goal. When consumers have motivation they are eager, ready and
willing to engage in a goal-relevant activity. Consumers can be motivated to engage in
decision making and can be seen in the context of acquiring, using, or disposing the offerings.
12
For example if one finds that using pesticides is harming environment they may be motivated
to engage in eating organic food. Hoyer & Mclinnis (2001) identify what can affects
motivation as follow.
Personal relevance A key factor affecting motivation is the extent of something which is
relevant to consumer. It means when consumers think about things are personally relevant,
they will be motivated to behave, or engage about these things and will involve when buying,
using or disposing of them. In our case we can see whether it is health or environmental
concern that are more relevant to them and therefore motivate them to consume organic food.
Values are beliefs that guide what we regard as important or good. Consumers are more
motivated to consume and process information when they find it relevant to their values.
Perceived Risk reflects the extent to which the consumer is uncertain about the consequences
of consumption. It is another factor affecting personal relevance and then motivation because
it can increase or decrease consumers’ motivation to engage in consuming. As perceived risk
increases consumers tend to collect more information and evaluate it carefully. In relation to
our case we present three types of perceived risk. 1) Performance risk is uncertainty about
whether the offering will perform as expected. In our case consumers might be uncertain
about organic food is really good for health and environment, if value is not perceived they
may not likely to buy. 2) Financial risk is higher if a product or service costs is more. Like
organic food is more expensive than conventional food it can be the risk for consumers to buy
if they do not see its benefit. 3) Time risk reflects uncertainties over the length of time that
must be invested in consumption of product or service. Like organic food is not widely
available in every food store, to buy it might take more time than buying conventional food
where easier available. High risk is generally uncomfortable it can reduce motivation to
consume (Hoyer & Maclnnis, 2001).
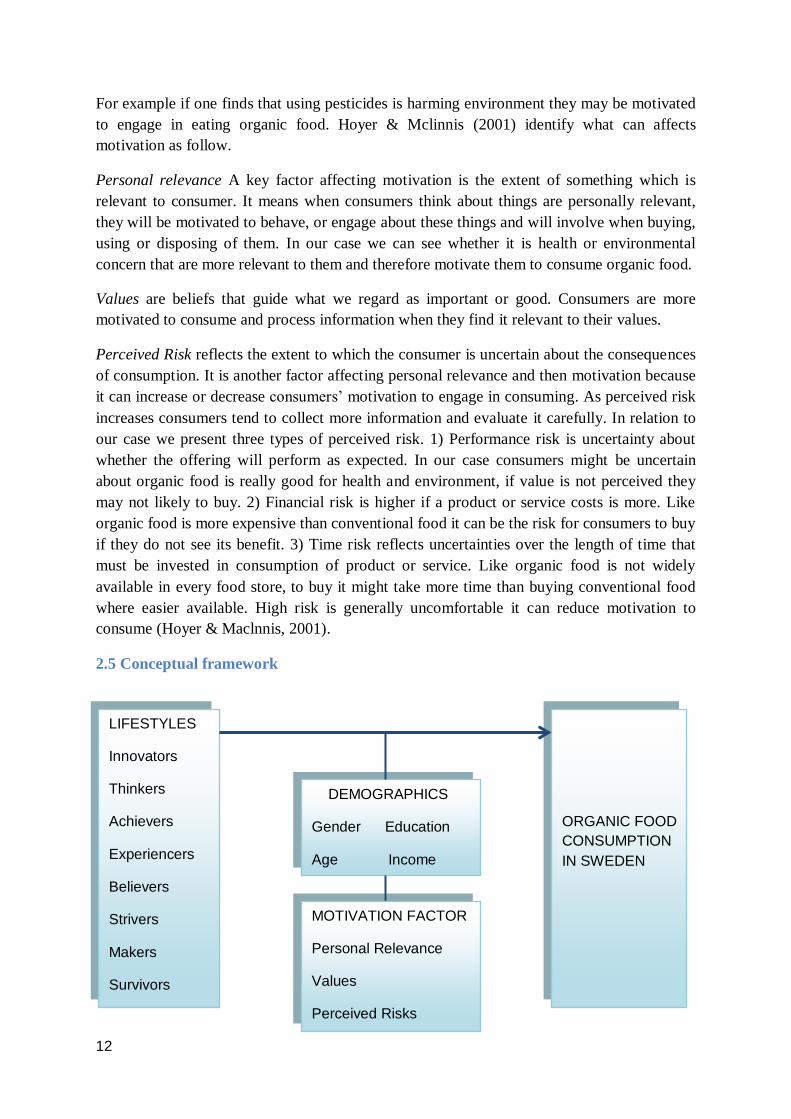
2.5 Conceptual framework
LIFESTYLES
Innovators
Thinkers
Achievers
Experiencers
Believers
Strivers
Makers
Survivors
DEMOGRAPHICS
Gender Education
Age Income
ORGANIC FOOD
CONSUMPTION
IN SWEDEN
MOTIVATION FACTOR
Personal Relevance
Values
Perceived Risks

13
Figure 2.3 Conceptual Framework Model
Since the research purpose is to identify the relationship between lifestyle and organic food
consumption in Swedish market, relevant factors have been reviewed from previous
researches and academic books. It shows that lifestyle is possible to affect organic food
consumption as lifestyles refer to pattern of consumption (Solomom, 2007). Therefore,
Lifestyle is independent variable in our model.
Another one is demographic factors. It affects organic food consumption as women and who
have high education tend more to consume organic food and young people are less willing to
pay for it than adults due to level of income.
At the same time, while looking at the different types of VALS lifestyles we can see that each
lifestyle is influenced by demographics variables as innovator, thinker, achiever, and
experience is the high resources group due to they have high level of education and income
whereas believer, striver, maker and survivor are the groups that have low resources. We can
imply that demographics influence both lifestyle and organic food consumption. So, we
regard demographics as a moderating variable that can affect the strength of the relationship
between lifestyle and organic food consumption.
In addition, previous organic food studies mentioned earlier show that health and
environmental concern, values, high price and limited availability are the factors that affect
organic food consumption therefore, we put those factors into motivation factor where health
and environmental concern are categorized into personal relevance, price and availability are
categorized into perceived risk while value is itself.
Motivation factor is investigated as the moderating variable as it can affect the direction of
the relationship between lifestyle and organic food consumption as well.

14
3. Method
In this chapter we explain how and what kind of data we use in this research. Besides that
method to analyze the data, reliability and validity, and ethical issues are addressed
3.1 Data Collection
Both primary and secondary data are used in this paper. We use a questionnaire as our source
of data collection. Details are presented in the following sub-sections.
3.1.1 Primary Data Collection
Collecting the primary data the researcher questions what the respondents thinks about a
specific topic or how they would behave under certain circumstances. The main advantage of
the primary data is that the questions the researchers ask are customized to elicit the data
which will be conducive in their research. Researchers should collect the data themselves by
using surveys, interviews or direct observations (Cateora, 2010)
The primary data in this paper consists of the answers about lifestyle which derived from the
questionnaire conducted by the authors. The aim of our primary data is to infer activities,
interests and opinions of the respondents which will be used to identify the relationship of
lifestyle and organic food consumption in Sweden. Explanation is presented in the following
sub-section.
3.1.1.1 Questionnaire
The questionnaire is divided into 3 parts as follow
1. Organic food consumption and the motivation factors that influence organic food
consumption
The questions in this part asking the respondents to rate the important of each factor under
rating scale such as respondent will rate for “price” from least important to most important
and dichotomous question is used to ask whether yes or no the respondents eat organic food.
2. Psychographic questions
This part aims to identify the lifestyles of respondents for that we use the psychographic
statements asking the respondents to rate the extent of their agree from mostly disagree to
mostly agree toward each statement such as “I dress more fashionably than most people”
15
Tam & Tai (1998) state that psychographic research involves two phases: the first phase is to
determine the appropriate psychographic statements. In this phase we borrow statements from
VALS in which all the statements have been proved by Strategic Business Insight as we
cannot develop our own question about psychographic because we do not know the logic
behind. The second phase is to develop a typology of consumers. For the typology we use
VALS’ model as well.
Therefore the VALS (value and lifestyle survey) is used in this paper for our questionnaire to
identify the lifestyle of consumers. As mentioned earlier regarding lifestyle variables that we
use VALS survey which in VALS survey, it consists of AIOs statements asking about their
activities, interests, and opinions which are 35 statements in total. Once we got the answer
from all respondents we will interpret and profile them in each segment by putting data into
VALS website to see what lifestyle segment they are whether they are Innovator, Thinker,
Believer, Achiever, Experiencer, Maker, Striver or a Survivor (see figure 2.2).
3. Demographic questions
The third part of the questionnaire is demographics questions. The structured questions asked
are either dichotomous and multiple choices where dichotomous question is used to ask about
gender but in the question about age, income, education respondents are provided with the
choices of answers. Because of demographics affects person’s lifestyle, data about
demographics are needed together with the questions in second part to put in VALS website
to identify the lifestyle of the respondents.
3.1.1.2 Sample Selection
In social science research two general approaches to sampling are used (Herek, 2009).
The first one is probability sampling meaning that all elements (e.g., persons, households) in
the population have opportunity to be chosen in the sample, and the mathematical probability
that any one of them will be selected can be calculated.
The second one is non-probability sampling in contrast, population elements are selected on
the basis of their availability (e.g., because they volunteered) or because of the researcher's
personal judgment that they are representative. The consequence is that an unknown portion
of the population is excluded (e.g., those who did not volunteer)
Convenience sampling is a type of non-probability sampling. It is simply method where the
units that are selected for inclusion in the sample are the easiest to access and it is advantage
for cost and time (Lund, 2010). Just like its name convenience sample is used by simply stop
people on the street, a shop, a restaurant, a theatre or whatever, asking people we met whether
they will answer questions. In other words, the sample comprises subjects who are simply
available in a convenient way to the researcher. However, because of there is not
randomness, the bias is high (Galloway, 1997).
In the research it is better if we can test the entire population by probability sampling but in
our case the population is just too large and hard to include everyone. A certain group of
16
sample frame is also unavailable we do not know how many organic food consumer in
Sweden as no information available or even it has it would be large then it takes too much
resources to complete. Although more accuracy but its time consuming and expensive limits
us to do thus, non-probability sampling is the alternative in order to conduct research.
Therefore in selecting sample we decide to adopt convenience sampling due to time and
budget constraint. The next sub-section explains how we manage to collect data.
3.1.1.3 Process of Collection
The questionnaire is collected via online questionnaire and questionnaire distribution. For the
online questionnaire, we have sent by email and facebook. We select our sample from the
name list of our colleagues, our family’s colleagues and friends, our friends in University,
previous school and the persons we know which all are living in Sweden.
In the questionnaire we have explained what the survey is about. Reminders were sent to the
persons who have not replied within 5 days for online questionnaire. There is a link presented
in our emails. Clicking the link the respondents are guided to the online questionnaire. When
the respondents are done with the questions they click “submit”. When they do so their
answers are transferred to our data base. The whole software is empowered by Google called
Google Document.
In addition we have distributed questionnaires in face to face contacts. The questionnaires are
mostly distributed in T-Centralen, Stockholm. Our sample is the people sitting on the bench
waiting for the train or waiting to meet their peers. We have chosen T-Centralen since it is
really crowded which make it easier to find respondents and they normally have time to
complete the questionnaire since they are waiting for travel. Another reason to choose T-
Centralen is that it is various in terms of population which is possible to meet many people
from different backgrounds with different demographic features and lifestyles. After the
respondents have filled questionnaires then we fill their answers manually to our data base.
Finally, after this strategy we got 143 respondents in total for our sample.
3.1.2 Secondary Data
Secondary data is the data which have been already collected by others and ready to use. The
advantages of the secondary data are it is economical in terms of time, money and efforts.
The data is ready and the researcher does not need to spend resources to conduct another
research. In line with that the data can be beyond the collecting capability of the researcher.
Thus the researcher can gain access to data which they are not able to collect. Besides that
secondary data is conductive to understand the problem and provides the researcher the
opportunity of comparing it with other data. However the disadvantage of secondary data is
that detailed secondary data which is appropriate to the researcher purpose might be not
available for many areas. It may not contain the level of reliability necessary for rational
decision making. It can also be deceitful and misleading. Moreover the data might not be
comparable as it is outdated or not being collected frequently enough (Juneja, 2011).The

17
secondary data presented in this paper is collected from internet, marketing books, previous
organic food researches from Emerald.
3.2 Interpretation and analysis method
The main analysis method used to answer our purpose is regression analysis while descriptive
statistics is used to describe collected data.
3.2.1 Regression Analysis
Regression analysis is a statistical model which is used in order to analyze several variables.
The model can observe the relationship between a dependent variable and one or more
independent variables. Moreover, regression analysis helps us to understand how the value of
the dependent variable changes when one of the independent variables is changed, while the
other independent variables are held fixed (Healey & Prus, 2009).
In our case we have observed the changes in organic food consumption (dependent variable)
when changing one of the independent variables while keeping the other independent
variables constant. In order to run the regression analysis we have exploited SPSS.
Encoding variables in SPSS
The authors use different kind of variables with different features in this paper. (The variables
will be discussed more in details later.) Therefore typing the variables to SPSS requires some
configurations. While typing the variables into SPSS we divided them into 6 groups:
eater/non eater, lifestyle, age, gender, education and income. Since the variables age, gender
and education are indicated in numerical values which is ranked in a hierarchical order we
choose the option “Scale” under the column of “Measure” on the very right side of the SPSS
sheet( variable view). By doing so we ensure that the software conceives the values
hierarchically as we want. On the other hand the variables gender, lifestyle and eater/non
eater should not be perceived hierarchically by the software because i.e we cannot say
male>female or opposite. The software should perceive the variables gender, lifestyle and
eater/non eater nominally. Therefore we choose the option “Nominal” instead of “Measure”
on the very right side of the SPSS sheet( variable view). See appendix 3 for illustration.
3.2.2 Descriptive statistics
Trochim ( 2006) describes descriptive statistics is the method to describes the basic features
of the data in a survey. Along with simple graphics analysis, they virtualize quantitative
analysis of data. It basically describes what the data shows by presenting a quantitative
descriptions in a manageable form. It is risky to attempt to describe a large set of
observations with a single indicator since distorting the original data or losing important
detail is very likely.
18
3.2.2.1 Univariate Analysis
Univariate analysis is the examination among cases of one variable at a time. As Trochim
(2006) explains the main features of a single variable as follows.
Distribution
The distribution is a summary of the frequency of individual values or ranges of values for a
variable. For instance, suppose that 100 respondents were asked to state their opinions
regarding the factors influence organic food consumption by using a five point Likert scale.
The results might look like that
Mean
To calculate the mean all the values should be summed up and divided by the number of
values. For example, suppose we have 9 persons at the age of 15, 25, 21, 28, 38, 36, 19, 28,
16. The mean of their age would be (15+25+21+28+38+36+19+28+16)/8=25.1
Dispersion
If we do not know how the data is dispersed we cannot see the whole picture of it. There are
two common measures of dispersion, the range and the standard deviation. For example, a
residential street with 40 homes on it having a mean value of $400,000 with little variation
from the mean would be very different from a street with the same mean home value but with
6 homes having a value of 2$ million and the other 34 clustered around $120,000 (quickmba,
2010)
The most common measures of dispersion are range and standard deviation.
We can calculate range by subtracting the lowest value from the highest value. In our
example distribution about ages of 9 person ( 15+25+21+28+38+36+19+28+16) , the highest
value is 38 and the lowest is 15, so the range is 38 - 15 = 23.
The standard deviation is another estimation dispersion which is more accurate and detailed.
Since an outlier (the outliner is 38 in this example). The Standard Deviation indicated the
relation between the numbers in a distribution and the mean of the sample.
In order to calculate the standard deviation firstly we need to compute the distance between
each value in the distribution and the mean. We already know that our mean is 25.1
Rank
Degree of
agreement Number
1 Least Important 5
2 Small Import 10
3 Medium Important 15
4 Important 30
5 Most Important 40

19
Again referring our distribution we can calculate the difference as follows.
15-25.1=
-
10.1
25-25.1= -0.1
21-25.1= -4.1
28-25.1= 2.9
38-25.1= 12.9
36-25.1= 10.9
19-25.1= -6.1
28-25.1= 2.9
16-25.1= -9.1
The next step is to take the squares of those differences.
-10.1*-10.1= 102.1
-0.1*-0.1= 0.1
-4.1*-4.1= 16.81
2.9*2*9= 8.41
12.9*12.9= 166.41
10.9*10.9= 118.81
-6.1*-6.1= 37.21
2.9*2.9= 8.41
-9.1*-9.1= 82.81
After squaring the differences we sum them up.
102.1 + 0.1 + 16.48 + 8.41 +166. 41 + 118.81 + 37.21 + 8.41 + 82.81 = 540.89
Now we need to divide 540.89 to the number of scores we have minus 1. Since we have 9
scores we need to divide the sum of squares (SS) to 8.
540.89 / 8 =67.61 (variance)
This value is our variance. In order to get the value of standard we need to take the square
root of 67.61.
(Standard deviation)
3.3 Validity and Reliability
Validity is concerned with a study´s capability of accurately measuring a concept. Validity of
a study increases if the study's success at measuring a concept is high (Meeker & Escobar,
1998). While conducting experiments, we aim to demonstrate cause and effect relationships

20
between the independent and dependent variables. We often try to do it in a way which
enables us to draw conclusions about larger sample groups. In this paper we try to understand
the relationship between Swedish consumer´s lifestyle and organic food consumption by
observing the dependent and independent variables which will be presented later. This
paper´s validity depends on the degree of our survey´s capability to explain the above
mentioned relationship for Sweden.
Reliability concerns how consistent a survey is. A survey is said to be reliable or consistent if
the survey can produce similar results if applied again under similar circumstances. There
are two types of reliability that is internal and external reliability (Meeker & Escobar, 1998).
3.3.1 External validity
External validity is concerned to the degree to which the results of a study are generalizable
or transferable. In other words it is about whether the inferences of a study can be held to be
true for other cases, for instance to different people, places etc. (Buttner, 1997). For our case
we can raise the question if the same research was conducted in all part of Sweden instead of
Stockholm and Västerås would we get similar results. According to our sample is mainly
surveyed in Stockholm and Västerås, the degree of external validity might be low because it
does not represent the whole population of Sweden.
3.3.2 Internal Validity
Internal validity is the true causes of the outcomes that are observed in the study. Strong
internal validity means that not only have reliable measures of independent and dependent
variables but a strong justification that causally links independent variables to dependent
variables. Thus strong internal validity refers to the unambiguous assignment of causes to
effects (JJ College of Criminal Justice, 2011). This paper has control over the independent
variables and the result is caused from only specific independent variable which is lifestyle.
3.3.3 Internal reliability
Refers to the degree to which a measure is consistent within itself. The internal reliability of
self-report measures, such as questionnaires can be evaluated by using the split half method
which involves dividing a test into two parts and letting the same participant doing both parts
of the test. If similar results would be obtained from those two parts this would suggest that
the test has internal reliability (Howell et al, 2005). We expect to have a high degree of
internal reliability since our questionnaire is recognized internationally and used before by
other researchers and once we have tried our questionnaire, the result is not bias.
21
3.3.4 External reliability
Refers to the degree to which a measure varies from one use to another. The external
reliability of self-report measures, questionnaires can be evaluated by using the test-retest
method. This method includes testing the same respondent twice over a period of time for the
same test. If the questionnaire has external reliability similar scores will come out (Howell, et
al., 2005). By collecting the data we used the VALS questionnaire the external reliability of
our survey would be high if same respondents would answer VALS similarly after i.e 6
months.
3.4 Ethical considerations
While conducting research in academic or professional standards, ethics behind the research
activity should be considered. We kept in mind the following objectives during our research
as we try to avoid our biases and personal standpoint to involve the research. The paper is
written from an objective perspective. The identification of the respondents of the
questionnaire and their personal information about demographic is held confidentially and
while answering the questionnaire nobody is asked to write the name so we only collect data
which cannot be used for malicious purpose. The findings are presented anonymously. The
results are represented accurately without any manipulation as what we observed or what you
were told. We want to be sure that no one is harmed psychologically because of this research
therefore we do not insist anyone who is not willingly to answer (Cobanoglu, 2003).

22
4. Empirical Findings
This chapter encompasses the empirical data collected through the questionnaire with the
143 respondents. Data about motivational factors which can effect organic food consumption
are exhibited as it is. However, data about organic food consumers’ lifestyle has already
been interpreted by VALS website and only the results are shown.
4.1 Organic food consumer
Figure 4.1 the number of organic food consumer from survey
The survey concerns people who live in Sweden. According to the data collected from 143
respondents, 99 people (69%) eat organic foods while 44 people (31%) do not eat.
Figure 4.2 Lifestyle of organic food consumer in Sweden
Yes, 99, 69%
No, 44, 31%
Do you eat organic food?
Yes
No
20
30 31
20
31
11
0
5
10
15
20
25
30
35
Thinker Achiever Experiencer Believer Strivers Innovator
Organic Food Consumer Lifestlyes

23
After we put respondents’ answer into VALS survey we got 6 lifestyle categories out of 8 the
missing lifestyles are maker and survivor as no one falls into these categories. As shown in
the graph above there are 20 thinkers, 30 achievers, 31 experiencers, 20 believers, 31 strivers
and 11 innovators.
4.2 The motivational factors
These factors are used to measure the factors that affect consumers’ motivation toward
organic food consumption. We use three aspects of motivation namely personal relevance
(health, environmental concerns), values, and perceived risk (price, availability).
4.2.1 Price
Figure 4.3 Price
Price is one measure of perceived risk. The chart above shows how much price is important
for consumers in which price can increase or decrease consumers’ motivation to consume.
The data shows 40 people rank price as the most important motivational factor when making
decision and 51 people rate price is important for them where 32 people state that it is
medium important, 18 people say it is also important but small while only one person says
price is the least important when deciding to buy organic food.
4.2.2 Availability
Figure 4.4 Availability
Availability is one perceived risk for consumers it can affect organic food consumption as
difficulty to find can reduce consumers’ motivation in order to consume. The result shows
1
18
32
51
40
0
10
20
30
40
50
60
Price
Least important
Small important
Medium important
Important
Most important
9
34
64
34
0
20
40
60
80
Availability
Least important
Small important
Medium Important
Important
Most important

24
that 34 people give availability is the most important this number applies to people who say it
is medium important. 64 is the most number of people who give availability is important
where only 9 think it is small important and no one says availability is the least important.
4.2.3 Values
Figure 4.5 Value
Value is perceived very important factor to motivate people to consume organic food as we
can see that 57 and 58 people give value is the most important and important respectively
while 20 say it is medium important and only 3 and 4 people say values is small and least
important.
4.2.4 Health concern
Figure 4.6 Health Concern
Health is a major motive for people to consume organic food as we can see from the chart
that 88 people give health concern is the most important, 34 people say it is important where
15 and 5 people say it is medium and small important. From the information in this chart we
can see that most people consume organic food because of health reason.
4 3
20
58 57
0
20
40
60
80
Value
Least important
Small important
Medium Important
Important
Most important
515
34
88
0
20
40
60
80
100
Health Concern
Least important
Small important
Medium Important
Important
Most important
25
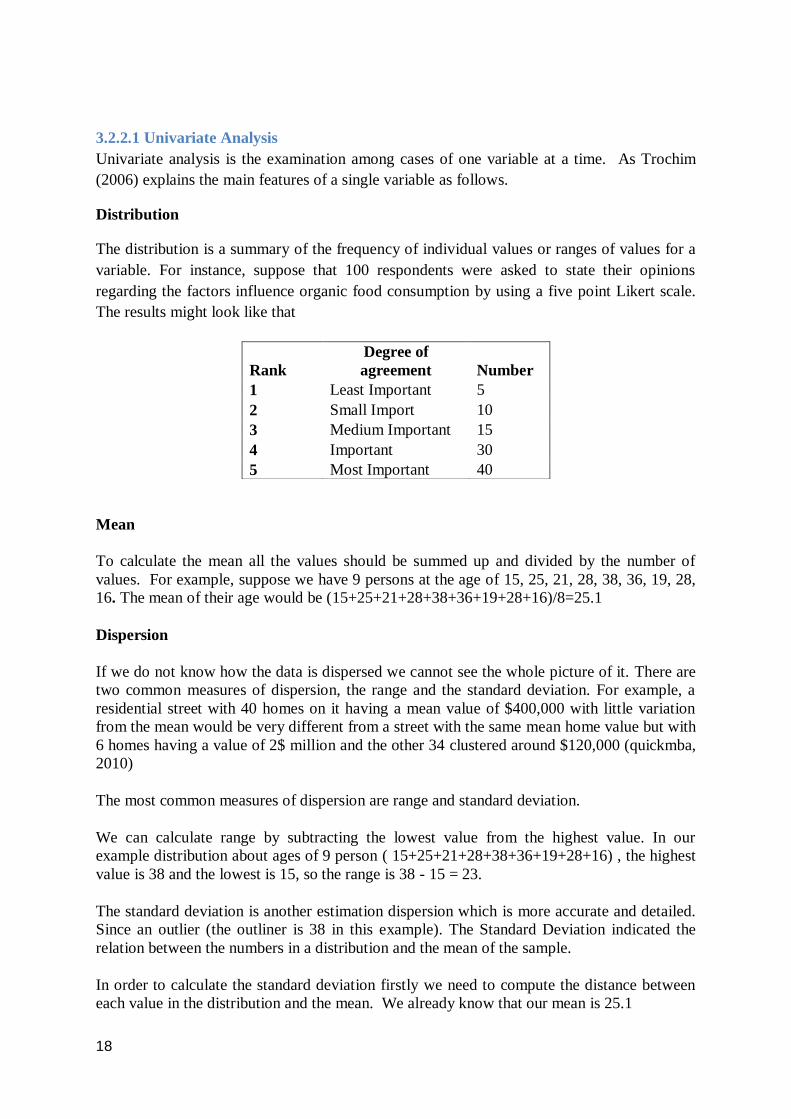
4.2.5 Environmental concern
Figure 4.7 Environmental Concern
Another personal relevance is environmental concern. For environment concern the number
of who consume organic food because of environmental reason is the most important is 36
where most people consume because they concern about environment is 54. 35 people give it
is medium important where 15 give small important and 3 give the least important.
4.3 Demographic Factor
Demographic is another factor influencing people to consume organic foods. Data of gender,
income, education, and age are showed according from our survey.
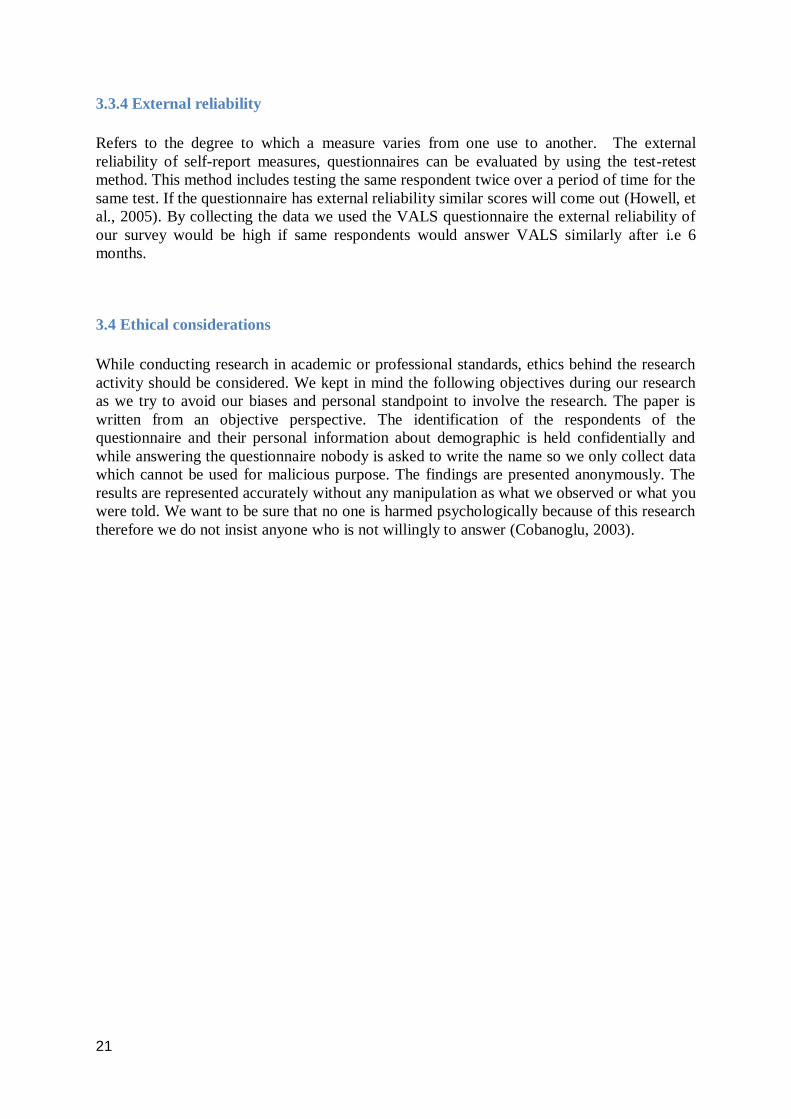
4.3.1 Gender
Figure 4.8 Gender
Our survey has 55 males and 88 females accounting for 38% and 62% of the whole sample
respectively.
3
15
35
54
36
0
10
20
30
40
50
60
Environmental Concern
Least important
Small important
Medium Important
Important
Most important
55, 38%
88, 62%
Gender
Male
Female
26
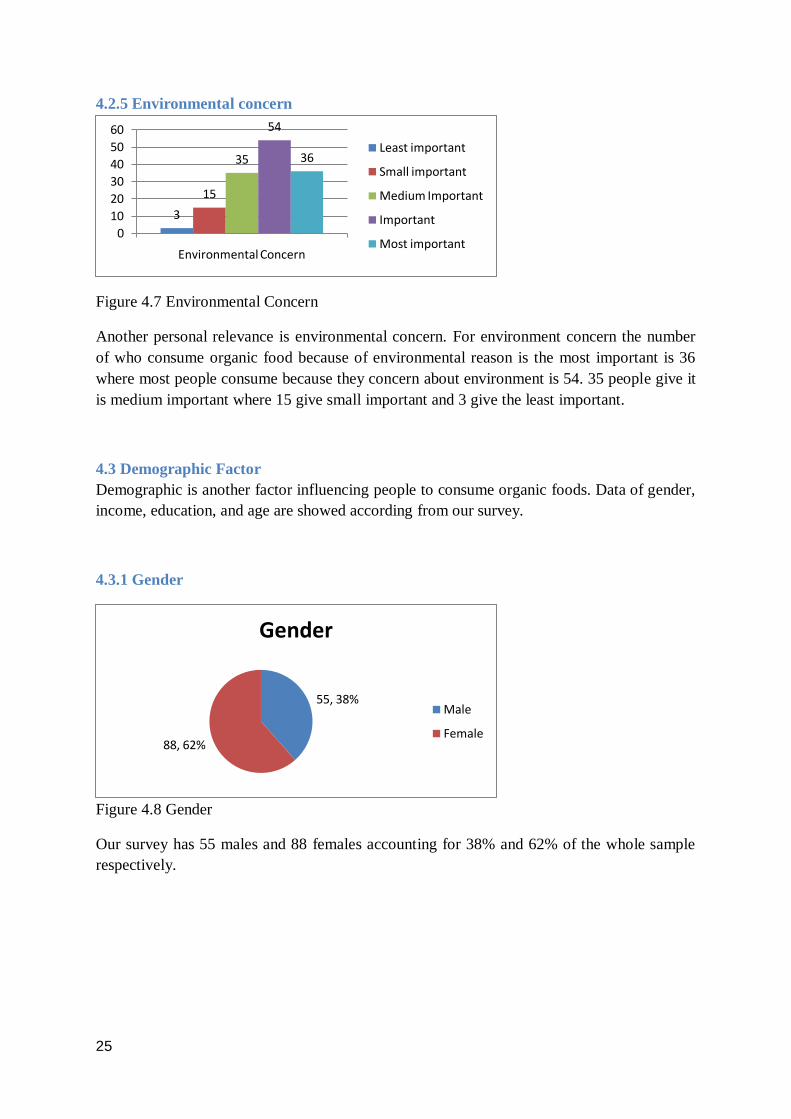
4.3.2 Age
Figure 4.9 Age
Most of the respondents are below 40 as we have 52 persons aged between 18-29, 63 persons
aged between 30-39, 17 persons aged between 40-49, and 10 persons from 50 and over
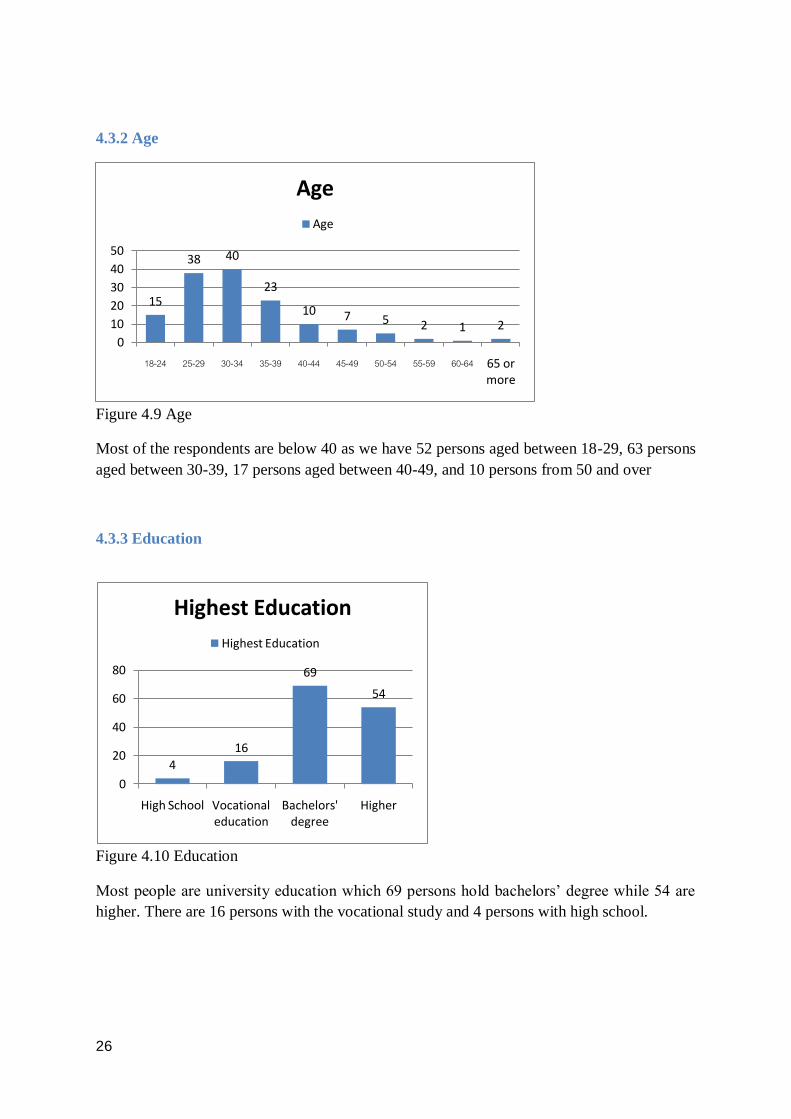
4.3.3 Education
Figure 4.10 Education
Most people are university education which 69 persons hold bachelors’ degree while 54 are
higher. There are 16 persons with the vocational study and 4 persons with high school.
15
38 40
23
10 7 5 2 1 2
0
10
20
30
40
50
18-24 25-29 30-34 35-39 40-44 45-49 50-54 55-59 60-64 65 or more
Age
Age
4
16
69
54
0
20
40
60
80
High School Vocational education
Bachelors' degree
Higher
Highest Education
Highest Education

27
4.3.4 Income
Figure 4.11 Income
Most respondents have income between SEK 150,000 to more than 300,000 (86 persons)
where the rest 38 persons have income between SEK 60,000-149,999 and 19 persons have
lower than SEK 60,000.
19
10 1216
32
17 19 18
05
101520253035
Income
Income
28
5. Analysis
In order to observe the relationship between organic food consumption and lifestyle we use
descriptive statistics and regression analysis which shows the correlation between the
dependent variable and independent variables. Firstly, descriptive statistics is used in order
to compare the data. Later we interpret all the correlations between the organic food eating
and other variables.
5.1 Descriptive Analysis
Gender, age, income, and education are compared between total population and organic food
consumer
5.1.1 Demographic data
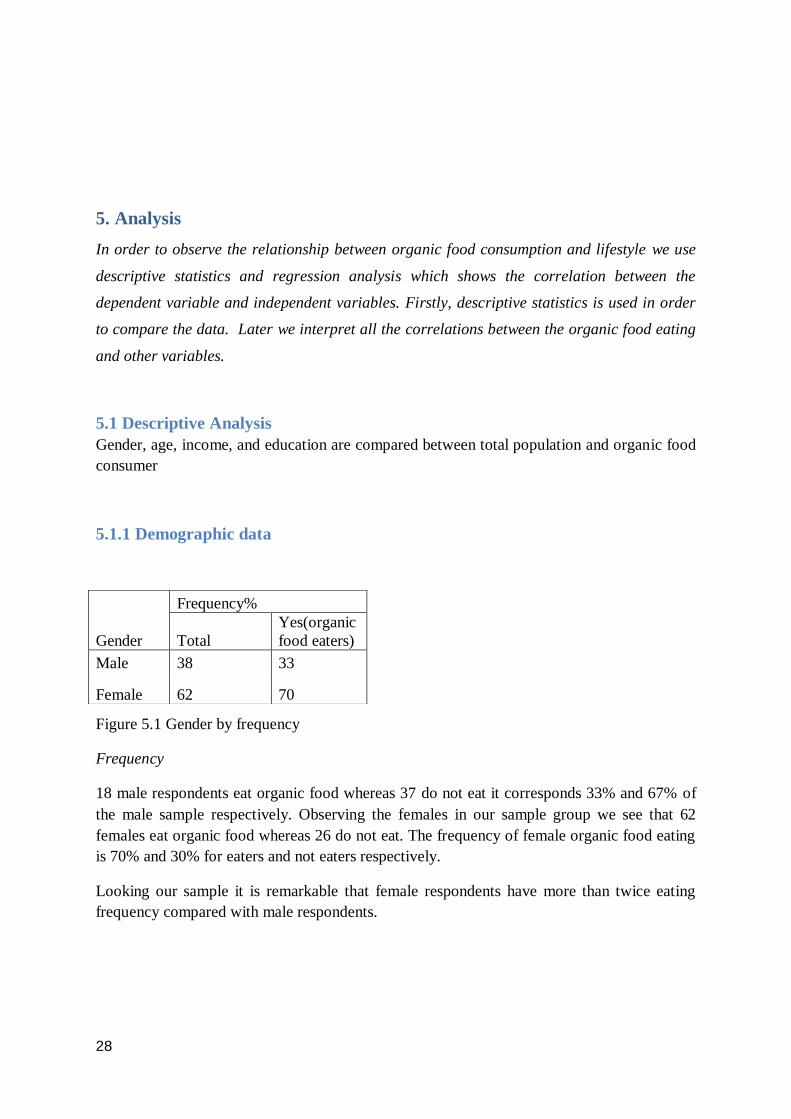
Figure 5.1 Gender by frequency
Frequency
18 male respondents eat organic food whereas 37 do not eat it corresponds 33% and 67% of
the male sample respectively. Observing the females in our sample group we see that 62
females eat organic food whereas 26 do not eat. The frequency of female organic food eating
is 70% and 30% for eaters and not eaters respectively.
Looking our sample it is remarkable that female respondents have more than twice eating
frequency compared with male respondents.
Gender
Frequency%
Total
Yes(organic
food eaters)
Male 38 33
Female 62 70

29
Age
Frequency% Mean Variance SD
Total Yes Total Yes Total Yes Total Yes
18-24 10.49 13.13
25-29 26.57 31.31
30-34 27.97 18.18
35-39 16.08 16.16 33.43 32.87 81.46 77 9.02 8.77
40-44 6.99 9.09
45-49 4.9 6.06
50-54 3.5 5.05
55-59 1.4 1.01
60-64 0.70 0
65 or more 1.4 0
Figure 5.2 Age with frequency, mean, variance, standard deviation
Frequency
The table above shows our total sample´s and organic food eaters age distribution.
Observing our total sample the age group of 30-34 has the highest frequency with 27.97%.
Age group 55-59 has the lowest frequency with 1.40 %. The age group of 25-29 has the
highest frequency with 31.31% among organic food eaters. Nobody in the age group 60-64
eats organic food.
Mean
The mean age of our total sample group and organic food eaters is 33.43 and 32.87. We can
observe that our organic food eaters are slightly younger compared with the whole sample
group.
Variance
The variance age for our whole sample group is 81.46 whereas the variance of organic food
eaters is 77. We can say that organic food eaters have a higher homogeneity of distribution in
the age groups. The sample group is clustered more in ages between 25 and 34.
Standard deviation
The standard deviation of the whole sample group and organic food eaters is 9.02 and 8.77
which are very close.

30
Figure 5.3 Education with frequency, mean, variance, standard deviation
Frequency
The frequency of education level for both the whole sample group and the organic food eaters
is presented above. We can postulate that there is no significant difference in terms of
frequency between two groups.
Calculating the mean, variance and standard deviation of the level of education it is not
possible to use the terms high school, bachelor etc. Therefore we numerate them as follows in
order to be able to calculate statistically. Each number represents the degree of education.
High school = 1, Vocational school = 2, Bachelors’ degree = 3, Higher = 4
Mean
The mean of education for the sample group is 3.15 which correspond between bachelor
degree and higher education closer to bachelor degree. The mean education level for organic
food eaters is slightly higher which is 3.24.
Variance
The education level variance of the whole sample group and organic food eaters is 0.69 and
0.61 respectively. There is no significant distribution difference in terms of education
between the two groups.
Standard deviation
The education level standard deviation of the whole sample group is 0.83. The same indicator
is 0.78 for organic food eaters.
Education
Frequency% Mean Variance SD
Total Yes Total Yes Total Yes Total Yes
High School 5.59 4.04
Vocational school 11.19 9.09 3.15 3.24 0.69 0.61 0.83 0.78
Bachelors' degree 45.45 45.45
Higher 37.76 41.41
Income
Frequency% Mean Variance SD
Total Yes Total Yes Total Yes Total Yes
Less than SEK 60,000 13.29 9.09
SEK 60,000-89,999 7.69 10.1
SEK 90,000-119,999 8.39 8.08 SEK SEK SEK SEK SEK SEK
SEK120,000-149,999 11.19 7.07 179,510 190,757 8471941791 8471941791 92,043.15 93,705.91
SEK150,000-179,999 21.68 22.22
SEK180,000-239,999 11.89 11.11
SEK240,000-299,999 13.29 18.18
SEK 300,000 or more 12.58 14.14

31
Figure 5.8 Income with frequency, mean, variance, standard deviation
Frequency
In the chart above we can observe the yearly household Income level frequency of our whole
sample group and organic food eaters. The income levels presented in VALS survey consist
of income gaps. The respondents cannot write how much money they earn yearly. They need
to pick the income gap presented by the survey. Since it is not possible to calculate statistical
matters such as variance, standard deviation, etc. with income gaps we take the average of
them for statistical calculations.
Example, 60000-89999 income gap:
60000+90000= 150000 150000/2=75000
Income
average
income
less than 60000 60000
60000-89999 75000
90000-119999 105000
120000-149999 135000
150000-179999 165000
180000-239999 220000
240000-299999 270000
300000 or more 350000
Mean
The mean yearly household income of the whole sample group and organic food eaters are
179510kr and 190757kr respectively. It is observable that the yearly mean household income
of organic food eaters is higher than the whole sample group.
Variance
The yearly household income variance of the whole sample group and organic food eaters
are 8471941791 and 8471941791 respectively. We can say that the income is distributed
more homogenously among the whole group compared with organic food eaters.
Standard deviation
The standard deviation of the whole sample group is 92043.15 whereas the same indicator is
93,705.91 for organic food eaters.
32
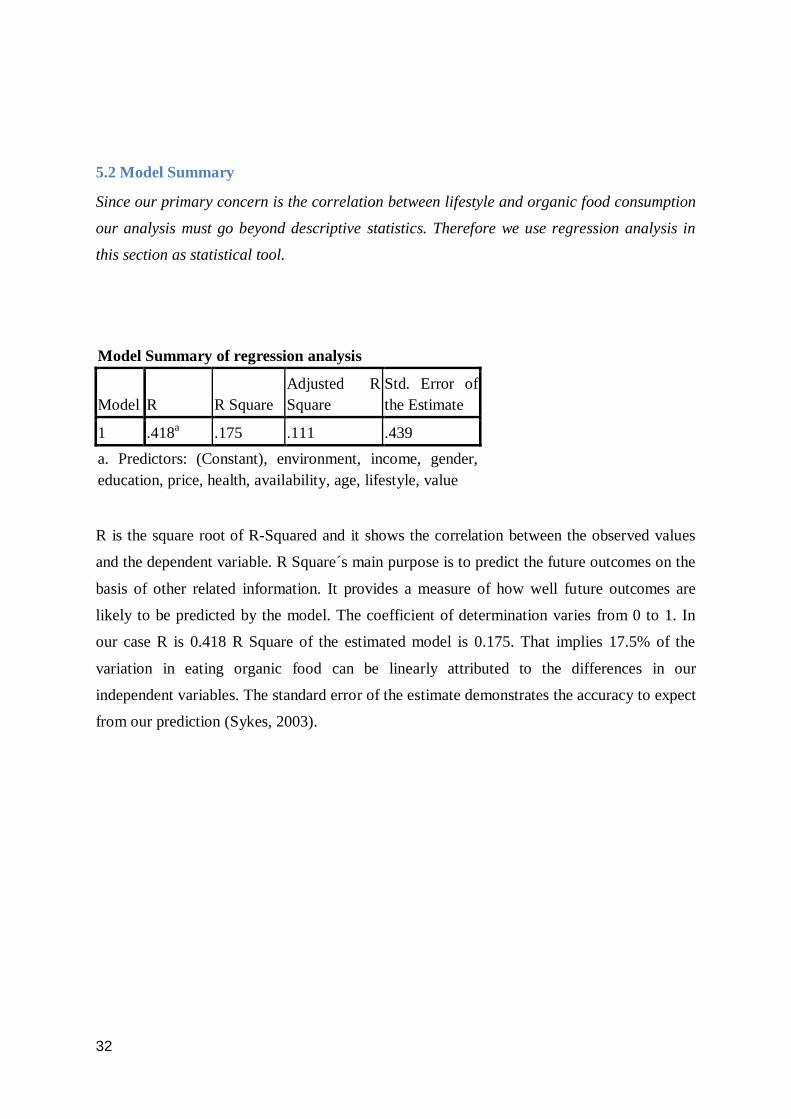
5.2 Model Summary
Since our primary concern is the correlation between lifestyle and organic food consumption
our analysis must go beyond descriptive statistics. Therefore we use regression analysis in
this section as statistical tool.
Model Summary of regression analysis
Model R R Square
Adjusted R
Square
Std. Error of
the Estimate
1 .418a .175 .111 .439
a. Predictors: (Constant), environment, income, gender,
education, price, health, availability, age, lifestyle, value
R is the square root of R-Squared and it shows the correlation between the observed values
and the dependent variable. R Square´s main purpose is to predict the future outcomes on the
basis of other related information. It provides a measure of how well future outcomes are
likely to be predicted by the model. The coefficient of determination varies from 0 to 1. In
our case R is 0.418 R Square of the estimated model is 0.175. That implies 17.5% of the
variation in eating organic food can be linearly attributed to the differences in our
independent variables. The standard error of the estimate demonstrates the accuracy to expect
from our prediction (Sykes, 2003).

33
ANOVA
Model
Sum of
Squares df Mean Square F Sig.
1 Regression 5.274 10 .527 2.732 .004a
Residual 24.898 129 .193
Total 30.171 139
a. Predictors: (Constant), environment, income, gender, education, price, health,
availability, age, lifestyle, value
b. Dependent Variable: eating
Coefficientsa
Model
Unstandardized
Coefficients
Standardized
Coefficients
T Sig. B Std. Error Beta
1 (Constant) 1.541 .415 3.710 .000
Lifestyle .055 .026 .196 2.122 .036
Age -.008 .023 -.032 -.347 .729
Gender .061 .083 .064 .739 .462
Education .115 .055 .184 2.074 .040
Income .005 .019 .023 .256 .798
Price .022 .041 .048 .544 .588
Availability .039 .047 .070 .827 .410
Value -.015 .051 -.030 -.294 .769
Health -.151 .052 -.267 -2.905 .004
environment -.041 .045 -.087 -.907 .366
a. Dependent Variable: eating

34
On the left column we see our Independent variables environment, income, gender,
education, price, health, availability, age, lifestyle, value as constant. The value constant,
which is referred also by Y intercept, is the height of the regression line on the Y axis when
all the other variables are 0. On the very right column we see the level of significance. If this
value is lower than 0.05 the results are statistically significant and we can reject the null
hypothesis. In our case the significance level of lifestyle is 0.036. Since 0.036<0.05 we can
conclude that our result about lifestyle, our main independent variable, is significant. The null
hypothesis that there is no relationship between lifestyle and eating organic food is rejected.
The standard error which is observable besides the coefficients is an estimate of the standard
deviation of the coefficient, the amount it varies from case to case. It can be accounted as a
measure of the precision with which the coefficient is measured. If a coefficient is large
compared to its standard error, then it is probably different from 0 (Fisher, 2007)
According to our conceptual framework we have clustered our independent variables into 3
groups lifestyle, demographic and motivational variables The only variable in the first group
is lifestyle which is our main independent variable. This variable like the other variables has
emerged after the VALS questionnaire conducted among our respondents. The difference
between the variable lifestyle and other independent variables is that it is a composition of
many respondents’ answers. The second group consists of demographic variables gender,
income, age and education. The third group is variables about motivation toward organic
food consumption. As described in theoretical framework this factor consists of personal
relevance which is health concern and environmental concern (depicted as health and
environment in the model), values, and perceived risk which is availability and price. Our
main purpose in this regression analysis is to investigate the correlation between eating
organic food (dependent variable) and lifestyle independent variable.
5.2.1 Interpretation of coefficients
As mentioned before our model is useful by observing the changes in dependent variable by
varying an independent variable while holding other independents constant.
5.2.2 Lifestyle
The coefficient for lifestyle is .055. So for every unit increase in lifestyle, a 0.055 unit
increase in consumption is predicted, while holding all the other variables constant. In other
words a leap from a low resource lifestyle such us believer, striver to a high resource lifestyle
such as thinker, achiever, experiencer and innovator will increase the likelihood of organic
food eating by 5.5%.

35
5.2.3 Demographic variables
The coefficient for age is -0.08. That means for every unit increase in age the likelihood of
eating organic food will decrease by 0.08 unit while other variables are held constant. There
is an inverse relationship between age and organic food consumption since the sign of the
coefficient is negative. The younger a person is the more probably consumes organic food.
However as the sig. value of the variable age is 0.729 and .729>0.05 this relationship is not
statistically significant.
The coefficient for gender is .061. Since we have coded male as 0 and female 1 in SPSS this
means that holding other variables constant and changing gender from man to women, a
correspondent is more likely to eat organic food by 0.061%. The level of significance for
gender is 0,462 which is bigger than 0.05 therefore we should assume that the relationship
between gender and organic food eating is not statistically significant.
The coefficient for the level of education is .115 which means that an increase in education
by one unit will increase the probability of organic food consumption by 0.115 unit while
holding other variables constant. In our case, an increase in education level i.e. from
bachelor to a master degree will escalate the probability of organic food consumption. The
sig. value for education is 0.4 which is bigger than 0.05. For this reason the relationship of
the level of education and organic food consumption is not statistically significant.
The coefficient for income is .005. For every unit increase in household income the
probability of organic food eating escalates 0.005 unit while holding the other variables
constant. (1 unit= 30000sek). Monitoring the sig. value of income we can conclude that the
relationship between income and organic food consumption is not significant statistically
since the sig value of income is bigger than 0,005. (0.798>0.05)
5.2.4 Motivation variables
We should keep in mind that in our questionnaire we asked the respondents to give points to
the motivation variables where 5 is the highest and 1 is the lowest. So it would be misleading
if we interpret the price the same way as the demographic variables and lifestyle. The
coefficient for price is .022. There is a positive relationship between price and organic food
eating however it does not mean that an increase in price will increase the organic food
consumption. Since the price for the respondent is important we can interpret it as follows,
one unit decrease in price yields a 0.022 unit increase in the probability of organic food
eating while other variables are constant. However we cannot claim that the relationship
between price and organic food eating is significant statistically since the sig. value for price
which is 0.588 is bigger than 0.05.
The coefficient for availability is .039. If we increase availability by one unit while holding
the other variables constant the probability of organic food eating increases 0.39 units. When
36
it come to the level of significance there is not a statistically significant relationship between
availability and our dependent variable. (0,41>0.05).
The coefficients for value, health concern and environmental concern can be interpreted in
the same way. All the three variables have a negative coefficient which means that increases
in those variables yield to decrease in the likelihood of organic food eating. The coefficients
for value, health and environment are -.015, -.151, -.041 respectively. One unit increase in
those variables( one by one, not all of them at once) while holding the other variables
constant results respectively 0.015, 0.151 and 0.042 units decrease in the probability of
organic food eating. Considering the sig. values of the variables health concern (0.004),
environmental concern (0.769) and value(0.366) it is observable that there is a statistically
significant relationship between health concern and organic food consumption whereas there
is not for value and environmental concern. (0.004<0.05 ; 0.769>0.05 ; 0.366>0.05)
37
6. Conclusion
In this part the purpose is summarized and compare our study results are compared with
previous organic food studies that have presented in problem discussion as well as practical
contribution and further research
Back to the conceptual framework this research is conducted to reveal how organic food
consumption is effected by other factors not least lifestyle. Throughout the literature review
we have encountered that organic food consumption is effected by demographic factors.
Besides that there are indeed other factors which effect consumer behavior such as
motivational factors. That is the reason why we do not only monitor the sheer relationship
between lifestyle and organic food eating. So we choose to built our model based on the
assumption that how lifestyle can effect organic food consumption by having been moderated
by motivational and demographic factors. In other words, prioritizing the relationship
between lifestyle and organic food consumption we tried to peer how also the demographical
and motivational factors affect our dependent variable.
The main purpose of this paper is to investigate the relationship between lifestyle and organic
food consumption in Sweden. The purpose is accomplished by collecting data and conducting
a regression analysis. We obtain a coefficient of 0.055 which shows that there is a positive
relationship between lifestyle and organic food consumption. As stated in analysis a shift
from a low resource lifestyle such us believer, achiever, striver to a high resource lifestyle
such as thinker, achiever, experiencer, and innovator will increase the likelihood of eating
organic food by 5.5% by holding the other factors constant. Furthermore as stated in the
analysis part the sig. value for lifestyle is 0,036 which is smaller 0.05 and makes the
correlation statistically significant. Thus we have validated the theory that lifestyle influences
consumption.
In the theoretical framework it is mentioned that there are other factors which influence
organic food consumption besides lifestyle such as demographic factors and motivation. We
examined the findings of other authors who claim that other factors such as age, gender,
price, education, availability effect (organic food) consumption. Our findings correspond
with theirs. We found that there is a relationship with all those factors and organic food
consumption. This paper does not reveal a new theory nevertheless our findings vindicate the
existing theories about the affects of age, gender, education and lifestyle by organic food
consumption.
Wandel & Bugge (1997), Von Alvensleben R. (1998) found that young people (less than 45)
eat more organic food. Our research validates their findings since there is a negative
correlation between age and organic food consumption. Furthermore Mathisson & Schollin
(1994) and Wandel & Bugge (1997) claim that women and well educated people are more
interested in organic food. Our findings are in line with theirs we have both for women and

38
education positive coefficient which means women and educated people are more apt to
consume organic food.
As we found in our analysis that there is a positive relationship between low price , high
availability and organic food consumption as Jolly (1991), Magnusson et al (2001),
Mathisson & Schollin (1994) ,Roddy et al (1996) show in their research that the main
obstacles of buying are the high price and limited availability. So our findings correspond
with theirs.
For the motivation (Von Alvensleben & Altmann, 1986; Wandel & Bugge, 1995) find that
young people buy because of environmental as well as health reasons but old people buy
because of health reason. On the contrary we found that variables health and environmental
concern have a negative relationship with organic food consumption. In that regard our
research does not correspond to theirs. Regarding value perception our findings contradict
with the studies of Davies et al (1995), Magnusson et al (2001), Fotopoulos & Krystallis
(2002), who claim that lack of value perception is a hindrance for organic food consumption.
Yet our analysis shows that there is a negative relationship between value and organic food
consumption.
For practical contribution due to our analysis can proof that lifestyle has positively
significant relationship with organic food consumption. Therefore lifestyle is a useful market
segmentation tool for marketers in organic food business in order to define the target market
rather than only using demographic segmentation. When marketer can define more precise
consumer they can develop better marketing communication and overall strategy to the target
as they will know what kind of marketing activities suit for consumers’ lifestyle.
For the VALS survey most lifestyle of organic food consumer is driven by achievement as we
have 30 achievers and 18 strivers. This character says they are successful work-oriented
people and favor products and service that show off their success to their peers. The
difference of these lifestyles is that achievers come from high resource group whereas strivers
belong to low resource group. In this point we can see that even though people who have
lower resources can have similar lifestyles they can have same wants. Therefore it is not
necessary to segment market by whom hold high resource but rather whom with same needs.
In this case organic food marketer must understand not only demographical difference but
also have to understand what they are psychographically.
Further research as mentioned in limitations part our paper have limitations and further
research should be conducted to go beyond limitations. A further quantitative study with a
bigger and better distributed sample in Swedish market could be helpful to obtain more
accurate results by other sampling method such a study could be able to generalize and
explain to entire population. In other words, further research with more respondents from
different backgrounds and regions in Sweden would shed light on the relationship between
lifestyle and organic food consumption. Such an extended research would enable the
researchers to examine the whole picture.

39
Appendix 1 Questionnaire Swedish Version
EKOLOGISK MAT KONSUMENT´S LIVSTIL
Den här enkät är en del av examensarbete i internationell marknadsföring på Mälardalens
Högskola, Sverige. Alla respondenternas svaren är konfidentiella och kommer inte att vara
tillgängliga för tredjepart. Enkäten handlar om livsstil undersökning. Det skulle ta cirka 5
minuter. Vänligen bidra till fyllning av frågeformuläret nedan. Alla frågor är enkla och inte
komplicerat att svara. Tack för din vänliga samarbete:)
Äter du ekologisk mat?
Ja
Nej
Faktorer som påverkar din ekologisk mat konsumption
Vänligen rangordna de faktorer som påverkar din konsumtion av ekologisk mat. 1 är minst
viktigt och 5 är den viktigaste
1 2 3 4 5
Minst viktig Lite viktig Mellan viktig Viktig Mest viktig
1. Pris
2.Tillgänglighet
3. Värde
4.Hälso
koncern
5. Miljö koncen
Verksamheter, intressen och åsikter
Följande påståenden handlar om dina aktiviteter, intressen och åsikter. Vänligen rangordna
graden av din åsikt. 1 = stark emot, 2 = emot, 3 = håller med, 4 = håller fullständigt med
1 2 3 4
Stark
emot
Emot Håller
med
Håller
fullständigt
med
1. Jag följer de senaste trenderna och mode
2. Jag trivs med saker som är nya och annorlunda
3.Jag tycker det är viktigt att utsättas för stora

40
variationer i livet
4. Jag trivs med att skapa saker som jag har användning
för
5. Jag är ofta intresserad av teorier
6. Jag är religiös
7. Jag trivs med att ha ansvar för en grupp
8. Jag tycker om att lära mig om konst, kultur och
historia
9. Jag trivs med spännande uppgifter
10. Jag är genuint intresserad av endast ett fåtal saker
11. Jag skulle hellre skapa något än att köpa det
12. Jag klär mig trendigare än de flesta
13. Regeringen bör uppmuntra individer till bön i
offentliga skolor
14. Jag anser mig vara mer kapabel än de flesta i min
omgivining
15. Jag anser att jag har ett utvecklat intellekt
16. Jag njuter av att visa upp mig
17. Jag tycker om att prova nya saker
18. Jag har ett starkt intresse för teknik och mekanik
19. Jag gillar att klä mig enligt det senaste modet
20. Det är för mycket sex på tv
21. Jag är bra på att leda andra
22. Jag skulle vilja tillbringa ett år eller mer utomlands
23. Jag trivs med att ha en hel del spänning i mitt liv
24. Mina intressen är ganska smala och begränsade
25. Jag gillar att skapa saker av trä, metall och/eller
andra typer av material
26. Jag vill bli betraktade som modemedveten
27. En kvinnas liv är endast fullständigt om hon kan
göra sin familj lycklig
28. Jag trivs med utmaningar och gör gärna saker som
jag aldrig tidigare har gjort
29. Jag gillar att lära mig om nya saker, trots att de
egentligen inte uppfyller något särskilt syfte
30. Jag gillar att skapa saker med mina händer
31. Jag är ständigt på jakt efter spänning i livet
32. Jag tycker om nya spännande upplevelser
33. Jag tycker om att besöka elektronik - och
teknikbutiker
34. Jag skulle vilja bilda mig en större förståelse för hur
universum fungerar
35. Jag vill att mitt liv ska vara ungefär likadant från
vecka till vecka

41
DEMOGRAFISKA DATA
Vänligen tecka din kö och ålder
Kön Ålder
Kön 18-24 30-34 40-44 50-54 60-64
Kvinna 25-29 35-39 45-49 55-59 65 eller äldre
Vilken är den högsta utbildning du har slutfört
Grundskola Gymnasiet Kandidat Magister och ytteerligare
Vänligen techkna vilken är din årliga totala hushållsinkomsten?
mindre än SEK 60,000 SEK 60,000 - 89,999 SEK 90,000 - 119,999
SEK 120,000 - 149,999
SEK 150,000 - 179,999 SEK 180,000 - 239,999 SEK 240,000 - 299,999
SEK 300,000 eller mer
TACK SÅ JÄTTEMYCKET!
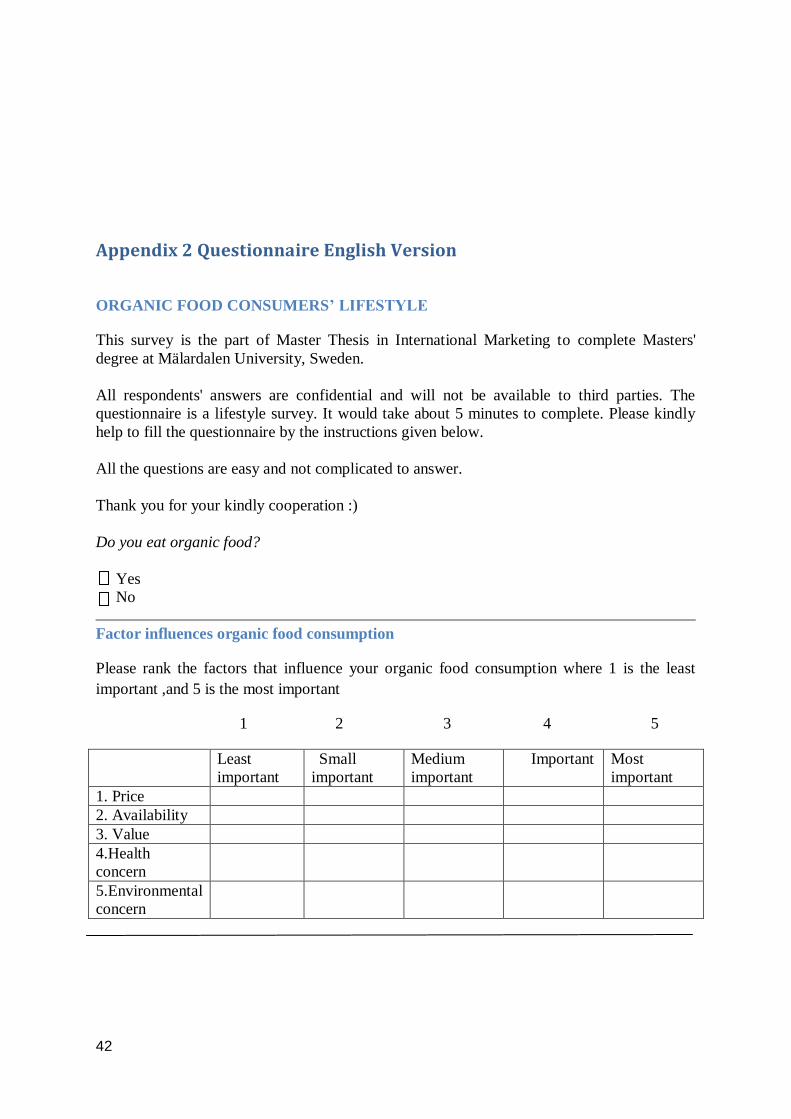
42
Appendix 2 Questionnaire English Version
ORGANIC FOOD CONSUMERS’ LIFESTYLE
This survey is the part of Master Thesis in International Marketing to complete Masters'
degree at Mälardalen University, Sweden.
All respondents' answers are confidential and will not be available to third parties. The
questionnaire is a lifestyle survey. It would take about 5 minutes to complete. Please kindly
help to fill the questionnaire by the instructions given below.
All the questions are easy and not complicated to answer.
Thank you for your kindly cooperation :)
Do you eat organic food?
Yes
No
Factor influences organic food consumption
Please rank the factors that influence your organic food consumption where 1 is the least
important ,and 5 is the most important
1 2 3 4 5
Least
important
Small
important
Medium
important
Important Most
important
1. Price
2. Availability
3. Value
4.Health
concern
5.Environmental
concern
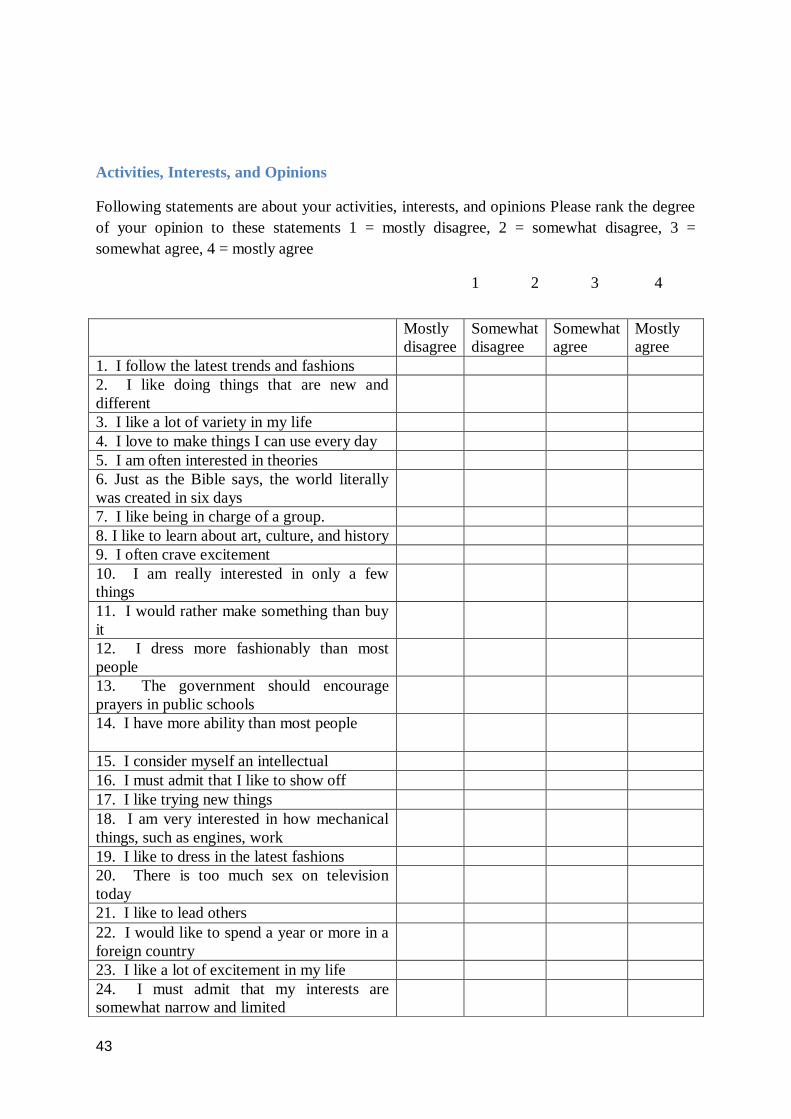
43
Activities, Interests, and Opinions
Following statements are about your activities, interests, and opinions Please rank the degree
of your opinion to these statements 1 = mostly disagree, 2 = somewhat disagree, 3 =
somewhat agree, 4 = mostly agree
1 2 3 4
Mostly
disagree
Somewhat
disagree
Somewhat
agree
Mostly
agree
1. I follow the latest trends and fashions
2. I like doing things that are new and
different
3. I like a lot of variety in my life
4. I love to make things I can use every day
5. I am often interested in theories
6. Just as the Bible says, the world literally
was created in six days
7. I like being in charge of a group.
8. I like to learn about art, culture, and history
9. I often crave excitement
10. I am really interested in only a few
things
11. I would rather make something than buy
it
12. I dress more fashionably than most
people
13. The government should encourage
prayers in public schools
14. I have more ability than most people
15. I consider myself an intellectual
16. I must admit that I like to show off
17. I like trying new things
18. I am very interested in how mechanical
things, such as engines, work
19. I like to dress in the latest fashions
20. There is too much sex on television
today
21. I like to lead others
22. I would like to spend a year or more in a
foreign country
23. I like a lot of excitement in my life
24. I must admit that my interests are
somewhat narrow and limited
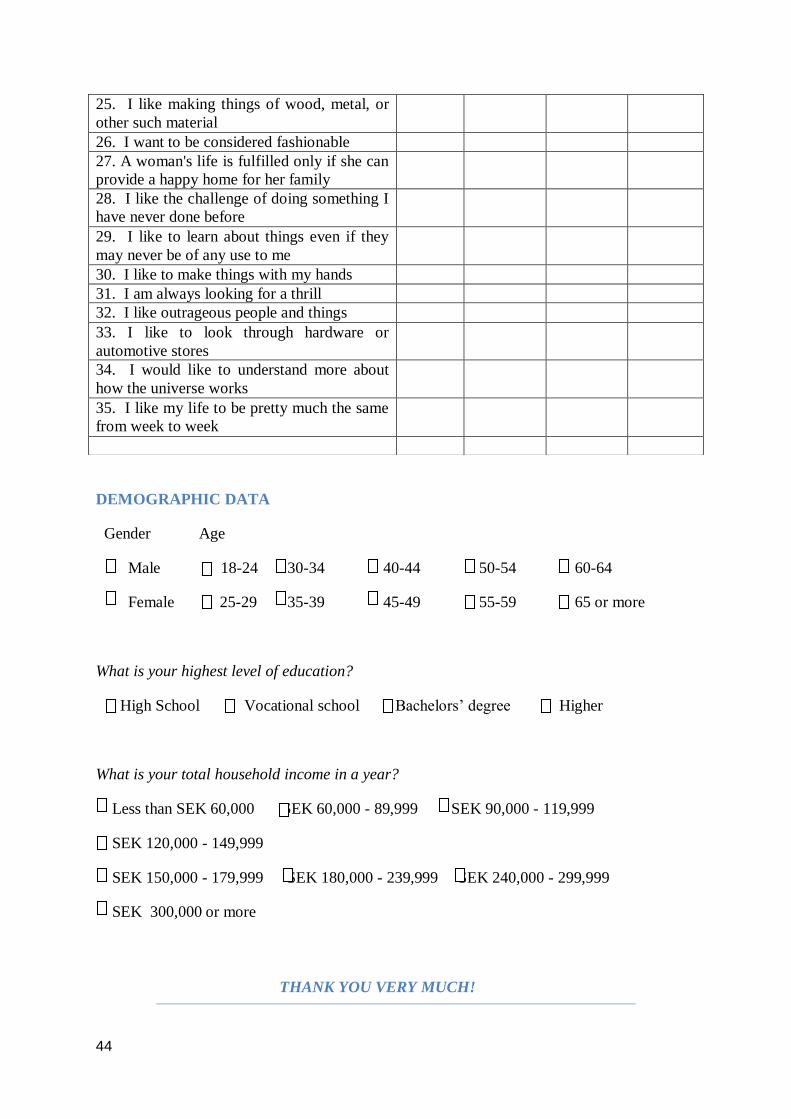
44
DEMOGRAPHIC DATA
Gender Age
Male 18-24 30-34 40-44 50-54 60-64
Female 25-29 35-39 45-49 55-59 65 or more
What is your highest level of education?
High School Vocational school Bachelors’ degree Higher
What is your total household income in a year?
Less than SEK 60,000 SEK 60,000 - 89,999 SEK 90,000 - 119,999
SEK 120,000 - 149,999
SEK 150,000 - 179,999 SEK 180,000 - 239,999 SEK 240,000 - 299,999
SEK 300,000 or more
THANK YOU VERY MUCH!
25. I like making things of wood, metal, or
other such material
26. I want to be considered fashionable
27. A woman's life is fulfilled only if she can
provide a happy home for her family
28. I like the challenge of doing something I
have never done before
29. I like to learn about things even if they
may never be of any use to me
30. I like to make things with my hands
31. I am always looking for a thrill
32. I like outrageous people and things
33. I like to look through hardware or
automotive stores
34. I would like to understand more about
how the universe works
35. I like my life to be pretty much the same
from week to week

45
Appendix 3 Encoding variables to stata

46
Bibliography
Browne, A., Harris, P., Hofne-Collins, A., Pasiecznic, N., & Wallace, R. (2000). Organic
production and ethical trade : definition, practice and links. Food Policy , Vol. 25, pp. 69-89.
Buttner, J. (1997). Diagnostic Validity as a theoretical concept and as a measurable quantity.
Castillo, J. J. (2009). convenience sampling. Retrieved April 1, 2011, from www.experiment-
resource.com: http://www.experiment-resources.com/convenience-sampling.html
Cateora, G. a. (2010). International Marketing 3rd Edition. London, U.K.: McGraw-Hill.
Cobanoglu, C., & Cobanoglu, N. (2003). The effect of incentives in web survey: application
and ethical consideration. International Journal of Market Research , Vol. 45 Q. 4 Pg 475-
488.
Consumer demand. (2005). Retrieved 4 6, 2011, from european commission web site:
http://ec.europa.eu/agriculture/organic/consumer-confidence/consumer-demand_en
Davies, A., Titterington, A., & Cochrane, C. (1995). Who buys organic food? A profile of the
purchasers of organic food in Northern Ireland. British Food Journal , Vol.97 No.10 pp.17-
23.
Ekelund, L. (1989). Vegetable consumption and consumer attitudes towards organically
grown vegetables-the case of Sweden. Acta Horticulturae , Vol. 259, pp.163-72.
Ekologisk mat fortsätter öka i Sverige. (2011). Retrieved April 6, 2011, from Ekocentrum:
http://www.ekocentrum.se/nyheter.php?id=1128
Evans, M., Jamal, A., & Foxall, G. (2009). Consumer Behaviour. a John Wiley and Sons, ltd.,
Publication.
Fisher, C. (2007). Researching and Writing A Dissertation 2nd edition. Essex: Pearson
Education Limited.
Fotopoulos, C., & Krystallis, A. (2002). Organic product avoidance:reasons for rejection and
potential buyers indetification in a countrywide survey. British Food Journal , Vol.104 No.9
pp.730-65.
Galloway, K. (1997). Non-probability samples. Retrieved April 10, 2011, from
http://tardis.ed.ac.uk: http://www.tardis.ed.ac.uk/~kate/qmcweb/s8.htm
Gil, J. G. (2000). market segmentation and willingness to pay for organic products in Spain.
The International Food and Agribusiness Maagement Review , vol. 3. No. 2 pp.207-26.
Greenan, H. P., & McIvor, R. (1997). The green initiative : improving quality and
competitiveness. European Business Review , Vol. 97 No. 5, pp. 208-14.
47
Grunert, G. (1993). Green consumerism in Denmark: some evidence from the EKO foods
project. Der Markt , Vol. 32 No. 3, pp.140-51.
Gunter, B., & Furnham, A. (1992). Consumer Profiles : An Introduction to Psychographics.
Routledge.
Haest, C. (1990). From farmer to shelf: trade of organically grown products. Ecology and
Farming , Vol.1 No.1, pp.9-11.
Halvorsen, K. (1992). Samhällsvetenskaplig metod. Lund: studentlitteratur.
Healey, J., & Prus, S. (2009). Statistics: a tool for social research. Nelson Education.
Herek, G. M. (2009). A brief introduction to sampling. Retrieved April 10, 2011, from
http://psychology.ucdavis.edu: http://psychology.ucdavis.edu/rainbow/html/fact_sample.html
Howell, J., Miller, P., Park, H. H., Satter, D., Schack, T., Spery, E., et al. (2005). validity and
reliability. Retrieved April 10, 2011, from writting@csu:
http://writing.colostate.edu/guides/research/relval/pop2b.cfm
Hoyer, W. D., & Maclnnis, D. J. (2001). Consumer Behavior 2nd Edition. Boston, NY:
Houghton Mifflin Company.
Huang, C. (1996). Consumer preferences and attitude towards organically grown produce.
European Review of Agricultural Economics , Vol. 23, pp.331-42.
Jolly, D. (1991). Differences between buyers and nonbuyers of organic produce and
willingness to pay organic price premiums. Jornal of Agribusiness , Vol. 9 No. 1, pp.97-111.
Jones, C. (2011). advantages & disadvantages of qualitative & Quantitative research.
Retrieved April 26, 2011, from www.ehow.com:
http://www.ehow.com/info_8091178_advantages-disadvantages-qualitative-quantitative-
research.html
Juneja, H. (2011). secondary data. Retrieved April 26, 2011, from
www.managementstudyguide.com: www.managementstudyguide.com:
http://www.managementstudyguide.com/secondary_data.htm
justice, J. J. (2011). http://web.jjay.cuny.edu/. Retrieved July 6, 2011, from
http://web.jjay.cuny.edu/~pzapf/classes/CRJ70000/Internal%20and%20External%20Validity.
htm
Krystallis, A., & Chryssohoidis, G. (2005). Consumers' willingness to pay for organic food:
Factors that affect it and variation per organic product type. British Food Journal , Vol. 107
No. 5 pp.320-343.
Lampkin, N. (1999). From niche to mainstream for EU organic farming. Proceedings of
euro-Organics'99 AgraEurope Conference, London .

48
Laroche, M., Bergeron, J., & Barbaro-Forleo, G. (2001). Targeting consumers who are
willing to pay more for environmentally friendly products. Journal of consumer marketing ,
Vol.18 No.6, pp.503-20.
Lawson, R., & Todd, S. (2002). Consumer Lifestyles : A Social Stratification Persperctive.
Marketing Theory pp 295.
Lohr, L. (2001). Factors Affecting International Demand and Trade in Organic Food
Products. Economic Research Service / USDA , pp.67-79.
Lund, A. (2010). convenience sampling : An overview. Retrieved April 1, 2011, from
dissertation.leard.com: http://dissertation.laerd.com/articles/convenience-sampling-an-
overview.php
Magnusson, M. K., Arvola, A., Hursti, U.-K. K., Åberg, L., & Sjoden, P. (2001). Attitudes
towards organic foods among Swedish consumers. British Food Journal , Vol.103 No. 3 pp
209-226.
Mathisson, K., & Schollin, A. (1994). Konsumenstaspekter på ekologiskt odlade gronsaker-
en jämforande studie (Consumer aspercts on organic vegetables-a coparative study). Report
No. 18, Department of Crop Production Sciences, Swedish University of Agricultural
Sciences .
Meeker, W. Q., & Escobar, L. A. (1998). Statistical Methods for Reliability Data. Hoboken,
New Jersey: Wiley.
Menghi, A. (1997). Consumer Response to Ecological Milk in Sweden. Uppsala: Swedish
Agricultural University.
Menuet, T. L. (2010). Consumer’s switching behavior in the new Swedish energy market.
Michman, R., & Mazze, E. (2009). The Affluent Consumer: Marketing and Selling the Luxury
Lifestyle. New York, NY: Praeger Publishers.
Misra, S., Huang, C., & Ott, S. (1991). Georgia consumers preference for organically grown
fresh produce. Journal of Agribusiness , Vol.9 No.2 pp.53-65.
Nykiel, R. A. (2007). Handbook of Marketing Research Methodologies for Hospitality and
tourism. Binghamton, NY: The Haworth Press Inc.
Plummer, J. (1974). The concepts and application of life style segmentation. Journal of
Marketing , Vol.38 No.1 pp.33-37.
quickmba. (2010). Retrieved May 7, 2011, from www.quickmba.com:
http://www.quickmba.com/stats/dispersion/
Roddy, G., Cowan, C., & Hutchinson, G. (1996). Consumer attitudes and behavior to organic
food in Ireland. Journal of International Consumer Marketing , Vol. 9 No. 2 pp.41-63.
49
Solomom, M. (2007). Consumer Behavior: Buying, having and Being. USA: Pearson
Prentice hall.
Sweden, Agriculture. (n.d.). Retrieved March 21, 2011, from www.nationsencyclopedia.com:
http://www.nationsencyclopedia.com/Europe/Sweden-AGRICULTURE.html
Tam, J. L., & Tai, S. H. (1998). The psychographic segmentation of the female market in
Greater China. International Marketing Review , Vol. 15 No.1 pp.61-77.
The business of food. (2011). Retrieved April 6, 2011, from encyclopedia of the food and
drink industries.
(1999). The Swedish Market for Organic Food. GroLink AB.
Trochim, W. (2006). descriptive statistics. Retrieved April 10, 2011, from
www.socialresearchmethod.net: http://www.socialresearchmethods.net/kb/statdesc.php
Tsakiridou, E., Boutsouki, C., Zotos, Y., & Mattas, K. (2008). Attitudes and behaviour
towards organic products: an exploratory study. International Journal of Retail &
Distribution Management , Vol. 36 No. 2, pp. 158-175.
VALS . (2011). Retrieved April 1, 2011, from www.strategicbusinessinsights.com:
http://www.strategicbusinessinsights.com/vals/ustypes.shtml
Von Alvensleben, R. (1998). Ecological aspects of food demand: the case of organic food in
Germany. AIR-CAT 4th Plenary Meeting : Health, Ecological and Safety Aspects in Food
Choice , Vol. 4 No. 1, pp.68-79.
Von Alvensleben, R., & Altmann, M. (1986). Die Nachfrage nach alternativen
Nahrschaftungsmitteln. Agrawirtschaft , Vol. 35, pp.289-95.
Wandel, M., & Bugge, A. (1997). Environmental concern in consumer evaluation of food
quality. Food Quality and Preference , Vol. 8 No. 1, pp. 19-26.
Wandel, M., & Bugge, A. (1995). Forbrukerholdninger til moderne matvareproducksjon.
Landbruksokonomisk Forum , Vol. 12 No. 1, pp.15-25.
Wier, M., & Smed, S. (2000). Consumption of Organic Foods, Part 2 : Modelling demand.
Roskilde: Techincal Report No. 319, National Environmental Research Institute.
Wier, M., Andersen, L., & Millock, K. (2003). Consumer demand for organic foods-attitudes,
values and purchasing. paper presented at SOM Workshop, Environment,Information and
Consumer , Frederiksdal, April.
William, D., & Douglas, J. (1971). "activities, interest, opinion". Journal of advertising
research , pp.27-35.
Zakowska-Biemans, S. (2011). Polish consumer food choices and beliefs abut organic food.
British Food Journal , Vol.113 No.1 pp.122-137.

50


