ML6416 FM LC AM Bk1 sol v1.0 - leapzuul.getmagicbox.com
17
503 Chapter 5 Exercise 5.1 Q. 1. (i) The distribution of the sample means will be approximately normal. (ii) Mean of the distribution of sample means = m Standard deviation of the distribution = s ___ √ __ n = s _____ √ ____ 400 = s ___ 20 Q. 2. m __ x = 9, s __ x = 2 ____ √ ___ 49 = 2 __ 7 z = __ x − m __ x ______ s __ x or __ x − m _____ s ___ √ __ n z = 10 − 9 ______ 2 __ 7 = 3.5 P(z . 3.5) = 1 − P(z ø 3.5) = 1 − 0.9989 = 0.0011 Q. 3. (i) z = x − m _____ s z = 167 − 164.4 ___________ 6.25 z = 0.416 P(z , 0.416) = 0.6613 (ii) m __ x = 164.4, s __ x = 6.25 _____ √ ___ 25 = 1.25 z = 167 − 164.4 ___________ 1.25 = 2.08 P(z , 2.08) = 0.9812 (iii) We were able to use the CLT as the underlying population is normally distributed. Q. 4. (i) z = x − m _____ s z = 182 − 177.5 ___________ 6.3 z = 0.7143 z = 173 − 177.5 ___________ 6.3 = −0.7143 P(173 ø x ø 182) = P(−0.7143 , z , 0.7143) P(−0.7143 , z , 0.7143) = 2P(z ø 0.7143) − 1 = 2(0.7625) − 1 = 0.52 –0.7143 0.7143 ACTIVE MATHS 4 BOOK 2 CH 05 SOLUTIONS
Transcript of ML6416 FM LC AM Bk1 sol v1.0 - leapzuul.getmagicbox.com
503
Chapter 5
Exercise 5.1Q. 1. (i) The distribution of the sample means will be approximately normal.
(ii) Mean of the distribution of sample means = m
Standard deviation of the distribution = s ___ √
__ n
= s _____
√ ____
400
= s ___ 20
Q. 2. m __ x = 9, s __
x = 2 ____
√ ___
49 = 2 __
7
z = __ x − m __
x ______ s __
x or __ x − m
_____ s ___
√ __
n
z = 10 − 9 ______
2 __ 7 = 3.5
P(z . 3.5) = 1 − P(z ø 3.5)
= 1 − 0.9989
= 0.0011
Q. 3. (i) z = x − m
_____ s
z = 167 − 164.4 ___________ 6.25
z = 0.416
P(z , 0.416) = 0.6613
(ii) m __ x = 164.4, s __
x = 6.25 _____
√ ___
25 = 1.25
z = 167 − 164.4 ___________ 1.25 = 2.08
P(z , 2.08) = 0.9812
(iii) We were able to use the CLT as the underlying population is normally distributed.
Q. 4. (i) z = x − m
_____ s
z = 182 − 177.5 ___________ 6.3
z = 0.7143
z = 173 − 177.5 ___________ 6.3
= −0.7143
P(173 ø x ø 182) = P(−0.7143 , z , 0.7143)
P(−0.7143 , z , 0.7143) = 2P(z ø 0.7143) − 1
= 2(0.7625) − 1
= 0.52
–0.7143 0.7143
ACTIVE MATHS 4 BOOK 2 CH 05 SOLUTIONS
ML6416_05_LC_AM_Bk2_sol_v5.0.indd 503 07/07/16 12:18 PM
504 ACTIVE MATHS 4 BOOK 2 CH 05 SOLUTIONS
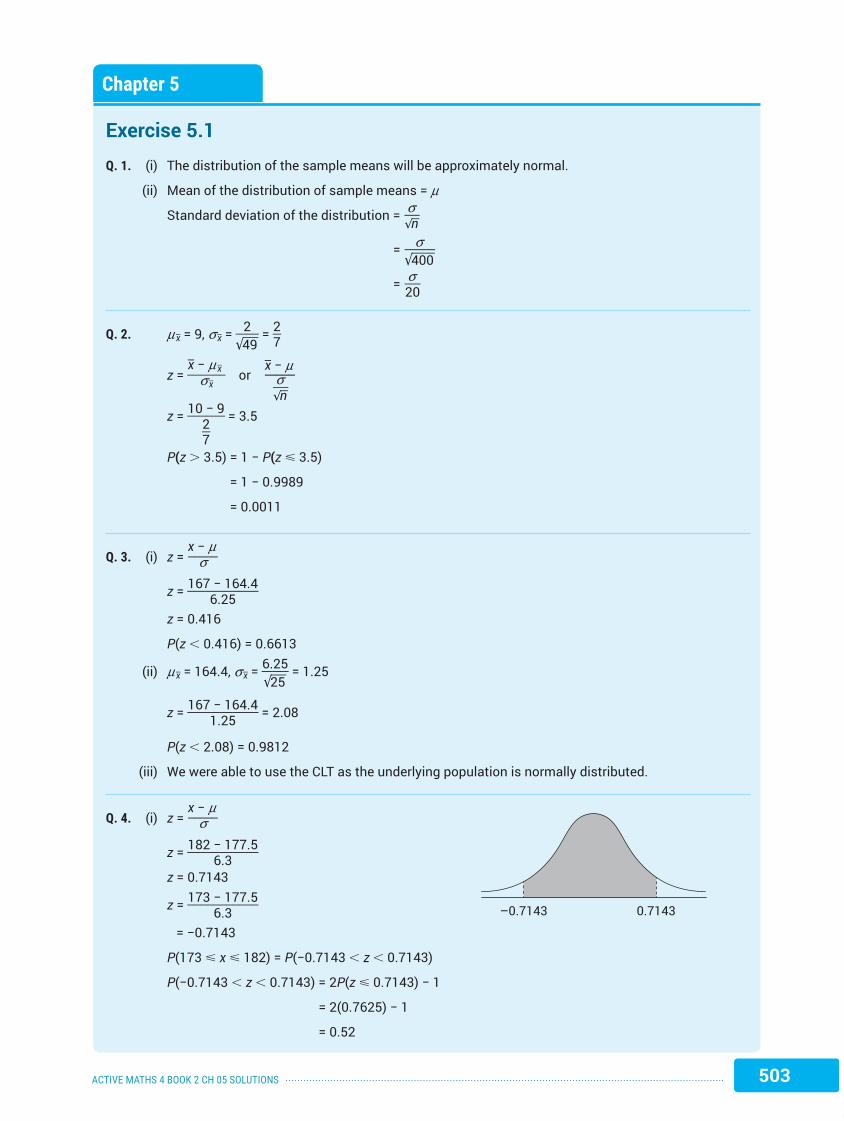
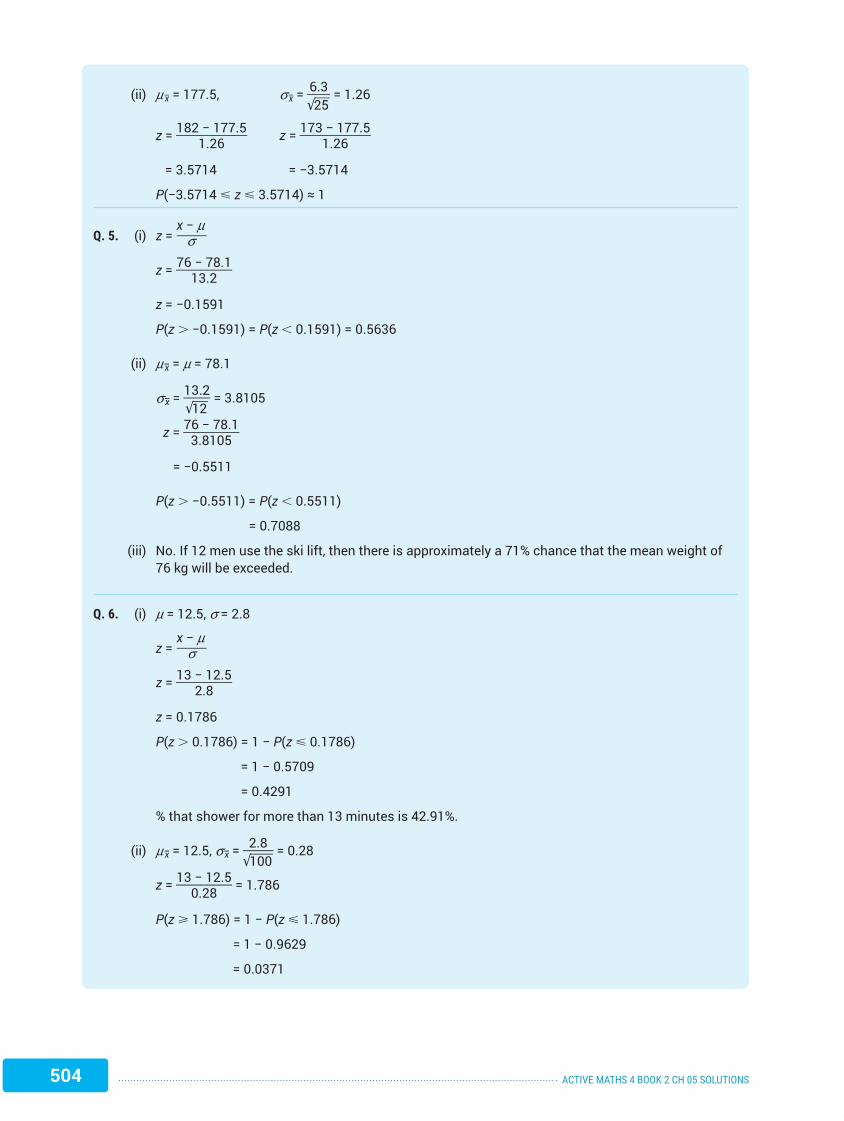
(ii) m __ x = 177.5, s __
x = 6.3 ____
√ ___
25 = 1.26
z = 182 − 177.5 ___________ 1.26 z = 173 − 177.5 ___________
1.26
= 3.5714 = −3.5714
P(−3.5714 ø z ø 3.5714) ≈ 1
Q. 5. (i) z = x − m
_____ s
z = 76 − 78.1 _________ 13.2
z = −0.1591
P(z . −0.1591) = P(z , 0.1591) = 0.5636
(ii) m __ x = m = 78.1
s __ x = 13.2 _____
√
___ 12 = 3.8105
z = 76 − 78.1 _________ 3.8105
= −0.5511
P(z . −0.5511) = P(z , 0.5511)
= 0.7088
(iii) No. If 12 men use the ski lift, then there is approximately a 71% chance that the mean weight of 76 kg will be exceeded.
Q. 6. (i) m = 12.5, s = 2.8
z = x − m
_____ s
z = 13 − 12.5 _________ 2.8
z = 0.1786
P(z . 0.1786) = 1 − P(z ø 0.1786)
= 1 − 0.5709
= 0.4291
% that shower for more than 13 minutes is 42.91%.
(ii) m __ x = 12.5, s __
x = 2.8 _____
√ ____
100 = 0.28
z = 13 − 12.5 _________ 0.28 = 1.786
P(z ù 1.786) = 1 − P(z ø 1.786)
= 1 − 0.9629
= 0.0371
ML6416_05_LC_AM_Bk2_sol_v5.0.indd 504 07/07/16 12:18 PM

505ACTIVE MATHS 4 BOOK 2 CH 05 SOLUTIONS
Q. 7. m = 80, s = 8
m __ x = 80
s __ x = 8 ___
√ __
n
P(z . z1) = 0.1977
P(z ø z1) = 0.8023
z1 = 0.85
0.85 = 82 − 80 _______
8 ___ √
__ n
0.85(8)
_______ √
__ n = 2
2 √ __
n = 6.8
√ __
n = 3.4
n = 11.56
⇒ n = 12
Q. 8. (i) The shape of the sampling distribution of the means will be approximately normal.
(ii) m __ x = m and s __
x = s ___ √
__ n
where m is population mean and s is population standard deviation and n is sample size.
Q. 9.
130,500 150,000 175,000
m __ x − 3 s __
x m __ x + 3 s __
x
Q. 10. (i) z = 7.5 − 6 _______
( 10 _____
√ ____
326 ) = 2.708 (to 3 d.p.)
P( __ x . 7.5) = P(z . 2.71) = 1 − P(z , 2.71)
= 1 − 0.9966
= 0.0034
= 0.34%
(ii) We assumed that the population from which the sample was chosen has a mean of 6 ppb and a standard deviation of 10 ppb.
(iii) z = 7 − 6 _______
( 10 _____
√ ____
326 ) = 1.81 (to 2 d.p.)
A z score of 1.81 is (well) within two standard deviations of the mean. So we could conclude that there is insufficient evidence to suggest that the true mean PFOA concentration for the population living near the DuPont facility is any different from the general population mean (nationwide) of 6 ppb.
ML6416_05_LC_AM_Bk2_sol_v5.0.indd 505 07/07/16 12:18 PM

506 ACTIVE MATHS 4 BOOK 2 CH 05 SOLUTIONS
OR
P(z . 1.81) = 1 − P(z , 1.81) = 1 − 0.9649 = 0.0351 = 3.51%
The chances of obtaining a sample mean of 7 or higher if the true population mean in the vicinity of the DuPont facility was 6 ppb is 3.51%.
Q. 11. (i) The sampling distribution of the sample mean (sample size of 40) will be approximately normal
with mean of 0.1 (hours) and standard deviation/error of 0.1 ____
√ ___
40 ≈ 0.0158 (hours).
(ii)
0.052 0.068 0.084 0.1 0.116 0.132 0.148
(iii) P( __ x . 0.13)
z = 0.13 − 0.1 _________ 0.0158 = 1.8987 … ≈ 1.90
P( __ x . 0.13) = P(z . 1.90)
= 1 − P(z ø 1.90)
= 1 − 0.9713
= 0.0287
= 2.87%
(iv) 1,500(0.0287) = 43.05
So answer is 43.
(v) It will be very similar to the actual sampling distribution of the sample means described in (i) + (ii) above.
Exercise 5.2
Q. 1. The 95% confidence interval for m is:
__ x − 1.96 s ___
√ __
n ø m ø __ x + 1.96 s ___
√ __
n
63 − 1.96 ( 10 _____
√____
800 ) ø m ø 63 + 1.96 ( 10 _____
√
____ 800 )
62.31 ø m ø 63.69
Q. 2. n = 400, s = 12, __
x = 110
110 − 1.96(12)
________
√ ____
400 ø m ø 110 + 1.96
(12) _____
√ ____
400
108.82 ø m ø 111.18
ML6416_05_LC_AM_Bk2_sol_v5.0.indd 506 07/07/16 12:18 PM
507ACTIVE MATHS 4 BOOK 2 CH 05 SOLUTIONS
Q. 3. n = 900, __ x = 172, s = 20
172 − 1.96 (20)
_____
√ ____
900 ø m ø 172 + 1.96
(20) _____
√ ____
900
170.69 ø m ø 173.31
Q. 4. n = 36, __ x = 68.8, s = 4.75
68.8 − 1.96 (4.75)
______
√ ___
36 ø m ø 68.8 + 1.96
(4.75) ______
√ ___
36
67.25 ø m ø 70.35
Q. 5. n = 100, __ x = 173, s = 120.5
173 − 1.96 (120.5)
_______
√ ____
100 ø m ø 173 + 1.96
(120.5) _______
√ ____
100
149.38 ø m ø 196.62
Q. 6. (a) n = 250, __ x = 4.5, s = 2.2
4.5 − 1.96 (2.2)
______
√ ____
250 ø m ø 4.5 + 1.96
(2.2) _____
√ ____
250
4.23 ø m ø 4.77
(b) __ x − 1.96
(2.2) _____
√ ____
250 ø 0.3
__ x − 0.27 ø 0.3
__ x = 0.3 + 0.27
__ x = 0.57
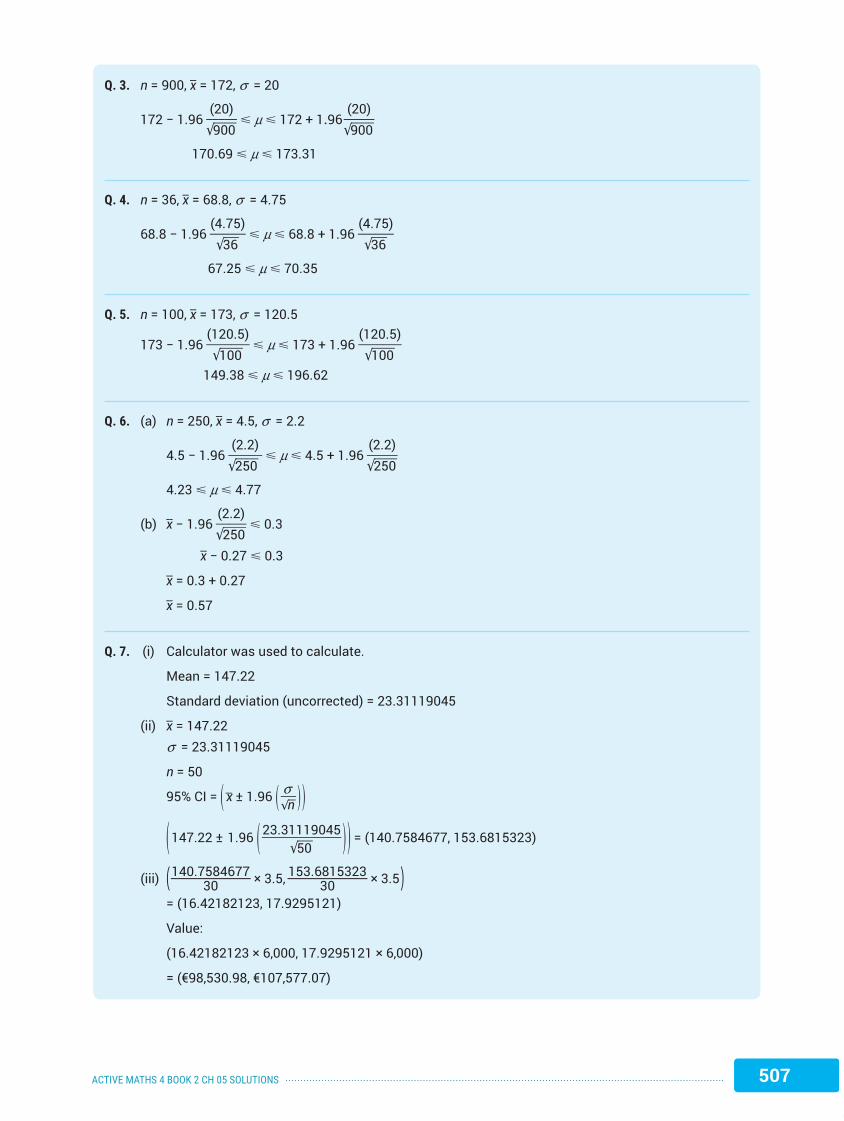
Q. 7. (i) Calculator was used to calculate.
Mean = 147.22
Standard deviation (uncorrected) = 23.31119045
(ii) __ x = 147.22
s = 23.31119045
n = 50
95% CI = ( _ x ± 1.96 ( s ___ √
__ n ) )
( 147.22 ± 1.96 ( 23.31119045 ____________
√ ___
50 ) ) = (140.7584677, 153.6815323)
(iii) ( 140.7584677 ____________ 30 × 3.5, 153.6815323 ____________ 30 × 3.5 ) = (16.42182123, 17.9295121)
Value:
(16.42182123 × 6,000, 17.9295121 × 6,000)
= (€98,530.98, €107,577.07)
ML6416_05_LC_AM_Bk2_sol_v5.0.indd 507 07/07/16 12:18 PM
508 ACTIVE MATHS 4 BOOK 2 CH 05 SOLUTIONS
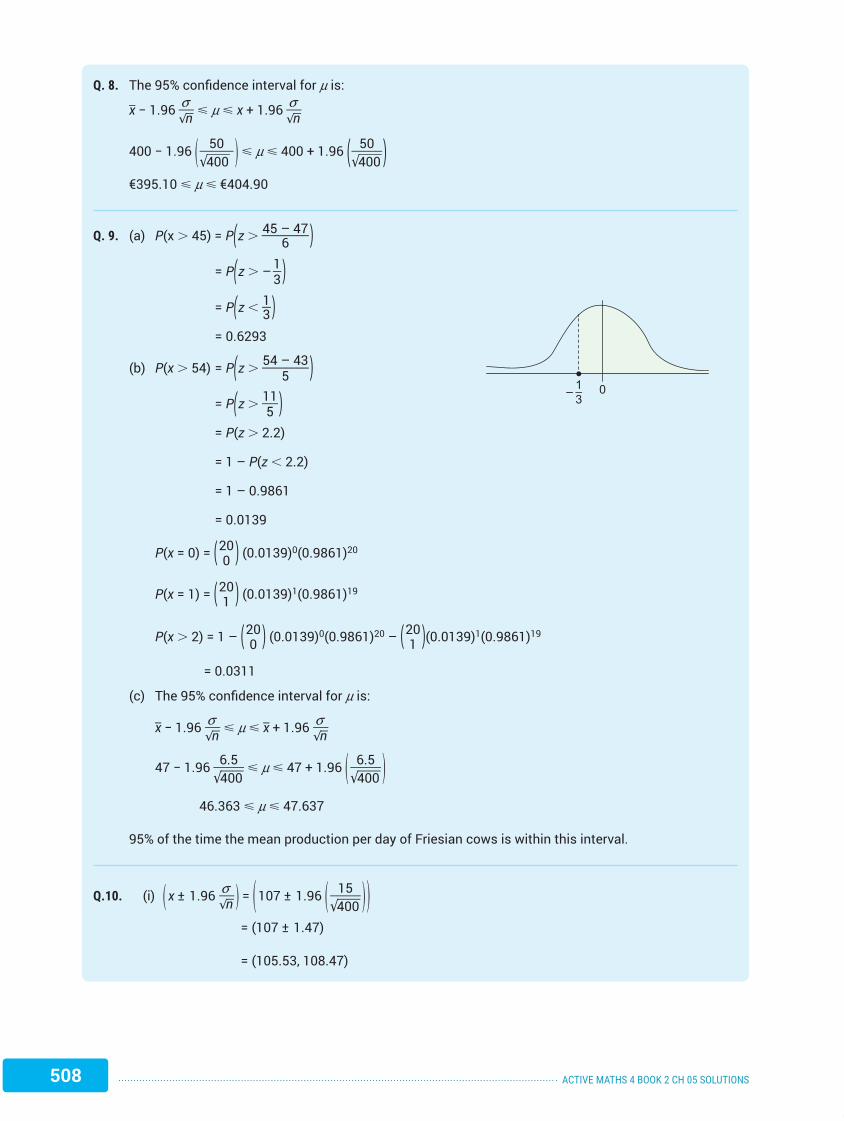
Q. 8. The 95% confidence interval for m is:
__ x − 1.96 s ___
√ __
n ø m ø x + 1.96 s ___ √
__ n
400 − 1.96 ( 50 ______
√ ____
400 ) ø m ø 400 + 1.96 ( 50 _____
√
____ 400 )
€395.10 ø m ø €404.90
Q. 9. (a) P(x . 45) = P ( z . 45 – 47 ________ 6 ) = P ( z . – 1 __
3 ) = P ( z , 1 __ 3 ) = 0.6293
(b) P(x . 54) = P ( z . 54 – 43 ________ 5 )
= P ( z . 11 ___ 5 )
= P(z . 2.2)
= 1 – P(z , 2.2)
= 1 – 0.9861
= 0.0139
P(x = 0) = ( 20 0 ) (0.0139)0(0.9861)20
P(x = 1) = ( 20 1 ) (0.0139)1(0.9861)19
P(x . 2) = 1 – ( 20 0 ) (0.0139)0(0.9861)20 – ( 20 1 ) (0.0139)1(0.9861)19
= 0.0311
(c) The 95% confidence interval for m is:
__ x − 1.96 s ___
√ __
n ø m ø __ x + 1.96 s ___
√ __
n
47 − 1.96 6.5 _____
√ ____
400 ø m ø 47 + 1.96 ( 6.5 _____
√
____ 400 )
46.363 ø m ø 47.637
95% of the time the mean production per day of Friesian cows is within this interval.
Q.10. (i) ( x ± 1.96 s ___ √
__ n ) = ( 107 ± 1.96 ( 15 _____
√
____ 400 ) )
= (107 ± 1.47)
= (105.53, 108.47)
1–3–
0
ML6416_05_LC_AM_Bk2_sol_v5.0.indd 508 07/07/16 12:18 PM

509ACTIVE MATHS 4 BOOK 2 CH 05 SOLUTIONS
(ii) 90% CI:
( x ± 1.645 s ___
√
__ n ) = ( 107 ± 1.645 ( 15 _____
√
____
400 ) )
= (105.76625, 108.23375)
We can be 90% confident that the true population means lies within this interval. (90% of intervals so constructed will contain the true population mean.)
99% CI:
( __ x ± 2.575 s ___
√
__ n ) = ( 107 ± 2.575 ( 15 _____
√
____
400 ) )
= (105.06875, 108.93125)
We can be 99% confident that the true population mean lies within this interval. (99% of intervals so constructed will contain the true population mean.)
Note: The 99% CI is wider than the 90% CI.
Q.11. (i) 31.844 − 29.202 _______________ 2 = 1.321
Margin of error = ± 1.321
(ii) As 90% , 95%, the margin of error would be less than the margin of error in part (i).
Reason: Margin of error for a population mean m is ± Z crit
s ___ √
__ n .
For 90% confidence level, Zcrit = 1.645.
For 95% confidence level, Zcrit = 1.96.
The 90% confidence level has a smaller Zcrit.
So 90% confidence interval has a smaller margin of error.
Exercise 5.3
Q. 1. p ± E
(a) 0.444 ± 0.111 (c) 0.427 ± 0.194
(b) 0.8 ± 0.1 (d) 0.66 ± 0.053
Q. 2. (a) E = 1.96 √
_______
p (1 − p ) ________ n
n = 500, x = 150, p = x __ n = 150 ____ 500
E = 1.96 √ ___________
0.3(1 − 0.3)
___________ 500
= 0.040
(b) n = 1000, x = 800, p = x __ n = 0.8
E = 1.96 √ ___________
0.8(1 − 0.8)
___________ 1,000
= 0.0248
(c) n = 600, x = 300, p = 300 ____ 600 = 0.5
1.96 √ ___________
0.5(1 − 0.5)
___________ 600
= 0.400
(d) n = 1600, x = 20, p = 0.0125
1.96 √ __________________
0.0125(1 − 0.0125)
__________________ 1,600
= 0.0054
Q. 3. (a) p − E , p , p + E
n = 1000, x = 690, p = 0.69
E = 1.96 √ _____________
0.69(1 − 0.69)
_____________ 1,000
E = 0.03
p − E , p , p + E
0.69 − 0.03 , p , 0.69 + 0.03
0.66 , p , 0.72
(b) No, as 63% lies outside the confidence interval.
Q. 4. (a) n = 500, x = 82, p = 0.164
E = 1.96 √ _______________
0.164(1 − 0.164)
_______________ 500
= 0.03
0.164 − 0.03p , 0.164 + 0.03
0.134 , p , 0.194
(b) We can say with 95% confidence that between 13% and 19% of all car accidents involve teenagers at the wheel.
ML6416_05_LC_AM_Bk2_sol_v5.0.indd 509 07/07/16 12:18 PM
510 ACTIVE MATHS 4 BOOK 2 CH 05 SOLUTIONS
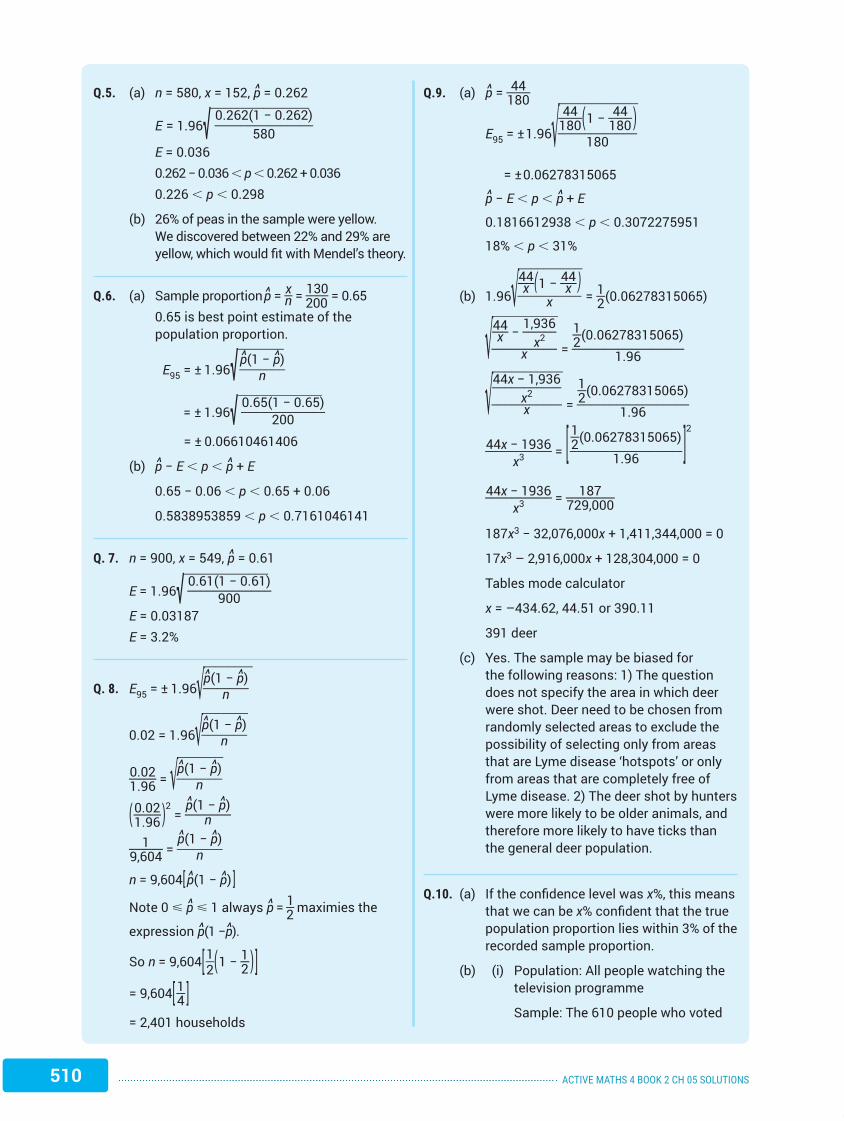
Q.5. (a) n = 580, x = 152, p = 0.262
E = 1.96 √ _______________
0.262(1 − 0.262)
_______________ 580
E = 0.036 0.262 − 0.036 , p , 0.262 + 0.036 0.226 , p , 0.298
(b) 26% of peas in the sample were yellow. We discovered between 22% and 29% are yellow, which would fit with Mendel’s theory.
Q.6. (a) Sample proportion p = x __ n = 130 ____ 200 = 0.65 0.65 is best point estimate of the
population proportion.
E 95 = ± 1.96 √ _______
p (1 − p )
_______ n
= ± 1.96 √ _____________
0.65(1 − 0.65)
_____________ 200
= ± 0.06610461406
(b) p − E , p , p + E
0.65 − 0.06 , p , 0.65 + 0.06
0.5838953859 , p , 0.7161046141
Q. 7. n = 900, x = 549, p = 0.61
E = 1.96 √ _____________
0.61(1 − 0.61)
_____________ 900
E = 0.03187 E = 3.2%
Q. 8. E 95 = ± 1.96 √ ________
p (1 − p )
_______ n
0.02 = 1.96 √ _______
p (1 − p )
_______ n
0.02 _____ 1.96 = √ _______
p (1 − p )
_______ n
( 0.02 _____ 1.96 ) 2 = p (1 − p )
_______ n
1 ______ 9,604 = p (1 − p )
_______ n
n = 9,604 [ p (1 − p ) ] Note 0 ø p ø 1 always p = 1 __ 2 maximies the
expression p (1 − p ).
So n = 9,604 [ 1 __ 2 ( 1 − 1 __ 2 ) ]
= 9,604 [ 1 __ 4 ] = 2,401 households
Q.9. (a) p = 44 ____ 180
E 95 = ± 1.96 √ ____________
44 ____ 180 ( 1 − 44 ____ 180 )
____________ 180
= ± 0.06278315065
p − E , p , p + E
0.1816612938 , p , 0.3072275951
18% , p , 31%
(b) 1.96 √ __________
44 ___ x ( 1 − 44 ___ x )
__________ x = 1 __ 2 (0.06278315065)
√ __________
44 ___ x − 1,936 ______
x 2 __________ x =
1 __ 2 (0.06278315065) _________________ 1.96
√ ___________
44x − 1,936 ___________
x 2 ___________ x =
1 __ 2 (0.06278315065) _________________ 1.96
44x − 1936 __________ x 3
= [ 1 __ 2 (0.06278315065) _________________ 1.96 ] 2
44x − 1936 __________ x 3
= 187 ________ 729,000
187x3 − 32,076,000x + 1,411,344,000 = 0
17x3 – 2,916,000x + 128,304,000 = 0
Tables mode calculator
x = –434.62, 44.51 or 390.11
391 deer
(c) Yes. The sample may be biased for the following reasons: 1) The question does not specify the area in which deer were shot. Deer need to be chosen from randomly selected areas to exclude the possibility of selecting only from areas that are Lyme disease ‘hotspots’ or only from areas that are completely free of Lyme disease. 2) The deer shot by hunters were more likely to be older animals, and therefore more likely to have ticks than the general deer population.
Q.10. (a) If the confidence level was x%, this means that we can be x% confident that the true population proportion lies within 3% of the recorded sample proportion.
(b) (i) Population: All people watching the television programme
Sample: The 610 people who voted
ML6416_05_LC_AM_Bk2_sol_v5.0.indd 510 07/07/16 12:18 PM

511ACTIVE MATHS 4 BOOK 2 CH 05 SOLUTIONS
(ii) p = 480 ____ 610 = 48 ___ 61 ← The proportion of the sample who favoured a uniform.
(iii) • Only viewers of the programme could potentially take part in the poll. These viewers may not be representative of the general public (in terms of age, gender, interests, lifestyle, employment status, etc.).
• Sample size of 610 may be too small.
• Self-selection bias: As response is voluntary, people with stronger opinions are more likely to participate in the poll.
Q.11. (i) p = 400 ____ 900 = 4 __ 9
Standard error = √ ________
4 __ 9 ( 1 − 4 __ 9 )
________ 900 = √
_____
( 20 ___ 81 )
____ 900 = ( 2 √
__ 5 ____ 9 ____ 30 ) = 2 √
__ 5 ____ 270
Zcrit = 1.96
95% CI = ( p ± 1.96 (standard error))
= ( 4 __ 9 ± 1.96 ( 2 √ __
5 ____ 270 ) )
= (0.41198005, 0.476908838)
(ii) 99% CI = ( 4 __ 9 ± 2.575 ( 2 √ __
5 ____ 270 ) )
= (0.401793518, 0.48709537)
(iii) Reducing the sample size would increase the width of a confidence interval.
Q.12. (i) 0.39872 − 0.35128 _________________ 2 = 0.02372
1.96 √ ________
p (1 − p )
_______ n = 0.02372
p = 600 ____ n
1.96 √ ____________
600 ____ n ( 1 − 600 ____ n )
____________ n = 0.02372
√ ____________
600 ____
n ( 1 − 600 ____ n ) ____________ n = 593 _______ 49,000
600 ____ n ( 1 − 600 ____ n )
____________ n = 0.000146459
600 ____ n 2
( 1 − 600 ____ n ) = 0.000146459
600 ____ n 2
− 360,000 ________ n 3
= 0.000146459
0.000146459 n3 − 600n + 360,000 = 0
Solve for n:
Positive solutions (to nearest whole number) are 675 and 1,600.
p ∈ (0.35125, 0.39872)
Only n = 1,600 will give in p in this interval.
∴ n = 1,600
ML6416_05_LC_AM_Bk2_sol_v5.0.indd 511 07/07/16 12:18 PM
512 ACTIVE MATHS 4 BOOK 2 CH 05 SOLUTIONS
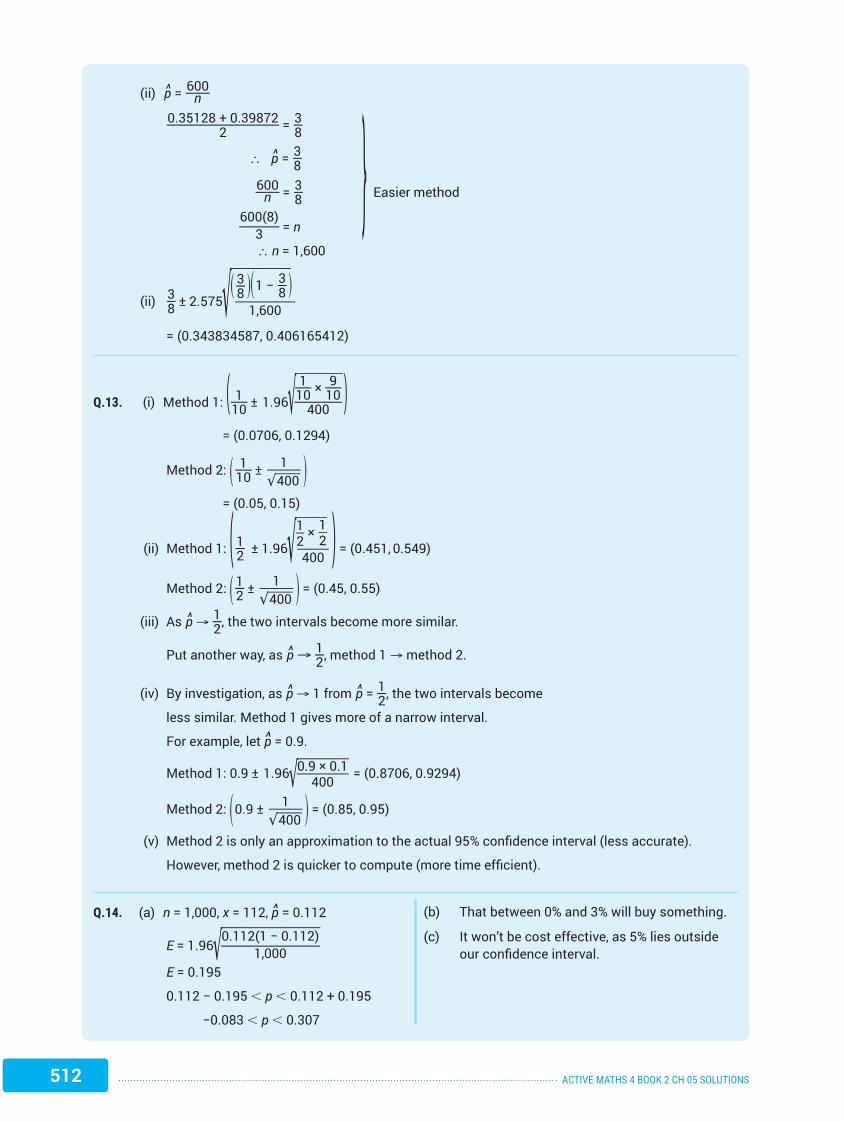
(ii) p = 600 ____ n
0.35128 + 0.39872 ________________ 2 = 3 __ 8
∴ p = 3 __ 8
600 ____ n = 3 __ 8 } Easier method
600(8)
______ 3 = n
∴ n = 1,600
(ii) 3 __ 8 ± 2.575 √ _________
( 3 __ 8 ) ( 1 − 3 __ 8 )
_________ 1,600
= (0.343834587, 0.406165412)
Q.13. (i) Method 1: ( 1 ___ 10 ± 1.96 √ ________
1 ___ 10 × 9 ___ 10
________ 400 ) = (0.0706, 0.1294)
Method 2: ( 1 ___ 10 ± 1 _____
√ ____
400 )
= (0.05, 0.15)
(ii) Method 1: ( 1 __ 2 ± 1.96 √ _____
1 __ 2 × 1 __
2 _____
400 ) = (0.451, 0.549)
Method 2: ( 1 __ 2 ± 1 _____
√ ____
400 ) = (0.45, 0.55)
(iii) As p → 1 __ 2 , the two intervals become more similar.
Put another way, as p → 1 __ 2 , method 1 → method 2.
(iv) By investigation, as p → 1 from p = 1 __ 2 , the two intervals become
less similar. Method 1 gives more of a narrow interval.
For example, let p = 0.9.
Method 1: 0.9 ± 1.96 √ ________
0.9 × 0.1 ________ 400 = (0.8706, 0.9294)
Method 2: ( 0.9 ± 1 _____
√ ____
400 ) = (0.85, 0.95)
(v) Method 2 is only an approximation to the actual 95% confidence interval (less accurate).
However, method 2 is quicker to compute (more time efficient).
Q.14. (a) n = 1,000, x = 112, p = 0.112
E = 1.96 √ ______________
0.112(1 − 0.112) ______________ 1,000
E = 0.195
0.112 − 0.195 , p , 0.112 + 0.195
−0.083 , p , 0.307
(b) That between 0% and 3% will buy something.
(c) It won’t be cost effective, as 5% lies outside our confidence interval.
ML6416_05_LC_AM_Bk2_sol_v5.0.indd 512 07/07/16 12:18 PM
513ACTIVE MATHS 4 BOOK 2 CH 05 SOLUTIONS
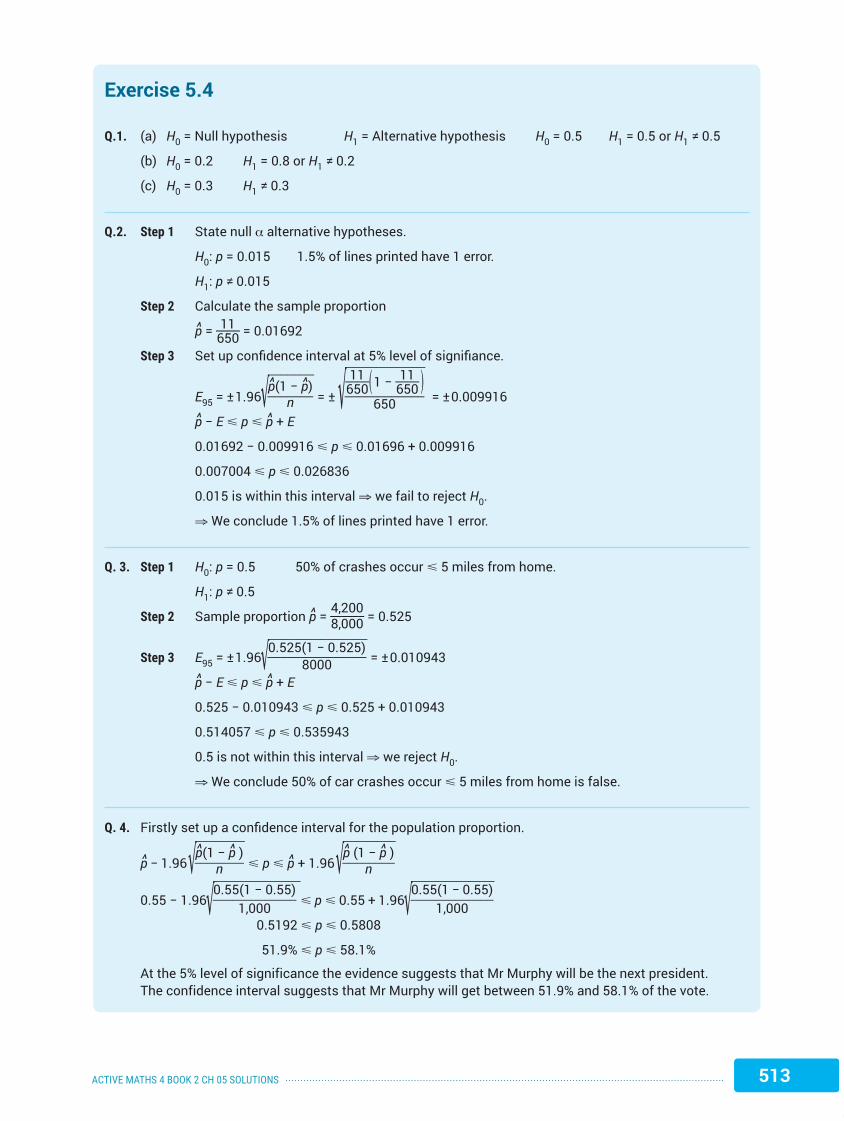
Exercise 5.4
Q.1. (a) H0 = Null hypothesis H1 = Alternative hypothesis H0 = 0.5 H1 = 0.5 or H1 ≠ 0.5
(b) H0 = 0.2 H1 = 0.8 or H1 ≠ 0.2
(c) H0 = 0.3 H1 ≠ 0.3
Q.2. Step 1 State null α alternative hypotheses.
H0: p = 0.015 1.5% of lines printed have 1 error.
H1: p ≠ 0.015
Step 2 Calculate the sample proportion
p = 11 ____ 650 = 0.01692
Step 3 Set up confidence interval at 5% level of signifiance.
E 95 = ± 1.96 √ _______
p (1 − p )
_______ n = ± √
_____________
11 ____ 650 ( 1 − 11 ____ 650 )
____________ 650 = ± 0.009916
p − E ø p ø p + E
0.01692 − 0.009916 ø p ø 0.01696 + 0.009916
0.007004 ø p ø 0.026836
0.015 is within this interval ⇒ we fail to reject H0.
⇒ We conclude 1.5% of lines printed have 1 error.
Q. 3. Step 1 H0: p = 0.5 50% of crashes occur ø 5 miles from home.
H1: p ≠ 0.5
Step 2 Sample proportion p = 4,200 ______ 8,000 = 0.525
Step 3 E 95 = ± 1.96 √ _______________
0.525(1 − 0.525)
_______________ 8000 = ± 0.010943
p − E ø p ø p + E
0.525 − 0.010943 ø p ø 0.525 + 0.010943
0.514057 ø p ø 0.535943
0.5 is not within this interval ⇒ we reject H0.
⇒ We conclude 50% of car crashes occur ø 5 miles from home is false.
Q. 4. Firstly set up a confidence interval for the population proportion.
p − 1.96 √ ________
p (1 − p )
________ n ø p ø p + 1.96 √
________
p (1 − p )________
n
0.55 − 1.96 √ ______________
0.55(1 − 0.55)
_____________ 1,000 ø p ø 0.55 + 1.96 √
_____________
0.55(1 − 0.55)
_____________1,000
0.5192 ø p ø 0.5808
51.9% ø p ø 58.1%
At the 5% level of significance the evidence suggests that Mr Murphy will be the next president. The confidence interval suggests that Mr Murphy will get between 51.9% and 58.1% of the vote.
ML6416_05_LC_AM_Bk2_sol_v5.0.indd 513 07/07/16 12:18 PM
514 ACTIVE MATHS 4 BOOK 2 CH 05 SOLUTIONS
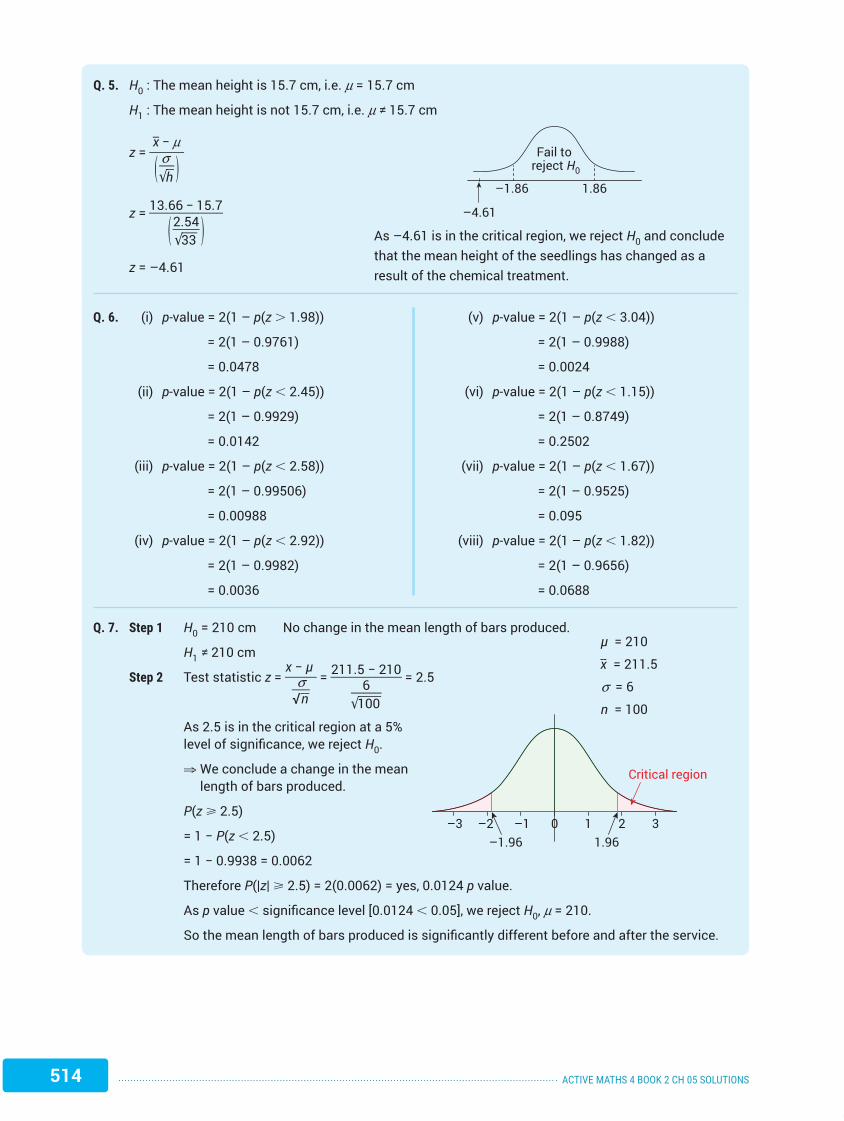
Q. 5. H0 : The mean height is 15.7 cm, i.e. m = 15.7 cm
H1 : The mean height is not 15.7 cm, i.e. m ≠ 15.7 cm
z = __ x − m
______
( s ___
√ __
h )
z = 13.66 − 15.7 ____________
( 2.54 _____
√ ___
33 )
z = –4.61
–4.61
–1.86 1.86
Fail to reject H0
As –4.61 is in the critical region, we reject H0 and conclude that the mean height of the seedlings has changed as a result of the chemical treatment.
Q. 6. (i) p-value = 2(1 – p(z . 1.98))
= 2(1 – 0.9761)
= 0.0478
(ii) p-value = 2(1 – p(z , 2.45))
= 2(1 – 0.9929)
= 0.0142
(iii) p-value = 2(1 – p(z , 2.58))
= 2(1 – 0.99506)
= 0.00988
(iv) p-value = 2(1 – p(z , 2.92))
= 2(1 – 0.9982)
= 0.0036
(v) p-value = 2(1 – p(z , 3.04))
= 2(1 – 0.9988)
= 0.0024
(vi) p-value = 2(1 – p(z , 1.15))
= 2(1 – 0.8749)
= 0.2502
(vii) p-value = 2(1 – p(z , 1.67))
= 2(1 – 0.9525)
= 0.095
(viii) p-value = 2(1 – p(z , 1.82))
= 2(1 – 0.9656)
= 0.0688
Q. 7. Step 1 H0 = 210 cm No change in the mean length of bars produced.
H1 ≠ 210 cm
Step 2 Test statistic z = x − μ
_____
s ___
√__
n = 211.5 − 210 ___________
6 _____
√
____ 100 = 2.5
As 2.5 is in the critical region at a 5% level of significance, we reject H0.
⇒ We conclude a change in the mean length of bars produced.
P(z ù 2.5)
= 1 − P(z , 2.5)
= 1 − 0.9938 = 0.0062
Therefore P(|z| ù 2.5) = 2(0.0062) = yes, 0.0124 p value.
As p value , significance level [0.0124 , 0.05], we reject H0, m = 210.
So the mean length of bars produced is significantly different before and after the service.
321.96
1–1 0–2–3
Critical region
–1.96
μ = 210
__ x = 211.5
s = 6
n = 100
ML6416_05_LC_AM_Bk2_sol_v5.0.indd 514 07/07/16 12:18 PM

515ACTIVE MATHS 4 BOOK 2 CH 05 SOLUTIONS
Q. 8. Step 1 H0 = 67.5 no change in the mean mark.
H1 ≠ 67.5
Step 2 Test statistic z = __
x − m _____
s ___ √
__ n = 69 − 67.5 _________
10 _____
√
____ 100 = 1.5
As 1.5 is outside the critical region at a 5% level of significance. We fail to reject H0.
⇒ We conclude no change in the mean mark. No evidence students improved.
Q. 9. Step 1 H0: m = 98.6 no change in mean body temperature.
H1: m ≠ 98.6
Step 2 Test statistic z = __
x − m _____
s ___ √
__ n = 98.2 − 98.6 _____
0.62 _____
√
____ 106 = −6.64
As −6.64 is in the critical region at a 5% level of significance, we reject H0.
⇒ We conclude the mean body temperature ≠ 98.6° F.
P(z ù 6.64)
1 − P[z , 6.64]
1 − 0.9990 = 0.001
Therefore P(|z| ù 6.64) = 2(0.001) = 0.002 p value.
As P value < significance level [0.002 , 0.05]. We reject H0, m = 98.6 greater evidence for rejecting the null hypothesis α support of the claim “the mean body temperature is not 98.6° F ”.
Revision Exercises
Q. 1. (a) Inferential statistics makes inferences about populations using data drawn from the population.
(b) (i) A census is a collection of data from every member of the population.
(ii) A sample is a subset of members selected from the population.
(iii) A random sample is a subset of members selected randomly from the population.
(iv) A parameter is a numerical measurement describing some characteristic of a population.
(v) A statistic is a numerical measurement describing some characteristic of a sample.
Q. 2. (i) The sampling distribution of the mean.
(ii) This is a normal distribution.
(iii) m = l.
(iv) a = s _____
√ ___
40 v
a = s ___ 20
μ = 67.5
__ x = 69
s = 10
n = 100
321.96
1–1 0–2–3
Critical region
–1.96
μ = 98.6
__ x = 98.2
s = 0.62
n = 106
1.96
Critical region
–1.96–3 –2 –1 0 1 2 3
ML6416_05_LC_AM_Bk2_sol_v5.0.indd 515 07/07/16 12:18 PM

516 ACTIVE MATHS 4 BOOK 2 CH 05 SOLUTIONS
Q. 3. m _ x = 120
s _ x = 15 _____
√ ____
100
= 1.5
Z = 124 − 120 __________ 1.5
= 2.67
p(Z . 2.67) = 1 − p(Z , 2.67)
= 1 − 0.9962
= 0.0038
Q. 4. m _ x = 175
s _ x = 4 ____
√ ___
64
= 0.5
Z = 174 − 175 __________ 0.5
= −2
p(Z , − 2) = p(Z . 2)
= 1 − p(Z , 2)
= 1 − 0.9772
= 0.0228
Q. 5. __ x − 1.96 s ___
√ __
n < m < __ x + 1.96 s ___
√ __
n
82.4 − 1.96 ( 12 _____
√ ____
900 ) < m < 82.4 + 1.96 ( 12 _____
√
____ 900 )
81.616 < m < 83.184
[81.616, 83.184]
Q. 6. (i) __ x − 1.96 s ___
√ __
n < m < __ x + 1·96 s ___
√ __
n
95 − 1.96 ( 15 _____
√ ____
400 ) < m < 95 + 1.96 ( 15 _____
√
____ 400 )
93.53 < m < 96.47
[93.53, 96.47]
(ii) 95 − 1.645 ( 15 _____
√ ____
400 ) < m < 95 + 1.645 ( 15 _____
√
____ 400 )
93.766 < m < 96.234
[93.766, 96.234]
(iii) 95 − 2.575 ( 15 _____
√ ____
400 ) < m < 95 + 2.575 ( 15 _____
√
____ 400 )
93.069 < m < 96.931
[93.069, 96.931]
Q. 7. p − 1.96 √ _______
p (1 − p )
_______ n < p < p + 1.96 √
_______
p (1 − p )
_______ n
8 ___ 15 − 1.96 √
_________
8 ___ 15 ( 1 − 8 ___ 15 )
_________ 900 < p < 8 ___
15 + 1.96 √ _________
8 ___ 15 ( 1 − 8 ___ 15 )
_________ 900
0.5007 < p < 0.5659
[50.07%, 56.59%]
Q. 8. H0 : p = 24 ____ 100
H1 : p ≠ 24 ____ 100
2 ___ 15 − 1.96 √ _________
2 ___ 15 ( 1 − 2 ___ 15 )
_________ 900 < p < 2 ___
15 + 1.96 √ _________
2 ___ 15 ( 1 − 2 ___ 15 )
_________ 900
0.1111 < p < 0.1555
Since 0.24 is outside the confidence interval, we reject the null hypothesis and conclude that the proportion has changed from 2007.
Q. 9. H0: m = 5
H1: m ≠ 5
Z = __ x − m
_____
( s ___ √
__ n )
Z = 4.9 − 5 _______
( 0.25 _____
√ ___
64 )
= −3.2
–3.2 lies in the critical region, therefore we reject H0 and conclude that the mean weight is not 5 kg at the 5% level of significance.
Q. 10. (a) Sample proportion p = x __ n = 200 ____ 300 = 2 __ 3
0.6 is best estimate of the population proportion.
(b) E 95 = ± 1.96 √ ________
p (1 − p )
________ n = ± 1.96 √
________
2 __ 3 ( 1 − 2 __ 3 )
________ 300
= ± 0.05334
p − E , p , p + E
2 __ 3 − 0.05334 , p , 2 __
3 + 0.05334
0.613326 , p , 0.720006
–3.2
–1.96 1.96
ML6416_05_LC_AM_Bk2_sol_v5.0.indd 516 07/07/16 12:18 PM

517ACTIVE MATHS 4 BOOK 2 CH 05 SOLUTIONS
Q. 11. p = 27 ___ 80 = 0.3375
1 ___ √
__ n = 1 ____
√
___ 80 = 0.1118
H0 : p = 0.3 (30% of wells located by the dowser have adequate water at depth of 35 m or less.)
H1 : p ≠ 0.3 (30% of wells located by the dowser don’t have adequate water at depth of 35 m or less.)
0.3375 − 0.1118 , p , 0.3375 + 0.1118
0.2257 , p , 0.4493
As 0.3 lies within the constructed 95% confidence interval, we accept the null hypothesis that 30% of wells located by the dowser have adequate water at a depth of 35 m or less. He/she does not have a different success rate to the water drillers.
Q. 12. (a) $97,300
(b) $30,000
________
√ ___
50 = $4,242.64
(c) Normal (approximately) with mean of $97,300 and standard deviation of $4,242.64. (d)
84,572 88,815 93,057 97,300 101,543 105,785 110,028
(e) z = 89,500 − 97,300
_______________ 4,242.64 = −1.838 (to 3 d.p.)
(f) P( __ x , 89,500) = P(z , −1.84) = 1 − P(z , 1.84)
= 1 − 0.9671
= 0.0329
= 3.29%
Exam QuestionsQ. 1. (i) P(. €12.80) = 0.75 = p
P(ø €12.80) = 0.25 = q
Ans = ( 6 4 ) (0.75)4(0.25)2 = 0.29663 … ≈ 29.66%
(ii) n = 200 so the Central Limit Theorem tells us that the sampling distribution of the sample mean (sample size of 200) will be approximately normal with mean €22.05 and standard deviation/
error of €10.64 _______
√ ____
200 ≈ €0.752.
So, we would expect the distribution of our one thousand sample means to be very similar to the above described sampling distribution.
ML6416_05_LC_AM_Bk2_sol_v5.0.indd 517 07/07/16 12:18 PM
518 ACTIVE MATHS 4 BOOK 2 CH 05 SOLUTIONS
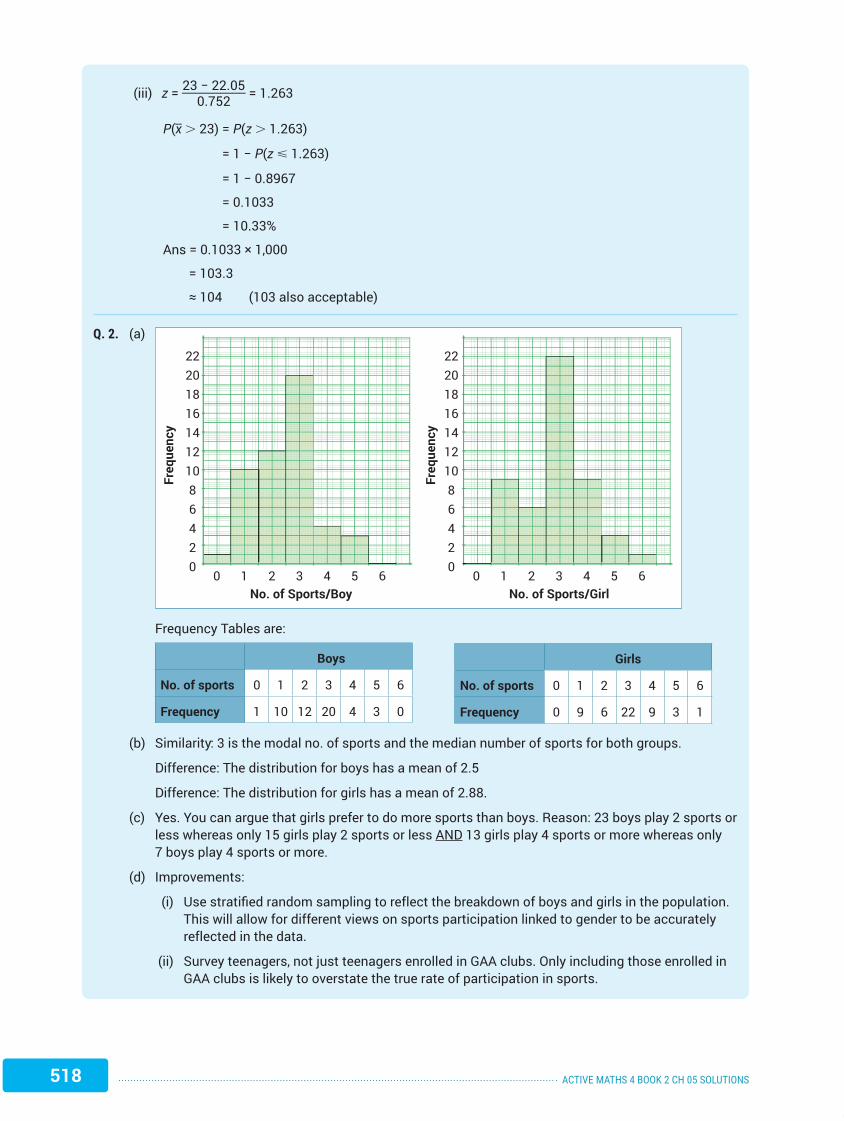
(iii) z = 23 − 22.05 __________ 0.752 = 1.263
P( __ x . 23) = P(z . 1.263)
= 1 − P(z ø 1.263)
= 1 − 0.8967
= 0.1033
= 10.33%
Ans = 0.1033 × 1,000
= 103.3
≈ 104 (103 also acceptable)
Q. 2. (a)
No. of Sports/Boy No. of Sports/Girl0
Freq
uenc
y
02468
10121416182022
Freq
uenc
y
02468
10121416182022
1 2 3 4 5 6 0 1 2 3 4 5 6
Frequency Tables are:
Boys
No. of sports 0 1 2 3 4 5 6
Frequency 1 10 12 20 4 3 0
(b) Similarity: 3 is the modal no. of sports and the median number of sports for both groups.
Difference: The distribution for boys has a mean of 2.5
Difference: The distribution for girls has a mean of 2.88.
(c) Yes. You can argue that girls prefer to do more sports than boys. Reason: 23 boys play 2 sports or less whereas only 15 girls play 2 sports or less AND 13 girls play 4 sports or more whereas only 7 boys play 4 sports or more.
(d) Improvements:
(i) Use stratifi ed random sampling to refl ect the breakdown of boys and girls in the population. This will allow for different views on sports participation linked to gender to be accurately refl ected in the data.
(ii) Survey teenagers, not just teenagers enrolled in GAA clubs. Only including those enrolled in GAA clubs is likely to overstate the true rate of participation in sports.
Girls
No. of sports 0 1 2 3 4 5 6
Frequency 0 9 6 22 9 3 1
ML6416_05_LC_AM_Bk2_sol_v5.0.indd 518 07/07/16 12:18 PM

519ACTIVE MATHS 4 BOOK 2 CH 05 SOLUTIONS
Q. 3. (a) z = x − m
_____ s
z = 39.7 _____ 0.2
= −1.5
p(z ø −1.5) = p(z . 1.5)
= 1 − p(z ø 1.5)
= 1 − 0.9332
= 0.0668
(b) p(x = 0) = ( 5 0 ) (0.0668)0(0.9332)5
= 0.7077399
p(x = 1) = ( 5 1 ) (0.0668)1(0.9332)4
= 0.2533059
p(x at least 2) = 1 − (0.7077399 + 0.2533059)
= 0.0389542
(c) __ x = 39.87
H0 : m = 40 (machine setting has not become inaccurate)
H1 : m ≠ 40 (machine setting has become inaccurate)
z = __ x − m
_____
s __ h
z = 39.87 − 40 __________
0.2 ____
√ ___
10
= −2.0554
−2.0554 , −1.96, therefore at the 5% level of significance we reject the null hypothesis and conclude that the machine setting has become inaccurate.
Q. 4. (i) H0: The new drug is not more successful than the generic drug.
p = 0.51
95% margin of error = 1 _____
√ ____
500 = 0.045
The success rate for the new drug
is 296 ____ 500 = 0.592.
This is outside the interval [0.51 − 0.045, 0.51 + 0.045] = [0.465, 0.555].
Result is significant, reject the null hypothesis.
There is evidence to conclude that the new drug is more successful than the generic.
(ii) The result must lie in the interval [0.465, 0.555]
Thus, n ____ 500 , 0.555 ⇒ n , 277.5
Hence, 277 patients.
Q. 5. (a) s ___ √
__ n = 20.73 ______
√
____ 100 = 2.073
CI = __ x ± 1.96 s ___
√ __
n = 90.45 ± 4.06
We can be 95% confident that the mean amount spent was in the range €86.39 , m , €94.51
(b) H0 : Mean spend is €94.
H1 : Mean spend is not €94.
METHOD 1:
__ x = 90.45, s = 20.73, m = 94, n = 100
z = __ x − m
_____
s ___ √
__ n = 90.45 − 94 __________ 2.073 = −1.71
−1.71 . −1.96
Fail to reject null hypothesis (not enough evidence to reject the null hypothesis).
(c) P(z , –1.71) = 1 – P(z , 1.71)
= 1 – 0.9564
= 0.0436
p-value = 0.0436 × 2 = 0.0872
Meaning: If the mean amount spent really was €94, then the probability that the sample mean would be €90.45 by chance is 8.72%. It is because this is more than a 5% chance that we do not reject the null hypothesis.
ML6416_05_LC_AM_Bk2_sol_v5.0.indd 519 07/07/16 12:18 PM