MKO Symposium 2007 V5b - ASM Consortium ASM Overview -- MKO...• Example case study showing how...
21
1 Page 1 ASM Abnormal Situation Management – Effective Automation to Improve Operator Performance Abnormal Situation Management ® Joint Research and Development Consortium Abnormal Situation Management – Effective Automation to Improve Operator Performance Abnormal Situation Management ® Joint Research and Development Consortium ® Abnormal Situation Management and ASM are U.S. registered trademarks of Honeywell Inc. www.ASMConsortium.com www.ASMConsortium.com
Transcript of MKO Symposium 2007 V5b - ASM Consortium ASM Overview -- MKO...• Example case study showing how...

1
Page 1
ASMAbnormal Situation Management –
Effective Automation to Improve Operator Performance
Abnormal Situation Management®
Joint Research and Development Consortium
Abnormal Situation Management –Effective Automation to Improve
Operator Performance
Abnormal Situation Management®
Joint Research and Development Consortium
® Abnormal Situation Management and ASM are U.S. registered trademarks of Honeywell Inc.
www.ASMConsortium.comwww.ASMConsortium.com
2
Page 2
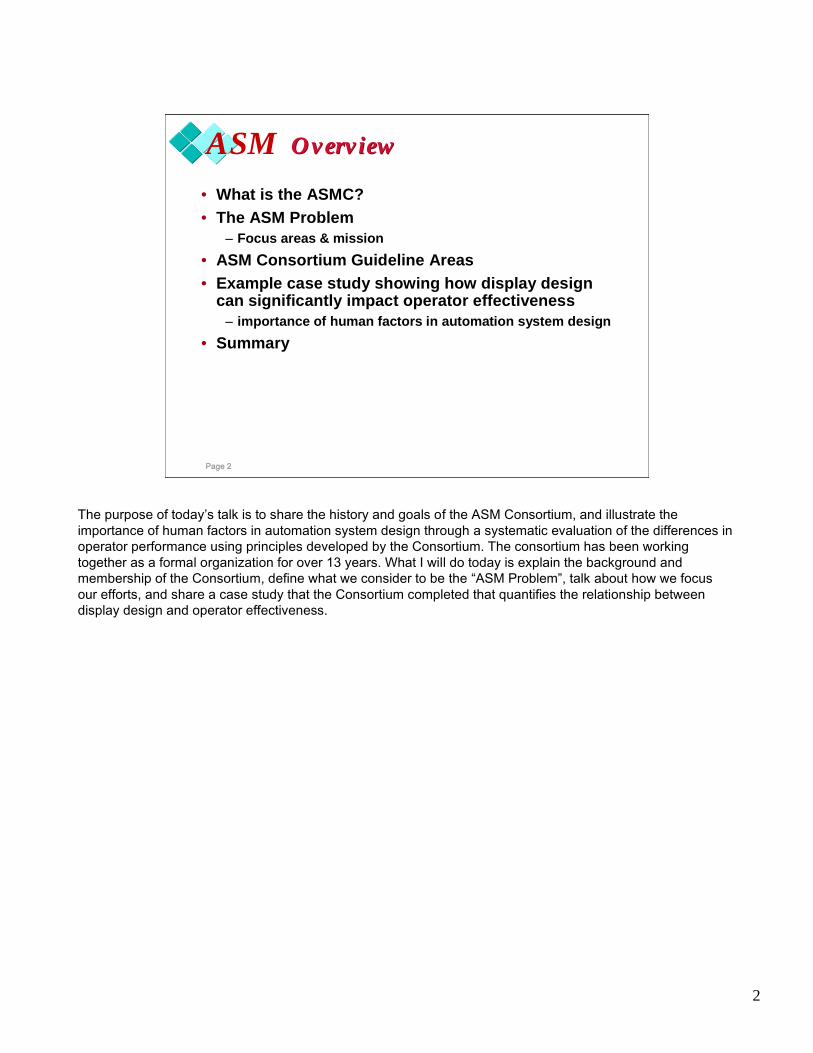
ASM OverviewOverview
• What is the ASMC?• The ASM Problem
– Focus areas & mission
• ASM Consortium Guideline Areas• Example case study showing how display design
can significantly impact operator effectiveness – importance of human factors in automation system design
• Summary
The purpose of today’s talk is to share the history and goals of the ASM Consortium, and illustrate the importance of human factors in automation system design through a systematic evaluation of the differences in operator performance using principles developed by the Consortium. The consortium has been working together as a formal organization for over 13 years. What I will do today is explain the background and membership of the Consortium, define what we consider to be the “ASM Problem”, talk about how we focus our efforts, and share a case study that the Consortium completed that quantifies the relationship between display design and operator effectiveness.
3
Page 3
ASMA Joint Research and Development Consortium
® Abnormal Situation Management and ASM are U.S. registered trademarks of Honeywell Inc.
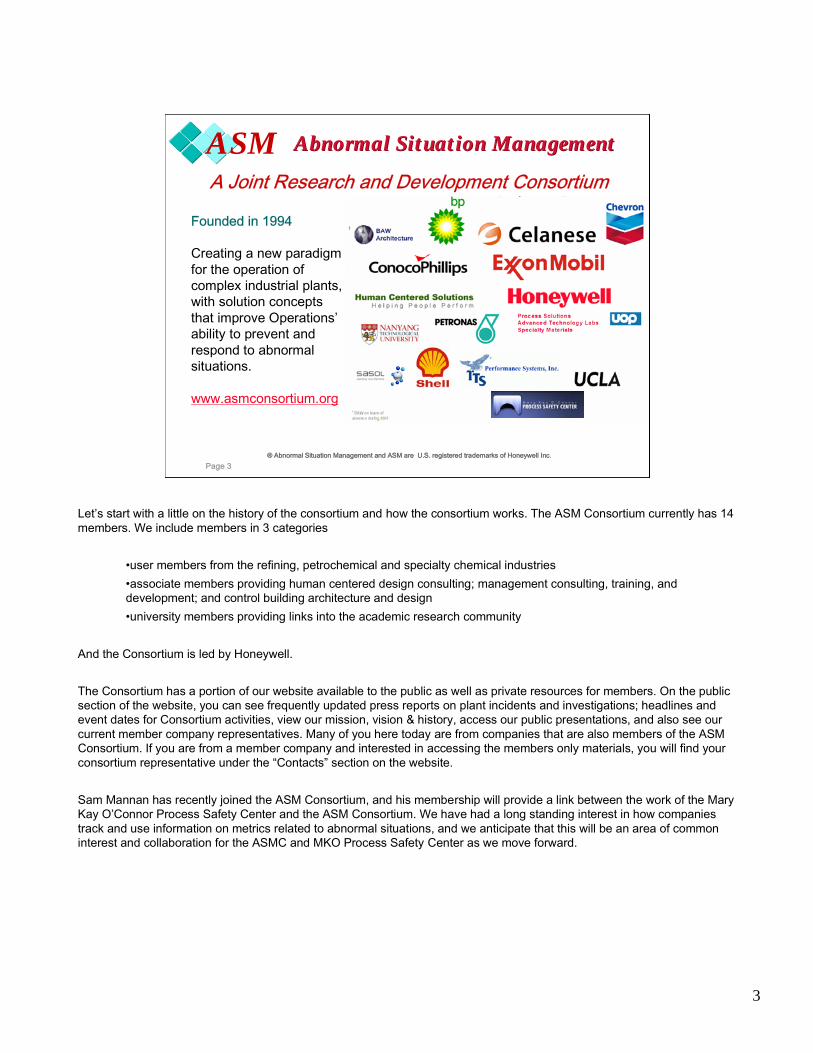
Founded in 1994
Creating a new paradigm for the operation of complex industrial plants, with solution concepts that improve Operations’ability to prevent and respond to abnormal situations.
www.asmconsortium.org
Abnormal Situation ManagementAbnormal Situation Management
Let’s start with a little on the history of the consortium and how the consortium works. The ASM Consortium currently has 14 members. We include members in 3 categories
•user members from the refining, petrochemical and specialty chemical industries•associate members providing human centered design consulting; management consulting, training, and development; and control building architecture and design•university members providing links into the academic research community
And the Consortium is led by Honeywell.
The Consortium has a portion of our website available to the public as well as private resources for members. On the public section of the website, you can see frequently updated press reports on plant incidents and investigations; headlines and event dates for Consortium activities, view our mission, vision & history, access our public presentations, and also see our current member company representatives. Many of you here today are from companies that are also members of the ASM Consortium. If you are from a member company and interested in accessing the members only materials, you will find your consortium representative under the “Contacts” section on the website.
Sam Mannan has recently joined the ASM Consortium, and his membership will provide a link between the work of the Mary Kay O’Connor Process Safety Center and the ASM Consortium. We have had a long standing interest in how companies track and use information on metrics related to abnormal situations, and we anticipate that this will be an area of common interest and collaboration for the ASMC and MKO Process Safety Center as we move forward.

4
Page 4
ASM• 1990 - Formed an Alarm Management Task Force of 25 Honeywell
Customer Representatives• 1992 - Asserted need to go beyond alarm management to improve
operator support• 1993 - Established assessment project to understand abnormal
situation management with 4 of Honeywell customers• 1994 - Generated ASM problem statement and solution requirements
document• 1994 - Founded the ASM Joint R&D Consortium - 10 companies• 1995 - Started NIST ASM Collaborative Decision Support Program
with focus on feasibility of technology• 1998 - Established @sset.MAX product and service offerings • 1999 - Decided to embark on 3-year short-term research to field
decision support solution concepts• 2002, 2005 - Decided to continue another 3 years emphasis on
closing gaps on effective operations practices & product development
ASM Consortium HistoryASM Consortium History
The Consortium grew out of a group called the Alarm Management Task Force, which was a customer advisory board led by Honeywell in 1990. The initial goal of the AMTF was to improve the alarm management functionality of Honeywell’s TDC3000 platform. One of the side effects of a flexible digital automation system was the rapid growth of configured alarms. The alarm volume began to overwhelm process operators. The AMTF suggested in 1992 that Honeywell investigate customer needs in addressing a bigger problem - they referenced this as abnormal situation management. In 1993, Honeywell and 4 customer companies (from the alarm management task force) formed a study team to investigate the nature of the abnormal situation management problem and define solution requirements. This team included Amoco, Chevron, Exxon, and Shell. In 1994, the ASM Consortium was formed as a formal legal entity with 5 additional customer companies - BP, Mobil, NOVACOR, Texaco, and Star Enterprises.
The ASM Consortium developed a research proposal and was granted funding from the National Institute of Standards and Technology in 1994. The Consortium received 6.6 million in funding from NIST for researching and prototyping ASM solutions. This initial research effort developed the solution concept for a suite of integrated software that would allow operators to manage abnormal situations.
After completion of the NIST research, the consortium members decided to self fund continuation of the work to field prototypes of the solution concepts developed in the NIST research program. The consortium has continued to operate in 3 year programs since 1999, working to further refine the products and focus on deploying solutions across operations. Phillips Petroleum became a member in the year 2000, Sasol in 2006, BP rejoined in 2007 and Petronas also joined in 2007.
Consortium members pay an initiation fee and annual dues. These monies are augmented with control over part of Honeywell’s engineering docket for R&D spending to fund ongoing research. Meaningful research in this area is very expensive, in terms of dollars and resources for people and site access. The collaborative consortium approach allows us to benchmark across different companies and plant sites to determine best practices and root causes for incidents. The fundamental approach is a pooling of knowledge so everyone ends up with a lot more than if they had done this by themselves.

5
Page 5
ASM What is an Abnormal Situation?What is an Abnormal Situation?
An industrial process is being disturbed and the automated control system can not cope...Consequently, the operations team mustintervene to supplement the controlsystem.Impacts profitability in multiple ways:
Product Quality
Product Throughput
Job Satisfaction Equipment Damage
Environmental Release
Personal Injury Loss of Life
Public Relations
The definition that we work with is: An abnormal situation is a disturbance or series of disturbances in a process that causes plant operations to deviate from their normal operating state.” The disturbances may be minimal or catastrophic, and cause production losses or, in serious cases, endanger human life. The result of an abnormal situation can be unnecessary cost due production losses, off-spec product, equipment damage, or worse. This industry runs 365/24, and can not simply reschedule production--what is lost is lost forever.

6
Page 6
ASM Fundamental ASM ProblemFundamental ASM Problem
The Paradox of Automation…
• Better automation leads to more sophisticated processes
• More sophisticated processes leads to more opportunities for error
• We “fix” the increasing errors with still more automation
When things go wrong, people have difficultyintervening to correct the problem!
Poor User Centered Automation
At the core of the ASM problem is what we have referred to as the “Paradox of Automation”. As systems get more complicated, the operator is put into an untenable position. Why? First, as systems become more complex, they become more difficult to operate. One solution to operational difficulty is to add automation. But automation itself increases complexity. In addition to the increase in complexity, it is difficult to maintain operational skills in an automated environment. Those skills are precisely the ones that are most needed when the automated system is unable to handle a problem and the operator is required to intervene.
Hence our focus has been on addressing the complex human-system interaction and factors that influence successful performance. Automation solutions have often been developed without consideration of the human that needs to interact with the solution. We can provide automation that effectively solves a problem under normal conditions, but when an anomaly occurs the complexity of the automation undermines the ability of people to intervene and correct the problem. One of the goals of the ASM R&D program is to define requirements for user-centered automation and support technologies

7
Page 7
ASM Unexpected Events Cost 3-8% Capacity> $10B annually in Lost ProductionUnexpected Events Cost 3-8% Capacity> $10B annually in Lost Production
Plant Operating Target
Plant Capacity Limit
Daily Production LevelDaily Production Level
Day
s pe
r Yea
r Optimization efforts
Operational Constraints
95% 100%< 60%
Total Feed
0
5
10
15
20
280
290
300
310
320
330
340
350
360
370
380
390
400
410
420
430
440
450
460
470
480
490
500
510
520
530
540
550
560
570
580
590
600
610
620
Rate
$33.5 M
Total Feed
02
46
810
121416
18
280
290
300
310
320
330
340
350
360
370
380
390
400
410
420
430
440
450
460
470
480
490
500
510
520
530
540
550
560
570
580
590
600
610
620
$38.5 M
0
50
100
150
200
250
3001
12
11
5
11
8
12
1
12
4
12
7
13
0
13
3
13
6
13
9
14
2
14
5
14
8
15
1
15
4
15
7
16
0
16
3
16
6
16
9
17
2
17
4
17
7
18
0
18
3
Production rate
3.2%5.8%
0
50
100
150
200
250
300
457
463
468
474
480
486
492
497
503
509
515
520
526
532
538
543
549
555
561
567
572
578
584
590
595
Feed Rate
1 5 0 3
$24.2M
1 σ2 σ
Summarized Production Data
Plant Incidents
33.5M
38.5M
24.2M
5.8% Source: ASM Consortium Research
This slide depicts a typical production curve or capacity realized in practice--and does not factor in costs required to attain that capacity nor costs of accidents.
Most abnormal situations do not result in explosions and fires but are costly nevertheless, resulting in poor product quality, schedule delays, equipment damage, and other significant costs. The histogram at the right illustrates a typical annual production curve where the area shown in red indicates the impact of abnormal situations on plant production. The height of the curve shows the number of days at a specific production level. The peak shows the most frequent production level as the operating target.
The histograms on the left display actual plant production data obtained in ASM Consortium site studies. This kind of data demonstrated that operations practices can lead to costs of 3-8 per cent of plant capacity due to unexpected events. Based on these data, we estimate the cost of lost production due to abnormal situations is at least $10 billion annually in the U.S. petrochemical industry.
Investments in advanced control are intended to move the distribution of production rates to the right. ASM solutions are designed to slice off the tail on the left. Although accidents are rare, their impact amortized over time is about the same as that of the everyday production shortfalls. Our calculations on the cost of accidents is based on analysis in the mid 90s. These figures are potentially higher today. On the average, a typical plant has a significant loss every three years.
83
Page 8
ASM Sources of Abnormal Events Sources of Abnormal Events
People 40%
Equipment 40%
Process 20%
Established in literature ; confirmed by 18 plant studies - US, Canada, & Europe
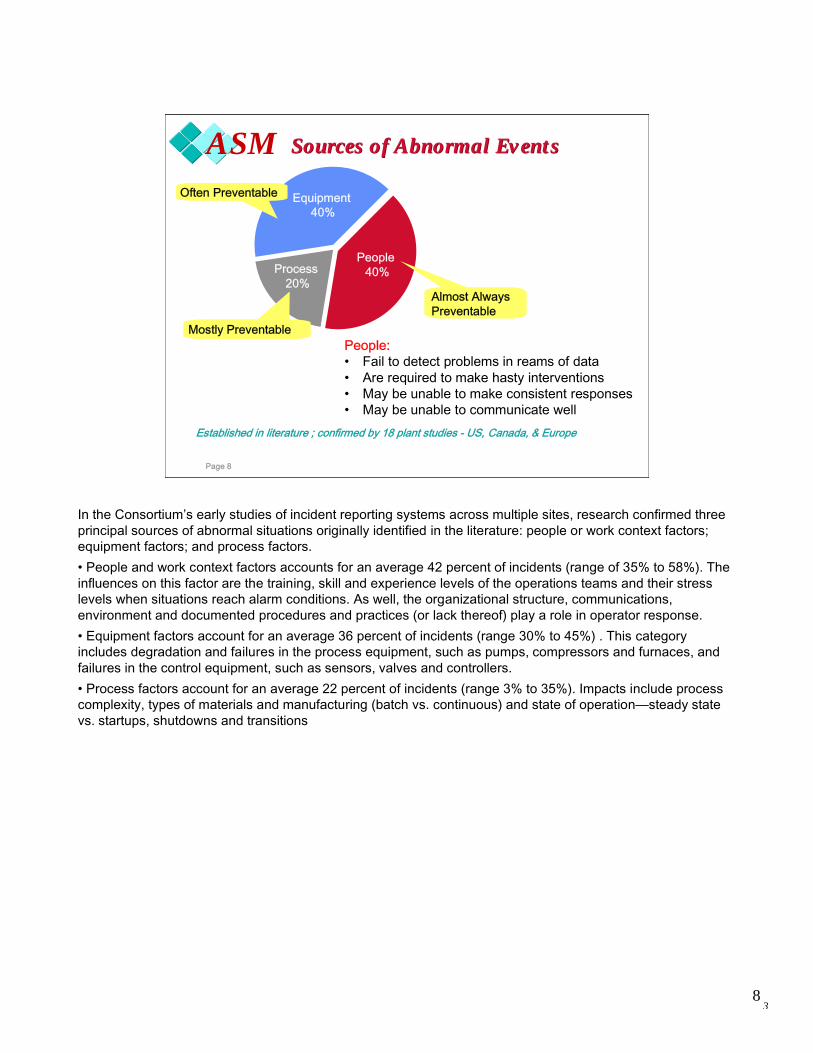
People:• Fail to detect problems in reams of data• Are required to make hasty interventions• May be unable to make consistent responses• May be unable to communicate well
Mostly Preventable
Often Preventable
Almost AlwaysPreventable
In the Consortium’s early studies of incident reporting systems across multiple sites, research confirmed three principal sources of abnormal situations originally identified in the literature: people or work context factors; equipment factors; and process factors.• People and work context factors accounts for an average 42 percent of incidents (range of 35% to 58%). The influences on this factor are the training, skill and experience levels of the operations teams and their stress levels when situations reach alarm conditions. As well, the organizational structure, communications, environment and documented procedures and practices (or lack thereof) play a role in operator response. • Equipment factors account for an average 36 percent of incidents (range 30% to 45%) . This category includes degradation and failures in the process equipment, such as pumps, compressors and furnaces, and failures in the control equipment, such as sensors, valves and controllers.• Process factors account for an average 22 percent of incidents (range 3% to 35%). Impacts include process complexity, types of materials and manufacturing (batch vs. continuous) and state of operation—steady state vs. startups, shutdowns and transitions

9
Page 9
ASM Human limitationsHuman limitations
• If we look at the causes of the events themselves, 90% are preventable,
– Majority are due to the actions or inactions of people– People will always be a part of the decision-making process
in plant operations
• People aren’t inept. People do have limitations. – We are not good at detecting problems in large bodies of
data– Don’t have enough time to think through consequences– Not as consistent as automation, given the same inputs– Communication can be an problem
• All of these human limitations are exacerbated by stressful situations
– Design the system with human strengths and limitations
If we look at the causes of the events themselves, 90% are preventable, and the majority--by some estimates the vast majority--are due to the actions or inactions of people. Human beings will always be a part of the decision-making process in plant operations and therefore there will always be opportunities for human error to contribute to abnormal situations
It’s not that people are inept. The problem is that they are dealing with too much complexity, a control system that has given up on solving the problem, and not enough time to thoroughly analyze the situation and respond accordingly. People have limitations – we are not good at detecting problems in large bodies of data, we are not always given time to think through an intervention, and people may not consistently as an automation system given the same inputs. People may also struggle to communicate. For example, it is currently difficult to send messages to plants affected by disturbance while at the same time taking compensatory or corrective action. In addition, miscommunication or no communication at all may occur across shifts which leads to inappropriate action.
All of these human limitations are exacerbated by stressful situations. The goal of the consortium has been to identify how to design the organization, training, support systems and automation to build on human strengths, and provide support for well understood limitations.
10
Page 10
ASM Effective Operations PracticesAreas of FocusEffective Operations PracticesAreas of FocusAreas of Focus
• Abnormal Situation Understanding
• Management Structure & Policy• Training and Skill Development• Communications• Procedures• Control Room and Field
Environment• Monitoring, Control and Support
Applications
• Future Role of Operator Vision
• ASM Overview References– Nimmo, I. Adequately Address
Abnormal Operations. Chemical Engineering Progress. September 1995.
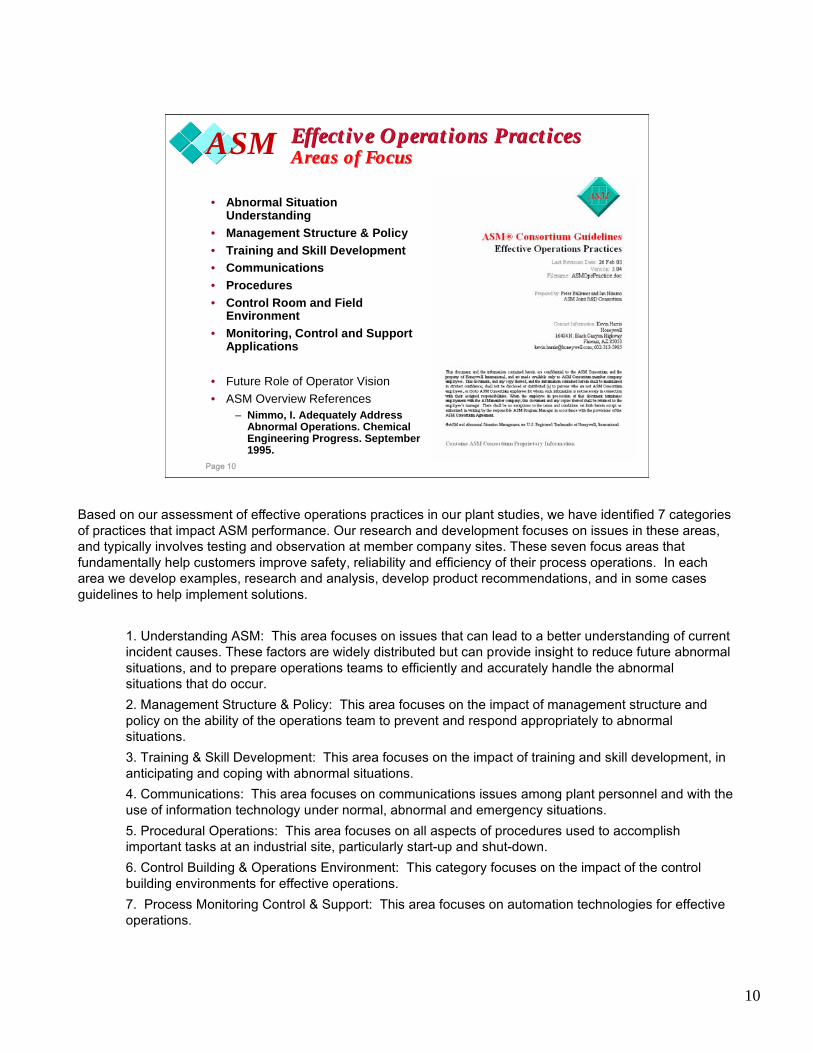
Based on our assessment of effective operations practices in our plant studies, we have identified 7 categories of practices that impact ASM performance. Our research and development focuses on issues in these areas, and typically involves testing and observation at member company sites. These seven focus areas that fundamentally help customers improve safety, reliability and efficiency of their process operations. In each area we develop examples, research and analysis, develop product recommendations, and in some cases guidelines to help implement solutions.
1. Understanding ASM: This area focuses on issues that can lead to a better understanding of current incident causes. These factors are widely distributed but can provide insight to reduce future abnormal situations, and to prepare operations teams to efficiently and accurately handle the abnormal situations that do occur.2. Management Structure & Policy: This area focuses on the impact of management structure and policy on the ability of the operations team to prevent and respond appropriately to abnormal situations.3. Training & Skill Development: This area focuses on the impact of training and skill development, in anticipating and coping with abnormal situations.4. Communications: This area focuses on communications issues among plant personnel and with the use of information technology under normal, abnormal and emergency situations.5. Procedural Operations: This area focuses on all aspects of procedures used to accomplish important tasks at an industrial site, particularly start-up and shut-down. 6. Control Building & Operations Environment: This category focuses on the impact of the control building environments for effective operations.7. Process Monitoring Control & Support: This area focuses on automation technologies for effective operations.
11
Page 11
ASM Alarm ManagementAreas of Focus Alarm ManagementAreas of Focus
• Research areas include– Alarm Flooding Problem– Alarm Philosophy and
Rationalization– Performance Metrics
Development– Alarm Management Guidelines
• Research led to development of Alarm Management Tools
– Maintain engineered limits– Alarm help for operators– Alarm metric reporting– Alert where appropriate
• Continue to support the development of a guidelines document by Engineering Equipment and Materials Users Association (EEMUA)
– New version expected soon– http://www.eemua.co.uk/publica
tions/control/
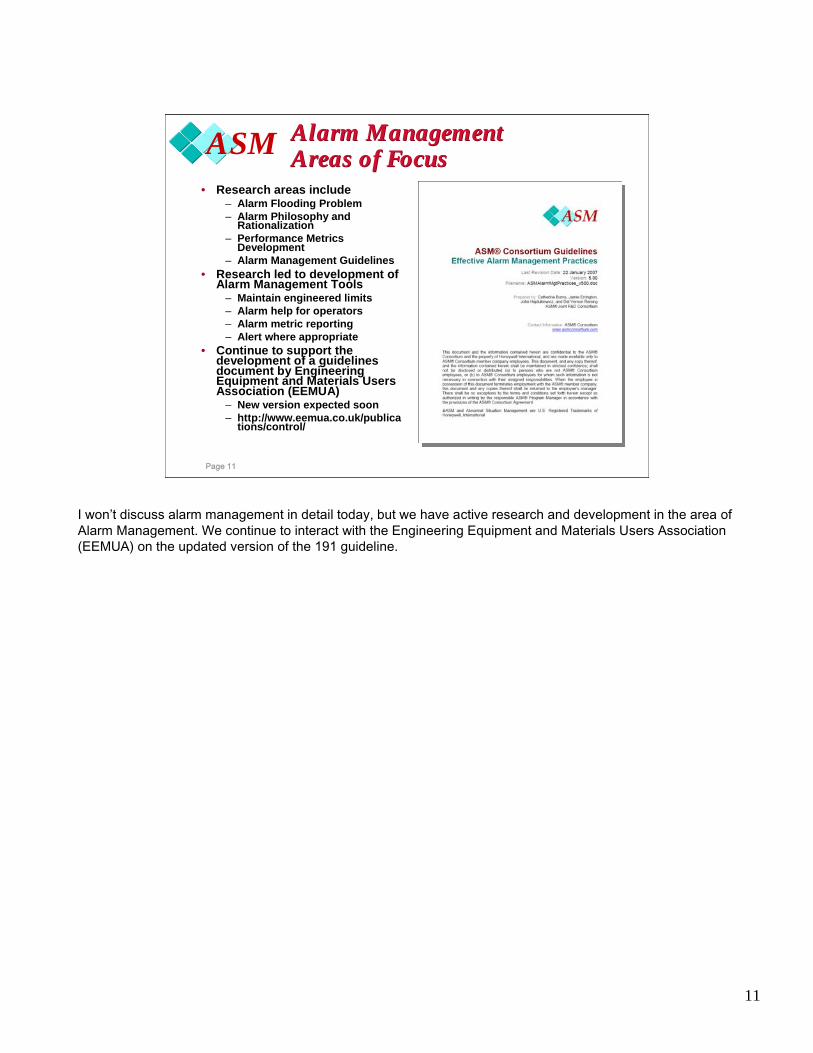
I won’t discuss alarm management in detail today, but we have active research and development in the area of Alarm Management. We continue to interact with the Engineering Equipment and Materials Users Association (EEMUA) on the updated version of the 191 guideline.
12
Page 12
ASM Effective Procedural PracticesAreas of FocusEffective Procedural PracticesAreas of FocusAreas of Focus
• Research areas– Content and Format – Development
– Deployment – Maintenance – Training
• Research has led to– development of a product
for implementing automated and mixed manual/automated procedures
– Effective Procedural Practices guideline
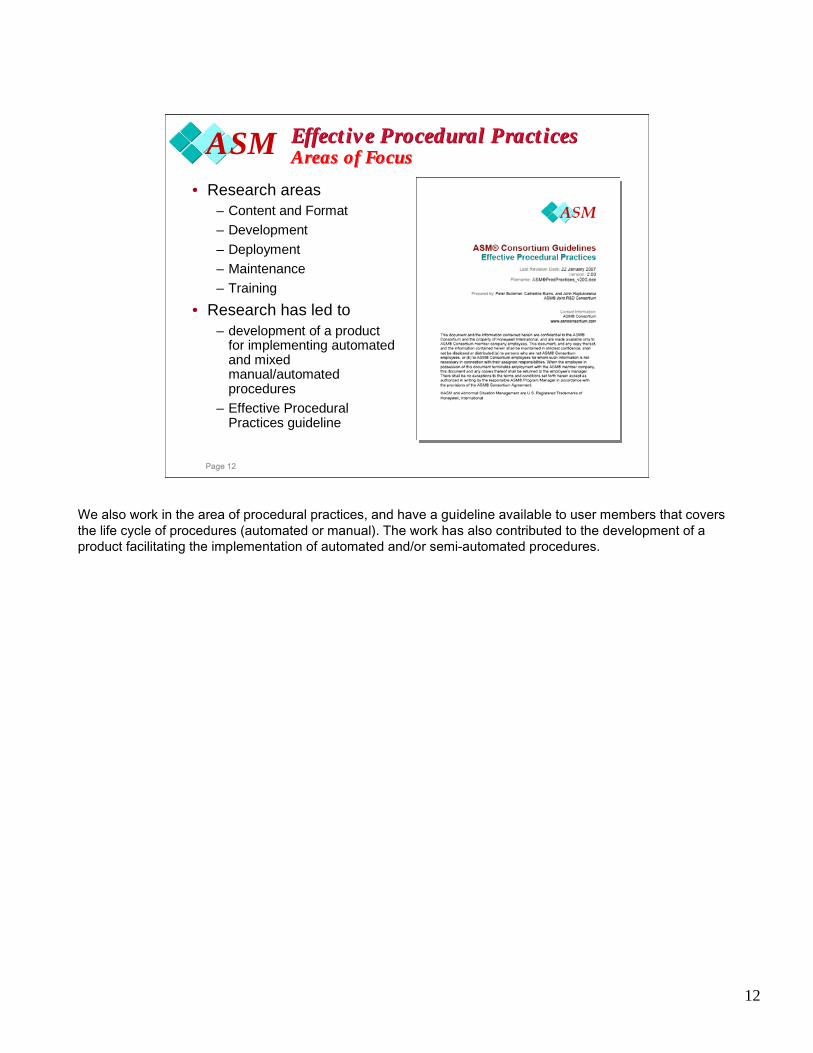
We also work in the area of procedural practices, and have a guideline available to user members that covers the life cycle of procedures (automated or manual). The work has also contributed to the development of a product facilitating the implementation of automated and/or semi-automated procedures.

13
Page 13
ASM Effective Operator Display DesignAreas of FocusEffective Operator Display DesignAreas of FocusAreas of Focus
• Display Types• Display Content and Task Appropriate
Information• Display Style Guidelines • Display Layout• Navigation• Use of Color• Use of Symbols and Process
Connections
• Use of Text and Numbers • Interaction with Display • Alarm Configuration Scheme• Audible Annunciation of Alarms• Visual Annunciation of Alarms• Training Program• On-line Guidance • Design Methodology
• Management of Change
In the area of operator display design, we have developed recommended practices in 16 categories. I won’t go through all of the categories today, but what you can see is that we cover how the display should be organized, understanding how shapes, colors, numbers and symbols should be developed to aid the operator; how alarms should be integrated into displays; how to train operators and manage change; and providing online help. You’ll see in the example presented today that many of these concepts described in the guidelines were used, and how those concepts result in significantly better reaction and resolution of abnormal situations.

14
Page 14
ASM Operator Interface Impact – A Case StudyOperator Interface Impact – A Case Study
• History– 1998, a paper was presented at the AIChE conference
describing how an ASM member was applying the ASM Consortium's Best Practices to the design of an ethylene plant
– In Sept, 2000 – that ethylene plant was successfully started-up and the design work was put into service
– User interface design based on ASM principles was a key part of the implementation
» Learnings from the NIST research put into practice at this site
– In addition, many ASM recommended effective operating practices also in place
» For example, extensive training on dynamic simulators in the major units prior to the plant startup
Bullemer, P. and Errington, J. "Designing for Abnormal Situation Management", 1998 AIChE Safety Session.
In 1998, at the AIChE conference in New Orleans Bullemer, P. and Errington, J. "Designing for Abnormal Situation Management", AIChE Safety Session, 1998, a paper was presented which described how NOVA Chemicals was applying the ASM Consortium's Best Practices to the design of an ethylene plant. In Sept, 2000 – that ethylene plant was successfully started-up and the design work was put into service.
Part of the implementation included an operator interface based on the findings from an early research prototype system called “AEGIS” – abnormal event guidance and information system. The approach prototyped in AEGIS included a structured multiple window format, with integrated trends, yoking, effective use of color/symbols/organized. The interface is designed to help the operator maintain big-picture awareness of the plant, with the capability to drill down to increasing levels of detail.
15
Page 15
ASM ASM Style InterfaceASM Style Interface
• Principal design aspects included:
– Multiple windows with controlled window management
– Multi-level views with increasing detail
– Yoked and tabbed navigation– Integrated trends and alarm
management– Integrated online access to
documentation, alarm rationalization, operating procedures, logbook
– Appropriate use of color, shape, object size, fonts, etc. based on human factors knowledge
Level 1
Level 2 Level 3
Level 4Level 4Trend Trend
Alarm Summary
Designed to enhance operator’s attention and perception of the plant
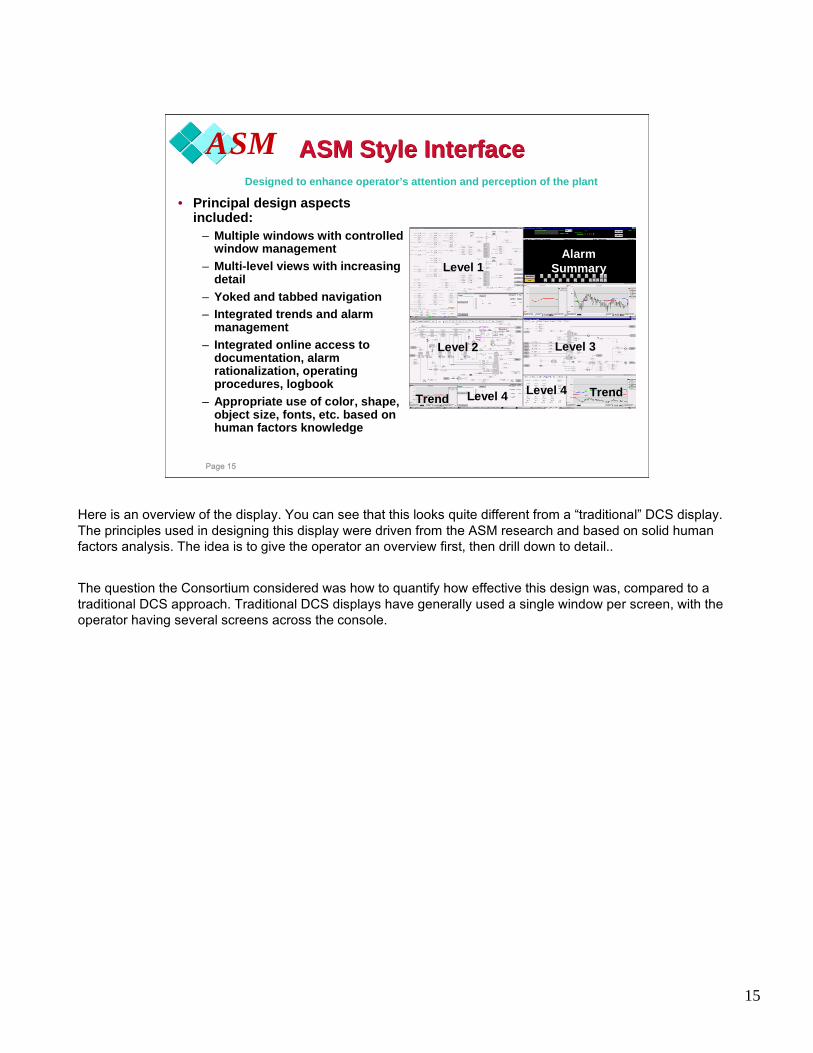
Here is an overview of the display. You can see that this looks quite different from a “traditional” DCS display. The principles used in designing this display were driven from the ASM research and based on solid human factors analysis. The idea is to give the operator an overview first, then drill down to detail..
The question the Consortium considered was how to quantify how effective this design was, compared to a traditional DCS approach. Traditional DCS displays have generally used a single window per screen, with the operator having several screens across the console.
16
Page 16
ASM Case Study ExperimentCase Study Experiment
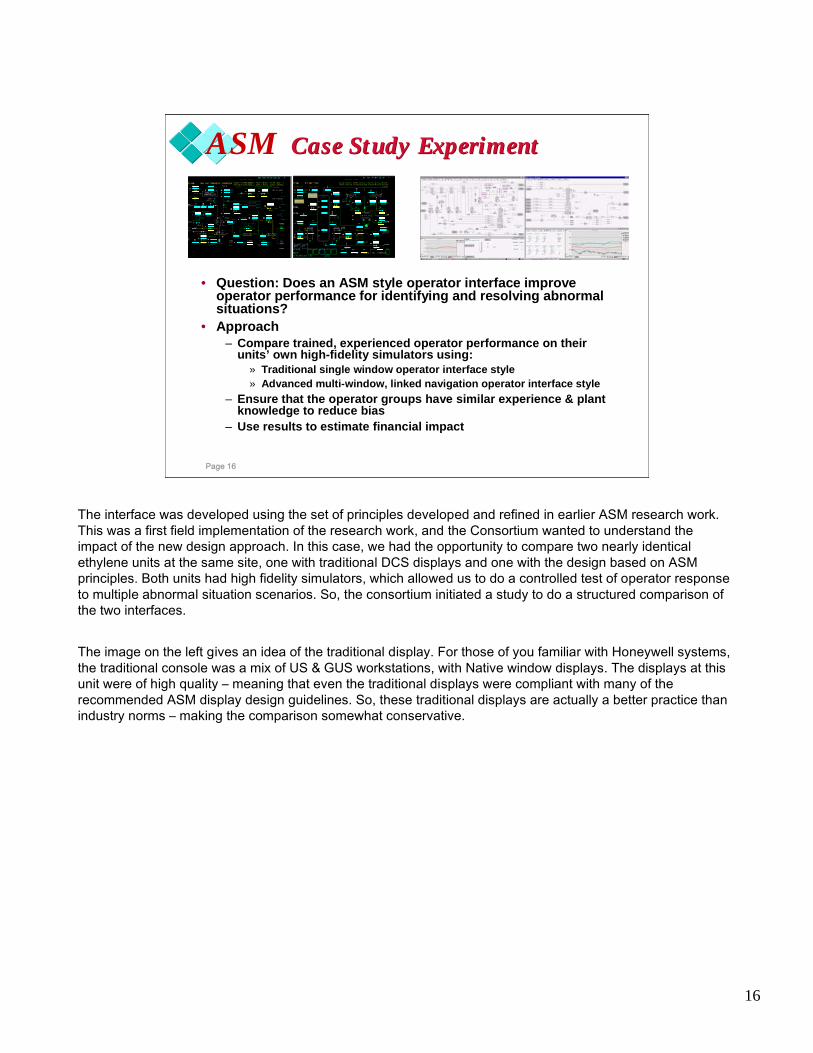
• Question: Does an ASM style operator interface improve operator performance for identifying and resolving abnormal situations?
• Approach – Compare trained, experienced operator performance on their
units’ own high-fidelity simulators using:» Traditional single window operator interface style » Advanced multi-window, linked navigation operator interface style
– Ensure that the operator groups have similar experience & plant knowledge to reduce bias
– Use results to estimate financial impact
The interface was developed using the set of principles developed and refined in earlier ASM research work. This was a first field implementation of the research work, and the Consortium wanted to understand the impact of the new design approach. In this case, we had the opportunity to compare two nearly identical ethylene units at the same site, one with traditional DCS displays and one with the design based on ASM principles. Both units had high fidelity simulators, which allowed us to do a controlled test of operator response to multiple abnormal situation scenarios. So, the consortium initiated a study to do a structured comparison of the two interfaces.
The image on the left gives an idea of the traditional display. For those of you familiar with Honeywell systems, the traditional console was a mix of US & GUS workstations, with Native window displays. The displays at this unit were of high quality – meaning that even the traditional displays were compliant with many of the recommended ASM display design guidelines. So, these traditional displays are actually a better practice than industry norms – making the comparison somewhat conservative.
17
Page 17
ASM Experimental DesignExperimental Design
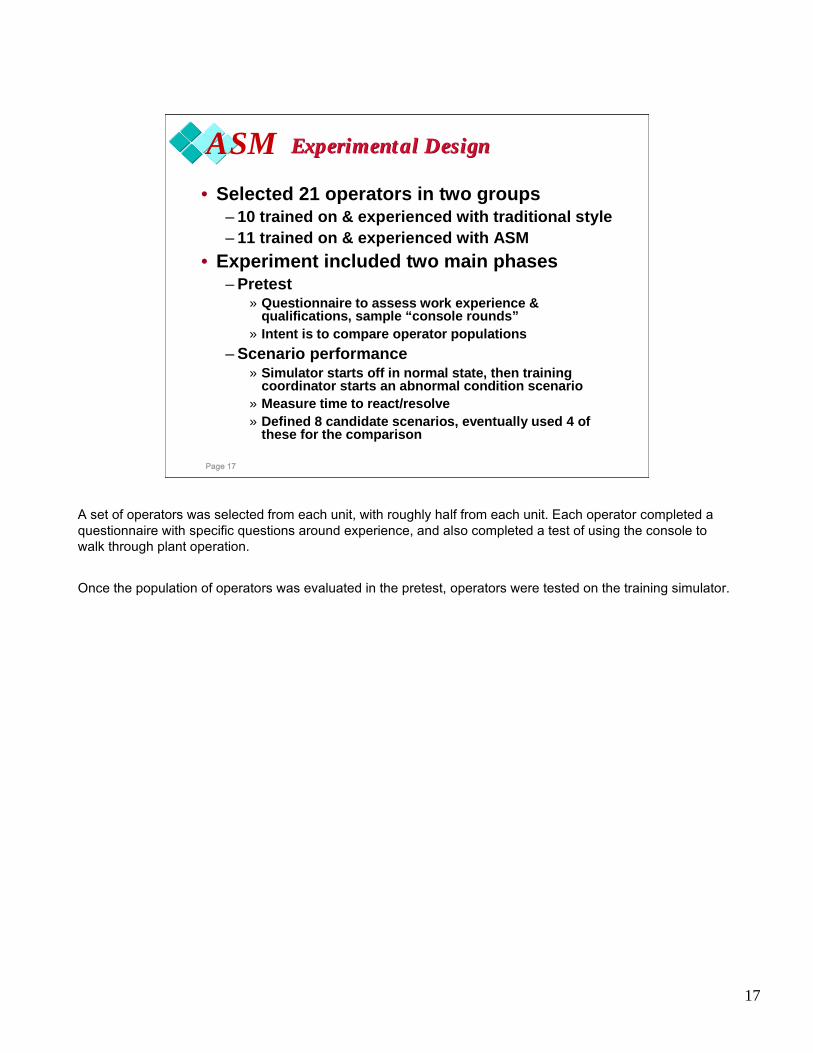
• Selected 21 operators in two groups– 10 trained on & experienced with traditional style– 11 trained on & experienced with ASM
• Experiment included two main phases– Pretest
» Questionnaire to assess work experience & qualifications, sample “console rounds”
» Intent is to compare operator populations
– Scenario performance » Simulator starts off in normal state, then training
coordinator starts an abnormal condition scenario» Measure time to react/resolve» Defined 8 candidate scenarios, eventually used 4 of
these for the comparison
A set of operators was selected from each unit, with roughly half from each unit. Each operator completed a questionnaire with specific questions around experience, and also completed a test of using the console to walk through plant operation.
Once the population of operators was evaluated in the pretest, operators were tested on the training simulator.
18
Page 18
ASM Pre-Test Results Pre-Test Results
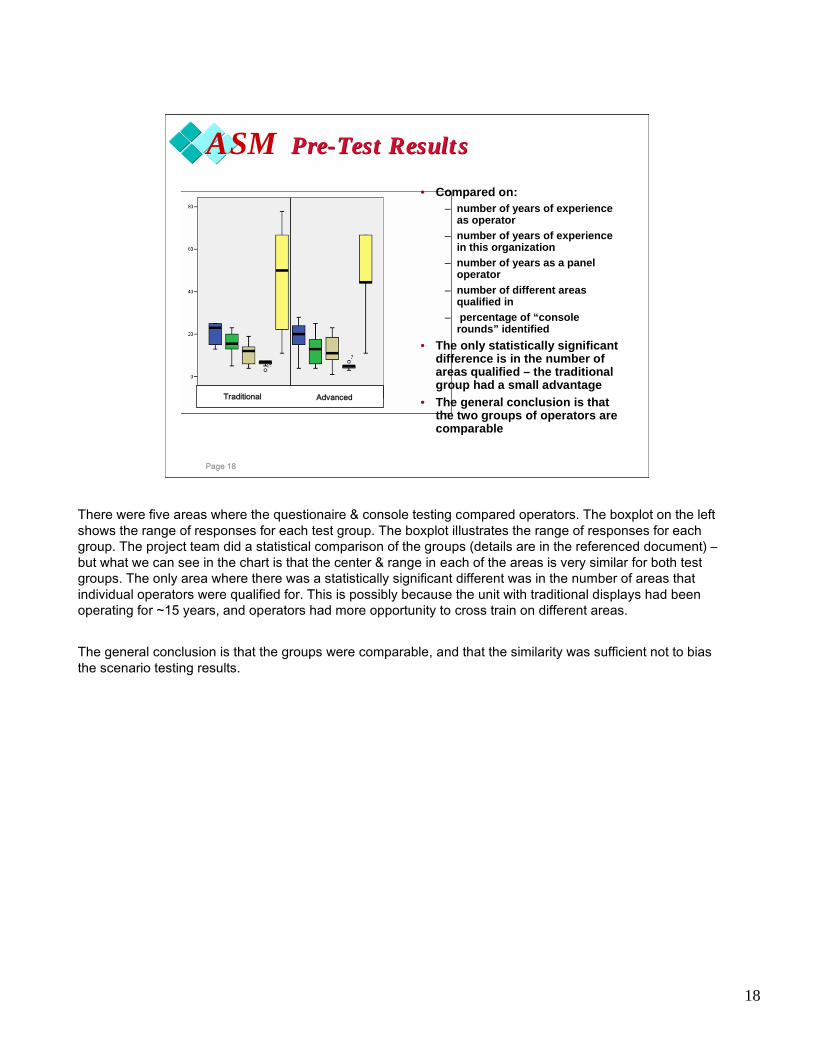
• Compared on:– number of years of experience
as operator– number of years of experience
in this organization– number of years as a panel
operator– number of different areas
qualified in– percentage of “console
rounds” identified
• The only statistically significant difference is in the number of areas qualified – the traditional group had a small advantage
• The general conclusion is that the two groups of operators are comparable
Traditional Advanced
There were five areas where the questionaire & console testing compared operators. The boxplot on the left shows the range of responses for each test group. The boxplot illustrates the range of responses for each group. The project team did a statistical comparison of the groups (details are in the referenced document) –but what we can see in the chart is that the center & range in each of the areas is very similar for both test groups. The only area where there was a statistically significant different was in the number of areas that individual operators were qualified for. This is possibly because the unit with traditional displays had been operating for ~15 years, and operators had more opportunity to cross train on different areas.
The general conclusion is that the groups were comparable, and that the similarity was sufficient not to bias the scenario testing results.
19
Page 19
ASM Case Study Results Case Study Results
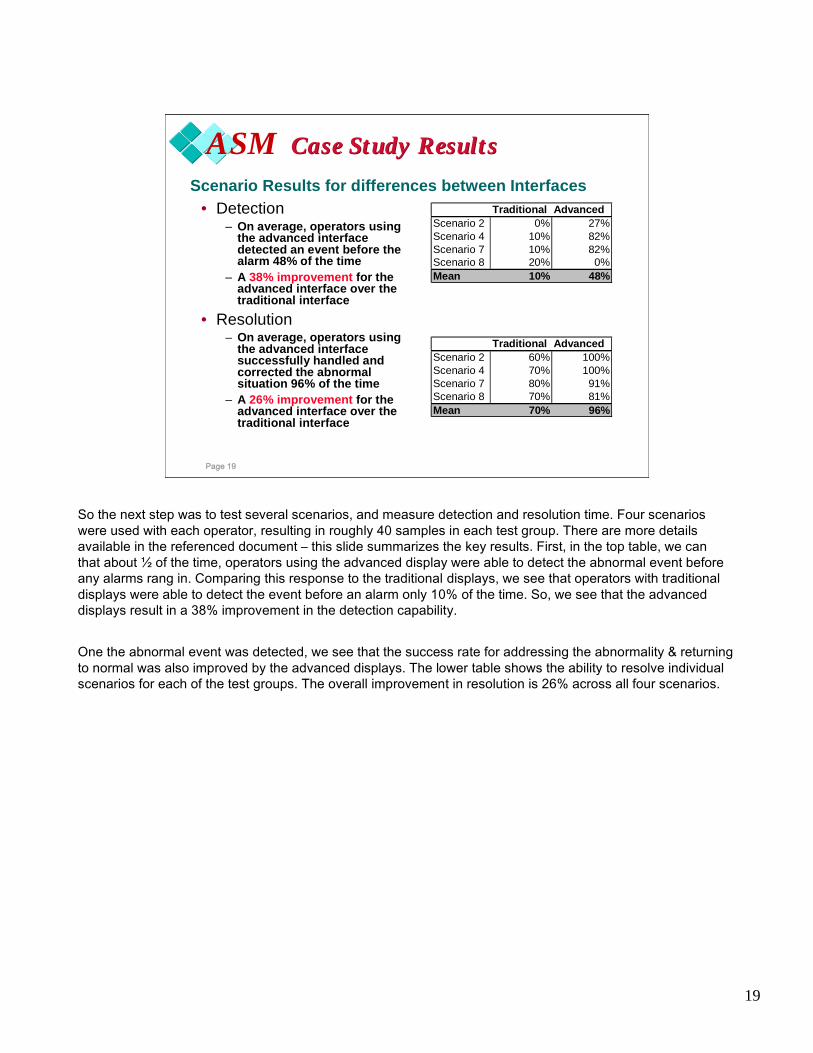
• Detection– On average, operators using
the advanced interface detected an event before the alarm 48% of the time
– A 38% improvement for the advanced interface over the traditional interface
• Resolution– On average, operators using
the advanced interface successfully handled and corrected the abnormal situation 96% of the time
– A 26% improvement for the advanced interface over the traditional interface
Traditional AdvancedScenario 2 0% 27%Scenario 4 10% 82%Scenario 7 10% 82%Scenario 8 20% 0%Mean 10% 48%
Scenario Results for differences between Interfaces
Traditional AdvancedScenario 2 60% 100%Scenario 4 70% 100%Scenario 7 80% 91%Scenario 8 70% 81%Mean 70% 96%
So the next step was to test several scenarios, and measure detection and resolution time. Four scenarios were used with each operator, resulting in roughly 40 samples in each test group. There are more details available in the referenced document – this slide summarizes the key results. First, in the top table, we can that about ½ of the time, operators using the advanced display were able to detect the abnormal event before any alarms rang in. Comparing this response to the traditional displays, we see that operators with traditional displays were able to detect the event before an alarm only 10% of the time. So, we see that the advanced displays result in a 38% improvement in the detection capability.
One the abnormal event was detected, we see that the success rate for addressing the abnormality & returning to normal was also improved by the advanced displays. The lower table shows the ability to resolve individual scenarios for each of the test groups. The overall improvement in resolution is 26% across all four scenarios.

20
Page 20
ASM Economic impactEconomic impact
• Economic impact assessment– Conducted a Monte Carlo simulation using site abnormal
event data collected on the traditional style unit– Collected annual baseline from 6 years of incident data
• The total economic impact for the unit with the Traditional Style Displays
– On average, $870K USD/year – The median economic impact (considered most likely) was
$800K USD/year– Note that data is from a 1.8 Blb/year ethylene plant
Case study demonstrates both technical measures and financial measures, and quantifies the opportunity for improvement using an advanced interface
The project team used the results from the scenario testing to drive an economic analysis of the impact of unresolved abnormal events. To do this, the site provided 6 years of incident data from the traditional display unit. This gives an approximate probability distribution for the various event types included in the test. Each of these incident types also included an economic impact assessment.
To estimate the range of potential economic impact, the team conducted a Monte Carlo simulation using the estimated probabilities from the historical incident data. This simulation approach gives a distribution of potential financial impacts, given the prior distribution of abnormal events. From this distribution, we can estimate the “most likely” impact by looking at a summary statistic for the distribution – as an example, the mean and median impact are shown.
In summary, the Consortium realized early on that if 90% of the events are preventable, than we should adopt that as our goal, and convert all of the production losses thus prevented to increased output and therefore profitability. To help us measure the impact of our solution concepts, we have been developing ASM performance metrics and case studies such as the example shown today.
21
Page 21
ASM SummarySummary
• ASM is a difficult problem, but the potential for improved plant safety and profitability is also significant
– ASM technology and practices improve operator performance for incident avoidance and in abnormal situations
• Some key references for further details:– Bullemer, P., Reising D.V., Hajdukiewicz, J., Errington, J,
Interaction Requirements Methods for Effective Operator Interfaces, Abnormal Situation Management Consortium internal publication, (2004)
– Errington, J., DeMaere, T., Wade, E. Supporting Key Console Operator Interactions through the Control System Interface, AIChESpring National Meeting (2005)
– Errington, J., Reising D.V., Harris, K. ASM Outperforms Traditional Interface, Chemical Processing (2006)
• ASM Public Dashboard – www.asmconsortium.com
It is important to emphasize that ASM excellence is not achieved by technology in isolation. Like any change process, excellence in ASM complete organizational commitment to the development and continuous improvement of management systems that ensure high quality operations practices. There are no magical bullets and there is no shortcut pat. Most importantly, the potential for improved plant safety and profitability is also significant.
The key references provide more background for the topics presented today.


![MKO Press Release Support for Quebec First Nations MMIWG [October 27 2015]](https://static.fdocuments.in/doc/165x107/563db7bb550346aa9a8d6ad2/mko-press-release-support-for-quebec-first-nations-mmiwg-october-27-2015.jpg)