MK Restaurant Group PCL ( Mm.listedcompany.com/misc/presentations/20190813-m... · 2Q2019...
20
2Q2019 Presentation Results August 2019 MK Restaurant Group PCL (“M”) Company Presentation
Transcript of MK Restaurant Group PCL ( Mm.listedcompany.com/misc/presentations/20190813-m... · 2Q2019...
2Q2019 Presentation Results
August 2019
MK Restaurant Group PCL (“M”)
Company
Presentation

1
Agenda
Company Overview
2Q2019 Key Financial Highlights
Business Update
2
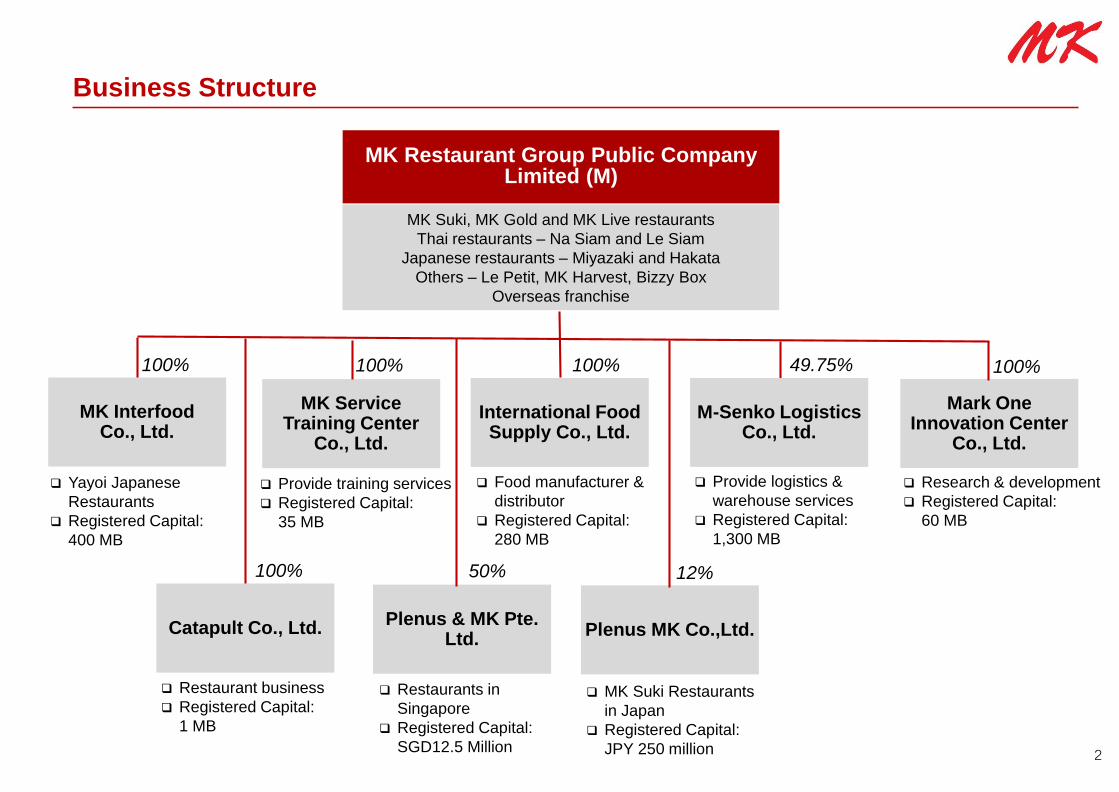
Business Structure
MK Restaurant Group Public Company Limited (M)
Plenus & MK Pte. Ltd.
Plenus MK Co.,Ltd.
100%
MK Service Training Center
Co., Ltd.
100%
50% 12%
Yayoi Japanese
Restaurants
Registered Capital:
400 MB
Provide training services
Registered Capital:
35 MB
Food manufacturer &
distributor
Registered Capital:
280 MB
Restaurants in
Singapore
Registered Capital:
SGD12.5 Million
MK Suki Restaurants
in Japan
Registered Capital:
JPY 250 million
MK Suki, MK Gold and MK Live restaurants
Thai restaurants – Na Siam and Le Siam
Japanese restaurants – Miyazaki and Hakata
Others – Le Petit, MK Harvest, Bizzy Box
Overseas franchise
Provide logistics &
warehouse services
Registered Capital:
1,300 MB
International Food Supply Co., Ltd.
100%
M-Senko Logistics Co., Ltd.
49.75%
Mark One Innovation Center
Co., Ltd.
100%
Research & development
Registered Capital:
60 MB
Catapult Co., Ltd.
100%
MK InterfoodCo., Ltd.
Restaurant business
Registered Capital:
1 MB

3
Restaurant Outlets in Thailand
Type of Business Restaurants Brand No. of Outlets
Suki RestaurantMK 440
MK Gold 7
MK Live 5
Japanese RestaurantYayoi 188
Miyazaki 23
Hakata 5
Thai RestaurantNa Siam 1
Le Siam 3
OthersLe Petit 3
Bizzy Box 6
Harvest 1
Remark: Data as of Jun 2019

4
Leader in chained restaurant industry with nationwide branches coverage
Dominant Position in Chained Restaurant Industry
89 99 97 106 108
5159 68
78 80
2015 2016 2017 2018 2Q19
Bangkok & Metropolitan area Provincial area
197 199 200 202 204
222 225 235 246 248
2015 2016 2017 2018 2Q19
Bangkok & Metropolitan area Provincial area
Extensive Coverage Nationwide
North
MK / Gold / Live 24
Yayoi 6
West
MK / Gold / Live 19
Yayoi 7
North East
MK / Gold / Live 61
Yayoi 18
South
MK / Gold / Live 51
Yayoi 13
East
MK / Gold / Live 49
Yayoi 20
BKK & Greater BKK
MK / Gold / Live 204
Yayoi 108
Central
MK / Gold / Live 44
Yayoi 16
Branches
Japan
MK 35
Japan
an
MK 9
Vietnam
an
Yayoi 8
Singapore
55%
45%
419 424 448
43%
57%
158
184
140
an
MK 2 / Miyazaki 1
Lao PDR
435
165
Yayoi 1
Malaysia
452
188

5
3%
0%
2%2%
1%2%
1Q18 2Q18 1Q19 2Q19 1H18 1H19
Same-Store Sales Growth
In 2Q2019, same-store sales growth for MK and Yayoi were 2% and -3% respectively compared to the previous year.
3%
1%0%
-3%
2%
-1%
1Q18 2Q18 1Q19 2Q19 1H18 1H19
6
Agenda
Company Overview
2Q2019 Key Financial Highlights
Business Update
7
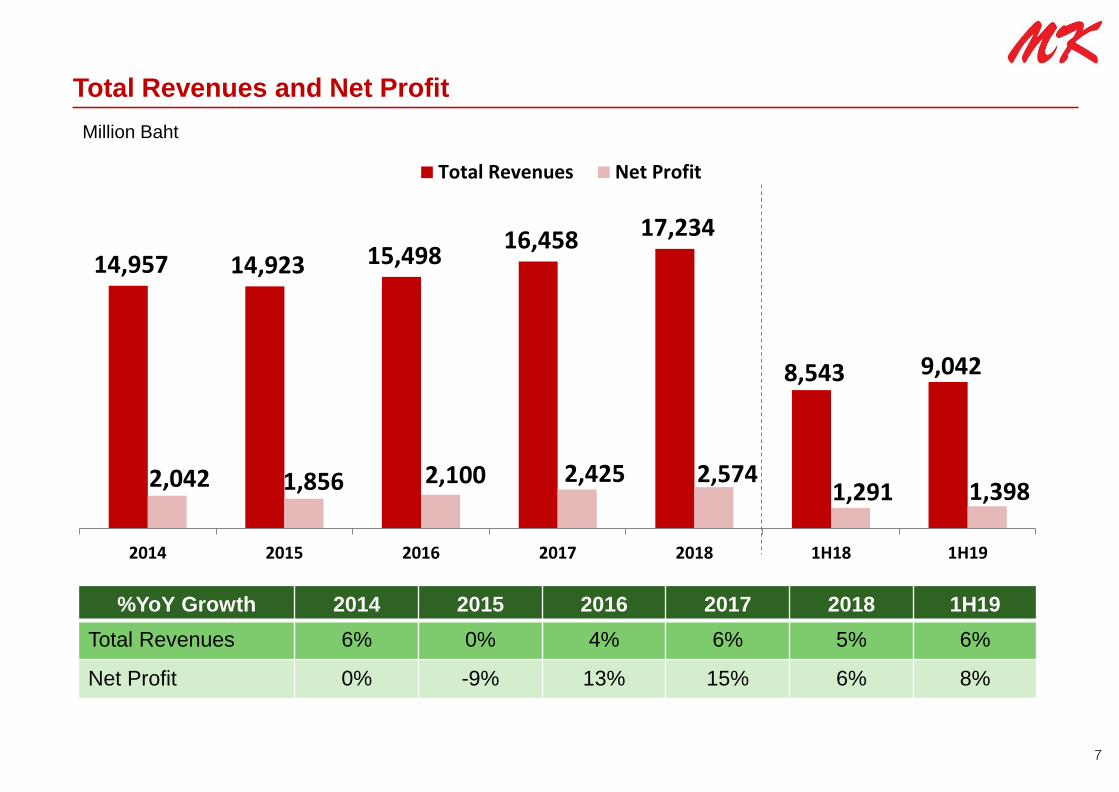
14,957 14,923 15,498 16,458 17,234
8,543 9,042
2,042 1,856 2,100 2,425 2,574 1,291 1,398
2014 2015 2016 2017 2018 1H18 1H19
Total Revenues Net Profit
Total Revenues and Net Profit
%YoY Growth 2014 2015 2016 2017 2018 1H19
Total Revenues 6% 0% 4% 6% 5% 6%
Net Profit 0% -9% 13% 15% 6% 8%
Million Baht

8
Gross Profit
Revenue ContributionRevenues from Sales and Services
Revenues Growth
In 2Q2019, revenues from sales & services grew up 5% compared to the prior year due primarily to the new
branch expansion
THB Million
THB Million
MK, 79%
Yayoi, 19%
Others, 2%
4,049 4,249 4,352 4,470
8,298 8,822
1Q18 2Q18 1Q19 2Q19 1H18 1H19
+5% YoY
+6% YoY
2,773 2,911 2,979 3,085 5,684 6,063
68.5% 68.5% 68.4% 69.0% 68.5% 68.7%
0%
10%
20%
30%
40%
50%
60%
70%
-
2,000
4,000
6,000
8,000
10,000
12,000
14,000
1Q18 2Q18 1Q19 2Q19 1H18 1H19
+7% YoY
+7% YoY

9
SG&A
In 2Q2019, SG&A increased 5% YoY compared to the prior year primarily due to the increase of labor cost and
rent.
SG&A Expenses
1H2019 SG&A Expenses Breakdown
THB Million
2,114 2,233 2,218 2,344
4,348 4,561
51% 51% 50% 51% 51% 50%
0%
10%
20%
30%
40%
50%
-
1,000
2,000
3,000
4,000
5,000
6,000
7,000
8,000
1Q18 2Q18 1Q19 2Q19 1H18 1H19
+5% YoY
+5% YoY
Personel, 53%
Rental, 20%
Utilities, 7%
Depreciation, 7%
Others, 13%

10
Net Profit
THB Million
EBITDA
In 2Q2019, EBITDA & Net Profit grew 3% and 4% YoY respectively compared to the previous year
THB Million
EBITDA & Net Profit
982 1,014 1,062 1,047 1,996 2,109
23.6% 23.1% 23.8% 22.8% 23.4% 23.3%
0%
5%
10%
15%
20%
25%
-
1,000
2,000
3,000
4,000
5,000
1Q18 2Q18 1Q19 2Q19 1H18 1H19
3% YoY6% YoY
632 659 710 689
1,291 1,398
15.2% 15.1% 15.9% 15.0% 15.1% 15.5%
0%
2%
4%
6%
8%
10%
12%
14%
16%
-
500
1,000
1,500
2,000
2,500
3,000
1Q18 2Q18 1Q19 2Q19 1H18 1H19
+4% YoY
+8% YoY
11
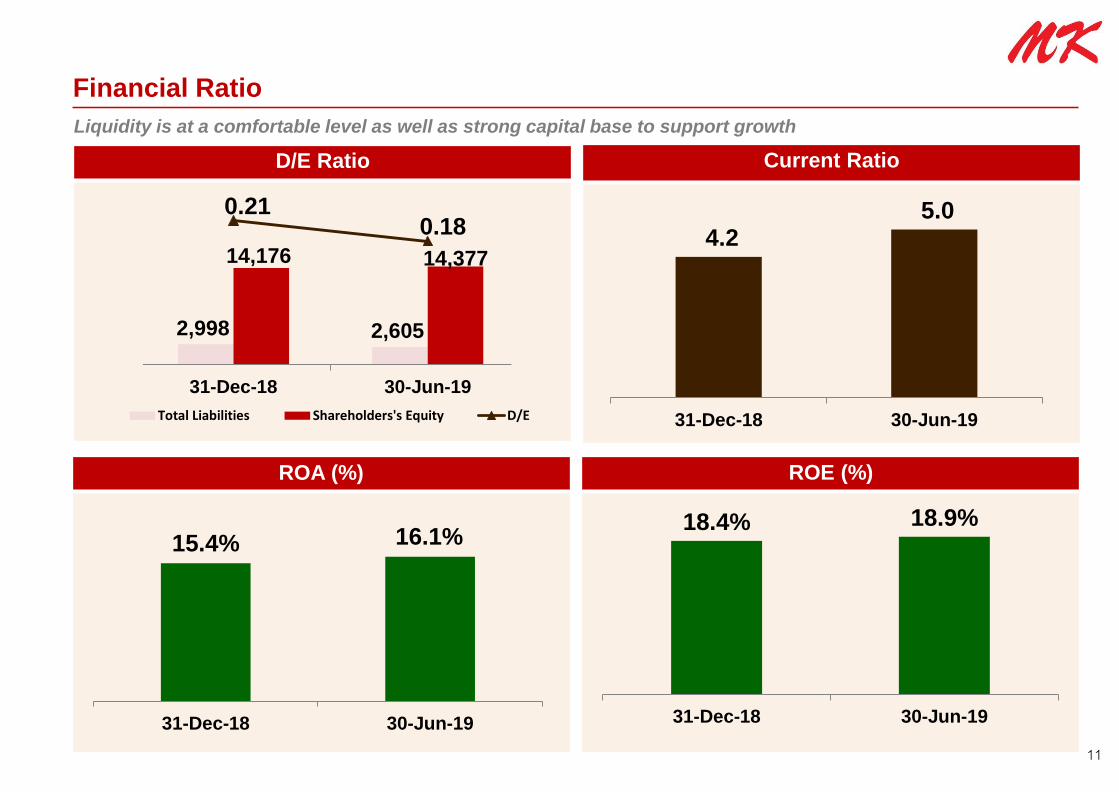
Current RatioD/E Ratio
Financial Ratio
Liquidity is at a comfortable level as well as strong capital base to support growth
ROA (%) ROE (%)
2,998 2,605
14,176 14,377
0.21 0.18
-
0.05
0.10
0.15
0.20
-
5,000
10,000
15,000
20,000
31-Dec-18 30-Jun-19
Total Liabilities Shareholders's Equity D/E
4.2 5.0
31-Dec-18 30-Jun-19
15.4% 16.1%
31-Dec-18 30-Jun-19
18.4% 18.9%
31-Dec-18 30-Jun-19

12
Agenda
Company Overview
2Q2019 Key Financial Highlights
Business Update

13
Notable Events in 1H2019
March 19, 2019 Awarded “Thailand Top Company Awards 2019” in “Food & Beverage” category
from Business+ Magazine & University of The Thai Chamber of Commerce.
April 26, 2019
June 28, 2019
Opened 8th MK Branch in Hanoi, Vietnam.
Opened 9th MK Branch in Ho Chi Minh City, Vietnam.
June 7, 2019 The Company was included in “THAIPAT Institute’s 2019 ESG100”, recognized
as outstanding performance in environment, social and governance aspects for 4
consecutive years.

14
Continued expansion strategy with shopping complexes, modern trade stores and community malls covering
nationwide
Outlet Expansion Plan
No. of New
outlets opened
in 1H2019
Plan
No. of New
outlets in 2019
65
4
MK Yayoi Others
1715
6
MK Yayoi Others

15
Marketing Campaign in 2Q2019 – MK

16
Marketing Campaign in 2Q2019 – MK
17
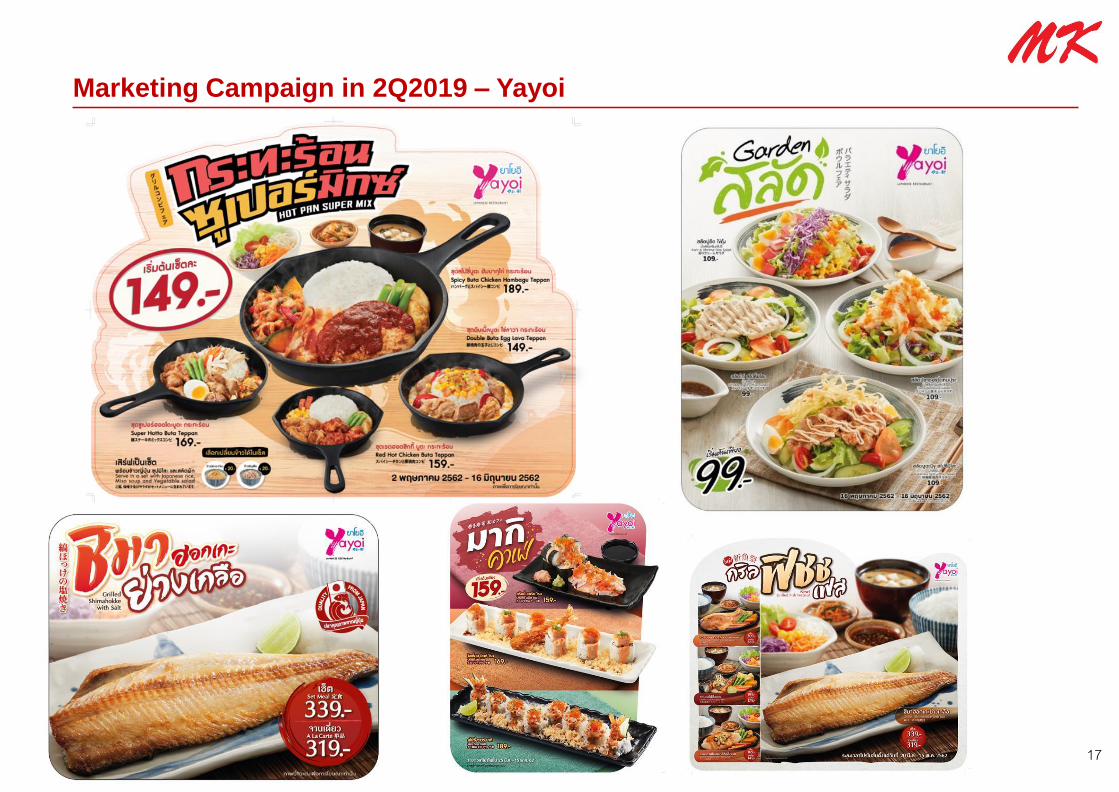
Marketing Campaign in 2Q2019 – Yayoi

18
Marketing Campaign in 2Q2019 – Yayoi

19