Mixing characteristics of draft tube airlift bioreactor ... · The influence of sparger...
147
Ryerson University Digital Commons @ Ryerson eses and dissertations 1-1-2010 Mixing characteristics of draſt tube airliſt bioreactor using the electrical resistance tomography Farouzatu Yakubu-Gumery Ryerson University Follow this and additional works at: hp://digitalcommons.ryerson.ca/dissertations Part of the Chemical Engineering Commons is esis is brought to you for free and open access by Digital Commons @ Ryerson. It has been accepted for inclusion in eses and dissertations by an authorized administrator of Digital Commons @ Ryerson. For more information, please contact [email protected]. Recommended Citation Yakubu-Gumery, Farouzatu, "Mixing characteristics of draſt tube airliſt bioreactor using the electrical resistance tomography" (2010). eses and dissertations. Paper 884.
Transcript of Mixing characteristics of draft tube airlift bioreactor ... · The influence of sparger...

Ryerson UniversityDigital Commons @ Ryerson
Theses and dissertations
1-1-2010
Mixing characteristics of draft tube airlift bioreactorusing the electrical resistance tomographyFarouzatu Yakubu-GumeryRyerson University
Follow this and additional works at: http://digitalcommons.ryerson.ca/dissertationsPart of the Chemical Engineering Commons
This Thesis is brought to you for free and open access by Digital Commons @ Ryerson. It has been accepted for inclusion in Theses and dissertations byan authorized administrator of Digital Commons @ Ryerson. For more information, please contact [email protected].
Recommended CitationYakubu-Gumery, Farouzatu, "Mixing characteristics of draft tube airlift bioreactor using the electrical resistance tomography" (2010).Theses and dissertations. Paper 884.
MIXING CHARACTERISTICS OF DRAFT TUBE AIRLIFT BIOREACTOR USING THE ELECTRICAL RESISTANCE
TOMOGRAPHY
by
FAROUZATU YAKUBU-GUMERY
B.Sc., Kwame Nkrumah University of Science and Technology, Kumasi, Ghana, 2005
A Thesis
Presented to Ryerson University
in Partial Fulfillment of the Requirements for the Degree of
Master of Applied Science
in the Program of Chemical Engineering
Toronto, Ontario, Canada, 2010
Copyright © 2010 by Farouzatu Yakubu-Gumery

ii
Author’s Declaration
I hereby declare that I am the sole author of this thesis. I authorize Ryerson University to lend
this thesis to other institutions or individuals for the purpose of scholarly research.
-------------------------
Farouzatu Yakubu-Gumery
I further authorize Ryerson University to reproduce this thesis by photocopying or by other
means, in total or in part, at the request of their institutions or individuals for the purpose of
scholarly research.
-------------------------
Farouzatu Yakubu-Gumery

iii
ABSTRACT
Farouzatu Yakubu-Gumery, Mixing characteristics of draft tube airlift bioreactor using the
electrical resistance tomography, MASc Chemical Engineering, Ryerson University Toronto,
2010.
In this work, mixing characteristics in terms of mixing time, hydrodynamics (liquid circulation
velocity and gas hold up) and shear rate were performed in the downcomer of a draft tube airlift
bioreactor with different geometries (i.e., Ad/Ar between 0.38 - 2.31 and bottom clearances
between 0.003-0.009 m). Newtonian (water and 34.5% coalescing sugar solution) and non
Newtonian (0.2% and 0.5% xanthan gum solutions) with different viscosities were used as the
liquid phase. Compressed air was used as the gas phase which was introduced through cross and
circular shaped sparger configurations at superficial velocities Ugr = 0.00165-0.00807 m/s. The
combined effects of geometric parameters (Ad/Ar, bottom clearances), sparger configuration, and
liquid viscosity on mixing characteristics have been presented.
Results showed that the increase in superficial gas velocity (Ugr) corresponds to an increase in
energy generated, and thus decreases in mixing time. However, the increase in Ugr corresponds
to the increase in liquid circulation velocity, gas holdup and shear rate values. Moreover, bottom
clearances and draft tube diameters show effects on flow resistance and frictional losses which
affect results of mixing parameters investigated. The influence of sparger configurations on
mixing time and liquid circulation velocity is significant due to their effect on gas distribution.
Mixing time decreased to about 40% in air-water media using the cross shaped sparger. Results
obtained with cross shaped sparger showed even and uniform distribution of gas, which provided
better mixing as compared to the circular shaped sparger configuration. However, the sparger

iv
configuration effect on shear rate is not as significant (about 20% reduction in shear rate values
using the cross shaped sparger). The effect of fluid viscosity had a significant influence on both
mixing times and circulation velocity, especially in the coalescing media of sugar and xanthan
gum solutions.
Results from this work will help to develop a clear pattern for operation and mixing that can help
improving several industrial processes, especially the ones related to emerging fields of
technology such as the biotechnology industry.

v
ACKNOWLEDGEMENTS
I would like to express my sincere gratitude to my supervisors, Dr. Yaser Dahman and Dr.
Farhad Ein-Mozaffari for their insightful supervision, comments, ideas and suggestions
throughout this research.
Again many thanks go to technologists; Ali Hemmati and Daniel Boothe and the faculty
members in Chemical Engineering Department of Ryerson University for the facilities and
assistance provided during my stay at the university.
Financial assistance from Agriculture and Agri-Food Canada and Natural Sciences and
Engineering Research Council of Canada (NSERC) is gratefully acknowledged.

vi
TABLE OF CONTENTS
Author’s Declaration .....................................................................................................................................ii
Abstract.........................................................................................................................................................iii
Acknowledgements........................................................................................................................................v
Table of Contents..........................................................................................................................................vi
List of Tables.................................................................................................................................................x
List of Figures...............................................................................................................................................xi
1. CHAPTER 1: Introduction………………………………………………………...…………1
2. CHAPTER 2: Literature Review…..………………………………………...........................3
2.1 Types of Bioreactors………………………………………………………………………..3
2.2 Airlift Bioreactors and Their Configuration………………………………………………..6
2.3 Hydrodynamic Characteristics of Airlift Bioreactors……………………………………..10
2.3.1 Gas Holdup………………………………………………………………………….11
2.3.1.1 Techniques to Evaluate Gas Holdup……………………………………………...13
2.3.1.2 Correlations and Effect of Geometry on Gas Holdup…………………………….14
2.3.1.3 Effect of Liquid Property………………………………………………………….19
2.3.1.4 Effect of Sparger and Bubble Distribution………………………………………..21
2.3.2 Liquid Circulation Velocity and Mixing Time………………………………………….22
2.3.2.1 Techniques for Measuring Liquid Circulation and Mixing Time………………….23
2.3.2.2 Correlations and Effect of Geometry on Liquid Circulation………………………25
2.4 Application of Airlift Bioreactors…………………………………………………………34

vii
2.5 Airlift Modifications………………………………………………………………………40
2.6 Research Objectives……………………………………………………………………….46
3. CHAPTER 3: Process Tomography …...……………………...............................................48
3.1 Electrical Resistance Tomography (ERT) Configuration………………………………....49
3.1.1 Electrode Sensors……………………………………………………………………51
3.1.2 Data Acquisition System (DAS)…………………………………………………….51
3.1.2.1 Data Collection Strategies……………………………………………………..53
3.1.3 Host Computer………………………………………………………………...........54
3.2 Applications of ERT……………………………………………………………………...55
4. CHAPTER 4: Experimental ……….......…………………………………….......................57
4.1 Experimental Setup………………………………………………………………………..57
4.1.1 Airlift Bioreactor……………………………………………………………………57
4.1.1.1 Sparger Design…………………………………………………………………....58
4.1.2 ERT System……………………………………………………………………………..59
4.1.2.1 Electrodes…………………………………………………………………............59
4.1.2.2 Data Acquisition System………………………………………………………….60
4.1.2.3 Host Computer…………………………………....................................................61
4.2 Material……………………………………………………………………………………61
4.3 Experimental Procedure……………………………….......………………………….......63
4.3.1 Mixing Time Measurements………………………………………….......................63
4.3.2 Gas Holdup Measurements………………………………………………………….65
4.4. Calculation of Liquid Circulation Velocity…………………………………………………68
4.5 Calculation of Shear Rate……………………………………………………………………69
4.6 Experimental Conditions………………………………………………………………….....70
5. CHAPTER 5: Results and Discussion ………………...............................................…........72

viii
5.1 Mixing Time……………………………………………………………………………....72
5.1.1 Effect of Gas Flow Rate and Bottom Clearance…………………………………….72
5.1.2 Effect of draft tube diameter………………………………………………………...74
5.1.3 Effect of Sparger…………………………………………………………………….75
5.1.4 Effect of Fluid Viscosity…………………………………………………………….77
5.2 Liquid Circulation Velocity……………………………………………………………….78
5.2.1 Effect of Gas Flow Rate and Bottom Clearance…………………………………….78
5.2.2 Effect of draft tube diameter………………………………………………………...80
5.2.3 Effect of Sparger…………………………………………………………………….81
5.2.4 Effect of Fluid Viscosity…………………………………………………………….82
5.3 Gas Holdup………………………………………………………………………………..84
5.3.1 Effect of Gas Flow Rate and Bottom Clearance…………………………………….84
5.3.2 Effect of draft tube diameter………………………………………………………...85
5.3.3 Effect of Sparger…………………………………………………………………….86
5.3.4 Effect of Fluid Viscosity…………………………………………………………….88
5.4 Shear Rate…………………………………………………………………………………89
5.4.1 Effect of Gas Flow Rate and Bottom Clearance…………………………………….90
5.4.2 Effect of draft tube diameter………………………………………………………...91
5.4.3 Effect of Sparger………………………………………………………………….....92
5.4.4 Effect of Fluid Viscosity………………………………………………………….....93
6. CHAPTER 6: Conclusion and Recommendation................................………………….....95
6.1 Conclusions………………………………………………………………………………..95
6.2 Recommendations………………………………………………………………………....97
Nomenclature…………………………………………………………………………...............98
References………………………………………………………………………………...........103

ix
APPENDICES............................................................................................................................124
Appendix A: ERT Data for Mixing Time……….…………...................................................124
Appendix B: ERT Data for Circulation Time.......……..........................................................129

x
List of Tables
Table 2.1 Bioreactors used for mixing……………………………………………………………………4
Table 2.2 Operating parameters investigated in an airlift bioreactor…………..………………….12
Table 2.3 Models for gas holdup in airlift bioreactors……………………………………………….15
Table 2.4 Mathematical models for liquid circulation velocity in airlift bioreactors……………28
Table 3.1 Electrical tomography techniques………………………………………………………….50
Table 4.1 Rheological properties of xanthan solution……………………………………………….62
Table 4.2 Experimental conditions……………………………………………………………………..71

xi
List of Figures
Fig.2.1 Types of bioreactors for mixing…………………………………………………………………..5
Fig.2.2 Types of airlift bioreactors…………………………………………………………………….....7
Fig.2.3 Individual sections of a draft tube airlift bioreactor…………………………………………..8
Fig.2.4 Circulation regime in an internal loop airlift bioreactor……………………………………..9
Fig.2.5Types of sparger configuration………………………………………………………………….22
Fig.2.6 Modifications of airlift bioreactors…………………………………………………………….41
Fig.2.7 The EIFBAB; external loop inverse fluidized bed airlift bioreactor……………………….43
Fig.2.8 Other modifications of airlift bioreactors……………………………………………………..45
Fig.3.1 Structure of a typical electrical resistance tomography system…………………………....49
Fig.3.2 Components of a typical data acquisition system ……………………………………………52
Fig.3.3 Data collection strategies ………………………................................................................54
Fig.4.1 Bioreactor setup…………………………………………………………………………………..58
Fig.4.2 ERT setup for experimental work………………………………………………………………60
Fig.4.3 Shear stress versus shear rate for xanthan solutions used in this study...........................63
Fig.4.4 Plot of conductivity vs. time for mixing time at Ugr 0.00807m/s in draft tube diameter
0.29 m, BC= 0.009 m (air-water system)………………………………………………………65
Fig.4.5 Bioreactor setup for gas holdup measurements……………………………………………...69

xii
Fig.4.6 Plot of circulation time at Ugr 0.00165m/s in draft tube diameter 0.29m on plane1 of
ERT, BC= 0.009m (air-water system) using cross shaped sparger……………………........68
Fig.5.1.1 Effect of BC on mixing time for all 3 BC for draft tube diameter 0.22 m (air-water
system) using cross shaped sparger………………………………………………………........74
Fig.5.1.2 Effect of draft tube diameter on mixing time at BC=0.009 m (air-water system) using
cross shaped sparger………………………………………………………………………........75
Fig.5.1.3 Effect of sparger configuration on mixing time at, BC=0.009m for draft tube diameter
0.29 m (air-water system) using cross shaped sparger…………………………….……..76
Fig.5.1.4 Effect of fluid viscosity on mixing time, BC=0.009 m for draft tube diameter 0.29m
(air-water system) using cross shaped sparger…………………………………………....78
Fig.5.2.1 Effect of BC on liquid velocity for all 3 BC in draft tube diameter 0.22m (air-water
system) using cross shaped sparger……………………………………………………………79
Fig.5.2.2 Effect of draft tube diameter on liquid velocity at BC=0.009 m (air-water system) using
cross shaped sparger…………………………………………………………………............80
Fig.5.2.3 Effect of sparger configuration on liquid velocity at, BC=0.009 m in a draft tube
diameter of 0.29 m(air-water system) cross shaped sparger……………………….…..82
Fig.5.2.4 Effect of fluid viscosity on liquid velcoity at, BC=0.009 m in draft tube diameter 0.29m

xiii
(air- water system) using cross shaped sparger…………………………………………….83
Fig.5.3.1 Effect of BC on gas holdup for 3 BC in draft tube diameter 0.22 m (air-water system)
using cross shaped sparger……………………………………………………….…………....85
Fig.5.3.2 Effect of draft tube diameter on gas holdup at BC=0.009 m (air-water system) using
cross shaped sparger…………………………………………………………………...........86
Fig.5.3.3 Effect of sparger configuration on gas holdup at, BC=0.009m in draft tube diameter
0.29m (air-water system) using cross shaped sparger……………………….…………...87
Fig.5.3.4 Effect of fluid viscosity on gas holdup BC=0.009 m in draft tube diameter 0.29m (air-
water system) using cross shaped sparger……………………………………………….…88
Fig.5.4.1 Effect of BC on shear rate for all 3 BC in draft tube diameter 0.22 m (air-water system)
using cross shaped sparger…………………………………………………………..............90
Fig.5.4.2 Effect of draft tube diameter on shear rate at BC=0.009 m (air-water system) using
cross shaped sparger…………………………………………………………………….........92
Fig.5.4.3 Effect of sparger configuration on shear rate BC=0.009m, draft tube diameter 0.29 m
(air-water system) using cross shaped sparger…………………………………………...93
Fig.5.4.4 Effect of fluid viscosity on shear rate BC=0.009 m for draft tube diameter 0.29 m (air-
water system) using cross shaped sparger…………………………………………..…94

CHAPTER 1
INTRODUCTION
Mixing is an important unit operation in biotechnology, petroleum refinery, wastewater
purification, readymade food production and other allied chemical industries. With requirements
that vary from fluidization, stripping of gas to leaching, mixing enhances homogeneity in order
to achieve a desired product quality. This process can be accomplished in stirred tanks, bubble
columns or airlift bioreactors for multiphase mixing in industry. Mixing begins from complex
interactions between molecules and thus affects chemistry of products formed. It is therefore,
necessary to understand the mixing parameters such as the hydrodynamics (gas holdup and
liquid circulation velocity), transport properties (heat and mass transfer coefficients) and mixing
time for a successful design and scale-up. In scaling-up the mixing process to industrial level,
one should be able to predict the performance comparable to that of laboratory scale. When
scale-up fails, it implies inefficient mixing, which compromises product quality. The cost of
correcting this anomaly is high as it was estimated that the US chemical industry alone spent
upto $10 billion extra due to poor mixing (Smith, 1990). Based on this figure, the economic
potential for efficient mixing is highly marked in addition to improvement in product.
We are in the biotechnology era, with mixing in bioreactors being the core of any bioprocess.
The commercial manufacture of pharmaceutical (penicillin), chemicals (citric acid), foods
(cheese, beer, vinegar) are largely dependent on biotransformation of organisms in a bioreactor
(Chisiti, 1989). Mixing of fermentation broth in most bioreactors is very important because it
affects productivity (Guillard and Tragardh, 1999). Considerable studies to evaluate the mixing
performance of a bioreactor have been documented and summarized in review papers by Chisti
1

and Moo-Young (1988), Chisti (1998), and Petersen and Margaritis (2001). Conventional
measuring techniques to assess mixing include the magnetic flow follower (Merchuk and Stein,
1981; Weiland and Onken, 1981), the use of conductivity probes (Weiland and Onken, 1981) and
hot film anemometer (Young et al., 1991). These techniques are intrusive therefore disrupting
the process flow and are not suitable for opaque reactors largely in use for industrial work.
With the development of imaging techniques for diagnostics purposes in the medical field using
the computerized axial tomography (CAT), scientists and engineers have adapted and improved
the tomography system to visualize the internals of process vessels. For industrial purposes, the
tomography measurements are based on electromagnetic (X-ray, γ-ray etc.), electrical (ERT,
ECT, and EIT) and acoustic (ultrasonic) with most popular one being the ERT (Williams and
Beck, 1995). Quite recently, the ERT system has been used for evaluating the performance of
different types of vessels (Fransolet et al., 2001, Haibo et al., 2006, Razzak et al., 2007, Pakzad
et al., 2008). The ERT technique is cheaper as compared to the ones used for medical
diagnostics. It is also non intrusive to process flow and also very suitable for opaque reactors.
The objectives of this research therefore would be to exploit the use of ERT to evaluate the
mixing performance in a draft tube airlift bioreactor.
2

CHAPTER 2
LITERATURE REVIEW
2.1 Types of Bioreactors
Bioreactors used for mixing are stirred tanks, bubble columns, airlift and fluidized beds (Table
2.1, Fig.2.1). Agitation in a stirrer tank reactor is accomplished by mechanical stirring (using
impellers). They provide excellent mixing and good values of mass and heat transfer
coefficients. Drawbacks of the stirred vessels are mechanical issues related to the moving parts
(e.g. shafts and impeller) which can introduce some level of contamination while operating cost
is also higher due to high energy consumption and cost of maintenance (Joshi et al., 1990).
The airlift reactor was first patented for use as a bioreactor by Lefrancois in 1955 (Gavrilescu
and Roman, 2004). Due to the fluid dynamic characteristics, it continues to gain popularity for its
success in the production of microorganisms (Siegel et al., 1988; Kim et al., 1997). Airlift
reactors are also used in petroleum (Mehrnia et al., 2004; Shariati et al., 2007), and wastewater
treatments (Jin et al., 2002), where satisfaction of high oxygen levels for higher mass transfer
rates is necessary for gas-liquid contact.
The bubble column and airlift bioreactors are pneumatically agitated and often employed in
bioprocesses where gas-liquid contact is important. The role of the gas is to provide contact with
the liquid for mass transfer processes such as absorption or desorption and to provide energy
through gas expansion or bubble buoyancy for liquid mixing. In these two pneumatically agitated
reactors, gas is sparged usually through the bottom and the buoyancy of the ascending gas
bubbles causes mixing. The main difference between these two pneumatically agitated reactors is
3

in their fluid flow characteristics. The flow in the airlift bioreactor is ordered and in a cyclic
pattern like in a loop beginning from top through to bottom.
The airlift bioreactor differs from the bubble column by the introduction of inner draft tubes
which improves circulation, whereas the bubble column is a simple tower. In the airlift, liquid
recirculation occurs due to the four distinct sections: the riser, downcomer, gas separator and
bottom or base. The bubble column is a simple vessel without any sectioning making the flow
rather a complex one.
Table 2.1 Bioreactors used for mixing.
Types of Bioreactors Advantages Disadvantages
Airlift Reactors
• Similar to bubble column. • Draft tube to improve liquid
circulation. • Better mixing with high mass transfer
properties. • Provides low shearing due to the
absence of mechanical mixers. • Low cost due to simple construction of
vessel with lower power requirement.
• Bubble coalescence can sometimes reduce mass transfer properties.
• Not suitable for very viscous solutions.
Bubble Column Reactors
• Very simple. • Uses sparged air for mixing (minimal
energy consumption). • The absence of moving parts avoids
mechanical breakages and contamination.
• Inhomogeneous shear might be due to that air is sparged at a focal point.
Fluidized Bed Reactors
• Fluid is used to fluidize catalysts. • Enhanced heat and mass transfer
properties • Insoluble and high viscosity solutions
can be used.
• High energy input is required to fluidize the solid particles.
Stirred Tank Bioreactor
• Uses mechanical agitation (impellers) for efficient distribution of heat and mass transfer properties.
• Possibility of contamination and high shear environment.
• High energy input is needed to power the impellers.
4

Fig.2.1. Types of Bioreactors for Mixing
Some attractive features of the airlift bioreactor are the low power consumption, simplicity in
construction with no moving parts, high mass and heat transfer rates and uniform distribution of
shear (Chisti and Moo Young, 1994; Merchuk, 1990). The advantage of its low power
consumption is of particular importance in effluent (e.g. wastewater) treatment where the product
value is comparatively low. Therefore, operational cost (efficient use of energy) is greatly
considered since this work is usually on a large scale. Homogenous shear is particularly
important for biological processes that are shear sensitive. In the conventional stirred tank, shear
is greatest at the stirrer and decreases away from it to the walls of the vessel. This creates a
gradient of shearing which can have adverse effect on the morphology or sometimes can damage
cells (e.g. animal and plant cells). The simple construction of the airlift without shafts makes it
not only aesthetically pleasing to look at but also eliminates contamination associated with the
conventional stirred tank which is a major drawback in the production of microorganism. A
(a) Stirred Tank
Sparger
SolidsStirrer
Solids
Sparger Sparger
(b) Bubble Column (c) Airlift Bioreactor (d) Fluidized Bed
5

sterile environment is crucial for growing organisms especially in the bioprocesses since
contamination reduces product quality, generates wastes, also more time and money are spent to
restore the whole process.
2.2 Airlift Bioreactors and Their Configurations
There are two main types of airlift bioreactors; (1) the external loop vessel where the liquid
circulation in the riser and downcomer takes place in two separate compartments. The external
loop usually reaches nearly total gas disengagement at the top section giving rise to a higher
difference in density or hydrostatic pressure. This results in lower gas recirculation (thus lower
mass transfer) with higher liquid circulation velocity to enhance fluid mixing; (2) the structure of
the internal loop vessel has various modifications with regards to the placement of the draft
tubes (Fig.2.2), examples of which are the split-cylinder, draft-tube, concentric tube etc. It is the
difference in configuration that allows variation of operation of the reactors in terms of liquid
circulation and gas disengagement.
Irrespective of the configurations of the airlift reactors, it has four distinct zones or sections with
variable local hydrodynamics (gas holdup, liquid velocity and mass transfer rates) thus, accurate
description and prediction of its performance are challenging. Fig.2.3 illustrates the various
sections in an airlift bioreactor using the internal loop as an example.
6

Internal‐Loop Concentric Tube
Reactor
Internal‐Loop Split
Fig.2.2. Types of airlift bioreactors: (a) split-cylinder-internal loop; (b) draft- tube internal loop
and (c) external loop.
The four sections are; (a) the riser, this is the section where gas is normally sparged and the flow
is upwards. This section usually has a higher gas holdup and it is here that most of the gas-liquid
mass transfer takes place; (b) the downcomer is parallel to the riser and combines the top and
bottom parts. The flow in here is downwards and the liquid recirculates as a result of pressure or
density difference due to partial or total disengagement of gas at the top of the draft tube; (c) gas
separator, which is at the top, connecting the riser and downcomer and allows gas disengagement
and liquid recirculation. This section affect gas holdup and liquid velocity depending on its
geometry and (d) bottom section connects the riser and downcomer and the geometry of this
section has an impact on gas holdup, liquid velocity and solid flow (for three phase flow).
Gas
Gas OutGas Out
Gas In Gas InGas In
Gas Out
External Loop
Gas
7

Fig.2.3. Individual sections of a draft tube airlift (internal loop vessel).
Although various flow regimes in gas-liquid flow have been reported and studied (Heijnen et al.,
1997; Vial et al., 2001; Gavrilescu and Tudose, 1998), the homogenous bubble and
heterogeneous turbulent regimes are of great interest. The homogenous regime occurs at low gas
velocities where the flow is characterized by a uniform distribution of relatively small bubbles.
This offers a larger surface area for mass transfer. In this case, the velocity of the gas phase is
equal to that of liquid phase, resulting in less or no turbulence. The heterogeneous turbulent
regime consisting bubbles of varying sizes can be observed with an increase in the gas flow rate
or when the diameter of the reactor increases (Merchuk, 1990). In this case, the gas holdup is
low, since, too many large bubbles tend to occupy the entire volume of the reactor and would
encourage bubble coalescence subsequently limiting mass transfer rates. Within these two flow
regimes, three circulation pattern regimes also exist (Fig.2.4).
8

Fig.2.4. Circulation regime in an internal loop airlift bioreactor.
In the first regime, the gas input is the lowest. Therefore the liquid velocity is insufficient to
entrain gases into the downcomer. In the second regime (normally the transition regime) there is
stratification of bubbles. As gas flow rate increases, induced liquid circulation velocity is
adequate to entrain bubbles to the downcomer. The entrainment of bubbles into the upper part of
the downcomer is visible. There is complete gas (bubble) recirculation in the third regime due to
sufficient energy from liquid velocity in the downcomer. This is attributed to an increase in gas
flow which promote the gradual descent and eventually the gas recirculation in the whole vessel.
9
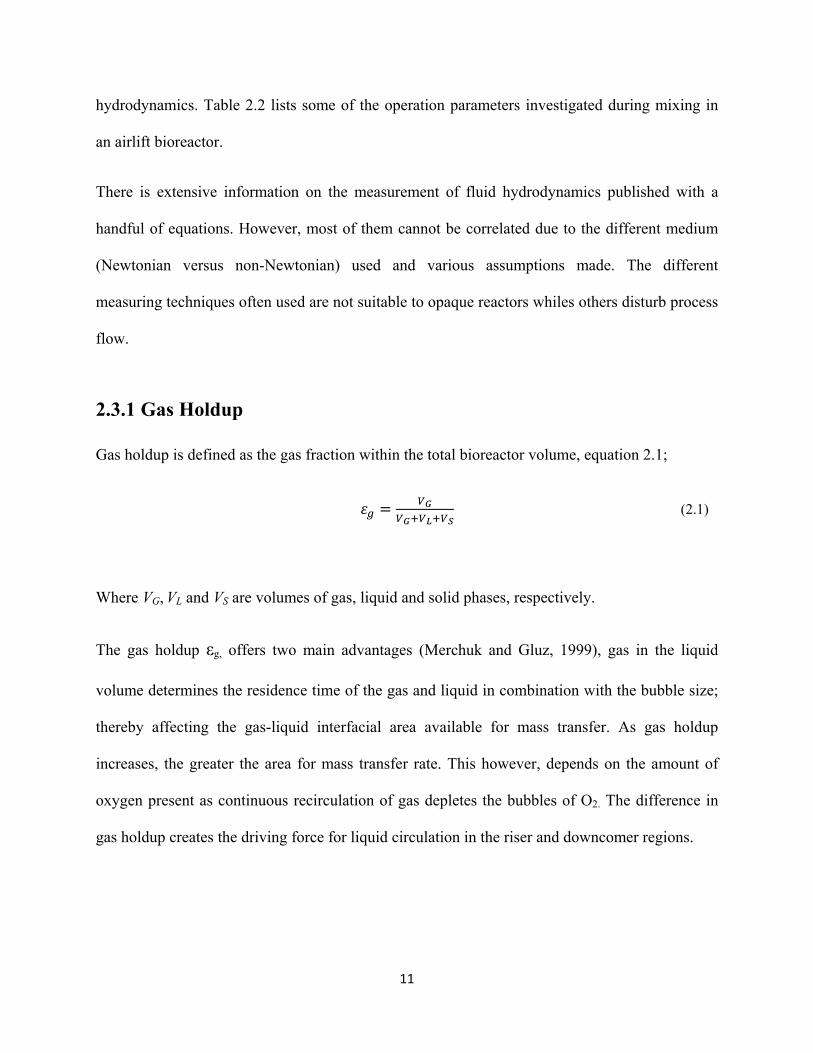
2.3 Hydrodynamic Characteristic of Airlift Bioreactors
The fluid hydrodynamics is simply its characteristics when in motion. Fluid mixing is influenced
by the mixing time and gas holdup which defines the fluid circulation and mass transfer
properties. The fluid recirculation causes the difference in hydrostatic pressure and density due to
partial or total gas disengagement at the top clearance (TC). Studies have been documented
during the last two decades with various correlations applicable for hydrodynamic parameters
(Chisti, 1998; Joshi et al., 1990; Petersen and Margaritis, 2001). This implies that for a
successful design, fundamental understanding of mixing parameters is important for industrial
scale-up.
It is difficult to generalize the performance of the bioreactor according to the process for which
the airlift will be employed. For example, in aerobic fermentation, oxygen is important for mass
transfer and therefore, it is imperative to consider a design where there will be less
disengagement of gas resulting in higher gas holdup for a higher mass transfer rate. In this case,
the liquid circulation velocity is low because less gas is disengaged at the top resulting in a lower
differential pressure and density. Furthermore, other processes require good mixing other than a
high mass transfer rate. However, provision can be made by increasing the gas disengagement at
the top to improve the liquid recirculation as in the case for anaerobic fermentation. Therefore, it
is safe to conclude as have been confirmed (Merchuk et al., 1994; Gavirilescu and Tudose, 1998;
Chisti, 1998) that, the geometry parameters such as the top clearance (TC), ratio of cross
sectional area of the downcomer to the riser (Ad/Ar), bottom clearance (BC), the cross sectional
areas of riser (Ar) and that of the downcomer (Ad), draft tube internal diameter (Dd), and height of
the column (H) and superficial gas velocity in the riser (Ugr) have an influence on fluid
10
11
hydrodynamics. Table 2.2 lists some of the operation parameters investigated during mixing in
an airlift bioreactor.
There is extensive information on the measurement of fluid hydrodynamics published with a
handful of equations. However, most of them cannot be correlated due to the different medium
(Newtonian versus non-Newtonian) used and various assumptions made. The different
measuring techniques often used are not suitable to opaque reactors whiles others disturb process
flow.
2.3.1 Gas Holdup
Gas holdup is defined as the gas fraction within the total bioreactor volume, equation 2.1;
(2.1)
Where VG, VL and VS are volumes of gas, liquid and solid phases, respectively.
The gas holdup εg, offers two main advantages (Merchuk and Gluz, 1999), gas in the liquid
volume determines the residence time of the gas and liquid in combination with the bubble size;
thereby affecting the gas-liquid interfacial area available for mass transfer. As gas holdup
increases, the greater the area for mass transfer rate. This however, depends on the amount of
oxygen present as continuous recirculation of gas depletes the bubbles of O2. The difference in
gas holdup creates the driving force for liquid circulation in the riser and downcomer regions.

Table2.2 Operating parameters investigated in an airlift bioreactor.
Reference Dc (m) Dd (m) Ad/Ar Gas sparger Ugr (m/s)
Bendjaballah et al.,
1999
0.10 0.057 0.33 62 holes, do=1mm 0.01-0.17
Blazej et al., 2004 0.108-
0.294
0.070- 0.200 1.23- 1.01 Multiple orifice sparger, 25-90 holes,
do= 0.5-1mm
0.01-0.03
Mehrina et al.,
2004
0.14 0.11-0.09 0.707-1.306 Perforated ladder, 30 holes, do=1mm 0.01-0.08
Miron et al., 2004 0.193 0.144 0.8 Perforated pipe sparger, 13-17 holes,
do=1 mm
0.001-0.05
Vial et al., 2002 0.06 0.1 0.36 Multiple orifice 62 orifices do=1 mm 0.01-0.24
12

2.3.1.1 Techniques to Evaluate Gas Holdup
Gas holdup is usually measured with the aid of manometers in different parts of the bioreactor
“locally” or as an “overall” in which εg is calculated from the difference between volumes of
aerated and unaerated liquid phase as in equation 2.2 (Merchuk et al., 1994);
(2.2)
where hL is gas free liquid height and hD is dispersion height after the introduction of air. The
use of manometers to measure the pressure difference (Merchuk and Stein, 1981; Al Marsy,
2001) may cause contaminations. Under sterile fermentation conditions special sensors such as
pressure transducers (Luo et al., 1997) may be used. Their mode of operation is such that there is
minimal interaction with the slurry under observation.
Hot film anemometer probe (Karamanev et al., 1996) was also used to measure the difference of
heat conductivity between liquid and gas phase. A downside is that this technique cannot be used
in fermentation media because it is an invasive technique and does interfere with process flow.
In non-invasive ultrasonic technique (with introduction of acoustic wave), liquids have a better
absorption than in gases. This technique uses the variation in acoustic velocity of sound wave
travelling through a medium. It is therefore, suitable for opaque systems and has a faster
response (Chang et al., 1984; Stolojanu and Prakash, 1997). Although this technique can be used
in fermentation media, Soong et al. (1995) described the weakness of this technique due to low
variation of ultrasonic velocity in fermentation media.
13
14
In the recent past, the electrical resistance tomography (ERT) has been employed for gas holdup
measurement in bubble column (Haibo et al., 2006). This technique measures the conductivity of
the media and the gas holdup is calculated by applying the Maxwell equation. Gas holdup
measurement with the ERT was in agreement with measurement taken with the pressure
transmitter. The most important feature of this technique is that it is non invasive and non
intrusive to process flow and can be used for opaque medium as well.
2.3.1.2 Correlations and Effect of Geometry on Gas Holdup
Generally, gas holdup behavior shows a dependence on gas flow rate, geometric parameter of the
vessel (i.e., Ad/Ar BC and TC; see Table 2.3), type of sparger and the physical properties of slurry
(with the introduction of solids). As gas flow rate increases, εg will also increase. Research
(Gavrilescu and Tudose, 1996 and Bello et al., 1989) have also shown that generally a decrease
in the ratio of Ad/Ar increases εg as this dictates the liquid and gas residence time in the vessel.
Models presented in Table 2.3, employed the pressure measuring technique using manometers or
piezometers. The model proposed by Hwang and Cheng (1997), overestimates the gas holdup
values and this they attributed to bubble coalescence due to high viscosity and gas flow rate.
However, correlations of Kemblowski et al. (1993) does provide better insight into the
hydrodynamics process taking place in the reactor as it takes into account, the friction and
pressure losses, and density of the liquid including the geometric parameter of the reactor for all
the other models (Kemblowski et al., 1993).

Table2.3. Models for gas holdup in airlift bioreactors
Reference Media Conditions Design Equation
Hwang and Cheng, 1997
Air Water CMC
Ar/Ad= 0.69-3.22 H =2.5m Dd = 0.9- 0.14m
Internal Loop 0.001 .
.. 1 .
Kemblowski et al., 1993
Air Water Glycol Syrup CMC
Ad/Ar = 1-1.33 Ugr = 0.001-0.15m/s.
External Loop 0.203
.
.
.
Popovic et al., 2004
Air CMC
Ad/Ar= 0.11-0.44 H =1.88m Dd = 0.15m
Internal Loop 0.93 . 1 . 1
.
Renzo, 2005 Air Water
N/A External Loop
⁄0.25 1.1 ⁄ ⁄
15

Gavrilescu and Tudose (1996) evaluated the gas holdup and liquid circulation velocity using
alcohol, NaCl and glucose in two external–loop airlift reactors (ELAR). On the laboratory scale,
they varied Ad/Ar (0.111-1.0) and superficial gas velocity (0.016-0.178 m/s), while for the pilot
scale, they varied the same as 0.040-0.1225 and 0.010- 0.120 m/s respectively. Later, they
reported that generally, the value of εg in both reactors increased with increasing Ugr, however,
greatest in reactor with the lowest Ad/Ar ratio, with the laboratory ELAR recording the highest εg.
This finding was in agreement with Bello et al. (1985). The pilot ELAR recorded lower εg
because it had a higher Ad/Ar which influenced liquid velocity as the Ug increased, thereby
reducing the residence time of the gas holdup in the riser. The liquid properties (surface tension
and viscosity) had little influence on εg although water had higher gas holdup rates as compared
to the other solutions since, water is a non coalescing fluid and the gas holdup effect in the
laboratory ELAR was more pronounced.
The importance of geometry on hydrodynamics cannot be over emphasized. Gavrilescu and
Tudose (1998) reported the effect of geometry in three concentric tube airlift (0.07, 2.5 and 5.2
m3), using air-water medium with Ad/Ar between 0.1-0.9 and Ugr of 0.005-0.1 m/s. Their
extensive study explained how these clearances affect the gas holdup, liquid circulation velocity
and thus the pressure drop. In general, εgr and εgd decreased when TC increased, resulting in an
increase in the driving force and hence increase in liquid velocity. The total gas holdup becomes
smaller, for an increasing ratio of Ad/Ar, the flow resistance at downcomer entrance is reduced.
For an equal TC and BC of 0.07m, εgr at a given Ugr of 0.07 m/s was found to be 65% higher as
compared to bottom clearance BC of 0.25 m. The effect of BC was more pronounced as
compared to the TC because of the resistance to flow in the downcomer. When the total gas
16

holdup diminishes as the Ad/Ar increases, the flow resistance at downcomer entrance is also
reduced. They proposed correlations for gas holdup in the riser εgr (equation 2.3) and gas holdup
in downcomer εgd which were validated with previous data (Merchuk et al., 1994). In the
correlations, bottom clearance (BC) was found to have an effect on gas holdup in all regions
whereas, the Ugr effect was more pronounced for εgr and at the separator:
0.0008 . . . . . . (2.3)
where, is the bottom spatial ratio, is the Froude number, is galilei
number, T is top spatial ratio, is the gas separator ratio and R is the ratio of cross
sectional area of downcomer to riser.
Performance of rectangular airlift bioreactor measuring the effect of geometry with gas sparged
in the annulus was studied (Klinozo et al., 2007). Experiments were performed in air-water,
NaCl and Carboxyl Methyl Cellulose (CMC) with viscosity of 0.02-0.5 Pa.s and surface tension
of 0.065-0.085 N/m. It was shown that the bottom clearance (BC) had an effect even in the
viscous media. In both systems a decrease in BC resulted in an increase in εgr. That is, as BC is
decreased, velocity of the liquid phase was affected by pressure drop resulting in lower velocity
of both bubbles and liquid. A large amount of bubbles were entrained with a large residence
time. A lower top clearance (TC) resulted in shorter residence time in the gas-liquid separator.
In three phase systems using calcium alginate as the solids in water, aqueous salt and glycerol
solutions in an internal loop bioreactor, the gas holdup decreased with increasing solid
concentration (Koide et al., 1992). As the solid loadings increased, viscosity of the system
17

increased with a decrease in liquid velocity. Furthermore, bubbles coalesced and reduced the gas
holdup, although gas holdup values were similar for water and salt solutions. In a similar three
phase system using CMC, Wen et al. (2005) confirmed that when Ug increased, εg in both
regions also increased as suggested previously (Hwang et al., 1997). They further analyzed the
effect of solid loadings on the hydrodynamics of a three phase system and found that generally,
the liquid velocities in the riser and downcomer decreased with an increase in the solid loadings.
This could be a result of frequent bubble coalescence which concurs with the idea of Wei et al.
(2000). Also, the εg declined with an increase in solid loadings attributing to a decrease in the
flow area. This phenomenon further decreased the mass transfer rate (KLa) since the bubbles
coalescence provides less room for interfacial flow area (Wen et al., 2005).
In an air-water-silica sands system using annulus airlift bioreactor, a model was developed to
predict liquid recirculation and gas holdup (Sun et al., 2005). They showed that liquid velocity
and gas holdup in the riser increased with increasing superficial gas velocity with a lower solid
concentration. This observation was similar to that of internal loop reactors (Lu et al., 1994). At
a higher concentration of solids, viscosity of the medium increased, while decreasing the gas
holdup. Their data on the liquid recirculation velocity and the average gas holdup in the riser
varied within 10% and 20% respectively. According to experimental data from water-in-
kerosene microemulsion medium using draft tube airlift bioreactor with a diameter of 0.14 m and
draft tube heights of 1.1, 1.48 and 1.897 m (Mehrnia et al., 2004) the TC, had very little effect on
overall εg and KLa which was closely agreed with Koide et al. (1985). However these results
were not in agreement with Merchuk et al. (1994) who reported otherwise which could be
18

attributed to the medium they used. They observed an increase in εg and KLa with increasing H/D
with an increase in liquid velocity.
2.3.1.3 Effect of Liquid Property
Properties of liquids such as the viscosity, surface tension and density also play a crucial role in
the hydrodynamic parameters of an airlift reactor. Viscosity, causing resistance to flow can
greatly affect the gas holdup hence can also affect the KLa. As viscosity increases, the resistance
to flow increases and coalesce more bubbles. As the bubbles coalesce it lowers the interfacial
surface area resulting in a decrease in KLa. Erikson and Deshpande (1981) evaluated the effect of
viscosity on gas holdup in a split cylinder airlift reactor using CMC. They also reported that the
gas holdup gradually decreased with increasing viscosity, since an increase in viscosity
shortened the residence time of gas bubbles. This observation concurs with results obtained using
CMC for 3 phase flow in an internal loop with draft tube (Wen et al., 2005).
Surfactants are substances that form a monolayer at interfaces and have the ability to inhibit
coalescence. They reduce the liquid surface tension hindering bubble coalescence with increases
in interfacial area and mass transfer rate. This seemed to have been in the case of Erikson and
Despande (1981) when they used sodium lauryl sulphate as a surfactant. By investigating mixing
using Kenon 10 and Kenon 4 as surfactants in a draft tube internal loop employing water in
diesel microemulsion, it was found that an increase in the surfactant resulted in a decline in the
values of εg and KLa, which was attributed to the increase in the viscosity of the microemulsions
(Shariati et al., 2007). In this case, the viscosity of the fluid clearly dominated the influence of
surface tension. The observed trend was clearly in disagreement with Koide et al. (1984b) and
19

Koide (1985) who reported otherwise, as the addition of surfactant increased εg and KLa, which
also contributed to a reduction of surface tension of the slurry.
Snape et al. (1992) compared the gas holdup in NaCl, KCl, Na2SO4 and CaCl2 solutions with
0.5-8% (w/v) sucrose and water and found that, salts (electrolytes) increased the gas holdup.
That was due to reduction in surface tension allowing smaller bubbles to form and preventing
coalescence. However, in the sugar solution the gas holdup was lowest at a higher sugar
concentration. This effect could be explained by the opposing effects of viscosity, density and
surface tension. With an increase in sucrose, the density and viscosity have increased while
surface tension decreased. The gas holdup was expected would be higher and this showed that
the effect of surface tension alone is not sufficient to characterize the liquid property.
The effect of methanol, propanol and butanol at 0.01-0.1% (v/v) on the gas holdup, liquid
velocity and mass transfer co-efficient in a split rectangular airlift bioreactor had been
investigated (El Azhera et al., 2005). The gas holdup increased with the increasing alcohol level
due to the inhibition of bubble coalescence. They also reported a decrease in KLa which
contradicted the theory as it was assumed that the larger the interfacial area the larger the transfer
rates. They further explained that this effect could have been due to the extended carbon chain,
thus the reduction of surface tension was probably minimal as a result of oxygen depletion (as
the bubbles recirculated over and over in the bioreactor).
20

2.3.1.4 Effect of Sparger and Bubble Distribution
Several gas distributors are used for flow distribution in an airlift reactor. Basic designs are either
tube-like or circular with several orifices (holes) of different diameters; annulus sparger, draft
tube sparger, multiple and single orifice (Fig.2.5). Contreras et al. (1999) found that in a bubbly
flow regime, smaller bubbles produced higher interfacial area and hence, εg and KLa were
increased. However, in the transition and heterogeneous regimes, the pore size had little effect.
During the transition to turbulent churn flow, various factors affected the size of the bubbles by
changing the degree of coalescence (Maruyama et al., 1981; Lockett et al., 1975). Furthermore,
they reported that the heterogeneous regime had a greater influence on hydrodynamics.
Although, the bubble size will be determined by the porosity of the sparger, the effect of the
sparger pores on the degree of coalesces cannot be completely ruled out as previously reported
(Snape et al., 1992). A higher εg and KLa were observed with increasing number (but smaller
diameter) of holes, although at a higher liquid height and in the heterogonous flow, the bubble
size effect was determined by coalescing effect (Zhao et al., 1994). The position of the sparger is
also important in gas distribution and bubble coalescence. Gas spargers or distributors placed just
inside the riser, enhanced gas distribution since the downcomer flow joins riser under the sparger
as opposed to spargers placed at the entrance of the riser. In this scenario, the downcomer stream
maldistributes the gas bubbles to the walls of the vessel encouraging coalescence (Chisti, 1989).
A second sparger (at the top of the downcomer) has been proposed in aerobic fermentation to
replenish oxygen (Siegel et al., 1986.)
21

Air
(a) (b) (c) (d)
Fig.2.5. Sparger Configuration; (a) Perforated pipe ladder type gas sparger, (b) multiple
orifice sparger, (c) single orifice, (d) annulus ring sparger.
2.3.2 Liquid Circulation and Mixing Time
Liquid circulation velocity Ul, is an important parameter in airlift bioreactors which affects the
residence time of gas, mass transfer KLa and mixing time tm. Studies showed that liquid
circulation velocity was affected by the gas flow rate and geometric parameters of the vessel
(Gouveia et al., 2003; Luo 2008; Mehrnia et. al., 2004). Liquid circulation occurs due to the
difference in hydrostatic pressure or density between the riser and downcomer. When gas flow
rate increases, the liquid velocity also increases, thereby entraining most of the bubbles from the
riser in to the downcomer. This will reduce the difference in hydrostatic pressure (compromising
the liquid velocity). In general, a higher liquid velocity reduces the residence time of the bubbles
in the riser and downcomer, as it encourages the recirculation of gas through the downcomer and
back to the riser.
22

2.3.2.1 Techniques for Measuring Liquid Circulation and Mixing Time
Liquid velocity has been measured using the tracer response techniques which measure the
conductivity and pH over time. In these methods, the probes that are connected to sensors and
microprocessor are inserted into the riser and downcomer of the bioreactor to measure the
conductivity or pH upon addition of a tracer. To calculate the velocity, the time taken for the
tracer to travel from one probe to the other is measured from recorded peaks or the time taken to
record consecutive peaks (Onken and Weiland, 1980). In measuring the conductivity, a
conductivity probe is inserted in the bioreactor which measures the response of an electrolyte
trace, whereas in measuring the pH an acid or base (eg. NaOH) acts as the tracer. This is a very
popular technique due to its relative simplicity. They however disrupt process flow since they
come into contact with the slurry under investigation.
The flow follower is another technique which employs a neutrally buoyant solid particle (flow
follower) to measure liquid circulation and mixing time. The importance of this technique is that
the choices of material selected for the follower must be detected inside a bioreactor and possess
fluid like properties of the medium under investigation. Bryant (1976) housed a radio transmitter
(radio pill) in a solid particle and thereafter, Bonakdarpour et al. (1994) developed a flow
follower using polystyrene beads covered with aluminum foil coated with silicone rubber to
prevent the absorption of water. Results of this follower were compared with that of the chemical
reaction method Bonakdarpour et al. (1994) in which iodine-sodium thiosulphate was used and
were under 15% deviation. The iodine sodium thiosulphate method recorded the process of
decolorization as a measurement of mixing time as used by Carreau et al. (1976).
23

With the thermo anemometry, a thin wire film probe made of platinum is used with heat
generated by electricity. The principle of this is that as the liquid flows, the heat is transferred to
the liquid and the film is cooled. This technique is ideal for fluctuation velocities where the time
interval is short. Results are usually excellent if the probe is frequently calibrated and the sensor
is positioned properly to the maximum flow direction during measurements (Brunn, 1996).
The dye or coloring method (Serrano and Galindo, 1997) requires the addition of iodine or
methylene blue where the dispersion of the dye is followed visually or by spectrophotometer and
therefore, usually reserved for the detection of stagnant regions. This technique however is not
applicable to fermentation broths as dyes may be absorbed and used up in fermentation process.
Apart from that, most industrial reactors as well as the fermentation media are turbid making
quantification quiet tedious.
Ultrasonic doppler velocimetry technique requires the addition of tracer particles to the medium
to produce echo for the estimation of doppler frequency. As tracer particles are loaded and start
to move around, they transmit and scatter ultrasound beams emitted by the probe generating
backscattering at all angles. The frequency generated is used to estimate the doppler frequency
that can be used in the calculation of the particle velocity. A disadvantage of this technique is
that care must be taken to determine the accurate doppler angle. Wang et al. (2003) proposed a
correlation to determine the doppler angle which extended this technique to multiphase systems.
24

2.3.2.2 Correlations and Effect of Geometry on Liquid Circulation and
Mixing Time
Although various correlations exist for prediction of liquid circulation velocity, the most popular
one was proposed by Chisti and Moo Young (1988) based on an energy balance. The correlation
(equation 2.4) was developed for low viscous media and has been widely used both in internal
and external loop reactors and adequately validated (Wachi et al., 1991; Cai and Nieuwstad,
1999; Fraser and Hill, 1993; Kemblowski et al., 1993)
.
(2.4)
where; Ulr is the superficial liquid velocity, Ar is the riser cross-sectional area, Ad is the
downcomer cross-sectional area, hD is the liquid dispersion height, εgr is the riser gas holdup, and
εgd is the downcomer gas holdup. KB and KT are the hydraulic pressure loss coefficients in the
bottom and at the top. For an internal loop reactor, KT is negligible compared to KB due to open
channel in the top section. In the external loop reactors the authors assume an equal value for
both KB and KT. The frictional co-efficient of KB can be calculated from the following empirical
correlation (equation 2.5) Chisti et al. (1988) for internal loop.
11.40.
(2.5)
where, Ad is the downcomer cross-sectional area and Ab is the cross section at the bottom of the
airlift reactor. A weakness; however here is that the local gas holdup in the riser and downcomer
25

are employed in the equation instead of principal gas flow rate which determines the gas
holdups.
Another model predicts liquid circulation velocity and gas holdup in both two phase and three
phase flow (Heijnen et al., 1997). For a turbulent regime they assumed a constant ratio of gas
holdup between the riser and downcomer with respect to superficial gas velocity (characteristic
typical to a homogenous bubble) to solve the momentum balance. Their model consists basically
of the gas holdup and liquid velocity which is a representation of the driving force for liquid
circulation in the airlift reactor. In the derivation of this model the difference in gas holdup
(equation 2.6) was estimated as an overall function of superficial gas velocity for the following
expression for estimating the circulating liquid velocity (equation 2.7);
2 (2.6)
where, is the difference in gas holdup between riser and downcomer; is bubble
swarm velocity, is circulation velocity; is gas superficial velocity.
⁄
1⁄
(2.7)
where, Kf is friction coefficient and ht is the draft tube height.
This expression does not account for an interaction between gas and solids and also the friction
coefficient ( for the top section is not explicit. Although the model is simplified, it has
successfully predicated a pilot reactor of 400 L and a 2840 hecto-L fully scale bioreactor for
wastewater treatment. Table 2.4 lists a few correlations for liquid circulation and superficial
liquid velocity. It can be seen that liquid circulation velocity is greatly influenced not only by the
26

27
superficial gas velocity but also by the geometry parameter of the vessel as well as the liquid
property.
The predictions of these correlations involve the application of theoretical equations combined
with mass and momentum balance over a circulation loop and various empirical correlations for
gas holdup and pressure drop. The predictions were based on steady state balance between
hydrostatic pressure differences, gas holdup differences between riser and downcomer. Also the
pressure drop resulting from resisting forces in circulation paths due to introduction of internals
(draft tubes), and flow rates (Merchuk and Stein, 1981).
Mixing is crucial to industrial scale from the laboratory analysis because it is compromised at the
industrial level. Since the environmental conditions in the bioreactor fluctuates, mixing time in
the bioprocess is important to predict the optimum operating conditions such as pH, temperature,
and substrate concentration required for maximum productivity. The estimation of mixing time
provides an indication of a time interval during mixing. In such processes knowing the mixing
time hinders the product formation out of cells, which reduces product formed and sometimes
cell damage.
Mixing time is usually defined as the time required for reaching a certain level of homogeneity
(I) (usually 95%) after the introduction of a tracer. The level of I can be expressed as;
(2.8)
or
(2.9)

Table2.4. Mathematical models for liquid circulations inside airlift bioreactors
Reference Media Conditions Design Equation
1.55Bello et al., 1984
Air WaterNaCl.
Ugr=0.0137-0.086m/s Ad/Ar=0.11-0.69 H= 1.8m Dd = 0.152m
Internal and External Loop
..
0.66.
.
Chisti et al., 1988
Air, WaterNaCl
Ugr=0.01-2.0m/s Ar/Ad=0.5-9.1 H = 3.21m Dd = 0.142m
Internal and External Loop
2.
0.178Gouveia et al., 2003
Air WaterNaCl.
Ugr=0.0126-0.044m/s Ad/Ar=0.63
Internal Loop
. .1
.
2
1
Kemblowski et al., 1993
Air WaterGlycol Sugar SyrupCMC
Ugr=0.001-0.15m/s Ad/Ar=1-1.33
External Loop
4
0.25 .Schlotelburg et al. 1999
Air WaterCMC
Ugr=0.01-0.06m/s Ad/Ar =1.56 Dd = 0.20m
Internal Loop
.. 1 .
28
where, c and c∞ are the tracer initial and mean concentration respectively. The residence time
distribution (RTD) is another method used to evaluate how well a solution is mixed and is
usually based on the liquid recirculation in airlift bioreactor, however mixing time remains very
popular and easier. Gavrilescu and Tudose (1998), Lu and Hwang (1994) and analyzed mixing
using the axial dispersion model (ADM) which can be expressed in equation 2.10 as;
(2.10)
where, Bo is the Bodenstein number (also known as the Peclet number, Pe) ⁄ , where is
the axial dispersion co-efficient (a higher implies a lower Bo), Cr is dimensionless
concentration ∞
and is dimensionless time . V, the linear velocity (equation 2.11)
defined as;
(2.11)
Using this method, a smaller Bo or Pe implies good mixing whereas Bo greater than 20 is
considered as a plug flow; where the shorter the mixing time the higher the liquid velocity.
29
Depending on the property of the fluid used, a higher circulating rate of slurry might not
necessarily achieve superior or better mixing. For example in a low viscous fluid, less agitation
(low circulation) would be required to accomplish mixing whereas; a highly viscous liquid might
require a higher degree of agitation (higher circulation). Bello et al. (1984) compared mixing in
an external loop reactor (0.11 ≤ Ad/Ar ≤ 0.69) and in a concentric tube (0.13 ≤ Ad/Ar ≤ 0.56) and
found that the circulation liquid velocity ) was correlated to the cube root of superficial gas

velocity of the riser in both bioreactors. However, the Ad/Ar ratio had greater influence. The
external loop had a higher due to a higher differential gas holdup between riser and
downcomer but the concentric tube bioreactor was better comparing the data on mixing time.
In a three phase system, the effect of draft tube length (1.1 and 1.7 m, Ar/Ad ratio of 1), gas
velocity and introduction of solids (polystyrene and calcium alginate) in an internal loop airlift
bioreactor was evaluated (Lu et al., 1994) by measuring tracer response and the estimation of Bo
using the time domain analysis introduced previously (Verlaan et al., 1989). They reported that
the mixing was better at the bottom (Bo is 10-20) but it was excellent in the top section (Bo is 10).
Furthermore, Bo in the riser and the downcomer were 20-30 and 40-70, respectively. They also
found that the overall axial dispersion co-efficient ( ) declined with increasing draft tube length
although increased with increasing gas flow rate. Liquid mixing time in the polystyrene phase
(two phase system) was shorter than that in a system with Calcium alginate. This was due to the
fact that, bubbles attached to the polystyrene particles camouflaged it as a two phase system and
enhanced mixing (Lu et al., 1994). The Dd/Dc or Ad/Ar ratio influenced pressure loss in the vessel
and hence, the circulation velocity varied on the extent of gas disengagement. However, gas
disengagement did not support high mass transfer rate. Generally, the effect of the ratio of Dd/Dc
or Ad/Ar on the liquid circulation velocity is difficult to predict because of interactions between
gas, liquid and solid particles. A number of publications exist in this area and Koide et al. (1983)
showed that when Dd/Dc decreased, the volumetric mass transfer increased. This was due to a
decreased area for the gas holdup, which inhibited the liquid circulation velocity. However,
Weiland (1984) disagreed, as in his study; an increase in the Dd/Dc was correlated to an increase
in volumetric mass transfer. Furthermore, liquid circulation was higher when diameter ratio
30

decreased to 0.6. These discrepancies could be attributed to the locations (clearance) of the draft
tubes.
Molina et al. (1999) characterized mixing in a split cylinder airlift bioreactor (Ad/Ar ratio of 1,
sucrose solution with viscosity variations of 1.54±19.5×10⁻³ Pa.s, and Ug of 0 ± 0.039 m/s). It
was reported that viscosity had no influence on circulation time, which contradicted the theory
(increase in viscosity reduces flow as a result of resistance). According to them, the driving force
of circulation has increased with increasing viscosity for any gas flow rate. This was due to the
fact that as viscosity increased more bubbles were coalesced with a magnitude of smaller
bubbles, where most of these large bubbles were disengaged at the top and smaller ones went
through the downcomer. This achieved a higher driving force for liquid circulation. Viscosity
had little effect on mixing time, which suggests that mixing time was affected by differences in
velocities between the gas and liquid phases.
Merchuk et al. (1998) carried out an extensive study in a concentric tube reactor with seven
different spargers (four cylindrical and three porous plates) of varying pore sizes using sea water
and NaCl. They reported that the sparger pore size had an impact on the gas holdup and liquid
recirculation. The smaller the pore sizes the higher the gas holdup which implied a decrease in
the liquid circulation velocity. At a higher gas velocity, mixing time was independent of sparger
geometry although the geometry of the sparger and pore size had an impact at a low gas velocity.
Three different flow regimes were identified using the cylindrical sparger. The homogenous
bubbly flow occurred as gas holdup increased with increasing gas velocity, while the transition
flow occurred as coalescence of gas bubbles began. Finally, the holdup was affected by
coalescing and not by the geometry of the sparger used. For the use of plane sparger, the
transition flow was not very significant. They presented a correlation for mixing using the axial
31

dispersion co-efficient (equation 2.12) as a function of equivalent diameter, superficial gas
velocity in the riser and gas holdup.
(2.1.2)
where, Dc is column diameter, K5 and n4 are 0.81 and 1.34 respectively. This correlation
predicted satisfactorily (Glen et al., 1993; Aoyama et al., 1968) although for different constants,
implying further research on effect of geometry on the constants.
Miron et al. (2000) tested mixing in a bubble column and airlift (split cylinder and draft tube)
with a dispersion height of 2 m and working volume of 0.06 m3 using water and seawater. They
reported that, at any gas flow rate the values of mixing parameters in the two fluid media were
identical. In all reactors mixing time decreased with increased superficial gas velocity. However,
the bubble column gave the shortest mixing time due to the bulk flow as opposed to the airlift
where circulation was in a cyclic motion impeding the bulk flow. A higher or rapid circulation
(decreased circulation time) also enhanced mixing, although, at a superficial gas velocity of 0.02
m/s, gas bubbles increased and were entrained into the downcomer decreasing the liquid
circulation rate. Although existing correlations for bubble column were in agreement with Miron
et al. (2000), they proposed a correlation for airlift in terms of Bodenstein number, axial
dispersion co-efficient and mixing time (see equations 2.13 and 2.14).
. (2.13)
(2.14)
32

where, is Bodenstein number based on the superficial velocity, Fr is the Froude number, tm
is the mixing time, tc is the circulation time and k, b and g are constants that depend on geometry
of the reactor and fluid used. (k=9.2±0.2 for their work).
Since in convection, the movement of molecules within fluids occurs through diffusion, the
conventional method (the pulse response technique where conductivity probes are used) cannot
differentiate the two processes, since as a result of diffusion equilibrium is reached quickly upon
addition of a tracer. Furthermore, to avoid the interference by the positions of the probes with the
flow field, Luo et al. (2008) used an advanced imaging technique, computer automated
radioactive particle tracking (CARPT) to investigate mixing in a draft-tube airlift bioreactor.
CARPT is an advanced imaging technique that measures the flow filed tracking a radioactive
particle. This particle is made to have a density equal to the slurry phase to be studied and the
tracking is usually done with NaI scintillation detectors placed in the vessel. Flow measurements
provide information for the analysis of flow field, mixing time and liquid circulation velocity.
Luo et al. (2008) have also used a draft tube sparged internal loop of 0.13 m diameter and 1.5 m
height and a draft tube of 0.09 m diameter and 1.05 m height in an air-liquid medium with
varying superficial gas velocities (0.00076–0.05 m/s) and varying TC and BC. The residence
time distribution from flow trajectories obtained using the CARPT system was analyzed. As the
superficial gas flow increased, the gas holdup also increased causing a difference for faster fluid
flow and this concurred with Lu et al. (1994). They reported an effect of superficial gas velocity
on liquid circulation velocity in terms of the circulation time. As superficial gas velocity
increased, the circulation time also decreased (meaning higher liquid circulation) for different
TC, however, at a faster rate for no top clearance (i.e.TC=0 cm). This implies that liquid flow
33

and mixing was enhanced at as gas-liquid separation was improved inducing a higher liquid
velocity for circulation. However, a decrease in the bottom clearance did not affect the fluid
circulation, meaning the friction loss did not change significantly. They also confirmed that flow
in the riser and downcomer could be modeled as plug flow as suggested previously (Chisti, 1998;
Lu et al., 1994) by estimating the Pe number.
2.4. Applications of Airlift Bioreactors
Airlift reactors are used in various industries and amongst them, they are vital in biodegrading
pollutants in municipal and industrial wastewater. Traces of pollutants in wastewater cause
environmental hazard to animals, plants and humans. Some traces found in wastewater are
phenol, sulfide, nitrogen etc. which are generated by chemical industries such as petroleum,
plastics, textile and dyes. Mohanty et al. (2008) designed a multi-stage external loop airlift
reactor for the removal of phenol from wastewater by means of its adsorption onto the surface of
activated carbons. To enhance the adsorption of the trace element onto the carbon sites, the
reactor was designed for continuous bubble formation, breakup and regeneration which
promoted recirculation of the slurry. This design was good enough to remove about 95% phenol
at a time with a lower carbon loading (2 g/L) which is typically 5 g/L for other wastewater
removal processes.
The biofilm airlift suspension (BAS) bioreactor is a three phase system for biological wastewater
treatment which became popular due to its high efficiency and low energy consumption (Heijnen
et al., 1993; Shieh, 1989) as opposed to the conventional activated sludge process. The BAS is
made up of two concentrically placed columns with ceramic materials as carriers to support
microorganisms (Zhou et al., 2003). This system was used to treat domestic wastewater with an
34

effluent COD of 160-327 mg L-1. In their experiments, two reactors with different sizes of
carriers were used. Moreover, it was found that the reactor with a smaller diameter carrier
achieved a higher concentration biomass of removing higher content of organic matter. This was
due to the fact that smaller sized ceramic fillings provided a large surface area for biofilm
attachment and biomass concentration. Generally a 95% COD has been removed by this method.
Nitrate removal from wastewater also employs the BAS, the first two processes ammonification
and nitrifications are aerobic requiring oxygen whiles dentrification is anaerobic as performed by
(Vilchez and Vega, 1995) using alginate beads as carriers to entrap chlamydomonas reinhardtii.
In the bioprocesses, for fermentation, microorganisms in an airlift bioreactor yielded better as
compared to the achievement in conventional stirred tank bioreactor. In the stirred tank, the
challenge of maintaining sterile condition for large cultures during scale up is enormous, whereas
in the airlift reactors without the mechanical agitation had better aseptic conditions and oxygen
supply. Ichii et al. (1993) developed a commercial scale internal loop airlift bioreactor of a
volume of 145 m3 to grow Candida utilis for the production of RNA. For a higher production
rate, the airlift fermenter was designed to increase the dilution rate by supplying more oxygen to
the microorganisms. The cross sectional area ratio of the riser to downcomer was 0.8 with gas
sparged in a draft tube containing perforated baffle plates. This design achieved an oxygen
transfer rate of 9.9 kg-O2/m3/h with yeast production of 9.79 kg-dry cell/m3/h which was greater
than that achieved in a stirred tank reactor.
Aleksieva et al. (2000) successfully operated a fungus (Humicola lutea 120-5) without
contamination for acid proteinase production under batch and continuous culture conditions.
Acid proteinase has been predominantly used in the food industry as an enzyme for fermentation
35

in cheese production. The continuous system produced three times proteinase as compared to the
batch system. Production data indicated comparable values for both stirred reactor and the airlift,
although the cost was less in the case of the airlift process due to the low power requirement.
Nakoa et al. (1997) used three reactors (internal loop, external loop and bubble column) in the
production of gluconic acid with immobilized glucose oxidase (GO). During this process H2O2
was formed and deactivated glucose oxidase. Under optimal operational conditions and the
reactor design, calcium alginate gel beads were used to entrap GO and H2O2, while controlling
the deactivation and the accumulation of H2O2. They reported that the internal loop and bubble
columns gave a higher production of gulconic acid with lower GO deactivation due to a higher
KLa. They further developed a few models for the deactivation of GO which can be used to
choose an optimum ratio of both MnO2 and GO for any gluconic production (Bao et al., 2004).
Modified airlift reactor (static mixers) was also used to produce ethanol by Vincente et al.
(1999). An increase of 30% production rate of ethanol was achieved in a three phase concentric
tube reactor using Saccharomyces cerevisiae during glucose fermentation. This was due to
smaller floc sizes produced with less gas flow rate, which promoted the dilution rate for the
fermentation process.
The use of airlift has not been spared in the production of microalgae, which are useful
biochemical substances as feed for human and aquaculture. Algae have been used for the
production of biofuels subsequently contributing to reduce global warming. This organism
utilizes light and CO2 for its photosynthesis. In conventional reactors, since the light is
introduced at a focal point, cells at the surface of the medium may capture higher photon flux
density (PFD) while it tends to decrease away from the surface to the bottom. This inhibits the
uniform distribution of light lowering the production. Ogbonna et al. (1996) proposed an
36

internally illuminated expensive stirred tank reactor. In light of this, Merchuk et al. (2000) used
three reactors illuminated externally through the reactor wall (bubble column, an airlift reactor
and a modified airlift reactor with helical flow promoters) for the cultivation of red microalgae
Porphyridium sp. According to them, both airlift and reactor modified with helical flow had a
higher production of biomass as compared to the bubble column. The airlift with its fluid
circulation pattern encouraged an even distribution of light at a lower cost for CO2. Earlier
Merchuk et al. (1998) produced similar results for the same microalgae cultivation in both
bubble column and airlift bioreactors, produced similar results at a higher gas input and a lower
photon flux density (PFD). However, at a higher PFD and lower gas flow the airlift had better
results.
Furthermore, Miron et al. (2000) studied the algae Phaeodactylum tricornutum using
photobioreactors of bubble column, split-cylinder airlift and concentric draft-tube all with
working volume of 0.06 m3 using Mediterranean seawater. There was no preference of one
reactor over the other since in this case as they all produced an equal biomass concentration of
about 4 kg/m3 after 260 h. Degen et al. (2001) investigated the production of Chlorella vulgaris
in a rectangular airlift photobioreactor (with an illuminated front area of 0.084 m2). This airlift
achieved 1.7 times higher production than the bubble column of similar dimensions.
Another area of growing interest is the production of materials and chemicals using different cell
culture techniques. This would provide a reliable source of materials for production of drugs in
the pharmaceutical industry, flavor for the food industry, and fragrances for the cosmetic
industry in addition to other related chemical industries. Generally, airlift reactors provide
uniform shear in cell cultures (though high shear would damage membrane and change the
morphology), and provide good mixing. A glass airlift bioreactor with a working volume of 2.3L
37

was evaluated by Kim and Pedersen (1991) for cell suspension of Thalictrum rugosum which
produced berberine. Berberine, which can also be derived from several plants, is used as an
antimalarial drug to prevent or cure malaria. A production of berberine was much lower in the
airlift bioreactor compared to the shake flask, although the cell yields were identical. Addition of
ethylene and CO2 in gas sparging increased the production level of berberine according to Kim
and Pedersen, 1991. Wu et al. (2007) also produced caffeic acids derivatives in a high density of
Echinacea purpurea without a product loss in 500 L and 1000 L airlift bioreactors as compared
to a 20 L bioreactor using Murashige and Skoog (MS) medium. E. purpurea have been widely
used in the production of caffeic acid derivatives (Wu et al., 2007). E. purpurea is a species of a
medicinal plant having antiviral, antifungal, antioxidant and antibacterial substances that can be
used for the treatment of various ailments. Its derivatives such as chichoric acid have been
known to inhibit the type 1 HIV integrase and replication (Lin et al., 1999). Caspeta et al. (2005)
tested the production of compounds having antifungal properties by Solanum chrysotrichum in
shake flask, draught internal loop and novel modified meshed draught tube with mesh. A
difficulty with this was that the hairiness and branching encouraged root entanglement that
hindered mass and energy transfer processes. The airlift reactor was designed as such that the
downcomer had a large space for root growth where the downcomer cross sectional area (Ad)
was three times greater than the riser (Ar). The modified reactor with helix provided superior
performance. The mesh in the modified reactor allowed growth of root without flow obstruction,
while the helixes promoted the even distribution of roots. With growing interest in genetic
engineering, airlift reactors were exploited for protein recovery application. Dahman and
Margaritis (2008) designed and used a draft tube fluidized bed reactor for protein bioseparation
from bovine serum albumin (BSA) and bovine hemoglobin (BHb) solution. They achieved a
38

higher BSA adsorption from the solution due to the homogenous shear created by the airlift, thus
reducing the compressibility of BHb. Bioseparation of BSA in a conventional adsorption
processes was limited due to high adsorption of BHb.
The use of airlift bioreactor extends to other chemical and allied industries, such as petroleum in
which toxic SO2 and N2 are released causing environmental pollution. In this case, biological
processing of petroleum biodesulphurization (BDS) has been proposed which is not only less
expensive (in terms of energy requirement) but also produces valuable products from the by
product (Pachecoet et al., 1999; Monticello, 2000). Mehrnia et al. (2004) simulated the chemical
properties of fermentation broth used in BDS, using water-in-kerosene microemulsion system in
a draft tube airlift bioreactor. They analyzed operating and geometric parameters on oxygen
transfer and mixing characteristics. In BDS, where microorganisms were used, high oxygen
levels for higher mass transfer rates were necessary for gas-liquid contacting. Mehrnia et al.
(2004) reported an increase in Ad/Ar had superior mixing and oxygen transfer rate as opposed to
an increase in the top section which depleted the system of oxygen.
39
2.5. Airlift Modification
Several modifications have been proposed to improve the conventional airlift bioreactor, and
some of them have already been adapted. Modified airlift bioreactors include the inverse
fluidized airlift, reactors with static mixers, helical flow promoters, and perforated draft tube;
refer to Figure 6a, b, and c respectively. The principle for the inverse fluidized bed utilizes
particles with densities lighter than liquid phase. These particles are entrained to the downcomer
against the buoyancy of gas sparged. This inverse fluidized reactor has been used for the
biological treatment of wastewater (Garnier et al., 1990; Faraq et al., 1997). In the process of
biodegradation in the fluidized bed, the solids (microorganisms trapped in polymeric gel) are
suspended in aqueous phase and gases are in contact with each other to provide oxygen for
biodegradation.
Gluz and Merchuk (1996) investigated the helical flow promoter (HFP; Figure 6 (c)), which is
consisted of fins and baffles that were placed either in the riser or downcomer. This caused fluid
to flow in a helical pattern down the downcomer as opposed to the conventional type with
straight downward flow. As the helical flow was generated, the content of the vessel began to
swirl enhancing radial mixing in the downcomer. This contributed in better distribution of shear
in addition to light and heat in the case of photobioreaction. Other characteristic of HFP is its
capacity for fluidizing solid particles at lower gas flow rates. This is particularly favorable for
operating dense cells immobilized on solids. Furthermore, mass transfer rates can be enhanced
about 50% due to higher relative velocity between particles and liquids in such type of bioreactor
(Merchuk et al., 1993).
40
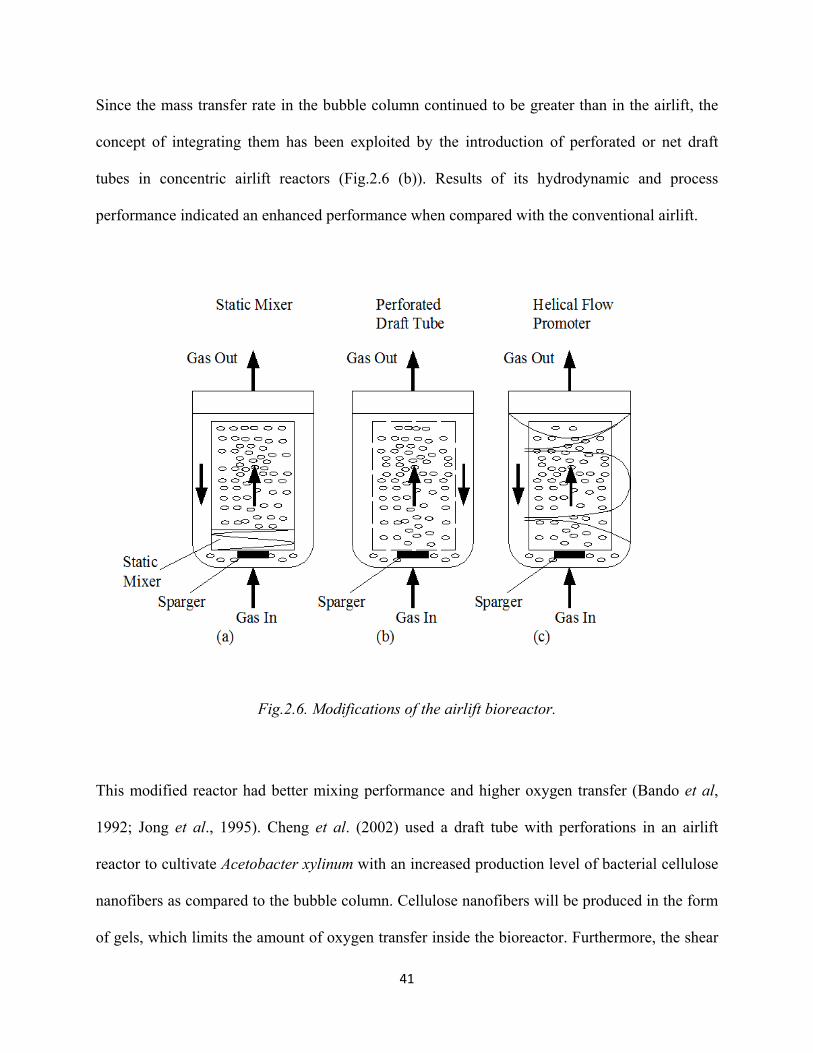
Since the mass transfer rate in the bubble column continued to be greater than in the airlift, the
concept of integrating them has been exploited by the introduction of perforated or net draft
tubes in concentric airlift reactors (Fig.2.6 (b)). Results of its hydrodynamic and process
performance indicated an enhanced performance when compared with the conventional airlift.
Fig.2.6. Modifications of the airlift bioreactor.
This modified reactor had better mixing performance and higher oxygen transfer (Bando et al,
1992; Jong et al., 1995). Cheng et al. (2002) used a draft tube with perforations in an airlift
reactor to cultivate Acetobacter xylinum with an increased production level of bacterial cellulose
nanofibers as compared to the bubble column. Cellulose nanofibers will be produced in the form
of gels, which limits the amount of oxygen transfer inside the bioreactor. Furthermore, the shear
41

sensitive nature of the cells makes it a challenging task to produce this bacterium in the
conventional stirred tank or in the bubble column. The superiority of the modified airlift with the
draft tube was attributed to the ability of the draft tube to promote high oxygen transfer, which
lead to improvement in the production of bacterial cellulose.
Wu et al. (2001) used the fungus Absidia coerulea CCRC 30897 to produce chitosan directly in a
perforated draft tube and bubble columns. Chitosan is a polysaccharide produced by
deacetylation of chitin and has unique properties that allow for its use in the biomedical industry.
The modified airlift with perforated draft tube proved to be superior as it produced more chitosan
with excellent oxygen transfer due to the proximity of chitosan to the cell walls of the fungus
which enhanced the production of biomass. Wu et al. (2000) produced Monascus purpureus, a
fungus that has an application in the production of certain fermented foods in China and Japan.
Recently it has been discovered that properties of this mold lowers cholesterol in human bodies.
Production levels of M. purpureus in the net draft tube far exceeded that in a bubble column as
reported by Wu et al. (2000).
In view of cell damaged due to high shear, Garnier et al. (1990) proposed a concentric tube
which combined both the fluidized bed and internal loop reactor. The setup ensured that, the gas,
liquid and solid contact was somewhat limited to reduce shear damage to cells. Solid particles
(i.e., polystyrene beads) were put in the annulus and gas was spared through the inner tube,
whereas liquid flowed through the downcomer expanding the bottom, resulting in an inverse
fluidized bed. However, lighter particles in addition to bursting of gas bubbles entrained into the
downcomer can damage cells. In retrospect, Guo et al. (1997) used an external loop inverse
fluidized bed airlift bioreactor (EIFBAB) to treat wastewater. In this type of bioreactors gas was
sparged in the middle of the riser to aid fluidization for heavy particles in the bottom of the riser.
42

Loh and Liu (2001) employed a similar setup in a 4 L EIFBAB (shown in Fig. 2.7) to eliminate
high contents of phenol in wastewater. However, a globe valve and stainless steel screen were
used to prevent solid particles from getting into the downcomer. Polystyrene solid particles were
used as support for immobilizing of Pseudomonas putida. The effect of the valve provided a
range of gas holdup at a fixed gas input rate to the reactor. This system successfully biodegraded
phenol up to 3000 mg/L. More on that, Loh and Ranganath (2005) integrated the EIFBAB with
granular activated carbon (GAC) and successfully achieved cometabolic biotransformation of 4-
chlorophenol (4-cp) in the presence of phenol.
Fig.2.7. The EIFBAB; external loop inverse fluidized bed airlift bioreactor
43
Another variation to enhance the performance of the conventional airlift was the introduction of
static mixer in the riser. In such a vessel, liquid circulation was decreased as a result of an
increased resistance from the static mixer.
Large gas bubbles were broken into smaller ones increasing the interfacial surface for higher
mass transfer rates. Chisti et al. (1990), Potucek (1990), and Gavrilescu et al. (1997) have
studied the influence of the static mixer in airlift bioreactors and observed an increase in KLa as
compared to reactors without mixers.
Other modified types of airlift bioreactors include the convergent-divergent airlift (Fig.2.8a). In
this type of airlift bioreactors the draft tube contracts and expands as the name suggests with
continuous renewal of gas-liquid interfacial area to promote mass transfer. Wei et al. (1999)
studied a three phase airlift bioreactors of air, water and resin. They reported an increase in both
εg and KLa by 8% and 10%, respectively as compared to the conventional draft tube bioreactors
with a lower liquid circulation due to the geometry of the convergent divergent vessel. The
increase in εg even in the presence of solid loadings was related to the effect of the solids
breaking up the gas bubbles into smaller ones to enhance mass transfer rates. They have further
confirmed a viscous media (containing CMC) which also produced higher gas holdup and thus
higher KLa (Wei et al., 2000).
44

(a)Convergent - divergent (b) multi stage airlift
Fig.2.8. Other modified airlift bioreactors
Mohanty et al. (2006) and Li et al. (2009) designed a novel multistage airlift system consisting
of three vertically staged airlift reactors constructed to work in series (Fig. 2.8b). These designs
are such that there is a continuous generation of bubbles, rupture and regeneration. This system
was equipped with different spargers (multiple orifice and single orifice) together with a screen
at various stages to encourage the continuous regeneration of bubbles. This system showed a
45% increment in gas holdup as compared to the single system. Mohanty et al. (2008) also
applied this system to the removal of phenol in wastewater as have been mentioned previously.
45

2.6 Research Objectives
It is evident from literature surveyed that although several mixing experiments have been
performed in the airlift bioreactors, discrepancies still exist mainly because of the various
measuring techniques employed. With the relative ease of using the conventional methods where
conductivity probes are inserted into the bioreactors, its downside however lies in their inability
to visualize flow characteristics, disrupting flow and sometimes causing damage to sensitive
cells thereby affecting accurate measurements in the bioreactor. Other visualization techniques
may disrupt flow processes as well as alter the accuracy of measurements taken during an
experiment. With growing interest and use of computational fluid dynamics (CFD) to simulate
and validate processes, it is crucial that measurements taken during experiments are as precise as
possible.
The electrical resistance tomography (ERT) has gained popularity over the last decade for
investigating mixing especially in the stirred tank reactors and bubble columns. Quiet recently
the ERT was employed to investigate the effect of sparger on gas holdup in bubble columns
(Haibo et al., 2006) and also to study the hydrodynamics and flow in a three phase fluidized bed
(Razzak et al., 2007). The main attractive feature of this measuring technique is that it is non
invasive and non intrusive to flow processes, in addition to that it provides information on flow
characteristics. The ERT technique measures conductivity variations within the reactor.
In view of the projected advantages of the ERT technique, this research work evaluated mixing
performance in a draft tube airlift bioreactor with the following objectives:
• To investigate the feasibility of using ERT in a draft tube airlift bioreactor to enhance the
knowledge of the characteristics of mixing inside airlift bioreactors.
46

• To determine the mixing time and circulation times which would be used in the
calculation of liquid circulation velocity and shear rate in the draft tube airlift bioreactor.
• To evaluate the effect of the bioreactor geometry such as bottom clearances and draft
tube diameter or ratio of cross sectional areas of downcomer to riser Ad/Ar,, in addition to
gas flow rate, sparger configuration and liquid viscosity on the mixing characteristics.
47
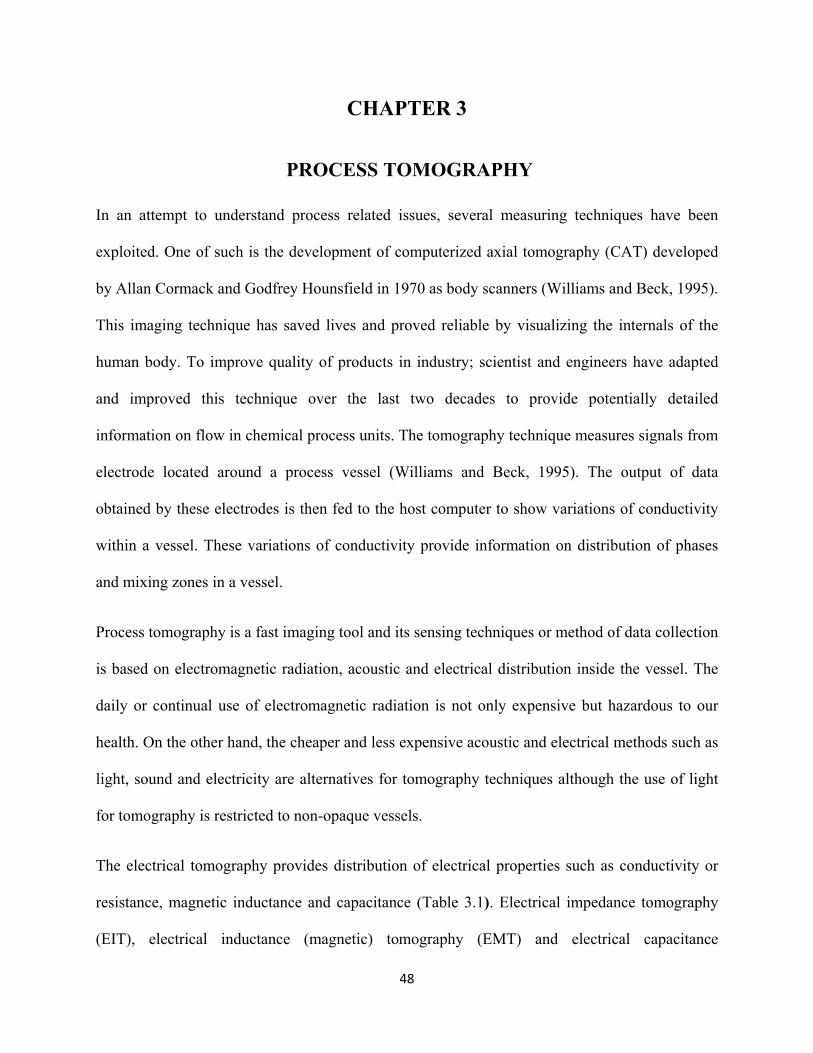
CHAPTER 3
PROCESS TOMOGRAPHY
In an attempt to understand process related issues, several measuring techniques have been
exploited. One of such is the development of computerized axial tomography (CAT) developed
by Allan Cormack and Godfrey Hounsfield in 1970 as body scanners (Williams and Beck, 1995).
This imaging technique has saved lives and proved reliable by visualizing the internals of the
human body. To improve quality of products in industry; scientist and engineers have adapted
and improved this technique over the last two decades to provide potentially detailed
information on flow in chemical process units. The tomography technique measures signals from
electrode located around a process vessel (Williams and Beck, 1995). The output of data
obtained by these electrodes is then fed to the host computer to show variations of conductivity
within a vessel. These variations of conductivity provide information on distribution of phases
and mixing zones in a vessel.
Process tomography is a fast imaging tool and its sensing techniques or method of data collection
is based on electromagnetic radiation, acoustic and electrical distribution inside the vessel. The
daily or continual use of electromagnetic radiation is not only expensive but hazardous to our
health. On the other hand, the cheaper and less expensive acoustic and electrical methods such as
light, sound and electricity are alternatives for tomography techniques although the use of light
for tomography is restricted to non-opaque vessels.
The electrical tomography provides distribution of electrical properties such as conductivity or
resistance, magnetic inductance and capacitance (Table 3.1). Electrical impedance tomography
(EIT), electrical inductance (magnetic) tomography (EMT) and electrical capacitance
48

49
tomography (ECT) produce images based upon the variations in the conductivity and
permittivity. The electrical resistance tomography (ERT) is an example of EIT. The electrical
tomography remain popular due to their simplicity, high speed capacity and most importantly
can be used for real online imaging during manufacturing processes (Mann et al., 1997).
3.1 Electrical Resistance Tomography (ERT) Configuration
The basic structure of the ERT system consists of the electrode hardware fitted around the
periphery of a vessel, data acquisition system (DAS) and a host computer in which data
processing software is imbedded for conductivity variation measurements (Fig 3.1).
Fig.3.1 Structure of a typical electrical resistance tomography system

Table 3.1 Electrical tomography technique
Electrical methods Principle realization General remarks Typical industrial applications
Capacitance
(Dyakowski et al., 1999)
Capacitance sensing electrodes which are non-invasive if separated from the process fluid by a 10 mm thick plastic liner
Electrode may need to be of 10 Electrically insulating systems cm2 area to give sufficient gas/oil, gas/solids capacitance change
two phase flow imaging
fluidizing bed imaging
Resistance
(Mann et al., 1997)
Resistivity sensing, which are invasive but non-intrusive.
Very small electrodes can be used, Electrically conducting systems Similar to system used for medical
hydrocyclone imaging imaging.
mixing study
geophysical prospecting
Impedance
(Lyon et al., 1995)
Similar to above but without current injecting electrodes. Current is induced by coils surrounding the vessel.
Similar to above. Ground water monitoring and soil remediation
Source: Williams and Beck (1995)
50

3.1.1 Electrodes
The electrodes for the ERT system are fitted inside the vessel non invasively for contact with
process fluids to allow for the continuous detection of conductivity changes without invading the
process flow. This hardware is usually made up of 16 equally spaced rectangular electrodes. The
arrangement of the electrodes can either be circular or vertical. For reliable measurements, the
electrode hardware must be more conductive than the process fluid (Williams and Beck, 1995).
Also to withstand harsh operating conditions such as temperature and pressure the electrodes are
made of metals (stainless steel, silver, gold, platinum etc). These electrodes are connected to the
data acquisition system by means of co-axial cables to reduce the noise generated by
electromagnetic transmissions associated with typical operation processes (Dickin and Wang,
1996).
3.1.2 The Data Acquisition System (DAS)
Fig.3.2 shows a schematic diagram of the ERT data acquisition system, this is a basic necessity
for an ERT system. The DAS is attached to the electrodes and connected to the host computer to
display signals of conductivity variations. It is responsible for applying current and recording its
corresponding voltage output revealing conductivity distribution in a vessel (Williams and Beck,
1995). The DAS incorporates signal measurements, de-modulation and control, waveform
generation and synchronization, multiplexer control and power supply (Dickin and Wang, 1996).
This system starts with the sine wave generator; here current is applied to produce a sine wave to
probe the material under investigation (Brown et al., 1994). An electrical current application is
51
preferred for sine generation because a good current source has high output impedance whereas a
voltage source has a low one (Dickin and Wang, 1996).
Digital function generators in the form of EPROM- based staircase with lower harmonic
distortions have replaced monolithic generators (Brown and Seagar 1985). For further filtration
of harmonics, the digital waves are then converted to an analog- voltage by a high speed digital-
to- analogue converter (DAC) and fed into a voltage current converter source (VCCS).
V essel V oltageB uffers M ultip lexers
Instruop-am p
P hasesensitive
dem odulator
D ig italdem odulation
L ow -passF ilter
12-bitA D C
M ultip lexers
C urren tsignals
C onstantcurrent
generator
S inew avevoltagegenerator
E lectrode m odule
E lectrodecontroller
M icrocontro ller
R eference signals
T o H ost Im age R econstruction C om puter
Fig.3.2. Components of a typical data-acquisition system (Holden et al., 1998)
The multiplexers share the current source and voltage measurement stages between any numbers
of electrodes. Depending on the strategy used to apply electric current, a wide range of voltages
maybe produced which the voltage measurements might not be able to accommodate. The
amplifier solves this problem by rejecting the common mode signals as electric noise.
52

This occurs through the grounded (load) floating measurement (GFM) technique. Here a GFM
lead is attached to one of the unused electrodes as a ground electrode on the vessel. The other
end of the lead is attached to the output of the common-mode voltage. The effect of this
arrangement is to produce a zero potential in the conducting region inside the vessel and
therefore the high common-mode voltage is removed from the current-driven electrodes (Wang
et al., 1993). An optimum signal-to-noise (SNR) is obtained through the digital demodulation;
finally the waves go through an analogue-to-digital converter (ADC).
3.1.2.1 Data Collection Strategies
With a reliable DAS system in place, the next step is the interrogation protocol for probing the
conductivity distribution within the vessel. These include the adjacent, conducting boundary,
diagonal and opposite measurements strategies (Fig.3.3). The interrogation protocol involves the
application of electric current through a set of electrodes and the detected voltage measured from
the other electrode combinations. For a typical ERT system, the most common measuring
protocol is the adjacent method. The adjacent protocol involves the application of electric current
through a pair of adjacent electrodes and the detected voltages measured from successive pairs of
neighboring electrodes (Fig.3.3a). The procedure is repeated for all other combinations of
adjacent pairs of electrodes for the entire ring of electrodes (Seagar et al., 1987).
This protocol yields M independent measurements which can be calculated from:
M N N
(3.1)
where N is the number of electrodes. The adjacent measuring protocol remains popular because
53

Fig.3.3. Data collection strategies: (a) The adjacent measurement strategy, (b) The conducting boundary measurement strategy, (c) The diagonal measurement strategy, (d) The opposite measurement strategy. Adapted from Dickin and Wang, 1996.
it requires minimal hardware for implementation with a relatively quick conductivity signal
output recording (Abdullah, 1993). A downside however is the non uniform current distribution
as a result of measurements at the periphery making this technique very sensitive to
measurement errors and noise (Brown et al., 1994).
3.1.3 Host Computer
Following acquisition of the voltage measurements from the electrode, an algorithm imbedded in
the host computer is used to display the average conductivity distribution within the vessel.
Average conductivity variations generated from the algorithm determines the internal
distribution of conductivity within the vessel. The ITS 2000 uses a non-iterative algorithm
known as the linear back projection (Barber et al., 1983 and Kotre, 1989) which converts voltage
measurements to conductivity values. This algorithm is quick, simple with low computational
time as average conductivity readings or signal are generated by simply multiplying the
measurements by a single, pre-calculated matrix (Holden et al., 1998).
54

3.2 Applications of ERT
Introduction of body scanners in the medical industry have enhanced diagnostics and treatment.
Other industries have exploited this possibility using the ERT without the multimillion dollar
price tag to it. In other chemical engineering applications, the ERT has been applied to evaluate
mixing performance in various reactors (Fransolet et al., 2001; Razzak et al., 2007; Pakzad et al.,
2008). Mixing evaluation is usually quantified by the mixing time and this is determined by the
variation of conductivity values in the ERT system. Mixing efficiency or performance may
depend on time, reactor geometry, fluid viscosity and impeller type. ERT technique enhances
knowledge during mixing process. This knowledge can be used to improve the design of
equipment and processes. GlaxoSmithKline a pharmaceutical company used the ERT for the
online control of an active pharmaceutical ingredient (API) synthesis for paracetamol production
(Ricard et al., 2005). This technique enabled them evaluate the mixing performance of several
reactor geometries and concluded that the ERT was valuable for development of API processes.
For batch processes, ERT was used to monitor the progress during nylon polymerization
(Dyakowski et al., 2000). To withstand harsh operating conditions involved in this process (i.e.
high temperatures and pressures), specially designed electrodes were fabricated using plasma
technology and fitted into the walls of the vessel. Results obtained using the ERT techniques
provided useful information on the various stages of nylon polymerization. The ERT showed the
material distribution during the heating up stage, the effect of opening the pressure control valve
and the permittivity distribution at the last stage of the polymerization process (Dyakowski et al.,
2000).
55

In the past, interpretations of the mechanisms of separating fluids in hydrocyclone were
inadequate due to; swirling, turbulence and the lack of on-line measuring techniques to provide
reliable experimental data for modelling (Dyakowski and Williams, 1998). To monitor the
separating process in hydrocylones, ERT was employed to investigate clay refining (Williams et
al., 1999). Experimental measurements were performed in a unit containing multiple 50 mm
diameter hydrocylone separators. The electrode hardware consisted of 8 planes of 16 electrodes.
These electrodes were disc shaped and engineered to be flush with the inner walls of the vessel
for continues measurements. Results indicated the possibility of identifying different (real) fault
conditions based on variations in conductivity readings. This information provides a rich source
of data for model development in fluid separation (Williams et al., 1999).
Pressure filtration is a process for separating of liquid from solid phase. Processes involved are
lengthy and can extend to a number of hours or days. Due to the slow dynamics of the reaction,
modest data acquisition rates of order one frame per minute of the ERT system are adequate.
Vlaev et al., 2000 used ERT, to monitor progress during washing and drying stages of pressure
filtration at Zeneca. Their aim was to identify the end point of filtration such that processing
times would be improved and waste reduced. Results obtained with the ERT technique showed
movement of liquid level during filtration. Also any tilt of the filter which causes a malfunction
of this process was also detected. They concluded that ERT sensing electrodes could be
retrofitted to a large scale filter without modifying the internals of the unit.
56

CHAPTER 4
EXPERIMENTAL
4.1 Experimental Setup Fig. 4.1 shows a schematic diagram of the bioreactor setup with a constant volume of 0.0578 m3.
The draft tube airlift bioreactor consists of two co-axially mounted concentric tubes. The first
concentric tube has an inside diameter of 0.40 m with a height of 0.60 m. The draft tubes
examined have inner diameters of 0.22, 0.29 and 0.34 m. For mixing time studies, the BC
(distance from bottom of the draft tube to base of the bioreactor) were adjusted to 0.003, 0.006
and 0.009 m. A sparger was placed just at the entrance of the draft tube (Chisti et al., 1989) and
the air flow controlled by a rotameter attached to the side of the bioreactor. The superficial gas
velocity varied between 0.00165 to 0.00807 m/s, which is the typical range used for cell culture
cultivation in industry (Grima et al., 1997). Two sparger configurations shown in Fig.4.1 were
used in this work: the cross shaped and circular shaped configurations.
4.1.1 Airlift Bioreactor
In order to evaluate the performance of the airlift bioreactor with different geometries, three sizes
of draft tubes were used in this experiment. They consist of a bigger cylindrical column with
internal diameter of 0.4 m and a height of 0.6 m. These draft tubes were of internal diameters of
0.22, 0.29 and 0.34 m, which is equivalent to Ad/Ar ratios of 2.31, 0.9 and 0.38 respectively.
Geometrical parameters were calculated from:
Cross sectional area of downcomer; (4.1) 4⁄
Cross sectional area of riser; 4⁄ (4.2)
57

Ratio of cross sectional areas; ⁄ 2 2
2 (4.3)
Fig. 4.1 Bioreactor set up
4.1.1.1 Sparger Design
To prevent weeping (back flow) in the sparger, Mersmann (1978) proposed that the weber
number (We) based on the hole diameter (1-5 mm) of the sparger to be 2. For the calculation of
number of holes on the sparger, the weber criterion is used to calculate the superficial gas
velocity through the holes (Ruff et al. 9 ). i.e.; , 1 78
2 (4.3)
58

(4.4)
where do is diameter of hole on sparger, is the density of gas, UG superficial gas velocity in
riser. The highest gas velocity (0.00807m/s) was calculated to find the maximum number of
holes needed on the sparger based on the following parameters:
do= 2 mm, = 1.206 kg/m3 and Ugr = 0.00807m/s.
2 0.07240.0021.206
7.75 /
Since Overall Volumetric flow rate of i Vo r through holes in sparger a r = lumetric flow rate of ai
4 4
Number of holes, . .. .
39 holes
4.1.2 ERT System
The ERT setup for this experiment consists of the electrodes, ITS P2000 data acquisition system
(DAS) and a host computer (Fig.4.2).
4.1.2.1 Electrodes
The wall of the bioreactor was fitted with four planes of electrodes (Fig.4.2). Each plane of
electrode consisted of 16 equally spaced stainless steel electrodes. Each rectangular electrode
was dimensioned as 20 mm high by 30mm wide with 1 mm thickness. The planes were
59

numbered from top to bottom (1-4) and at intervals of 8.5 cm for the first three planes and the
last plane was 4.5 cm from the bottom of the bioreactor. Since the electrodes were fitted on the
periphery of the bioreactor, changes in conductivity within the bioreactor were observed only in
the downcomer (annulus). The electrodes were connected to the ITS P2000 data acquisition
system via co-axial cables.
4.1.2.2 Data Acquisition System (DAS)
The DAS was responsible for applying current and measuring the corresponding voltage output.
Data collection was performed quickly to track changes in conductivity variations in the
bioreactor after the injection of a tracer. The ITS P2000 used the adjacent measurement protocol
by applying electrical current between an adjacent pair of electrodes and measuring the voltage
difference between all other adjacent electrode pairs.
Fig.4.2 ERT setup for experimental work
60

The procedure was repeated for other combinations of adjacent electrode pairs for a full rotation
of the vessel. The main specifications of the DAS used in this study were: frequency, 9600 kHz
and injecting current 75 mA.
4.1.2.3 Host Computer
The DAS was connected to a host computer (Fig.4.2) through a communication port for data
collection and storage. It used a non-iterative algorithm (Linear Back Projection-LBP). The
algorithm shows distribution of conductivity inside the annulus of the bioreactor. This algorithm
requires voltage difference measurements before and after any change in conductivity to convert
the voltage measurements into average conductivity readings or signals on the various planes of
electrodes. The LBP is easy, quick and simple due to its low computational requirement (Barber
and Brown, 1984).
4.2 Materials and Supplies
Xanthan gum (XG) powder was used for the preparation of aqueous xanthan gum solution.
Xanthan gum is a highly viscous polysaccharide solution (Davidson, 1980) produced by
fermentation of Xanthomonas campestris bacterium and has found its application in food,
petrochemical, pharmaceutical and oil recovery industries. Food grade XG powder used was
obtained from Archer Daniels Midland Company (Decatur, IL). Household salt (NaCl) was
purchased for use as the tracer; sugar and tap water were also used.
The concentrations of sugar solution and xanthan gum solutions were chosen to approximate
those found in fermentation media (Onken and Weiland 1980; Fields et al., 1984). 34.5% sugar
solution was prepared by dissolving the right amount of sugar into water. To prepare 0.2% and
61

0.5% xanthan solution for a volume of 0.0579 m3, appropriate masses of XG powder was
weighed. The mixing tank was then filled with some tap water. With the stirrer on, xanthan gum
powder was slowly added to the water in the tank. Water was added up to the desired volume
and the resulting solution was stirred continuously for about 6 hours to achieve a homogenous
solution. The density of the resulting solution was measured using a pycnometer. Rheological
properties of XG were determined (Table 4.1) using a Bohlin CVOR Rheometer 150 (Malvern
instruments, USA) and correlated according to the Hercshel-Bulkley model (Herschel and
Bulkley, 1926) to determine viscosity. All measurements were taken using the Bohlin Mooney-
Cell and Cup geometry (25mm diameter, 29mm height, stainless steel) at 22oC. The rheology of
XG solutions was modelled best by the Hercshel-Bulkley model as shown in Fig.4.3. Then the
viscosity is given by:
| | (4.5)
The average shear for viscosity calculation is evaluated based on the correlation proposed by
Nishikawa et al. (1977);
1000 . (4.6)
Table 4.1. Rheological properties of xanthan gum solution
Power-law index, n
Yield stress, τy
Density,ρ Viscosity, µ Concentration Consistency index, K (kg/m3) (Pa.s) (%) (Pa sn) (Pa)
0.2 XG 0.0849 0.9509 1.864 1002 0.0889-
0.1167
0.5 XG 0.3408 1.169 4.506 1006 0.7482-
0.7790
34.5 Sugar - - - 1089 0.004
Water - - - 998 0.001
62

0
5
10
15
20
25
30
35
40
45
0 50 100 150 200 250 300 350 400
Shea
r str
ess
(Pa)
Shear rate (s-1)
0.2% XG
fitted model
0.5% XG
Fig.4.3. Shear stress versus shear rate for xanthan solutions
4.3 Experimental Procedure
4.3.1 Mixing Time Measurements
The bioreactor with draft tube diameter of 0.22 m was first fitted with the cross shaped sparger
and the bottom clearance (BC) set at 0.003 and filled with tap water to a volume of 0.0579 m3.
The conductivity of the water was then measured using a conductivity probe and this value was
fed to the ERT system. Air was introduced through the system by the sparger at a superficial
velocity of 0.00165 m/s for about 25 seconds till steady state was reached. Mixing time
measurements were performed in the downcomer (annulus of the bioreactor) by the addition of
50 ml saline tracer (NaCl). Tracer injection was performed in the draft tube diameter at about 2
cm above the liquid level. Mixing was monitored by means of variations in average conductivity
signals that are generated by the ERT system. Once these changes in average conductivity of all
63

four planes of electrodes were less than 10% (Fig.4.4) data collection was discontinued. Gas
flow into the bioreactor was shut off and water was drained out. For the same superficial gas
velocity, the above procedure was repeated for two other bottom clearances (0.006 and 0.009 m).
This process was then repeated for four other superficial gas velocities (0.00331, 0.00471,
0.00667 and 0.00807 m/s) all in the 0.22 m diameter draft tube. For the second and third draft
tubes with internal diameters of 0.29 m and 0.34 m respectively, the above procedure was
repeated for all gas velocities and bottom clearance of 0.009 m using the cross shaped sparger.
The effect of the circular sparger was also evaluated by fitting it to the 0.29 m diameter draft
tube with a constant bottom clearance of 0.009 m for all gas velocities.
Mixing time measurement for 34.5% sugar, 0.2% and 0.5% XG solutions were performed in
draft tube with internal diameter of 0.29 m for all gas velocities but at a bottom clearance of
0.009 m using the cross shaped sparger configuration.
Mixing time is the time required to reach a certain steady state conductivity reading after the
injection of a tracer, usually with less than 10% deviation (Onken and Weiland, 1980).
100% (4.7)
Mixing time (degree of homogeneity) after the injection of a tracer into the riser is obtained in
the downcomer by the plot of ERT data (Fig.4.4).
Fig.4.4 shows the changes in the water conductivity with time at ugr = 0.00807 m/s in bioreactor
with draft tube diameter of 0.22 m and bottom clearance of 0.009 m after the injection of tracer.
Examining Fig.4.4 shows that there is no change in conductivity readings from 0 to about 26
seconds in the absence of a tracer.
64

0.3
0.32
0.34
0.36
0.38
0.4
0.42
0.44
0.46
0.48
0 20 40 60 80 100
Con
duct
ivity
(m
S/cm
)
Time (s)120
P1 MeanP2 MeanP3 MeanP4 Mean
tm =29sec
1%
Fig.4.4: The change in conductivity with time at Ugr = 0.00807 m/s in draft tube diameter of 0.22 m with a bottom clearance of 0.009 m (air-water system).
However, after the injection of tracer at about 26 seconds, electrodes of the ERT system picks up
the changes in conductivity readings until there is a certain level of homogeneity at time 55
seconds (less than 10% deviation of the conductivity readings) to determine the mixing time.
4.3.2 Gas Holdup Measurements
Due to the large diameter of the bioreactor used, a flat circular cover of about 0.385 m was
constructed to fit directly into the bioreactor. This cover had an extension of a cylinder up
directly in the middle of the cover to make readings of dispersion easier (Fig. 4.4). Gas Holdup
measurements were conducted using the height of dispersion method (Merchuk, 1990). The
bioreactor with draft tube of 0.22 m fitted with a cross shaped sparger was first used with the
bottom clearance set at 0.003 m. The bioreactor was then filled with tap water to the required
65

volume of 0.0579 m3 and the level or height of the liquid (hL) was recorded (Fig.4.5). Air was
then introduced through the system by the sparger at a superficial velocity of 0.00165 m/s till
steady state was reached. By visual inspection, the height of dispersion or liquid level (hD) due to
aeration was recorded and the gas flow was shut off. The above procedure was repeated for two
more bottom clearances (0.006 and 0.009 m). This process was then repeated for four other
superficial gas velocities (0.00331, 0.00471, 0.00667 and 0.00807 m/s) all in the 0.22 m diameter
draft tube. The draft tube diameters of 0.29 m and 0.34 m were fitted with the cross shaped
sparger, and the above procedure was repeated for all gas velocities and constant bottom
clearance of 0.009 m. Again for the second draft tube of 0.29 m the same set of experiments
were performed only this time using the circular shaped sparger.
Fig.4.5 Bioreactor setup for gas holdup measurements
66

Gas holdup measurements using 34.5% sugar solution, 0.2% and 0.5% XG solutions were
performed in the draft tube of 0.29 m fitted with the cross shaped sparger with the bottom
clearance set at 0.009 m for all five superficial gas velocities.
The overall or total gas holdup measureme : nt is
(4.8)
According to Chisit, 1989, the total gas holdup is related to the holdups in the riser and
downcomer, thus;
(4.9)
For internal loop airlift reactors without gas-liquid separator, the gas holdup in the downcomer is
reported (Chisiti, 1989) as;
0.9 (4.10)
Further, with the cross sectional areas of the riser and downcomer known (i.e. for draft tube
diameter of 0.22 m, Ad = 0.0878 and Ar = 0.038), equations (4.7-4.9) could be combined to yield
the following expression for gas holdup in the riser;
. . .
.. (4.11)
0.12580.1170
Gas holdup in the downcomer is then calculated using equation (4.10) from Chisit’s correlation
(1989).
With experimental data obtained from mixing time measurements and gas holdup, the following
parameters were calculated;
67

4.4. Calculation of Liquid Circulation Velocity
Liquid velocity was calculated using data obtained from circulation time tc (Fig4.6). The
circulation time is defined as the time taken for the tracer to circulate the draft tube (Blenke,
1979) or the time difference between adjacent conductivity peaks recorded (Onken and Weiland,
1980). The liquid circulation velocity was then calculated as follows (Schlotelburg et al., 1999);
1 (4.12)
0.3
0.32
0.34
0.36
0.38
0.4
0.42
0.44
0.46
0.48
0.5
0 20 40 60 80 100 120
Con
duct
ivity
(mS/
cm)
Time (s)
tc=11 s
Fig.4.6 Conductivity versus time at Ugr=0.00165 m/s in draft tube diameter of 0.29 m at 0.009 m bottom clearance on plane 1 of ERT system (air-water system) using circular shaped sparger.
Fig.4.5 shows the change in water conductivity with time at Ugr = 0.00165 m/s in draft tube
diameter of 0.29 m for a bottom clearance of 0.009 m after the injection of tracer. The graph
68

represents the circulation time of the tracer. The 4 planes response time for the ERT electrode
system was short and gave constant readings. Therefore, only plane 1 of the ERT electrode
system was used for circulation time measurements. A similar method was used by Shi et al.,
1990.
4.5 Calculation of Shear rate
The definition of shear stress previously employed (Merchuk and Berzin, 1995) was modified for
airlift (Grima et al., 1997). Knowledge of energy dissipation rate and fluid residence time in each
o calculate the shear rate in that zonezone is used t .
(4.13)
where , , , , and values of shear stresses in the downcomer, energy dissipation rate
downcomer, height of liquid level, volume of liquid and specific interfacial area for bubbles all
in the downcomer respectively.
(4.14)
Yomoshimoto et al., 2007 proposed the following equation for specific interfacial areas for
bubbles; where is the viscosity of the fluid
323 . (4.15)
Fina
lly the shear rate for Newtonian fluids (water and sugar solution) is calculated as;
(4.16)
69
Shear rate calculations were performed using average values of the various parameters needed
(ie. gas holdup, circulation time, liquid circulation velocity).
In the case of the non Newtonian xanthan gum solutions which obey the Herschel Bulkley model
(Herschel Bulkley, 1926), the shear rate is calculated using the following equation;
(4.17)
All experiments were repeated three times (expect for xanthan gum solutions) and each result is
an average from three mixing time values. The error bars representing standard deviations
indicate the spread of the mixing time about the mean value for water and 34.5% sugar solutions.
The maximum standard deviation was 2, confirming the high accuracy of the ERT system for
mixing time measurements.
Generally, the standard deviation is defined as:
∑ (4.18)
Where s is standard deviation; N denotes the number of samples taken; x represents the value of
the mixing time; and is the average value of the mixing time.
4.6 Experimental Conditions
The experiments were performed at room temperature between at 21 (±1 ºC). As summarized in
Table 4.2, the working fluids were Newtonian fluids represent by tap water (ρ = 998 kg/m3; μ =
0.001 Pa·s, =0.0724 kg/s2; Okada et al. 1995), salt solution (5M NaCl), 34.5% coalescing sugar
solution and non-Newtonian fluids represented by XG solutions of 0.5% and 0.2%. The tracer
70

was 50 mL of 5M NaCl solution for each test. The tracer injection was performed by a single
syringe and the injection point was in the riser (inside the draft tube) whiles results from ERT
were obtained in the downcomer (annulus).
Table 4.2 Experimental conditions
Setup 1 Setup 2 Setup 3
Dd (m) 0.22 0.29 0.34
Ad/Ar 2.31 0.90 0.38
BC (m) 0.003,0.006,0.009 0.009 0.009
Air-water Air-water
System Air-water 34.5% Sugar
0.2, 0.5% XG
Cross shaped Sparger Configuration Cross shaped Cross shaped
Circular shaped
71

CHAPTER 5
RESULTS AND DISCUSSION
5.1 Mixing Time
The effect of gas flow rate, bottom clearance, draft tube diameter, sparger configurations and
fluid viscosity on mixing time, liquid circulation velocity, gas holdup and shear values were
examined. Experiments were conducted using three different bottom clearance (BC= 0.003,
0.006 and 0.009 m), and five different superficial gas velocity in riser, (Ugr = 0.00165-0.00807
m/s). The ratio between downcomer and riser cross sectional areas (Ad/Ar) were varied between
2.31 - 0.38 for draft tube with internal diameter of 0.22, 0.29 and 0.34 m respectively.
5.1.1 Effect of Gas Flow Rate and Bottom Clearance
Mixing time studies is of particular importance in a typical fermentation media to prevent
formation of products outside cells within the fermentation broth which compromises product
quality. Supply of nutrients and oxygen takes place within cells in the fermentation broth
therefore; once mixing is completed products begin to form out of the cells. And also for the mix
of solids, segregation may occur as a result of excessive mixing. Fig.5.1.1 shows the effects of
superficial gas velocity in the riser (Ugr) on mixing time at different bottom clearances (0.003,
0.006, and 0.009 m) with a draft tube diameter of 0.22 m. Results in Fig.5.1.1 demonstrates that
the mixing time decreased with the increase in superficial gas velocity in the riser for all different
bottom clearances examined. The decrease in tm with increasing Ugr occurs as a result of the
increase in turbulence in the bioreactor. This may be attributed to the fact that an increase in Ugr
72

corresponds to an increase in energy generated, resulting in an increase in gas holdup which
creates a higher driving force for liquid circulation velocity. It is interesting to note that at a
higher gas flow rate, the effect of Ugr on mixing is not as efficient since the mixing time becomes
a plateau (Fig.5.1.1). It has been established that the specific power input increases when
superficial gas velocity increases (Chang et al., 1993). An increased specific power input without
significantly improving mixing suggests that selecting a proper aeration rate is important for
bioreactor. A higher gas flow rate consumes more energy but does not necessarily improve
mixing. On the other hand, higher gas flow rate may cause higher shearing which perhaps cause
damages to microorganisms during fermentation.
Fig.5.1.1 also shows mixing time (tm) at various bottom clearances (BC). According to this
Figure, tm, decreases as the BC increases. It is within the bottom clearances that the moving
liquid from the downcomer makes a ‘u-turn’ into the riser. This can be explained based on the
fact that as these distances shortens; the greater is the impedance to the liquids momentum
caused by a loss of kinetic energy and hydraulic friction (Petersen and Margaritis, 2001; Luo and
Dahhan, 2008). This observation is in agreement with results obtained by Gavrilescu and
Tudose, 1999; Gouveia et al. (2003); Luo and Dahhan, 2008. The above results are clearly in
agreement with Bando et al. (1998) who also reported that mixing time decreased as the bottom
clearance increased. However, for a larger bottom clearance, part of the gas from the sparger can
get directly into the downcomer if the sparger is not placed properly which reduces the driving
force and liquid velocity.
73

25
30
35
40
45
50
55
0 1 2 3 4 5 6 7 8 9
t m(s
)
Ugr x103 (m/s)
BC= 0.003m
BC= 0.006m
BC= 0.009m
Fig.5.1.1 Effect of bottom clearance (BC), on mixing time for all three bottom clearances in draft tube diameter of 0.22 m (air-water system) using cross shaped sparger configuration.
5.1.2 Effect of Draft Tube Diameter
In Fig.5.1.2, comparisons of mixing time using different draft tube diameters (0.22, 0.29, 0.34 m)
are shown as a function of superficial gas velocity in the riser (Ugr) with bottom clearance fixed
at 0.009 m using the cross shaped sparger. The results in Fig.5.1.2 clearly demonstrate decrease
in mixing time with the increase in draft tube diameter. The increase in draft tube diameter
results in lower ratio of Ad/Ar, i.e. a decrease in cross sectional area of the downcomer with
higher circulation rates. This indicates that an increase in draft tube diameter improves the
mixing time and circulation in the downcomer, which enhances the entrainment of gas at a faster
rate. This could be attributed to the fact that restrictions of flow are encouraged by small Ad/Ar
74

ratio (Gavrilescu and Tudose, 1999). These results are in agreement with results previously
published by Mehrnia et al., 2004.
10
15
20
25
30
35
40
45
50
0 1 2 3 4 5 6 7 8 9
t m(s
)
Ugrx103 (m/s)
Ad/Ar=0.38
Ad/Ar=0.90
Ad/Ar=2.31
Fig.5.1.2. Effect of draft tube diameter on mixing time at BC = 0.009 m (air-water system) using cross shaped sparger configuration.
5.1.3 Effect of Sparger Configurations
Fig.5.1.3 represents the effect of sparger configurations on mixing time for different superficial
gas velocity (Ugr) in a draft tube with diameter of 0.29 m fixed at bottom clearance of 0.009 m.
As shown in Fig.5.1.3, mixing time was lower for the cross shaped sparger configuration than
the circular sparger. Mixing time decreased to about 40% in air-water media using the cross
shaped sparger. It should also be noted that mixing time shows a steeper decrease in the low
75

range of superficial gas velocity, followed by a milder decrease as Ugr gets higher for both
sparger configuration.
Fig.5.1.3. Effect of sparger configuration on mixing time at BC = 0.009 m in draft tube diameter
of 0.29 m (air-water system).
20
25
30
35
40
45
50
55
0 1 2 3 4 5 6 7 8 9
t m(s
)
Ugr x103 (m/s)
circular
cross shaped
Nonetheless, as Ugr increased from 0.00607 m/s the effect of the configuration was minimal and
would probably diminish in the heterogeneous regime. In the heterogeneous regime, mixing is
turbulent consisting bubbles of varying sizes. In this case, the gas holdup is low, since, too many
large bubbles tend to occupy the entire volume of the reactor and would encourage bubble
coalescence subsequently limiting mass transfer rates. This shows that the cross shaped sparger
76

had produced a greater density difference between the riser and downcomer resulting in greater
mixing efficiency at lower superficial gas velocities.
5.1.4 Effect of Fluid Viscosity
The influence of fluid viscosities on mixing time in a 0.29 m draft tube diameter using cross
shaped sparger is shown in Fig.5.1.4. Different fluid systems of different viscosities were
examined here, which include Newtonain solutions (water and solution containing 34.5% sugar),
and non- Newtonian solutions (0.2% and 0.5% xanthan gum). It is evident from Fig.5.1.4 that
mixing time in less viscous Newtonian fluids (water and 34.5% sugar solution) is lower than that
in highly viscous non-Newtonian fluids (0.2% and 0.5% xanthan gum solutions). The effect of
viscosity on mixing time is significant especially in the case of the viscous non-Newtonian
xanthan gum solutions as shown in Fig.5.1.4. Although results of mixing time for water and
sugar solution are not as appreciable as in the case of xanthan gum, there is a reduction in mixing
time observed for 34.5% sugar solution. This is attributed to the occurrence of bubble
coalescence behavior of sugar solution (Prince and Blanch, 1990). As gas is introduced into the
bioreactor, bubbles begin to form and coalesce reducing gas holdup leading to a reduced driving
force for liquid circulation velocity and mixing time. For xanthan gum solutions of 0.2% and
0.5%, mixing time significantly decreased as a result of increased viscosity. This increased fluid
viscosity drag hinders the liquid circulation (Fields et al.1984) which results in an increase in
mixing time. The friction factor is substantially lower and this drag reduction (friction) usually
increases with the flow rate and xanthan gum molecular weight (Fields et al. 1984).
77

0
500
1000
1500
2000
2500
3000
0 1 2 3 4 5 6 7 8 9
t m(s
)
Ugrx103 (m/s)
water
34.5% sugar
0.2% XG
0.5% XG
Fig.5.1.4. Effect of liquid viscosity on mixing time at BC = 0.009 m and draft tube diameter of 0.29 m for cross shaped sparger configuration.
5.2 Liquid Circulation Velocity
5.2.1 Effect of Gas Flow Rate and Bottom Clearances
The liquid circulation velocity is the primary hydrodynamic parameter differentiating the draft
tube airlift bioreactors from bubble columns due to the continuous recirculation of liquid. The
liquid circulation velocity in the airlift bioreactors depends on the geometry of the bioreactor.
Liquid circulation velocity versus superficial gas velocity data for three bottom clearances (BC=
0.003, 0.006, 0.009 m) in draft tube diameter of 0.22 m using cross shaped sparger configuration
is shown in Fig.5.2.1.
78

0.05
0.07
0.09
0.11
0.13
0.15
0 1 2 3 4 5 6 7 8 9
Uld
(m/s
)
Ugrx103 (m/s)
BC= 0.003m
BC= 0.006m
BC= 0.009m
Fig.5.2.1 Effect of bottom clearance on liquid velocity for all three clearances in draft tube diameter of 0.22 m (air-water system) using cross shaped sparger configuration.
The results in Fig.5.2.1 show liquid circulation velocity increases with increasing gas velocity.
This can be explained based on that an increase in gas flow increases the difference in the gas
holdup which is the driving force for liquid circulation velocity. Trends of the liquid velocity
have similar shapes but different magnitudes (Fig.5.2.1). Also, increasing the BC increases the
liquid velocity (Fig 5.2.1), as a result of the fact that by varying BC, the pressure drop at the
bioreactor bottom is strongly affected. When the free area for liquid flow between the bottom
plate and the draft-tube is very constrained, changes in the bottom clearance have strong
influence on pressure drop.
79

5.2.2 Effect of Draft Tube Diameter
Fig.5.2.2 shows the comparison between the different liquid circulation velocities at different
superficial gas velocities for three different draft tube diameters (0.22, 0.29, 0.34 m) fixed at a
bottom clearance of 0.009 m using cross shaped sparger configuration. Fig.5.2.2 clearly
demonstrates that liquid circulation velocity is increased for draft tubes of higher diameters. An
increase in draft tube diameter results in a lower ratio of Ad/Ar (i.e., higher cross sectional ratio in
the riser with less circulation velocity). With a ratio of less than 1 of Ad/Ar, (for draft tube
diameter of 0.29 m), the downcomer cross sectional area is less than that for the riser. Thus, the
liquid velocity in the riser is less due to its wider cross sectional area; therefore there is higher
gas residence time in the riser.
0
0.05
0.1
0.15
0.2
0.25
0 1 2 3 4 5 6 7 8
Uld
(m/s
)
Ugrx103 (m/s)
9
Ad/Ar= 0.38
Ad/Ar= 0.90
Ad/Ar= 2.31
Fig.5.2.2 Effect of draft tube diameter on liquid circulation velocity for BC = 0.009 m (air-water system) using cross shaped sparger configuration.
80

The downcomer liquid velocity is increased due to the decrease in cross-sectional area of the
downcomer. Tobajas et al. (1999) employed a rectangular split airlift and found that the liquid
circulation in the downcomer and mass transfer coefficient increased with decreasing cross
sectional ratios.
5.2.3 Effect of Sparger
In Fig.5.2.3 the influence of sparger configuration on liquid circulation velocity versus
superficial gas velocity in a draft tube diameter of 0.29 m, at a bottom clearance of 0.009 m is
shown. An increase in liquid circulation velocity is observed between the data corresponding to
the cross shaped sparger configuration. This is because the cross shaped sparger produced a
uniform distribution of the gas in the riser than its counterpart the circular shaped sparger. This is
attributed to a higher disengagement (due to lower rise velocity of gas bubbles) of gas into the
downcomer due to even distribution of gas creating a higher driving force for fluid to circulate in
the bioreactor. By visual inspection, the circular shape sparger creates a poor distribution of the
gas in the riser with a tendency to coalescing bubbles, resulting in a reduced driving force for
liquid recirculation in the bioreactor.
81

0.06
0.08
0.1
0.12
0.14
0.16
0.18
0 1 2 3 4 5 6 7 8 9
Uld
(m/s
)
Ugr x103 (m/s)
circular
cross shaped
Fig.5.2.3 Effect of sparger configuration on liquid circulation velocity, BC = 0.009 m in draft tube diameter of 0.29 m (air-water system).
5.2.4 Effect of Fluid Viscosity
In Fig.5.2.4 the influence of different fluids at varying viscosities (water, 34.5% sugar solution,
0.2% and 0.5% xanthan gum solutions) on liquid circulation velocity versus superficial gas
velocity in a draft tube diameter of 0.29 m, fixed at a bottom clearance of 0.009 m using cross
shaped sparger configuration is compared. Fig.5.2.4 shows that the liquid circulation velocity
decreases with the increase in fluid viscosity. This phenomenon could be attributed to increased
fluid viscous drag which hinders liquid circulation of xanthan gum (Fields et al. 1984). The flow
behavior of xanthan gum is different from that of water and sugar solutions. The friction factor is
substantially lower and this drag reduction (friction) usually increases with the flow rate and
xanthan gum molecular weight (Fields et al. 1984). An increase in viscosity diminishes the
82

bubble rise velocity, hence hinders the escape of bubbles in the downcomer (Onken and
Weiland, 1981). This leads to a high gas hold-up in the downcomer resulting in a reduced
difference in mean density between the riser and downcomer. With the above factors influencing
the driving force for liquid circulation, less energy is left to accelerate the fluid.
0.01
0.03
0.05
0.07
0.09
0.11
0.13
0.15
0.17
0.19
0 1 2 3 4 5 6 7 8 9
Uld
(m/s
)
Ugr X103m/s)
water
34.5% sugar
0.2% XG
0.5% XG
Fig.5.2.4. Effect of liquid viscosity on liquid circulation velocity at BC = 0.009 m in draft tube diameter of 0.29 m (air-water system) for cross shaped sparger configuration.
83

5.3 Gas Holdup
5.3.1 Effect of Gas Flow Rate and Bottom Clearance
Fig.5.3.1 represents the effects of gas flow and bottom clearances in draft tube diameter of 0.29
m. It is evident from this Figure that gas holdup values significantly increased with increasing
gas flow rate. Results obtained are in agreement with previously reported results in the literatures
(Chisti, 1998; Gavrilescu and Tudose, 1999; Gouveia et al., 2003). As the gas flow rate is
increased more bubbles are produced which results in an increase in gas holdup. At lower gas
input (i.e. 0.00165-0.00331 m/s); homogenous gas bubbles existed resulting in a lower gas
holdup accounting for a bubbly flow regime. Moreover, as the gas flow rate increased, this
homogenous dispersion turns into a heterogeneous regime with the formation of larger gas
bubbles. For a typical aerobic fermentation, operations in the heterogonous regime is not
desirable as the gas-liquid interfacial area for mass transfer rate is reduced and the gas residence
time shortened due to the increasing velocity of larger bubbles.
Gas holdup in the system is largely controlled by the liquid circulation velocity as it carries the
bubbles down into the downcomer. The recorded gas holdups indicate that the gas holdup
increases as the bottom clearance decreases (Fig 5.3.1) as a result of the decreasing liquid
velocity (Fig.5.2.1). This may be due to the fact that a decrease in the liquid velocity results in
more gas being retained in the downcomer as opposed to being disengaged at the top of the
bioreactor.
84

Fig.5.3.1 Effect of gas flow rate and bottom clearances on gas holdup in a draft tube diameter of 0.22 m and BC = 0.009 m (air-water system) using cross shaped sparger.
0.01
0.02
0.03
0.04
0.05
0.06
0.07
0.08
0.09
0.1
0 2 4 6 8
ε gd
(-)
Ugrx103 (m/s)
BC= 0.003m
BC= 0.006m
BC= 0.009m
5.3.2 Effect of Draft Tube Diameter
A comparison of gas holdup values for three draft tube diameters fixed at a bottom clearance of
0.009 m is presented in Fig.5.3.2. The results in Fig.5.3.2 demonstrate increases in gas holdup
with decreasing Ad/Ar ratio. With the increase in the draft tube diameter, (i.e. decreasing Ad/Ar
ratio), there is a decrease in flow resistance which enhances more gas entrainment to the
downcomer. The larger the draft tube diameter, the less resistance and more flow will entrain
into the downcomer. The decrease in flow resistance with decreasing values of Ad/Ar ratio
improves the entrainment of gas bubbles into the downcomer and thus the values of gas holdup
in the downcomer increases. These results show the influence of Ad/Ar ratio as a principal
85

geometry which influences the friction in the airlift bioreactor (Chisti, 1989; Gavrilescu and
Tudose, 1999; Gouveia et al., 2003).
0
0.02
0.04
0.06
0.08
0.1
0.12
0.14
0 1 2 3 4 5 6 7 8
ε gd
(-)
Ugrx103 (m/s)
9
Ad/Ar= 0.38
Ad/Ar= 0.90
Ad/Ar= 2.31
Fig.5.3.2 Effect of draft tube diameter on gas holdup for BC = 0.009 m (air-water system) using cross shaped sparger configuration.
5.3.3 Effect of Sparger
In Fig.5.3.3 the combined effects of gas flow and sparger configurations in a draft tube diameter
of 0.29 m fixed at a bottom clearance of 0.009 m are shown. As expected, an increase in gas flow
confirms the production of more bubbles for gas holdup values. The results also show increase in
gas holdup values for the cross shaped sparger configuration. The differences in the gas holdup
values for the two sparger configurations can be explained by visual observation, where the cross
shaped sparger configuration gives an approximately even distribution of the gas in the riser, as
86

compared to the circular shaped sparger. For an increase in gas holdup, the liquid circulation
velocity gets lower. The lower liquid circulation velocity in the downcomer with the circular
shaped sparger (Fig.5.2.3) should result in an increase of bubble entrainment into the
downcomer. However, this was not the case; which can be explained by the coalescence of
bubbles due to uneven distribution by the circular shaped sparger. Moreover, the cross shaped
sparger with higher liquid circulation velocity produced evenly distributed bubbles enhancing the
entrainment which resulted in higher gas hold up values.
0.02
0.03
0.04
0.05
0.06
0.07
0.08
0.09
0.1
0 1 2 3 4 5 6 7 8 9
ε gd
(-)
Ugr x 103 (m/s)
circular
cross shaped
Fig.5.3.3 Effect of sparger configuration on gas holdup at BC = 0.009 m in a draft tube diameter of 0.29 m (air-water system).
87

5.3.4 Effect of Liquid Viscosity
The effects of fluid viscosity on gas hold up in draft tube diameter of 0.29 m are shown in
Fig.5.2.4. It can be seen that viscosity has a significant influence on gas holdup results. The
highest gas holdup values were recorded in water and sugar solutions because of their low
viscosity. For such Newtonian fluid with low viscosity, numerous small bubbles with low
ascending velocity were produced, leading to an increased residence time of gas in the
bioreactor. Consequently, the gas hold-up was higher at lower viscosities.
Fig.5.3.4. Effect of liquid viscosity on gas holdup at BC = 0.009 m in draft tube diameter of 0.29 m (air-water system) using a cross shaped sparger configuration.
0.01
0.03
0.05
0.07
0.09
0.11
0.13
0 1 2 3 4 5 6 7 8 9
ε gd
(-)
Ugr x103 (m/s)
water34.5% sugar0.2% XG0.5% XG
88

Conversely, in the viscous non Newtonian coalescing fluids (i.e., 0.2% and 0.5% xanthan gum
solutions), intensive bubble coalescence increases the bubble rise velocity leading to a shorter
gas residence time, and consequently, gas hold-up decreased with increasing viscosity.
The bubble coalescence results from inefficient gas radial dispersion as reported by Poggeman et
al. (1983). At any superficial gas velocity in viscous fluids, gas from the sparger does not
disperse uniformly radially. Therefore the bubbles tend to accumulate in the space above the
sparger resulting in high bubble concentration which increases the bubble coalescence
(Poggeman et al., 1983).
In a real fermentation using xanthan gum (Olivier and Oosterhuis, 1988), the bubble coalescence
was strongly enhanced by increasing xanthan concentrations similar to the results in the present
work. From Fig.5.3.4, it is clear that in the range of fluid viscosities examined, bubble
coalescence is enhanced at higher viscosity, probably by poor radial gas dispersion and a
decrease in liquid circulation velocity (Fig.5.2.4). These observations and results are in
agreement with results reported by Wen et al. (2005), Onken and Weiland (1980) and Fields et
al. (1984).
5.4 Shear Rate In most chemical processes, the shear rate is of no significance by itself except as a means of
increasing the heat and mass transfer properties (Cerri et al., 2007). However, for any
fermentation processes, the shear rate is important. Higher shear stress may damage fragile cells
leading to the loss of productivity. Shear rate has had important implications in cultures
involving filamentous microorganisms, animal and plant cells (Chisti and Moo Young, 1986).
89

5.4.1 Effect of Gas Flow Rate and Bottom Clearance
The combined effects of bottom clearances and gas velocity on shear rates in draft tube diameter
of 0.22 m at bottom clearances of 0.006, 0.009 m are shown in Fig.5.4.1 using the cross shaped
sparger. Generally, the shear rates increased as the gas velocity is increased as shown in
Fig.5.4.1. This is mainly because more energy is dissipated which can be turbulent to reticulate
the fluid in the bioreactor.
18710
18730
18750
18770
18790
18810
18830
18850
18870
18890
0 2 4 6 8
(s-1
)
Ugr x103 (m/s)
BC= 0.009m
BC= 0.006m
Fig.5.4.1 Effect of gas flow on shear rate for draft tube diameter of 0.22 m at two bottom clearances (air-water system) using cross shaped sparger configuration.
Also results in Fig.5.4.1 indicate that an inverse relationship between the bottom clearances and
shear rate can obviously be observed. According to this Figure, a decrease in bottom clearance
corresponds to an increase in shear rate values. This is due to impedance to flow restriction
90

caused by the shorter distance between the bioreactor bottom and draft tube. At lower superficial
gas velocities, the effect of bottom clearance was insignificant on the shear rate. The above
observations are in agreement with those reported by Merchuk and Berzin (1995) and Luo and
Dahhan (2008).
5.4.2 Effect of Draft Tube Diameter
Fig.5.4.2 displays the effects of superficial gas velocity in the riser (Ugr) on shear rate in different
draft tube diameters (0.22, 0.29, 0.34 m) fixed at a bottom clearance of 0.009 m using cross
shaped sparger. Results in Fig.5.4.2 indicate that the shear rate is higher for a lower Ad/Ar ratio.
For a decrease in cross sectional area (i.e. and increase in draft tube diameter) it is known that
liquid circulation velocity is higher (Gavrilescu and Tudose, 1999; Gouveia et al., 2003) thus
increasing the shear rate. However, in draft tube diameters of 0.22 m and 0.29 m, shear rate
values are almost the same. This could be because the increase in liquid circulation velocity in
these bioreactor setups did not vary as much as that of the 0.34 m draft tube diameter.
91

18600
18700
18800
18900
19000
19100
19200
19300
0 1 2 3 4 5 6 7 8 9
(s-1
)
Ugrx103 (m/s)
Ad/Ar= 0.38
Ad/Ar= 0.90
Ad/Ar= 2.31
Fig.5.4.2 Effect of draft tube diameter on shear rate at BC= 0.009 m (air-water system) using cross shaped sparger configuration.
5.4.3 Effect of Sparger
Fig.5.4.3 compares the influence of sparger configuration on the profile of shear rates versus
superficial gas velocity in a draft tube diameter of 0.29 m, at a bottom clearance of 0.009 m. The
result shows an increase in shear rate for both configurations as gas flow is increased. Moreover,
the circular shaped sparger resulted in the higher shear rate attributed to an increase in bubble
coalesce produced in the circular shaped sparger. Results show 20% reduction in shear rate
values using the cross shaped sparger configuration. The results suggest that for a sparger
configuration which encourages bubble coalescence, the interfacial area for mass transfer is
reduced. The shear in airlift bioreactors occurs mainly in the vicinity of the gas liquid interface.
92

Therefore, the shear rate is negatively affected by the bubble coalescence as gas velocity
increases. Therefore, the shear rate is negatively affected by the bubble coalescence as gas
velocity increases. Contreras et al., 1999 reported similar results for shear rate values using
different spargers.
Fig.5.4.3 Effect of sparger configuration on shear rate at BC = 0.009 m in draft tube diameter of 0.29 m (air-water system)
18725
18735
18745
18755
18765
18775
18785
18795
18805
0 1 2 3 4 5 6 7 8 9
(s-1
)
Ugr x103 (m/s)
circular
cross shaped
5.4.4 Effect of Liquid Viscosity
Fig.5.4.4 demonstrates the effect of varying fluid viscosities (water, 34.5% sugar solution, and
0.2% and 0.5% xanthan gum solutions) on shear rate versus superficial gas velocity in a draft
tube diameter of 0.29 m. According to Fig.5.4.4, the shear rate decreased with increasing fluid
viscosity. By increasing the fluid’s viscosity the liquid circulation velocity can be lowered
(Fig.5.2.4). It is also clear that the energy dissipation is decreases with increasing fluid viscosity,
93

causing to decrease the shear rate. Trends or increase in shear rate values in the downcomer is
usually minimal. This observation is in agreement with results obtained by Grima et al., 1997.
Results obtained from xanthan gum solutions (shear rate 50-500 s-1) are well within the range for
animal cell culture cultivation (Grima et al., 1997).
0
2000
4000
6000
8000
10000
12000
14000
16000
18000
20000
0 1 2 3 4 5 6 7 8 9 1
(s-1
)
Ugr x103 (m/s)
0
water
34.5% sugar
0.2% XG
0.5% XG
Fig.5.4.4. Effect of liquid viscosity on shear rate at BC= 0.009 m in draft tube diameter of 0.29 m using cross shaped sparger configuration.
94

CHAPTER 6
CONCLUSIONS AND RECOMMENDATIONS
6.1 Conclusions
ERT provides a powerful means for non-invasive measurements of fluid mixing parameters in
the airlift bioreactor. The investigations performed for all parameters reveal that increasing the
superficial gas velocity, (Ugr) corresponds to an increase in energy generated. This results in an
increase in gas holdup which creates a higher bulk density difference (higher driving force) for
liquid circulation velocity. This improves the gas-liquid separation at the top of the bioreactor
and therefore, enhances turbulence which further enhances mixing.
The experimental results of mixing parameters such as: the mixing time, liquid circulation
velocity, gas holdup, and shear rate revealed that geometric parameters are important factors that
affect these mixing characteristics. Experimental results for bottom clearances and ratios of cross
sectional areas of downcomer and riser (Ad/Ar) revealed that at these geometries, and depending
on their flow resistance, the loss of kinetic energy and friction impacts the mixing characteristics.
For a shorter bottom clearance, the greater impedance to the fluids movement results in higher
friction losses.
The effect of sparger configuration is significant for mixing time and hydrodynamic parameters
(gas holdup and liquid circulation velocity). Apparently, this is attributed to an even bubble
distribution produced by the cross shaped sparger, resulting in an increase in driving force for
liquid circulation velocity and hence shortened and enhanced mixing times. The even
95

distribution of bubbles prevents bubble coalescence which reduces mass transfer rates. However,
the effect of the sparger on shear rate is not as significant.
The effects of fluid viscosity on mixing time, liquid circulation velocity, gas holdup, and shear
rate were significant. Increased viscosity caused an increase in the circulation path flow
resistance and increased the fluid viscous drag, thus reducing liquid circulation velocity and
hence increasing mixing time. For both sugar and xanthan gum solutions, larger numbers of gas
bubbles were formed with low bubble rise velocities resulting in a decrease for driving force for
liquid circulation velocity. Shear rate values corresponding to typical shear rate range up to
6000s-1 for viscous fluids were recorded, although much higher values were noted for less
viscous media (water).
96

6.2 Recommendations
It is worthy to point out that all measurements were made in the downcomer (annulus of the
bioreactor), for future studies to enhance our knowledge of the bioreactor system using this non
invasive ERT technique, experiments could be performed in the split cylinder airlift bioreactor.
This type of bioreactor affords ERT measurements both in the riser and downcomer regions.
Although it is known that various mixing parameters and shear rates are of magnitudes higher in
the riser than in the downcomer, ERT measurements of both regions would support these
findings and predictions.
To validate the ERT system, further studies to include the churn and heterogeneous regimes
could be performed and results could then be correlated for the various liquid circulation
velocities. Computational fluid dynamics (CFD) modeling can be recommended. CFD analysis
can be used to simulate and validate the mixing processes.
97

NOMENCLATURE
Ab cross sectional area for flow under baffle or draft tube (m2)
Ad cross sectional area of downcomer (m2)
Ar cross sectional area of riser (m2)
Ad/Ar ratio of cross sectional area of downcomer and riser
Bo Bodenstein number
c initial tracer concentration (kg/m3)
c∞ mean or final concentration of tracer (kg/m3)
Dc column diameter (m)
Dd draft diameter (m)
Ds gas separator diameter (m)
Ez axial dispersion coefficient
Fr froude number (-)
g gravitational acceleration (m/s2)
H height of bioreactor (m)
hL height of gas free liquid (m)
hd height of draft tube (m)
98
hD height of gas liquid dispersion (m)
ht draft tube height (m)
K consistency index (Pa sn)
KB frictional co-efficient at the bottom
KT frictional co-efficient at the top
KLa volumetric mass transfer coefficient (m-1)
Lc circulation length (m)
Mo Morton number
n flow behavior index
Pe peclet number
s standard deviation
tc circulation time (s)
tm mixing time (s)
TC top clearance (m)
Ug superficial gas velocity (m/s)
Ugr superficial gas velocity in riser (m/s)
Ul circulation liquid velocity (m/s)
99

Usb bubble swarm velocity (m/s)
Usp particle swarm velocity (m/s)
z axial dispersion distance in reactor (m)
Greek Symbols
εg gas holdup
εgr gas holdup in riser
εgd gas holdup in downcomer
εs solid loadings (-)
µL viscosity of liquid (Pa.s)
ρs density of solids (kg/m3)
ρL density of liquids (kg/m3)
τm dimensionless time
τ shear stress (N/m2)
shear rate (s-1)
σ surface tension (N/m)
100

ABBREVIATION
ADC analogue to digital converter
ADM axial dispersion model
ALR airlift reactor
API active pharmaceutical ingredient
BAS biofilm activated sludge
BC bottom clearance (m)
BDS biodesulphurization
BHb bovine hemoglobin
BSA bovine serum albumin
CAT computer axial tomogoraphy
CARPT computer automated radioactive particle tracking
CFD Computational fluid dynamics
CMC carboxyl methyl cellulose
COD chemical oxygen demand
DAC digital to analogue converter
DAS data acquisition system
101

DTAB draft tube airlift bioreactor
EIFBAB external loop inverse fluidized bed airlift bioreactor.
ECT electrical capacitance tomography
EIT electrical impedance tomography
EMT electromagnetic tomography
ERT electrical resistance tomography
GAC granular activated carbon
GFM grounded floating measurements
GO glucose oxidase
HFP helical flow promoter
SNR signal to noise ratio
VCCS voltage current converter source
XG xanthan gum
102

REFERENCE
Abdullah MZ (1993) Electrical impedance tomography for imaging conducting mixtures in
hydrocyclone separators PhD Thesis University of Manchester.
Aleksieva P, Peeva L (2000) Investigation of acid proteinase biosynthesis by the fungus
Humicola lutea 120-5 in an airlift bioreactor. Enzym. Microb. Technol., 26: 402–405.
Al-Masry, WA (2001) Gas holdup in circulating bubble columns with pseudoplastic liquids.
Chem. Eng. Technol., 24: 71–76.
Allen DG, Robinson CW (1990) Measurements rheological properties of filamentious
fermentation broth. Chem. Eng. Sci. 45: 37-48.
Aoyama Y, Ogushi K, Koide K, Kubota H (1968) Liquid mixing in concurrent bubble column. J.
Chem. Eng. Jpn., 1: 158-163.
Bando Y, Nishimura M, Sota H, Suzuki S, Kawase N (1992). Flow characteristics of counter
current bubble column with perforated draft tube. Chem. Eng. Sci., 47: 3371-3378.
Bando Y, Hayakawa H, Nishmura M (1998) Effects of equipment dimensions on liquid mixing
time on bubbles column with draft tube. The society of Chem. Eng. Jpn., 31: 765-770.
Bao J, Koumatsu K, Furumoto K, Yoshimoto M, Fukunaga K Nakao K (2004) Deactivation
kinetics of immobilized glucose oxidase for production of calcium gluconate in an external loop
airlift bioreactor. Biochem. Eng. J., 22: 33–41.
103

Barber CD, Brown BH, Freeston IL (1983) Imaging spatial distributions of resistivity using
applied potential tomography. Electron. Lett., 19: 933-935.
Bello RA, Robinson CW, Moo-Young M (1984) Liquid circulation and mixing characteristics of
airlift contactors. Can. J. Chem. Eng., 62: 573-577.
Bello RA, Robinson CW, Moo-Young M (1985) Gas holdup and overall volumetric oxygen
transfer co-efficient in airlift contactors. Biotechnol. Bioen., 27: 369-381.
Bendjaballah N, Dhaouadi H, Poncin S, Midoux N, Hornut JM, Wild G (1999) Hydrodynamics
and flow regimes in external loop airlift reactors. Chem. Eng. Sci., 54: 5211-5221
Blazej M, Kisa M, Markos J (2004) Scale influence on the hydrodynamics of an internal loop
airlift reactor. Chem. Eng. and Proces., 43: 1519-1527.
Blenke H (1979) Loop reactors. Adv. Biochem. Eng., 13: 121-214.
Brown BH, Barber DC, Wang W, Lu L, Leathard LH, Smallwood RH, Hampshire AR, Mackay
R, and Hatzigalanis K (1994) Multi-frequency imaging and modelling of respiratory related
electrical impedance changes. Physiol. Meas., A 15:1-12.
Brown BH and Seagar AD (1985) The sheffield data collection system. Clin. Phys. Physiol.
Meas., A 8: 91-97.
Bruun H (1996) Hot-film anemometry in liquid flows. Meas. Sci. Technol. 7: 1301–1312.
Bryant J (1976) The Characterization of mixing in fermenters. Adv. Biochem., 5: 101-123.
104

Bonakdarpour B, McManamey WJ, Thayanithy K, Bartlett G (1994) Development of a flow
follower method for the measurement of liquid circulation and mixing inside airlift fermenters.
Inst. of Chem. Eng. Sympos.; Series- Adv Biochem. Eng., 157-159.
Cerri MO, Futiwaki L, Jesus CDF, Cruz AJG, Bandino AC (2007) Average shear rate for non
Newotonain fluids in a concentric tube airlift bioreactor. Biochem. Eng. J., 39: 51-57.
Cai J, Nieuwstad TJ (1999) Hydrodynamic modelling and blankrunning of a pilot scale internal
loop airlift reactor for wastewater treatment. Envioron. Technol., 12: 637-653.
Carreau PJ, Patterson I, Yap CY (1976) Mixing viscoelastic fluids with helical-ribbon agitators.
Can. J. Chem. Eng., 54: 135-142.
Caspeta L, Quintero R, Villarreal ML (2005) Novel airlift reactor fitting for hairy root cultures:
Developmental and performance studies. Biotechnol. Prog., 21: 735-740.
Chang JS, Ichikawa Y, Irons GA, Morala EC, Wan PT (1984) Fraction measurement by an
ultrasonic transmission technique in a bubbly gas-liquid two-phase flow, In: Delhaye JM, Cognet
G (Eds) Measuring techniques in gas-liquid two-phase flows. Springer-Verlag, New York, NY,
319–335.
Chaug CM, Lu WJ, Own KS, Hwang SJ (1993) Operation conditions affecting the performance
of airlift reactors for immobilized enzyme reactions. Biotech. Tech., 7: 31 7-322.
Cheng HP, Wang PM, Chen JW, Wu WT (2002) Cultivation of Acetobacter Xylinum for
bacterial cellulose production in a modified airlift reactor. Biotechnol. Appl. Biochem., 35: 125–
132.
105

Chisti Y, Moo-Young M (1986) Disruption of microbial cells for intracellular products, Enzyme
Microb. Technol., 8: 194–204.
Chisti MY, Moo-Young M (1987) Airlift reactors: Characteristics, applications and design
considerations. Chem. Eng. Comm., 60: 195-242.
Chisti Y, Moo-Young M (1988) Prediction of liquid velocity in airlift reactors with biological
media. J. Chem. Technol. Biotech., 42: 211-219.
Chisti MY (Ed) (1989) Airlift bioreactors. Elsevier applied sciences, London, England.
Chisti Y, Kasper M, Moo-Young M, (1990) Mass transfer in external loop airlift bioreactor using
static mixers. Can. J. Eng., 68: 45-50
Chisti Y Moo-Young M (1994) Airlift bioreactors for treatment of hydrocarbon contaminated
wastes, in Better living through biochemical engineering. Teo WK, Yap MGS and Oh SKW
(Eds) 771-776.
Chisti Y (1998) Pneumatically agitated bioreactors in industrial and environmental
bioprocessing: Hydrodyanmics, hydraulics and transport phenomena. Am. Soc. Mechan. Eng.,
51: 33-112.
Contreras A, Garcia F, Emilio M, Merchuk J (1999) Influence of sparger on energy dissipation,
shear rate, and mass transfer to sea water in a concentric-tube airlift bioreactor. Enzyme Microb.
Technol., 25: 820–830.
Dahman Y, Margaritis A (2008.) Applicability of airlift draft-tube fluidized bioreactors for
binary protein mixture bioseparation. Bioprocess Biosyst. Eng., 31:335–344.
106

Davidson RL (1980). Handbook of water-soluble gums and resins. McGraw Hill.
Degen J, Uebele A, Retze A, Schmid-Staiger U, Trosch W (2001) A novel airlift photobioreactor
with baffles for improved light utilization through the flashing light effect. J. Biotechnol., 92:
89–94.
Dickin F, Wang M (1996) Electrical resistance tomography for process applications. Meas. Sci.
Technol., 7: 247-260.
Dyakowskia T, York T, Mikos M, Vlaev D, Mann R, Follows G, Boxman A, Wilson M (2000)
Imaging nylon polymerization processes by applying electrical tomography. Chem. Eng. J., 77:
105–109.
Dyakowski T, Wang SJ, Geldart D, Beck MS (1999) Tomographic studies of flow patterns
within a circulating fluidised bed. Chem. Eng. Commun., 175: 117-130.
Dyakowskia T, Williams RA (1998) Hydrocyclone flow modelling a continuous research
challenge. Chapter 5 in Innovation in Physical separation technologies: Richard Mozley Symp.
Vol. Inst. Min. and Metallur., 61-67.
El Azhera N, Gouricha B, Viald C, Bellhaje Soulami M, Bouzidib A, Barkaouia M, Ziyadc M
(2005) Influence of alcohol addition on gas hold-up, liquid circulation velocity and mass transfer
coefficient in a split-rectangular airlift bioreactor. Biochem. Eng. J., 23: 161–167
Erickson LE, Deshpande V (1981) Gas-liquid dispersions characteristics in airlift fermenters:
Advances in biotechnology. Pergamon Press Oxford, England
107

Farag IH, Nikolov VR, Nikov I (1997) Gas liquid mass transfer in three-phase inverse fluidized
bed; Advances in fluidization and fluid particle systems. AIChE. Symp. Series., 93: 51–57
Farshid PS, Babak B, Mohammad RM (2007) Hydrodynamics and oxygen transfer behaviour of
water in diesel microemulsions in a draft tube airlift bioreactor. Chem. Eng. Proc., 46: 334–342
Fields PR, Mitchell FRG, Slater NKH (1984) Studies of mixing in a concentric tube airlift
reactor containing xanthan gum by means of an improved flow follower. Chem. Eng. Commun.,
25: 93-104.
Fransolet E, Crine M, L’Homme G, Toye D, Marchot P (2001) Analysis of electrical resistance
tomography measurements obtained on a bubble column. Meas. Sci. Technol., 12: 1055–1060.
Fraser RD, Hill GA (1993) Hydrodynamic characteristics of a spinning sparger, external loop
airlift bioreactor.Can. J. Chem. Eng., 71: 419-425
Garnier A, Chavarie C, Andre G, Klvana D (1990) The inverse fluidization airlift bioreactor, Part
I: Hydrodynamic studies. Chem. Eng. Commun., 98: 31–45
Gavrilescu M, Tudose RZ (1996) Effect of downcomer to riser cross sectional area on operation
behaviour of external-loop airlift bioreactors. Bioprocess Eng., 15: 77-85.
Gavrilescu M, Roman RV, Tudose RZ (1997) Hydrodynamics in external-loop airlift bioreactors
with static mixers. Bioprocess. Eng., 16: 93-99.
Gavrilescu M, Tudose RZ (1998) Concentric-tube airlift bioreactors: Effects of geometry on gas
holdup. Bioprocess Eng., 19: 37-44.
108

Gavrilescu M, Tudose RZ (1998) Concentric-tube airlift bioreactors Part II: Effects of geometry
on liquid circulation. Bioprocess Eng., 19: 103-109.
Gavrilescu M, Tudose RZ (1999) Modelling mixing parameters in concentric-tube airlift
bioreactors. Bioprocess Eng., 20: 423-428.
Gavrilescu M, Roman RV (2004) Performance of airlift bioreactors in the cultivation of some
antibiotic producing microorganisms. Acta Biotechnologica., 18: 201 – 229.
Glennon B, Al-Masry W, MacLoughlin PF, Malone DM (1993) Hydrodynamic modelling in an
airlift loop reactor. Chem. Eng. Commun., 121: 181-192.
Gluz MD, Merchuk JC (1996) Modified airlift reactors; The helical flow promoters. Chem. Eng.
Sci., 51: 2915-2920.
Guo YX, Rathor MN, Ti HC (1997) Hydrodynamics and mass transfer studies in a novel
external loop airlift reactor. Chem. Eng. J., 67: 205–214.
Gouveia ER, Hokka CO, Badino jnr AC (2003) The Effects of geometry and operational
conditions on gas holdup, liquid circulation and mass transfer in an airlift reactor. Brazil J.
Chem. Eng., 20: 363-374
Guillard, F, Trägårdh Ch (1999) Modelling the performance of industrial bioreactors with a
dynamic microenvironmental approach: A critical review. Chem. Eng. Technol., 22 :187-195.
Haibo J, Wang M, Williams RA (2006) The effect of sparger geometry on gas bubble flow
behaviours using electrical resistance tomography. Chinese J. Chem. Eng., 14: 127-131.
109

Heijnen JJ, Van Loosdrecht MC (1993) Development and scale up of anaerobic biofilm
suspension reactor. Water Sci. Technol., 27: 253-261.
Heijnen JJ, Hols J, Van der Lans RG, Van Leeuwen HL, Mulder A, Weltevrede (1997) A simple
hydrodynamic model for liquid circulation velocity in a full-scale two and three-phase internal
airlift reactor operating in the gas recirculation regime. Chem. Eng. Sci., 52: 2527-2540.
Herschel W E, Bulkley R (1926) Measurements of consistency as applied to rubber-benzene
solutions. Proc. Am. Soc. Test. Mat., 26: 621-633.
Holden PJ, Wang M, Mann R, Dickin FJ, Edwards RB (1998) Imaging stirred-vessel
macromixing using electrical resistance tomography. AIChE J., 44: 780-790.
Hwang SJ, Cheng YL (1997) Gas holdup and liquid velocity in three phases internal loop airlift
reactor. Chem Eng Sci., 52: 3940-3960.
Ichii T, Takehara S, Konno H, Ishida T, Sato H, Suzuki A, Yamazump K (1993) Development of
a new commercial-scale airlift fermentor for rapid growth of yeast. J. Ferment. Bioeng., 75: 375-
379.
Jin B, Y XQ, Yu K, Van Leeuwen HJ (2002) Comprehensive pilot plant system for fungal
biomass protein producation and wastewater reclamation. Adv. Environ. Res., 6: 179-189.
Joshi JB, Rande VV, Gharat SD, Lee SS (1990) Sparged loop reactors. Can. J. Chem. Eng., 68:
705-741.
110

Jong JZ, Hsiun DY, Wu T, Tzeng YM (1995) Fed batch culture of Bacillus Thuringiensis Fo
thuringiensis production in a tower type bioreactor. Biotechnol. Bioeng., 48: 207-213
Kawase Y, Moo-Young M (1990) Mathematical models for design of bioreactors: applications
of Kolmogoroff's theory of isotropic turbulence. Chem. Eng. J., 43: 19–41.
Karamanev DG, Chavarie C, Samson R (1996) Hydrodynamics and mass transfer in an airlift
reactor with a semi-permeable draft tube. Chem. Eng. Sci., 51:1173-1176.
Kemblowski Z, Przywarski J, Diab A (1993) An average gas holdup and liquid circulation
velocity in airlift reactors with external loop. Chem. Eng. Sci., 48: 4023-4035.
Kilonzo PM, Margaritis A, Bergougnou MA, Yu J, Ye Q (2007). Effects of geometrical design
on hydrodynamic and mass transfer characteristics of a rectangular-column airlift bioreactor.
Biochem. Eng. J., 34: 279–288.
Kim SW, Kang SW, Lee JS (1997) Cellulase and xylanase production by AspergiliusNniger KKS
in various bioreactors. Bioresour. Technol., 96: 63-67.
Kim D, Pedersen H (1991) Cultivation of Thalictrum Rugosum cell suspension in an improved
airlift bioreactor: Stimulatory effect of carbon dioxide and ethylene on alkaloid production.
Biotechnol. Bioeng., 38: 331-339.
Koide K, Kurematsu K, Iwamoto S, Iwata Y, Honbe KJ (1983) Gas holdup and volumetric liquid
phase mass transfer co-efficient in bubble column with draught tube and with gas dispersion into
Tube. Chem. Eng. Jpn., 16: 413-419.
111

Koide K, Horibe K, Kawabata H, Shigetaka I (1984b) Critical gas velocity required for complete
suspension of solid particles in solid-suspended bubble column with draught tube. J. Chem. Eng.
Jpn., 17: 368-374.
Koide K, Horibe K, Kawabata H, Ito S (1985) Gas holdup and volumetric liquid-phase mass
transfer coefficient in solid suspended bubble column with draught tube. J. Chem. Eng. Jpn., 18:
248-253.
Koide K, Shibata K, Ito H, Kim SY, Ohtagaguchi K (1992) Gas holdup and volumetric liquid
phase mass transfer co-efficient in a gel-particle suspended bubble column with draft tube. J.
Chem. Eng. Jpn., 25: 11-16.
Kotre CJ (1989) A sensitivity coefficient method for the reconstruction of electrical impedance
tomograms. Clin.Phys. Physiol. Means., 10: 275-281.
Lu J, Own S, Hwang S (1993) Operation conditions affecting the performance of airlift reactors
for immobilized enzyme reactions. Biotech. Techni., 7: 317-322.
Li S, Qi T, Zhang Y, Liu C (2009) Hydrodynamics of a multi-stage internal loop airlift reactor.
Chem. Eng. Technol., 32: 80-85.
Lin Z, Neamati N, Zhao H, Kiryu Y, Turpin JA, Aberham C, Strebel K, Kohn K, Witvrouw M,
Pannecouque C, Debyser Z, Clercq ED, Rice WG, Pommier Y, Burke TR (1999) Chichoric acid
analogues as HIV-1 integrase inhibitors. J. Med. Chem., 42: 1401–1414.
Lockett MJ, Kirkpatrick RD (1975) Ideal bubbly flow and actual flow in bubble columns. Trans.
Inst. Chem. Eng., 53: 267–273.
112

Loh KC, Liu J (2001) External loop inverse fluidized bed airlift reactor for treating high strength
phenolic wastewater. Chem. Eng. Sci., 56: 6171-6176.
Loh KC, Ranganath S (2005) External loop fluidized bed airlift bioreactor (EFBAB) for the
cometabolic biotransformation of 4-chlorophenol (4-cp) in the presence of phenol. Chem. Eng.
Sci., 60: 6313–6319.
Lu WJ, Hwang SJ (1994) Liquid mixing in internal loop airlift reactors. Ind. Eng. Chem. Res.,
33: 2180-2186.
Luo HP, Al-Dahhan MH (2008) Macro-mixing in a draft tube airlift bioreactor. Chem. Eng. Sci.,
63: 1572-1585.
Luo XK, Jiang PJ, Fan LS (1997) High-pressure three-phase fluidization: Hydrodynamics and
heat transfer. AIChE J., 43: 2432–2445.
Lyon GM, Inam M, Oakley JP, Beck MS (1995) Innovations in instrumentation for electrical
tomography. IEE Colloqu., 13: 1-4.
Mann R, Dickin FJ, Wang M, Dyakowski T, Williams RA, Edwards RB, Forrest AE, Holden PJ
(1997) Application of electrical resistance tomography to interrogate mixing process at plant
scale. Chem. Eng. Sci., 52: 2087-2097.
Maruyama T, Yoshida S, Mizushuna T (1981) The flow transition in a bubble column. J. Chem.
Eng. Jpn., 14: 352–357.
113

Mehrnia MR, Towfighi J. Bonakdarpour B, Akbarnegad MM (2004) Influence of top-section
design and draft-tube height on the performance of airlift bioreactors containing water-in-oil
microemulsion. J. Chem. Technol. Biotechnol., 79: 260-267.
Mehrnia MR, Bonakdarpour B, Jafar T, Akbarnegad MM (2004).Design and operational aspects
of airlift bioreactors for petroleum biodesulfurization. Am. Inst. Chem. Eng. Environ. Prog., 23:
206-214.
Merchuk JC, Stein Y (1981) Local hold-up and liquid velocity in air-lift reactors. AIChE J., 27:
377–388.
Merchuk J, Stein Y (1981) Distributed parameter model of a gaslift fermentor: Effects of
pressure. Biotechnol. Bioeng., 23: 1309-1324.
Merchuk JC (1986) Gas hold up and liquid velocity in a two dimensional airlift reactor. Chem.
Eng, Sci., 41: 11-16.
Merchuk JC (1990) in K Schugerled. Biotechnology Springer New York.
Merchuk JC (1990) Why use airlift bioreactor? Tibtech 8: 66-71.
Merchuk JC, Ladwa N, Bulmer M (1993) Bioreactor and bioprocess fluid dynamics. 3rd
International conference on bioreactor and bioprocess fluid dynamics, Cambridge, BRH Group
Ltd.
Merchuk JC, Ladwa N, Cameron A, Bulmer M, Pickett A (1994) Concentric-tube airlift reactors:
Effects of geometric design on performance. AIChE J., 40: 1105-1117.
114

Merchuk J, Berzin I (1995) Distribution of energy dissipation in airlift reactors. Chem. Eng. Sci.,
50: 2225 – 2233.
Merchuk JC, Ronen M, Giris S, Arad MS (1998) Light-dark cycles in the growth of the red
microalga. Biotechnol. Bioeng., 59: 705-713.
Merchuk JC, Contreras A, Garcia F, Molina E (1998) Studies of mixing in a concentric tube
airlift bioreactor with different spargers. Chem. Eng. Sci., 53: 709-719.
Merchuk JC, Gluz M (Eds) (1999) Bioreactors, airlift reactors in encyclopedia of bioprocess
technology-fermentation, biocatalysis and bioseparation. John Wiley and Sons, 320-353.
Merchuk JC, Gluz M, Mukmenev I (2000) Comparison of photobioreactors for cultivationof the
red microalga Porphyridium Sp. J Chem. Technol. Biotechnol., 75: 1119-1126.
Mersmann A (1978) Design and scale up of bubble and spray columns. German Chem. Eng., 1:
1-11.
Mir´on AS, Camacho FG, G´omez AC, Grima EM, Chisti Y (2000) Bubble column and airlift
photobiorectors for algal culture. AIChE J., 46: 1872-1887.
Mir´on AS, Camacho FG, G´omez AC, Grima EM, Chisti Y (2000) Mixing in bubble column
and airlift reactors. Chem. Eng. Res. Des., 82: 1367–1374.
Mohantya K, Das D, Biswas MN (2006) Hydrodynamics of a novel multi-stage external loop
airlift reactor. Chem. Eng. Sci., 61: 4617–4624.
115

Mohantya K, Das D, Biswas MN (2008) Treatment of phenolic wastewater in a novel multi-
stage external loop airlift reactor using activated carbon. Sep. Purif. Technol., 58: 311–319.
Molina E, Contreras A, Chisti Y (1999c) Gas holdup, liquid circulation and mixing behaviour of
viscous Newtonaian media in a split-cylinder airlift bioreactor. Trans. Inst. Chem. Eng., 77: 27-
32.
Monticello DJ (2000) Biodesulfurization and the upgrading of petroleum distillates. Curr. Opin.
Biotechnol., 11: 540–546.
Nakao K, Kiefner A, Furumoto K, Harada T (1997) Production of gluconic acid with
immobilized glucose oxidase in airlift reactors. Chem. Eng. Sci., 52: 4127-4133.
Nevers N (1968) Bubble driven fluid circulation. AIChE J., 14: 222-226.
Nishikawa M, Kato H, Hashimoto K (1977) Heat transfer in aerated tower filled with non
newtonian liquid. Ind. Eng. Chem. Process Des. Dev., 16: 1333-137.
Ogbonna JC, Yada H, Masu H, Tanaka H (1996) A novel internally illuminated stirred tank
photobioreactor for large scale cultivation of photosynthetic cells. J. Fermentat. Bioeng., 82: 61-
67.
Olivier AP, Oosterhuis MMC, Oxygen Mass Transfer, in: Non-newtonian fermentation systems
(Dirand G, Bobickon L, Florent J, SFM, Eds.), Proc. 8th Znt. Biotechnol.Symp., Paris 1988, 398-
407.
116

Okada K, Nagata Y, Akagi Y (1995) Effect of packed bed on mass transfer in external loop
airlift bubble column. J. Chem. Eng. Jpn., 22: 582-587.
Onken U, Weiland P (1980) Hydrodynamics and mass transfer in an airlift loop fermenter.
Europ. J. Appl. Biotech., 10: 31-40.
Onken U, Weiland P (1981) Liquid velocity as an important parameter for airlift loop fermenters.
In: M Moo-Young, CW Robinson, C Vezina (Eds) Advances in biotechnology. Pergamon Press,
Oxford pp 559-564.
Onken U, Weiland P (1981) Differences in the behavior of bubble column and airlift loop
reactors. Ger. Chem. Eng., 4: 174–181.
Onken U, Weiland P (1983) Airlift fermenters: construction, behavior, and uses. Adv.
Biotechnol. Proc., 1: 67–95.
Pakzad L, Ein- Mozaffari F, Chan P (2008) Analysis of cavern formation in mixing of yield
stress fluids using tomography and CFD modeling. Chem. Eng. Sci., 63: 2508-2522.
Pacheco MA, Lange EA, Pienkos PT, Yu LQ, Rouse MP, Lin Q, Linguist LK (1999) Recent
advances in biodesulfurization of diesel fuel, NRPA AM-99-27, Annual Meeting of National
Petrochemical and Refiners Association pp 1–26, March 21–23, San Antonio, TX.
Petersen EE, Margaritis A (2001) Hydrodynamic and mass transfer characteristics of three-phase
gaslift bioreactor systems. Crit. Rev. Biotechnol., 21: 233-294.
117

Poggemann R, Steiff A, Weinspach PM (1983) Influence of physical properties on the interfacial
area in a jet-tube reactor. German Chem. Eng., 6: 236-249.
Popovic M, Kiefneer A, Bajpai RK (2004) Gas holdup and liquid circulation velocity in gas-
liquid –solid airlift reactors. Can. J. Chem. Eng., 82: 1273-1274.
Potucek F (1990) Specific interfacial area in an airlift tower Reactor. Coll. Czech. Chem.
Commun., 55: 981-986.
Prince MJ, Blanch HW (1990) Transition electrolyte concentrations for bubble coalescence.
AIChemE J., 36: 1425-1429.
Razzak SA, Barghi S, Zhu JX (2007) Electrical resistance tomography for flow characterization
of a gas–liquid–solid three-phase circulating fluidized bed. Chem. Eng. Sci., 62: 7253-7263.
Renzo DF (2005) Liquid circulation in two and three phase external loop airlift reactors. Chem.
Eng. J., 109: 49-55.
Ricard F, Brechtelsbauer C, Xu XY, Lawrence CJ (2005) Monitoring of multi-phase
pharmaceutical processes using electrical resistance tomography. World congress of Chem. Eng.,
7th Glasgow, United Kingdom, 844381/1-84438/42, July 10-14.
Ruff K, Pilhofer T, Mersmann A (1978) Ensuring flow through al the openings of perforated
plates for fluid dispersion. Inter. Chem. Eng., 18: 395-401.
Schlotelburg C, Gluz M, Popovic M, Merchuk JC (1999) Characterization of an airlift reactor
with helical flow promoters. Can. J. Chem. Eng., 77: 804-810.
118

Seagar AD, Barber DC, Brown BH (1987) Electrical impedance imaging. IEE proc., 134: 201-
210.
Serrano-Carreon L, Galindo E (1997) Studies on cavern development in mixing a yield stress
fluid in a pilot-scale proto-fermenter. Rècents Progerès. Gènie Procèd., 11: 161–168.
Shariati FP, Bonakdarpour B, Mehrnia MR (2007) Hydrodynamics and oxygen transfer behavior
of water in diesel microemulsions in a draft tube airlift bioreactor. Chem. Eng. Proc., 46: 334–
342.
Shieh WK (1989) Performance and kinetics of aerated fluidized bed biofilm reactor. J. Environ.
Eng., 115: 65-79.
Shi LK, Riba JP, Angelino H (1990) Estimation of effective shear rate for aerated non
Newtonian liquids in airlift bioreactor. Chem. Eng. Comm., 89: 25-35.
Siegel MH, Merchuk JC, Schugerl K (1986) Airlift reactor analysis: Interrelationships between
riser, downcomer, and gas-liquid separator behavior, including gas recirculation effects. AICHE
J., 1: 1585-1597.
Siegel MH, Hallaile M, Merchuk JC (1988) Advances in biotechnological processes: Mizarahi A
(Ed) Upstream process and equipment and techniques 7: 79-124.
Siegel MH, Robinson CW (1992) Applications of airlift gas-liquid-solid reaction in
biotechnology. Chem. Eng. Sci., 47: 3215-3229.
Smith JM. (1990) Industrial needs for mixing research. Trans. Inst. Chem. Eng., 68: Part A.
119

Snape JB, Zahradnik FJ, Thomas NH (1992) Hydrodynamic studies in an external loop airlift
reactor containing aqueous electrolyte and sugar solutions. Chem. Eng. Sci., 47: 3387-3394.
Soong Y, Gamwo IK, Blackwell AG, Schehl RR, Zarochak MF (1995) Measurements of solids
concentration in a three-phase reactor by an ultrasonic technique. Chem. Eng. J., 60: 161–167.
Stolojanu V, Prakash A (1997) Hydrodynamic measurements in a slurry bubble column using
ultrasonic techniques. Chem. Eng. Sci., 52: 4225–4230.
Sun S, Bao X, Liu C, Xu J, Wei W (2005) Hydrodynamic model for three-phase annulus airlift
reactors. Ind. Eng. Chem. Res., 44: 7550-7558.
Tobajas M, Siegel MH, Apitz SE (1999) Influence of geometry and solids concentration on the
hydrodynamic and mass transfer of a rectangular gas-lift bioreactor for marine sediment and soil
bioremediation. Can. J. Chem. Eng., 77: 660-669.
Verlaan P, Van Eijis AMM, Tramper J, Van’t Reit K, Luyben KCAM (1989) Estimation of axial
dispersion in individual sections of an airlift –loop reactor. Chem. Eng. Sci., 44: 1139-1146.
Vlaev DS, Wang M, Dyakowski T, Mann R, Grieve BD (2000) Detecting filter-cake pathologies in solid-liquid filtration: Semi-tech scale demonstrations using electrical resistance tomography.
Chem. Eng. J., 77: 87–92.
Vial C, Poncin S, Wild G, Midoux N (2001) A simple method for regime identification and flow
characterization in bubble columns and airlift reactors. Chem. Eng. Proc., 40: 135–151.
120

Vial C, Poncin S, Wild G, Midoux N (2002) Experimental and theoretical analysis of
hydrodynamics in riser of an external loop airlift reactors. Chem. Eng. Sci., 57: 4745-4762.
Vilchez C, Vega JM (1995) Nitrate uptake by immobilized Chlamydomonas reinhardtii cells
growing in airlift reactors. Enzyme Microb. Technol., 17: 386-390.
Vincente A, Duly M, Teixeira JA (1999) Increase ethanol productivity in an airlift with a
modified draft tube. Can. J. Chem. Eng., 77: 497-502.
Wachi S, Jones AG, Elson TP (1991) Flow dynamics in a draft-tube bubble column using
various liquids. Chem. Eng. Sci., 46: 657-663.
Wang M, Dickin F, Beck MS (1993) Signal phase-shift and compensation in resistive electrical
impedance tomography Process Tomography-A strategy for industrial exploitation ed Beck MS
et al (Manchester UMIST Publications) 75-78.
Wang TF, Wang JF, Jin Y (2003c) Application of doppler ultrasound velocimetry in multiphase
flow. Chem. Eng. J., 92: 111–122.
Wei C, Xie B, Wu C, Xiao H, Tang Yingke (1999) Study on three-phase Newtonian fluid in an
Internal Loop Airlift Reactor with a Convergence-Divergence Draft Tube. Huaxue
Gongcheng/Chem. Eng., 27: 14-17
Wei C, Xie B, Xiao H (2000) Hydrodynamics in an internal loop airlift reactor with a
convergent-divergent gaslift. Chem. Eng. Technol, 23: 38-45
121
Wei CH, Xie B, Xia HL, Wang DS (2000) Volumetric mass transfer co-efficient of oxygen in
and internal loop airlift reactor with a convergence-divergence draft tube. Chem. Eng. Technol.,
23: 597-603.
Weiland P, (1984) Influence of draft tube diameter on operation behavior of air-lift loop
bioreactors. Ger. Chem. Eng., 7:374-385.
Wen J, Jia X, Chen X, Yang P (2005) Characteristics of three phase internal loop airlift
bioreactors with complete gas recirculation for non-Newtonian fluids. Bioprocess Biosyst., 27:
193-205.
William RA, Beck MS (1995) Process tomography: principles, techniques and applications. 7 th
ed. Oxford, UK: Butterworth- Heinemann.
Williams RA, Jia X, West RM, Wang M, Cullivan JC, Bond J, Faulks I, Dyakowski T, Wang SJ,
Climpson N, Kostuch JA, Payton D (1999) Industrial monitoring of hydrocyclone operation
using electrical resistance tomography. Minerals Eng., 12: 1245-1252.
Wu CH, Murthy HN, Hahn EJ, Paek KY (2007) Large-scale cultivation of adventitious roots of
echinacea purpurea in airlift bioreactors for the production of chichoric acid, chlorogenic acid
and caftaric acid. Biotechnol. Lett., 29: 1179–1182.
Wu WT, Wang PM, Chang YY, Huang TK, Chien YH (2000) Suspended rice particles for
cultivation of Monascus purpureus in a tower-type bioreactor. Appl. Microbiol. Biotechnol., 53:
542–544.
122

Wu WT, Huang TK, Wang PM, Chen JW (2001) Cultivation of Absidia coerulea for chitosan
production in a modified airlift reactor. J. Chinese Inst. Chem. Eng., 35: 235–240.
Yoshimoto M, Suenagas S, Furumoto K, Naoko K (2007) Gas-liquid interfacial area, bubble
size and liquid phase mass transfer in a three phase external loop airlift bubble column. Chem.
Biochem. Eng., 21: 365-372.
Zhao M, Niranjan K, Davidson F (1994) Mass transfer to viscous liquids in bubble columns and
airlift reactor: Influence of baffles. Chem. Eng. Sci., 49: 2359-2369.
Zhou P, He J, Qian Y (2003) Biofilm airlift suspension reactor treatment of domestic
wastewater. Water, Air, Soil Pollut., 144: 81-100.
123

APPENDICES
Appendix A
ERT DATA FOR MIXING TIMES
Table 1a. Mixing time for draft tube diameter 0.22 m bottom clearance 0.009 m (air-water) using cross shaped sparger configuration.
Ugr 103(m/s) 1.65 3.331 4.75 6.69 8.07
tm1(s) 44 40 37 32 29
tm2(s) 43 40 37 31 30
tm3(s) 45 41 39 33 31
mean 44 40.33 37.67 32 30
standard
deviation
1 0.58 1.15 1 1
124

Table 1b. Mixing time for draft tube id 0.22 m bottom clearance 0.006 m (air-water) using cross shaped sparger configuration.
Ug rX103(m/s) 1.65 3.331 4.75 6.69 8.07
tm1(s) 49 46 40 35 34
tm2(s) 48 44 41 36 34
tm3(s) 47 45 40 36 35
mean 48 45 40.33 35.67 34.33
standard
deviation
1 1 0.58 0.58 0.58
Table 1c. Mixing time for draft tube diameter 0.22 m bottom clearance 0.003 m (air-water) using cross shaped sparger configuration.
Ugr 103(m/s) 1.65 3.331 4.75 6.69 8.07
tm1(s) 53 48 43 42 39
tm2(s) 51 47 44 41 40
tm3(s) 52 46 44 40 38
mean 52 47 43.67 41 39
standard
deviation
1 1 0.58 1 1
125

Table 2a. Mixing time for draft tube diameter 0.29 m bottom clearance 0.009 m (air-water) using cross shaped sparger configuration.
Ugr 103(m/s) 1.65 3.331 4.75 6.69 8.07
tm1(s) 36 32 29 27 26
tm2(s) 34 34 30 26 24
tm3(S) 35 34 29 27 26
mean 35 33.33 29.33 26.67 25.33
standard
deviation
1 1.15 0.58 0.58 1.15
Table 2b. Mixing time for draft tube diameter 0.34 m bottom clearance 0.009 m (air-water) using cross shaped sparger configuration.
Ugr 103(m/s) 1.65 3.331 4.75 6.69 8.07
tm1(s) 31 26 22 15 14
tm2(s) 31 28 22 15 14
tm3(S) 30 28 23 16 13
mean 30.67 27.33 22.33333 15.33 13.67
standard
deviation
0.58 1.15 0.58 0.58 0.58
126

Table 2c. Mixing time for draft tube diameter 0.29 m bottom clearance 0.009 m (air-water) using circular shaped sparger configuration.
Ugr 103(m/s) 1.65 3.31 4.75 6.69 8.07
tm1(s) 50 44 39 30 25
tm2(s) 52 45 39 29 23
tm3(s) 50 44 37 30 24
mean 50.67 44.33 38.33 29.67 24
standard
devaiton
1.15 0.58 1.15 0.58 1
Table 3. Mixing time for draft tube diameter 0.29 m bottom clearance 0.009 m (sugar solution) using cross shaped sparger configuration.
Ugr 103(m/s) 1.65 3.331 4.75 6.69 8.07
tm1(s) 55 49 46 35 35
tm2(s) 55 51 46 37 33
tm3(s) 57 50 45 36 32
mean 55.67 50 45.67 36 33.33
standard
deviation
1.15 1 0.58 1 1.53
127

Table4a. Mixing time for draft tube diameter 0.29 m bottom clearance 0.009 m (0.2% xanthan gum solution) using cross shaped sparger configuration.
Ugr 103(m/s) 1.65 3.331 4.75 6.69 8.07
tm(s) 699 514 430 289 201
Table4b. Mixing time for draft tube diameter 0.29 m bottom clearance 0.009 m (0.5% xanthan gum solution) using cross shaped sparger configuration.
Ugr 103(m/s) 1.65 3.331 4.75 6.69 8.07
tm(s) 2397 1905 1276 924 829
128

Appendix B
ERT DATA FOR CIRCULATION TIME
Table 1a. Circulation time for draft tube diameter 0.22 m bottom clearance 0.009 m (air-water) using cross shaped sparger configuration.
Ugr 103(m/s) 1.65 3.331 4.75 6.69 8.07
tc1(s)
10 9 8 7 7 tc2(s)
10 10 9 8 7 tc3(s)
11 9 8 7 6 mean
10.33 9.33 8.33 7.33 6.67 Standard
deviation 0.58 0.58 0.58 0.58 0.58
129

Table 1b. Circulation time for draft tube diameter 0.22 m bottom clearance 0.006 m (air-water) using cross shaped sparger configuration.
Ugr 103(m/s) 1.65 3.331 4.75 6.69 8.07
tc1(s) 11 9 9 9 7
tc2(s) 11 9 10 7 6
tc3(s) 10 10 8 8 8
mean 10.67 9.33 9 8 7
standard
deviation 0.58 0.58 1 1 1
Table 1c. Circulation time for draft tube diameter 0.22 m bottom clearance 0.003 m (air-water) using cross shaped sparger configuration.
Ugr 103(m/s) 1.65 3.331 4.75 6.69 8.07
tc1(s) 13 11 10 9 9
tc2(s) 12 11 10 9 9
tc3(s) 9 9 9 9 8
mean 11.33 10.33 9.67 9 8.67
standard
deviation 2.08 1.15 0.58 0 0.58
130

Table 2a. Circulation time for draft tube diameter 0.29 m bottom clearance 0.009 m (air-water) using cross shaped sparger configuration.
Ugr 103(m/s) 1.65 3.331 4.75 6.69 8.07
tc1(s) 8 8 6 5 4
tc2(s) 8 7 7 5 4
tc3(s) 9 7 6 6 5
mean 8.33 7.33 6.33 5.33 4.33
standard
deviation 0.58 0.58 0.58 0.58 0.58
Table 2b. Circulation time for draft tube diameter 0.34 m bottom clearance 0.009 m (air-water) using cross shaped sparger configuration.
Ugr 103(m/s) 1.65 3.331 4.75 6.69 8.07
tc1(s) 7 6 5 4 3
tc2(s) 7 6 5 4 3
tc3(s) 7 6 5 4 4
mean 7 6 5 4 3.33
standard
deviation 0 0 0 0 0.58
131

Table 2c. Circulation time for draft tube diameter 0.29 m bottom clearance 0.009 m (air-water) using circular shaped sparger configuration.
Ugr 103(m/s) 1.65 3.31 4.75 6.69 8.07
tc1(s) 10 8 7 6 5
tc2(s) 11 9 7 7 6
tc3(s) 11 9 8 7 5
mean 10.66667 8.666667 7.333333 6.666667 5.33
standard
deviation 0.58 0.58 0.58 0.58 0.57735
Table 3. Circulation time for draft tube diameter 0.29 m bottom clearance 0.009 m (sugar solution) using cross shaped sparger configuration.
Ugr 103(m/s) 1.65 3.331 4.75 6.69 8.07
tc1(s) 11 10 10 7 7
tc2(s) 12 9 8 8 7
tc3(s) 12 10 8 8 6
mean 11.67 9.67 8.67 7.67 6.67
standard
deviation 0.58 0.58 1.15 0.58 0.58
132

133
Table 4a. Circulation time for draft tube diameter 0.29 m bottom clearance 0.009 m (0.2% xanthan gum solution) using cross shaped sparger configuration.
Ugr 103(m/s) 1.65 3.331 4.75 6.69 8.07
tc(s) 31 26 22 18 16
Table 4b. Circulation time for draft tube id 0.29 m bottom clearance 0.009 m (0.5% xanthan gum solution) using cross shaped sparger configuration.
Ugr 103(m/s) 1.65 3.331 4.75 6.69 8.07
tc(s) 44 36 28 23 17