Mitsubishi UFJ Securities Holdings Business Strategy here on the basis of the outlook at the time...
25
Mitsubishi UFJ Securities Holdings Business Strategy January 2013
Transcript of Mitsubishi UFJ Securities Holdings Business Strategy here on the basis of the outlook at the time...

Mitsubishi UFJ Securities Holdings Business Strategy
January 2013

1
This document contains forward-looking statements in regard to forecasts, targets and plans of Mitsubishi UFJ Financial Group, Inc. (“MUFG”) and its group companies (collectively, “the group”). These forward-looking statements are based on information currently available to the group and are stated here on the basis of the outlook at the time that this document was produced. In addition, in producing these statements certain assumptions (premises) have been utilized. These statements and assumptions (premises) are subjective and may prove to be incorrect and may not be realized in the future. Underlying such circumstances are a large number of risks and uncertainties. Please see other disclosure and public filings made or will be made by MUFG and the other companies comprising the group, including the latest kessantanshin, financial reports, Japanese securities reports and annual reports, for additional information regarding such risks and uncertainties. The group has no obligation or intent to update any forward-looking statements contained in this document
In addition, information on companies and other entities outside the group that is recorded in this document has been obtained from publicly available information and other sources. The accuracy and appropriateness of that information has not been verified by the group and cannot be guaranteed
The financial information used in this document was prepared in accordance with accounting standards generally accepted in Japan, or Japanese GAAP

2
Contents
History and group overviewFY2012-14 Medium-term Business Plan vision and strategy
Financial resultsFY2012 H1 results summaryFinancial results comparison with other Japanese securities firms
Domestic securities strategy-MUMSS Financial results-MUMSS Sales divisions-MUMSS Investment banking business unit-MUMSS Global market business unitPrivate banking strategyGlobal strategy
45
Outline of Financial ResultsOutline of Financial Results
Major subsidiariesMajor subsidiaries’’ position and strategyposition and strategy
Overview of Mitsubishi UFJ Securities Holdings Overview of Mitsubishi UFJ Securities Holdings
11
2122
789

3
Overview of Mitsubishi UFJ Securities Holdings

4
History and group overview
60%Main foreign securities firms Main domestic subsidiaries
100%
Mitsubishi UFJ Securities Holdings (MUSHD)
40%
Morgan Stanley MUFG Securities
(MSMS)
60% economic interest; 49% voting rights
100%
MSJH
Morgan Stanley
MUS-MSJH Japan alliance
MUFG-MS Global Alliance
MUFG
40% economic interest; 51% voting rights
Approx.22%
<Equity method affiliate>
Apr. 2010 Mitsubishi UFJ Securities Holdings (MUSHD) establishedMay 2010 MUSHD group company Mitsubishi UFJ Securities integrated with Morgan Stanley
Japan Securities’s investment banking operations and was renamed Mitsubishi UFJ Morgan Stanley Securities
MUFG’s core securities group including domestic and overseas securities and asset management firms
MUS(USA)(100% owned)
MUSI(100% owned)
KOKUSAI AM(55% owned)
67% MUFG consolidated
base
Mitsubishi UFJMorgan Stanley
Securities(MUMSS)
MUS(SPR)(100% owned)
MUS(HK)(100% owned)
MUML-PB(51% owned)
100% MUFGconsolidated
base
MUTB BTMU

5
FY2012-14 Medium-term Business Plan vision and strategy
Our Vision-As a part of the world’s most trusted financial group-
1. Work together to exceed the expectations of our customers2. Provide reliable and constant support to our customers 3. Expand and strengthen our global presence4. Inspire the trust of shareholders by enhancing corporate value
Medium-term Business Plan VisionTo respond to customers’ diverse needs as MUFG’s core securities group by
collaborating with MUFG group companies as a bank-affiliated securities firm, and byleveraging our relationship with JV partner Morgan Stanley
Core Strategy1. Drive BTMU/MUSHD collaboration (in Japan) and utilize Morgan Stanley’s global reach to
provide high quality service 2. Pursue collaboration between our overseas subsidiaries and MUFG group companies3. Strengthen management fundamentals and control
–Significantly strengthen risk management and other functions required for global governance–Create a robust operational base built on self-sustaining cost control culture

6
Outline of Financial Results

22.4
6.3
19.416.3
0.2
18.0
(69.8)(40.0)
(20.0)
0.0
20.0
40.0
FY09H1
FY09H2
FY10H1
FY10H2
FY11H1
FY11H2
FY12H1
31.9
9.0
17.7 20.4
30.5
(2.2)
(93.5)(40.0)
(20.0)
0.0
20.0
40.0
FY09H1
FY09H2
FY10H1
FY10H2
FY11H1
FY11H2
FY12H1
155.2131.8 127.2
12.5
114.0 124.5 129.1
0.0
50.0
100.0
150.0
200.0
FY09H1
FY09H2
FY10H1
FY10H2
FY11H1
FY11H2
FY12H1
7
Financial results (MUSHD consolidated)
Following large losses in the trading business in FY2010, business structure was reformed and returned to profit in FY2011 H1, and later income increased steadily Main initiatives: Thoroughly strengthened collaboration with BTMU and Morgan Stanley, reduced fixed costs through a range of cost-cutting initiatives, and transformed business model of global market business
<Net operating revenue>
<Selling, general and administrative expenses>
<Ordinary income and loss>
<Net income and loss>
* FY2011 H2: MUMSS early retirement program resulted in extraordinary loss
*
129.4
133.6 134.2
120.6 121.9118.1 117.5
100.0
110.0
120.0
130.0
140.0
FY09H1
FY09H2
FY10H1
FY10H2
FY11H1
FY11H2
FY12H1
(¥bn)
(¥bn)
(¥bn)
(¥bn)

8
FY2012 H1 results summaryUnderwriting, secondary distribution commissions and trading income strong. Returned to operating profit, helped by lower SG&A expensesIncreases in ordinary income and net income
Net operating revenueCommissions received• Commission to consignees: declined due to
sluggish market conditions• Underwriting, secondary distribution
commissions: increased due to winning of lead manager mandates on large IPO
• Offering, secondary distribution commissions: investment trust sales commissions declined
• Other commissions: Commissions to consignees declined due to decrease in KOKUSAI AM’s investment assets. MUMSS increased due to good performance in M&A advisory
Trading income• Large increase in income by steadily capturing
client transaction flow
SG&ADecreased due to restrained spending
<Consolidated income statement>
(MUSHD consolidated)
(¥bn)
ChangeOperating revenue 152.8 155.2 2.4
Commison received 73.0 69.0 (3.9)Commision to consignees 9.2 7.3 (1.8)Commision for underwriting,secondary distribution 6.6 12.7 6.1
Fee for offering, secondarydistribution 17.9 14.9 (2.9)
Other fees received 39.2 33.9 (5.2)Net trading income 36.5 49.4 12.8
Stocks (9.0) (9.3) (0.3)Bonds, others 45.5 58.7 13.2
Financial revenue 44.6 36.7 (7.8)Financial expenses 38.7 26.1 (12.5)
Net operating revenue 114.0 129.1 15.0Selling, general and administrative expenses 121.9 117.5 (4.4)Operating income(loss) (7.8) 11.5 19.4Non-operating income 27.6 19.7 (7.8)
Interest income 3.6 3.5 (0.0)Equity in earnings of affiliates 19.7 12.0 (7.7)
Non-operating expenses 1.9 0.8 (1.1)Ordinary income 17.7 30.5 12.7Extraordinary income 6.8 1.1 (5.6)Net income 16.3 18.0 1.6
FY11 H1 FY12 H1

9
(¥bn)
Financial results comparison with other Japanese securities firms
(Source) Calculated by MUMSS based on company disclosures
306.9 155.2 1851.7 900.8 422.3 227.3 228.5 138.1 251.2 118.7
238.5 129.1 1535.8 770.9 336.0 175.3 167.1 106.7 228.8 108.5
143.0 69.0 551.0 244.3 220.8 100.6 118.7 57.7 119.4 53.3
19.3 7.3 178.1 73.0 40.7 16.9 27.1 12.1 13.8 5.9
15.9 12.7 28.9 13.5 19.5 12.5 22.7 12.5 18.7 7.9
33.3 14.9 169.0 76.6 49.1 19.0 25.1 9.8 46.6 21.7
74.4 33.9 175.0 81.2 111.4 52.0 43.6 23.1 40.0 17.6
86.0 49.4 272.5 173.3 79.4 47.1 8.7 31.5 102.2 50.7
Stocks (6.2) (9.3) - - (6.4) (12.4) (5.0) (4.3) 0.3 (0.1)
Bonds, exchanges, etc 92.2 58.7 - - 85.8 59.5 13.7 35.8 101.9 50.9
(2.1) (0.0) 25.0 (5.0) 1.9 5.9 (0.2) 0.4 - -
12.1 10.6 119.9 66.4 20.0 10.4 39.9 17.0 4.5 3.4
(0.4) 0.0 567.1 291.8 13.7 11.2 - - 2.5 1.0
240.1 117.5 1450.9 715.8 359.7 164.7 218.4 97.7 185.1 91.8
(1.5) 11.5 84.9 55.0 (23.7) 10.6 (51.2) 9.0 43.7 16.7
39.7 18.9 - - 11.5 6.3 1.4 0.7 0.8 0.6
38.1 30.5 84.9 55.0 (12.2) 16.9 (49.7) 9.7 44.5 17.3
(13.6) 1.1 - - (4.6) (0.1) (27.2) (2.3) (1.2) (4.6)
16.5 18.0 11.5 4.7 (39.4) 10.0 (95.6) 8.3 19.4 6.6
FY2011FY2012
H1
MUSHD Nomura Holdings Daiwa Securities Group Mizuho Securities(consolidated)
SMBC Nikko Securities(consolidated)
FY2011FY2012
H1Operating revenue
FY2011FY2012
H1FY2011
FY2012H1
FY2011FY2012
H1
Net operating revenue
Commison received
Commision to consigneesCommision for underwriting,secondary distributionFee for offering, secondarydistribution
Other fees received
Net trading income
Net gain on private equity andother securities
Net interest income
OthersSelling, general andadministrative expenses
Operating income(loss)
Non-operating income
Ordinary income(loss)
Extraordinary income(loss)
Net income(loss)

10
Major subsidiaries’ position and strategy
9.6
1.3
(13.6)
18.9
(9.1) (3.1)
(135.8)(40.0)
(20.0)
0.0
20.0
FY09H1
FY09H2
FY10H1
FY10H2
FY11H1
FY11H2
FY12H1
8.5
2.57.1
14.3
(120.4)
(6.2) (4.3)
(40.0)
(20.0)
0.0
20.0
FY09H1
FY09H2
FY10H1
FY10H2
FY11H1
FY11H2
FY12H1
104.3 98.689.8
81.488.6 94.8
(28.3)
(30.0)
20.0
70.0
120.0
FY09H1
FY09H2
FY10H1
FY10H2
FY11H1
FY11H2
FY12H1
96.9 96.6 97.5
92.4
86.6
82.981.6
70.0
80.0
90.0
100.0
FY09H1
FY09H2
FY10H1
FY10H2
FY11H1
FY11H2
FY12H1
11
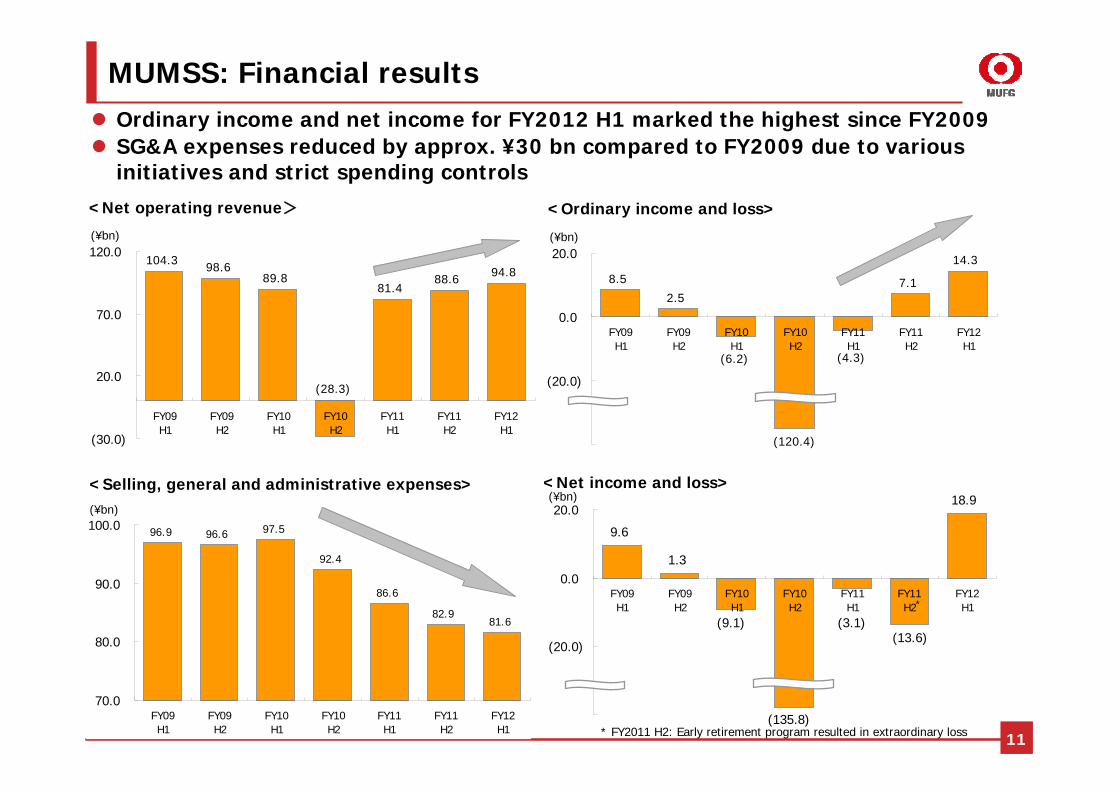
MUMSS: Financial resultsOrdinary income and net income for FY2012 H1 marked the highest since FY2009SG&A expenses reduced by approx. ¥30 bn compared to FY2009 due to various initiatives and strict spending controls
* FY2011 H2: Early retirement program resulted in extraordinary loss
*
<Net operating revenue> <Ordinary income and loss>
<Selling, general and administrative expenses> <Net income and loss>
(¥bn)
(¥bn)
(¥bn)
(¥bn)

12
Promote sharing of sales know-howImprove back office efficiency
Large scale offices
MUMSS: Sales divisions (1)Overall strategyEnhance comprehensive strengths and productivity through innovation in sales style, BTMU/MUMSS collaboration, and strengthening product competitiveness through Morgan Stanley collaborationBuild effective sales structure to match each customer segment
Innovation in sales style Thorough profiling sales
Deliver high quality services, expand customer base and achieve sustainable growing of profitability
Private banking
tier
Financial planning
tier
Life Planningtier
Consulting-type sales
Enlarge customer base through BTMU/MUMSS collaboration
Increase active accounts through stronger proposalsPromote financialproducts intermediation business
Strengthen online products and functionsIncrease efficiency by promoting e-contracts
Product strategy
Collaborate with Morgan StanleyExpand services/product lineup matched to customer needs
BTMU/MUMSS collaboration
Strengthen cooperation with BTMUPromote referrals and intermediation
13
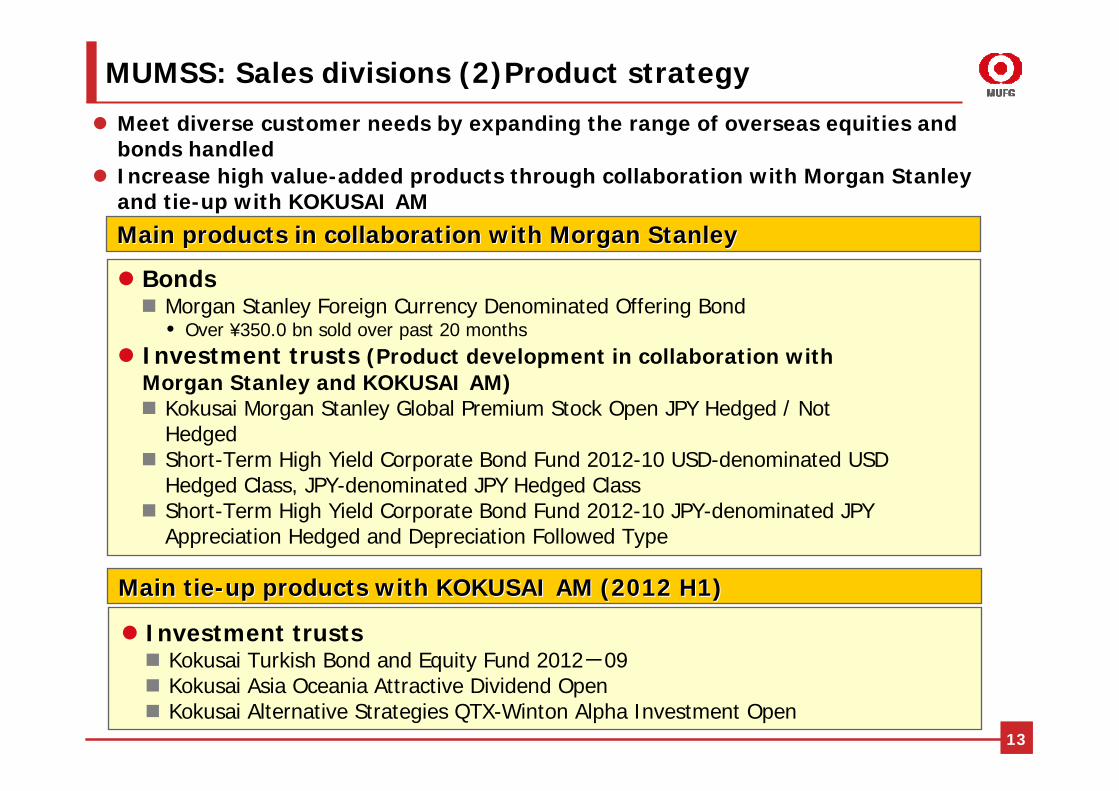
MUMSS: Sales divisions (2)Product strategy
Meet diverse customer needs by expanding the range of overseas equities and bonds handledIncrease high value-added products through collaboration with Morgan Stanley and tie-up with KOKUSAI AM
BondsMorgan Stanley Foreign Currency Denominated Offering Bond• Over ¥350.0 bn sold over past 20 months
Investment trusts (Product development in collaboration with Morgan Stanley and KOKUSAI AM)
Kokusai Morgan Stanley Global Premium Stock Open JPY Hedged / Not HedgedShort-Term High Yield Corporate Bond Fund 2012-10 USD-denominated USD Hedged Class, JPY-denominated JPY Hedged ClassShort-Term High Yield Corporate Bond Fund 2012-10 JPY-denominated JPY Appreciation Hedged and Depreciation Followed Type
Main products in collaboration with Morgan StanleyMain products in collaboration with Morgan Stanley
Investment trustsKokusai Turkish Bond and Equity Fund 2012-09Kokusai Asia Oceania Attractive Dividend OpenKokusai Alternative Strategies QTX-Winton Alpha Investment Open
Main tieMain tie--up products with KOKUSAI AM (2012 H1)up products with KOKUSAI AM (2012 H1)
0.0
50.0
100.0
150.0
200.0
250.0
300.0
FY09H1
FY09H2
FY10H1
FY10H2
FY11H1
FY11H2
FY12H1
0.0
200.0
400.0
600.0
800.0
FY09H1
FY09H2
FY10H1
FY10H2
FY11H1
FY11H2
FY12H1
100
120
140
160
180
200
(FY09 H1=100)
Foreign bonds Investment trusts Sales per employee
14
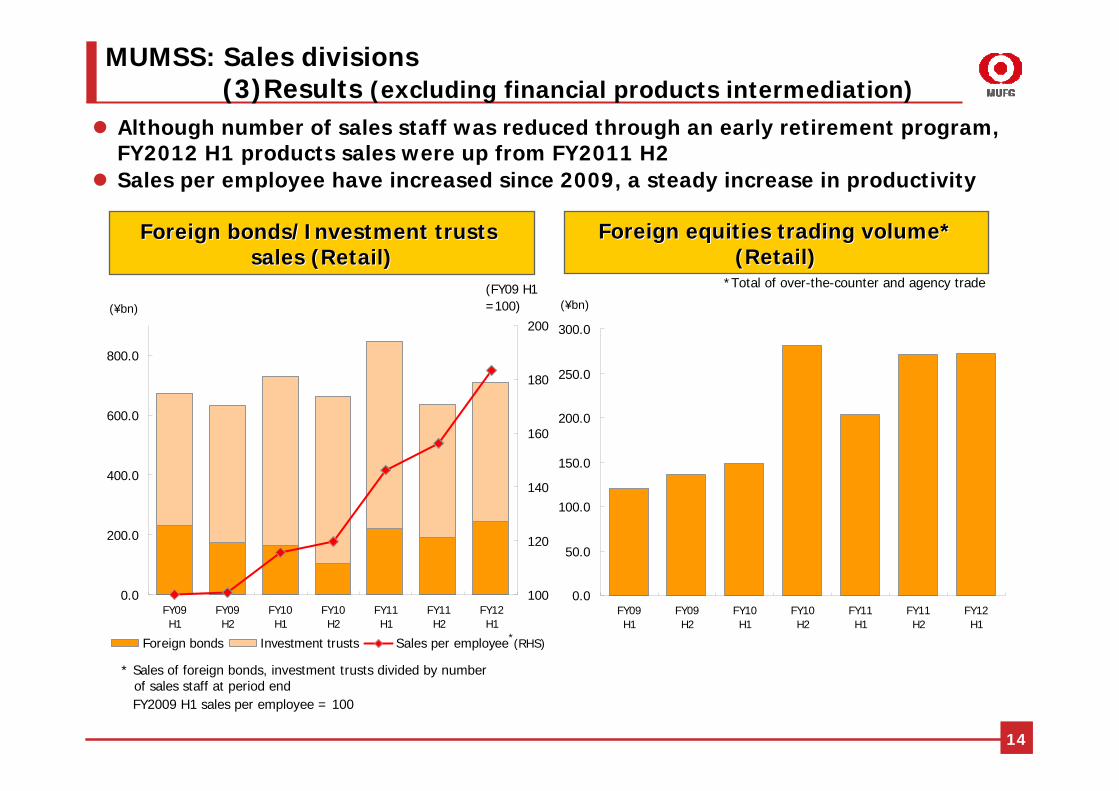
Although number of sales staff was reduced through an early retirement program, FY2012 H1 products sales were up from FY2011 H2Sales per employee have increased since 2009, a steady increase in productivity
Foreign bonds/Investment trusts Foreign bonds/Investment trusts sales (Retail)sales (Retail)
MUMSS: Sales divisions(3)Results (excluding financial products intermediation)
Foreign equities trading volume*Foreign equities trading volume*(Retail)(Retail)
FY2009 H1 sales per employee = 100
* Sales of foreign bonds, investment trusts divided by number of sales staff at period end
*
(¥bn)
*Total of over-the-counter and agency trade
(¥bn)
(RHS)

0.0
5.0
10.0
15.0
FY09H1
FY09H2
FY10H1
FY10H2
FY11H1
FY11H2
FY12H1
500
550
600
650
700
Net operating revenue Staff transfered to BTMU etc. (RHS)
176.1
248.2
282.8
240.2
276.1302.9
344.1
0.0
100.0
200.0
300.0
400.0
FY09H1
FY09H2
FY10H1
FY10H2
FY11H1
FY11H2
FY12H1
Foreign bonds Investment trusts
15
MUMSS: Sales divisions (4)Financial products intermediation
Financial products intermediation results strong due to major progress in BTMU/MUMSS collaboration Expand business through increase in staff transfered to BTMU etc.
Net operating revenue of financialNet operating revenue of financialproducts intermediation products intermediation
Revenue growth through deepeningtransactions
Revenue has doubled since FY2009 H1 due to development in BTMU/MUMSS collaboration
Sales of foreign bonds and investment trusts are on an increasing trend
Sales of financialSales of financialproducts intermediation products intermediation
(¥bn) (¥bn)(staff)

16
MUMSS: Investment banking business unit (1)Strategy and vision
Use our unique competitive edge as a bank-owned/foreign-owned hybrid securities firm to deliver added value and service that competitors can’t matchIncrease our presence as an arm of MUFG and Morgan Stanley’s investment banking business in Japan
The mission of investment banking business unitThe mission of investment banking business unit
We will put quality foremost and quickly and precisely respond to customers’needs while continuously providing globally-recognized, high quality investment banking advice and solutions. Through this, we will contribute to the growth and competitiveness of Japanese business by deeply participating in planning and execution of business and capital strategy as a trusted partner of Japan’s top business management
Exert uniqueness as hybridsecurities firm
Make maximum use of MorganStanley’s global network
Strengthen collaborationwith BTMU

RankMUMSS Nomura Mizuho Financial Group2,232.2 bn\ 23.1% 395.3 bn\ 23.9% 4,765.3 bn\ 41.2%
Mizuho Securities Daiwa Securities Group Nomura2,075.1 bn\ 21.5% 324.0 bn\ 19.6% 4,235.8 bn\ 36.6%
Nomura Securities MUMSS MUMSS1,532.0 bn\ 15.9% 217.2 bn\ 13.1% 3,657.3 bn\ 31.6%
Daiwa Securities Mizuho Financial Group JP Morgan1,422.9 bn\ 14.7% 209.7 bn\ 12.7% 2,437.7 bn\ 21.1%
SMBC Nikko Securities Sumitomo Mitsui Financial Group Goldman Sachs & Co1,040.9 bn\ 10.8% 188.1 bn\ 11.4% 2,270.5 bn\ 19.6%
MUMSS Nomura Nomura2,788.3 bn\ 22.6% 278.5 bn\ 22.7% 4,989.4 bn\ 34.5%
Nomura Securities Daiwa Securities Group Goldman Sachs & Co2,355.9 bn\ 19.1% 276.3 bn\ 22.5% 4,281.9 bn\ 29.6%
Mizuho Securities Sumitomo Mitsui Financial Group Mizuho Financial Group2,254.5 bn\ 18.3% 240.6 bn\ 19.6% 3,575.9 bn\ 24.8%
SMBC Nikko Securities Mizuho Financial Group Deutsche Bank AG1,827.5 bn\ 14.8% 157.5 bn\ 12.8% 3,517.9 bn\ 24.4%
Daiwa Securities Capital Markets MUMSS Bank of America Merrill Lynch1,643.5 bn\ 13.3% 126.0 bn\ 10.3% 3,327.4 bn\ 23.0%
7: MUMSS2,896.1 bn\ 20.0%
5
4
3
2
1
M&A Advisory (announced base)*3Japan Equity and Equity-linked*2
Apr-Dec 2012
Japan Domestic Debt*1
Apr 2011 - Mar 2012
4
5
1
2
3
17
MUMSS: Investment banking business unit (2)League tables
Maintaining top share in bond underwritingMoved up from fifth to third in equity underwritings due to winning lead manager mandate for large scale IPOsLeapt into third place in M&A deals (announced base)
(Source) Thomson Reuters (data compiled by Mitsubishi UFJ Morgan Stanley)*1 Includes Japanese Straight Bonds, Ex-FILP Agency Bonds ( incl. Expressway company's bonds ) and Municipal Bonds Related. Based on lead manager's credit*2 Mitsubishi UFJ Morgan Stanley includes domestic offerings of Japanese issuers underwritten by Morgan Stanley MUFG Securities as well as global offerings of Japanese issuers underwritten by Morgan Stanley. Based on underwriting amount*3 Any Japanese involvement announced including property acquisitions. Mitsubishi UFJ Morgan Stanley includes deals advised by Morgan Stanley
(Source) Thomson Reuters (data compiled by MUMSS)
18
MUMSS: Investment banking business unit (3)Morgan Stanley collaboration
Main results of collaboration with Morgan StanleyMain results of collaboration with Morgan Stanley
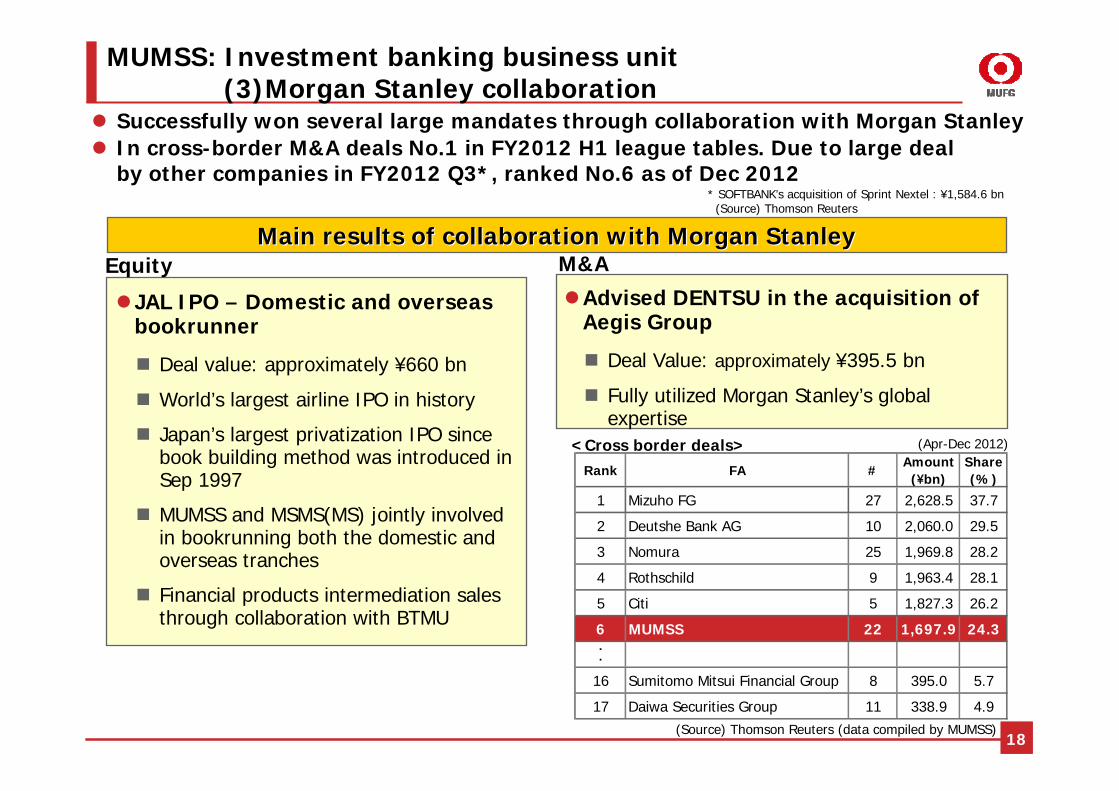
Successfully won several large mandates through collaboration with Morgan Stanley In cross-border M&A deals No.1 in FY2012 H1 league tables. Due to large deal by other companies in FY2012 Q3*, ranked No.6 as of Dec 2012
EquityAdvised DENTSU in the acquisition of Aegis Group
Deal Value: approximately ¥395.5 bn
Fully utilized Morgan Stanley’s global expertise
<Cross border deals> (Apr-Dec 2012)
(Source) Thomson Reuters (data compiled by MUMSS)
JAL IPO – Domestic and overseas bookrunner
Deal value: approximately ¥660 bn
World’s largest airline IPO in history
Japan’s largest privatization IPO sincebook building method was introduced in Sep 1997
MUMSS and MSMS(MS) jointly involved in bookrunning both the domestic and overseas tranches
Financial products intermediation sales through collaboration with BTMU
M&A
Rank FA #Amount
( bn)\
Share(%)
1 Mizuho FG 27 2,628.5 37.7
2 Deutshe Bank AG 10 2,060.0 29.5
3 Nomura 25 1,969.8 28.2
4 Rothschild 9 1,963.4 28.1
5 Citi 5 1,827.3 26.2
6 MUMSS 22 1,697.9 24.3・・
16 Sumitomo Mitsui Financial Group 8 395.0 5.7
17 Daiwa Securities Group 11 338.9 4.9
* SOFTBANK’s acquisition of Sprint Nextel : ¥1,584.6 bn(Source) Thomson Reuters
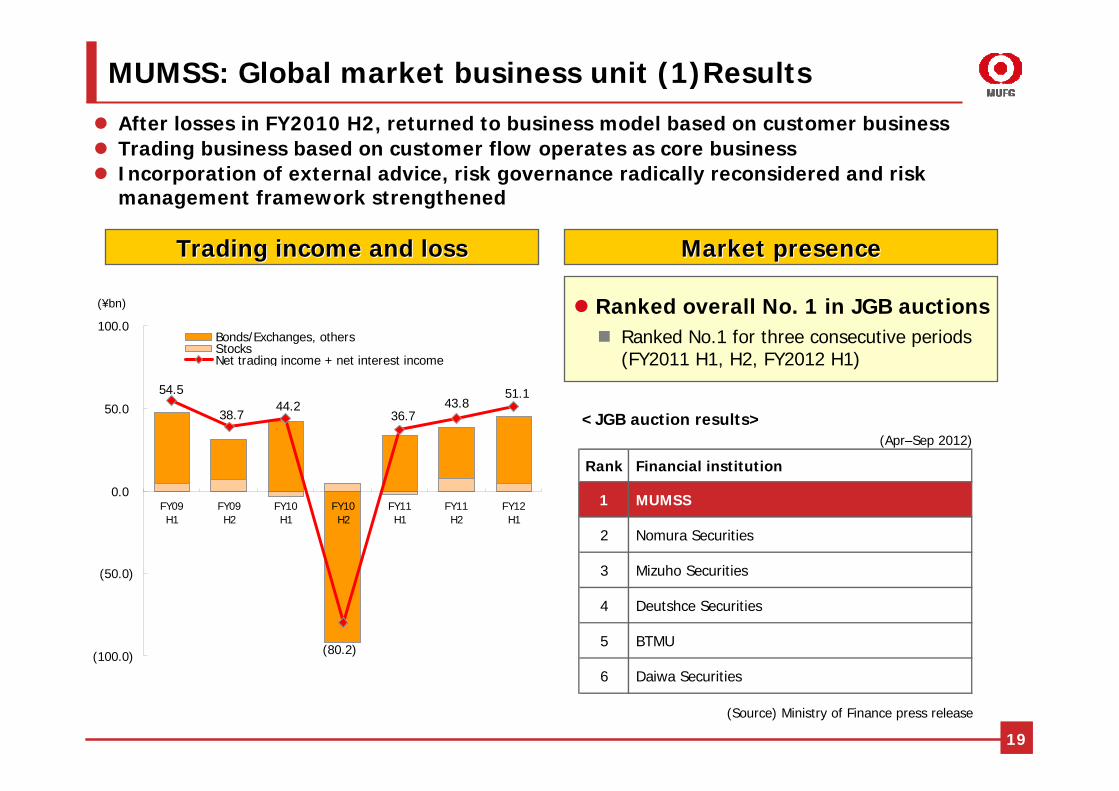
51.143.8
36.7
(80.2)
44.238.7
54.5
(100.0)
(50.0)
0.0
50.0
100.0
FY09H1
FY09H2
FY10H1
FY10H2
FY11H1
FY11H2
FY12H1
Bonds/Exchanges, othersStocksNet trading income + net interest income
19
MUMSS: Global market business unit (1)Results
After losses in FY2010 H2, returned to business model based on customer businessTrading business based on customer flow operates as core business Incorporation of external advice, risk governance radically reconsidered and risk management framework strengthened
Market presenceMarket presenceTrading income and lossTrading income and loss
Ranked overall No. 1 in JGB auctionsRanked No.1 for three consecutive periods (FY2011 H1, H2, FY2012 H1)
(Apr–Sep 2012)<JGB auction results>
(Source) Ministry of Finance press release
(¥bn)
Rank Financial institution
1 MUMSS
2 Nomura Securities
3 Mizuho Securities
4 Deutshce Securities
5 BTMU
6 Daiwa Securities

, 85.2%
MUMSS14.8%
20
MUMSS: Global market business unit (2)Transactions shareMarket presence growing steadily due to further focus on customer flow business
Transactions share Transactions share ((FY2012 H1)FY2012 H1)
(Source) Created by MUMSS based on data from JSDA
(Source) Created by MUMSS based on data from TSE
Change in shareChange in share
Pu
blic and Corporate B
ondsP
ublic and C
orporate Bonds
Equities
Equities
(with dom
estic institution
s*)(w
ith dom
estic institu
tions*)
(Excl. inter-dealer transaction)
Overall market volumeapprox. ¥1,006 tn
MUMSS10.7%
Overall TSE market volumeapprox. ¥18 tn*
(TSE 1st section + 2nd section + Mothers)
* Life and non-life, city & regional banks, trust banks and investment trusts on TSE definition
14.8%15.4%
14.2%
12.5%12.3%
10%
12%
14%
16%
FY10H1
FY10H2
FY11H1
FY11H2
FY12H1
10.2%
9.6%
10.7%
8.6%
9.3%
8%
10%
12%
FY10H1
FY10H2
FY11H1
FY11H2
FY12H1

21
Private banking strategyIn Dec 2012 Mitsubishi UFJ Merrill Lynch PB Securities was made a 100% subsidiary of MUFGFurther strengthen Private banking services to MUFG’s high net worth customer base
BeforeBefore AfterAfter
MUFG
BTMU MUSHD
Mitsubishi UFJMerrill LynchPB Securities
Merrill Lynch Japan Securities
Bank of AmericaMerrill Lynch
49.02% 41.18% 9.80%
MUMSS
(FY2011 results)Value of deposited assets : ¥1.8 tnNet operating revenue : ¥25.0 bnOrdinary income : ¥11.8 bn
MUFG
BTMU MUSHD
Mitsubishi UFJMerrill LynchPB Securities
49.0% 51.0%
MUMSS
Maintain business partnership with Bank of America Merrill Lynch for the time being
Focus on further collaboration with BTMU. Consider collaboration with MUMSS/Morgan Stanley too

22
Global strategy: Main strategy, BTMU/MUSHD collaborationExpand BTMU/MUSHD collaboration and cross-selling based on the framework of MUFG Integrated Global Business Group and Integrated Global Markets Business GroupIn primary markets business collaborate with Morgan Stanley and capture BTMU’s overseas customers’ direct financing needs In secondary markets business accelerate the unification of global markets business, including MUMSS
Prim
ary businessSecon
dary business
Europe Americas Asia
MUSI MUS(USA)BTMUMUMSS
Morgan Stanley Morgan
Stanley
Morgan Stanley
MUS(HK)MUS(SPR)
MUFG Integrated Global Markets Business Group
Collaboration Collaboration

3.2
0.0
(0.7)
8.6
(4.8)(5.0)
0.0
5.0
10.0
FY10H1
FY10H2
FY11H1
FY11H2
FY12H1
Americas Europe Asia Total
FY10 H1 FY10 H2 FY11 H1 FY11 H2 FY12 H1
(42.7) (12.7) (85.1) (43.9) (41.6)
(6.6) (14.8) (15.2) (10.5) (7.0)
Nomura Holdings
Daiwa Securities Group
23
Global strategy: Overseas subsidiaries’ performance
Despite the deteriorating environment from the European financial crisis etc., posted comparatively solid results, based on BTMU/MUSHD collaboration business Returned to profits in FY2011 H2, also increased profits in FY2012 H1
Ordinary income and lossOrdinary income and lossMUSIDCM, key to BTMU/MUSHD collaboration, was strong
Customer derivative transactions also growing
MUS (USA)Increase in deals as lead manager in underwriting business through driving collaboration with BTMU and UB
MUS (HK), MUS(SPR)
Develop DCM and secondary business as a spoke of MUSI, MUMSS. Achieve stable profits through strengthening collaboration with BTMU
(Note) Accounting period for overseas subsidiaries differ by three months from MUFG consolidated base. H1:Jan 1-Jun 30, H2: Jul 1-Dec 31
* Income (loss) before income taxes
<Reference>Income and loss in overseas
*
(¥bn)
(Source) Company disclosures
(¥bn)

Rank Bookrunner Amount (EUR MM) Share (%)
1 BNP Paribas SA 14,591 7.92 Societe Generale 12,677 6.93 Deutsche Bank 11,599 6.54 HSBC Holdings PLC 10,290 5.55 Credit Agricole CIB 9,865 5.56 Barclays 9,217 4.97 UniCredit 8,939 4.98 RBS 8,362 4.79 JP Morgan 7,885 4.310 Citi 6,532 3.715 MUSI 3,877 2.227 Mizuho Financial Group 1,599 0.949 Nomura 114 0.0
Rank Bookrunner Amount (USD MM) Share (%)
1 JP Morgan 117,503 11.72 Bank of America Merrill Lynch 88,030 8.83 Citi 81,776 8.24 Morgan Stanley 64,810 6.55 Goldman Sachs & Co 57,539 5.76 Barclays 53,583 5.47 Deutsche Bank 40,284 4.08 Wells Fargo & Co 33,328 3.39 HSBC Holdings PLC 31,560 3.210 RBS 27,616 2.815 MUS(USA) 9,768 1.017 Mizuho Financial Group 7,502 0.733 Nomura 1,518 0.237 Sumitomo Mitsui Finl Grp Inc 1,362 0.1
<Americas>
<Europe>
Corporate bondsCorporate bonds** bookrunnerbookrunner* Investment Grade
Changes in rankingChanges in ranking
Global strategy: League tablesFirmly maintain top share among Japanese firms due to progress in BTMU/MUSHD collaboration
(Source) Thomson Reuters
(Source) Thomson Reuters
24
0
10
20
30
40
50
60
2009 2010 2011 2012(Rank)
MUSI Nomura Mizuho
1
0
10
20
30
40
50
60
70
2009 2010 2011 2012(Rank)
MUS(USA) Nomura DaiwaMizuho SMFG
1