Mistakes I've Made- Cam Davidson-Pilon
56
Mistakes I've Made Mistakes I've Made PyData Seattle 2015 Cam Davidson-Pilon
-
Upload
pydata -
Category
Data & Analytics
-
view
53 -
download
1
Transcript of Mistakes I've Made- Cam Davidson-Pilon

Mistakes I've MadeMistakes I've Made
PyData Seattle 2015Cam Davidson-Pilon
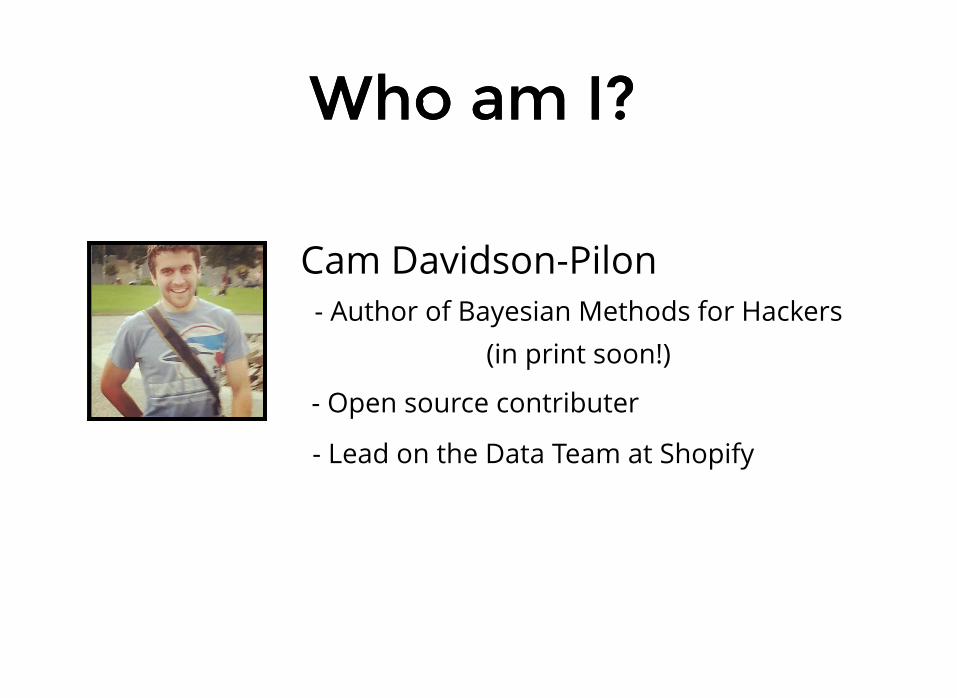
Who am I?Who am I?
Cam Davidson-Pilon
- Lead on the Data Team at Shopify
- Open source contributer
- Author of Bayesian Methods for Hackers(in print soon!)


Ottawa

Ottawa

Ottawa?

Case Study 1Case Study 1

We needed to predict mail returnrates based on census data.
Sample Data (simplified):

Well I'm predicting the rate, so Ibuild that:
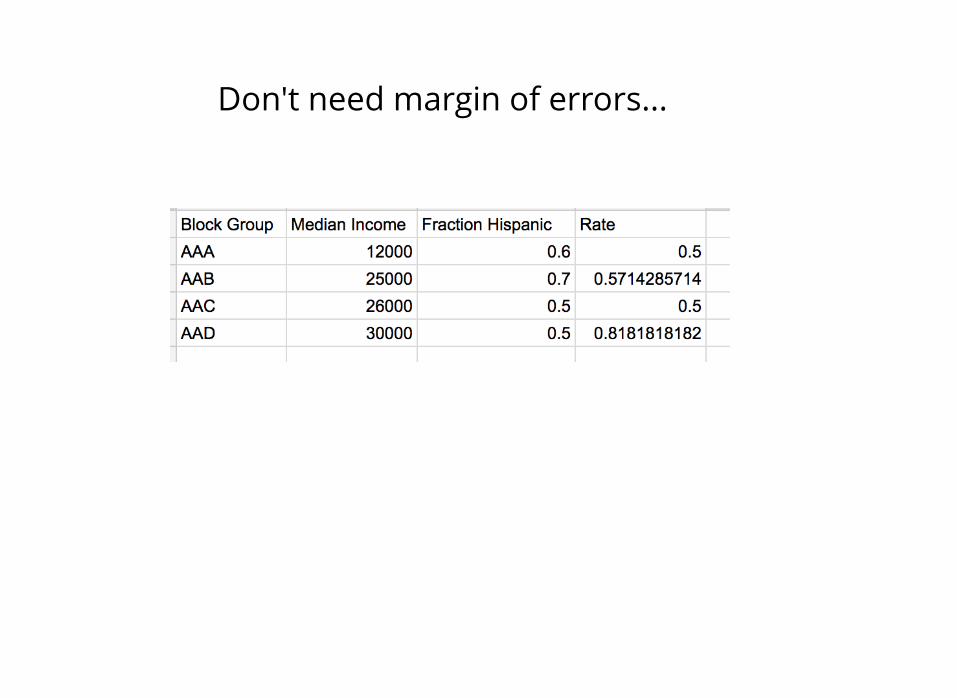
Don't need margin of errors...
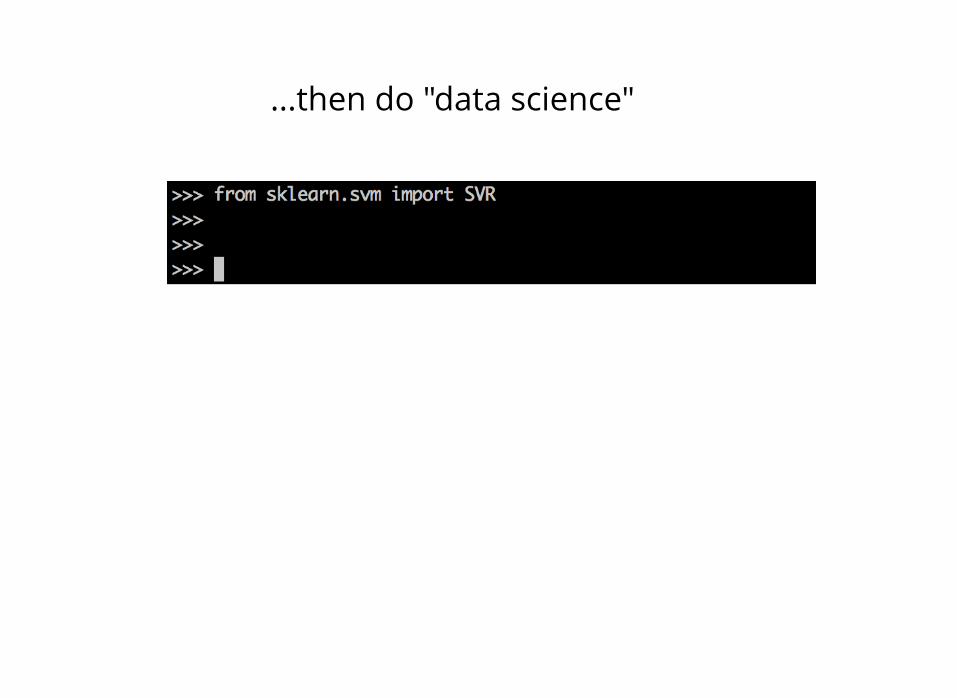
...then do "data science"
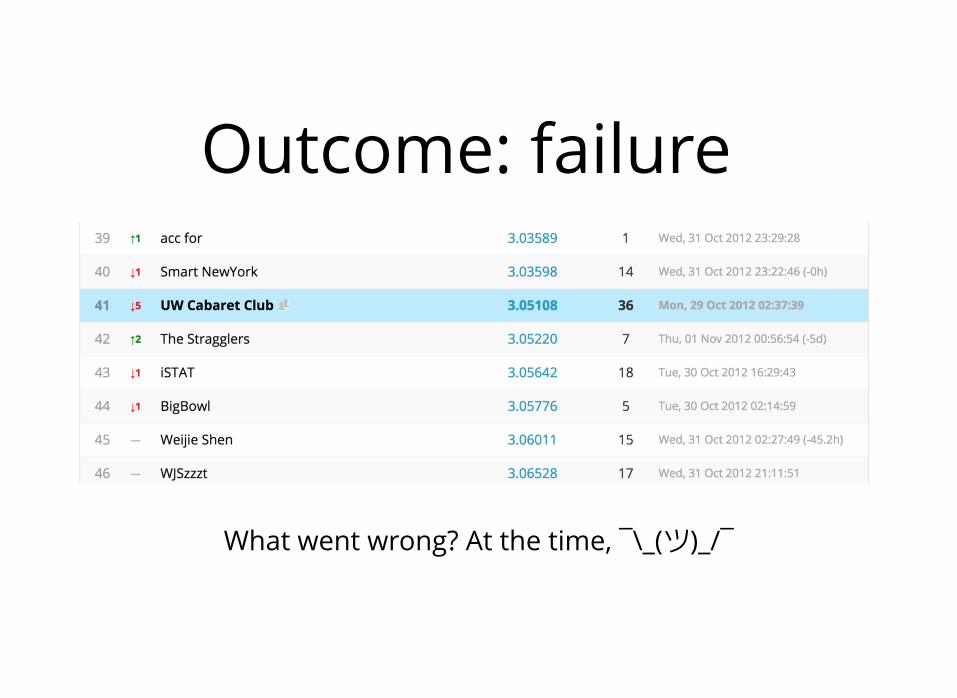
Outcome: failure
What went wrong? At the time, ¯\_(ツ)_/¯
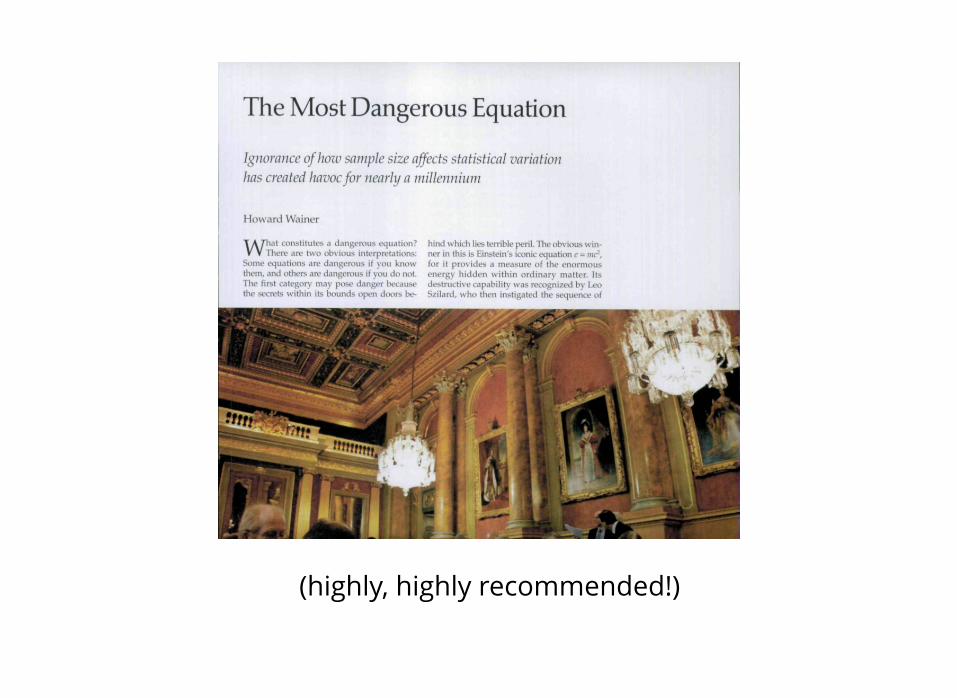
(highly, highly recommended!)

σ =X̄ √nσ

σ =X̄ √nσ
"The std. deviation of the sample mean isequal to the std. deviation of thepopulation over square-root n"

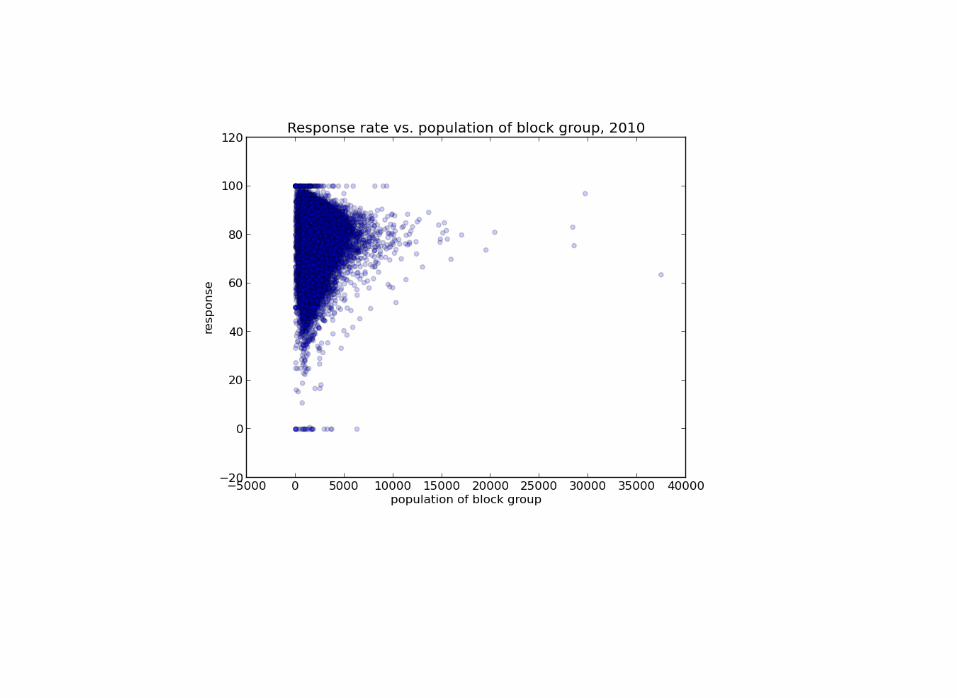


What I learned1. Sample sizes are so important when dealing with
aggregate level data.2. It was only an issue because the sample sizes were
different, too.3. Use the Margin of Error, don't ignore it - it's there for a
reason.4. I got burned so bad here, I became a Bayesian soon after.
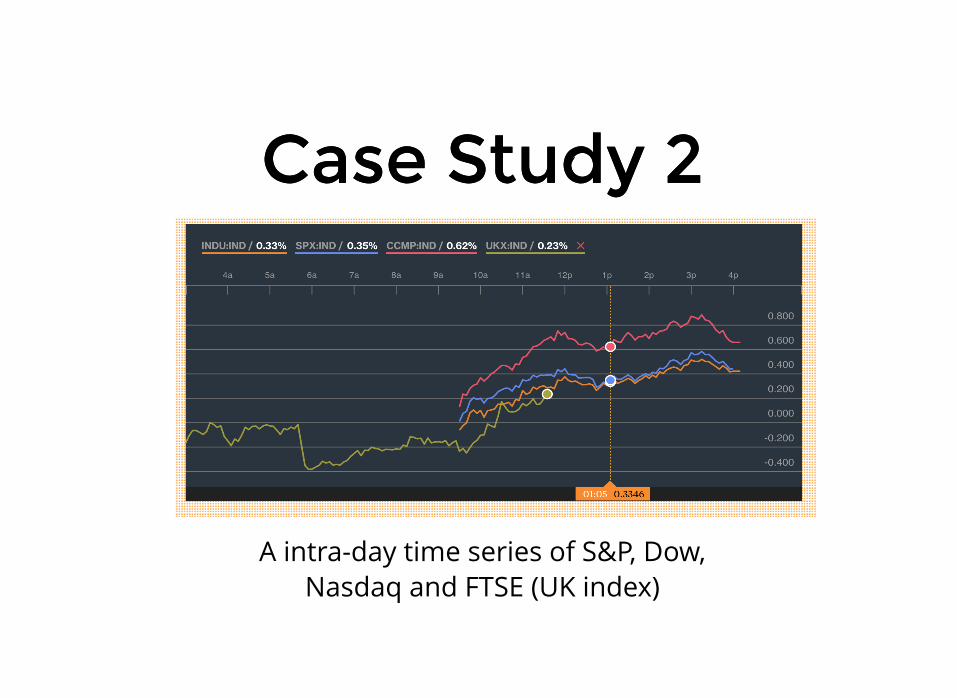
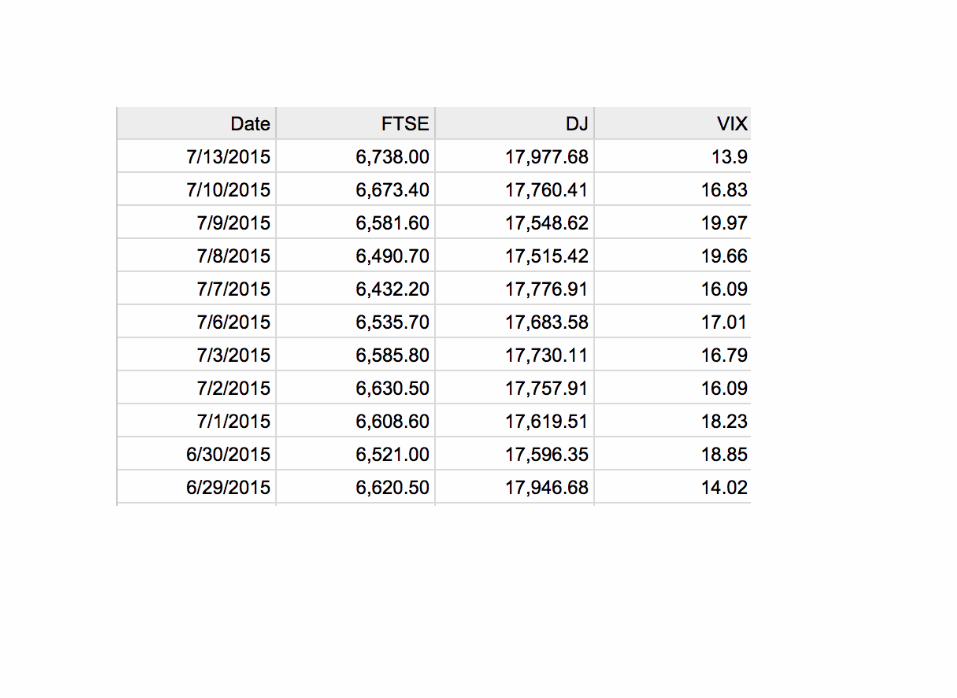
Case Study 2Case Study 2
A intra-day time series of S&P, Dow,Nasdaq and FTSE (UK index)

Suppose you areinterested in doing someday trading. Your target:
UK stocks.
Futures on the FTSE inparticular.
Post Backtesting Results

Push to Production -investing really money
What happened?
Data Leakage happened


What I learned1. Your backtesting / cross validation will always be equal or
overly optimistic - plan for that.2. Understand where your data comes from, from start to
finish.
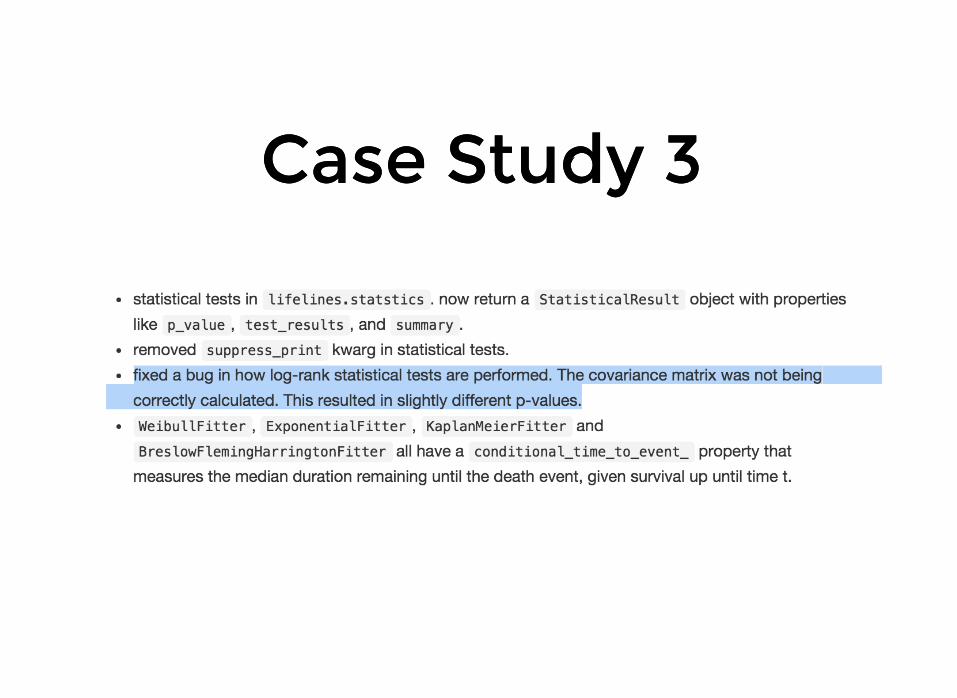
Case Study 3Case Study 3

What I learned1. When developing statistical software that already exists in
the wild, write tests against the output of that software. 2. Be responsible for your software:

Case Study 4Case Study 4
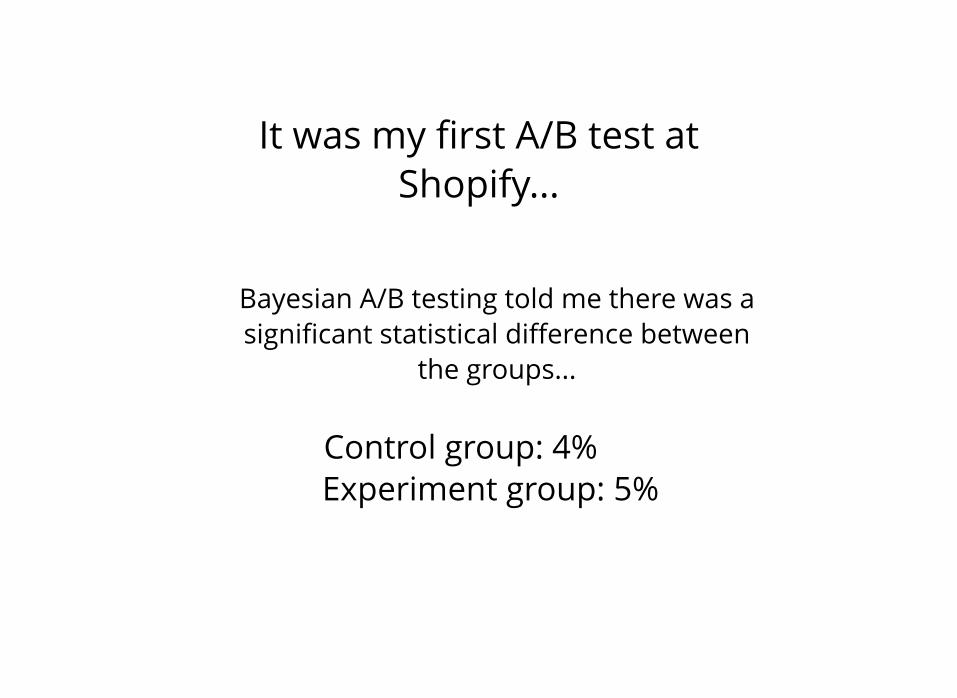
It was my first A/B test atShopify...
Control group: 4%Experiment group: 5%
Bayesian A/B testing told me there was asignificant statistical difference between
the groups...

Upper management wantedto know the relative increase...
(5% - 4%) / 4% = 25%

No.We forgot sample size
again.


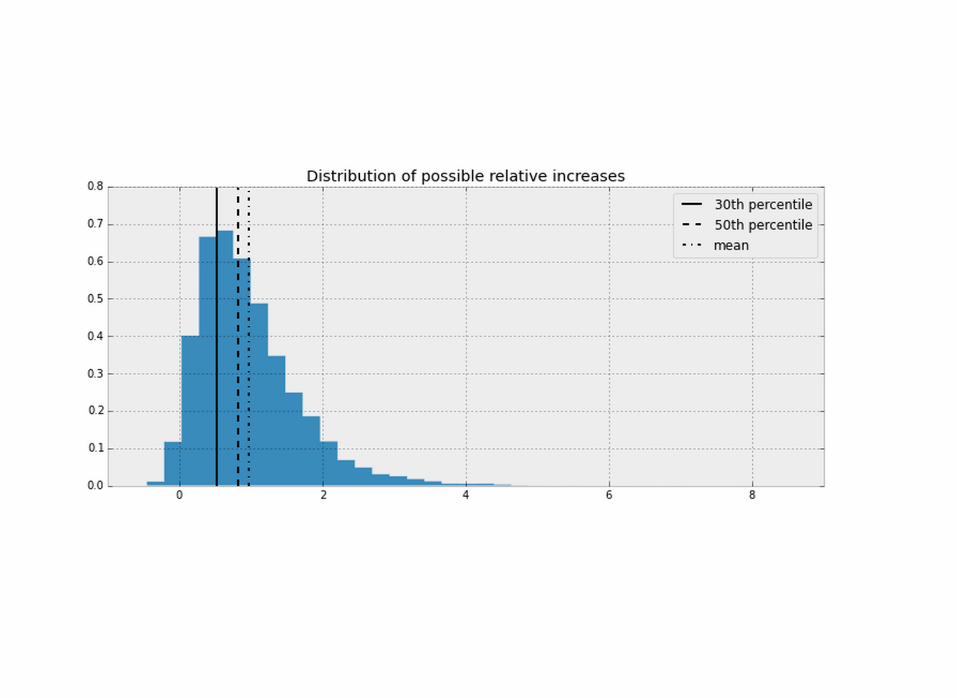

What I learned1. Don't naively compute stats on top of stats - this only
compounds the uncertainty. 2. Better to underestimate than overestimate3. Visualizing uncertainty is a the role of a statistician.

Machine LearningMachine Learningcounter examplescounter examples
Sparse-ing thesolution naively

Coefficients after linear regression*:
*Assume data has been normalized too,i.e. mean 0 and standard deviation 1
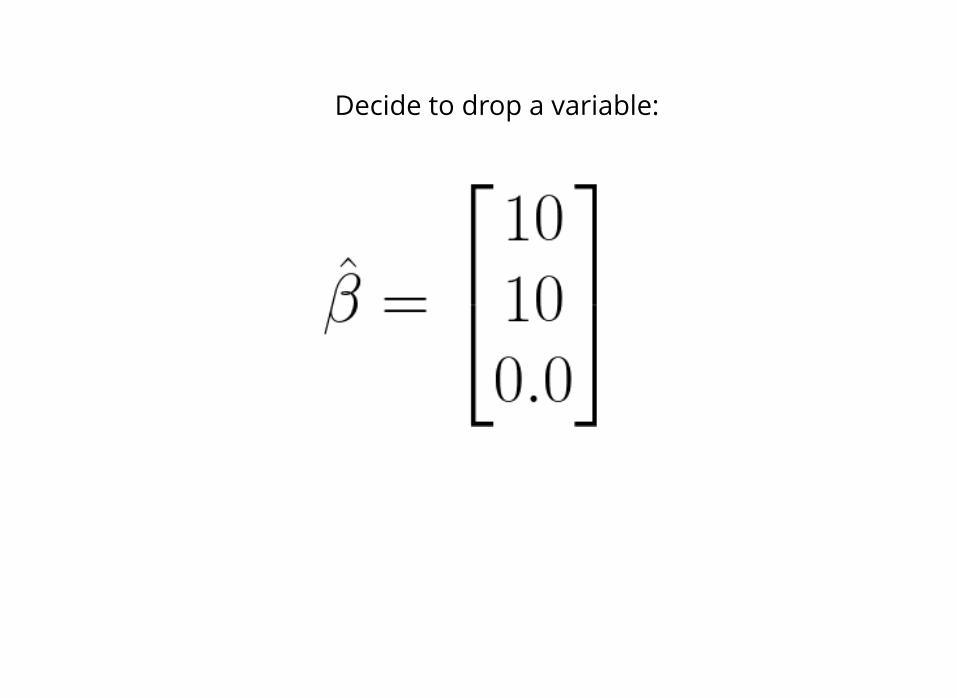
Decide to drop a variable:


Suppose this is the true model...
Okay, out regression got the coefficientsright, but...
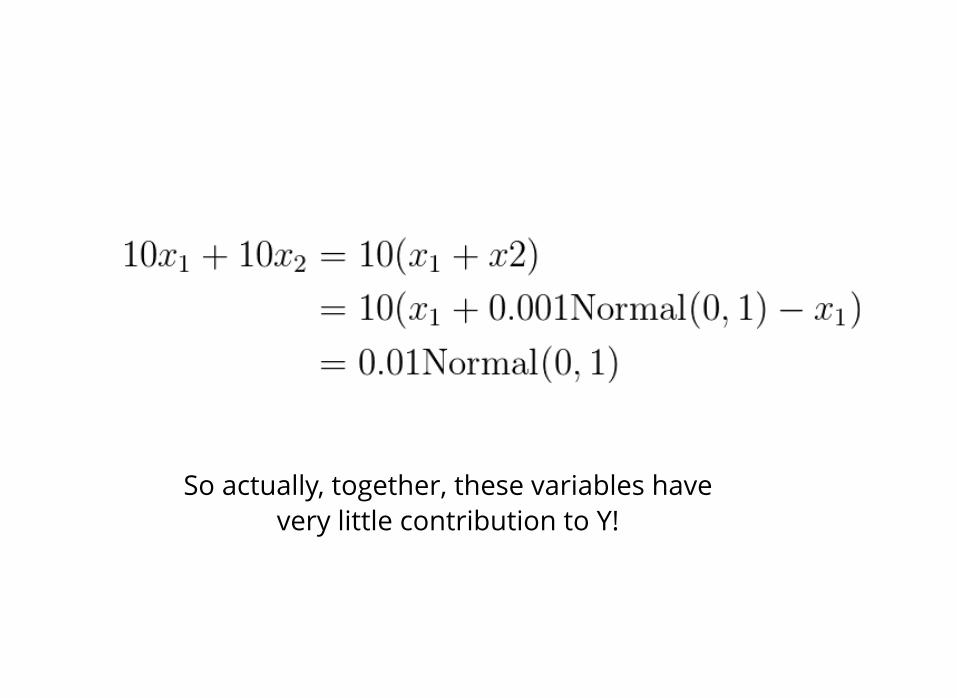
So actually, together, these variables havevery little contribution to Y!

Solution:
Any form of regularization will solve this.For example, using ridge regression withwith even the slightest penalizer gives:

PCA beforeRegression

PCA is great at many things, but it canactually significantly hurt regression if
used as a preprocessing step. How?
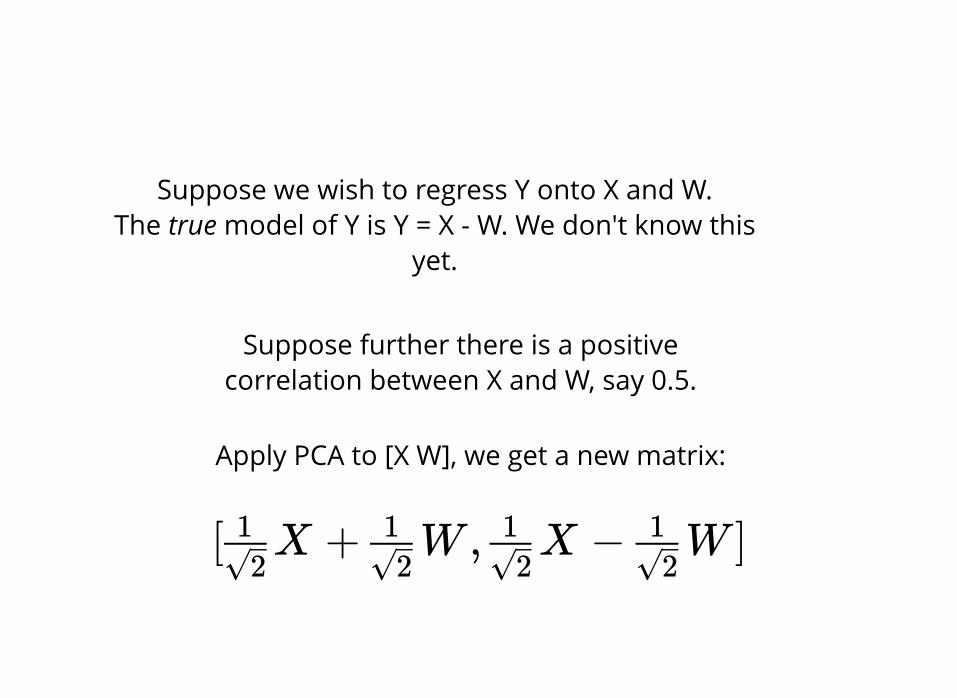
Suppose we wish to regress Y onto X and W.The true model of Y is Y = X - W. We don't know this
yet.
Suppose further there is a positivecorrelation between X and W, say 0.5.
Apply PCA to [X W], we get a new matrix:
[ X + W , X − W ]√21
√21
√21
√21

[ X + W , X − W ]√21
√21
√21
√21
Textbook analysis tells you to drop thesecond dimension from this new PCA.

[ X + W ]√21
√21
So now we are regressing Y onto:
i.e., find values to fit the model:
Y = α + β(X + W )
But there are no good values for theseunknowns!
QuickIPythonDemo
Solution:
Don't use naive PCA before regression, youare losing information - try something like
supervised PCA, or just don't do it.
Thanks for listening :)
@cmrn_dp