Missouri Wild Turkey Harvest and Population Status … Science Division . ... 2016Missouri Wild...
30
2016 MISSOURI WILD TURKEY HARVEST AND POPULATION STATUS REPORT Missouri Department of Conservation Resource Science Division
Transcript of Missouri Wild Turkey Harvest and Population Status … Science Division . ... 2016Missouri Wild...

2016MISSOURI WILD TURKEY HARVEST
AND POPULATION STATUS REPORT
Missouri Department of
Conservation
Resource Science Division
2016 Missouri Wild Turkey Harvest and Population Status Report
1
TABLE OF CONTENTS
Population Status . . . . . . . . . 2
Reproduction – Wild Turkey Brood Survey . . . . . . 6
Harvest . . . . . . . . . . 8
2016 Spring Turkey Season . . . . . . . 8
2016 Fall Firearms Turkey Season . . . . . . 12
2016 Fall Archery Turkey Season . . . . . . 13
Hunting Incidents . . . . . . . . . 16
Recent Regulation Changes . . . . . . . . 16
Bowhunter Observation Survey . . . . . . . 17
Wild Turkey Research Project Update. . . . . . . 18
Appendix A – County-level Spring Turkey Harvest . . . . . 21
Appendix B – County-level Fall Turkey Harvest . . . . . 25

2
2016 Missouri Wild Turkey Harvest and Population Status Report
POPULATION STATUS
Figure 1. Turkey Productivity Regions in Missouri. Regions consist of counties grouped by
similar land cover composition.
Lindley Breaks Region Turkey numbers in the Lindley Breaks region
(Figure 1) peaked in the early 2000s before
declining by approximately 30% from 2001–
2009. Improved production has helped to
stabilize regional turkey numbers. Turkey
abundance remains about 25% below the peak
numbers observed more than a decade ago.
0
1,000
2,000
3,000
4,000
5,000
6,000
Sp
ring T
urk
ey H
arves
t

3
2016 Missouri Wild Turkey Harvest and Population Status Report
Mississippi Lowlands Region Turkey numbers in the Mississippi
Lowlands region (Figure 1) increased
during the 2000s. Turkey habitat within
the region is limited, resulting in low
harvests compared to other regions.
Regional turkey numbers are currently
stable based on the five-year spring
harvest trend.
Northeast Region Six consecutive years of poor production
caused turkey numbers in the Northeast
region (Figure 1) to decline by
approximately 40% during the late
2000s. Regional turkey numbers remain
about 35% below those observed from
the late 1990s through the mid-2000s.
Improved production in recent years has
resulted in an increasing trend in turkey
numbers within the region.
Northwest Region Similar to the Northeast region, poor
production caused turkey numbers to
decline sharply in the Northwest region
(Figure 1) during the late 2000s.
Although regional production has
improved, turkey numbers remain about
45% below the population peak. During
the past five years, regional turkey
numbers have stabilized.
0
100
200
300
400
500
600
700
Sp
ring T
urk
ey H
arves
t
0
2,000
4,000
6,000
8,000
10,000
12,000
Sp
ring T
urk
ey H
arves
t
0
2,000
4,000
6,000
8,000
10,000
12,000
Sp
ring T
urk
ey H
arves
t

4
2016 Missouri Wild Turkey Harvest and Population Status Report
0
1,000
2,000
3,000
4,000
5,000
6,000
7,000
Sp
ring T
urk
ey H
arves
t
Ozark Border Region Turkey numbers in the Ozark Border
region (Figure 1) peaked in the early
2000s as they did in most of the state
before declining during the mid-to-late
2000s. Regional turkey numbers have
since increased and are currently just
above the previous population peak. The
region contains many of the top turkey
harvest counties in the state.
Ozarks East Region The Ozarks East region (Figure 1) has
experienced some of the state’s best
turkey production in recent years, which
has spurred population growth
throughout much of the region. Although
turkey abundance remains about 15%
below the peak observed during the early
2000s, regional turkey numbers have
displayed an increasing trend during the
last five years.
Ozarks West Region Regional turkey numbers (Figure 1) are
about 20% below the population peak
that occurred during the early 2000s,
however, improved production has
resulted in an increasing population trend
during the last five years. Like the Ozark
Border region, many of the counties in
the Ozarks West region consistently rank
among the highest in the state for turkey
harvest.
0
1,000
2,000
3,000
4,000
5,000
6,000
7,000
Sp
ring T
urk
ey H
arves
t
0
2,000
4,000
6,000
8,000
10,000
12,000
Sp
ring T
urk
ey H
arves
t

5
2016 Missouri Wild Turkey Harvest and Population Status Report
Union Breaks Region Turkey numbers in the Union Breaks
region (Figure 1) are stable and currently
about 15% below peak numbers of the
early 2000s. Containing a good mix of
forested and open land cover types, this
region contains some of the state’s best
turkey habitat and its counties
consistently rank among the highest in
turkey harvest.
West Prairie Region Turkey numbers in the West Prairie
region (Figure 1) have been stable for the
last five years. Similar to the population
trend in the Northwest region, turkey
numbers peaked during the early-to-mid
2000s. Regional turkey numbers remain
about 20% below that population peak.
0
1,000
2,000
3,000
4,000
5,000
6,000
7,000
8,000
9,000
Sp
ring T
urk
ey H
arves
t
0
1,000
2,000
3,000
4,000
5,000
6,000
7,000
8,000
9,000
Sp
rin
g T
urk
ey H
arves
t

6
2016 Missouri Wild Turkey Harvest and Population Status Report
REPRODUCTION – WILD TURKEY BROOD SURVEY
The Missouri Department of Conservation (MDC) has been conducting a Wild Turkey Brood Survey
annually since 1959. During the survey, Department staff and citizen volunteers record observations
of hens, poults, and gobblers during June, July, and August. Turkey sightings are recorded on
observation cards, which the MDC mails to participants at the beginning of each survey month. By
recording observations of hens and poults, survey participants provide information that serves as an
index to turkey production. It is through this survey that the MDC determines the success of each
year’s turkey hatch. Turkey observations are collected at the county-level and analyzed by Turkey
Productivity Region (Figure 1), which are counties grouped by similar land cover composition.
After receiving completed survey cards, MDC staff determines the percentage of hens observed with
and without poults, as well as the average number of poults per hen for those hens observed with a
brood. Observations of hens and poults are used to determine the poult-to-hen ratio (PHR), which is
the average number of poults per hen. The PHR includes observations of hens with a brood and those
observed without a brood.
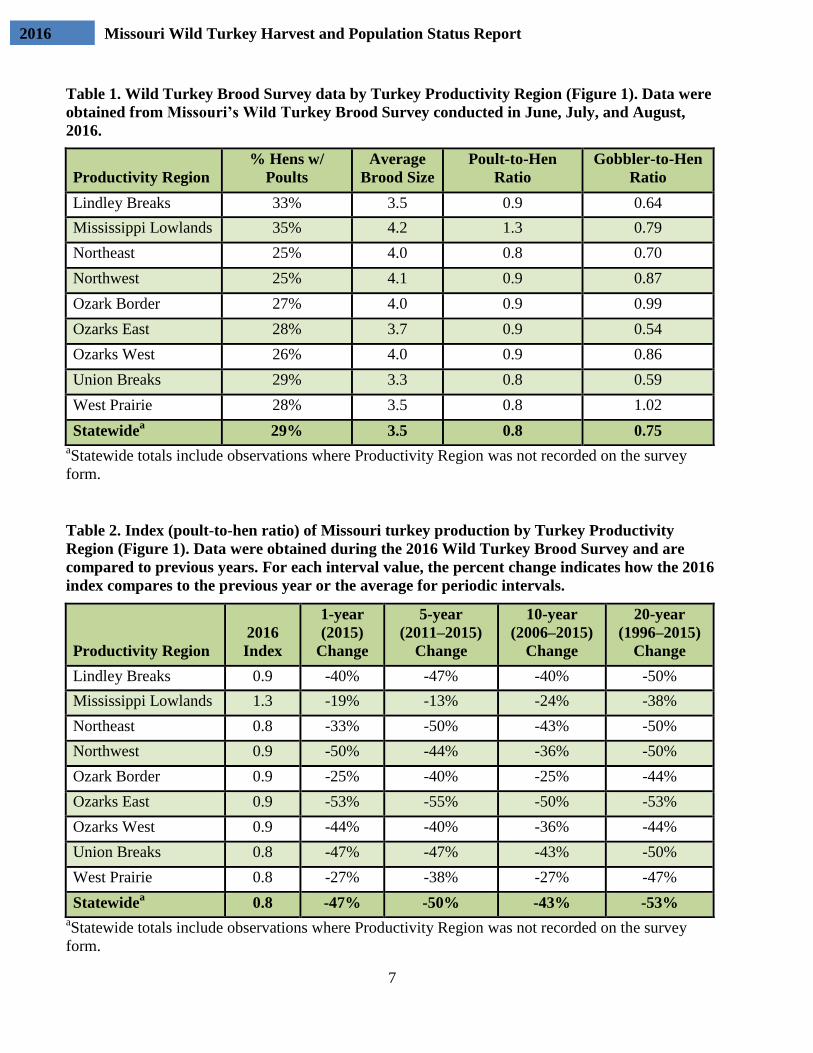
In 2016, MDC staff and citizen volunteers recorded observations of over 59,000 turkeys during the
three-month survey. At the statewide scale, 29% of hens were observed with a brood (Table 1), which
is down from 43% in 2015 and is 34% less than the previous five-year average. The percentage of
hens observed with a brood ranged from 25% in the Northeast and Northwest regions to 35% in the
Mississippi Lowlands region. Statewide, the average brood size was 3.5 poults (Table 1), which is
down from 3.9 in 2015 and 19% less than the previous five-year average. Average brood size ranged
from 3.3 in the Union Breaks region to 4.2 in the Mississippi Lowlands region.
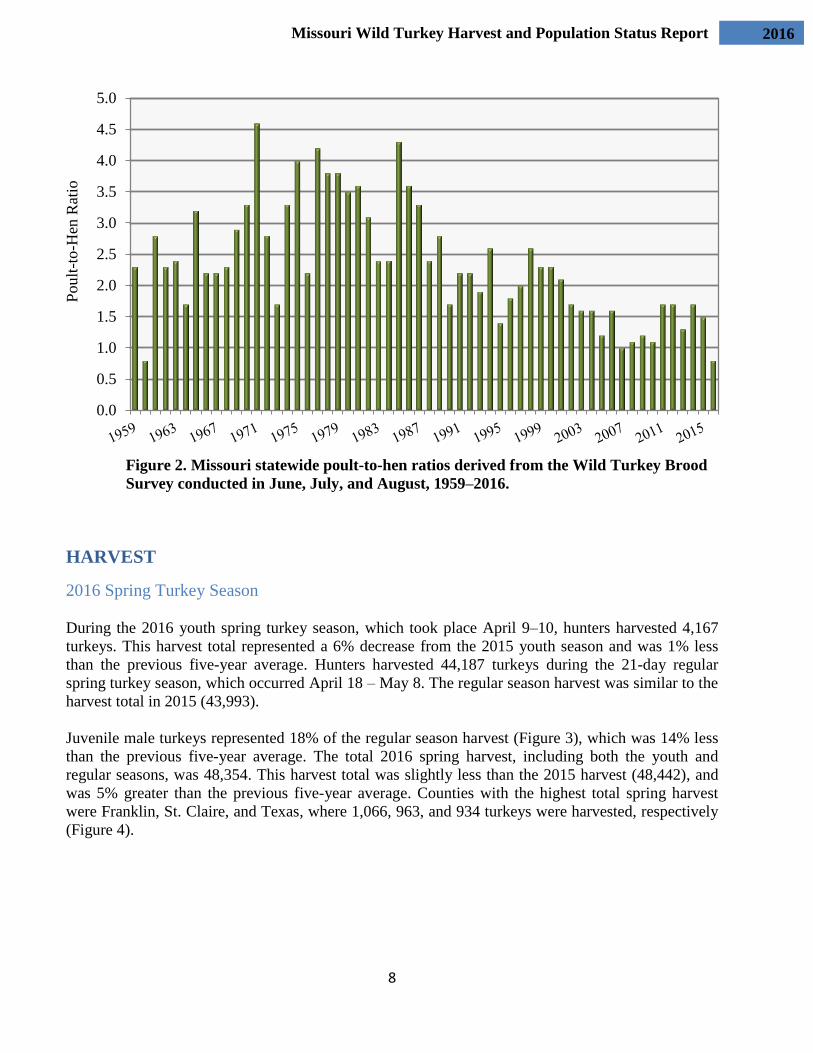
The 2016 statewide PHR of 0.8 was 47% less than the 2015 ratio, 50% less than the previous five-
year average, and 43% less than the 10-year average (Table 2). The 2016 PHR was 53% less than the
20-year average. Among Turkey Productivity Regions, PHRs ranged from 0.8 in the Northeast,
Union Breaks, and West Prairie to 1.3 in the Mississippi Lowlands (Table 2).
Prior to 2011, Missouri’s turkey population had experienced four consecutive years of poor
production characterized by low nest success and low poult survival. The average PHR during this
period was 1.1. In contrast, the average PHR from 2011–2015 was 1.6, a 45% increase. Despite
improvements in production prior to last year, the statewide PHR in 2016 was identical to the ratio in
1960, which was the lowest on record since the survey was initiated (Figure 2).
2016 Missouri Wild Turkey Harvest and Population Status Report
7
Table 1. Wild Turkey Brood Survey data by Turkey Productivity Region (Figure 1). Data were
obtained from Missouri’s Wild Turkey Brood Survey conducted in June, July, and August,
2016.
Productivity Region
% Hens w/
Poults
Average
Brood Size
Poult-to-Hen
Ratio
Gobbler-to-Hen
Ratio
Lindley Breaks 33% 3.5 0.9 0.64
Mississippi Lowlands 35% 4.2 1.3 0.79
Northeast 25% 4.0 0.8 0.70
Northwest 25% 4.1 0.9 0.87
Ozark Border 27% 4.0 0.9 0.99
Ozarks East 28% 3.7 0.9 0.54
Ozarks West 26% 4.0 0.9 0.86
Union Breaks 29% 3.3 0.8 0.59
West Prairie 28% 3.5 0.8 1.02
Statewidea
29% 3.5 0.8 0.75aStatewide totals include observations where Productivity Region was not recorded on the survey
form.
Table 2. Index (poult-to-hen ratio) of Missouri turkey production by Turkey Productivity
Region (Figure 1). Data were obtained during the 2016 Wild Turkey Brood Survey and are
compared to previous years. For each interval value, the percent change indicates how the 2016
index compares to the previous year or the average for periodic intervals.
Productivity Region
2016
Index
1-year
(2015)
Change
5-year
(2011–2015)
Change
10-year
(2006–2015)
Change
20-year
(1996–2015)
Change
Lindley Breaks 0.9 -40% -47% -40% -50%
Mississippi Lowlands 1.3 -19% -13% -24% -38%
Northeast 0.8 -33% -50% -43% -50%
Northwest 0.9 -50% -44% -36% -50%
Ozark Border 0.9 -25% -40% -25% -44%
Ozarks East 0.9 -53% -55% -50% -53%
Ozarks West 0.9 -44% -40% -36% -44%
Union Breaks 0.8 -47% -47% -43% -50%
West Prairie 0.8 -27% -38% -27% -47%
Statewidea 0.8 -47% -50% -43% -53%
aStatewide totals include observations where Productivity Region was not recorded on the survey
form.
8
2016 Missouri Wild Turkey Harvest and Population Status Report
Figure 2. Missouri statewide poult-to-hen ratios derived from the Wild Turkey Brood
Survey conducted in June, July, and August, 1959–2016.
HARVEST
2016 Spring Turkey Season
During the 2016 youth spring turkey season, which took place April 9–10, hunters harvested 4,167
turkeys. This harvest total represented a 6% decrease from the 2015 youth season and was 1% less
than the previous five-year average. Hunters harvested 44,187 turkeys during the 21-day regular
spring turkey season, which occurred April 18 – May 8. The regular season harvest was similar to the
harvest total in 2015 (43,993).
Juvenile male turkeys represented 18% of the regular season harvest (Figure 3), which was 14% less
than the previous five-year average. The total 2016 spring harvest, including both the youth and
regular seasons, was 48,354. This harvest total was slightly less than the 2015 harvest (48,442), and
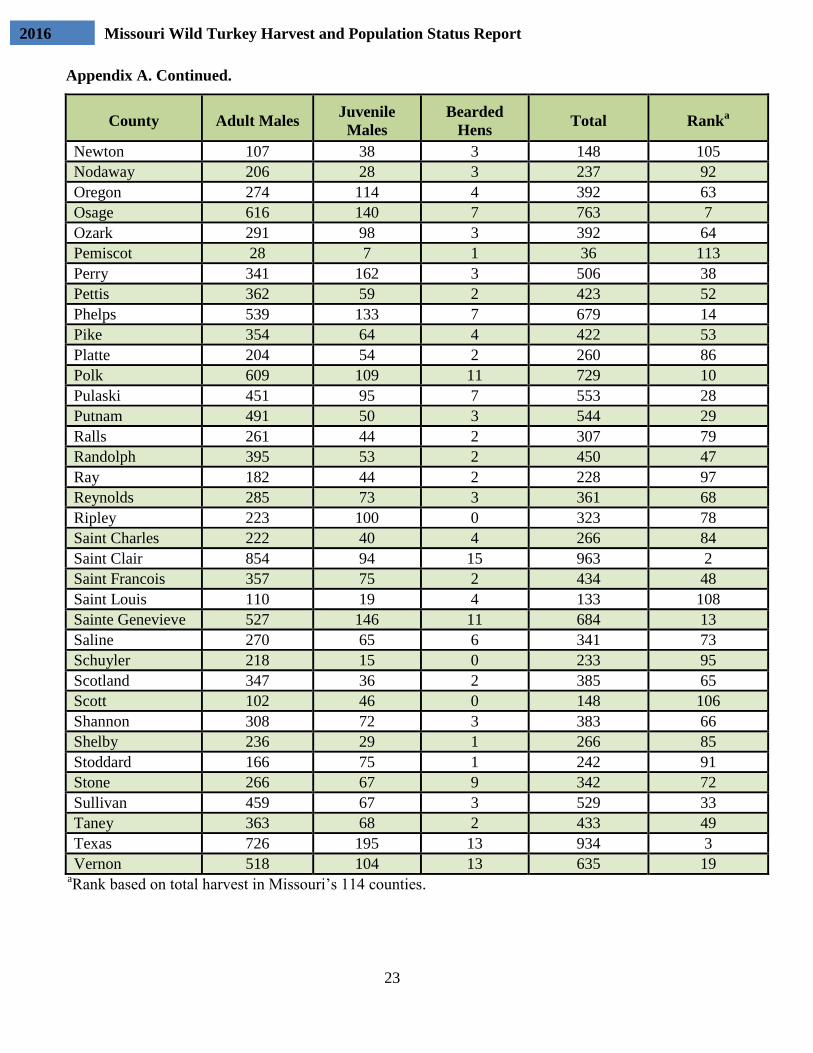
was 5% greater than the previous five-year average. Counties with the highest total spring harvest
were Franklin, St. Claire, and Texas, where 1,066, 963, and 934 turkeys were harvested, respectively
(Figure 4).
0.0
0.5
1.0
1.5
2.0
2.5
3.0
3.5
4.0
4.5
5.0
Poult
-to-H
en R
atio

2016 Missouri Wild Turkey Harvest and Population Status Report
9
Figure 3. Missouri’s statewide poult-to-hen ratio multiplied by 10, compared with the
percentage of jakes in the following year’s regular season spring harvest, 1959–2016.
Total permit sales for the 2016 spring turkey season (107,482; excluding no-cost landowner permits)
were 3% less than in 2015 (Figure 5). Spring turkey permit sales in 2016 included 99,160 (92%)
resident permits and 8,322 (8%) non-resident permits. An additional 42,624 no-cost permits were
distributed to resident landowners. The total number of spring turkey hunters in Missouri in 2016 was
144,840, which was 3% less than in 2015. The total number of hunters does not equal the permit sales
total because some hunters purchase a permit in addition to receiving a no-cost landowner permit.
Spring turkey harvest in Missouri during 2016 was 20% below the record harvest of over 60,000
birds in 2004 (Figure 5). Spring turkey hunter success stabilized from 2007–2011 after declining
during the early to mid-2000s (Figure 6). Since 2011, spring turkey hunter success has displayed a
slightly increasing trend. The success rate for permit-buyers during the 2016 spring season was 79
turkeys harvested per 1,000 hunting trips, which was 9% greater than the previous five-year average.
0
10
20
30
40
50
60
Po
ult
-to-H
en R
atio
10X
and %
Jak
es i
n
Spri
ng H
arves
t
% Jakes in Spring Harvest Poult-to-hen Ratio 10X

10
2016 Missouri Wild Turkey Harvest and Population Status Report
Figure 4. Total (youth and regular season) spring wild turkey harvest in Missouri, 2016.

2016 Missouri Wild Turkey Harvest and Population Status Report
11
Figure 5. Number of wild turkeys harvested during the spring season (youth and
regular season) in Missouri and the number of turkey hunting permits sold for the
spring season, 1960–2016. Permit sales do not include no-cost landowner permits.
Figure 6. Statewide spring turkey hunter success rate in Missouri. Data are the
number of turkeys harvested per 1,000 hunting trips, 1998–2016.
0
20,000
40,000
60,000
80,000
100,000
120,000
140,000
Har
ves
t an
d P
erm
it S
ales
Spring Harvest Permit Sales
0
20
40
60
80
100
120
1998 2000 2002 2004 2006 2008 2010 2012 2014 2016
Turk
eys
Kil
led p
er 1
,000 T
rips

12
2016 Missouri Wild Turkey Harvest and Population Status Report
2016 Fall Firearms Turkey Season
The 2016 fall firearms turkey harvest total of 3,698 was 40% less than the 2015 harvest total and was
45% below the previous five-year average. The majority of the fall firearms harvest occurred in
southern Missouri (Figure 7). The top three harvest counties were Greene, Franklin, and Wayne
where 128, 96, and 92 turkeys were harvested, respectively.
Fall firearms turkey permit sales declined by 12% in 2016. Of the 11,696 permits sold, 11,469 (98%)
were purchased by Missouri residents and 227 (2%) by nonresidents; an additional 60,761 no-cost
permits were distributed to resident landowners. Fall firearms turkey hunting in Missouri has
generally been declining in popularity since the late 1980s when over 50,000 permits were sold and
more than 28,000 turkeys were harvested during the 14-day season (Figure 8).
Although the novelty of the fall firearms turkey season may have worn off for some of Missouri’s
hunters, the increasing popularity of the archery deer and turkey season is likely to be partially
responsible for the declining interest. Additionally, declining turkey numbers during the mid-to-late
2000s are likely to have reduced hunter participation in the fall season. Missouri is not alone in
experiencing a declining trend in fall firearms turkey hunting participation, as even some states with a
strong fall turkey hunting tradition have experienced a decline in fall turkey hunter numbers.
Figure 7. Missouri fall firearms wild turkey harvest, 2016.

13
2016 Missouri Wild Turkey Harvest and Population Status Report
Figure 8. Number of wild turkeys harvested during the fall firearms turkey season
in Missouri and the number of fall firearms permits sold, 1978–2016. Permit sales
do not include no-cost landowner permits.
2016 Fall Archery Turkey Season
Hunters harvested 2,304 turkeys during the 2016 fall archery deer and turkey season (Figures 9,
10). The 2016 archery turkey harvest total was 24% less than the 2015 harvest total and was 20%
less than the previous five-year average. Unlike the fall firearms turkey harvest, which has
shown a declining trend since the late 1980s (Figure 8), the fall archery harvest increased until
the mid-2000s. Since 2005, archery turkey harvests have fluctuated substantially on an annual
basis, while showing a general trend towards stabilization (Figure 10).
0
10,000
20,000
30,000
40,000
50,000
60,000
Har
ves
t an
d P
erm
it S
ales
Fall Firearms Harvest Fall Firearms Permit Sales

14
2016 Missouri Wild Turkey Harvest and Population Status Report
Figure 9. Wild turkey harvest in Missouri during the 2016 fall archery season.
Although archery permit sales were relatively stable from the mid-1990s through the mid-2000s,
sales have since shown an increasing trend (Figure 11). In 2016, 121,489 permits were sold; the
highest number since the season’s inception. Of the archery permits sold in 2016, 111,039 (91%)
were purchased by Missouri residents and 10,450 (9%) by non-residents. An additional 93,495 no-
cost permits were distributed to resident landowners.

15
2016 Missouri Wild Turkey Harvest and Population Status Report
Figure 10. Missouri fall archery wild turkey harvest, 1975–2016.
Figure 11. Missouri archery deer and turkey permit sales, 1975–2016. Permit sales
do not include no-cost landowner permits. Prior to 1979, hunters purchased archery
deer and turkey permits separately.
0
500
1,000
1,500
2,000
2,500
3,000
3,500
Turk
eys
Har
ves
ted
0
20,000
40,000
60,000
80,000
100,000
120,000
140,000
Per
mit
Sal
es

16
2016 Missouri Wild Turkey Harvest and Population Status Report
HUNTING INCIDENTS
There was one non-fatal hunting incident during the 2016 spring turkey season. The number of spring
turkey hunting incidents in Missouri has declined considerably over the course of the last three
decades. During the late 1980s, more than 30 incidents occurred annually for every 100,000 permits
sold. During the last five hunting seasons, the average number of incidents per 100,000 permits sold
is 3.3 (Figure 12).
RECENT REGULATION CHANGES
Beginning in 2016, crossbows became a legal method for all hunters during the fall archery deer and
turkey season.
Figure 12. Hunting incidents during the spring turkey season in Missouri per 100,000
permits sold, 1987–2016.
0
5
10
15
20
25
30
35
40
45
Inci
den
ts p
er 1
00,0
00 P
erm
its
Sold

17
2016 Missouri Wild Turkey Harvest and Population Status Report
BOWHUNTER OBSERVATION SURVEY
Since 1983, MDC staff and citizen volunteers participating in the MDC’s Bowhunter Observation
Survey have recorded the number of turkeys observed while archery hunting. Survey participants also
record the number of hours they bowhunt and in which county, allowing an index of turkey
abundance to be calculated at the statewide and regional scales.
In 2016, at the statewide scale, the number of turkeys observed per 1,000 hours bowhunting was 250
(Figure 13). At the regional scale, index values ranged from 188 in the Lindley Breaks to 360 in the
Ozark Border (Table 3). The statewide average of 250 was 34% less than in 2015 and was 35% less
than the previous five-year average. The statewide index remains 38% and 51% below the previous
10 and 20-year averages, respectively (Table 3).
Figure 13. Number of wild turkeys observed during the Missouri Department of
Conservation’s Bowhunter Observation Survey, 1983–2016. Data are the average
number of turkeys observed per 1,000 hours bowhunting at the statewide scale.
0
100
200
300
400
500
600
700
800
900
Turk
eys
Obse
rved
per
1,0
00 H
ours
Bow
hunti
ng

18
2016 Missouri Wild Turkey Harvest and Population Status Report
Table 3. Index of wild turkey abundance in Missouri by Turkey Productivity Region (Figure 1).
Data were obtained from the Conservation Department’s Bowhunter Observation Survey. Index
values are the average number of turkeys observed per 1,000 hours bowhunting. For each
interval value, the % change indicates how the 2016 index compares to the previous year or the
average for periodic intervals.
NORTHEAST MISSOURI WILD TURKEY RESEARCH PROJECT UPDATE
Introduction
In 2013, the MDC began a five-year wild turkey research project in north Missouri in partnership
with the University of Missouri and the University of Washington. The study is being conducted in
Putnam, Schuyler, Monroe, and Marion Counties. Funding for the project is provided by the MDC
and grants from the U.S. Fish and Wildlife Service’s Wildlife Restoration Program and the George
Clark Missouri State Chapter of the National Wild Turkey Federation. The research project will
provide information that will be used by the Conservation Department’s Wild Turkey Management
Program to monitor the turkey population and assist with making decisions about hunting regulations.
The Conservation Department uses a science-based approach to manage the state’s wild turkey
population and this research project is just one of the many ways that the Department obtains the
information used in its program.
The goal of the research project is to develop population models, which will provide annual estimates
of turkey population size, survival rates, harvest rates (percentage of the population shot by hunters),
recruitment (number of young produced that enter the population), and the growth rate of the turkey
population. A computer software program will also be developed to facilitate use of the population
models. Researchers will be capturing and radio-tracking turkeys throughout the four-county study
area. During trapping efforts, all turkeys are released in the same fields where they are captured. The
Productivity Region
2016
Index
1-year
(2015)
Change
5-year
(2011–2015)
Change
10-year
(2006–2015)
Change
20-year
(1996–2015)
Change
Lindley Breaks 188 -25% -38% -41% -52%
Mississippi Lowlands 263 +112% +59% -9% -6%
Northeast 238 -40% -45% -44% -62%
Northwest 245 -41% -43% -55% -67%
Ozark Border 360 -29% -21% -15% -31%
Ozarks East 274 -5% +2% +2% -15%
Ozarks West 195 -51% -42% -44% -54%
Union Breaks 284 -27% -23% -26% -33%
West Prairie 273 -40% -42% -48% -57%
Statewide 250 -34% -35% -38% -51%

19
2016 Missouri Wild Turkey Harvest and Population Status Report
field-based portion of the research project will provide the Conservation Department with estimates
of seasonal and annual survival for adult gobblers, jakes, and hens, as well as harvest rate estimates
during the spring and fall hunting seasons.
Fitting wild turkeys with radio-transmitters allows researchers to track the birds and determine
survival throughout the year in addition to identifying the various sources of mortality. Of central
importance will be determining what percentage of adult gobblers and jakes are harvested during the
spring hunting season. To allow harvest rates to be estimated, a toll-free phone number has been
inscribed on each turkey band. Should a hunter happen to shoot a banded turkey, in addition to
reporting their bird through the Telecheck system, the Conservation Department asks that they call
the toll-free number on the band. The information gained from band returns is critically important to
the success of the project.
In addition to determining the percentage of adult gobblers and jakes that are harvested during the
spring hunting season, researchers will determine what percentage of banded turkeys are harvested
during the fall season. Researchers will also be monitoring hens closely during the nesting and brood-
rearing seasons. The study will allow researchers to answer some basic questions about turkey
reproduction, including: What proportion of hens attempt to nest each year? Does this differ between
adult and juvenile hens? What percentage of hens nest successfully? Of those hens that nest
successfully, what is the survival rate of their poults? Although previous research projects have shed
light on the answers to these questions, brood survey results indicate considerable declines in turkey
production since the last turkey research project was conducted in Missouri and having updated
information is important.
Years 1–3 – Project Summary
Researchers have captured over 1,300 turkeys during the first four winter field seasons, including 381
males and 985 hens. All males were banded and radio-tagged; 136 hens were banded and radio-
tagged, and 849 hens were marked only with bands.
Annual survival rates of radio-tagged hens have ranged from 50–63%. Winter was the season of
highest survival during the first (93%) and third (98%) years of the project. During the second year of
the project, highest seasonal survival was during spring (89%). Lowest seasonal survival period was
summer during years one (84%) and two (78%). During year three, spring was lowest seasonal
survival period (81%).
Annual survival of adult gobblers (39–46%) was lower than that of hens and jakes (68–77%). For
adult gobblers, seasonal survival has been greatest in fall (92%) during years one and two, and in
winter (98%) during year three. Seasonal survival rates of adult gobblers have been lowest during
spring (56–69%). Greatest seasonal survival of jakes has varied from summer (98%) in year one,
summer and winter during year two (95%), and fall (100%) in year three. Lowest season survival of
jakes has been during spring in years one and three (both 85%) and during fall (89%) in year two.

20
2016 Missouri Wild Turkey Harvest and Population Status Report
During the first three years of the project, predation has been the leading cause of death of hens and
jakes. Based on evidence at kill sites, coyotes, bobcats, and great-horned owls were suspected of
having predated radio-tagged turkeys. Hunter harvest has been the leading cause of death for adult
gobblers. During the first three years of the project, the percentage of adult gobblers harvested during
the spring season has ranged from 15–31%. Not surprisingly, the percentage of jakes harvested
during the spring season (0–6%) has been considerably lower than that of adult gobblers.
Researchers were radio-tracking 126 turkeys (38 adult gobblers, 55 jakes, and 33 hens) during the
2014 fall turkey season; an additional 68 hens had been banded the previous winter, but had not been
fitted with radio-tags. During the 2014 fall season, three jakes (2% of the radio-tagged turkeys) were
harvested. None of the marked hens were harvested. During the 2015 fall turkey season, 131 turkeys
(39 adult gobblers, 60 jakes, and 32 hens) were being radio-tracked and an additional 219 hens had
been banded the previous winter, but not radio-tagged. Similar to 2014, 2% of the radio-tagged
turkeys were harvested during the 2015 fall season. This included one hen and two males (one adult
gobbler and one jake). An additional banded hen (not radio-tagged) was also harvested. On opening
day of the 2016 fall turkey season, researchers were radio-tracking 126 turkeys (46 adult gobblers, 47
jakes, and 33 hens); an additional 207 hens had been banded the previous winter. During the fall
season, one radio-tagged hen was harvested, which was less than one percent of the radio-tagged
turkeys. An additional banded hen (not radio-tagged) was also harvested.
Of the hens radio-tracked during the first three years of the project, the median dates of initial nest
incubation initiation have ranged from May 7–16. Most radio-tagged adult hens (69–88%) have
initiated incubation of at least one nest, whereas only 40–60% of juvenile hens initiated incubation.
Of the adult hens that failed their initial nesting attempt, 30–60% initiated incubation of a second
nest. One-third of juvenile hens have renested during the first three years of the study.
During years 1–3, the percentage of hens that have been successful at hatching poults (female
success) has ranged from 17–27%. Female success has been greater for adult hens (29%, 24%, 19%)
than for juvenile hens (20%, 10%, 0%). Average first nest clutch sizes have been 10, 11, and 11 eggs,
respectively. Of the eggs laid in successful nests, 94%, 82%, and 97% hatched. During the first three
years of the project, 47%, 25%, and 15% of poults have survived to be about a month old.

21
2016 Missouri Wild Turkey Harvest and Population Status Report
Appendix A. 2016 Missouri spring turkey harvest (youth and regular seasons combined).
aRank based on total harvest in Missouri’s 114 counties.
County Adult Males Juvenile
Males
Bearded
Hens Total Rank
a
Adair 381 66 5 452 45
Andrew 194 33 6 233 94
Atchison 144 24 4 172 103
Audrain 215 30 2 247 89
Barry 177 49 3 229 96
Barton 267 54 8 329 74
Bates 394 104 6 504 39
Benton 691 113 12 816 5
Bollinger 444 115 8 567 27
Boone 440 85 10 535 32
Buchanan 127 25 1 153 104
Butler 131 51 1 183 101
Caldwell 181 50 4 235 93
Callaway 621 189 10 820 4
Camden 566 99 13 678 15
Cape Girardeau 342 143 8 493 41
Carroll 278 50 1 329 75
Carter 186 81 1 268 83
Cass 274 120 2 396 61
Cedar 600 99 9 708 11
Chariton 377 43 1 421 54
Christian 379 118 6 503 40
Clark 322 51 3 376 67
Clay 146 37 0 183 102
Clinton 106 27 1 134 107
Cole 293 97 3 393 62
Cooper 295 58 1 354 70
Crawford 399 111 7 517 36
Dade 332 80 4 416 57
Dallas 487 103 8 598 24
Daviess 328 85 8 421 55
DeKalb 148 35 3 186 100
Dent 505 154 17 676 16
Douglas 497 114 11 622 20
Dunklin 8 5 0 13 114
Franklin 826 223 17 1,066 1

22
2016 Missouri Wild Turkey Harvest and Population Status Report
Appendix A. Continued.
aRank based on total harvest in Missouri’s 114 counties.
County Adult Males Juvenile
Males
Bearded
Hens Total Rank
a
Gasconade 545 146 9 700 12
Gentry 157 33 1 191 99
Greene 605 144 12 761 8
Grundy 267 52 7 326 76
Harrison 402 61 4 467 43
Henry 554 102 19 675 17
Hickory 463 69 7 539 30
Holt 204 40 4 248 88
Howard 355 68 2 425 50
Howell 393 121 4 518 35
Iron 216 63 4 283 82
Jackson 179 69 5 253 87
Jasper 256 63 7 326 77
Jefferson 472 135 13 620 21
Johnson 377 92 3 472 42
Knox 256 35 4 295 80
Laclede 658 133 5 796 6
Lafayette 197 47 2 246 90
Lawrence 322 76 9 407 59
Lewis 187 35 5 227 98
Lincoln 343 76 6 425 51
Linn 356 59 5 420 56
Livingston 325 81 4 410 58
Macon 642 89 11 742 9
Madison 270 78 1 349 71
Maries 461 126 5 592 25
Marion 262 25 3 290 81
McDonald 61 24 2 87 110
Mercer 457 48 8 513 37
Miller 483 118 5 606 23
Mississippi 53 9 0 62 111
Moniteau 293 60 4 357 69
Monroe 560 85 6 651 18
Montgomery 360 83 7 450 46
Morgan 422 109 6 537 31
New Madrid 45 16 0 61 112
23
2016 Missouri Wild Turkey Harvest and Population Status Report
Appendix A. Continued.
aRank based on total harvest in Missouri’s 114 counties.
County Adult Males Juvenile
Males
Bearded
Hens Total Rank
a
Newton 107 38 3 148 105
Nodaway 206 28 3 237 92
Oregon 274 114 4 392 63
Osage 616 140 7 763 7
Ozark 291 98 3 392 64
Pemiscot 28 7 1 36 113
Perry 341 162 3 506 38
Pettis 362 59 2 423 52
Phelps 539 133 7 679 14
Pike 354 64 4 422 53
Platte 204 54 2 260 86
Polk 609 109 11 729 10
Pulaski 451 95 7 553 28
Putnam 491 50 3 544 29
Ralls 261 44 2 307 79
Randolph 395 53 2 450 47
Ray 182 44 2 228 97
Reynolds 285 73 3 361 68
Ripley 223 100 0 323 78
Saint Charles 222 40 4 266 84
Saint Clair 854 94 15 963 2
Saint Francois 357 75 2 434 48
Saint Louis 110 19 4 133 108
Sainte Genevieve 527 146 11 684 13
Saline 270 65 6 341 73
Schuyler 218 15 0 233 95
Scotland 347 36 2 385 65
Scott 102 46 0 148 106
Shannon 308 72 3 383 66
Shelby 236 29 1 266 85
Stoddard 166 75 1 242 91
Stone 266 67 9 342 72
Sullivan 459 67 3 529 33
Taney 363 68 2 433 49
Texas 726 195 13 934 3
Vernon 518 104 13 635 19

24
2016 Missouri Wild Turkey Harvest and Population Status Report
Appendix A. Continued.
aRank based on total harvest in Missouri’s 114 counties.
County Adult Males Juvenile
Males
Bearded
Hens Total Rank
a
Warren 313 87 4 404 60
Washington 362 91 6 459 44
Wayne 403 123 2 528 34
Webster 484 113 12 609 22
Worth 96 9 1 106 109
Wright 463 113 15 591 26
Totals 38,948 8,805 601 48,354

25
2016 Missouri Wild Turkey Harvest and Population Status Report
Appendix B. 2016 Missouri fall turkey harvest (firearms and archery seasons combined).
aRank based on total harvest in Missouri’s 114 counties.
County Adult
Males
Adult
Females
Juvenile
Males
Juvenile
Females Total Rank
a
Adair 13 26 3 17 59 44
Andrew 4 7 0 8 19 95
Atchison 1 3 2 2 8 106
Audrain 9 5 4 9 27 83
Barry 9 8 5 3 25 87
Barton 17 16 6 11 50 55
Bates 13 19 6 16 54 54
Benton 29 26 5 16 76 25
Bollinger 14 19 10 24 67 34
Boone 23 18 7 14 62 41
Buchanan 1 0 2 1 4 110
Butler 8 8 3 8 27 84
Caldwell 8 5 0 7 20 93
Callaway 19 24 12 30 85 19
Camden 28 31 16 32 107 9
Cape Girardeau 21 17 7 18 63 40
Carroll 5 9 6 4 24 90
Carter 5 22 11 19 57 49
Cass 14 12 12 17 55 53
Cedar 34 30 16 20 100 12
Chariton 7 7 8 9 31 77
Christian 36 23 7 27 93 15
Clark 5 12 5 4 26 86
Clay 9 5 1 5 20 94
Clinton 4 6 0 5 15 98
Cole 18 19 7 21 65 38
Cooper 4 6 1 4 15 99
Crawford 19 23 11 27 80 23
Dade 20 14 6 19 59 45
Dallas 34 31 15 37 117 8
Daviess 21 12 5 19 57 50
DeKalb 6 10 1 2 19 96
Dent 22 20 4 24 70 30
Douglas 17 15 6 20 58 46
Dunklin 0 0 0 0 0 114

26
2016 Missouri Wild Turkey Harvest and Population Status Report
Appendix B. Continued.
aRank based on total harvest in Missouri’s 114 counties.
County Adult
Males
Adult
Females
Juvenile
Males
Juvenile
Females Total Rank
a
Franklin 36 46 15 50 147 2
Gasconade 26 15 12 18 71 28
Gentry 6 4 1 2 13 102
Greene 60 46 17 55 178 1
Grundy 7 4 3 9 23 91
Harrison 12 10 0 14 36 68
Henry 17 19 5 44 85 20
Hickory 27 14 8 24 73 27
Holt 7 13 4 8 32 75
Howard 10 5 5 9 29 78
Howell 21 16 15 18 70 31
Iron 16 15 6 21 58 47
Jackson 17 14 3 9 43 62
Jasper 30 16 7 4 57 51
Jefferson 33 23 8 16 80 24
Johnson 12 11 7 16 46 59
Knox 4 6 5 10 25 88
Laclede 28 30 21 46 125 5
Lafayette 8 10 7 3 28 80
Lawrence 27 21 10 10 68 33
Lewis 8 10 4 7 29 79
Lincoln 10 13 3 9 35 70
Linn 17 15 2 8 42 64
Livingston 15 11 5 15 46 60
Macon 13 24 8 17 62 42
Madison 17 11 6 24 58 48
Maries 37 19 21 43 120 6
Marion 2 1 0 4 7 107
McDonald 0 4 0 0 4 111
Mercer 16 13 9 11 49 56
Miller 21 12 11 23 67 35
Mississippi 1 1 0 0 2 113
Moniteau 10 10 3 9 32 76
Monroe 20 14 6 17 57 52
Montgomery 14 14 2 17 47 57

27
2016 Missouri Wild Turkey Harvest and Population Status Report
Appendix B. Continued.
aRank based on total harvest in Missouri’s 114 counties.
County Adult
Males
Adult
Females
Juvenile
Males
Juvenile
Females Total Rank
a
Morgan 36 16 8 26 86 18
New Madrid 1 1 0 1 3 112
Newton 3 6 0 1 10 104
Nodaway 1 3 0 3 7 108
Oregon 14 16 16 21 67 36
Osage 30 28 14 25 97 14
Ozark 20 12 6 5 43 63
Pemiscot 2 3 1 0 6 109
Perry 15 24 12 15 66 37
Pettis 6 6 6 10 28 81
Phelps 18 16 9 28 71 29
Pike 13 15 3 9 40 67
Platte 8 10 1 2 21 92
Polk 23 25 14 25 87 17
Pulaski 35 15 12 22 84 21
Putnam 14 17 4 7 42 65
Ralls 13 10 2 11 36 69
Randolph 15 13 3 3 34 71
Ray 5 6 1 3 15 100
Reynolds 20 15 8 21 64 39
Ripley 13 15 3 11 42 66
Saint Charles 9 14 5 5 33 74
Saint Clair 51 43 17 27 138 3
Saint Francois 23 12 9 16 60 43
Saint Louis 4 6 1 7 18 97
Sainte Genevieve 24 15 13 22 74 26
Saline 8 4 1 2 15 101
Schuyler 9 12 5 2 28 82
Scotland 6 12 1 8 27 85
Scott 5 3 0 5 13 103
Shannon 12 10 12 13 47 58
Shelby 7 8 3 7 25 89
Stoddard 16 17 24 24 81 22
Stone 14 9 1 10 34 72
Sullivan 18 15 5 8 46 61

28
2016 Missouri Wild Turkey Harvest and Population Status Report
Appendix B. Continued.
aRank based on total harvest in Missouri’s 114 counties.
County Adult
Males
Adult
Females
Juvenile
Males
Juvenile
Females Total Rank
a
Taney 23 18 8 21 70 32
Texas 20 33 14 34 101 11
Vernon 42 27 14 16 99 13
Warren 6 15 3 10 34 73
Washington 27 17 14 31 89 16
Wayne 30 35 22 44 131 4
Webster 40 27 10 41 118 7
Worth 3 2 1 3 9 105
Wright 33 26 18 30 107 10
Totals 1,837 1,670 773 1,724 6,004

Missouri Department of Conservation