MISSOURI NCCI LOSS COST ACTUARY REVIEW
160
2020 MISSOURI NCCI LOSS COST ACTUARY REVIEW Proposed to be Effective January 1, 2021 MISSOURI DEPARTMENT OF COMMERCE & INSURANCE
Transcript of MISSOURI NCCI LOSS COST ACTUARY REVIEW

2020
MISSOURI NCCILOSS COST ACTUARY
REVIEWProposed to be Effective January 1, 2021
MISSOURI DEPARTMENT OF COMMERCE & INSURANCE

2
October 21, 2020
Ms. LeAnn CoxRegulatory Compliance ManagerProperty and Casualty SectionMissouri Department of Commerce & Insurance301 W. High St., Room 530Jefferson City, MO 65101
Dear Ms. Cox:
Enclosed is the report detailing our actuarial review of the Missouri NCCI Advisory Loss Costs and Rating Values Filing proposed to be effective January 1, 2021.
The first section in the text of our report is the Executive Summary section. This section presents our Conclusions. It also describes the Purpose and Scope of our report, explains the Distribution and Use of our report, and provides the Conditions and Limitations underlying our work.
The second section of our report is a Summary of the NCCI’s Methodology for determining the indicated voluntary loss costs and rating factors. The third section of our report contains the Analysis Performed by Taylor & Mulder.
The last section of the text of our report details our Review of the NCCI’s Response to Interrogatories.
Please call if you have any questions regarding any aspect of our report.
Sincerely,
Evelyn Toni Mulder, FCAS, MAAA, FCA
Daniel W. Lupton, FCAS, MAAA, CSPA, MBA
Bobby J. Jaegers, ACAS, MAAAEnclosures
Daniel W Luptonnn FFFFFFFFFFFFFFFFFFFFFFFFFFFFFFFFFFFFFFFFFFFFFFFFFFFFFFFFFFFFFFFFFFFFFFFFFFFFFFFCACCCCCCCCCCCCCCCCC S MAA
Sincerely,
Evelynnnnnnnnnnnnnnnnnnnnnnnnnnnnnnnnnnnnnnnnnnnn Toni Mulder FCAS MAAA FCA
Bobby J. Jaeeeeeeaeeeeeeeeeeaeeeeeeeeeeeeaeeeeaeeeaeeeeeeeeeeeeeeeeeaeaeeeaeeeaeeeeeeeeeeeeeeeeeeeeeeeeeeeeeaaeeaeeaeeegers, ACAAAAAAAAAAAAAAAAAAAAAAAAAAAAAAAAAAAAAAAAAAAAAAAAAAAAAAAAAA AS, M

3
Missouri Department of Commerce and InsuranceActuarial Review of the
National Council on Compensation Insurance Missouri Advisory Loss Costs and Rating Values Filing
Contents
Executive Summary ........................................................................................................................ 6
Purpose and Scope ...................................................................................................................... 6
Conclusions ................................................................................................................................. 7
Major Factors Influencing Overall Voluntary Loss Cost Level Change Indication................ 7
Indication Excluding Assigned-Risk Experience........................................................................ 8
Report Distribution and Use........................................................................................................ 9
Conditions and Limitations ....................................................................................................... 10
Summary of the NCCI’s Methodology......................................................................................... 11
Calculation of the Overall Voluntary Advisory Loss Cost Level Change................................ 12
Changes to Loss Adjustment Expense Methodology................................................................ 15
Allocation of Overall to Industry Group ................................................................................... 16
Allocation to Occupational Classifications ............................................................................... 17
Analysis Performed by Taylor & Mulder ..................................................................................... 17
Loss Development Method ....................................................................................................... 17
Trend ......................................................................................................................................... 18
Loss Adjustment Expenses........................................................................................................ 22

4
Review of the NCCI’s Response to Interrogatories...................................................................... 22
Review of Responses to Interrogatories Dated September 28, 2020 ........................................ 23
Question 1: DATA................................................................................................................. 23
Question 2: IMPACTS OF CHANGES ................................................................................ 23
Question 3: TERRORISM..................................................................................................... 23
Question 4: LOSS DEVELOPMENT TRIANGLES ............................................................ 23
Question 5: LOSS DEVELOPMENT FACTORS ................................................................ 24
Question 6: FACTOR TO ADJUST LOSSES FOR PRIOR POLICY YEARS ................... 24
Question 7: FACTOR TO ADJUST TAIL FACTOR TO A LIMITED BASIS................... 24
Question 8: AOE ANALYSIS............................................................................................... 25
Question 9: DCCE................................................................................................................. 25
Question 10: DCCE............................................................................................................... 25
Question 11: AOE ................................................................................................................. 26
Question 12: INDUSTRY GROUP DIFFERENTIALS ....................................................... 26
Question 13: OCCUPATIONAL CLASSES ........................................................................ 26
Question 14: TREND ............................................................................................................ 26
Question 15: ASSIGNED RISK PLAN ................................................................................ 26
Question 16: CAPPING......................................................................................................... 27
Question 17: CLASS RATEMAKING ................................................................................. 27
Question 18: CLASSIFICATIONS....................................................................................... 27
5
Question 19: INDICATION DATA...................................................................................... 29
Review of Responses to Interrogatories Dated October 13, 2020 ............................................ 30
Question 1: AOE PROVISION ............................................................................................. 30
Review of Responses to Interrogatories Dated October 20, 2020 ............................................ 30
Question 1: AOE PROVISION ............................................................................................. 30
Attachment A: NCCI Responses to Objections including Exhibits
Attachment B: Proposed and Current Loss Costs by Class Code

6
Executive Summary
Purpose and Scope
Taylor & Mulder, Incorporated (“T&M”) was retained by the Missouri Department of Commerce
and Insurance (“the Department”) to provide an actuarial review of the Missouri Loss Costs and
Rating Values Filing (“the Filing”) filed by the National Council on Compensation Insurance
(“NCCI”) with a proposed effective date of January 1, 2021. This report contains our summary,
conclusions, actuarial aspects raised with the NCCI, and a description of the analysis underlying
our conclusions.
The scope of our work consisted of an actuarial review of all the components underlying the
calculation of the Missouri advisory loss costs and the allocation of the overall indications to
industry group and then to occupational classification. We reviewed each one of the analyses
leading to the NCCI indications in order to determine (1) if the factors and the underlying
calculations were justified based on the experience and actuarial soundness, (2) if the methodology
and judgments were reasonable and (3) if the resulting advisory loss costs comply with Missouri
law to the extent that the resulting loss costs are not excessive, inadequate or unfairly
discriminatory.
We provided three sets of written interrogatories to the NCCI. Our interrogatories requested
additional supporting data and calculations, which were also reviewed in order to reach our
conclusions. The NCCI provided T&M with all the requested supporting information and
additional schedules in a timely fashion.

7
The responses to the objections prepared by the NCCI were very thorough and detailed and
included a significant number of supporting schedules, data and information that were very helpful.
Conclusions
The NCCI is proposing an overall average increase of 1.0% in voluntary loss, effective January 1,
2021. Among Industry Groups, the 1.0% voluntary loss cost increase is allocated to industry group
as follows: a 1.4% increase for manufacturing, a 2.3% increase for office & clerical, a 1.7%
increase for goods & services, a 1.1% decrease for contracting, and a 0.9% increase for
miscellaneous.
NCCI Proposed Average Loss Cost Level Changes by Industry Group
Industry Group Average ChangeManufacturing 1.4%Contracting -1.1%Office & Clerical 2.3%Goods & Services 1.7%Miscellaneous 0.9%
T&M has reviewed the methodology, calculations, assumptions, judgments, and selections of the
advisory loss costs changes effective January 1, 2021 as filed by the NCCI. T&M concludes that
there are several aspects of the filing where we think that different selections are more appropriate.
Therefore, we would recommend no change to the loss costs as opposed to the +1.0%
recommended by NCCI.
Major Factors Influencing Overall Voluntary Loss Cost Level Change Indication
Although a wide variety of factors affect the overall voluntary loss cost levels, a subset of
factors may be seen as having the greatest impact on the indicated loss costs:

8
The filing was based on premium and loss experience from the two most recent
experience periods. These periods are consistent with periods used in prior filings as
can be seen by the modest rate increase and the relatively stable indication over the past
two loss cost filings.
There have been slight increases in indemnity and medical loss ratios during the
experience period. The changes in loss ratio for the indemnity and medical coverages
combined indicates a slight increase in the average loss ratio in the current filing from
98.5% to 100.5%.
Projected loss Ratio Including Benefit Changes
CoverageEffective 1/1/2020
Effective 1/1/2021
Indemnity Prior Policy Year 40.8% 39.1%Indemnity Current Policy Year 40.0% 41.8%Medical Prior Policy Year 56.3% 59.8%Medical Current Policy Year 59.9% 60.2%Total Prior Policy Period 97.1% 98.9%Total Current Policy Period 99.9% 102.0%Average 98.5% 100.5%
The prior and current policy years for the filing effective 1/1/2020 are policy years
2016 and 2017 respectively whereas the prior and current policy years for the filing
effective 1/1/2021 are 2017 and 2018, respectively.
The provision for LAE has increased from 18.7% in the prior filing effective 1/1/2020
to 19.3% for this filing, resulting in a 0.5% loss cost increase.
Indication Excluding Assigned-Risk Experience
As part of our review, we requested that NCCI provide the calculation for the indicated loss cost
change after removing the assigned-risk experience. After removing the assigned-risk experience,

9
there would be minimal changes to the loss development factors and trend assumptions therefore
the only changes would be to the premium and losses that were reported to NCCI. The table below
shows the percentage of premiums and ultimate losses that were attributable to the assigned risk
program for each policy year.
Percentage of Premiums and Ultimate Losses in the Assigned Risk PlanPolicy Year Premium Indemnity Ultimate Losses Medical Ultimate Losses
2018 1.4% 2.2% 4.0%2017 1.5% 2.1% 3.2%
As can be seen from the table, the assigned risk plan accounts for a relatively small portion of the
premiums and ultimate losses in the experience. However, since there is a higher percentage of
losses in the assigned risk plan than premiums, if the associated premiums and losses were to be
removed, this would cause the indicated rate change for just the voluntary market to decrease. In
the supplementary analysis provided by NCCI, they have calculated that the indicated loss cost
change would be 0.993 or -0.7% if the assigned risk experience were to be excluded.
Report Distribution and Use
This report has been prepared solely for internal use by the Missouri Department of Commerce
and Insurance to assist the Department with its review of the NCCI filing. This report may be
provided to other Missouri state agencies. The Exhibits are integral parts of this report. Other
distribution or use of this report by the Department or parties described above is not authorized
without the prior written permission of T&M. After approval by T&M, this report may be
reproduced only in its entirety.

10
This report was prepared for use by persons technically competent in insurance financial matters.
Persons receiving this report should be made aware of the availability of T&M personnel to answer
questions and/or amplify on any matter addressed therein.
Conditions and Limitations
The actuarial review contained in this report was performed in conformance with sound actuarial
standards and principles. With regard to projections of ultimate values, it should be understood
that the emergence and settlement of claims are subject to uncertainty. While we have used our
best professional judgment in all instances, projections of future ultimate losses and loss expenses
are inherently uncertain because of the random nature of claims occurrences. They are also
dependent upon future contingent events and are affected by many additional factors.
Claim reserving procedures and settlement philosophy, current and perceived social and economic
inflation, current and future court and jury attitudes, improvements in medical technology, and
many other economic, legal, political, and social factors all can have significant effects on ultimate
claim costs. Therefore, we cannot warrant that actual developments will not differ from current
projections. Such differences could be upward or downward and could be significant.
In summary, judgments regarding voluntary loss cost and assigned risk rate levels are subject to
potential variations in estimation due to:
(1) the fact that the ultimate liability of associated claims is subject to the outcome of
events yet to occur,
(2) the unanticipated changes in the legal, economic, or claims adjudication environments,

11
(3) statistical fluctuation in losses around the estimated or expected values when all other
factors remain constant; and,
(4) the fact that the actual future loss and loss payment and reporting patterns may differ
from those applied in the determination of the expected losses or there may be
unanticipated changes in the loss and expense loss and expense reporting patterns.
Accordingly, no assurance can be given that future loss emergence will not deviate from the
estimated ultimate loss and loss adjustment expenses. We performed a detailed review of the major
aspects of each section of the ratemaking process. We believe our conclusions are based on a
reasonable application of generally accepted actuarial procedures and techniques applied to the
data and information provided by the NCCI.
T&M relied without audit or verification on historical loss, loss adjustment expense, exposure
data, and other information compiled by the NCCI. T&M has relied upon the data provided and
on the written statements made regarding the quality, accuracy, and completeness of the data and
information supplied. Any inaccuracies or inconsistencies in the data or the written statements
could have a significant effect on the conclusions drawn.
Summary of the NCCI’s Methodology
The NCCI calculates proposed advisory loss cost changes by first calculating an overall proposed
change in advisory loss cost level for new and renewal voluntary market policies. From this point,

12
the overall proposed change is allocated to industry group and then to occupational classification
within each industry group and ultimately to each class.
Calculation of the Overall Voluntary Advisory Loss Cost Level Change
Overall voluntary advisory loss cost level change is calculated based on both voluntary and
assigned risk market data combined for the two most recent policy years.
In this filing, policy years are 2017 and 2018 are evaluated as of December 31, 2019. The indicated
changes in loss and loss adjustment expenses are calculated separately for each policy year and
then combined in order to obtain the overall indicated change in advisory loss costs.
The change in loss costs excluding expenses is calculated first. This calculation involves adjusting
historical earned premiums to current rate levels and removing the portion expected to cover loss
adjustment expenses. The limited losses are developed to ultimate loss levels, trended and then
compared to the portion of the on-level premiums available for payment of such benefits (i.e.,
excluding added expenses and profits). This calculation is performed separately for indemnity
losses and medical losses, and the resulting ratios are added together. A final ratio of 1.000 would
indicate that the portion of premiums available for the payment of benefits was exactly equal to
the cost of such benefits. A ratio greater than 1.000 would indicate that the cost of the benefits
exceeded the premium available to pay for such, and as a result, an increase in loss costs is
indicated. A ratio lower than 1.000 indicates that a decrease in loss costs is indicated.
The specific steps involved in calculation of this ratio are as follows:

13
1. Standard earned premiums for each policy year are developed to ultimate and multiplied
by an on-level factor. This factor includes placing the premium on level to reflect approved
loss cost and rate level changes as well as statutory benefit levels for all years in the
experience period. The factor also removes premium related to loss-based expenses
because the purpose is to derive loss costs, which exclude expenses.
2. Ultimate limited medical and indemnity losses are multiplied by an on-level factor to obtain
on-level ultimate limited medical and indemnity losses separately for both medical and
indemnity.
3. The results are divided by the on-level ultimate standard earned premium to produce the
loss cost.
4. The resulting loss cost ratio is next multiplied by trend factors which are calculated based
on an exponential trend of indemnity and medical loss ratios for Policy Years 2004 to 2018
(See Appendix A-III). The following chart shows current approved and selected annual
loss ratio trend factors for medical and indemnity:
Annual Trend FactorsIndemnity Medical
Current Approved Annual Loss Ratio Trend Factor 0.980 0.990Selected Annual Loss Ratio Trend Factor 0.980 0.990
The selected trend factor is then applied based on the length of the trend period calculated
from the midpoint of each policy year to the midpoint of the effective period. For policy
years 2017 and 2018, this is 4.001 and 3.001 years, respectively. So, for example, the
indemnity trend factor for policy year 2017 is calculated as 0.980^4.001 = 0.922.
5. The trended loss cost ratio is then multiplied by a factor for the adjustment of limited losses
to unlimited. Losses are initially limited to exclude large losses that may increase the
14
volatility of loss cost change experience from year to year. A factor is then used to add
back a provision for such large losses as a way of spreading such risk over a longer time-
frame to achieve greater stability in loss costs. A threshold for large losses is selected based
on a projection of losses at the midpoint of the loss cost effective period. The threshold for
this filing is $9,919,089 and it was determined that 1.1% of the statewide losses are
expected to exceed this threshold. Therefore, a factor of 1.011 is multiplied by the ultimate
loss ratio to adjust losses from a limited to an unlimited basis.
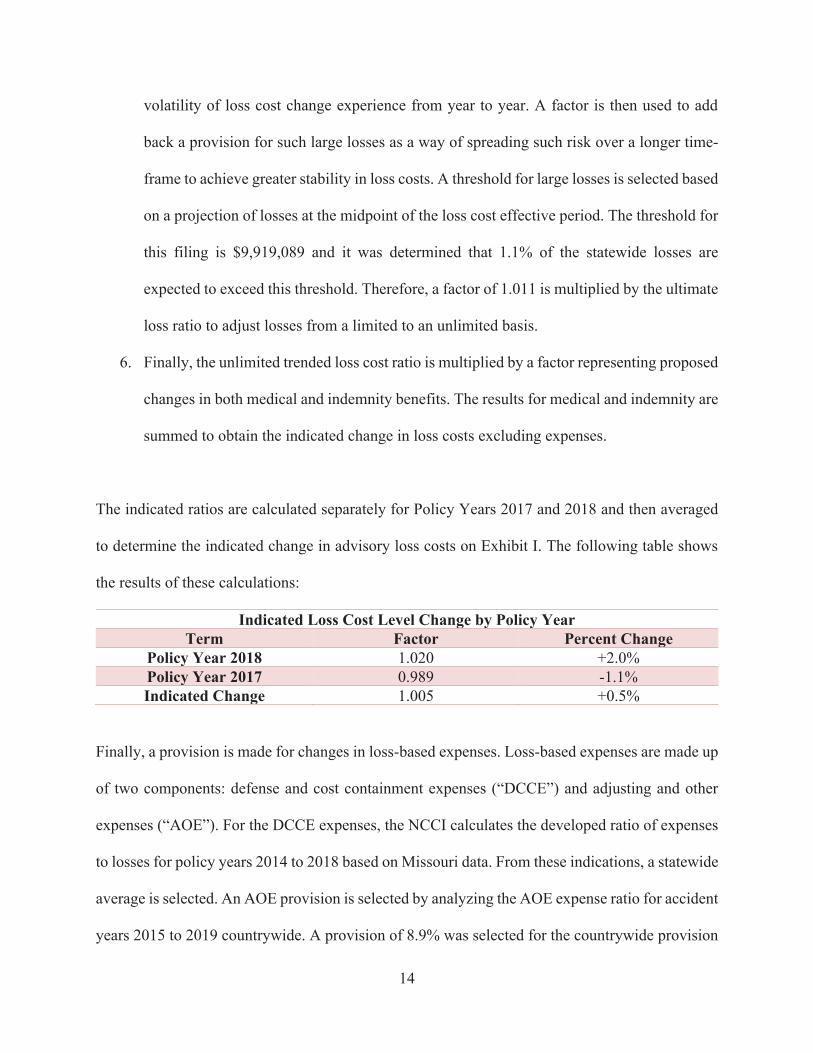
6. Finally, the unlimited trended loss cost ratio is multiplied by a factor representing proposed
changes in both medical and indemnity benefits. The results for medical and indemnity are
summed to obtain the indicated change in loss costs excluding expenses.
The indicated ratios are calculated separately for Policy Years 2017 and 2018 and then averaged
to determine the indicated change in advisory loss costs on Exhibit I. The following table shows
the results of these calculations:
Indicated Loss Cost Level Change by Policy YearTerm Factor Percent Change
Policy Year 2018 1.020 +2.0%Policy Year 2017 0.989 -1.1%Indicated Change 1.005 +0.5%
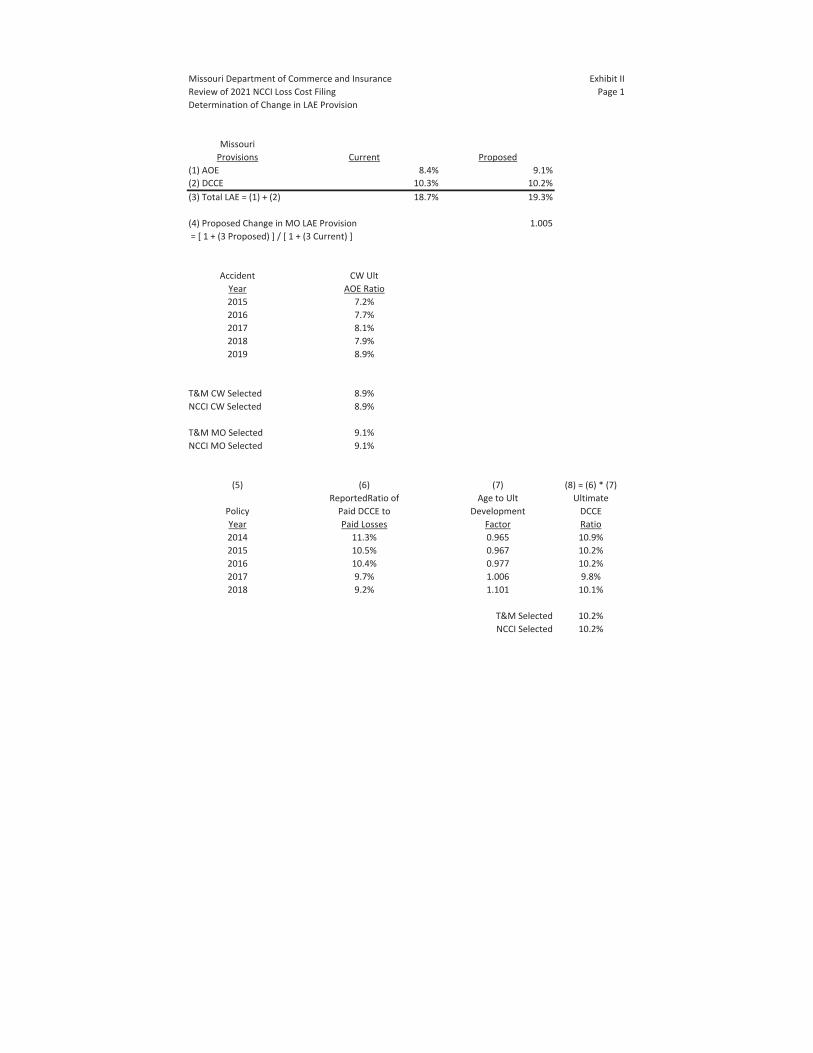
Finally, a provision is made for changes in loss-based expenses. Loss-based expenses are made up
of two components: defense and cost containment expenses (“DCCE”) and adjusting and other
expenses (“AOE”). For the DCCE expenses, the NCCI calculates the developed ratio of expenses
to losses for policy years 2014 to 2018 based on Missouri data. From these indications, a statewide
average is selected. An AOE provision is selected by analyzing the AOE expense ratio for accident
years 2015 to 2019 countrywide. A provision of 8.9% was selected for the countrywide provision

15
and, after credibility weighting with Missouri data, an AOE provision of 9.1% was selected for the
Missouri provision. The adjusted selected DCCE ratio and the selected AOE ratio are summed to
obtain the Missouri selected loss adjustment expense (“LAE”) ratio. This ratio is compared to the
prior year ratio to obtain a proposed change in LAE provision.
The following table shows the results of these calculations:
Indicated LAE Provision ChangeCurrent Missouri LAE Provision 18.7%Proposed Missouri LAE Provision 19.3%Indicated Change Factor 1.005
The calculated 1.005 factor is equal to (1 + 18.7%) / (1 + 19.3%). This 1.005 factor is applied to
the previously calculated average loss cost factor of 1.005 to obtain the overall indicated loss-cost
level change reflecting the change in loss-based expenses of 1.005 x 1.005 = 1.010, or 1.0% on
Exhibit I.
Changes to Loss Adjustment Expense Methodology
With this filing, NCCI is modifying how it handles AOE expenses provided to them in Financial
Call 19. During their analysis, NCCI noticed that there were some carriers that would have Third-
Party Administrator (TPA) agreements, but they would report no AOE expenses. In this filing, if
a carrier is associated with a TPA agreement and there is no AOE reported to NCCI, NCCI will
exclude the losses and AOE associated with that carrier (i.e., remove the data from both the
numerator and denominator of the AOE ratio calculation).

16
Allocation of Overall to Industry Group
Each of the five industry groups has unique experience over the five-year experience period.
Because the overall rate change of 1.0% represents the aggregated experience of all of the industry
groups, it will only be accurate on average, i.e. for some industry groups the change of 1.0% will
be inadequate whereas for some it will be excessive. For this reason, the 1.0% must be allocated
to the five industry groups to determine the relative change for each group. This is done by
applying industry group differentials to the overall loss cost level change factor to obtain indicated
loss cost level change factors by industry group.
Industry group differentials are calculated based on the ratio of prior five years actual losses to
prior five years expected losses. Actual losses are trended, brought to current levels, developed to
ultimate and include adjustments for wage trend and the off-balance factor (which is the ratio of
standard premium to manual premium). Expected losses are based on underlying pure premiums
multiplied by associated payrolls (in hundreds) and are adjusted for off-balance. Indicated ratios
are normalized, adjusted for wage trend, credibility weighted, and re-normalized before being
applied to the overall loss cost level change to obtain final level changes by industry group.
The following table from Exhibit I shows the results of this calculation:
Indicated Industry Group Loss Cost Level Change
Industry Group
(1)Overall
Loss CostLevel Change
(2)IndustryGroup
Differential
(3) = (1) x (2)Final Loss CostLevel Change
by Industry GroupManufacturing 1.010 1.004 1.014Contracting 1.010 0.979 0.989Office & Clerical 1.010 1.013 1.023Goods & Services 1.010 1.007 1.017Miscellaneous 1.010 0.999 1.009Overall 1.010 1.000 1.010
17
Allocation to Occupational Classifications
To allocate the overall rate change to individual occupational classifications, the allocated rate
change level factor by industry group is applied to occupational classifications using a three-way
credibility weighting approach to obtain proposed advisory loss costs by class code.
For each occupational classification, three pure premiums are credibility weighted together:
1. Indicated Pure Premium
2. Pure Premium Indicated by National Relativity
3. Pure Premium Present on Rate Level
Weighting all of the pure premiums together results in the adjusted loss costs. The adjusted loss
costs are limited to swing limits, and loaded for disease, catastrophe, and/or miscellaneous
additional costs. The result is the final loaded loss cost.
Analysis Performed by Taylor & Mulder
Our review of the filing consisted an evaluation of the methodologies and assumptions underlying
the determination of the indicated loss cost change. T&M reviewed all aspects of the filing,
applying particular scrutiny and testing to the assumptions and selections that were used in the loss
development method, trend determinations, and loss adjustment expense provisions.
Loss Development Method
When developing losses to an ultimate level, NCCI chose to use a loss development factor that
was equal to the two-year average of the link ratios for the paid loss development method. They
used a five-year average of the link ratios for the paid plus case loss development method. In our
tests, we did not use a single prescribed average for a particular cohort of claims. For example, for

18
the first to second loss development factor for the medical paid loss development method, we could
select the three-year average of the link ratios in that period whereas for the next development
period, the second to third year, we could select a different average, such as the five-year average.
When making these selections, we considered trends in the link ratios as well as the stability of the
link ratios over time with the goal of maximizing both stability and responsiveness. Since the
NCCI used a single prescribed average without actuarial judgment, there are some cases where the
selections were not always the best selection based on historical loss development.
After selecting loss development factors for the paid and paid plus case losses for medical and
indemnity coverages, the cumulative loss development factors were applied to losses to bring them
to an ultimate level. Although these newly calculated ultimate losses did not differ materially from
the ultimate losses derived from the method used by NCCI, the net result was to lower the
indication.
Trend
The next step in the ratemaking process that we tested was the trend factors that are used to bring
losses and premiums to the projected level. In our tests, we reviewed how the premium, frequency,
and severity for each year have changed from one policy period to the next over different time
periods. Our review primarily focused on the selection of the frequency and severity trends. Our
analysis consisted of fitting an exponential curve to the frequency and severity then selecting the
trend provision that maximized the R-squared value1.
1 The R2 value is known as the “coefficient of determination” and is a measure of the proportion of the variance that is explained by the prediction. A higher R2 value is indicative of a model that “fits” the data better. Mathematically, the R2 value is defined as one minus the ratio of the sum of the squared error (between the model and the dependent variable) and the variance in the dependent variable. An R-squared value close to 1.0 would indicate a strong fit whereas a value close to 0 would suggest the model is not fitting well to the data.
19
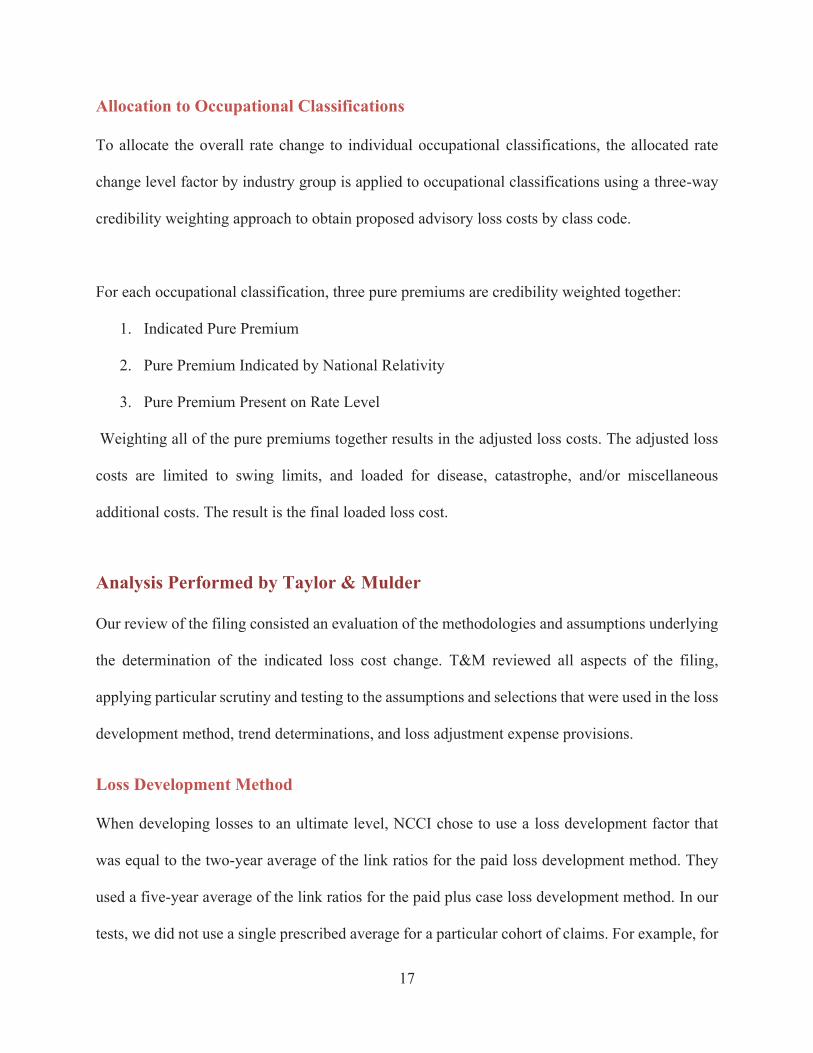
As can be seen from the following chart, the frequency is consistently decreasing, with minimal
volatility beginning in policy year 2010. We have selected a frequency trend of -3.1%, which
coincides with an exponential fit of the data from policy year 2010 to 2018.
After selecting the frequency trend provision, we then analyzed the indemnity and medical severity
trends. It is important to note that the loss development factors discussed in the prior section will
have a direct effect on the severities, since ultimate losses are divided by the number of claims to
calculate the ultimate severities.
0
5
10
15
20
25
30
35
2004 2005 2006 2007 2008 2009 2010 2011 2012 2013 2014 2015 2016 2017 2018
Claim Frequency
Claim Frequency Expon. (Claim Frequency)

20
The chart below shows the impact of our loss development factor selections on ultimate severities.
Additionally, it shows how the ultimate indemnity severity changes from year to year. As can be
seen from the chart, our loss development factor selections generated ultimate severities that were
very similar to those calculated based on the NCCI’s loss development factors (i.e., the solid red
(NCCI) and solid blue (T&M) lines are very close for each policy year.) The dotted blue line shows
the fitted severity trend based on our selection. We selected an indemnity severity trend provision
of 1.0%, which had the highest R-squared value. This trend reflects a consistent moderate increase
in indemnity severity over time.
The medical trend procedure is similar to that of the indemnity trend procedure. We calculated the
ultimate severities, and then analyzed them over time. Medical severities have been steadily
20,000
20,500
21,000
21,500
22,000
22,500
23,000
23,500
24,000
24,500
25,000
2004 2005 2006 2007 2008 2009 2010 2011 2012 2013 2014 2015 2016 2017 2018
Indemnity Severity
T&M Indemnity Severity NCCI Indemnity Severity Expon. (T&M Indemnity Severity)

21
increasing over time. Similar to the indemnity severity chart above, Taylor & Mulder’s loss
development factor selections generated similar medical severities to NCCI’s selections. The
dotted blue line shows the line of best fit. We selected the trend provision balancing the highest
R-squared value with the longest time period, resulting in a medical severity trend of 2.1%. The
following chart shows the medical severities over time. The dotted blue line shows the fitted
medical severity trend based on our selection.
In order to compare our trend selections with those of NCCI, we multiplied the frequency and
severity trend factors together to determine a net trend. This yields a net indemnity trend of -2.1%
(= (1 – 0.031) * (1 + 0.010)), which is slightly lower than the NCCI net indemnity trend selection.
20,000
22,000
24,000
26,000
28,000
30,000
32,000
34,000
36,000
2004 2005 2006 2007 2008 2009 2010 2011 2012 2013 2014 2015 2016 2017 2018
Medical Severity
Medical Severity NCCI Medical Severity Expon. (Medical Severity)

22
Repeating this same calculation for the net medical trend results in a net trend of -1.1% (= (1 –
0.031) * (1 + 0.021)), which differs slightly from the NCCI medical net trend of -1.0%.
Loss Adjustment Expenses
NCCI used a five-year average of the ultimate paid DCCE to paid losses ratio to determine the
DCCE provision to be applied to losses. Their selection of 10.2% for the DCCE provision appears
reasonable.
To determine the AOE provision, NCCI uses a weighted average of countrywide AOE paid divided
by paid losses and State specific AOE paid divided by paid losses. NCCI applies a weight of 71%
to the countrywide AOE ratio and a weight of 29% to the Missouri AOE to paid loss provision to
calculate an AOE provision of 9.1%. These weights reflect the respective shares of ultimate
projected losses.
The DCCE and AOE provisions are added together to determine a proposed LAE ratio of 19.3%
which is 0.5% higher than the prior year’s LAE provision of 18.7%. To account for this, NCCI
applies a factor of 1.005 to the indicated rate changed based on experience, trend, and benefits.
The selections and methods used to determine this provision appear reasonable.
Review of the NCCI’s Response to Interrogatories
The scope of our work includes (1) a review of the Filing and (2) a review of the answers,
attachments and supporting documentation provided in response to the T&M interrogatories.
During the course of our review, we were provided with additional information, supporting data

23
and calculations underlying certain portions of the filing that were not included within the filing.
Therefore, our conclusions are based on the totality of the information we received from the NCCI.
Review of Responses to Interrogatories Dated September 28, 2020
This section contains a review of the responses provided by NCCI to the objections issued on
September 28, 2020.
Question 1: DATA
NCCI has confirmed that there have been no changes to the underlying data used in this filing
when compared to the previous filing.
Question 2: IMPACTS OF CHANGES
The indicated loss cost changes are being impacted by two changes made in the NCCI
methodology for this filing, including (1) changing the selected loss development factor selection
for paid losses to a 2-year average instead of a 3-year average and (2) changing the methodology
for determining the AOE provision. The change in selected loss development factors resulted in a
decrease in the indication of 0.3% and the change in AOE methodology resulted in an increase of
0.7% in the indicated loss cost change.
Question 3: TERRORISM
NCCI confirmed that there have been no changes to the methodology or assumptions used to
determine the terrorism loss cost.
Question 4: LOSS DEVELOPMENT TRIANGLES
NCCI provided loss development triangles with 10 years of loss development factors for indemnity
and medical coverages as well as DCCE. Paid and Paid + Case triangles were provided for both

24
the medical and indemnity coverages. We used this data to evaluate trends and make selections of
loss development factors by period to test NCCI’s selections.
Question 5: LOSS DEVELOPMENT FACTORS
A two-year average loss development factor was utilized for paid loss development as opposed to
a three-year average that was used in the prior filing because the three-year average was meant to
be a temporary selection due to irregular experience in the calendar year ending December 31,
2016. By only using two-years, these atypical results are eliminated. Taylor & Mulder tested this
method of selecting a two-year average as opposed to a three-year average and we tested both the
two year and the three year averages against T&M’s selections. It appears that NCCI’s selected
two-year average does not always provide the best answer for each evaluation.
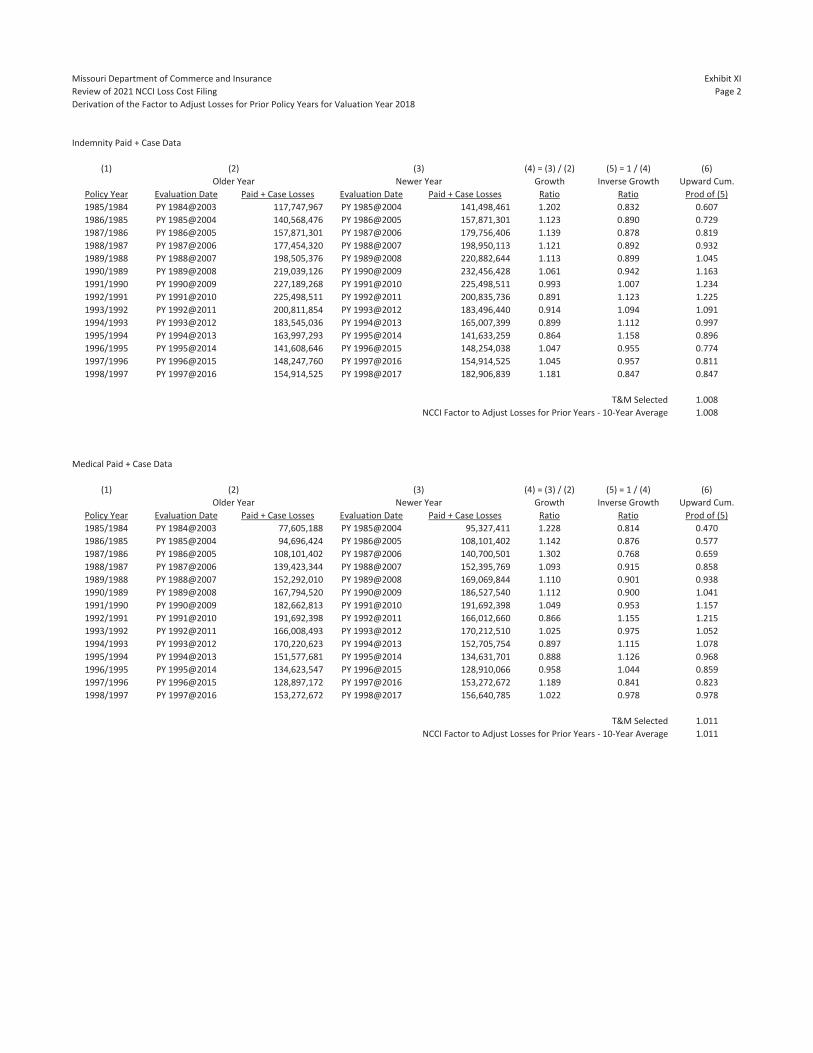
Question 6: FACTOR TO ADJUST LOSSES FOR PRIOR POLICY YEARS
It was requested that NCCI provide detailed calculations of how the factor to adjust losses for prior
policy years was determined in Appendix A-II column 6. A spreadsheet showing how this was
calculated was provided. T&M reviewed the calculations and determined that the calculation and
methodology are appropriate.
Question 7: FACTOR TO ADJUST TAIL FACTOR TO A LIMITED BASIS
We requested support for the factor to adjust the 19th-to-ultimate development factor to a limited
basis since this information was not provided in the filing. This calculation was provided as a
response to this interrogatory. NCCI uses a countrywide unlimited loss development factor and
the expected percentage of losses about the large loss threshold to determine the countrywide
limited tail factor. The countrywide limited tail factor minus one is then divided by the countrywide
unlimited tail factor minus one to determine the factor to adjust the tail factor to a limited basis.

25
After reviewing the calculations and supporting documentation, this calculation appears
reasonable.
Question 8: AOE ANALYSIS
NCCI provided a description of the new AOE process and how agreements from TPAs (third-party
administrators) were accounted for in the AOE calculation. NCCI further explained that the
Missouri AOE provision was derived by taking a weighted average of the countrywide AOE
provision and the indicated provision for the Missouri state fund. The weights applied to each of
these were 71% and 29% for the countrywide AOE provision and the indicated provision for the
Missouri state fund, respectively. This response did not show how the indicated provision for the
Missouri state fund was derived. Taylor & Mulder requested the underlying data and calculations
for the Missouri state fund AOE provision in a subsequent set of objections. We reviewed the
calculations and selections, which appear reasonable.
Question 9: DCCE
NCCI explained their position that the two-year average loss development factor for DCCE
provides a balance between stability and responsiveness. T&M reviewed the impact of this change
and concluded that this change appears appear reasonable.
Question 10: DCCE
NCCI expanded the table in Exhibit II Section C – Selection of DCCE provision to include policy
years 2009 through 2013. This additional information was used in T&M’s analysis of the DCCE
provision, and it was determined that the NCCI selected provision is reasonable.
26
Question 11: AOE
NCCI determined that there were no biases with how AOE and DCCE were reported due to TPA
agreements. The rationale provided by NCCI appears reasonable.
Question 12: INDUSTRY GROUP DIFFERENTIALS
This question asks for the calculations underlying certain factors in the determination of the
industry group factors in Appendix A-IV, Section I, Columns (4) and (5). NCCI provided these
calculations in Exhibit 12 of their response. Taylor & Mulder reviewed these calculations, and
they appear reasonable.
Question 13: OCCUPATIONAL CLASSES
We requested the underlying calculations for factors used in the distribution of loss cost level
changes to occupational classifications in Appendix B-1, Section A.1.1. These were provided in
Exhibit 13 of the NCCI responses. Taylor & Mulder reviewed these calculations, and concluded
that the calculations are appropriate.
Question 14: TREND
The question asks for underlying data, fits, assumptions, calculation, selections and rationale that
went into the selection of the indemnity and medical trend factors. NCCI provided Exhibit 14,
“Supplemental Loss Development and Trend Information”, as support for these calculations.
Question 15: ASSIGNED RISK PLAN
This question asked for the indicated loss cost change when assigned risk experience was removed
from the analysis. An overall average loss cost level indication of -0.7% would result if the
assigned risk experience was removed from the filing. The details of this calculation were provided

27
in Exhibit 15, “Voluntary Only Indication”. Taylor & Mulder reviewed the calculation and
assumptions determined that they were appropriate.
Question 16: CAPPING
This question asked about the possibility of disparate impacts to classes with low loss costs and
whether applying a cap to loss cost increases and decreases would prohibit changes to those loss
costs. NCCI indicated that they review cases where the upper bound and lower bound are equal to
the current loss cost and if the indicated industry group change and the indicated class change is
in the same direction then they will change the loss cost by $0.01 in the direction of the change.
This method is reasonable as it will adequately modify occupational classes with low loss costs.
Question 17: CLASS RATEMAKING
An update was requested for the class ratemaking research to which NCCI provided as Exhibit 17
two presentations: “Class Ratemaking Research: Status and Results” presented on February 23,
2017 and “Class Ratemaking Research: Final Wrap-Up” presented on February 22, 2018. Taylor
& Mulder reviewed these documents which are referenced below.
Question 18: CLASSIFICATIONS
T&M requested information pertaining to the loss cost changes and payrolls by class code. NCCI
provided an excel spreadsheet with this information in Exhibit 18 in the responses to the objections.
We evaluated the data and calculated several statistics based on the history of rate changes,
including:
1. Coefficient of Variation of Loss Costs from loss costs that are effective from January 1,
2018 to January 1, 2021.

28
2. Absolute Percent Change in loss costs from changes effective from January 1, 2018 to
January 1, 2021 (i.e., the total amount of rate change over time. For example, if a class
code had a 10% increase and a 10% decrease, the absolute change would be 21% (= (1+|.1|)
× (1+|-.1|) – 1) = ((1.1 × 1.1) – 1.0)).
3. Total “Swing” (i.e. the maximum change minus the minimum change in loss costs from
loss cost changes effective from January 1, 2018 to January 1, 2021).
Attachment B displays loss costs and changes in loss costs by individual class codes. The data is
sorted in three ways; (1) by dollar amount of payroll written in each class, (2) by absolute change
percent of changes effective from January 1, 2018 to January 1, 2021 and (3) by swing. We
searched for class codes that had particularly high payrolls and unusual or unstable loss cost change
history, which would indicate potential issues with the classification rate making algorithm. We
also reviewed the class codes with the largest amount of change and the widest swings in rate
change history to see if similar stability issues could be detected.
One class code, number 3574, has a somewhat unusual rate change history. Class code 3574
received a 16.1% increase in 2019, a 17.7% decrease in 2020, and a 20.9% increase in 2021. This
swinging back and forth implies that the class code’s claims history may be receiving excessive
credibility, causing an excessive impact on the loss cost from year to year.
Of the remaining 509 class codes with payrolls greater than $0 in 2017 or 2018, we observe several
other classes that have swings that are over 20%. The highest seventeen swing classes have swings
that are greater than 20%. However, the remainder of the classes are under 20% for the three years
of changes. Since most of the class codes have swings that are less than 20% over this period, the

29
new classification methodology appears to be achieving the goal of less volatility in class
ratemaking.
The NCCI implemented a new classification ratemaking methodology effective January 1, 2019.
If we look at the classification information sorted by payroll, we observe that the smaller classes
do not appear to have a higher absolute value of rate changes from 2018 to 2021 than the higher
payroll classes.
In our interrogatories, Taylor & Mulder asked for any updates on class ratemaking research, status
and results, or stability performance results on tests of the performance of the recently
implemented small class ratemaking project intended to address the stability of the small classes.
The response included two studies that dated 2017 and 2018, before this change was implemented.
It would be helpful to have an update of those studies to understand if the classification ratemaking
has improved the volatility in the small class ratemaking. Our methodology was an attempt to test
the new classification methodology but the NCCI has much more information available to do a
more detailed evaluation.
Question 19: INDICATION DATA
NCCI confirmed that the data that the indication in Exhibit I was combined for the voluntary and
assigned risk markets.

30
Review of Responses to Interrogatories Dated October 13, 2020
This section contains a review of the responses provided by NCCI to the objections issued on
October 13, 2020.
Question 1: AOE PROVISION
NCCI provided an exhibit which showed the calculation of the selected AOE ratio on both a
countrywide and Missouri only basis. This exhibit also showed how these values were weighted
together to obtain the weighted-average AOE ratio of 9.1%.
Review of Responses to Interrogatories Dated October 20, 2020
This section contains a review of the responses provided by NCCI to the objections issued on
October 20, 2020.
Question 1: AOE PROVISION
It was noticed that the exhibit provided with the responses to the objections dated October 13,
2020 did not reconcile with the AOE provisions on page 43 of the filing. NCCI provided a
discussion of why this was the case, and it was determined that these values were acceptable.

Missouri Department of Commerce and Insurance Exhibit IReview of 2021 NCCI Loss Cost Filing Page 1Indicated Rate Change
Determination of Loss Cost Level Change
Policy YearPremium 2018 2017
(1) Standard Earned Premium Developed to Ultimate 634,026,730 656,818,816(2) Premium On level Factor 0.799 0.76(3) Pure Premium Available for Benefit Costs = (1) x (2) 506,587,357 499,182,300
Indemnity Benefit Cost:(4) Limited Indemnity Losses Developed to Ultimate 220,520,982 207,657,021(5) Indemnity Loss On level Factor 1.000 1.000(6) Adjusted Limited Indemnity Losses = (4) x (5) 220,520,982 207,657,021(7) Adjusted Limited Indemnity Cost Ratio excluding Trend and Benefits = (6) / (3) 0.435 0.416(8) Factor to Reflect Indemnity Trend 0.938 0.918(9) Projected Limited Indemnity Cost Ratio = (7) x (8) 0.408 0.382
(10) Factor to Adjust Indemnity Cost Ratio to an Unlimited Basis 1.011 1.011(11) Projected Indemnity Cost Ratio = (9) x (10) 0.413 0.386(12) Factor to Reflect Proposed Changes in Indemnity Benefits 1.000 1.000(13) Projected Indemnity Cost Ratio including Benefit Changes = (11) x (12) 0.413 0.386
NCCI Indemnity Benefit Cost 0.418 0.391Medical Benefit Cost:(14) Limited Medical Losses Developed to Ultimate 309,448,124 304,351,681(15) Medical Loss On level Factor 1.000 1.000(16) Adjusted Limited Medical Losses = (14) x (15) 309,448,124 304,351,681(17) Adjusted Limited Medical Cost Ratio excluding Trend and Benefits = (16) / (3) 0.611 0.610(18) Factor to Reflect Medical Trend 0.969 0.959(19) Projected Limited Medical Cost Ratio = (17) x (18) 0.592 0.584(20) Factor to Adjust Medical Cost Ratio to an Unlimited Basis 1.011 1.011(21) Projected Medical Cost Ratio = (19) x (20) 0.598 0.591(22) Factor to Reflect Proposed Changes in Medical Benefits 1.000 1.000(23) Projected Medical Cost Ratio including Benefit Changes = (21) x (22) 0.598 0.591
NCCI Medical Benefit Cost 0.602 0.598Total Benefit Cost:(24) Indicated Change Based on Experience, Trend, and Benefits = (13) + (23) 1.011 0.977
NCCI Indicated Change Based on Experience, Trend, and Benefits 1.020 0.989
Total Indicated Change
(25) PY 2018 Indicated Change Based on Experience, Trend and Benefits 1.011(26) PY 2017 Indicated Change Based on Experience, Trend and Benefits 0.977(27) Indicated Change Based on Experience, Trend, and Benefits = Average of (25) and (26) 0.994(28) Effect of Change in Loss Based Expenses 1.005(29) Indicated Change Modified to Reflect the Change in Loss Based Expenses = (27) * (28) 1.000
NCCI Indicated Chagne Modified to Reflect the Change in Loss Based Expenses 1.010
Missouri Department of Commerce and Insurance Exhibit IIReview of 2021 NCCI Loss Cost Filing Page 1Determination of Change in LAE Provision
MissouriProvisions Current Proposed
(1) AOE 8.4% 9.1%(2) DCCE 10.3% 10.2%(3) Total LAE = (1) + (2) 18.7% 19.3%
(4) Proposed Change in MO LAE Provision 1.005= [ 1 + (3 Proposed) ] / [ 1 + (3 Current) ]
Accident CW UltYear AOE Ratio2015 7.2%2016 7.7%2017 8.1%2018 7.9%2019 8.9%
T&M CW Selected 8.9%NCCI CW Selected 8.9%
T&M MO Selected 9.1%NCCI MO Selected 9.1%
(5) (6) (7) (8) = (6) * (7)ReportedRatio of Age to Ult Ultimate
Policy Paid DCCE to Development DCCEYear Paid Losses Factor Ratio2014 11.3% 0.965 10.9%2015 10.5% 0.967 10.2%2016 10.4% 0.977 10.2%2017 9.7% 1.006 9.8%2018 9.2% 1.101 10.1%
T&M Selected 10.2%NCCI Selected 10.2%

Missouri Department of Commerce and Insurance Exhibit IIReview of 2021 NCCI Loss Cost Filing Page 2Determination of AOE Provision
AOE ProvisionPrivate Carriers State Fund
Ultimate AOE Ultimate AOE Average Ultimate AOE Ultimate AOE AverageRatio Based on Ratio Based on Ultimate Ratio Based on Ratio Based on Ultimate
Accident Year Paid Data Incurred Data AOE Ratio Paid Data Incurred Data AOE Ratio2015 7.8% 7.8% 7.8% 10.6% 9.9% 10.3%2016 8.3% 8.2% 8.3% 9.7% 9.1% 9.4%2017 8.9% 8.8% 8.9% 9.3% 8.5% 8.9%2018 8.8% 8.8% 8.8% 9.6% 9.3% 9.5%2019 9.0% 8.8% 8.9% 10.5% 10.5% 10.5%
T&M Selected AOE Povision 8.9% T&M Selected AOE Povision 9.7%NCCI Selected AOE Provision 8.9% NCCI Selected AOE Provision 9.7%
T&M Weights 71.0% 29.0%NCCI Weights 71.0% 29.0%
T&M Weighted Average AOE Ratio 9.13%NCCI Weighted Average AOE Ratio 9.13%

Missouri Department of Commerce and Insurance Exhibit IIIReview of 2021 NCCI Loss Cost Filing Page 1Trend Analysis
(1) (2) (3) (4) (5) (6) (7) (8) (9) (10)
Policy Claim Fitted T&M Indemnit Fitted Medical FittedYear Frequency Trend R² Severity Trend R² Severity Trend R²2004 29.815 3.1% 94.5% 21,530 1.0% 76.9% 23,689 2.1% 86.0%2005 26.260 2.9% 96.6% 20,908 1.0% 77.4% 25,676 1.9% 83.8%2006 24.816 2.8% 95.9% 20,436 1.0% 72.1% 25,928 1.9% 80.0%2007 25.019 2.8% 95.0% 21,497 0.8% 68.9% 25,949 1.8% 74.6%2008 23.158 2.7% 94.1% 22,333 0.7% 59.6% 28,941 1.5% 67.6%2009 21.750 2.7% 92.8% 22,090 0.7% 53.3% 27,890 1.7% 67.6%2010 23.023 3.1% 97.8% 22,316 0.5% 37.9% 29,849 1.5% 56.9%2011 21.892 3.0% 97.5% 23,435 0.3% 17.3% 30,734 1.8% 59.1%2012 21.137 2.9% 96.2% 22,598 0.6% 30.6% 29,945 2.6% 79.8%2013 20.648 2.9% 94.1% 23,664 0.2% 6.0% 29,082 3.4% 91.6%2014 20.044 2.7% 89.7% 23,278 0.6% 27.3% 29,321 3.7% 89.6%2015 19.281 2.1% 81.9% 23,184 0.9% 29.4% 31,143 3.4% 79.4%2016 18.382 0.9% 88.5% 23,660 1.0% 16.3% 30,971 4.6% 79.1%2017 18.104 0.4% 100.0% 22,989 5.0% 100.0% 33,694 0.5% 100.0%2018 18.040 24,130 33,860
(11) T&M Selected 3.1% 1.0% 2.1%(12) T&M Net Trend 2.1% 1.1%(13) Current NCCI Net Trend 2.0% 1.0%(14) Selected NCCI Net Trend 2.0% 1.0%
(15) (16) (17) = [ 1 + (12 Indemnity) ] ^ (16) + (12 Medical) ] ^ (16)Policy Trend FactorYear Years Indemnity Medical2017 4.001 0.9185 0.95862018 3.001 0.9382 0.9688

Missouri Department of Commerce and Insurance Exhibit IVReview of 2021 NCCI Loss Cost Filing Page 1Selected On Level Ultimate Losses
Indemnity Ultimate Losses
(1) (2) (3) (4) (5) = 1 (3) (6) = (2) * (3) + (4) *
Paid Paid Ult Paid + Case Paid + Case Ult SelectedOn Level Loss On Level Loss On Level
Policy Year Ult. Losses Weight Ult. Losses Weight Ult. Losses2004 200,530,387 50% 206,561,780 50% 203,546,0842005 184,215,706 50% 185,977,366 50% 185,096,5362006 183,962,545 50% 184,737,390 50% 184,349,9682007 212,274,366 50% 215,145,040 50% 213,709,7032008 196,325,408 50% 199,237,085 50% 197,781,2462009 178,427,762 50% 176,220,170 50% 177,323,9662010 198,952,367 50% 197,508,140 50% 198,230,2542011 204,991,294 50% 199,505,333 50% 202,248,3132012 192,249,778 50% 185,589,335 50% 188,919,5562013 199,879,914 50% 196,424,099 50% 198,152,0072014 201,125,369 50% 197,193,882 50% 199,159,6262015 203,977,823 50% 199,615,563 50% 201,796,6932016 212,003,817 50% 199,140,698 50% 205,572,2572017 214,554,232 50% 200,759,809 50% 207,657,0212018 223,892,081 50% 217,149,884 50% 220,520,982
Medical Ultimate Losses
(1) (2) (3) (4) (5) = 1 (3) (6) = (2) * (3) + (4) *
Paid Paid Ult Paid + Case Paid + Case Ult SelectedOn Level Loss On Level Loss On Level
Policy Year Ult. Losses Weight Ult. Losses Weight Ult. Losses2004 222,886,754 50% 228,189,786 50% 225,538,2702005 224,288,184 50% 233,527,547 50% 228,907,8662006 235,541,265 50% 235,508,214 50% 235,524,7392007 260,266,675 50% 259,292,629 50% 259,779,6522008 254,308,985 50% 261,882,565 50% 258,095,7752009 227,436,201 50% 223,468,516 50% 225,452,3592010 269,104,000 50% 264,904,507 50% 267,004,2542011 268,211,851 50% 265,989,475 50% 267,100,6632012 252,904,339 50% 251,265,951 50% 252,085,1452013 247,850,863 50% 241,131,845 50% 244,491,3542014 255,124,200 50% 246,598,640 50% 250,861,4202015 270,638,725 50% 271,497,713 50% 271,068,2192016 273,743,678 50% 264,443,235 50% 269,093,4572017 304,009,133 50% 304,694,230 50% 304,351,6812018 313,338,142 50% 305,558,107 50% 309,448,124

Missouri Department of Commerce and Insurance Exhibit IVReview of 2021 NCCI Loss Cost Filing Page 2Selected Wage Adjusted On Level Ultimate Losses
Indemnity Ultimate Losses
(1) (2) (3) (4) (5) = 1 (3) (6) = (2) * (3) + (4) *Paid Paid + Case Selected
Wage Adj Paid Ult Wage Adj Paid + Case Ult Wage AdjOn Level Loss On Level Loss On Level
Policy Year Ult. Losses Weight Ult. Losses Weight Ult. Losses2004 283,299,104 50% 291,819,949 50% 287,559,5262005 253,754,925 50% 256,181,589 50% 254,968,2572006 245,271,374 50% 246,304,451 50% 245,787,9132007 271,261,803 50% 274,930,189 50% 273,095,9962008 245,543,009 50% 249,184,627 50% 247,363,8182009 223,338,208 50% 220,574,963 50% 221,956,5862010 244,621,287 50% 242,845,541 50% 243,733,4142011 245,647,217 50% 239,073,226 50% 242,360,2212012 225,345,193 50% 217,538,168 50% 221,441,6802013 229,777,952 50% 225,805,216 50% 227,791,5842014 223,651,410 50% 219,279,597 50% 221,465,5042015 221,927,872 50% 217,181,732 50% 219,554,8022016 226,632,080 50% 212,881,406 50% 219,756,7432017 222,278,184 50% 207,987,163 50% 215,132,6732018 223,892,081 50% 217,149,884 50% 220,520,982
Medical Ultimate Losses
(1) (2) (3) (4) (5) = 1 (3) (6) = (2) * (3) + (4) *Paid Paid + Case Selected
Wage Adj Paid Ult Wage Adj Paid + Case Ult Wage AdjOn Level Loss On Level Loss On Level
Policy Year Ult. Losses Weight Ult. Losses Weight Ult. Losses2004 312,672,225 50% 320,111,478 50% 316,391,8512005 306,800,219 50% 319,438,595 50% 313,119,4072006 311,856,634 50% 311,812,876 50% 311,834,7552007 330,278,411 50% 329,042,346 50% 329,660,3782008 315,851,759 50% 325,258,145 50% 320,554,9522009 282,703,198 50% 277,771,365 50% 280,237,2822010 328,575,984 50% 323,448,403 50% 326,012,1942011 319,172,103 50% 316,527,475 50% 317,849,7892012 294,380,651 50% 292,473,567 50% 293,427,1092013 283,789,238 50% 276,095,962 50% 279,942,6002014 283,698,110 50% 274,217,688 50% 278,957,8992015 294,454,932 50% 295,389,512 50% 294,922,2222016 292,631,992 50% 282,689,818 50% 287,660,9052017 314,953,462 50% 315,663,222 50% 315,308,3422018 313,338,142 50% 305,558,107 50% 309,448,124

Missouri Department of Commerce and Insurance Exhibit VReview of 2021 NCCI Loss Cost Filing Page 1Indemnity Paid Loss Development
Ultimate Wage AdjDevelopment Ultimate On Level
Policy Year Losses Factor Losses Ult. Losses2004 191,089,182 1.049 200,530,387 283,299,1042005 174,669,269 1.055 184,215,706 253,754,9252006 173,044,868 1.063 183,962,545 245,271,3742007 198,584,246 1.069 212,274,366 271,261,8032008 182,314,748 1.077 196,325,408 245,543,0092009 164,053,820 1.088 178,427,762 223,338,2082010 180,044,278 1.105 198,952,367 244,621,2872011 182,498,057 1.123 204,991,294 245,647,2172012 167,415,689 1.148 192,249,778 225,345,1932013 168,141,609 1.189 199,879,914 229,777,9522014 161,030,427 1.249 201,125,369 223,651,4102015 151,497,436 1.346 203,977,823 221,927,8722016 136,706,428 1.551 212,003,817 226,632,0802017 108,058,588 1.986 214,554,232 222,278,1842018 62,656,894 3.573 223,892,081 223,892,081
Indemnity Limited Statewide Paid Loss Development through @12/19
PY 1/2 2/3 3/4 4/5 5/6 6/7 7/8 8/9 9/10 10/11 11/12 12/13 13/14 14/15 15/16 16/17 17/18 18/191991 1.0031992 1.004 1.0041993 1.005 1.002 1.0041994 1.005 1.004 1.004 1.0011995 1.008 1.004 1.007 1.004 1.0021996 1.005 1.004 1.005 1.005 1.004 1.0021997 1.006 1.004 1.004 1.002 1.003 1.002 1.0041998 1.007 1.007 1.005 1.005 1.004 1.005 1.004 1.0071999 1.015 1.006 1.006 1.008 1.007 1.001 1.007 1.002 1.0022000 1.008 1.008 1.003 1.013 1.006 1.006 1.004 1.003 1.004 1.0012001 1.010 1.010 1.010 1.007 1.004 1.012 1.003 1.005 1.004 1.0022002 1.028 1.018 1.008 1.009 1.008 1.007 1.003 1.004 1.003 1.0052003 1.034 1.023 1.016 1.016 1.005 1.006 1.005 1.007 1.007 1.0052004 1.050 1.032 1.021 1.020 1.014 1.014 1.007 1.006 1.012 1.0052005 1.081 1.046 1.036 1.022 1.012 1.014 1.010 1.008 1.006 1.0042006 1.117 1.068 1.040 1.032 1.026 1.016 1.009 1.008 1.010 1.0052007 1.271 1.125 1.077 1.054 1.036 1.018 1.016 1.021 1.013 1.0062008 1.793 1.248 1.159 1.092 1.047 1.041 1.019 1.020 1.020 1.0092009 1.799 1.292 1.141 1.091 1.059 1.026 1.023 1.017 1.0122010 1.872 1.289 1.152 1.092 1.051 1.033 1.020 1.0162011 1.789 1.295 1.161 1.092 1.060 1.045 1.0242012 1.801 1.308 1.155 1.087 1.052 1.0312013 1.747 1.328 1.182 1.073 1.0402014 1.869 1.268 1.117 1.0742015 1.806 1.282 1.1442016 1.781 1.2912017 1.812
2 Yr Avg 1.797 1.287 1.131 1.074 1.046 1.038 1.022 1.017 1.016 1.011 1.008 1.006 1.008 1.006 1.004 1.005 1.003 1.0023 Yr Avg 1.800 1.280 1.148 1.078 1.051 1.036 1.022 1.018 1.018 1.010 1.008 1.006 1.008 1.005 1.004 1.004 1.003 1.0035 Yr Avg 1.803 1.295 1.152 1.084 1.052 1.035 1.021 1.017 1.015 1.011 1.007 1.006 1.008 1.005 1.004 1.005 1.003 1.0035 Yr Avg (Ex. Hi Lo) 1.800 1.294 1.153 1.084 1.054 1.035 1.021 1.016 1.015 1.011 1.007 1.006 1.008 1.005 1.004 1.005 1.003 1.0035 Yr Median 1.806 1.291 1.155 1.087 1.052 1.033 1.020 1.016 1.014 1.010 1.007 1.006 1.007 1.005 1.004 1.005 1.002 1.0027 Yr Avg 1.801 1.294 1.150 1.086 1.052 1.035 1.022 1.017 1.015 1.010 1.007 1.007 1.007 1.005 1.003 1.005 1.003 1.003All Yr Avg 1.807 1.287 1.145 1.083 1.050 1.035 1.022 1.016 1.013 1.010 1.007 1.007 1.007 1.005 1.004 1.005 1.003 1.003T&M Selected 1.800 1.280 1.152 1.078 1.051 1.035 1.022 1.017 1.016 1.010 1.007 1.006 1.008 1.005 1.004 1.005 1.003 1.002 TailCumulative 3.573 1.986 1.551 1.346 1.249 1.189 1.148 1.123 1.105 1.088 1.077 1.069 1.063 1.055 1.049 1.045 1.041 1.037 1.036

Missouri Department of Commerce and Insurance Exhibit VIReview of 2021 NCCI Loss Cost Filing Page 1Indemnity Paid + Case Loss Development
Ultimate Wage AdjDevelopment Ultimate On Level
Policy Year Losses Factor Losses Ult. Losses2004 203,458,379 1.015 206,561,780 291,819,9492005 183,000,226 1.016 185,977,366 256,181,5892006 181,381,062 1.019 184,737,390 246,304,4512007 210,604,449 1.022 215,145,040 274,930,1892008 195,032,228 1.022 199,237,085 249,184,6272009 172,156,767 1.024 176,220,170 220,574,9632010 192,376,734 1.027 197,508,140 242,845,5412011 193,740,816 1.030 199,505,333 239,073,2262012 179,508,872 1.034 185,589,335 217,538,1682013 188,356,236 1.043 196,424,099 225,805,2162014 187,407,732 1.052 197,193,882 219,279,5972015 184,362,713 1.083 199,615,563 217,181,7322016 179,088,737 1.112 199,140,698 212,881,4062017 169,924,533 1.181 200,759,809 207,987,1632018 162,652,397 1.335 217,149,884 217,149,884
Indemnity Limited Statewide Paid+Case Loss Development through @12/19
PY 1/2 2/3 3/4 4/5 5/6 6/7 7/8 8/9 9/10 10/11 11/12 12/13 13/14 14/15 15/16 16/17 17/18 18/191991 1.0021992 1.002 1.0021993 1.001 1.002 1.0031994 1.001 1.000 1.000 1.0011995 0.998 1.000 1.000 1.000 1.0011996 0.996 1.000 1.001 1.001 1.001 1.0021997 1.001 0.999 0.999 0.998 0.998 1.004 1.0031998 1.002 1.005 1.001 1.006 0.999 1.003 1.003 1.0001999 1.001 0.999 1.002 1.003 0.999 1.001 1.001 1.001 1.0032000 0.998 1.003 1.003 1.004 1.001 1.001 1.000 1.000 0.996 1.0022001 1.002 1.007 0.997 1.004 1.001 1.002 0.999 1.002 1.000 0.9982002 1.004 1.005 1.005 1.002 0.995 0.999 1.003 0.999 1.002 1.0022003 1.016 1.005 1.005 1.007 1.000 1.000 1.008 0.998 1.004 1.0012004 1.014 0.996 1.001 1.001 1.008 1.002 1.000 1.011 1.006 1.0022005 1.016 1.017 1.005 1.005 0.999 1.006 0.998 1.004 1.004 1.0022006 1.027 1.013 1.017 1.004 1.009 1.002 1.002 1.001 0.998 1.0022007 1.045 1.024 1.009 1.021 1.001 1.007 1.014 1.012 1.002 1.0022008 1.116 1.041 1.055 1.029 1.028 1.013 1.009 1.008 1.002 1.0032009 1.119 1.063 1.028 1.041 1.005 1.002 1.014 1.001 1.0042010 1.125 1.059 1.043 1.029 1.015 1.014 1.005 1.0002011 1.095 1.051 1.072 1.033 1.017 1.003 1.0032012 1.136 1.078 1.038 1.019 1.008 1.0092013 1.128 1.089 1.074 1.040 1.0022014 1.135 1.054 1.021 1.0282015 1.123 1.063 1.0332016 1.140 1.0622017 1.127
2 Yr Avg 1.134 1.063 1.027 1.034 1.005 1.006 1.004 1.001 1.003 1.003 1.000 1.003 1.004 1.003 1.002 1.001 0.997 1.0033 Yr Avg 1.130 1.060 1.043 1.029 1.009 1.009 1.007 1.003 1.006 1.002 1.001 1.006 1.002 1.002 1.002 1.001 0.998 1.0025 Yr Avg 1.131 1.069 1.048 1.030 1.009 1.008 1.008 1.005 1.005 1.001 1.001 1.005 1.002 1.001 1.001 1.001 1.000 1.0025 Yr Avg (Ex. Hi Lo) 1.130 1.068 1.048 1.030 1.009 1.008 1.007 1.004 1.004 1.002 1.001 1.005 1.002 1.001 1.001 1.001 1.001 1.0025 Yr Median 1.128 1.063 1.038 1.029 1.008 1.009 1.007 1.002 1.004 1.002 1.000 1.004 1.002 1.001 1.001 1.001 1.001 1.0027 Yr Avg 1.126 1.065 1.044 1.031 1.014 1.007 1.007 1.004 1.006 1.001 1.000 1.004 1.002 1.001 1.000 1.001 1.000 1.002All Yr Avg 1.124 1.061 1.042 1.026 1.014 1.006 1.006 1.004 1.005 1.001 1.001 1.004 1.001 1.001 1.001 1.001 1.001 1.002T&M Selected 1.130 1.063 1.027 1.029 1.009 1.009 1.004 1.003 1.003 1.002 1.000 1.003 1.002 1.001 1.001 1.001 1.000 1.002 TailCumulative 1.335 1.181 1.112 1.083 1.052 1.043 1.034 1.030 1.027 1.024 1.022 1.022 1.019 1.016 1.015 1.014 1.013 1.012 1.010

Missouri Department of Commerce and Insurance Exhibit VIIReview of 2021 NCCI Loss Cost Filing Page 1Medical Paid Loss Development
Ultimate Wage AdjDevelopment Ultimate On Level
Policy Year Losses Factor Losses Ult. Losses2004 211,339,248 1.055 222,886,754 312,672,2252005 211,820,789 1.059 224,288,184 306,800,2192006 221,709,319 1.062 235,541,265 311,856,6342007 243,958,128 1.067 260,266,675 330,278,4112008 237,376,770 1.071 254,308,985 315,851,7592009 211,152,984 1.077 227,436,201 282,703,1982010 248,677,098 1.082 269,104,000 328,575,9842011 246,423,414 1.088 268,211,851 319,172,1032012 230,149,982 1.099 252,904,339 294,380,6512013 223,317,998 1.110 247,850,863 283,789,2382014 227,011,063 1.124 255,124,200 283,698,1102015 237,140,307 1.141 270,638,725 294,454,9322016 233,403,448 1.173 273,743,678 292,631,9922017 244,076,116 1.246 304,009,133 314,953,4622018 205,729,460 1.523 313,338,142 313,338,142
Medical Limited Statewide Paid Loss Development through @12/19
PY 1/2 2/3 3/4 4/5 5/6 6/7 7/8 8/9 9/10 10/11 11/12 12/13 13/14 14/15 15/16 16/17 17/18 18/191991 1.0021992 1.002 1.0011993 1.003 1.004 1.0031994 1.004 1.008 1.004 1.0041995 1.005 1.005 1.003 1.004 1.0031996 1.006 1.004 1.000 1.001 1.003 1.0011997 1.007 1.005 1.006 1.004 1.006 1.005 1.0111998 1.011 1.012 1.009 1.003 1.003 1.001 1.001 1.0021999 1.007 1.008 1.007 1.010 1.006 1.002 1.009 1.001 1.0012000 1.012 1.006 1.007 1.007 1.004 1.017 1.001 1.002 1.003 1.0012001 1.004 1.007 1.009 1.007 1.004 1.003 1.004 1.005 1.003 1.0032002 1.012 1.011 1.006 1.007 1.005 1.005 1.007 1.004 1.003 1.0112003 1.015 1.014 1.008 1.009 1.005 1.005 1.004 1.002 1.004 1.0022004 1.010 1.015 1.012 1.007 1.012 1.009 1.004 1.004 1.004 1.0062005 1.028 1.026 1.022 1.016 1.006 1.006 1.005 1.004 1.005 1.0042006 1.032 1.017 1.014 1.009 1.015 1.008 1.004 1.003 1.005 1.0032007 1.062 1.036 1.009 1.012 1.011 1.009 1.004 1.004 1.005 1.0032008 1.221 1.064 1.033 1.023 1.022 1.019 1.012 1.004 1.012 1.0052009 1.226 1.059 1.036 1.017 1.013 1.010 1.006 1.006 1.0032010 1.243 1.059 1.036 1.016 1.012 1.010 1.009 1.0072011 1.218 1.058 1.036 1.020 1.018 1.013 1.0122012 1.226 1.066 1.030 1.019 1.015 1.0092013 1.219 1.064 1.027 1.016 1.0052014 1.241 1.061 1.021 1.0152015 1.237 1.059 1.0352016 1.205 1.0602017 1.212
2 Yr Avg 1.209 1.060 1.028 1.016 1.010 1.011 1.011 1.007 1.008 1.005 1.004 1.004 1.004 1.005 1.003 1.007 1.003 1.0013 Yr Avg 1.218 1.060 1.028 1.017 1.013 1.011 1.009 1.006 1.006 1.004 1.004 1.004 1.003 1.005 1.003 1.005 1.002 1.0015 Yr Avg 1.223 1.062 1.030 1.017 1.013 1.012 1.010 1.006 1.006 1.005 1.004 1.004 1.004 1.007 1.003 1.005 1.003 1.0035 Yr Avg (Ex. Hi Lo) 1.223 1.062 1.031 1.017 1.013 1.011 1.010 1.006 1.005 1.005 1.004 1.004 1.004 1.005 1.002 1.005 1.002 1.0015 Yr Median 1.219 1.061 1.030 1.016 1.013 1.010 1.009 1.006 1.004 1.005 1.004 1.004 1.004 1.004 1.002 1.003 1.003 1.0017 Yr Avg 1.223 1.061 1.032 1.018 1.014 1.012 1.011 1.006 1.007 1.006 1.005 1.005 1.005 1.006 1.003 1.005 1.003 1.003All Yr Avg 1.225 1.061 1.032 1.018 1.015 1.013 1.012 1.007 1.008 1.006 1.006 1.006 1.005 1.006 1.003 1.005 1.003 1.003T&M Selected 1.223 1.062 1.028 1.016 1.013 1.010 1.010 1.006 1.005 1.005 1.004 1.004 1.003 1.004 1.002 1.005 1.002 1.001 TailCumulative 1.523 1.246 1.173 1.141 1.124 1.110 1.099 1.088 1.082 1.077 1.071 1.067 1.062 1.059 1.055 1.052 1.047 1.044 1.043

Missouri Department of Commerce and Insurance Exhibiit VIIIReview of 2021 NCCI Loss Cost Filing Page 1Medical Paid + Case Loss Development
Ultimate Wage AdjDevelopment Ultimate On Level
Policy Year Losses Factor Losses Ult. Losses2004 224,583,369 1.016 228,189,786 320,111,4782005 229,698,950 1.017 233,527,547 319,438,5952006 231,879,024 1.016 235,508,214 311,812,8762007 254,660,269 1.018 259,292,629 329,042,3462008 256,946,988 1.019 261,882,565 325,258,1452009 220,211,159 1.015 223,468,516 277,771,3652010 262,003,845 1.011 264,904,507 323,448,4032011 263,868,538 1.008 265,989,475 316,527,4752012 248,814,550 1.010 251,265,951 292,473,5672013 239,292,083 1.008 241,131,845 276,095,9622014 245,453,529 1.005 246,598,640 274,217,6882015 271,050,130 1.002 271,497,713 295,389,5122016 264,095,314 1.001 264,443,235 282,689,8182017 305,208,978 0.998 304,694,230 315,663,2222018 299,251,383 1.021 305,558,107 305,558,107
Medical Limited Statewide Paid+Case Loss Development through @12/19
PY 1/2 2/3 3/4 4/5 5/6 6/7 7/8 8/9 9/10 10/11 11/12 12/13 13/14 14/15 15/16 16/17 17/18 18/191991 0.9971992 1.003 1.0021993 1.001 1.002 1.0021994 0.996 1.001 0.996 1.0061995 1.001 1.004 1.003 0.998 1.0011996 0.999 0.991 1.004 1.008 1.001 1.0021997 1.002 0.993 1.002 0.990 0.999 1.013 0.9901998 1.014 1.009 1.004 0.989 1.008 1.004 1.000 1.0001999 1.000 1.002 1.000 1.005 1.002 1.000 1.004 0.999 0.9992000 1.011 1.003 1.011 1.005 1.003 0.990 0.997 1.000 1.001 1.0032001 1.009 1.001 1.017 1.007 1.002 0.999 1.003 0.993 1.000 0.9962002 1.002 1.001 1.008 1.002 0.999 1.005 1.003 1.003 1.001 1.0022003 1.009 1.000 0.999 0.995 1.004 0.993 1.004 0.999 1.009 1.0012004 0.995 1.005 1.001 1.035 1.005 0.997 1.001 1.005 0.994 0.9982005 1.008 0.989 1.002 1.004 1.001 1.023 0.997 1.010 1.002 1.0002006 0.996 0.997 1.002 0.985 1.006 0.998 1.001 1.006 1.001 1.0032007 1.010 1.001 1.000 0.997 0.998 1.003 1.004 1.002 0.996 1.0012008 1.071 1.025 1.010 0.983 1.010 1.007 0.996 1.007 0.990 0.9852009 1.043 1.013 0.999 1.003 0.998 1.007 1.007 0.996 0.9972010 1.050 1.002 0.994 0.993 1.010 1.001 0.997 0.9982011 1.022 0.998 0.972 0.993 1.024 0.992 1.0062012 1.031 1.005 1.004 0.998 0.986 0.9952013 1.013 0.993 1.000 1.000 0.9812014 1.034 0.993 0.992 1.0082015 1.035 1.006 1.0072016 1.007 0.9662017 1.025
2 Yr Avg 1.016 0.986 1.000 1.004 0.984 0.994 1.002 0.997 0.994 0.991 1.001 1.003 0.997 1.004 1.001 1.001 0.999 1.0013 Yr Avg 1.022 0.988 1.000 1.002 0.997 0.996 1.003 1.000 0.996 0.996 1.004 1.003 0.998 1.003 0.998 1.001 0.999 1.0015 Yr Avg 1.023 0.993 0.995 0.998 1.000 1.000 1.002 1.001 1.003 0.996 1.001 1.004 0.999 1.001 0.998 1.002 1.002 0.9995 Yr Avg (Ex. Hi Lo) 1.024 0.997 0.999 0.997 0.998 1.001 1.002 1.000 1.000 0.997 1.001 1.004 0.999 1.001 0.999 1.002 1.000 1.0005 Yr Median 1.025 0.993 1.000 0.998 0.998 1.001 1.003 0.998 1.001 0.997 1.001 1.004 0.999 1.003 1.000 1.002 1.000 1.0007 Yr Avg 1.024 0.995 0.995 0.997 1.001 0.998 1.003 1.006 1.002 0.998 1.002 1.004 1.000 0.999 0.999 1.002 1.001 1.000All Yr Avg 1.033 1.001 0.998 0.998 0.999 1.000 1.002 1.005 1.003 1.001 1.004 1.004 1.000 0.999 0.999 1.002 1.001 1.000T&M Selected 1.023 0.997 1.000 0.997 0.997 0.998 1.002 0.997 0.996 0.996 1.001 1.003 0.999 1.001 0.998 1.001 0.999 1.001 TailCumulative 1.021 0.998 1.001 1.002 1.005 1.008 1.010 1.008 1.011 1.015 1.019 1.018 1.016 1.017 1.016 1.018 1.017 1.018 1.017

Missouri Department of Commerce and Insurance Exhibit IXReview of 2021 NCCI Loss Cost Filing Page 1Limited to Unlimited Analysis
Factor to Adjust Limited Losses to an Ultimate Bases
(1) Threshold at the Midpoint of the Loss Cost Effective Period 9,919,089(2) Statewide Excess Ratio 0.011(3) Market Share for Carriers Missing from Large Loss and Catastrophe Call 0.000(4) Factor to Adjust Limited Losses to an Unlimited Bases = 1 / [ 1 [ (2) * [ 1 (3 1.011

Missouri Department of Commerce and Insurance Exhibit XReview of 2021 NCCI Loss Cost Filing Page 1Tail Factor Analysis
Indemnity MedicalPaid/Paid+Case Paid/Paid+Case
Policy Year 19th Report 19th Report1996 0.972 0.9531997 0.975 0.9811998 0.973 0.9751999 0.968 0.9862000 0.989 0.959
T&M Selected 0.975 0.975NCCI Selected 0.975 0.975
Indemnity Medical(1) Paid + Case 19th to Ultimate Loss Development Factor 1.012 1.020(2) Factor to Adjust 19th to Ultimate Development Factor to a Limited Basis 0.859 0.859(3) Limited Paid + Case 19th to Ultimate Loss Development Factor = [ (1) 1 ] * (2) + 1 1.010 1.017(4) Limited Paid to Paid + Case Ratio 0.975 0.975(5) Limited Paid 19th to Ultiamte Loss Development Factor = (3) / (4) 1.036 1.043
Indemnity Paid + Case Tail Factor Analysis(1) (2) (3) (4) (5) (6) (7) = [1 + (3) (2) + ((5) (4)) / (6)] / (2)
Factor to IndicatedLosses for Policy Year Losses for All Prior Policy Years Adjust Losses 19th to Ult Development
Policy Year 19th Report 20th Report Previous Current for Prior Policy Years for Policy Year1990 227,070,139 227,101,992 1,740,222,671 1,741,179,800 0.551 1.0081991 225,355,332 225,327,519 1,968,281,782 1,970,265,933 0.630 1.0141992 200,549,303 200,679,586 2,195,087,537 2,198,064,275 0.787 1.0201993 183,188,006 183,535,361 2,399,277,237 2,401,159,473 0.934 1.0131994 163,726,551 163,870,863 2,566,044,372 2,568,255,311 1.098 1.0131995 141,313,490 141,545,926 2,727,688,854 2,729,411,452 1.309 1.0111996 147,966,426 148,885,395 2,870,128,232 2,872,051,105 1.256 1.0171997 154,311,500 154,746,190 3,017,196,317 3,016,590,277 1.201 1.0001998 182,540,288 182,664,069 3,169,160,582 3,171,144,364 1.008 1.0111999 178,274,607 178,699,133 3,218,869,043 3,221,136,033 0.987 1.015
T&M 19th to Ultimate Loss Development Factor 1.012NCCI Indemnity 19th to Ultimate Loss Development Factor 1.012
Medical Paid + Case Tail Factor Analysis
(1) (2) (3) (4) (5) (6) (7) = [1 + (3) (2) + ((5) (4)) / (6)] / (2)Factor to Indicated
Losses for Policy Year Losses for All Prior Policy Years Adjust Losses 19th to Ult DevelopmentPolicy Year 19th Report 20th Report Previous Current for Prior Policy Years for Policy Year
1990 182,510,617 182,123,647 1,210,755,402 1,209,584,537 0.502 0.9851991 191,573,815 192,847,310 1,391,708,184 1,391,806,331 0.551 1.0081992 165,486,131 165,432,240 1,584,603,674 1,590,881,650 0.723 1.0521993 169,737,364 170,485,300 1,756,367,002 1,757,043,235 0.775 1.0101994 151,270,232 149,612,389 1,915,056,614 1,916,008,300 0.935 0.9961995 134,266,425 134,657,354 2,061,176,436 2,065,782,021 1.111 1.0341996 128,546,172 128,496,716 2,199,686,714 2,200,950,027 1.194 1.0081997 152,933,798 153,607,274 2,327,361,810 2,327,688,399 1.021 1.0061998 156,288,073 155,917,719 2,480,377,273 2,483,028,345 1.011 1.0141999 162,855,364 162,873,779 2,532,868,394 2,541,713,451 0.946 1.058
T&M 19th to Ultimate Loss Development Factor 1.020NCCI Indemnity 19th to Ultimate Loss Development Factor 1.020

Missouri Department of Commerce and Insurance Exhibit XIReview of 2021 NCCI Loss Cost Filing Page 1Derivation of the Factor to Adjust Losses for Prior Policy Years for Valuation Year 2019
Indemnity Paid + Case Data
(1) (2) (3) (4) = (3) / (2) (5) = 1 / (4) (6)Older Year Newer Year Growth Inverse Growth Upward Cum.
Policy Year Evaluation Date Paid + Case Losses Evaluation Date Paid + Case Losses Ratio Ratio Prod of (5)1986/1985 PY 1985@2004 140,568,476 PY 1986@2005 157,871,301 1.123 0.890 0.7171987/1986 PY 1986@2005 157,871,301 PY 1987@2006 179,756,406 1.139 0.878 0.8051988/1987 PY 1987@2006 177,454,320 PY 1988@2007 198,950,113 1.121 0.892 0.9161989/1988 PY 1988@2007 198,505,376 PY 1989@2008 220,882,644 1.113 0.899 1.0271990/1989 PY 1989@2008 219,039,126 PY 1990@2009 232,456,428 1.061 0.942 1.1431991/1990 PY 1990@2009 227,189,268 PY 1991@2010 225,498,511 0.993 1.007 1.2131992/1991 PY 1991@2010 225,498,511 PY 1992@2011 200,835,736 0.891 1.123 1.2041993/1992 PY 1992@2011 200,811,854 PY 1993@2012 183,496,440 0.914 1.094 1.0721994/1993 PY 1993@2012 183,545,036 PY 1994@2013 165,007,399 0.899 1.112 0.9801995/1994 PY 1994@2013 163,997,293 PY 1995@2014 141,633,259 0.864 1.158 0.8811996/1995 PY 1995@2014 141,608,646 PY 1996@2015 148,254,038 1.047 0.955 0.7611997/1996 PY 1996@2015 148,247,760 PY 1997@2016 154,914,525 1.045 0.957 0.7961998/1997 PY 1997@2016 154,914,525 PY 1998@2017 182,906,839 1.181 0.847 0.8321999/1998 PY 1998@2017 192,061,279 PY 1999@2018 195,440,205 1.018 0.983 0.983
T&M Selected 0.987NCCI Factor to Adjust Losses for Prior Years 10 Year Average 0.987
Medical Paid + Case Data
(1) (2) (3) (4) = (3) / (2) (5) = 1 / (4) (6)Older Year Newer Year Growth Inverse Growth Upward Cum.
Policy Year Evaluation Date Paid + Case Losses Evaluation Date Paid + Case Losses Ratio Ratio Prod of (5)1986/1985 PY 1985@2004 94,696,424 PY 1986@2005 108,101,402 1.142 0.876 0.5371987/1986 PY 1986@2005 108,101,402 PY 1987@2006 140,700,501 1.302 0.768 0.6131988/1987 PY 1987@2006 139,423,344 PY 1988@2007 152,395,769 1.093 0.915 0.7981989/1988 PY 1988@2007 152,292,010 PY 1989@2008 169,069,844 1.110 0.901 0.8721990/1989 PY 1989@2008 167,794,520 PY 1990@2009 186,527,540 1.112 0.900 0.9681991/1990 PY 1990@2009 182,662,813 PY 1991@2010 191,692,398 1.049 0.953 1.0761992/1991 PY 1991@2010 191,692,398 PY 1992@2011 166,012,660 0.866 1.155 1.1291993/1992 PY 1992@2011 166,008,493 PY 1993@2012 170,212,510 1.025 0.975 0.9781994/1993 PY 1993@2012 170,220,623 PY 1994@2013 152,705,754 0.897 1.115 1.0031995/1994 PY 1994@2013 151,577,681 PY 1995@2014 134,631,701 0.888 1.126 0.9001996/1995 PY 1995@2014 134,623,547 PY 1996@2015 128,910,066 0.958 1.044 0.7991997/1996 PY 1996@2015 128,897,172 PY 1997@2016 153,272,672 1.189 0.841 0.7651998/1997 PY 1997@2016 153,272,672 PY 1998@2017 156,640,785 1.022 0.978 0.9101999/1998 PY 1998@2017 164,679,784 PY 1999@2018 177,106,284 1.075 0.930 0.930
T&M Selected 0.946NCCI Factor to Adjust Losses for Prior Years 10 Year Average 0.946
Missouri Department of Commerce and Insurance Exhibit XIReview of 2021 NCCI Loss Cost Filing Page 2Derivation of the Factor to Adjust Losses for Prior Policy Years for Valuation Year 2018
Indemnity Paid + Case Data
(1) (2) (3) (4) = (3) / (2) (5) = 1 / (4) (6)Older Year Newer Year Growth Inverse Growth Upward Cum.
Policy Year Evaluation Date Paid + Case Losses Evaluation Date Paid + Case Losses Ratio Ratio Prod of (5)1985/1984 PY 1984@2003 117,747,967 PY 1985@2004 141,498,461 1.202 0.832 0.6071986/1985 PY 1985@2004 140,568,476 PY 1986@2005 157,871,301 1.123 0.890 0.7291987/1986 PY 1986@2005 157,871,301 PY 1987@2006 179,756,406 1.139 0.878 0.8191988/1987 PY 1987@2006 177,454,320 PY 1988@2007 198,950,113 1.121 0.892 0.9321989/1988 PY 1988@2007 198,505,376 PY 1989@2008 220,882,644 1.113 0.899 1.0451990/1989 PY 1989@2008 219,039,126 PY 1990@2009 232,456,428 1.061 0.942 1.1631991/1990 PY 1990@2009 227,189,268 PY 1991@2010 225,498,511 0.993 1.007 1.2341992/1991 PY 1991@2010 225,498,511 PY 1992@2011 200,835,736 0.891 1.123 1.2251993/1992 PY 1992@2011 200,811,854 PY 1993@2012 183,496,440 0.914 1.094 1.0911994/1993 PY 1993@2012 183,545,036 PY 1994@2013 165,007,399 0.899 1.112 0.9971995/1994 PY 1994@2013 163,997,293 PY 1995@2014 141,633,259 0.864 1.158 0.8961996/1995 PY 1995@2014 141,608,646 PY 1996@2015 148,254,038 1.047 0.955 0.7741997/1996 PY 1996@2015 148,247,760 PY 1997@2016 154,914,525 1.045 0.957 0.8111998/1997 PY 1997@2016 154,914,525 PY 1998@2017 182,906,839 1.181 0.847 0.847
T&M Selected 1.008NCCI Factor to Adjust Losses for Prior Years 10 Year Average 1.008
Medical Paid + Case Data
(1) (2) (3) (4) = (3) / (2) (5) = 1 / (4) (6)Older Year Newer Year Growth Inverse Growth Upward Cum.
Policy Year Evaluation Date Paid + Case Losses Evaluation Date Paid + Case Losses Ratio Ratio Prod of (5)1985/1984 PY 1984@2003 77,605,188 PY 1985@2004 95,327,411 1.228 0.814 0.4701986/1985 PY 1985@2004 94,696,424 PY 1986@2005 108,101,402 1.142 0.876 0.5771987/1986 PY 1986@2005 108,101,402 PY 1987@2006 140,700,501 1.302 0.768 0.6591988/1987 PY 1987@2006 139,423,344 PY 1988@2007 152,395,769 1.093 0.915 0.8581989/1988 PY 1988@2007 152,292,010 PY 1989@2008 169,069,844 1.110 0.901 0.9381990/1989 PY 1989@2008 167,794,520 PY 1990@2009 186,527,540 1.112 0.900 1.0411991/1990 PY 1990@2009 182,662,813 PY 1991@2010 191,692,398 1.049 0.953 1.1571992/1991 PY 1991@2010 191,692,398 PY 1992@2011 166,012,660 0.866 1.155 1.2151993/1992 PY 1992@2011 166,008,493 PY 1993@2012 170,212,510 1.025 0.975 1.0521994/1993 PY 1993@2012 170,220,623 PY 1994@2013 152,705,754 0.897 1.115 1.0781995/1994 PY 1994@2013 151,577,681 PY 1995@2014 134,631,701 0.888 1.126 0.9681996/1995 PY 1995@2014 134,623,547 PY 1996@2015 128,910,066 0.958 1.044 0.8591997/1996 PY 1996@2015 128,897,172 PY 1997@2016 153,272,672 1.189 0.841 0.8231998/1997 PY 1997@2016 153,272,672 PY 1998@2017 156,640,785 1.022 0.978 0.978
T&M Selected 1.011NCCI Factor to Adjust Losses for Prior Years 10 Year Average 1.011

ATTACHMENT ANCCI RESPONSES TO OBJECTIONS INCLUDING EXHIBITS

NATIONAL COUNCIL ON COMPENSATION INSURANCE, INC.
MISSOURI ADVISORY LOSS COSTS AND RATING VALUES FILING—JANUARY 1, 2021
RESPONSES TO THE DEPARTMENT OF COMMERCE AND INSURANCE’S REQUESTS DATED SEPTEMBER 28, 2020
1
1. Have any of the data sources used in determining the Missouri Advisory Loss Costs and Rating Values Filing changed since the previous filing? For example, using data from a different data call to develop expenses. There have not been any changes in the underlying data sources between this and last year’s filings.
2. Please provide the estimated overall impact for each change in methodology from the previous filing. Two changes to Missouri’s aggregate ratemaking methodology have been included in this year’s filing.
In last year’s filing, the most recent three-year average of historical paid loss development factors through a 19th report was utilized. In this year’s filing, a two-year average of paid loss development factors was incorporated—lowering the otherwise-calculated overall average loss cost level change by 0.3%.
The change to the current AOE provision in this year’s filing (+0.7%) is primarily
driven by the proposed update to the AOE methodology, as described on page 19 of the filing.
3. Page 27 of 98: Please provide the updated calculation for the terrorism advisory lost cost if any of the underlying assumptions and/or data have changed. There have not been any changes to the methodology or assumptions used in determining the terrorism advisory loss cost between this and last year’s filings.
4. Please provide loss development triangles with at least 10 diagonals for both the voluntary and assigned risk markets separated by indemnity, medical, and DCCE for the past 19 years. In the prior year, this was submitted as NCCI response to ATSI Interrogatories for MO 1-1-2020.xlsx. An updated version of this file will suffice for these purposes. Please see the attached Exhibit 4 for the available loss development triangles.

NATIONAL COUNCIL ON COMPENSATION INSURANCE, INC.
MISSOURI ADVISORY LOSS COSTS AND RATING VALUES FILING—JANUARY 1, 2021
RESPONSES TO THE DEPARTMENT OF COMMERCE AND INSURANCE’S REQUESTS DATED SEPTEMBER 28, 2020
2
5. Please explain your reasoning and provide detailed support for using a 2-year average of the paid LDFs in this filing when last year a 3-year average was used. Prior to the January 1, 2018 filing, the most recent two-year average of historical paid loss development factors through a 19th report was utilized in Missouri’s annual loss cost filings. In response to atypical indemnity paid link ratios observed at early maturities (1:2 and 2:3) on the @12/16 diagonal, a temporary shift to a three-year average was incorporated into the January 1, 2018 Missouri filing to temper the influence that these link ratios would otherwise have on the overall aggregate loss cost level indication. In this year’s filing, reliance on two-year average paid loss development (unimpacted by suspected outlier link ratios) was once again incorporated as being both actuarially appropriate and responsive to Missouri’s workers compensation environment.
6. Please provide an Excel file with the specific calculations used to determine Appendix A-II, Section G, column (6). Please see the attached Exhibit 6 for the requested information. The calculations are provided for the most recent two valuations separately for indemnity and medical.
7. Please provide an excel file spreadsheet with the specific calculations that provide the derivation of the 0.859 factor in Appendix A-II, Section H, line 2. A countrywide unlimited tail factor (ULDF) is determined based on financial data for NCCI states. Then a countrywide limited tail factor (CLDFT) is calculated based on Missouri’s large loss threshold, T.
CLDFT = (1 – XST) / (1/ULDF – XST/ELDFT), where
XST is the excess loss ratio for threshold T ELDFT is the excess loss development factor for threshold T
FT, the factor to adjust the loss development factor to a limited basis, is then calculated. This is the ratio of limited-to-unlimited countrywide tail factors.
FT = (CLDFT 1.0) / (ULDF 1.0)

NATIONAL COUNCIL ON COMPENSATION INSURANCE, INC.
MISSOURI ADVISORY LOSS COSTS AND RATING VALUES FILING—JANUARY 1, 2021
RESPONSES TO THE DEPARTMENT OF COMMERCE AND INSURANCE’S REQUESTS DATED SEPTEMBER 28, 2020
3
Appendix A-II, Section K, Line 1 shows the large loss threshold used in this year’s Missouri filing ($9,919,089). Using the terminology above, the ULDF is 1.025, the CLDFT at a threshold of $9M is 1.0210, and the CLDFT at a threshold of $10M is 1.0215. Using the above-referenced formula for FT at each of the $9M and $10M thresholds and then interpolating between those results produces the 0.859 factor corresponding to Missouri’s large loss threshold.
8. Exhibit II Section B Page 43 of 98:
a) Please provide in excel an additional 5 years of Countrywide AOE Ultimate AOE Ratios.
b) Please provide the underlying data and calculations to bring AOE to an ultimate level including the development factors, AOE, losses, and any other values used to determine the Ultimate AOE ratios.
c) Please provide the Ultimate AOE Ratios for MO only data. d) Please provide your reasoning and support for the selected Countrywide AOE
ratio of 8.9% when all other accident years aside from 2019 are below 8.9%. e) Please provide the underlying data and calculations for the MO Selected AOE
ratio. As a result of Third-Party Administrator (TPA) agreements, some carriers report losses on Financial Call 19 without associated AOE. Beginning with this filing, for policies associated with TPA agreements where the AOE is not reported to NCCI, the associated losses were excluded from the AOE analysis so that they did not impact the ultimate AOE ratios. The detailed data required to make this adjustment was only collected from the carriers for the most recent five experience years in response to an NCCI data request. As the AOE ratios are based on data collected on countrywide Financial Call 19, ultimate AOE ratios by individual state are not available. It should be noted that only the losses without associated AOE were removed from this year’s AOE analysis, rather than entire carrier Call 19 data submissions. Please see the attached Exhibit 8 for the requested calculations underlying the new AOE methodology proposed with this year’s filing. Note that the historical countrywide AOE values shown for years 2015 through 2018 on page 43 of the filing are based on the current AOE methodology. The countrywide selected AOE provision of 8.9% shown on page 43 of the filing is based on the five years of AOE indications shown in Exhibit 8.

NATIONAL COUNCIL ON COMPENSATION INSURANCE, INC.
MISSOURI ADVISORY LOSS COSTS AND RATING VALUES FILING—JANUARY 1, 2021
RESPONSES TO THE DEPARTMENT OF COMMERCE AND INSURANCE’S REQUESTS DATED SEPTEMBER 28, 2020
4
The Missouri selected AOE provision is based on a weighted average (71% / 29%, respectively) of the countrywide private carrier AOE provision and the indicated provision for the Missouri state fund.
9. Page 45 of 98: Exhibit II Section E: Please explain the rationale of only using the average of 2 years to select the DCCE loss development factor. Why weren’t more years considered or a geometric average? A two-year average was selected as a balance between stability and responsiveness as well as consistency with the two-year average paid loss development factors utilized in the determination of the overall average loss cost level change.
10. Page 44 of 98: Exhibit II Section C: Please provide an excel file that expands this section to include years 2009 through 2013. The requested information is as follows:
Policy Year
(1) Reported Ratio of
Paid DCCE to Paid Losses
(2) Age to Ultimate Development
Factor
(3) = (1)x(2) Ultimate
DCCE Ratio
2009 0.111 0.985 0.109 2010 0.110 0.979 0.108 2011 0.109 0.976 0.106 2012 0.109 0.972 0.106 2013 0.109 0.966 0.105
11. Page 44 of 98: Companies that did not report AOE may be including expenses typically considered to be AOE in DCCE expenses, potentially inflating the DCCE provision for the same reasons that this error would reduce the AOE provision. Were companies that did not report AOE excluded from the calculation of the DCCE provision as well? If not, please provide a revised DCCE provision excluding DCCE and losses from companies that did not report AOE.

NATIONAL COUNCIL ON COMPENSATION INSURANCE, INC.
MISSOURI ADVISORY LOSS COSTS AND RATING VALUES FILING—JANUARY 1, 2021
RESPONSES TO THE DEPARTMENT OF COMMERCE AND INSURANCE’S REQUESTS DATED SEPTEMBER 28, 2020
5
Instances of carriers reporting losses on Call 19 without associated AOE is unlikely to affect DCCE reporting. As a result of TPA agreements, some carriers report losses on Call 19 without associated AOE. These TPA contracts typically involve AOE payments only—and exclude the handling of DCCE costs. As such, carriers are able to account for and fully report their DCCE payments to NCCI. It should be noted that only the losses without associated AOE were removed from this year’s AOE analysis, rather than entire carrier Call 19 data submissions.
12. Appendix A-IV Section I Page 62 of 98: Please show the calculations underlying the factors in Col (4) and Col (5). Please see the attached Exhibit 12 for the requested information.
13. Appendix B-I Section I Page 65 of 98: Please provide underlying data and calculations for how the Likely-to-Develop and Not-Likely-to-Develop columns are calculated. Please see the attached Exhibit 13 for the requested information.
14. Page 61 of 98 (Appendix A-III). Provide the underlying data, fits, assumptions, calculations, selections, and rationale of the selection of the indemnity and medical trend factors. Please include an update of the excel file provided last year entitled Supplemental Loss Development and Trend Information. Please include fifteen years of information including Lost-Time claim frequency and severity based on data in excess of wage inflation, claim counts, premium, limited indemnity losses, and limited medical losses. Please see the attached Exhibit 14 for the requested trend information. The filing proposes no changes to the annual loss ratio trend factors that have been in effect since January 1, 2020. Underlying the proposed loss ratio trend factors in this year’s filing are historically observed declines in lost-time claim frequency, relatively flat year-to-year changes in indemnity claim severity, and a moderately increasing pattern of medical lost-time claim severities.
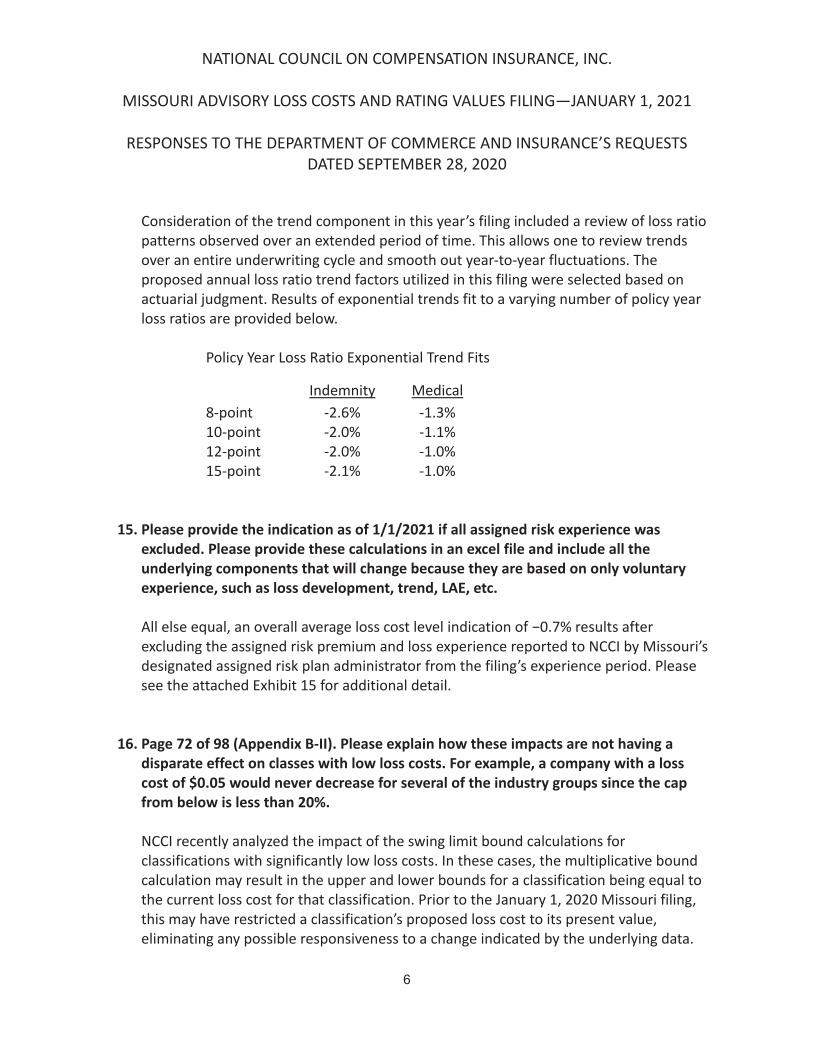
NATIONAL COUNCIL ON COMPENSATION INSURANCE, INC.
MISSOURI ADVISORY LOSS COSTS AND RATING VALUES FILING—JANUARY 1, 2021
RESPONSES TO THE DEPARTMENT OF COMMERCE AND INSURANCE’S REQUESTS DATED SEPTEMBER 28, 2020
6
Consideration of the trend component in this year’s filing included a review of loss ratio patterns observed over an extended period of time. This allows one to review trends over an entire underwriting cycle and smooth out year-to-year fluctuations. The proposed annual loss ratio trend factors utilized in this filing were selected based on actuarial judgment. Results of exponential trends fit to a varying number of policy year loss ratios are provided below.
Policy Year Loss Ratio Exponential Trend Fits
Indemnity Medical 8-point -2.6% -1.3% 10-point -2.0% -1.1% 12-point -2.0% -1.0% 15-point -2.1% -1.0%
15. Please provide the indication as of 1/1/2021 if all assigned risk experience was excluded. Please provide these calculations in an excel file and include all the underlying components that will change because they are based on only voluntary experience, such as loss development, trend, LAE, etc. All else equal, an overall average loss cost level indication of 0.7% results after excluding the assigned risk premium and loss experience reported to NCCI by Missouri’s designated assigned risk plan administrator from the filing’s experience period. Please see the attached Exhibit 15 for additional detail.
16. Page 72 of 98 (Appendix B-II). Please explain how these impacts are not having a disparate effect on classes with low loss costs. For example, a company with a loss cost of $0.05 would never decrease for several of the industry groups since the cap from below is less than 20%. NCCI recently analyzed the impact of the swing limit bound calculations for classifications with significantly low loss costs. In these cases, the multiplicative bound calculation may result in the upper and lower bounds for a classification being equal to the current loss cost for that classification. Prior to the January 1, 2020 Missouri filing, this may have restricted a classification’s proposed loss cost to its present value, eliminating any possible responsiveness to a change indicated by the underlying data.

NATIONAL COUNCIL ON COMPENSATION INSURANCE, INC.
MISSOURI ADVISORY LOSS COSTS AND RATING VALUES FILING—JANUARY 1, 2021
RESPONSES TO THE DEPARTMENT OF COMMERCE AND INSURANCE’S REQUESTS DATED SEPTEMBER 28, 2020
7
In last year’s Missouri filing, NCCI implemented a modification to the calculation of the loss cost bounds by classification when both the upper and lower bounds are equal to the current loss cost. In these cases, NCCI reviews the change indicated by the classification and the corresponding industry group. If the direction of these two indications are aligned, NCCI adjusts the upper or lower bound so that the proposed loss cost may change by one cent from its current value in the direction of the change indicated for the classification.
17. Please provide any updates on class ratemaking research, status and results, or stability performance results on tests of the performance of the recently implemented small class ratemaking project intended to address the stability of the small classes. Please see the attached Exhibit 17 which contains the most recent NCCI research related to the stability of small classes in NCCI ratemaking. The following NCCI Actuarial Committee presentations are contained in Exhibit 17:
“Class Ratemaking Research: Status and Results” presented February 23, 2017 “Class Ratemaking Research: Final Wrap-Up” presented February 22, 2018
18. Please provide an Excel file with seven columns of information. The first column should be the class code, the second column should be the exposures by class code, the third column should be the current advisory loss cost, the fourth column should be the proposed advisory loss cost by class code and the last three columns should be the percentage loss cost changes effective 2021, 2020, and 2019 by class code. Include totals in columns 5, 6, and 7 and please exclude discontinued classes. Please see the attached Exhibit 18 for the requested information.
19. Please confirm that the indication provided in Exhibit I is an indication for the voluntary market but that the data upon which it is based is on combined voluntary and assigned risk plan losses. If not, please explain. Please confirm that although the voluntary indications are based on combined voluntary and assigned risk plan data, that you are not providing loss costs or rates for the assigned risk market.

NATIONAL COUNCIL ON COMPENSATION INSURANCE, INC.
MISSOURI ADVISORY LOSS COSTS AND RATING VALUES FILING—JANUARY 1, 2021
RESPONSES TO THE DEPARTMENT OF COMMERCE AND INSURANCE’S REQUESTS DATED SEPTEMBER 28, 2020
8
The voluntary market advisory loss cost level indication determined in the filing’s Exhibit I is based on combined voluntary and assigned risk premium and loss experience reported to NCCI. NCCI’s role in Missouri does not include the filing of loss costs or rates for the state’s assigned risk market.

NATIONAL COUNCIL ON COMPENSATION INSURANCE 2020 ANNUAL COUNTRYWIDE ADJUSTING AND OTHER EXPENSE REVIEW
1 © Copyright 2020 National Council on Compensation Insurance, Inc. All Rights Reserved.
Each year, NCCI calculates a countrywide (CW) adjusting and other expense (AOE) provision. This file provides the CW AOE provision that will be filed as applicable during the 2020–2021 filing season.
NCCI calculates ultimate AOE ratios by accident year, separately for both paid and incurred data (paid plus unpaid). The selected AOE ratio for an individual year is calculated as the average of the paid and incurred AOE ratio indications. The AOE ratios by year as well as the selected provision is shown in Exhibit 1.
Exhibit 1: Ultimate AOE Ratios and Countrywide Selection
Ultimate AOE Ultimate AOE Ultimate AOE Ratio Based on
Ratio Based on Ratio Based on Avg. of Paid and Accident Year Paid Data Incurred Data Incurred Data
2015 7.8% 7.8% 7.8% 2016 8.3% 8.2% 8.3% 2017 8.9% 8.8% 8.9% 2018 8.8% 8.8% 8.8% 2019 9.0% 8.8% 8.9%
Selected AOE Provision 8.9%
Exhibit 8

NATIONAL COUNCIL ON COMPENSATION INSURANCE 2020 ANNUAL COUNTRYWIDE ADJUSTING AND OTHER EXPENSE REVIEW
2 © Copyright 2020 National Council on Compensation Insurance, Inc. All Rights Reserved.
Data Used NCCI uses private carrier data reported on NCCI Call 19 to calculate the ultimate AOE ratios. Call 19 is a CW Call in which data is reported for the most recent 10 individual accident years, in addition to an aggregated “prior line” in which data is reported for all years older than the most recent 10. The data reported includes losses and AOE on both a paid and unpaid (i.e., case plus IBNR reserves) basis. Further, the Call 19 data is reported for all policy types—including that for large deductible policies.
Methodology Overview
To determine the ultimate AOE ratios, NCCI uses the following methodology for each accident year:
After developing AOE and losses separately to a 10th report, calculate the ratio of AOE-to-losses at that age of maturity Apply a 10th-to-ultimate (tail) factor to the AOE ratios at a 10th report Apply the adjustment for AOE below the deductible limit
The purpose of this adjustment is to account for carriers that treat reimbursements of AOE below a deductible limit as a credit to their total AOE. The adjustment reverses this credit, increasing the AOE dollars as a percentage of losses.
Apply the adjustment for losses associated with Third-Party Administrator (TPA) Agreements (new for the 2020 Annual CW AOE Review):
As a result of TPA agreements, some carriers report losses on Call #19 without associated AOE. The purpose of this adjustment is to remove these losses from the analysis.
Apply the adjustment to convert losses from a net-of-deductible to a gross-of-deductible basis Up to this point in the calculation, the data used includes losses from large deductible policies, net of the deductible. The purpose of this adjustment is to convert the data to a full coverage basis, allowing the AOE provision to be on the same basis as the losses used in individual state experience filings.
Exhibit 8

NATIONAL COUNCIL ON COMPENSATION INSURANCE 2020 ANNUAL COUNTRYWIDE ADJUSTING AND OTHER EXPENSE REVIEW
3 © Copyright 2020 National Council on Compensation Insurance, Inc. All Rights Reserved.
Exhibit 2: Calculation of Ultimate AOE Ratios—Paid Data
(1) (2) (3)=(1)x(2) (4) (5) (6)=(4)x(5)
Cumulative Estimated Cumulative Estimated
Paid AOE Paid AOE Paid AOE Paid Losses Paid Loss Paid Losses
at Current Development Developed to a at Current Development Developed to a Accident Year Report Factors 10th Report Report Factors 10th Report
2015 1,762,405,982 1.088 1,917,497,708 15,877,014,233 1.141 18,115,673,240 2016 1,798,537,405 1.137 2,044,937,029 14,769,511,806 1.223 18,063,112,939 2017 1,796,408,238 1.221 2,193,414,459 13,260,201,068 1.391 18,444,939,686 2018 1,647,154,595 1.393 2,294,486,351 10,872,410,528 1.800 19,570,338,950 2019 1,181,971,666 2.069 2,445,499,377 5,088,736,249 3.956 20,131,040,601
(7) (8)=(3)/(6)x(7) (9) (10) (11) (12)= [(8)+(9)]x(10)x(11)
10th Report- Estimated Adjustment Adjustment for Adjustment to Estimated
to-Ultimate Ultimate AOE for AOE Below Losses Convert From Ultimate AOE
Paid AOE Ratio Before the Deductible Associated with Net to Gross Ratio After Accident Year Tail Factor Adjustments Limit TPA Agreements of Deductible Adjustments
2015 0.910 9.6% 0.009 1.059 0.70 7.8% 2016 0.910 10.3% 0.010 1.057 0.70 8.3% 2017 0.910 10.8% 0.011 1.065 0.70 8.9% 2018 0.910 10.6% 0.011 1.067 0.70 8.8% 2019 0.910 11.0% 0.009 1.078 0.70 9.0%
Exhibit 8

NATIONAL COUNCIL ON COMPENSATION INSURANCE 2020 ANNUAL COUNTRYWIDE ADJUSTING AND OTHER EXPENSE REVIEW
4 © Copyright 2020 National Council on Compensation Insurance, Inc. All Rights Reserved.
Exhibit 3: Calculation of Ultimate AOE Ratios—Incurred Data
(1) (2) (3)=(1)x(2) (4) (5) (6)=(4)x(5)
Cumulative Estimated Cumulative Estimated
Incurred AOE Incurred AOE Incurred AOE Incurred Losses Incurred Loss Incurred Losses
at Current Development Developed to a at Current Development Developed to a Accident Year Report Factors 10th Report Report Factors 10th Report
2015 2,096,541,259 1.018 2,134,279,002 22,876,301,959 0.976 22,327,270,712 2016 2,232,668,241 1.014 2,263,925,596 23,387,611,726 0.956 22,358,556,810 2017 2,389,604,132 1.008 2,408,720,965 24,148,808,712 0.933 22,530,838,528 2018 2,474,282,050 0.989 2,447,064,947 25,582,304,982 0.906 23,177,568,314 2019 2,515,285,647 0.967 2,432,281,221 25,457,147,440 0.886 22,555,032,632
(7) (8)=(3)/(6)x(7) (9) (10) (11) (12)= [(8)+(9)]x(10)x(11)
10th Report- Estimated Adjustment Adjustment for Adjustment to Estimated
to-Ultimate Ultimate AOE for AOE Below Losses Convert From Ultimate AOE
Incurred AOE Ratio Before the Deductible Associated with Net to Gross Ratio After Accident Year Tail Factor Adjustments Limit TPA Agreements of Deductible Adjustments
2015 1.000 9.6% 0.009 1.059 0.70 7.8% 2016 1.000 10.1% 0.010 1.057 0.70 8.2% 2017 1.000 10.7% 0.011 1.065 0.70 8.8% 2018 1.000 10.6% 0.011 1.067 0.70 8.8% 2019 1.000 10.8% 0.009 1.078 0.70 8.8%
Exhibit 8

NATIONAL COUNCIL ON COMPENSATION INSURANCE 2020 ANNUAL COUNTRYWIDE ADJUSTING AND OTHER EXPENSE REVIEW
5 © Copyright 2020 National Council on Compensation Insurance, Inc. All Rights Reserved.
Exhibit 4: AOE Tail Factor Selection—Paid
(1)
(2)
(3) = (1)/(2)
Paid AOE-to-Losses Paid AOE Paid Losses 10th-to-Ultimate
Valuation Date 10th-to-Ultimate 10th-to-Ultimate Tail Factor 12/31/2014 1.089 1.233 0.883 12/31/2015 1.057 1.214 0.871 12/31/2016 1.081 1.198 0.902 12/31/2017 1.073 1.192 0.900 12/31/2018 1.115 1.138 0.980 12/31/2019 1.060 1.158 0.915
Selected Paid AOE Tail Factor 0.910
Exhibit 5: AOE Tail Factor Selection—Incurred
(1)
(2)
(3) = (1)/(2)
Incurred AOE-to-Losses Incurred AOE Incurred Losses 10th-to-Ultimate
Valuation Date 10th-to-Ultimate 10th-to-Ultimate Tail Factor 12/31/2014 1.027 1.033 0.994 12/31/2015 0.999 1.017 0.982 12/31/2016 1.004 0.995 1.009 12/31/2017 1.000 0.997 1.003 12/31/2018 1.041 0.960 1.084 12/31/2019 1.008 0.976 1.033
Selected Incurred AOE Tail Factor 1.000
Exhibit 8

Exhibit 12

Likely
85,873,459 99,509,003 107,909,762 115,044,355 118,736,234 121,084,306 123,258,576 125,144,38476,947,671 91,690,283 101,288,877 107,913,115 112,385,948 114,492,756 116,431,00876,140,429 88,429,315 97,122,490 102,414,309 106,329,085 108,223,44077,323,191 93,390,680 101,811,778 107,897,799 111,698,78960,056,111 72,230,419 81,623,268 86,439,77162,432,683 75,716,217 83,041,09859,888,929 74,026,98958,046,953
1.159 1.084 1.066 1.032 1.020 1.018 1.015 0.9961.192 1.105 1.065 1.041 1.019 1.017 1.0091.161 1.098 1.054 1.038 1.018 1.0251.208 1.090 1.060 1.035 1.0401.203 1.130 1.059 1.0531.213 1.097 1.0821.236 1.1481.235
Exhibit 13

Not-Likely
153,963,719 162,850,099 168,125,804 170,244,621 171,229,670 171,878,571 172,360,979 173,273,486147,478,853 157,943,608 164,060,221 166,495,078 169,362,459 169,315,079 170,012,167151,819,694 164,230,930 169,498,764 173,131,217 174,361,556 175,769,718147,714,143 159,379,477 167,941,265 172,880,371 173,571,859139,687,182 154,274,723 162,009,873 164,259,555134,849,777 146,367,706 154,581,843140,932,549 156,264,774140,534,996
1.058 1.032 1.013 1.006 1.004 1.003 1.005 1.0011.071 1.039 1.015 1.017 1.000 1.004 0.9981.082 1.032 1.021 1.007 1.008 0.9981.079 1.054 1.029 1.004 1.0041.104 1.050 1.014 1.0021.085 1.056 1.0211.109 1.0531.090
Exhibit 13

Likely
102,901,807 109,548,383 112,018,719 113,313,720 115,348,918 115,484,370 114,888,543 116,326,59599,323,294 106,494,451 110,979,108 114,405,386 114,845,328 114,274,953 114,483,824100,854,536 105,262,138 108,886,106 110,393,045 111,390,966 111,011,418100,533,090 106,442,753 110,879,923 114,192,455 114,978,38281,308,701 88,082,227 89,043,099 90,604,95888,550,954 96,355,353 96,689,85188,012,598 94,354,74887,546,132
1.065 1.023 1.012 1.018 1.001 0.995 1.013 0.9991.072 1.042 1.031 1.004 0.995 1.002 1.0051.044 1.034 1.014 1.009 0.997 1.0111.059 1.042 1.030 1.007 1.0001.083 1.011 1.018 1.0091.088 1.003 1.0101.072 1.0401.061
Exhibit 13

Not-Likely
220,323,177 222,181,247 224,103,020 223,283,193 223,427,182 223,859,953 223,269,624 223,246,842229,660,457 231,894,531 232,046,284 231,763,368 231,264,814 231,053,325 231,442,581241,306,088 243,502,966 245,021,830 246,691,026 245,444,289 245,542,135243,699,208 247,359,165 249,999,730 249,947,774 249,328,811235,382,638 240,558,389 243,160,990 242,547,891240,958,854 244,822,641 245,982,044259,480,693 263,990,360258,173,684
1.008 1.009 0.996 1.001 1.002 0.997 1.000 0.9981.010 1.001 0.999 0.998 0.999 1.002 0.9991.009 1.006 1.007 0.995 1.000 0.9971.015 1.011 1.000 0.998 0.9981.022 1.011 0.997 0.9951.016 1.005 0.9941.017 1.0001.005
Exhibit 13

Committee members and meeting participants are prohibited from discussing any matter pertainingspecifically and directly to rates or loss costs in any particular state or states.
Exhibit 6-1Page 1 of 27
© Copyright 2017 National Council on Compensation Insurance, Inc. All Rights Reserved.
38
Exhibit 17

Exhibit 6-1Page 2 of 27
© Copyright 2017 National Council on Compensation Insurance, Inc. All Rights Reserved.
39
Exhibit 17

Exhibit 6-1Page 3 of 27
© Copyright 2017 National Council on Compensation Insurance, Inc. All Rights Reserved.
40
Exhibit 17

Exhibit 6-1Page 4 of 27
© Copyright 2017 National Council on Compensation Insurance, Inc. All Rights Reserved.
41
Exhibit 17

Continued …
Exhibit 6-1Page 5 of 27
© Copyright 2017 National Council on Compensation Insurance, Inc. All Rights Reserved.
42
Exhibit 17

Continued …
Continued …
Exhibit 6-1Page 6 of 27
© Copyright 2017 National Council on Compensation Insurance, Inc. All Rights Reserved.
43
Exhibit 17

Exhibit 6-1Page 7 of 27
© Copyright 2017 National Council on Compensation Insurance, Inc. All Rights Reserved.
44
Exhibit 17
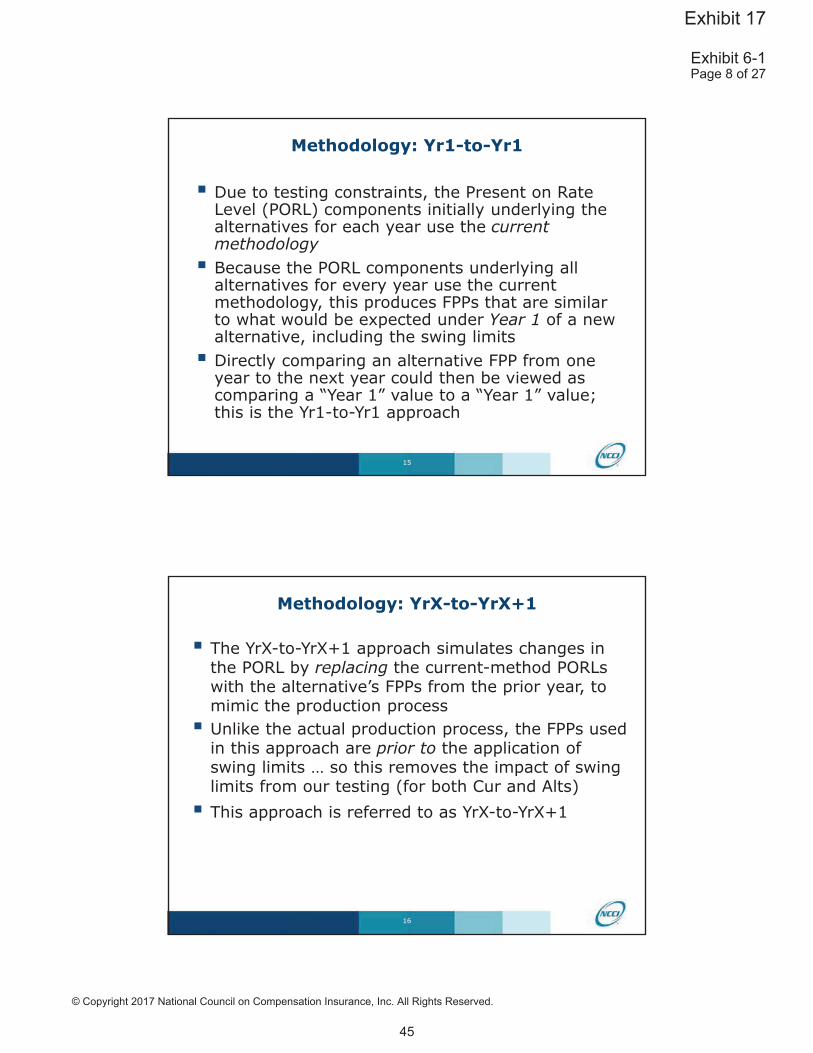
Exhibit 6-1Page 8 of 27
© Copyright 2017 National Council on Compensation Insurance, Inc. All Rights Reserved.
45
Exhibit 17

Exhibit 6-1Page 9 of 27
© Copyright 2017 National Council on Compensation Insurance, Inc. All Rights Reserved.
46
Exhibit 17

75th percentile
25th percentile
Median
Mean
75th percentile + 1.5 IQR
25th percentile 1.5 IQR(y axis caps value at 0%)
IQR = Interquartile Range
Exhibit 6-1Page 10 of 27
© Copyright 2017 National Council on Compensation Insurance, Inc. All Rights Reserved.
47
Exhibit 17

GPP7_2x
All of the Alts use an exponent of 0.5 and a multiple of the CurFS as labeled
NPP_2x
Exhibit 6-1Page 11 of 27
© Copyright 2017 National Council on Compensation Insurance, Inc. All Rights Reserved.
48
Exhibit 17

All of the Alts use anexponent of 0.5 anda multiple of theCurFS as labeled
Exhibit 6-1Page 12 of 27
© Copyright 2017 National Council on Compensation Insurance, Inc. All Rights Reserved.
49
Exhibit 17
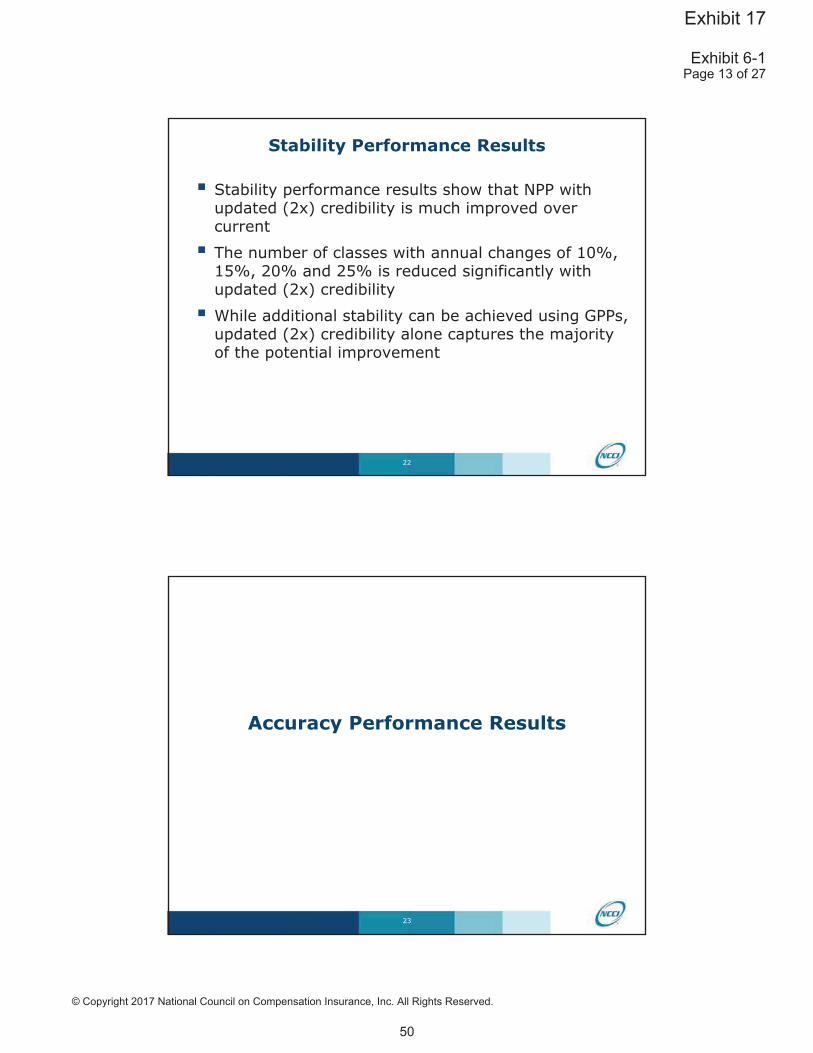
Exhibit 6-1Page 13 of 27
© Copyright 2017 National Council on Compensation Insurance, Inc. All Rights Reserved.
50
Exhibit 17

Exhibit 6-1Page 14 of 27
© Copyright 2017 National Council on Compensation Insurance, Inc. All Rights Reserved.
51
Exhibit 17

Group 1 Group 2 Total1 # of Classes 500 500 1,0002 Actual Loss 10,000,000 10,000,000 20,000,0003 Cur Loss Costs: Expected Loss 9,500,000 10,500,000 20,000,0004 Alt Loss Costs: Expected Loss 10,200,000 9,800,000 20,000,0005 Cur Loss Ratio = (2) / (3) 1.053 0.952 1.0006 Alt Loss Ratio = (2) / (4) 0.980 1.020 1.000
Exhibit 6-1Page 15 of 27
© Copyright 2017 National Council on Compensation Insurance, Inc. All Rights Reserved.
52
Exhibit 17

Group 1 Group 2 Absolute Avg Alt % Improvement*
%Di
ffere
nce
* (Cur abs avg diff) – (Alt abs avg diff)
Exhibit 6-1Page 16 of 27
© Copyright 2017 National Council on Compensation Insurance, Inc. All Rights Reserved.
53
Exhibit 17

Group 1 Group 2 Abs Avg Alt % Improvement
2012
2010
2011
%Di
ffere
nce
%Di
ffere
nce
%Di
ffere
nce
Exhibit 6-1Page 17 of 27
© Copyright 2017 National Council on Compensation Insurance, Inc. All Rights Reserved.
54
Exhibit 17

2010
2011
2012
Group 1 Group 2 Total1 # of State Classes 7,483 5,770 13,2532 Actual Losses $7,731,220,430 $9,743,716,161 $17,474,936,5913 Current FPPs: Expected Losses $7,609,319,770 $9,865,616,821 $17,474,936,5914 Proposed FPPs: Expected Losses $7,805,856,769 $9,669,079,822 $17,474,936,5915 Current Loss Ratio = (2)/(3) 1.016 0.988 1.0006 Proposed Loss Ratio = (2)/(4) 0.990 1.008 1.000
Group 1 Group 2 Total1 # of State Classes 7,416 5,901 13,3172 Actual Losses $7,304,633,086 $9,948,046,252 $17,252,679,3383 Current FPPs: Expected Losses $7,058,416,512 $10,194,262,826 $17,252,679,3384 Proposed FPPs: Expected Losses $7,291,588,521 $9,961,090,817 $17,252,679,3385 Current Loss Ratio = (2)/(3) 1.035 0.976 1.0006 Proposed Loss Ratio = (2)/(4) 1.002 0.999 1.000
Group 1 Group 2 Total1 # of State Classes 7,401 5,895 13,2962 Actual Losses $8,184,748,532 $9,138,176,619 $17,322,925,1513 Current FPPs: Expected Losses $7,964,239,076 $9,358,686,075 $17,322,925,1514 Proposed FPPs: Expected Losses $8,216,485,708 $9,106,439,443 $17,322,925,1515 Current Loss Ratio = (2)/(3) 1.028 0.976 1.0006 Proposed Loss Ratio = (2)/(4) 0.996 1.003 1.000
Exhibit 6-1Page 18 of 27
© Copyright 2017 National Council on Compensation Insurance, Inc. All Rights Reserved.
55
Exhibit 17

Alt % Improvement(Cur abs avg diff) – (Alt abs avg diff)
2010 2011 20121x 0.4% 0.9% 1.0%1.5x 0.8% 2.0% 2.2%2x 0.6% 2.8% 2.2%2.5x 0.5% 2.7% 2.8%3x 0.6% 2.4% 2.6%4x 0.7% 2.3% 1.8%GPP7_2x 3.2% 4.0% 4.3%
All of the Alts use an exponent of 0.5 and a multiple of the CurFS as labeled
Exhibit 6-1Page 19 of 27
© Copyright 2017 National Council on Compensation Insurance, Inc. All Rights Reserved.
56
Exhibit 17

Alt % Improvement(Cur abs avg diff) – (Alt abs avg diff)
* Small states were reviewed since they have a higher proportion of small classes
2010 2011 20121x 1.3% 0.9% 0.9%1.5x 2.7% 1.1% 0.2%2x 3.6% 1.1% 1.0%2.5x 3.5% 0.4% 0.4%3x 4.2% 0.8% 1.7%4x 5.2% 1.1% 3.2%GPP7_2x 1.9% 6.0% 1.6%
All of the Alts use an exponent of 0.5 and a multiple of the CurFS as labeled
Exhibit 6-1Page 20 of 27
© Copyright 2017 National Council on Compensation Insurance, Inc. All Rights Reserved.
57
Exhibit 17

Alt % Improvement(Cur abs avg diff) – (Alt abs avg diff)
Alt % Improvement(Cur abs avg diff) – (Alt abs avg diff)
400 850 LT claimsin the state class
850 1700 LT claimsin the state class
2010 2011 20121.5x 1.1% 1.2% 1.1%2x 1.9% 2.1% 2.0%2.5x 2.6% 2.8% 2.7%
2010 2011 20121.5x 0.5% 0.4% 0.1%2x 0.9% 0.9% 0.0%2.5x 1.2% 1.3% 0.1%
All of the Alts use an exponent of 0.5 and a multiple of the CurFS as labeled
Exhibit 6-1Page 21 of 27
© Copyright 2017 National Council on Compensation Insurance, Inc. All Rights Reserved.
58
Exhibit 17

Exhibit 6-1Page 22 of 27
© Copyright 2017 National Council on Compensation Insurance, Inc. All Rights Reserved.
59
Exhibit 17

Exhibit 6-1Page 23 of 27
© Copyright 2017 National Council on Compensation Insurance, Inc. All Rights Reserved.
60
Exhibit 17
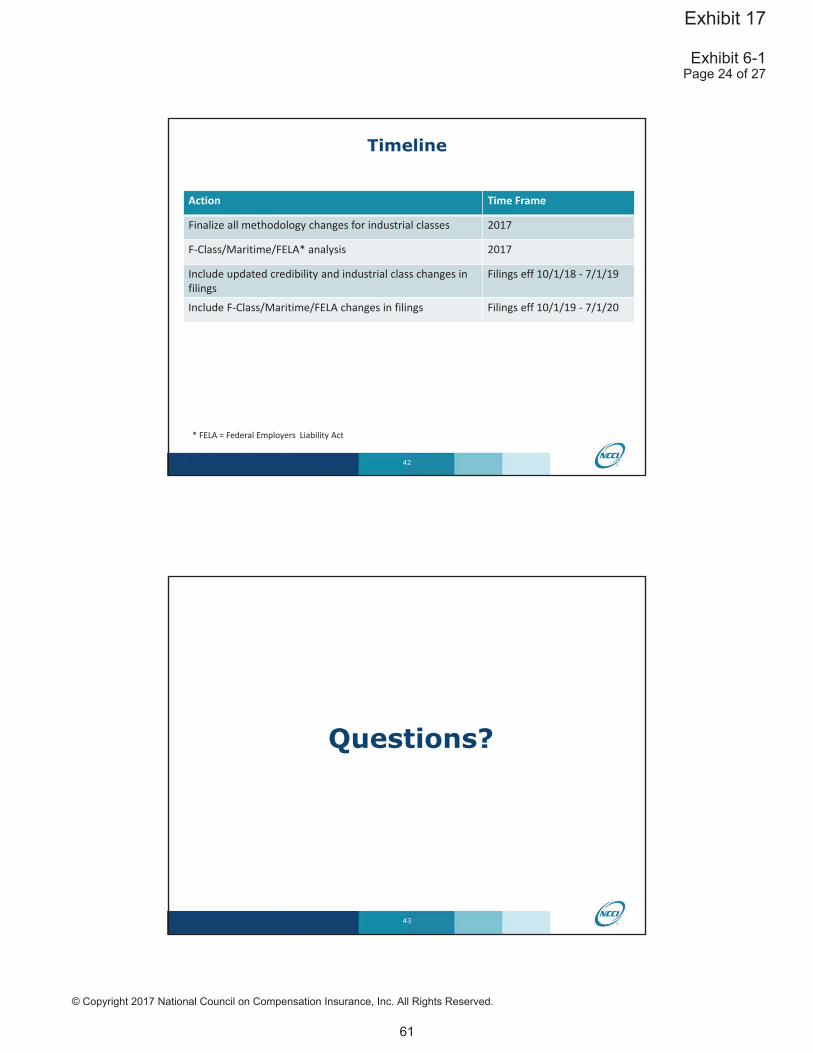
Action Time Frame
Finalize all methodology changes for industrial classes 2017
F Class/Maritime/FELA* analysis 2017
Include updated credibility and industrial class changes infilings
Filings eff 10/1/18 7/1/19
Include F Class/Maritime/FELA changes in filings Filings eff 10/1/19 7/1/20
* FELA = Federal Employers Liability Act
Exhibit 6-1Page 24 of 27
© Copyright 2017 National Council on Compensation Insurance, Inc. All Rights Reserved.
61
Exhibit 17

Exhibit 6-1Page 25 of 27
© Copyright 2017 National Council on Compensation Insurance, Inc. All Rights Reserved.
62
Exhibit 17
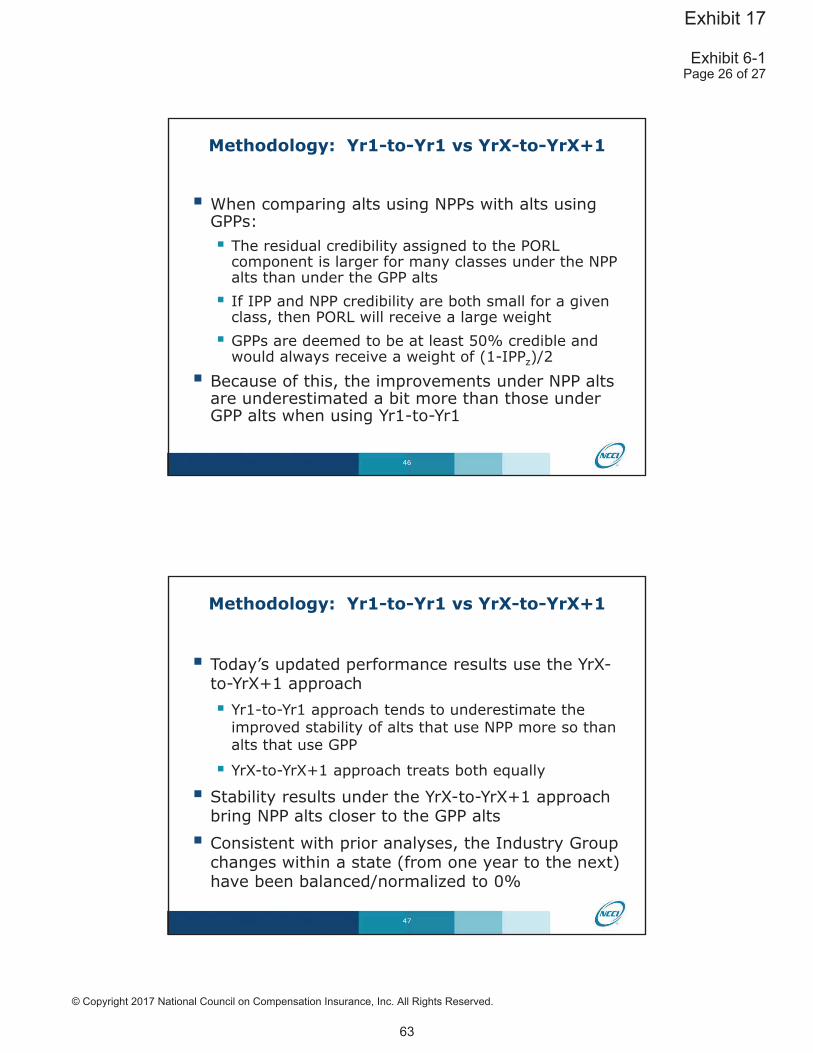
Exhibit 6-1Page 26 of 27
© Copyright 2017 National Council on Compensation Insurance, Inc. All Rights Reserved.
63
Exhibit 17
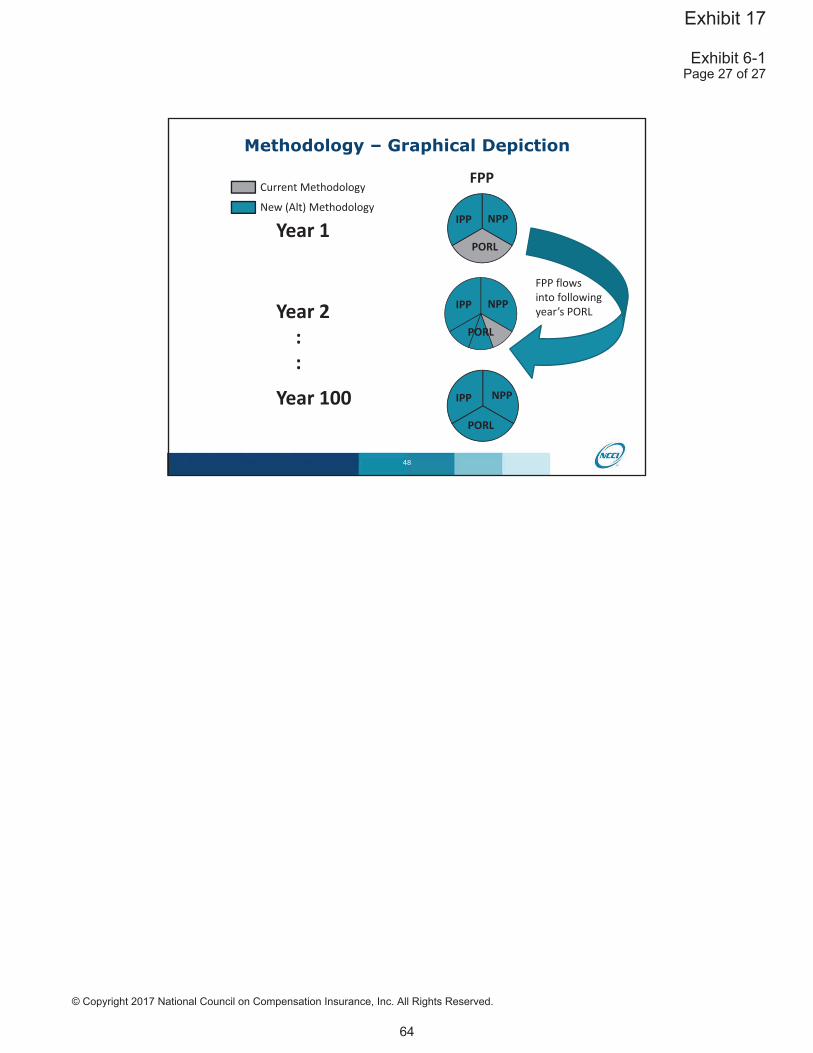
Year 1
Year 2::
Year 100
IPP NPP
PORL
FPP
New (Alt) Methodology
Current Methodology
IPP NPP
PORL
IPP NPP
PORL
FPP flowsinto followingyear’s PORL
Exhibit 6-1Page 27 of 27
© Copyright 2017 National Council on Compensation Insurance, Inc. All Rights Reserved.
64
Exhibit 17

Class Ratemaking Research:Final Wrap Up
Agenda
2
Background
What’s Changing
Considered/Reviewed but Not Changing
Federal Classes
Summary
Committee members and meeting participants are prohibited from discussing any matter pertainingspecifically and directly to rates or loss costs in any particular state or states.
Exhibit 11-1Page 1 of 6
© Copyright 2018 National Council on Compensation Insurance, Inc. All Rights Reserved.
Exhibit 17

3
Background
As reported at Actuarial Committee (AC) meetings over the pastthree years, staff has engaged in an extensive review of classratemaking, with particular emphasis on credibility and smallclasses
The research portion of this project has been completed
This presentation will provide a high level wrap up
4
Class Ratemaking Changes
Exhibit 11-1Page 2 of 6
© Copyright 2018 National Council on Compensation Insurance, Inc. All Rights Reserved.
Exhibit 17

5
What’s Changing
Credibility formulas for Indicated Pure Premiums (IPPs) andNational Pure Premiums (NPPs) will be updated with thefollowing parameters:
Exponent of 0.5Double today’s Full Standards
These changes are planned for the upcoming rate filing cycle
See Feb 2017 AC Agenda for more on this decision
6
Considered and Reviewed But Not Changing
Exhibit 11-1Page 3 of 6
© Copyright 2018 National Council on Compensation Insurance, Inc. All Rights Reserved.
Exhibit 17

7
Reviewed But Not Changing
Major items that were considered and reviewed but will not beincorporated:
Basing credibility on indemnity and medical combined ratherthan separately
See Feb 2017 AC Agenda
Changing the number of policy periods used for IPP and NPPSee Oct 2015 AC Agenda
Implementing new pure premium components: frequencyestimators, severity estimators and Group Pure Premiums(GPPs)
See Feb 2017 AC Agenda
8
Reviewed But Not Changing
Major items that were considered and reviewed but will not beincorporated:
Reseeding the smallest classesNCCI underwriting staff plans to eliminate/revise the classes wewere considering for reseeding
Eliminating Industry Group differentialsSee AC Agenda for this meeting (Feb 2018)
Continued …
Exhibit 11-1Page 4 of 6
© Copyright 2018 National Council on Compensation Insurance, Inc. All Rights Reserved.
Exhibit 17

9
Federal Classes
10
Federal Classes
Federal classes consist of the USL&HW (F Classes), Maritimeand FELA classes*These classes will benefit from the upcoming changes tocredibilityA separate project will determine whether any additionalchanges would be beneficial
* USL&HW: United States Longshore and Harbor Workers ActFELA: Federal Employers Liability Act
Exhibit 11-1Page 5 of 6
© Copyright 2018 National Council on Compensation Insurance, Inc. All Rights Reserved.
Exhibit 17

11
Summary
Summary
Credibility formulas for Indicated Pure Premiums (IPPs) andNational Pure Premiums (NPPs) will be updated with thefollowing parameters:
Exponent of 0.5Double today’s Full Standards
These changes are planned for the upcoming rate filing cycle
NCCI underwriting will be eliminating/revising approximatelytwo dozen class codes as a result of our research
Federal classes will be reviewed as part of a separate project
12
Exhibit 11-1Page 6 of 6
© Copyright 2018 National Council on Compensation Insurance, Inc. All Rights Reserved.
Exhibit 17

MissouriIndemnity Limited Statewide Paid Loss Development through @12/19
PY 1/2 2/3 3/4 4/5 5/6 6/7 7/8 8/9 9/101991199219931994199519961997199819992000 1.0082001 1.010 1.0102002 1.028 1.018 1.0082003 1.034 1.023 1.016 1.0162004 1.050 1.032 1.021 1.020 1.0142005 1.081 1.046 1.036 1.022 1.012 1.0142006 1.117 1.068 1.040 1.032 1.026 1.016 1.0092007 1.271 1.125 1.077 1.054 1.036 1.018 1.016 1.0212008 1.793 1.248 1.159 1.092 1.047 1.041 1.019 1.020 1.0202009 1.799 1.292 1.141 1.091 1.059 1.026 1.023 1.017 1.0122010 1.872 1.289 1.152 1.092 1.051 1.033 1.020 1.0162011 1.789 1.295 1.161 1.092 1.060 1.045 1.0242012 1.801 1.308 1.155 1.087 1.052 1.0312013 1.747 1.328 1.182 1.073 1.0402014 1.869 1.268 1.117 1.0742015 1.806 1.282 1.1442016 1.781 1.2912017 1.812
© Copyright 2020 National Council on Compensation Insurance Inc. All Rights Reserved.
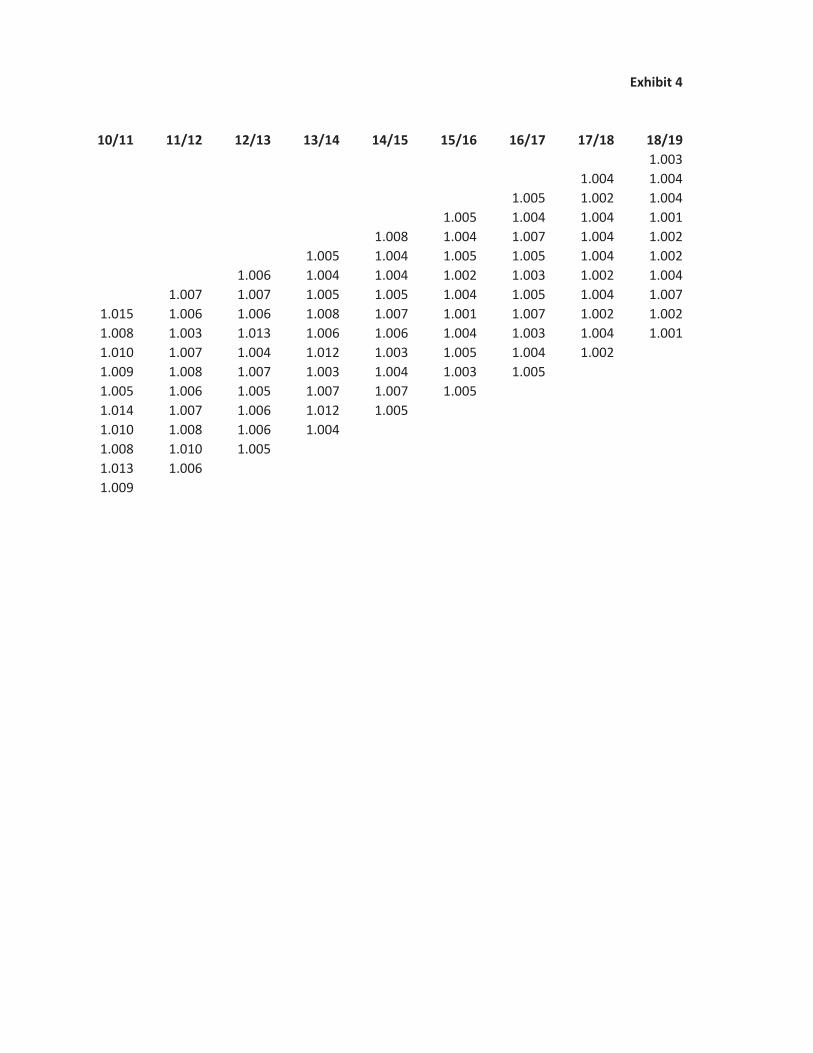
Exhibit 4
10/11 11/12 12/13 13/14 14/15 15/16 16/17 17/18 18/191.003
1.004 1.0041.005 1.002 1.004
1.005 1.004 1.004 1.0011.008 1.004 1.007 1.004 1.002
1.005 1.004 1.005 1.005 1.004 1.0021.006 1.004 1.004 1.002 1.003 1.002 1.004
1.007 1.007 1.005 1.005 1.004 1.005 1.004 1.0071.015 1.006 1.006 1.008 1.007 1.001 1.007 1.002 1.0021.008 1.003 1.013 1.006 1.006 1.004 1.003 1.004 1.0011.010 1.007 1.004 1.012 1.003 1.005 1.004 1.0021.009 1.008 1.007 1.003 1.004 1.003 1.0051.005 1.006 1.005 1.007 1.007 1.0051.014 1.007 1.006 1.012 1.0051.010 1.008 1.006 1.0041.008 1.010 1.0051.013 1.0061.009

MissouriIndemnity Limited Statewide Paid+Case Loss Development through @12/19
PY 1/2 2/3 3/4 4/5 5/6 6/7 7/8 8/9 9/101991199219931994199519961997199819992000 0.9982001 1.002 1.0072002 1.004 1.005 1.0052003 1.016 1.005 1.005 1.0072004 1.014 0.996 1.001 1.001 1.0082005 1.016 1.017 1.005 1.005 0.999 1.0062006 1.027 1.013 1.017 1.004 1.009 1.002 1.0022007 1.045 1.024 1.009 1.021 1.001 1.007 1.014 1.0122008 1.116 1.041 1.055 1.029 1.028 1.013 1.009 1.008 1.0022009 1.119 1.063 1.028 1.041 1.005 1.002 1.014 1.001 1.0042010 1.125 1.059 1.043 1.029 1.015 1.014 1.005 1.0002011 1.095 1.051 1.072 1.033 1.017 1.003 1.0032012 1.136 1.078 1.038 1.019 1.008 1.0092013 1.128 1.089 1.074 1.040 1.0022014 1.135 1.054 1.021 1.0282015 1.123 1.063 1.0332016 1.140 1.0622017 1.127
© Copyright 2020 National Council on Compensation Insurance Inc. All Rights Reserved.

Exhibit 4
10/11 11/12 12/13 13/14 14/15 15/16 16/17 17/18 18/191.002
1.002 1.0021.001 1.002 1.003
1.001 1.000 1.000 1.0010.998 1.000 1.000 1.000 1.001
0.996 1.000 1.001 1.001 1.001 1.0021.001 0.999 0.999 0.998 0.998 1.004 1.003
1.002 1.005 1.001 1.006 0.999 1.003 1.003 1.0001.001 0.999 1.002 1.003 0.999 1.001 1.001 1.001 1.0031.003 1.003 1.004 1.001 1.001 1.000 1.000 0.996 1.0020.997 1.004 1.001 1.002 0.999 1.002 1.000 0.9981.002 0.995 0.999 1.003 0.999 1.002 1.0021.000 1.000 1.008 0.998 1.004 1.0011.002 1.000 1.011 1.006 1.0020.998 1.004 1.004 1.0021.001 0.998 1.0021.002 1.0021.003
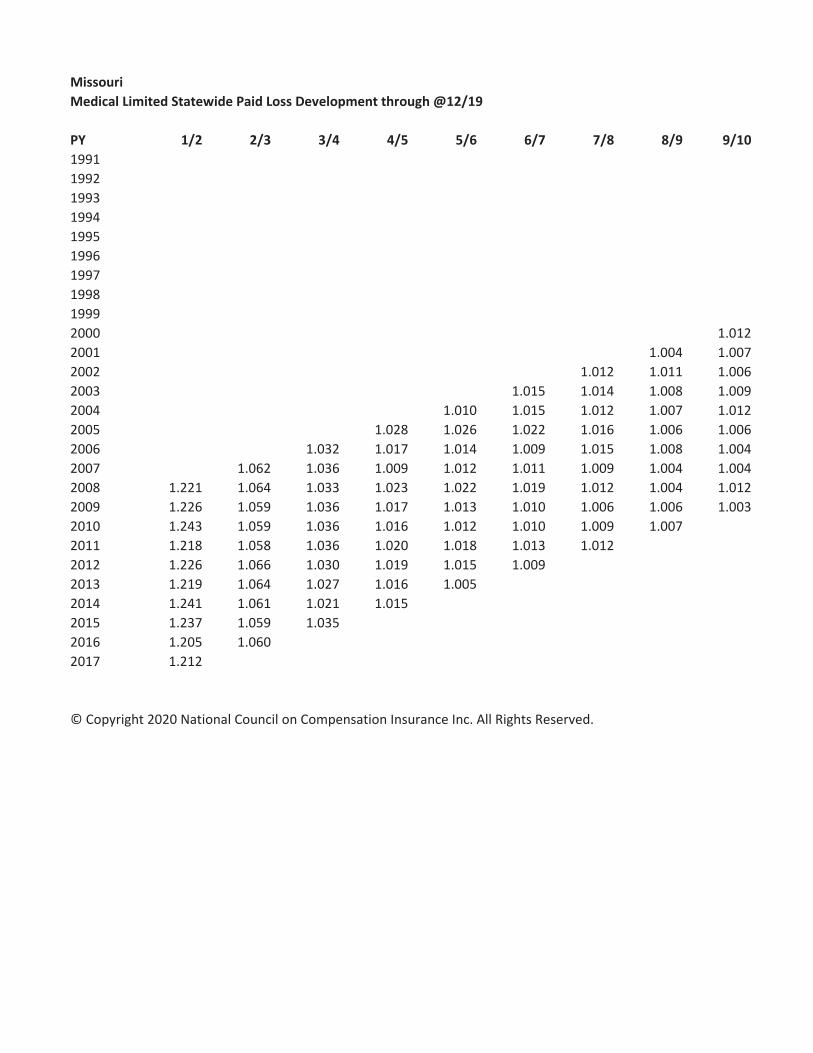
MissouriMedical Limited Statewide Paid Loss Development through @12/19
PY 1/2 2/3 3/4 4/5 5/6 6/7 7/8 8/9 9/101991199219931994199519961997199819992000 1.0122001 1.004 1.0072002 1.012 1.011 1.0062003 1.015 1.014 1.008 1.0092004 1.010 1.015 1.012 1.007 1.0122005 1.028 1.026 1.022 1.016 1.006 1.0062006 1.032 1.017 1.014 1.009 1.015 1.008 1.0042007 1.062 1.036 1.009 1.012 1.011 1.009 1.004 1.0042008 1.221 1.064 1.033 1.023 1.022 1.019 1.012 1.004 1.0122009 1.226 1.059 1.036 1.017 1.013 1.010 1.006 1.006 1.0032010 1.243 1.059 1.036 1.016 1.012 1.010 1.009 1.0072011 1.218 1.058 1.036 1.020 1.018 1.013 1.0122012 1.226 1.066 1.030 1.019 1.015 1.0092013 1.219 1.064 1.027 1.016 1.0052014 1.241 1.061 1.021 1.0152015 1.237 1.059 1.0352016 1.205 1.0602017 1.212
© Copyright 2020 National Council on Compensation Insurance Inc. All Rights Reserved.

Exhibit 4
10/11 11/12 12/13 13/14 14/15 15/16 16/17 17/18 18/191.002
1.002 1.0011.003 1.004 1.003
1.004 1.008 1.004 1.0041.005 1.005 1.003 1.004 1.003
1.006 1.004 1.000 1.001 1.003 1.0011.007 1.005 1.006 1.004 1.006 1.005 1.011
1.011 1.012 1.009 1.003 1.003 1.001 1.001 1.0021.007 1.008 1.007 1.010 1.006 1.002 1.009 1.001 1.0011.006 1.007 1.007 1.004 1.017 1.001 1.002 1.003 1.0011.009 1.007 1.004 1.003 1.004 1.005 1.003 1.0031.007 1.005 1.005 1.007 1.004 1.003 1.0111.005 1.005 1.004 1.002 1.004 1.0021.009 1.004 1.004 1.004 1.0061.005 1.004 1.005 1.0041.003 1.005 1.0031.005 1.0031.005

MissouriMedical Limited Statewide Paid+Case Loss Development through @12/19
PY 1/2 2/3 3/4 4/5 5/6 6/7 7/8 8/9 9/101991199219931994199519961997199819992000 1.0112001 1.009 1.0012002 1.002 1.001 1.0082003 1.009 1.000 0.999 0.9952004 0.995 1.005 1.001 1.035 1.0052005 1.008 0.989 1.002 1.004 1.001 1.0232006 0.996 0.997 1.002 0.985 1.006 0.998 1.0012007 1.010 1.001 1.000 0.997 0.998 1.003 1.004 1.0022008 1.071 1.025 1.010 0.983 1.010 1.007 0.996 1.007 0.9902009 1.043 1.013 0.999 1.003 0.998 1.007 1.007 0.996 0.9972010 1.050 1.002 0.994 0.993 1.010 1.001 0.997 0.9982011 1.022 0.998 0.972 0.993 1.024 0.992 1.0062012 1.031 1.005 1.004 0.998 0.986 0.9952013 1.013 0.993 1.000 1.000 0.9812014 1.034 0.993 0.992 1.0082015 1.035 1.006 1.0072016 1.007 0.9662017 1.025
© Copyright 2020 National Council on Compensation Insurance Inc. All Rights Reserved.

Exhibit 4
10/11 11/12 12/13 13/14 14/15 15/16 16/17 17/18 18/190.997
1.003 1.0021.001 1.002 1.002
0.996 1.001 0.996 1.0061.001 1.004 1.003 0.998 1.001
0.999 0.991 1.004 1.008 1.001 1.0021.002 0.993 1.002 0.990 0.999 1.013 0.990
1.014 1.009 1.004 0.989 1.008 1.004 1.000 1.0001.000 1.002 1.000 1.005 1.002 1.000 1.004 0.999 0.9991.003 1.011 1.005 1.003 0.990 0.997 1.000 1.001 1.0031.017 1.007 1.002 0.999 1.003 0.993 1.000 0.9961.002 0.999 1.005 1.003 1.003 1.001 1.0021.004 0.993 1.004 0.999 1.009 1.0010.997 1.001 1.005 0.994 0.9980.997 1.010 1.002 1.0001.006 1.001 1.0030.996 1.0010.985

MissouriStatewide Unlimited DCCE Paid Development through @12/19
PY 1/2 2/3 3/4 4/5 5/6 6/7 7/8 8/919941995199619971998199920002001 1.0092002 1.018 1.0082003 1.028 1.016 1.0152004 1.038 1.022 1.020 1.0112005 1.072 1.038 1.027 1.014 1.0092006 1.086 1.054 1.034 1.018 1.011 1.0112007 1.195 1.095 1.058 1.038 1.022 1.013 1.0112008 1.462 1.191 1.114 1.050 1.032 1.023 1.015 1.0102009 1.493 1.190 1.085 1.048 1.031 1.018 1.012 1.0082010 1.508 1.181 1.090 1.049 1.026 1.016 1.010 1.0072011 1.476 1.164 1.108 1.047 1.034 1.019 1.0122012 1.476 1.175 1.071 1.051 1.025 1.0132013 1.477 1.152 1.084 1.042 1.0222014 1.452 1.158 1.077 1.0392015 1.475 1.172 1.0762016 1.479 1.1612017 1.470
© Copyright 2020 National Council on Compensation Insurance Inc. All Rights Reserved.

9/10 10/11 11/12 12/13 13/14 14/15 15/16 16/17 17/181.002 1.003 1.003
1.003 1.005 1.002 1.0011.004 1.007 1.001 1.001 1.002
1.007 1.003 1.004 1.002 1.003 1.0021.005 1.006 1.004 1.005 1.003 1.003 1.001
1.008 1.011 1.011 1.004 1.005 1.002 1.004 1.0021.009 1.007 1.010 1.007 1.004 1.005 1.001 1.001 1.0021.012 1.008 1.005 1.002 1.002 1.004 1.005 0.999 1.0021.015 1.008 1.006 1.004 1.003 1.002 1.004 1.0021.009 1.005 1.005 1.004 1.002 1.003 1.0021.008 1.009 1.005 1.003 1.003 1.0031.008 1.006 1.005 1.004 1.0041.006 1.006 1.005 1.0031.012 1.005 1.0061.008 1.0071.002

Exhibit 4
18/191.0071.0011.0021.0021.0021.0011.002

MISSOURI Exhibit 6Statewide - Private Carrier + State FundDerivation of the Factor to Adjust Losses for Prior Policy Years for Valuation Year 2019
Indemnity Paid+Case Data(1) (2) (3) (4)=(3)/(2) (5) (6)
Policy Older Year's Indemnity Newer Year's Indemnity Growth Inverse Upward Cum.
Years Paid + Case Losses Paid + Case Losses Ratio 1 / (4) Product of (5)
1986/1985 PY 1985@2004 140,568,476 PY 1986@2005 157,871,301 1.123 0.890 0.7171987/1986 PY 1986@2005 157,871,301 PY 1987@2006 179,756,406 1.139 0.878 0.8051988/1987 PY 1987@2006 177,454,320 PY 1988@2007 198,950,113 1.121 0.892 0.9161989/1988 PY 1988@2007 198,505,376 PY 1989@2008 220,882,644 1.113 0.899 1.0271990/1989 PY 1989@2008 219,039,126 PY 1990@2009 232,456,428 1.061 0.942 1.1431991/1990 PY 1990@2009 227,189,268 PY 1991@2010 225,498,511 0.993 1.007 1.2131992/1991 PY 1991@2010 225,498,511 PY 1992@2011 200,835,736 0.891 1.123 1.2041993/1992 PY 1992@2011 200,811,854 PY 1993@2012 183,496,440 0.914 1.094 1.0721994/1993 PY 1993@2012 183,545,036 PY 1994@2013 165,007,399 0.899 1.112 0.9801995/1994 PY 1994@2013 163,997,293 PY 1995@2014 141,633,259 0.864 1.158 0.8811996/1995 PY 1995@2014 141,608,646 PY 1996@2015 148,254,038 1.047 0.955 0.7611997/1996 PY 1996@2015 148,247,760 PY 1997@2016 154,914,525 1.045 0.957 0.7961998/1997 PY 1997@2016 154,914,525 PY 1998@2017 182,906,839 1.181 0.847 0.8321999/1998 PY 1998@2017 192,061,279 PY 1999@2018 195,440,205 1.018 0.983 0.983
Factor to Adjust Losses for Prior Years—10-Year Average 0.987
Medical Paid+Case Data(1) (2) (3) (4)=(3)/(2) (5) (6)
Policy Older Year's Medical Newer Year's Medical Growth Inverse Upward Cum.
Years Paid + Case Losses Paid + Case Losses Ratio 1 / (4) Product of (5)
1986/1985 PY 1985@2004 94,696,424 PY 1986@2005 108,101,402 1.142 0.876 0.5371987/1986 PY 1986@2005 108,101,402 PY 1987@2006 140,700,501 1.302 0.768 0.6131988/1987 PY 1987@2006 139,423,344 PY 1988@2007 152,395,769 1.093 0.915 0.7981989/1988 PY 1988@2007 152,292,010 PY 1989@2008 169,069,844 1.110 0.901 0.8721990/1989 PY 1989@2008 167,794,520 PY 1990@2009 186,527,540 1.112 0.900 0.9681991/1990 PY 1990@2009 182,662,813 PY 1991@2010 191,692,398 1.049 0.953 1.0761992/1991 PY 1991@2010 191,692,398 PY 1992@2011 166,012,660 0.866 1.155 1.1291993/1992 PY 1992@2011 166,008,493 PY 1993@2012 170,212,510 1.025 0.975 0.9781994/1993 PY 1993@2012 170,220,623 PY 1994@2013 152,705,754 0.897 1.115 1.0031995/1994 PY 1994@2013 151,577,681 PY 1995@2014 134,631,701 0.888 1.126 0.9001996/1995 PY 1995@2014 134,623,547 PY 1996@2015 128,910,066 0.958 1.044 0.7991997/1996 PY 1996@2015 128,897,172 PY 1997@2016 153,272,672 1.189 0.841 0.7651998/1997 PY 1997@2016 153,272,672 PY 1998@2017 156,640,785 1.022 0.978 0.9101999/1998 PY 1998@2017 164,679,784 PY 1999@2018 177,106,284 1.075 0.930 0.930
Factor to Adjust Losses for Prior Years—10-Year Average 0.946
© Copyright 2020 National Council on Compensation Insurance Inc. All Rights Reserved.

MISSOURI Exhibit 6Statewide - Private Carrier + State FundDerivation of the Factor to Adjust Losses for Prior Policy Years for Valuation Year 2018
Indemnity Paid+Case Data(1) (2) (3) (4)=(3)/(2) (5) (6)
Policy Older Year's Indemnity Newer Year's Indemnity Growth Inverse Upward Cum.
Years Paid + Case Losses Paid + Case Losses Ratio 1 / (4) Product of (5)
1985/1984 PY 1984@2003 117,747,967 PY 1985@2004 141,498,461 1.202 0.832 0.6071986/1985 PY 1985@2004 140,568,476 PY 1986@2005 157,871,301 1.123 0.890 0.7291987/1986 PY 1986@2005 157,871,301 PY 1987@2006 179,756,406 1.139 0.878 0.8191988/1987 PY 1987@2006 177,454,320 PY 1988@2007 198,950,113 1.121 0.892 0.9321989/1988 PY 1988@2007 198,505,376 PY 1989@2008 220,882,644 1.113 0.899 1.0451990/1989 PY 1989@2008 219,039,126 PY 1990@2009 232,456,428 1.061 0.942 1.1631991/1990 PY 1990@2009 227,189,268 PY 1991@2010 225,498,511 0.993 1.007 1.2341992/1991 PY 1991@2010 225,498,511 PY 1992@2011 200,835,736 0.891 1.123 1.2251993/1992 PY 1992@2011 200,811,854 PY 1993@2012 183,496,440 0.914 1.094 1.0911994/1993 PY 1993@2012 183,545,036 PY 1994@2013 165,007,399 0.899 1.112 0.9971995/1994 PY 1994@2013 163,997,293 PY 1995@2014 141,633,259 0.864 1.158 0.8961996/1995 PY 1995@2014 141,608,646 PY 1996@2015 148,254,038 1.047 0.955 0.7741997/1996 PY 1996@2015 148,247,760 PY 1997@2016 154,914,525 1.045 0.957 0.8111998/1997 PY 1997@2016 154,914,525 PY 1998@2017 182,906,839 1.181 0.847 0.847
Factor to Adjust Losses for Prior Years—10-Year Average 1.008
Medical Paid+Case Data(1) (2) (3) (4)=(3)/(2) (5) (6)
Policy Older Year's Medical Newer Year's Medical Growth Inverse Upward Cum.
Years Paid + Case Losses Paid + Case Losses Ratio 1 / (4) Product of (5)
1985/1984 PY 1984@2003 77,605,188 PY 1985@2004 95,327,411 1.228 0.814 0.4701986/1985 PY 1985@2004 94,696,424 PY 1986@2005 108,101,402 1.142 0.876 0.5771987/1986 PY 1986@2005 108,101,402 PY 1987@2006 140,700,501 1.302 0.768 0.6591988/1987 PY 1987@2006 139,423,344 PY 1988@2007 152,395,769 1.093 0.915 0.8581989/1988 PY 1988@2007 152,292,010 PY 1989@2008 169,069,844 1.110 0.901 0.9381990/1989 PY 1989@2008 167,794,520 PY 1990@2009 186,527,540 1.112 0.900 1.0411991/1990 PY 1990@2009 182,662,813 PY 1991@2010 191,692,398 1.049 0.953 1.1571992/1991 PY 1991@2010 191,692,398 PY 1992@2011 166,012,660 0.866 1.155 1.2151993/1992 PY 1992@2011 166,008,493 PY 1993@2012 170,212,510 1.025 0.975 1.0521994/1993 PY 1993@2012 170,220,623 PY 1994@2013 152,705,754 0.897 1.115 1.0781995/1994 PY 1994@2013 151,577,681 PY 1995@2014 134,631,701 0.888 1.126 0.9681996/1995 PY 1995@2014 134,623,547 PY 1996@2015 128,910,066 0.958 1.044 0.8591997/1996 PY 1996@2015 128,897,172 PY 1997@2016 153,272,672 1.189 0.841 0.8231998/1997 PY 1997@2016 153,272,672 PY 1998@2017 156,640,785 1.022 0.978 0.978
Factor to Adjust Losses for Prior Years—10-Year Average 1.011
© Copyright 2020 National Council on Compensation Insurance Inc. All Rights Reserved.
© Copyright 2020 National Council on Compensation Insurance Inc. All Rights Reserved.
ACCESS AND USE OF THESE NCCI MATERIALS ARE GOVERNED BY A LEGAL AGREEMENT BETWEEN NCCI AND THE END USER. YOU MAY NOT USE THESE MATERIALS UNLESS YOU HAVE ENTERED INTO AN AGREEMENT WITH NCCI. THESE MATERIALS ARE BEING PROVIDED FOR YOUR INTERNAL USE ONLY. NCCI DOES NOT HAVE ANY CONTROL OVER THE CONDITIONS UNDER WHICH YOU MAY USE THEM. THEREFORE, NCCI CANNOT AND DOES NOT WARRANT THE RESULTS OR CONCLUSIONS THAT MAY BE DERIVED OR OBTAINED BY YOU THROUGH YOUR LICENSED USE OF THESE MATERIALS OR YOUR ABILITY OR INABILITY TO USE THEM. NCCI EXPRESSLY DISCLAIMS ALL WARRANTIES OF ANY KIND INCLUDING ANY AND ALL EXPRESS, STATUTORY AND THE IMPLIED WARRANTIES OF MERCHANTABILITY AND FITNESS FOR A PARTICULAR PURPOSE WITH THE MATERIALS BEING PROVIDED ON AN “AS IS” BASIS.

Supplemental Loss Development and Trend InformationMissouri January 1, 2021 Filing
Introduction
Supplemental Loss Development and Trend Information provides the data underlying the frequency and severity trend graphs shown in the filing document. The data included (i.e., policy year or accident year, limited or unlimited, etc.) is consistent with the data used in the filing and can vary by state. All of the data shown is as of the latest valuation date, December 31, 2019.
The development and on-level factors shown in the Supplemental Loss Development and Trend Information exhibit can be found in the filing. The frequency and severity values provided have been adjusted to the current wage level.
Note: The information shown in the Supplemental Loss Development and Trend Information exhibit is provided for informational purposes only. NCCI makes no warranty that any of the loss development factors, on-level factors, wage adjustment factors or any other information provided is suitable for application to an individual carrier's data.
© Copyright 2020 National Council on Compensation Insurance, Inc. All Rights Reserved.

Supplemental Loss Development and Trend InformationMissouri January 1, 2021 Filing
Definitions
Accident Year (AY)—A loss accounting definition in which experience is summarized by the calendar year in which an accident occurred.
Calendar Year (CY)1. The 12-month period beginning January 1 and ending December 31.2. Method of accounting for all financial transactions occurring during a specific year.
Case Reserves—Reserves that an insurance company establishes for specific (known) claims.
DSR Premium (commonly referred to as DSR Level Premium)—The standard earned premium that would result if business were written at a common benchmark level known as the designated statistical reporting level (e.g., NCCI state-approved loss costs or rates).
Frequency—The number of workplace injuries resulting in lost-time claims per million dollars of on-leveled, wage-adjusted premium.
Incurred Claim Count—The total of all claims reported, whether open or closed, as of a given valuation date. An indemnity claim is associated with a payment or case reserve for an indemnity loss (i.e., lost work time-related benefits) and excludes claims closed without an indemnity payment.
Limited Losses—Losses that result after the application of NCCI's large loss procedure (in which individual large claims are limited to state- and year-specific large loss thresholds).
On-Level Factor—Applied to historical policy and accident year premiums and losses to adjust the historical experience to reflect approved loss cost and rate level changes as well as statutory benefit level changes implemented since that time period.
Paid+Case Losses—The sum of paid losses and case reserves. Also known as case-incurred losses.
Paid Losses—Losses that an insurance company has paid as a result of claim activity.

Policy Year1. The one-year period beginning with the effective date or anniversary of a policy.2. A premium and loss accounting definition in which experience is summarized for all policies with effective dates in a given calendar year period.
Severity—The average indemnity or medical cost per lost-time claim.
Ultimate Development Factor—For an aggregation of data, an estimate of the development that will occur between the data's current valuation date and the time period when all claims are closed. For example, an ultimate loss development factor applied to Policy Year 2000 reported losses represents an estimate of the Policy Year 2000 ultimate losses.
Unlimited Losses—Losses that have not been adjusted to reflect NCCI's large loss procedure (see Limited Losses).
Valuation Date—The date that premiums and losses are valued for reporting purposes. Premiums and losses change over time from initial estimates to final values (other than calendar year statistics). Therefore, interim snapshots have associated valuation dates.
Wage Level Adjustment Factor—Ratio of the average workers’ wage during the most recent policy or accident year period to the average workers’ wage during a historical time period.
© Copyright 2020 National Council on Compensation Insurance, Inc. All Rights Reserved.

Supplemental Loss Development and Trend InformationMissouri January 1, 2021 Filing
Limited–Statewide–Private Carrier + State Fund–Policy Year
Lost-Time Claim Frequency and Severity–Based on Data in Excess of Wage Inflation(1) (2) (3) (4) (5) (6) (7) (8) (9) (10) (11)
Claim Freq Indemnity Severity Medical Severity Annual Percentage Change
Policy Year
Per MillionOn-level
Premium Paid Paid + Case
Average Pd/P+C Paid
Paid + Case
Average Pd/P+C
Claim Frequency
Indemnity Severity
(Avg Pd/P+C)
Medical Severity
(Avg Pd/P+C)2004 29.815 21,227 21,826 21,527 23,466 24,016 23,7412005 26.260 20,827 20,973 20,900 25,235 26,257 25,746 11.9% 2.9% 8.4%2006 24.816 20,407 20,445 20,426 26,018 25,986 26,002 5.5% 2.3% 1.0%2007 25.019 21,376 21,653 21,514 26,075 25,998 26,036 0.8% 5.3% 0.1%2008 23.158 22,219 22,535 22,377 28,588 29,475 29,032 7.4% 4.0% 11.5%2009 21.750 22,302 21,966 22,134 28,184 27,759 27,972 6.1% 1.1% 3.7%2010 23.023 22,466 22,293 22,379 30,247 29,935 30,091 5.9% 1.1% 7.6%2011 21.892 23,825 23,206 23,515 31,077 31,060 31,069 4.9% 5.1% 3.3%2012 21.137 23,067 22,372 22,719 30,292 30,295 30,293 3.4% 3.4% 2.5%2013 20.648 24,025 23,628 23,826 29,751 29,175 29,463 2.3% 4.9% 2.7%2014 20.044 23,545 23,197 23,371 30,009 29,406 29,707 2.9% 1.9% 0.8%2015 19.281 23,393 23,109 23,251 31,304 31,857 31,581 3.8% 0.5% 6.3%2016 18.382 23,916 23,560 23,738 31,726 30,943 31,334 4.7% 2.1% 0.8%2017 18.104 23,399 22,988 23,194 33,830 34,161 33,995 1.5% 2.3% 8.5%2018 18.040 24,099 24,596 24,348 34,082 33,858 33,970 0.4% 5.0% 0.1%
Notes: (2) = (15) / [(22) / 1,000,000] (6) = (39) / (15) (9) is based on (2)(3) = (27) / (15) (7) = (43) / (15) (10) is based on (5)(4) = (31) / (15) (8) = (45) / (15) (11) is based on (8)(5) = (33) / (15)
Claim Counts Premium(12) (13) (14) (15) (16) (17) (18) (19) (20) (21) (22)
Policy Year
Incurred Lost-Time
Claim Count
Ultimate Development
Factor
Ultimate Incurred Lost-
Time Claim Count
Policy Year
DSR Level
Premium
Ultimate Development
FactorUltimate
PremiumOn-level
Factor
Factor to Adjust to 2018
Wage Levels
Wage-Adj On-level
Ult. Prem2004 13,356 1.000 13,356 2004 571,375,826 1.000 571,375,826 0.553 1.417 447,958,6482005 12,195 1.000 12,195 2005 602,321,720 1.000 602,321,720 0.562 1.372 464,390,0462006 12,027 1.000 12,027 2006 637,695,551 1.000 637,695,551 0.574 1.324 484,648,6192007 12,704 1.000 12,704 2007 692,743,226 1.000 692,743,226 0.578 1.269 507,780,7852008 11,076 1.000 11,076 2008 602,365,485 1.000 602,365,485 0.639 1.242 478,278,1952009 10,048 1.000 10,048 2009 541,602,630 1.000 541,602,630 0.686 1.243 461,987,0432010 10,922 1.000 10,922 2010 558,777,683 1.000 558,777,683 0.695 1.221 474,402,2532011 10,342 1.000 10,342 2011 546,775,878 1.000 546,775,878 0.726 1.190 472,414,3592012 9,799 1.000 9,799 2012 522,666,691 1.000 522,666,691 0.762 1.164 463,605,3552013 9,626 1.000 9,626 2013 540,208,766 1.000 540,208,766 0.754 1.145 466,200,1652014 9,514 1.000 9,514 2014 628,677,306 1.000 628,677,306 0.679 1.112 474,651,3662015 9,489 0.998 9,470 2015 641,196,354 1.000 641,196,354 0.704 1.088 491,156,4072016 9,307 0.998 9,288 2016 653,643,107 1.000 653,643,107 0.723 1.069 505,266,1222017 9,330 1.003 9,358 2017 656,818,816 1.000 656,818,816 0.760 1.036 516,916,4082018 8,754 1.044 9,139 2018 629,619,394 1.007 634,026,730 0.799 1.000 506,587,357
Notes: (15) = (13) x (14) (19) = (17) x (18)(22) = (19) x [(20) x (21)]
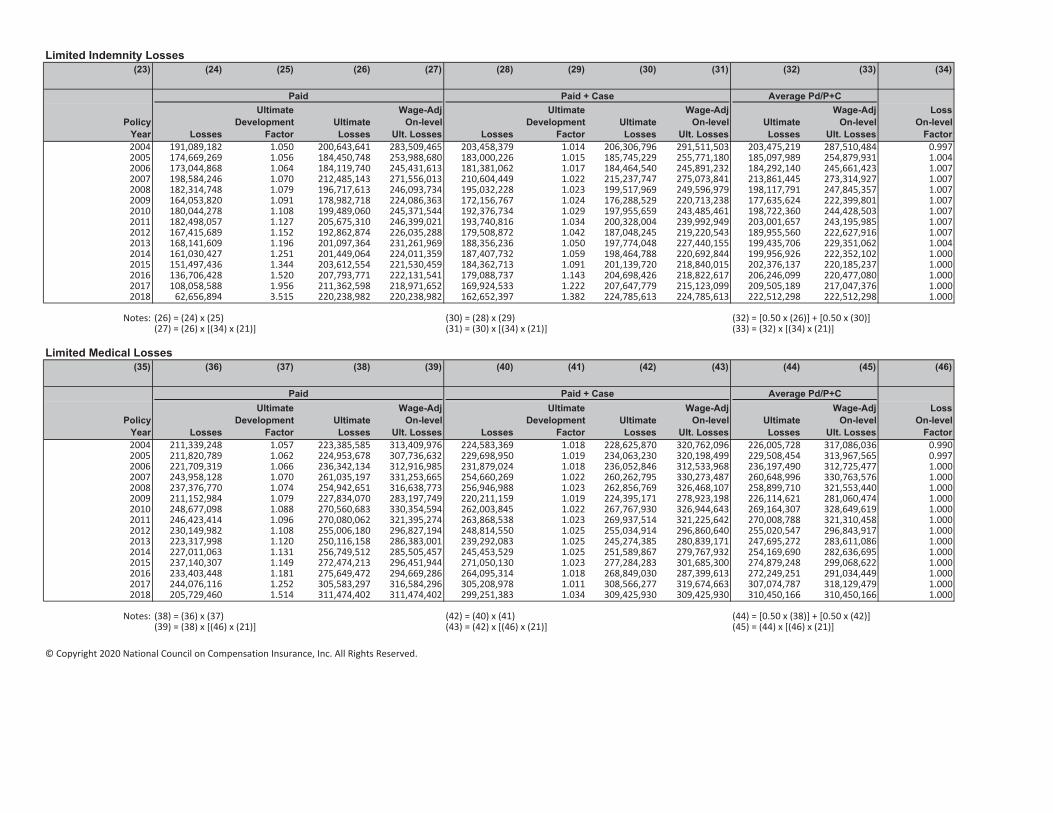
Limited Indemnity Losses(23) (24) (25) (26) (27) (28) (29) (30) (31) (32) (33) (34)
Paid Paid + Case Average Pd/P+C
Policy Year Losses
UltimateDevelopment
FactorUltimateLosses
Wage-Adj On-level
Ult. Losses Losses
UltimateDevelopment
FactorUltimateLosses
Wage-Adj On-level
Ult. LossesUltimateLosses
Wage-Adj On-level
Ult. Losses
Loss On-level
Factor2004 191,089,182 1.050 200,643,641 283,509,465 203,458,379 1.014 206,306,796 291,511,503 203,475,219 287,510,484 0.9972005 174,669,269 1.056 184,450,748 253,988,680 183,000,226 1.015 185,745,229 255,771,180 185,097,989 254,879,931 1.0042006 173,044,868 1.064 184,119,740 245,431,613 181,381,062 1.017 184,464,540 245,891,232 184,292,140 245,661,423 1.0072007 198,584,246 1.070 212,485,143 271,556,013 210,604,449 1.022 215,237,747 275,073,841 213,861,445 273,314,927 1.0072008 182,314,748 1.079 196,717,613 246,093,734 195,032,228 1.023 199,517,969 249,596,979 198,117,791 247,845,357 1.0072009 164,053,820 1.091 178,982,718 224,086,363 172,156,767 1.024 176,288,529 220,713,238 177,635,624 222,399,801 1.0072010 180,044,278 1.108 199,489,060 245,371,544 192,376,734 1.029 197,955,659 243,485,461 198,722,360 244,428,503 1.0072011 182,498,057 1.127 205,675,310 246,399,021 193,740,816 1.034 200,328,004 239,992,949 203,001,657 243,195,985 1.0072012 167,415,689 1.152 192,862,874 226,035,288 179,508,872 1.042 187,048,245 219,220,543 189,955,560 222,627,916 1.0072013 168,141,609 1.196 201,097,364 231,261,969 188,356,236 1.050 197,774,048 227,440,155 199,435,706 229,351,062 1.0042014 161,030,427 1.251 201,449,064 224,011,359 187,407,732 1.059 198,464,788 220,692,844 199,956,926 222,352,102 1.0002015 151,497,436 1.344 203,612,554 221,530,459 184,362,713 1.091 201,139,720 218,840,015 202,376,137 220,185,237 1.0002016 136,706,428 1.520 207,793,771 222,131,541 179,088,737 1.143 204,698,426 218,822,617 206,246,099 220,477,080 1.0002017 108,058,588 1.956 211,362,598 218,971,652 169,924,533 1.222 207,647,779 215,123,099 209,505,189 217,047,376 1.0002018 62,656,894 3.515 220,238,982 220,238,982 162,652,397 1.382 224,785,613 224,785,613 222,512,298 222,512,298 1.000
Notes: (26) = (24) x (25) (30) = (28) x (29) (32) = [0.50 x (26)] + [0.50 x (30)](27) = (26) x [(34) x (21)] (31) = (30) x [(34) x (21)] (33) = (32) x [(34) x (21)]
Limited Medical Losses(35) (36) (37) (38) (39) (40) (41) (42) (43) (44) (45) (46)
Paid Paid + Case Average Pd/P+C
Policy Year Losses
UltimateDevelopment
FactorUltimateLosses
Wage-Adj On-level
Ult. Losses Losses
UltimateDevelopment
FactorUltimateLosses
Wage-Adj On-level
Ult. LossesUltimateLosses
Wage-Adj On-level
Ult. Losses
Loss On-level
Factor2004 211,339,248 1.057 223,385,585 313,409,976 224,583,369 1.018 228,625,870 320,762,096 226,005,728 317,086,036 0.9902005 211,820,789 1.062 224,953,678 307,736,632 229,698,950 1.019 234,063,230 320,198,499 229,508,454 313,967,565 0.9972006 221,709,319 1.066 236,342,134 312,916,985 231,879,024 1.018 236,052,846 312,533,968 236,197,490 312,725,477 1.0002007 243,958,128 1.070 261,035,197 331,253,665 254,660,269 1.022 260,262,795 330,273,487 260,648,996 330,763,576 1.0002008 237,376,770 1.074 254,942,651 316,638,773 256,946,988 1.023 262,856,769 326,468,107 258,899,710 321,553,440 1.0002009 211,152,984 1.079 227,834,070 283,197,749 220,211,159 1.019 224,395,171 278,923,198 226,114,621 281,060,474 1.0002010 248,677,098 1.088 270,560,683 330,354,594 262,003,845 1.022 267,767,930 326,944,643 269,164,307 328,649,619 1.0002011 246,423,414 1.096 270,080,062 321,395,274 263,868,538 1.023 269,937,514 321,225,642 270,008,788 321,310,458 1.0002012 230,149,982 1.108 255,006,180 296,827,194 248,814,550 1.025 255,034,914 296,860,640 255,020,547 296,843,917 1.0002013 223,317,998 1.120 250,116,158 286,383,001 239,292,083 1.025 245,274,385 280,839,171 247,695,272 283,611,086 1.0002014 227,011,063 1.131 256,749,512 285,505,457 245,453,529 1.025 251,589,867 279,767,932 254,169,690 282,636,695 1.0002015 237,140,307 1.149 272,474,213 296,451,944 271,050,130 1.023 277,284,283 301,685,300 274,879,248 299,068,622 1.0002016 233,403,448 1.181 275,649,472 294,669,286 264,095,314 1.018 268,849,030 287,399,613 272,249,251 291,034,449 1.0002017 244,076,116 1.252 305,583,297 316,584,296 305,208,978 1.011 308,566,277 319,674,663 307,074,787 318,129,479 1.0002018 205,729,460 1.514 311,474,402 311,474,402 299,251,383 1.034 309,425,930 309,425,930 310,450,166 310,450,166 1.000
Notes: (38) = (36) x (37) (42) = (40) x (41) (44) = [0.50 x (38)] + [0.50 x (42)](39) = (38) x [(46) x (21)] (43) = (42) x [(46) x (21)] (45) = (44) x [(46) x (21)]
© Copyright 2020 National Council on Compensation Insurance, Inc. All Rights Reserved.

Missouri - January 1, 2021 Exhibit 15
Determination of the indicated loss cost level change after excluding the assigned risk premium and loss experiencereported to NCCI by Missouri’s designated assigned risk plan administrator from the filing’s experience period
PY 2018 PY 2017Premium:
(1) Standard Earned Premium Developed to Ultimate (Appendix A-II) $625,446,341 $647,272,786(2) Premium On-level Factor (Appendix A-I) 0.799 0.760(3) Pure Premium Available for Benefit Costs = (1) x (2) $499,731,626 $491,927,317
$4,378,124.39Indemnity Benefit Cost:
(4) Limited Indemnity Losses Developed to Ultimate (Appendix A-II) $217,746,484 $205,277,692(5) Indemnity Loss On-level Factor (Appendix A-I) 1.000 1.000(6) Adjusted Limited Indemnity Losses = (4) x (5) $217,746,484 $205,277,692(7) Adjusted Limited Indemnity Cost Ratio excluding Trend and Benefits = (6) / (3) 0.436 0.417(8) Factor to Reflect Indemnity Trend (Appendix A-III) 0.941 0.922(9) Projected Limited Indemnity Cost Ratio = (7) x (8) 0.410 0.384
(10) Factor to Adjust Indemnity Cost Ratio to an Unlimited Basis (Appendix A-II) 1.011 1.011(11) Projected Indemnity Cost Ratio = (9) x (10) 0.415 0.388(12) Factor to Reflect Proposed Changes in Indemnity Benefits (Appendix C) 1.000 1.000(13) Projected Indemnity Cost Ratio including Benefit Changes = (11) x (12) 0.415 0.388
Medical Benefit Cost:
(14) Limited Medical Losses Developed to Ultimate (Appendix A-II) $298,583,644 $297,442,733(15) Medical Loss On-level Factor (Appendix A-I) 1.000 1.000(16) Adjusted Limited Medical Losses = (14) x (15) $298,583,644 $297,442,733(17) Adjusted Limited Medical Cost Ratio excluding Trend and Benefits = (16) / (3) 0.597 0.605(18) Factor to Reflect Medical Trend (Appendix A-III) 0.970 0.961(19) Projected Limited Medical Cost Ratio = (17) x (18) 0.579 0.581(20) Factor to Adjust Medical Cost Ratio to an Unlimited Basis (Appendix A-II) 1.011 1.011(21) Projected Medical Cost Ratio = (19) x (20) 0.585 0.587(22) Factor to Reflect Proposed Changes in Medical Benefits (Appendix C) 1.000 1.000(23) Projected Medical Cost Ratio including Benefit Changes = (21) x (22) 0.585 0.587
Total Benefit Cost:
(24) Indicated Change Based on Experience, Trend, and Benefits = (13) + (23) 1.000 0.975
(25) Average Indicated Change Based on Experience, Trend, and Benefits = Average of (24) 0.988
(26) Effect of the Change in Loss-based Expenses (Exhibit II) 1.005
(27) Overall Average Voluntary Loss Cost Level Change 0.993
© Copyright 2020 National Council on Compensation Insurance Inc. All Rights Reserved.
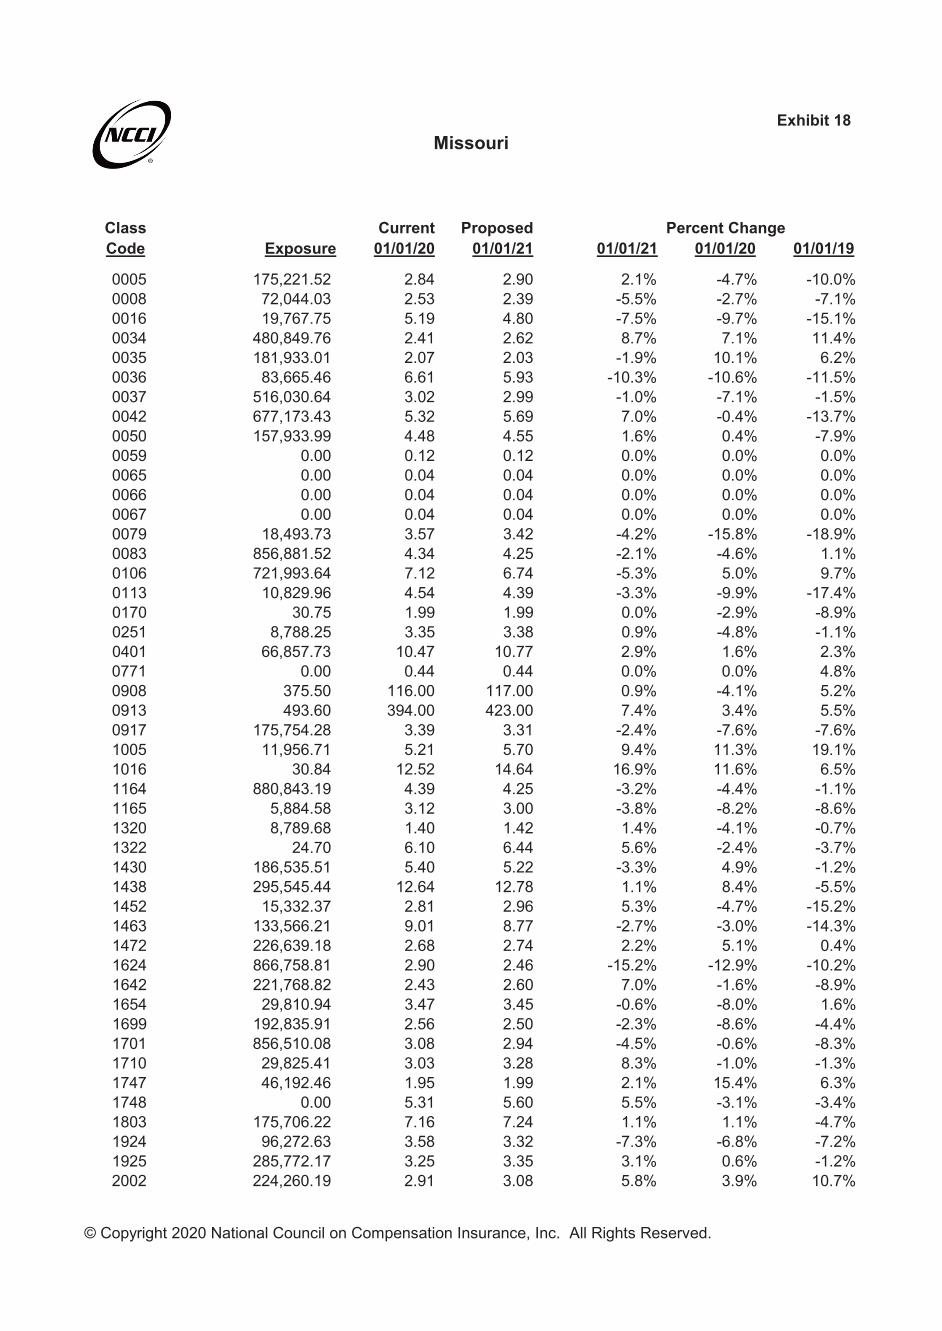
Exhibit 18
Class Current Proposed Percent ChangeCode Exposure 01/01/20 01/01/21 01/01/21 01/01/20 01/01/19
0005 175,221.52 2.84 2.90 2.1% -4.7% -10.0%0008 72,044.03 2.53 2.39 -5.5% -2.7% -7.1%0016 19,767.75 5.19 4.80 -7.5% -9.7% -15.1%0034 480,849.76 2.41 2.62 8.7% 7.1% 11.4%0035 181,933.01 2.07 2.03 -1.9% 10.1% 6.2%0036 83,665.46 6.61 5.93 -10.3% -10.6% -11.5%0037 516,030.64 3.02 2.99 -1.0% -7.1% -1.5%0042 677,173.43 5.32 5.69 7.0% -0.4% -13.7%0050 157,933.99 4.48 4.55 1.6% 0.4% -7.9%0059 0.00 0.12 0.12 0.0% 0.0% 0.0%0065 0.00 0.04 0.04 0.0% 0.0% 0.0%0066 0.00 0.04 0.04 0.0% 0.0% 0.0%0067 0.00 0.04 0.04 0.0% 0.0% 0.0%0079 18,493.73 3.57 3.42 -4.2% -15.8% -18.9%0083 856,881.52 4.34 4.25 -2.1% -4.6% 1.1%0106 721,993.64 7.12 6.74 -5.3% 5.0% 9.7%0113 10,829.96 4.54 4.39 -3.3% -9.9% -17.4%0170 30.75 1.99 1.99 0.0% -2.9% -8.9%0251 8,788.25 3.35 3.38 0.9% -4.8% -1.1%0401 66,857.73 10.47 10.77 2.9% 1.6% 2.3%0771 0.00 0.44 0.44 0.0% 0.0% 4.8%0908 375.50 116.00 117.00 0.9% -4.1% 5.2%0913 493.60 394.00 423.00 7.4% 3.4% 5.5%0917 175,754.28 3.39 3.31 -2.4% -7.6% -7.6%1005 11,956.71 5.21 5.70 9.4% 11.3% 19.1%1016 30.84 12.52 14.64 16.9% 11.6% 6.5%1164 880,843.19 4.39 4.25 -3.2% -4.4% -1.1%1165 5,884.58 3.12 3.00 -3.8% -8.2% -8.6%1320 8,789.68 1.40 1.42 1.4% -4.1% -0.7%1322 24.70 6.10 6.44 5.6% -2.4% -3.7%1430 186,535.51 5.40 5.22 -3.3% 4.9% -1.2%1438 295,545.44 12.64 12.78 1.1% 8.4% -5.5%1452 15,332.37 2.81 2.96 5.3% -4.7% -15.2%1463 133,566.21 9.01 8.77 -2.7% -3.0% -14.3%1472 226,639.18 2.68 2.74 2.2% 5.1% 0.4%1624 866,758.81 2.90 2.46 -15.2% -12.9% -10.2%1642 221,768.82 2.43 2.60 7.0% -1.6% -8.9%1654 29,810.94 3.47 3.45 -0.6% -8.0% 1.6%1699 192,835.91 2.56 2.50 -2.3% -8.6% -4.4%1701 856,510.08 3.08 2.94 -4.5% -0.6% -8.3%1710 29,825.41 3.03 3.28 8.3% -1.0% -1.3%1747 46,192.46 1.95 1.99 2.1% 15.4% 6.3%1748 0.00 5.31 5.60 5.5% -3.1% -3.4%1803 175,706.22 7.16 7.24 1.1% 1.1% -4.7%1924 96,272.63 3.58 3.32 -7.3% -6.8% -7.2%1925 285,772.17 3.25 3.35 3.1% 0.6% -1.2%2002 224,260.19 2.91 3.08 5.8% 3.9% 10.7%
Missouri
© Copyright 2020 National Council on Compensation Insurance, Inc. All Rights Reserved.

Exhibit 18
Class Current Proposed Percent ChangeCode Exposure 01/01/20 01/01/21 01/01/21 01/01/20 01/01/19
Missouri
2003 738,282.67 3.52 3.65 3.7% -3.0% -0.3%2014 740,965.56 4.52 4.62 2.2% 0.4% 13.1%2016 246,791.34 2.88 2.84 -1.4% -1.7% 11.8%2021 102,411.03 2.06 2.49 20.9% 10.8% 5.7%2039 427,492.65 2.50 2.68 7.2% 0.4% 3.3%2041 64,450.46 2.47 2.54 2.8% 0.4% -0.4%2065 15,711.78 1.75 1.70 -2.9% -7.4% -2.6%2070 996,794.17 3.91 3.86 -1.3% -3.0% -6.5%2081 24,879.45 4.79 4.79 0.0% -1.6% -13.8%2089 2,186,544.13 3.17 3.13 -1.3% -4.8% -2.9%2095 1,714,750.77 3.23 3.42 5.9% 12.5% 0.7%2105 6,032.62 3.42 4.00 17.0% 5.9% 1.6%2110 45,326.67 1.80 1.76 -2.2% -4.8% -5.5%2111 363,152.16 2.06 1.98 -3.9% -4.2% -0.5%2112 3,015.22 3.57 3.57 0.0% -1.9% 4.3%2114 0.00 2.96 2.92 -1.4% -3.9% 1.3%2121 816,217.95 1.18 1.26 6.8% -7.8% -12.9%2130 205,956.09 1.68 1.72 2.4% -2.3% -1.1%2131 86,493.91 2.22 2.34 5.4% 0.5% -5.2%2143 126,190.15 2.17 2.31 6.5% 5.9% 12.6%2157 709,315.66 5.97 5.32 -10.9% -4.5% -4.7%2172 378.56 1.47 1.48 0.7% -3.9% -0.6%2174 157.80 2.76 2.93 6.2% 0.4% -6.8%2211 121.59 9.36 8.97 -4.2% -7.9% -9.4%2220 13,310.54 1.92 2.03 5.7% 1.1% -0.5%2288 102,587.49 3.55 3.84 8.2% -3.5% -8.7%2302 44.97 1.62 1.71 5.6% -5.8% -5.5%2305 99,437.24 2.26 2.18 -3.5% -7.4% -18.4%2361 3,179.75 1.80 1.74 -3.3% -2.2% -2.1%2362 1,724.46 1.73 1.94 12.1% 4.8% 5.8%2380 648.23 1.98 2.00 1.0% -5.7% -7.1%2388 95,243.54 1.52 1.55 2.0% 1.3% 0.0%2402 1,531.68 2.46 2.54 3.3% 4.2% 4.0%2413 7,832.21 2.52 2.65 5.2% 2.9% 3.8%2416 0.00 1.80 1.94 7.8% -3.2% -2.6%2417 21,915.21 1.34 1.40 4.5% 3.9% -7.2%2501 1,113,976.11 2.45 2.53 3.3% 4.3% 4.0%2503 18,445.18 1.31 1.21 -7.6% -8.4% 4.4%2570 29,366.79 3.77 3.86 2.4% -2.6% -3.7%2585 1,070,479.25 3.08 2.94 -4.5% -1.9% 0.3%2586 60,761.54 2.50 2.78 11.2% 12.6% 8.3%2587 1,652.71 1.73 1.95 12.7% -0.6% -5.4%2589 197,808.85 1.88 1.96 4.3% -1.6% 0.0%2600 0.00 3.72 4.08 9.7% -2.1% -0.3%2623 28,347.31 6.02 5.79 -3.8% -8.9% -9.8%2651 75,813.67 2.21 2.23 0.9% 3.8% 8.1%2660 265,003.28 2.70 2.83 4.8% 0.0% -1.5%
© Copyright 2020 National Council on Compensation Insurance, Inc. All Rights Reserved.

Exhibit 18
Class Current Proposed Percent ChangeCode Exposure 01/01/20 01/01/21 01/01/21 01/01/20 01/01/19
Missouri
2683 6,412.74 2.10 2.53 20.5% 16.0% 7.1%2688 62,641.78 2.42 2.30 -5.0% -10.7% -9.4%2701 5,992.00 10.48 10.42 -0.6% 3.6% 12.3%2702 15,178.76 15.86 15.80 -0.4% -11.2% -11.1%2709 2,521.13 16.56 19.92 20.3% -0.5% 15.3%2710 129,721.30 12.46 12.62 1.3% -7.8% -10.6%2714 607.79 4.62 4.50 -2.6% -2.5% -6.3%2731 409,352.29 3.68 3.47 -5.7% 5.4% -0.6%2735 46,555.09 3.48 3.69 6.0% -6.5% -5.1%2759 315,693.81 6.08 5.91 -2.8% -1.8% -0.6%2790 34,714.04 1.63 1.80 10.4% 0.6% 2.5%2797 26,107.37 4.75 5.07 6.7% 9.2% 17.9%2799 36,736.23 5.03 4.69 -6.8% -0.4% 8.4%2802 322,297.70 4.92 4.88 -0.8% 0.0% -6.8%2835 18,458.08 2.22 2.26 1.8% -10.1% -8.2%2836 6,958.56 2.16 2.48 14.8% 3.8% 5.6%2841 51,210.84 3.55 3.94 11.0% 0.0% -4.1%2881 218,987.49 2.93 2.78 -5.1% -6.1% -2.5%2883 1,362,081.47 2.83 2.74 -3.2% -4.4% 2.1%2915 0.00 3.35 3.32 -0.9% 6.0% 10.5%2916 1,781.97 3.71 3.41 -8.1% -7.9% -13.1%2923 8,645.78 1.85 1.77 -4.3% -3.1% -3.5%2960 25,697.67 5.19 4.97 -4.2% -6.3% -15.5%3004 24.97 1.77 1.71 -3.4% -8.3% -13.8%3018 45,812.00 4.37 3.87 -11.4% -14.0% -14.3%3022 136,716.92 3.44 3.28 -4.7% -2.8% -8.1%3027 12,461.84 2.45 2.28 -6.9% -3.9% -7.3%3028 192,547.90 3.60 3.71 3.1% -5.0% -12.7%3030 839,145.37 4.32 4.48 3.7% 1.6% 2.9%3040 290,156.21 4.84 4.76 -1.7% -6.6% -7.8%3041 17,115.16 4.07 3.96 -2.7% -8.3% -9.8%3042 442.35 4.76 4.79 0.6% -5.0% -14.4%3064 147,298.61 3.32 3.45 3.9% 5.1% -4.8%3076 5,007,821.41 3.00 2.99 -0.3% 4.9% 1.4%3081 102,361.34 3.95 4.27 8.1% 2.6% 9.1%3082 48,569.98 4.61 4.76 3.3% 0.2% -2.3%3085 624,796.40 4.41 4.61 4.5% 0.9% -15.1%3110 46,634.20 4.21 4.19 -0.5% -10.6% -11.6%3111 4,111.90 2.15 2.08 -3.3% -7.3% -0.4%3113 1,438,342.90 1.76 1.64 -6.8% -4.9% 0.0%3114 55,022.26 3.25 3.35 3.1% 6.2% 8.9%3118 15,271.75 2.05 1.99 -2.9% -4.2% -2.3%3119 734.66 1.37 1.41 2.9% -7.4% -9.2%3122 739.81 2.03 2.08 2.5% 3.6% -3.0%3126 35,705.76 1.31 1.36 3.8% 3.1% 8.5%3131 140.89 1.81 1.79 -1.1% -1.6% 1.7%3132 8,404.38 3.68 4.45 20.9% 0.0% -3.2%
© Copyright 2020 National Council on Compensation Insurance, Inc. All Rights Reserved.

Exhibit 18
Class Current Proposed Percent ChangeCode Exposure 01/01/20 01/01/21 01/01/21 01/01/20 01/01/19
Missouri
3145 120,429.46 2.26 2.33 3.1% -2.2% -6.9%3146 444,986.31 2.22 2.25 1.4% 1.4% 5.3%3169 74,896.11 2.22 2.48 11.7% 6.7% 5.1%3179 1,922,408.55 2.01 2.08 3.5% -1.5% -7.7%3180 222,389.80 2.64 2.65 0.4% -5.0% 3.3%3188 270,958.12 2.16 2.19 1.4% -6.5% 7.4%3220 283,324.98 2.15 2.19 1.9% -3.2% -8.3%3224 0.00 2.85 3.12 9.5% 0.7% -4.7%3227 300,731.19 2.89 2.83 -2.1% -3.7% 1.7%3240 3,707.77 2.71 2.48 -8.5% 16.8% 17.2%3241 300,108.05 2.74 2.60 -5.1% -15.4% -9.0%3255 0.00 2.24 2.37 5.8% 1.4% -2.2%3257 413,677.16 2.47 2.48 0.4% -1.2% 2.5%3270 154,153.28 3.65 3.62 -0.8% -0.5% -12.2%3300 346,188.63 3.93 4.28 8.9% 0.3% 2.1%3303 255,362.59 2.01 2.04 1.5% 1.5% -14.3%3307 74,090.81 3.27 2.92 -10.7% -8.7% -13.5%3315 40,313.42 3.04 2.97 -2.3% -5.6% -9.6%3334 105,216.96 1.80 1.79 -0.6% -3.2% -3.1%3336 87,932.05 2.63 2.72 3.4% -5.4% -4.8%3365 296,510.66 3.31 3.28 -0.9% -4.6% -11.5%3372 158,036.15 3.13 2.99 -4.5% -8.2% -5.0%3373 75,282.37 4.45 4.37 -1.8% -3.7% -11.5%3383 32,740.72 1.51 1.55 2.6% 2.0% 4.2%3385 4,802.07 0.82 0.88 7.3% 1.2% -3.6%3400 1,078,320.18 4.20 4.31 2.6% 2.7% -2.2%3507 890,324.32 2.57 2.59 0.8% 6.6% 0.4%3515 4,588.12 2.59 2.57 -0.8% -2.3% -4.3%3548 29,206.42 1.43 1.48 3.5% -0.7% -5.3%3559 56,884.69 2.36 2.35 -0.4% 1.7% -3.3%3574 1,467,736.94 1.72 2.08 20.9% -17.7% 16.1%3581 67,302.77 1.22 1.27 4.1% 5.2% -4.9%3612 725,582.56 1.97 1.96 -0.5% -2.0% -6.1%3620 546,838.76 3.69 3.64 -1.4% 0.3% 0.3%3629 933,329.43 1.51 1.48 -2.0% -6.8% -8.0%3632 4,028,331.59 2.80 2.81 0.4% -2.1% -6.8%3634 487,491.89 1.54 1.50 -2.6% -6.7% 3.8%3635 52,178.35 2.10 2.08 -1.0% -1.4% -2.7%3638 149,464.05 1.88 2.18 16.0% 5.0% -6.8%3642 2,059.16 1.21 1.12 -7.4% -5.5% -3.0%3643 1,935,097.83 2.41 2.68 11.2% 10.6% -0.9%3647 1,135,140.42 2.49 2.76 10.8% 0.0% 0.4%3648 94,392.22 1.46 1.55 6.2% 2.1% -3.4%3681 3,200,659.88 0.73 0.72 -1.4% -5.2% -4.9%3685 1,357,601.56 1.16 1.09 -6.0% -4.9% -10.9%3719 12,535.99 1.04 0.95 -8.7% -11.1% -23.5%3724 2,542,469.24 3.20 3.19 -0.3% -2.1% -14.8%
© Copyright 2020 National Council on Compensation Insurance, Inc. All Rights Reserved.

Exhibit 18
Class Current Proposed Percent ChangeCode Exposure 01/01/20 01/01/21 01/01/21 01/01/20 01/01/19
Missouri
3726 226,002.98 3.18 3.25 2.2% -4.2% -2.4%3803 182,177.56 2.00 2.28 14.0% 15.6% 0.6%3807 222,544.57 2.02 2.28 12.9% 1.0% -1.5%3808 326,248.69 3.50 3.59 2.6% -1.4% -5.6%3821 258,621.49 4.46 4.57 2.5% -4.5% -9.5%3822 21,263.56 3.50 3.45 -1.4% -3.3% -6.5%3824 921,883.83 4.04 3.91 -3.2% -12.0% -5.2%3826 123,855.40 1.00 1.07 7.0% -2.0% 5.2%3827 1,055.14 2.35 2.39 1.7% -2.5% -5.5%3830 9,338,773.95 0.70 0.70 0.0% -1.4% 4.4%3851 248,516.58 2.69 2.38 -11.5% -20.9% -21.8%3865 49,864.89 2.05 2.47 20.5% 10.8% 8.8%3881 197,796.48 3.69 3.57 -3.3% -2.1% -9.2%4000 173,834.85 4.50 3.99 -11.3% -8.0% -0.4%4018 156,588.93 4.95 5.34 7.9% 1.6% -0.8%4021 4,295.82 6.19 5.40 -12.8% -4.2% -14.2%4034 398,025.55 6.33 6.28 -0.8% -6.5% 4.5%4036 47,993.71 2.40 2.25 -6.3% -8.4% -5.1%4038 12,410.35 3.83 3.71 -3.1% -10.1% -14.3%4062 19,358.05 2.63 2.67 1.5% 4.4% 3.3%4101 98,258.00 2.22 2.21 -0.5% -5.5% 1.3%4109 88,906.84 0.55 0.57 3.6% -1.8% -11.1%4110 47,566.00 1.21 1.16 -4.1% -5.5% -12.9%4111 7,465.88 1.73 1.79 3.5% -1.1% -4.4%4114 313,205.84 3.11 3.11 0.0% -5.5% -10.6%4130 156,852.95 3.09 3.03 -1.9% -2.5% -4.5%4131 798.98 4.55 4.58 0.7% 14.3% 1.8%4133 5,499.63 1.80 1.96 8.9% -2.7% 8.8%4149 173,628.59 0.82 0.77 -6.1% -4.7% -3.4%4206 11,298.79 2.34 2.49 6.4% -0.4% -1.3%4207 0.00 1.80 1.92 6.7% -0.6% 0.6%4239 90,396.78 1.90 2.01 5.8% 6.1% -0.6%4240 76,927.40 3.48 3.37 -3.2% -0.3% 16.3%4243 528,667.20 2.06 2.21 7.3% 0.0% -6.4%4244 1,065,505.83 2.32 2.48 6.9% -1.7% -10.3%4250 88,457.24 1.68 1.72 2.4% 0.0% -5.1%4251 148,058.17 3.28 3.41 4.0% -2.4% -0.3%4263 25,976.13 3.32 3.36 1.2% -7.5% -14.5%4273 644,739.57 2.27 2.34 3.1% -2.2% -6.5%4279 341,103.44 2.24 2.33 4.0% 3.7% -0.9%4283 221,402.29 1.38 1.28 -7.2% -2.8% -8.4%4299 2,263,941.96 2.07 1.96 -5.3% -2.8% -3.6%4304 236,165.26 5.73 5.07 -11.5% -11.2% -9.8%4307 83,489.17 1.68 1.79 6.5% -1.2% 7.6%4351 22,750.33 0.83 0.89 7.2% 6.4% 0.0%4352 25,588.02 1.65 1.66 0.6% 1.9% -5.8%4361 746,309.38 0.71 0.67 -5.6% -6.6% -11.6%
© Copyright 2020 National Council on Compensation Insurance, Inc. All Rights Reserved.

Exhibit 18
Class Current Proposed Percent ChangeCode Exposure 01/01/20 01/01/21 01/01/21 01/01/20 01/01/19
Missouri
4410 1,404,239.63 2.88 3.06 6.3% -2.4% 4.6%4420 1,422.67 3.92 3.89 -0.8% -4.2% -0.7%4431 14,577.32 1.26 1.26 0.0% -0.8% -3.1%4432 0.00 1.21 1.20 -0.8% -5.5% -5.9%4452 631,243.44 2.59 2.47 -4.6% -5.1% -2.2%4459 1,103,493.38 2.40 2.39 -0.4% 4.8% -5.4%4470 89,370.98 2.17 2.15 -0.9% 3.3% 1.4%4484 4,585,157.44 2.47 2.65 7.3% 5.1% -3.3%4493 8,910.10 4.44 3.66 -17.6% -21.0% -2.8%4511 3,168,541.62 0.41 0.40 -2.4% 5.1% 8.3%4557 230,195.12 2.00 2.23 11.5% -4.3% -8.7%4558 460,416.28 1.71 1.72 0.6% -4.5% -4.3%4568 9,501.52 3.71 3.30 -11.1% -15.9% -4.8%4581 13,428.47 1.58 1.91 20.9% 18.8% 17.7%4583 304,754.42 4.08 4.43 8.6% 3.3% 4.5%4611 3,066,940.57 0.98 1.07 9.2% -1.0% -4.8%4635 348,178.29 2.94 2.77 -5.8% -2.3% -5.6%4653 7,003.71 1.29 1.41 9.3% 0.8% -4.5%4665 11,430.17 9.01 9.02 0.1% 3.2% -2.9%4683 54,677.09 3.58 3.60 0.6% -4.0% -7.0%4686 134,366.43 2.41 2.16 -10.4% -7.7% 4.0%4692 296,450.94 0.82 0.86 4.9% 1.2% 3.8%4693 146,235.24 0.82 0.92 12.2% 9.3% 10.3%4703 189,721.78 1.91 1.87 -2.1% -2.6% -10.9%4717 79,868.73 2.05 2.11 2.9% 3.0% 7.0%4720 862,039.74 1.93 2.05 6.2% 8.4% 5.3%4740 84,049.32 0.98 1.01 3.1% 10.1% 7.2%4741 80,852.92 2.22 2.31 4.1% 3.7% -6.6%4751 0.00 1.75 2.05 17.1% 2.9% -6.1%4771 334,142.82 2.52 2.52 0.0% 0.4% 6.4%4777 55,415.29 3.89 3.86 -0.8% -4.0% -0.2%4825 2,183,199.77 0.72 0.72 0.0% 0.0% -5.3%4828 1,365,039.87 1.82 1.94 6.6% -7.1% -8.0%4829 1,668,027.51 1.07 1.11 3.7% 0.9% 2.9%4902 125,907.34 2.39 2.34 -2.1% -8.1% -10.7%4923 29,481.00 0.97 0.99 2.1% 4.3% -6.1%5020 86,169.89 4.23 4.07 -3.8% -6.2% 0.7%5022 1,286,615.90 5.46 5.66 3.7% 0.0% -0.2%5037 7,932.57 10.46 9.86 -5.7% -6.6% -7.4%5040 130,018.73 11.04 9.71 -12.0% -7.6% -16.7%5057 367,381.53 3.66 4.34 18.6% -0.8% -9.6%5059 58,420.11 24.30 23.46 -3.5% -5.7% -8.8%5102 416,529.46 5.20 4.96 -4.6% -5.3% -6.0%5146 386,754.85 4.38 4.46 1.8% -3.9% -1.9%5160 425,156.27 2.02 1.96 -3.0% -6.5% -9.2%5183 4,403,480.82 2.65 2.59 -2.3% -3.6% -8.9%5188 548,196.31 2.64 2.58 -2.3% 5.6% -0.4%
© Copyright 2020 National Council on Compensation Insurance, Inc. All Rights Reserved.

Exhibit 18
Class Current Proposed Percent ChangeCode Exposure 01/01/20 01/01/21 01/01/21 01/01/20 01/01/19
Missouri
5190 5,343,237.63 2.50 2.49 -0.4% 0.0% -2.7%5191 3,400,487.11 0.66 0.69 4.5% 1.5% -3.0%5192 545,002.00 2.19 2.55 16.4% 2.8% -1.4%5213 1,493,212.15 5.39 4.86 -9.8% -11.1% -2.6%5215 536,178.42 4.87 4.86 -0.2% -0.4% -3.7%5221 2,795,020.67 3.94 4.15 5.3% 4.0% -4.1%5222 261,291.55 6.74 6.70 -0.6% -1.6% -4.9%5223 141,230.53 5.27 4.97 -5.7% -8.8% -6.2%5348 676,263.06 3.73 3.50 -6.2% -3.9% -15.5%5402 6,600.40 3.72 4.26 14.5% 12.4% -1.8%5403 2,937,940.67 4.98 4.92 -1.2% -2.7% -7.1%5437 1,329,660.47 4.04 4.45 10.1% 3.3% 3.7%5443 3,459.17 2.80 2.82 0.7% 6.9% -6.4%5445 1,792,945.01 4.38 3.97 -9.4% -0.9% -4.3%5462 338,706.11 4.99 4.67 -6.4% -7.1% -0.4%5472 84,930.55 4.55 4.36 -4.2% -10.6% -3.0%5473 101,666.21 6.81 6.85 0.6% -4.5% -7.0%5474 1,918,312.67 4.73 4.75 0.4% -6.5% -7.7%5478 619,735.18 5.05 4.41 -12.7% -9.3% -9.9%5479 168,358.63 6.14 6.14 0.0% -4.7% -9.7%5480 53,295.15 5.08 4.91 -3.3% -1.7% 0.2%5491 23,956.55 1.54 1.49 -3.2% 2.7% -5.1%5506 1,910,702.24 4.68 4.62 -1.3% 2.6% -5.4%5507 170,855.58 3.20 3.28 2.5% -0.3% -10.3%5535 964,395.93 5.36 5.52 3.0% -1.3% -11.0%5537 3,906,366.80 3.83 3.66 -4.4% 8.5% -4.3%5551 813,619.54 13.67 14.25 4.2% -0.6% -9.4%5606 5,466,731.31 1.10 1.12 1.8% -4.3% -0.9%5610 127,606.04 4.25 3.68 -13.4% -10.1% -6.2%5645 2,302,359.80 9.19 8.95 -2.6% 3.0% -3.8%5703 1,814.76 10.02 11.90 18.8% 5.8% -3.6%5705 504.77 22.38 19.95 -10.9% -7.6% -11.0%5951 38,200.91 0.35 0.39 11.4% 2.9% 0.0%6003 15,109.01 4.26 4.58 7.5% 2.2% -6.1%6005 1,411.56 4.55 4.32 -5.1% -6.4% -10.2%6045 9,266.10 3.12 3.52 12.8% 5.4% -6.3%6204 137,007.78 8.43 7.30 -13.4% -10.8% -25.2%6206 88.95 2.10 2.28 8.6% 0.5% -10.3%6213 2,936.53 1.15 1.11 -3.5% -10.2% -12.3%6214 24.70 1.58 1.52 -3.8% -6.0% -12.0%6216 10,247.60 3.96 4.01 1.3% -5.7% -4.3%6217 2,377,460.45 3.40 3.15 -7.4% -11.5% -8.1%6229 96,851.87 3.91 4.14 5.9% -3.0% -1.0%6233 172,496.79 1.89 2.07 9.5% 5.6% 1.7%6235 8,411.26 5.33 5.18 -2.8% -2.9% -17.2%6236 0.00 5.22 5.14 -1.5% -4.6% -10.9%6237 3,484.08 1.19 1.16 -2.5% -5.6% -11.3%
© Copyright 2020 National Council on Compensation Insurance, Inc. All Rights Reserved.

Exhibit 18
Class Current Proposed Percent ChangeCode Exposure 01/01/20 01/01/21 01/01/21 01/01/20 01/01/19
Missouri
6251 81,624.05 3.06 2.90 -5.2% -10.5% -6.0%6252 51,057.01 2.95 2.79 -5.4% -4.2% -10.7%6306 496,709.11 4.92 4.53 -7.9% -9.2% -21.8%6319 555,867.17 3.42 3.30 -3.5% -5.8% -11.9%6325 601,592.93 2.83 2.80 -1.1% -7.5% -5.6%6400 203,337.37 5.06 4.94 -2.4% 12.7% 0.9%6503 34,730.60 1.96 2.00 2.0% -1.0% -1.0%6504 4,309,721.64 2.29 2.25 -1.7% -0.9% 1.8%6702 0.00 3.45 3.54 2.6% 0.3% -5.8%6703 0.00 5.60 6.48 15.7% 17.9% 1.9%6704 0.00 3.83 3.93 2.6% 0.3% -5.7%6824 0.00 7.27 6.64 -8.7% -8.3% 3.5%6825 155,417.91 2.74 2.58 -5.8% -7.1% 1.4%6826 0.02 4.21 3.93 -6.7% -3.0% 4.6%6834 913,321.85 3.09 2.62 -15.2% -9.1% -5.3%6835 0.00 2.59 2.62 1.2% -2.3% -0.7%6836 162,068.04 3.02 3.09 2.3% -5.3% 6.7%6872 844.61 10.12 9.12 -9.9% -4.4% -2.2%6874 0.00 15.18 14.63 -3.6% -1.2% 7.9%6882 3,785.00 3.32 3.16 -4.8% -7.8% -3.2%6884 0.00 5.16 5.03 -2.5% -4.6% -4.6%7016 0.00 2.34 2.64 12.8% 17.6% 9.9%7024 3,805.48 2.60 2.93 12.7% 17.6% 10.0%7038 0.00 5.10 4.80 -5.9% -4.9% 2.1%7046 0.00 9.40 9.49 1.0% -2.0% -1.8%7047 0.00 3.24 4.83 49.1% 17.8% 19.0%7050 0.00 8.73 8.79 0.7% 18.0% 10.4%7090 1,035.38 5.67 5.33 -6.0% -4.7% 2.1%7098 10.00 10.44 10.54 1.0% -2.1% -1.8%7099 0.00 15.63 17.38 11.2% 18.0% 6.1%7133 17,617.43 2.26 2.57 13.7% 1.8% 4.2%7151 0.00 2.75 3.12 13.5% 1.9% 4.2%7152 0.00 4.40 5.72 30.0% 18.0% 12.7%7153 0.00 3.05 3.47 13.8% 1.7% 4.2%7219 12,624,490.32 6.43 6.38 -0.8% -1.7% 0.8%7222 7,350.08 5.63 5.80 3.0% 0.5% 4.5%7225 176,366.34 6.02 7.28 20.9% -2.1% -0.6%7230 366,247.84 6.01 6.30 4.8% -3.1% 2.5%7231 518,187.66 6.91 6.99 1.2% -7.4% -0.1%7232 308,031.95 6.86 7.53 9.8% 3.0% 13.8%7309 14,169.93 10.26 9.20 -10.3% -6.3% 0.6%7313 36.81 3.38 3.25 -3.8% 3.0% 8.6%7317 10,199.73 8.02 7.99 -0.4% -4.3% 5.3%7327 0.00 19.03 18.71 -1.7% 0.0% 7.1%7333 0.00 1.85 1.97 6.5% -4.6% 7.8%7335 14.31 2.05 2.19 6.8% -4.7% 7.5%7337 0.00 3.15 3.61 14.6% 18.0% 16.1%
© Copyright 2020 National Council on Compensation Insurance, Inc. All Rights Reserved.

Exhibit 18
Class Current Proposed Percent ChangeCode Exposure 01/01/20 01/01/21 01/01/21 01/01/20 01/01/19
Missouri
7350 9,220.48 10.48 9.46 -9.7% -8.3% -4.8%7360 336,705.40 3.66 3.73 1.9% -1.9% -5.3%7370 150,342.21 4.12 4.02 -2.4% -8.4% -5.9%7380 5,031,599.11 4.26 4.45 4.5% -0.2% -1.8%7382 1,371,358.69 4.07 4.14 1.7% -5.8% -2.3%7390 357,290.91 4.84 4.54 -6.2% -6.7% -21.2%7394 0.00 3.53 3.73 5.7% 5.1% 0.3%7395 1,501.61 3.92 4.14 5.6% 5.1% 0.3%7398 0.00 5.47 6.83 24.9% 17.9% 8.4%7402 8,722.81 0.10 0.10 0.0% -9.1% -8.3%7403 2,146,329.55 3.88 4.26 9.8% -1.3% -10.7%7405 891,314.29 1.19 1.22 2.5% -5.6% 4.1%7420 9,353.21 6.86 6.50 -5.2% -4.5% -5.3%7421 345,832.21 0.55 0.58 5.5% 7.8% -3.8%7422 98,765.22 1.73 1.52 -12.1% -18.4% -17.2%7425 263,934.06 2.02 1.82 -9.9% -19.5% -7.4%7431 236,558.35 0.99 1.04 5.1% 5.3% 9.3%7445 0.00 0.64 0.66 3.1% -5.9% 4.6%7453 0.00 0.53 0.56 5.7% 3.9% 10.9%7502 84,730.98 2.47 2.07 -16.2% -19.3% -16.2%7515 357,488.57 0.99 0.95 -4.0% -3.9% 8.4%7520 1,023,762.24 2.78 2.55 -8.3% -7.9% -13.7%7538 781,649.27 5.13 5.10 -0.6% -6.9% 2.2%7539 536,725.14 1.69 1.62 -4.1% -17.6% -18.0%7540 149.66 2.55 2.51 -1.6% -6.3% -2.9%7580 310,381.95 2.23 2.50 12.1% 2.8% 4.8%7590 126,450.17 2.59 2.62 1.2% -4.1% -4.6%7600 3,320,363.23 3.04 3.14 3.3% -2.3% -1.0%7605 953,794.43 1.66 1.66 0.0% -2.4% -8.1%7610 2,845,343.89 0.39 0.41 5.1% 5.4% 2.8%7705 1,214,706.87 3.76 3.79 0.8% -1.8% 14.0%7710 1,245,520.46 4.08 4.12 1.0% 0.5% 1.5%7711 155,176.77 4.08 4.12 1.0% 0.5% 1.5%7720 3,694,716.12 2.53 2.71 7.1% 2.4% -4.3%7855 270,051.29 3.10 3.17 2.3% 0.3% -5.8%8001 398,020.49 1.88 1.95 3.7% 8.0% -1.7%8002 614,728.76 1.62 1.78 9.9% 2.5% 5.3%8006 2,778,162.31 1.58 1.60 1.3% -1.9% -0.6%8008 3,637,119.46 0.88 0.91 3.4% 2.3% -5.5%8010 2,742,818.09 1.53 1.60 4.6% -1.9% -10.9%8013 1,338,764.43 0.32 0.34 6.3% 0.0% -5.9%8015 375,449.65 0.73 0.68 -6.8% -6.4% -3.7%8017 9,161,583.67 1.31 1.28 -2.3% -5.1% -2.1%8018 5,668,336.20 2.19 2.31 5.5% 3.3% -1.4%8021 403,683.71 2.67 2.69 0.7% -5.7% -6.6%8031 188,558.72 1.98 2.01 1.5% -2.5% 16.0%8032 344,296.92 1.70 1.75 2.9% -2.3% -5.4%
© Copyright 2020 National Council on Compensation Insurance, Inc. All Rights Reserved.
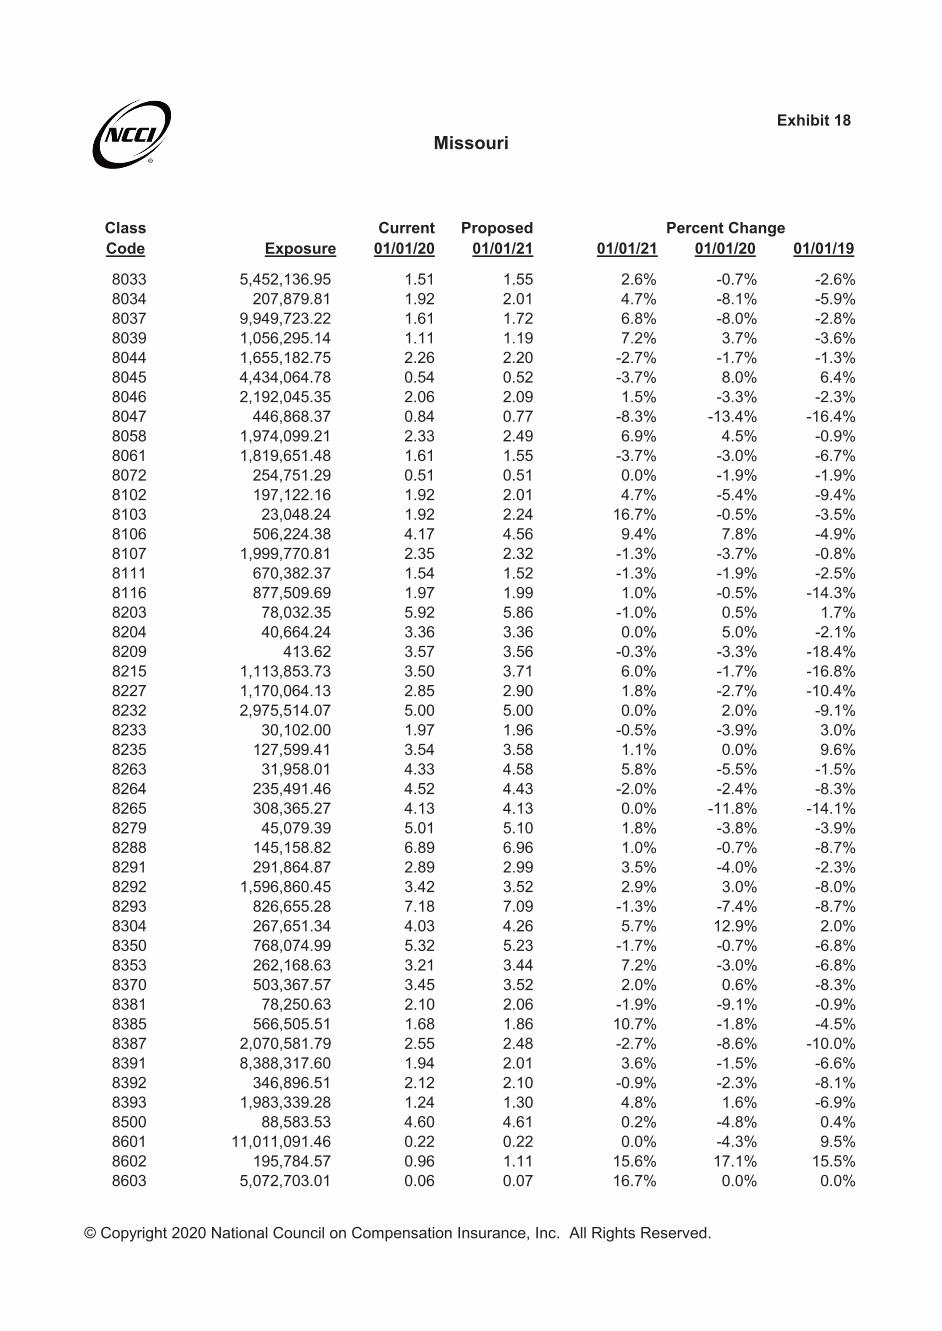
Exhibit 18
Class Current Proposed Percent ChangeCode Exposure 01/01/20 01/01/21 01/01/21 01/01/20 01/01/19
Missouri
8033 5,452,136.95 1.51 1.55 2.6% -0.7% -2.6%8034 207,879.81 1.92 2.01 4.7% -8.1% -5.9%8037 9,949,723.22 1.61 1.72 6.8% -8.0% -2.8%8039 1,056,295.14 1.11 1.19 7.2% 3.7% -3.6%8044 1,655,182.75 2.26 2.20 -2.7% -1.7% -1.3%8045 4,434,064.78 0.54 0.52 -3.7% 8.0% 6.4%8046 2,192,045.35 2.06 2.09 1.5% -3.3% -2.3%8047 446,868.37 0.84 0.77 -8.3% -13.4% -16.4%8058 1,974,099.21 2.33 2.49 6.9% 4.5% -0.9%8061 1,819,651.48 1.61 1.55 -3.7% -3.0% -6.7%8072 254,751.29 0.51 0.51 0.0% -1.9% -1.9%8102 197,122.16 1.92 2.01 4.7% -5.4% -9.4%8103 23,048.24 1.92 2.24 16.7% -0.5% -3.5%8106 506,224.38 4.17 4.56 9.4% 7.8% -4.9%8107 1,999,770.81 2.35 2.32 -1.3% -3.7% -0.8%8111 670,382.37 1.54 1.52 -1.3% -1.9% -2.5%8116 877,509.69 1.97 1.99 1.0% -0.5% -14.3%8203 78,032.35 5.92 5.86 -1.0% 0.5% 1.7%8204 40,664.24 3.36 3.36 0.0% 5.0% -2.1%8209 413.62 3.57 3.56 -0.3% -3.3% -18.4%8215 1,113,853.73 3.50 3.71 6.0% -1.7% -16.8%8227 1,170,064.13 2.85 2.90 1.8% -2.7% -10.4%8232 2,975,514.07 5.00 5.00 0.0% 2.0% -9.1%8233 30,102.00 1.97 1.96 -0.5% -3.9% 3.0%8235 127,599.41 3.54 3.58 1.1% 0.0% 9.6%8263 31,958.01 4.33 4.58 5.8% -5.5% -1.5%8264 235,491.46 4.52 4.43 -2.0% -2.4% -8.3%8265 308,365.27 4.13 4.13 0.0% -11.8% -14.1%8279 45,079.39 5.01 5.10 1.8% -3.8% -3.9%8288 145,158.82 6.89 6.96 1.0% -0.7% -8.7%8291 291,864.87 2.89 2.99 3.5% -4.0% -2.3%8292 1,596,860.45 3.42 3.52 2.9% 3.0% -8.0%8293 826,655.28 7.18 7.09 -1.3% -7.4% -8.7%8304 267,651.34 4.03 4.26 5.7% 12.9% 2.0%8350 768,074.99 5.32 5.23 -1.7% -0.7% -6.8%8353 262,168.63 3.21 3.44 7.2% -3.0% -6.8%8370 503,367.57 3.45 3.52 2.0% 0.6% -8.3%8381 78,250.63 2.10 2.06 -1.9% -9.1% -0.9%8385 566,505.51 1.68 1.86 10.7% -1.8% -4.5%8387 2,070,581.79 2.55 2.48 -2.7% -8.6% -10.0%8391 8,388,317.60 1.94 2.01 3.6% -1.5% -6.6%8392 346,896.51 2.12 2.10 -0.9% -2.3% -8.1%8393 1,983,339.28 1.24 1.30 4.8% 1.6% -6.9%8500 88,583.53 4.60 4.61 0.2% -4.8% 0.4%8601 11,011,091.46 0.22 0.22 0.0% -4.3% 9.5%8602 195,784.57 0.96 1.11 15.6% 17.1% 15.5%8603 5,072,703.01 0.06 0.07 16.7% 0.0% 0.0%
© Copyright 2020 National Council on Compensation Insurance, Inc. All Rights Reserved.

Exhibit 18
Class Current Proposed Percent ChangeCode Exposure 01/01/20 01/01/21 01/01/21 01/01/20 01/01/19
Missouri
8606 2,039.03 1.69 1.68 -0.6% -5.1% -7.3%8709 735.71 4.35 4.12 -5.3% -0.2% 4.8%8719 1,352.52 1.76 1.73 -1.7% -7.9% -9.5%8720 1,063,427.10 1.04 1.02 -1.9% -12.6% -15.6%8721 254,205.00 0.25 0.26 4.0% 0.0% 0.0%8723 20,034,704.33 0.14 0.14 0.0% 0.0% -6.7%8725 13,373.47 1.99 2.05 3.0% 6.4% 2.2%8726 3,814.15 1.78 1.82 2.2% -5.3% 1.1%8728 483,232.22 0.37 0.41 10.8% 8.8% 9.7%8734 0.00 0.32 0.34 6.3% -5.9% -10.5%8737 0.00 0.29 0.30 3.4% -3.3% -11.8%8738 0.00 0.49 0.56 14.3% 16.7% -2.3%8742 62,480,615.68 0.24 0.25 4.2% -4.0% -10.7%8745 14,176.88 3.49 3.19 -8.6% -15.7% -11.0%8748 3,342,328.30 0.49 0.51 4.1% -5.8% -8.8%8755 604,626.60 0.31 0.30 -3.2% -16.2% -22.9%8799 247,646.32 0.35 0.36 2.9% -14.6% -10.9%8800 414,247.20 1.23 1.21 -1.6% -5.4% 2.4%8803 20,776,387.85 0.06 0.05 -16.7% 0.0% -14.3%8805 0.00 0.15 0.15 0.0% -6.3% -11.1%8810 266,583,996.58 0.11 0.11 0.0% -8.3% -7.7%8814 0.00 0.13 0.13 0.0% -13.3% -6.3%8815 0.00 0.23 0.24 4.3% 15.0% 0.0%8820 12,553,533.10 0.13 0.11 -15.4% -7.1% -6.7%8824 1,462,372.67 1.88 1.91 1.6% -19.0% -1.7%8826 1,370,393.57 1.74 1.87 7.5% 7.4% -6.4%8831 2,668,225.84 1.14 1.14 0.0% -0.9% -9.4%8832 39,494,428.56 0.23 0.23 0.0% -8.0% 0.0%8833 19,708,990.48 1.04 1.07 2.9% 4.0% -1.0%8835 5,932,084.12 1.76 1.74 -1.1% -7.4% -2.6%8855 28,781,844.22 0.14 0.14 0.0% -6.7% -6.3%8856 396,927.54 0.30 0.36 20.0% 15.4% 13.0%8861 5,866,338.59 1.14 1.25 9.6% -1.7% -1.7%8868 36,697,133.22 0.38 0.39 2.6% 2.7% 0.0%8869 3,463,126.54 0.89 0.89 0.0% 0.0% -8.2%8871 3,116,084.24 0.06 0.06 0.0% -14.3% 0.0%8901 10,920,540.51 0.17 0.16 -5.9% -5.6% 0.0%9012 4,699,112.20 0.77 0.71 -7.8% -9.4% -17.5%9014 4,999,681.50 2.43 2.27 -6.6% 7.0% -1.7%9015 3,923,390.16 2.66 2.73 2.6% -0.7% 4.7%9016 431,316.45 2.85 2.83 -0.7% 4.0% 4.2%9019 2,998.29 1.80 1.94 7.8% 17.6% 19.5%9033 316,270.85 1.73 1.71 -1.2% 4.2% 1.8%9040 873,195.69 3.29 3.38 2.7% 1.2% -2.1%9044 1,641,392.12 0.88 0.90 2.3% 0.0% -6.4%9052 4,595,054.75 1.71 1.66 -2.9% 0.6% -1.2%9058 1,040,888.20 1.33 1.39 4.5% -5.7% -6.6%
© Copyright 2020 National Council on Compensation Insurance, Inc. All Rights Reserved.

Exhibit 18
Class Current Proposed Percent ChangeCode Exposure 01/01/20 01/01/21 01/01/21 01/01/20 01/01/19
Missouri
9060 1,420,876.48 1.06 1.12 5.7% -4.5% -2.6%9061 322,766.71 1.30 1.25 -3.8% -10.3% -12.7%9062 92,644.26 1.16 1.20 3.4% -9.4% -9.2%9063 2,262,010.25 0.69 0.76 10.1% -4.2% -6.5%9077 0.00 2.42 2.43 0.4% -0.4% 7.0%9082 16,479,495.29 1.11 1.12 0.9% -3.5% -2.5%9083 11,831,285.48 0.91 0.97 6.6% -1.1% -2.1%9084 848,645.57 1.12 1.16 3.6% -6.7% -7.7%9089 3,010.57 0.99 0.94 -5.1% -4.8% -7.1%9093 232,462.53 1.23 1.16 -5.7% -2.4% -14.3%9101 2,697,997.39 3.13 3.36 7.3% -6.8% -2.6%9102 2,435,098.18 2.50 2.48 -0.8% -7.7% 5.9%9110 904,154.86 2.62 2.52 -3.8% -7.1% -5.7%9154 1,030,761.28 1.47 1.63 10.9% 5.0% -2.8%9156 420,251.07 2.10 2.19 4.3% 2.9% 6.3%9170 40,967.63 10.34 10.85 4.9% 6.8% 1.5%9178 111,418.25 10.14 10.32 1.8% -5.9% -1.7%9179 89,249.84 17.37 17.95 3.3% 2.5% -1.7%9180 211,831.19 3.85 3.87 0.5% -2.5% 17.6%9182 526,653.57 1.67 1.75 4.8% 2.5% -4.7%9186 25,616.87 14.81 13.02 -12.1% -12.1% 1.0%9220 179,998.00 3.45 3.53 2.3% -4.7% 0.0%9402 525,602.87 3.87 4.17 7.8% 1.6% 2.4%9403 1,385,486.22 6.79 6.87 1.2% 3.2% 6.1%9410 210,688.80 2.63 2.71 3.0% -4.4% -8.3%9501 238,258.64 2.84 2.99 5.3% 0.4% -2.4%9505 95,533.48 3.98 3.87 -2.8% -0.3% 10.2%9516 465,572.41 2.63 2.35 -10.6% -14.3% -12.5%9519 474,050.21 3.15 3.34 6.0% -4.5% 2.8%9521 183,284.40 3.29 3.45 4.9% -6.8% -8.8%9522 354,200.43 3.60 4.35 20.8% 16.9% 3.7%9534 169,393.73 4.02 3.99 -0.7% -3.6% -5.2%9554 186,347.79 7.50 7.40 -1.3% -6.7% -10.8%9586 1,620,778.18 0.48 0.48 0.0% -4.0% -13.8%9600 7,855.38 2.96 3.17 7.1% 4.6% 1.4%9620 527,209.09 1.01 1.05 4.0% -1.0% -7.3%
Total 0.8% -1.8% -3.7%
© Copyright 2020 National Council on Compensation Insurance, Inc. All Rights Reserved.
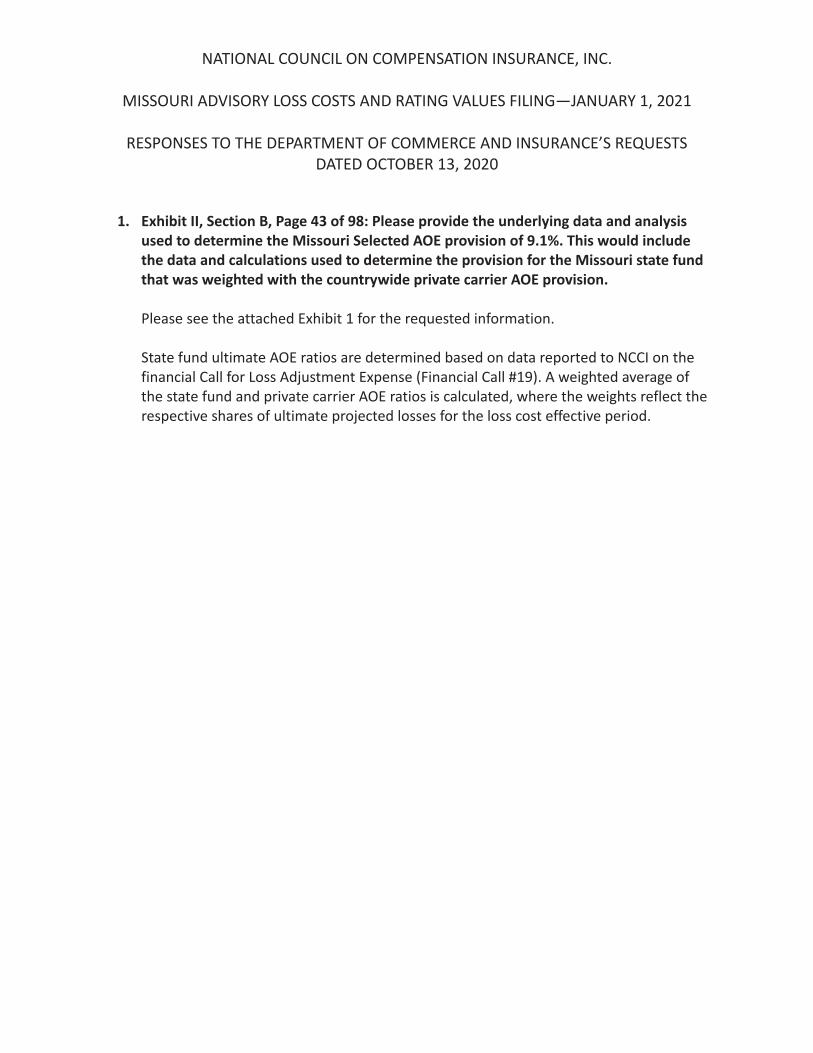
NATIONAL COUNCIL ON COMPENSATION INSURANCE, INC.
MISSOURI ADVISORY LOSS COSTS AND RATING VALUES FILING—JANUARY 1, 2021
RESPONSES TO THE DEPARTMENT OF COMMERCE AND INSURANCE’S REQUESTS DATED OCTOBER 13, 2020
1. Exhibit II, Section B, Page 43 of 98: Please provide the underlying data and analysis used to determine the Missouri Selected AOE provision of 9.1%. This would include the data and calculations used to determine the provision for the Missouri state fund that was weighted with the countrywide private carrier AOE provision. Please see the attached Exhibit 1 for the requested information. State fund ultimate AOE ratios are determined based on data reported to NCCI on the financial Call for Loss Adjustment Expense (Financial Call #19). A weighted average of the state fund and private carrier AOE ratios is calculated, where the weights reflect the respective shares of ultimate projected losses for the loss cost effective period.

Exhibit 1MissouriDerivation of the Adjusting and Other Expense (AOE) Provision
(1) (2) (3) = [(1)+(2)]/2 (4) (5) (6) = [(4)+(5)]/2Ultimate AOE Ultimate AOE Average Ultimate AOE Ultimate AOE Average
Ratio Based on Ratio Based on Ultimate AOE Ratio Based on Ratio Based on Ultimate AOEAY Paid Data Incurred Data Ratio Paid Data Incurred Data Ratio2015 7.8% 7.8% 7.8% 10.6% 9.9% 10.3%2016 8.3% 8.2% 8.3% 9.7% 9.1% 9.4%2017 8.9% 8.8% 8.9% 9.3% 8.5% 8.9%2018 8.8% 8.8% 8.8% 9.6% 9.3% 9.5%2019 9.0% 8.8% 8.9% 10.5% 10.5% 10.5%
(7) Selected AOE ratio 8.9% 9.7%
(8) Weights 71% 29%
(9) Weighted-average AOE ratio = (0.089 x 0.71) + (0.097 x 0.29) = 9.1%
© Copyright 2020 National Council on Compensation Insurance Inc. All Rights Reserved.
Private Carrier State Fund

NATIONAL COUNCIL ON COMPENSATION INSURANCE, INC.
MISSOURI ADVISORY LOSS COSTS AND RATING VALUES FILING—JANUARY 1, 2021
RESPONSE TO THE DEPARTMENT OF COMMERCE AND INSURANCE’S REQUEST DATED OCTOBER 20, 2020
1. Please explain why the Average Ultimate AOE Ratios provided in the response to the objection dated October 13, 2020 do not equal the AOE ratios in Exhibit II on page 43 of the filing. Please refer to Response 8 in connection with the objection letter dated September 28, 2020. Exhibit 8 provided in response to that prior request contains the calculations underlying the new AOE methodology proposed with this year’s filing. Note that the historical countrywide AOE values shown for years 2015 through 2018 on page 43 of the filing are based on the current AOE methodology. The countrywide selected AOE provision shown on page 43 of the filing is based on the five years of AOE indications shown in the previously provided Exhibit 8. These five years of AOE indications are also reflected in the supporting calculations provided in response to the objection letter dated October 13, 2020.

ATTACHMENT BPROPOSED AND CURRENT LOSS COSTS BY CLASS CODE

NCCI Missouri Loss Cost Filing Effective January 1, 2021Analysis of the Absolute Loss Cost Change from Loss Costs that are Effective from January 1, 2018 to January 1, 2021 Sorted by 2018 Payroll
SwingLoss Cost Percent Change Loss Cost Absolute Max Min Payroll (100's)
Class Code 2018 2019 2020 2021 2019 2020 2021 Coef. Var Change Change 2017 20188810 0.13 0.12 0.11 0.11 7.7% 8.3% 0.0% 0.08 16.67% 8.3% 255,211,347 266,583,9978742 0.28 0.25 0.24 0.25 10.7% 4.0% 4.2% 0.07 19.94% 14.9% 60,950,716 62,480,6168832 0.25 0.25 0.23 0.23 0.0% 8.0% 0.0% 0.05 8.00% 8.0% 36,664,231 39,494,4298868 0.37 0.37 0.38 0.39 0.0% 2.7% 2.6% 0.03 5.41% 2.7% 35,525,434 36,697,1338855 0.16 0.15 0.14 0.14 6.3% 6.7% 0.0% 0.06 13.33% 6.7% 25,075,510 28,781,8448803 0.07 0.06 0.06 0.05 14.3% 0.0% 16.7% 0.14 33.33% 16.7% 18,065,042 20,776,3888723 0.15 0.14 0.14 0.14 6.7% 0.0% 0.0% 0.04 6.67% 6.7% 19,563,323 20,034,7048833 1.01 1.00 1.04 1.07 1.0% 4.0% 2.9% 0.03 8.06% 5.0% 18,604,651 19,708,9909082 1.18 1.15 1.11 1.12 2.5% 3.5% 0.9% 0.03 7.07% 4.4% 15,779,625 16,479,4957219 6.49 6.54 6.43 6.38 0.8% 1.7% 0.8% 0.01 3.26% 2.5% 12,166,683 12,624,4908820 0.15 0.14 0.13 0.11 6.7% 7.1% 15.4% 0.13 31.87% 8.7% 12,575,621 12,553,5339083 0.94 0.92 0.91 0.97 2.1% 1.1% 6.6% 0.03 10.04% 8.7% 11,249,827 11,831,2858601 0.21 0.23 0.22 0.22 9.5% 4.3% 0.0% 0.04 14.29% 13.9% 10,878,465 11,011,0918901 0.18 0.18 0.17 0.16 0.0% 5.6% 5.9% 0.06 11.76% 5.9% 11,414,928 10,920,5418037 1.80 1.75 1.61 1.72 2.8% 8.0% 6.8% 0.05 18.58% 14.8% 9,810,553 9,949,7233830 0.68 0.71 0.70 0.70 4.4% 1.4% 0.0% 0.02 5.88% 5.8% 9,096,560 9,338,7748017 1.41 1.38 1.31 1.28 2.1% 5.1% 2.3% 0.04 9.77% 2.9% 8,750,505 9,161,5848391 2.11 1.97 1.94 2.01 6.6% 1.5% 3.6% 0.04 12.17% 10.2% 7,833,459 8,388,3188835 1.95 1.90 1.76 1.74 2.6% 7.4% 1.1% 0.06 11.37% 6.2% 5,714,031 5,932,0848861 1.18 1.16 1.14 1.25 1.7% 1.7% 9.6% 0.04 13.43% 11.4% 5,358,532 5,866,3398018 2.15 2.12 2.19 2.31 1.4% 3.3% 5.5% 0.04 10.48% 6.9% 5,246,371 5,668,3365606 1.16 1.15 1.10 1.12 0.9% 4.3% 1.8% 0.02 7.16% 6.2% 5,198,512 5,466,7318033 1.56 1.52 1.51 1.55 2.6% 0.7% 2.6% 0.02 5.97% 5.2% 5,774,305 5,452,1375190 2.57 2.50 2.50 2.49 2.7% 0.0% 0.4% 0.01 3.13% 2.7% 5,150,803 5,343,2388603 0.06 0.06 0.06 0.07 0.0% 0.0% 16.7% 0.08 16.67% 16.7% 4,584,789 5,072,7037380 4.35 4.27 4.26 4.45 1.8% 0.2% 4.5% 0.02 6.63% 6.3% 4,660,879 5,031,5993076 2.82 2.86 3.00 2.99 1.4% 4.9% 0.3% 0.03 6.74% 5.2% 5,081,301 5,007,8219014 2.31 2.27 2.43 2.27 1.7% 7.0% 6.6% 0.03 16.07% 13.6% 4,710,137 4,999,6829012 1.03 0.85 0.77 0.71 17.5% 9.4% 7.8% 0.17 38.55% 9.7% 4,769,208 4,699,1129052 1.72 1.70 1.71 1.66 1.2% 0.6% 2.9% 0.02 4.73% 3.5% 4,041,664 4,595,0554484 2.43 2.35 2.47 2.65 3.3% 5.1% 7.3% 0.05 16.48% 10.6% 4,004,186 4,585,1578045 0.47 0.50 0.54 0.52 6.4% 8.0% 3.7% 0.06 19.15% 11.7% 4,541,227 4,434,0655183 3.02 2.75 2.65 2.59 8.9% 3.6% 2.3% 0.07 15.46% 6.7% 4,282,023 4,403,4816504 2.27 2.31 2.29 2.25 1.8% 0.9% 1.7% 0.01 4.44% 3.5% 3,686,151 4,309,7223632 3.07 2.86 2.80 2.81 6.8% 2.1% 0.4% 0.04 9.47% 7.2% 3,679,662 4,028,3329015 2.56 2.68 2.66 2.73 4.7% 0.7% 2.6% 0.03 8.24% 5.4% 3,729,910 3,923,3905537 3.69 3.53 3.83 3.66 4.3% 8.5% 4.4% 0.03 18.23% 12.9% 3,534,958 3,906,3677720 2.58 2.47 2.53 2.71 4.3% 2.4% 7.1% 0.04 14.39% 11.4% 3,432,603 3,694,7168008 0.91 0.86 0.88 0.91 5.5% 2.3% 3.4% 0.03 11.63% 8.9% 3,667,061 3,637,1198869 0.97 0.89 0.89 0.89 8.2% 0.0% 0.0% 0.04 8.25% 8.2% 3,318,827 3,463,1275191 0.67 0.65 0.66 0.69 3.0% 1.5% 4.5% 0.03 9.32% 7.5% 3,463,112 3,400,4878748 0.57 0.52 0.49 0.51 8.8% 5.8% 4.1% 0.07 19.74% 12.9% 3,211,586 3,342,3287600 3.14 3.11 3.04 3.14 1.0% 2.3% 3.3% 0.02 6.62% 5.5% 3,544,445 3,320,3633681 0.81 0.77 0.73 0.72 4.9% 5.2% 1.4% 0.05 11.90% 3.8% 2,446,154 3,200,6604511 0.36 0.39 0.41 0.40 8.3% 5.1% 2.4% 0.06 16.67% 10.8% 3,512,990 3,168,5428871 0.07 0.07 0.06 0.06 0.0% 14.3% 0.0% 0.09 14.29% 14.3% 2,456,877 3,116,0844611 1.04 0.99 0.98 1.07 4.8% 1.0% 9.2% 0.04 15.59% 14.0% 3,157,722 3,066,9418232 5.39 4.90 5.00 5.00 9.1% 2.0% 0.0% 0.04 11.32% 11.1% 2,831,565 2,975,5145403 5.51 5.12 4.98 4.92 7.1% 2.7% 1.2% 0.05 11.33% 5.9% 2,787,745 2,937,9417610 0.36 0.37 0.39 0.41 2.8% 5.4% 5.1% 0.06 13.89% 2.6% 2,660,830 2,845,3445221 3.95 3.79 3.94 4.15 4.1% 4.0% 5.3% 0.04 13.93% 9.4% 2,685,246 2,795,0218006 1.62 1.61 1.58 1.60 0.6% 1.9% 1.3% 0.01 3.79% 3.1% 2,635,938 2,778,1628010 1.75 1.56 1.53 1.60 10.9% 1.9% 4.6% 0.06 18.16% 15.4% 2,634,299 2,742,8189101 3.45 3.36 3.13 3.36 2.6% 6.8% 7.3% 0.04 17.69% 14.2% 2,644,715 2,697,9978831 1.27 1.15 1.14 1.14 9.4% 0.9% 0.0% 0.05 10.40% 9.4% 2,526,353 2,668,2263724 3.84 3.27 3.20 3.19 14.8% 2.1% 0.3% 0.09 17.67% 14.5% 2,544,942 2,542,4699102 2.56 2.71 2.50 2.48 5.9% 7.7% 0.8% 0.04 14.98% 13.6% 2,248,866 2,435,0986217 4.18 3.84 3.40 3.15 8.1% 11.5% 7.4% 0.13 29.39% 4.1% 2,323,776 2,377,4605645 9.27 8.92 9.19 8.95 3.8% 3.0% 2.6% 0.02 9.71% 6.8% 2,236,385 2,302,360

NCCI Missouri Loss Cost Filing Effective January 1, 2021Analysis of the Absolute Loss Cost Change from Loss Costs that are Effective from January 1, 2018 to January 1, 2021 Sorted by 2018 Payroll
SwingLoss Cost Percent Change Loss Cost Absolute Max Min Payroll (100's)
Class Code 2018 2019 2020 2021 2019 2020 2021 Coef. Var Change Change 2017 20184299 2.21 2.13 2.07 1.96 3.6% 2.8% 5.3% 0.05 12.20% 2.5% 2,380,979 2,263,9429063 0.77 0.72 0.69 0.76 6.5% 4.2% 10.1% 0.05 22.18% 16.6% 2,271,633 2,262,0108046 2.18 2.13 2.06 2.09 2.3% 3.3% 1.5% 0.02 7.19% 4.7% 2,219,568 2,192,0452089 3.43 3.33 3.17 3.13 2.9% 4.8% 1.3% 0.04 9.22% 3.5% 1,986,321 2,186,5444825 0.76 0.72 0.72 0.72 5.3% 0.0% 0.0% 0.03 5.26% 5.3% 2,061,898 2,183,2007403 4.40 3.93 3.88 4.26 10.7% 1.3% 9.8% 0.06 23.07% 20.5% 2,042,578 2,146,3308387 3.10 2.79 2.55 2.48 10.0% 8.6% 2.7% 0.10 22.74% 7.3% 1,982,326 2,070,5828107 2.46 2.44 2.35 2.32 0.8% 3.7% 1.3% 0.03 5.87% 2.9% 1,818,342 1,999,7718393 1.31 1.22 1.24 1.30 6.9% 1.6% 4.8% 0.03 13.88% 11.7% 1,760,453 1,983,3398058 2.25 2.23 2.33 2.49 0.9% 4.5% 6.9% 0.05 12.65% 7.8% 1,902,765 1,974,0993643 2.20 2.18 2.41 2.68 0.9% 10.6% 11.2% 0.10 24.05% 12.1% 1,329,683 1,935,0983179 2.21 2.04 2.01 2.08 7.7% 1.5% 3.5% 0.04 13.08% 11.2% 1,643,733 1,922,4095474 5.48 5.06 4.73 4.75 7.7% 6.5% 0.4% 0.07 15.17% 8.1% 1,933,498 1,918,3135506 4.82 4.56 4.68 4.62 5.4% 2.6% 1.3% 0.02 9.55% 8.0% 1,835,083 1,910,7028061 1.78 1.66 1.61 1.55 6.7% 3.0% 3.7% 0.06 14.05% 3.7% 1,776,589 1,819,6515445 4.62 4.42 4.38 3.97 4.3% 0.9% 9.4% 0.06 15.13% 8.5% 1,805,940 1,792,9452095 2.85 2.87 3.23 3.42 0.7% 12.5% 5.9% 0.09 20.00% 11.8% 1,663,499 1,714,7514829 1.03 1.06 1.07 1.11 2.9% 0.9% 3.7% 0.03 7.77% 2.8% 1,431,459 1,668,0288044 2.33 2.30 2.26 2.20 1.3% 1.7% 2.7% 0.02 5.78% 1.4% 1,590,757 1,655,1839044 0.94 0.88 0.88 0.90 6.4% 0.0% 2.3% 0.03 8.80% 8.7% 2,539,398 1,641,3929586 0.58 0.50 0.48 0.48 13.8% 4.0% 0.0% 0.09 18.34% 13.8% 1,586,477 1,620,7788292 3.61 3.32 3.42 3.52 8.0% 3.0% 2.9% 0.04 14.54% 11.0% 1,465,865 1,596,8605213 6.22 6.06 5.39 4.86 2.6% 11.1% 9.8% 0.11 25.11% 8.5% 1,389,996 1,493,2123574 1.80 2.09 1.72 2.08 16.1% 17.7% 20.9% 0.10 65.27% 38.6% 513,164 1,467,7378824 2.36 2.32 1.88 1.91 1.7% 19.0% 1.6% 0.12 22.91% 20.6% 1,295,292 1,462,3733113 1.85 1.85 1.76 1.64 0.0% 4.9% 6.8% 0.06 12.01% 6.8% 1,426,505 1,438,3439060 1.14 1.11 1.06 1.12 2.6% 4.5% 5.7% 0.03 13.33% 10.2% 1,341,056 1,420,8764410 2.82 2.95 2.88 3.06 4.6% 2.4% 6.3% 0.04 13.79% 8.6% 1,310,351 1,404,2409403 6.20 6.58 6.79 6.87 6.1% 3.2% 1.2% 0.05 10.81% 5.0% 1,342,733 1,385,4867382 4.42 4.32 4.07 4.14 2.3% 5.8% 1.7% 0.04 10.04% 7.5% 1,327,485 1,371,3598826 1.73 1.62 1.74 1.87 6.4% 7.4% 7.5% 0.06 22.77% 13.8% 732,634 1,370,3944828 2.13 1.96 1.82 1.94 8.0% 7.1% 6.6% 0.07 23.32% 14.6% 1,170,027 1,365,0402883 2.90 2.96 2.83 2.74 2.1% 4.4% 3.2% 0.03 9.94% 6.5% 1,273,831 1,362,0813685 1.37 1.22 1.16 1.09 10.9% 4.9% 6.0% 0.10 23.43% 6.0% 1,395,129 1,357,6028013 0.34 0.32 0.32 0.34 5.9% 0.0% 6.3% 0.03 12.50% 12.1% 1,397,188 1,338,7645437 3.77 3.91 4.04 4.45 3.7% 3.3% 10.1% 0.07 18.04% 6.8% 1,306,098 1,329,6605022 5.47 5.46 5.46 5.66 0.2% 0.0% 3.7% 0.02 3.85% 3.8% 1,295,269 1,286,6167710 4.00 4.06 4.08 4.12 1.5% 0.5% 1.0% 0.01 3.00% 1.0% 1,085,275 1,245,5207705 3.36 3.83 3.76 3.79 14.0% 1.8% 0.8% 0.06 17.00% 15.8% 1,095,461 1,214,7078227 3.27 2.93 2.85 2.90 10.4% 2.7% 1.8% 0.06 15.40% 12.2% 1,122,259 1,170,0643647 2.48 2.49 2.49 2.76 0.4% 0.0% 10.8% 0.05 11.29% 10.8% 1,110,849 1,135,1402501 2.26 2.35 2.45 2.53 4.0% 4.3% 3.3% 0.05 11.95% 1.0% 1,077,937 1,113,9768215 4.28 3.56 3.50 3.71 16.8% 1.7% 6.0% 0.09 25.92% 22.8% 1,009,787 1,113,8544459 2.42 2.29 2.40 2.39 5.4% 4.8% 0.4% 0.02 10.89% 10.2% 793,725 1,103,4933400 4.18 4.09 4.20 4.31 2.2% 2.7% 2.6% 0.02 7.65% 4.8% 1,326,392 1,078,3202585 3.13 3.14 3.08 2.94 0.3% 1.9% 4.5% 0.03 6.88% 4.9% 964,313 1,070,4794244 2.63 2.36 2.32 2.48 10.3% 1.7% 6.9% 0.06 19.87% 17.2% 897,624 1,065,5068720 1.41 1.19 1.04 1.02 15.6% 12.6% 1.9% 0.15 32.68% 13.7% 1,022,911 1,063,4278039 1.11 1.07 1.11 1.19 3.6% 3.7% 7.2% 0.04 15.22% 10.8% 1,152,381 1,056,2959058 1.51 1.41 1.33 1.39 6.6% 5.7% 4.5% 0.05 17.75% 11.1% 1,016,126 1,040,8889154 1.44 1.40 1.47 1.63 2.8% 5.0% 10.9% 0.07 19.66% 13.7% 930,979 1,030,7617520 3.50 3.02 2.78 2.55 13.7% 7.9% 8.3% 0.14 32.91% 5.8% 859,352 1,023,7622070 4.31 4.03 3.91 3.86 6.5% 3.0% 1.3% 0.05 11.07% 5.2% 531,989 996,7945535 6.10 5.43 5.36 5.52 11.0% 1.3% 3.0% 0.06 15.77% 14.0% 1,004,638 964,3967605 1.85 1.70 1.66 1.66 8.1% 2.4% 0.0% 0.05 10.65% 8.1% 935,580 953,7943629 1.76 1.62 1.51 1.48 8.0% 6.8% 2.0% 0.08 17.58% 6.0% 888,991 933,3293824 4.84 4.59 4.04 3.91 5.2% 12.0% 3.2% 0.10 21.56% 8.8% 778,106 921,8846834 3.59 3.40 3.09 2.62 5.3% 9.1% 15.2% 0.13 32.37% 9.9% 377,822 913,3229110 2.99 2.82 2.62 2.52 5.7% 7.1% 3.8% 0.08 17.50% 3.3% 805,703 904,155

NCCI Missouri Loss Cost Filing Effective January 1, 2021Analysis of the Absolute Loss Cost Change from Loss Costs that are Effective from January 1, 2018 to January 1, 2021 Sorted by 2018 Payroll
SwingLoss Cost Percent Change Loss Cost Absolute Max Min Payroll (100's)
Class Code 2018 2019 2020 2021 2019 2020 2021 Coef. Var Change Change 2017 20187405 1.21 1.26 1.19 1.22 4.1% 5.6% 2.5% 0.02 12.69% 9.7% 832,298 891,3143507 2.40 2.41 2.57 2.59 0.4% 6.6% 0.8% 0.04 7.92% 6.2% 809,408 890,3241164 4.64 4.59 4.39 4.25 1.1% 4.4% 3.2% 0.04 8.85% 3.3% 628,282 880,8438116 2.31 1.98 1.97 1.99 14.3% 0.5% 1.0% 0.08 16.03% 15.3% 832,412 877,5109040 3.32 3.25 3.29 3.38 2.1% 1.2% 2.7% 0.02 6.19% 4.8% 834,652 873,1961624 3.71 3.33 2.90 2.46 10.2% 12.9% 15.2% 0.17 43.36% 4.9% 865,153 866,7594720 1.69 1.78 1.93 2.05 5.3% 8.4% 6.2% 0.09 21.30% 3.1% 1,172,580 862,0400083 4.50 4.55 4.34 4.25 1.1% 4.6% 2.1% 0.03 7.97% 5.7% 791,132 856,8821701 3.38 3.10 3.08 2.94 8.3% 0.6% 4.5% 0.06 13.94% 7.6% 772,916 856,5109084 1.30 1.20 1.12 1.16 7.7% 6.7% 3.6% 0.06 18.97% 11.3% 759,618 848,6463030 4.13 4.25 4.32 4.48 2.9% 1.6% 3.7% 0.03 8.47% 2.1% 785,052 839,1458293 8.49 7.75 7.18 7.09 8.7% 7.4% 1.3% 0.08 18.17% 7.5% 881,264 826,6552121 1.47 1.28 1.18 1.26 12.9% 7.8% 6.8% 0.09 30.00% 19.7% 798,918 816,2185551 15.17 13.75 13.67 14.25 9.4% 0.6% 4.2% 0.05 14.66% 13.6% 867,605 813,6207538 5.39 5.51 5.13 5.10 2.2% 6.9% 0.6% 0.04 9.92% 9.1% 759,145 781,6498350 5.75 5.36 5.32 5.23 6.8% 0.7% 1.7% 0.04 9.40% 6.0% 717,830 768,0754361 0.86 0.76 0.71 0.67 11.6% 6.6% 5.6% 0.11 25.67% 6.0% 757,031 746,3092014 3.98 4.50 4.52 4.62 13.1% 0.4% 2.2% 0.07 16.08% 12.6% 698,213 740,9662003 3.64 3.63 3.52 3.65 0.3% 3.0% 3.7% 0.02 7.13% 6.7% 540,593 738,2833612 2.14 2.01 1.97 1.96 6.1% 2.0% 0.5% 0.04 8.73% 5.6% 790,319 725,5830106 6.18 6.78 7.12 6.74 9.7% 5.0% 5.3% 0.06 21.36% 15.0% 733,553 721,9942157 6.56 6.25 5.97 5.32 4.7% 4.5% 10.9% 0.09 21.33% 6.4% 678,966 709,3160042 6.19 5.34 5.32 5.69 13.7% 0.4% 7.0% 0.07 22.10% 20.7% 657,098 677,1735348 4.59 3.88 3.73 3.50 15.5% 3.9% 6.2% 0.12 27.33% 11.6% 607,208 676,2638111 1.61 1.57 1.54 1.52 2.5% 1.9% 1.3% 0.03 5.80% 1.2% 707,498 670,3824273 2.48 2.32 2.27 2.34 6.5% 2.2% 3.1% 0.04 12.10% 9.5% 644,283 644,7404452 2.79 2.73 2.59 2.47 2.2% 5.1% 4.6% 0.05 12.36% 3.0% 515,162 631,2433085 5.15 4.37 4.41 4.61 15.1% 0.9% 4.5% 0.08 21.47% 19.7% 644,461 624,7965478 6.18 5.57 5.05 4.41 9.9% 9.3% 12.7% 0.14 35.35% 3.3% 631,459 619,7358002 1.50 1.58 1.62 1.78 5.3% 2.5% 9.9% 0.07 18.67% 7.3% 683,403 614,7298755 0.48 0.37 0.31 0.30 22.9% 16.2% 3.2% 0.23 47.46% 19.7% 638,779 604,6276325 3.24 3.06 2.83 2.80 5.6% 7.5% 1.1% 0.07 14.69% 6.5% 544,279 601,5938385 1.79 1.71 1.68 1.86 4.5% 1.8% 10.7% 0.05 17.69% 15.2% 582,277 566,5066319 4.12 3.63 3.42 3.30 11.9% 5.8% 3.5% 0.10 22.52% 8.4% 597,604 555,8675188 2.51 2.50 2.64 2.58 0.4% 5.6% 2.3% 0.03 8.43% 7.9% 562,891 548,1963620 3.67 3.68 3.69 3.64 0.3% 0.3% 1.4% 0.01 1.91% 1.6% 523,729 546,8395192 2.16 2.13 2.19 2.55 1.4% 2.8% 16.4% 0.09 21.38% 17.8% 547,627 545,0027539 2.50 2.05 1.69 1.62 18.0% 17.6% 4.1% 0.21 44.47% 13.9% 521,686 536,7255215 5.08 4.89 4.87 4.86 3.7% 0.4% 0.2% 0.02 4.38% 3.5% 548,826 536,1784243 2.20 2.06 2.06 2.21 6.4% 0.0% 7.3% 0.04 14.11% 13.6% 490,558 528,6679620 1.10 1.02 1.01 1.05 7.3% 1.0% 4.0% 0.04 12.61% 11.2% 549,067 527,2099182 1.71 1.63 1.67 1.75 4.7% 2.5% 4.8% 0.03 12.38% 9.5% 450,631 526,6549402 3.72 3.81 3.87 4.17 2.4% 1.6% 7.8% 0.05 12.10% 6.2% 438,231 525,6037231 7.47 7.46 6.91 6.99 0.1% 7.4% 1.2% 0.04 8.76% 8.5% 428,051 518,1880037 3.30 3.25 3.02 2.99 1.5% 7.1% 1.0% 0.05 9.78% 6.1% 467,083 516,0318106 4.07 3.87 4.17 4.56 4.9% 7.8% 9.4% 0.07 23.62% 14.3% 464,766 506,2248370 3.74 3.43 3.45 3.52 8.3% 0.6% 2.0% 0.04 11.13% 10.3% 494,192 503,3686306 6.93 5.42 4.92 4.53 21.8% 9.2% 7.9% 0.19 43.57% 13.9% 450,582 496,7093634 1.59 1.65 1.54 1.50 3.8% 6.7% 2.6% 0.04 13.57% 10.4% 410,059 487,4928728 0.31 0.34 0.37 0.41 9.7% 8.8% 10.8% 0.12 32.26% 2.0% 463,191 483,2320034 2.02 2.25 2.41 2.62 11.4% 7.1% 8.7% 0.11 29.70% 4.3% 377,904 480,8509519 3.21 3.30 3.15 3.34 2.8% 4.5% 6.0% 0.03 13.96% 10.6% 464,515 474,0509516 3.51 3.07 2.63 2.35 12.5% 14.3% 10.6% 0.18 42.36% 3.7% 496,687 465,5724558 1.87 1.79 1.71 1.72 4.3% 4.5% 0.6% 0.04 9.58% 5.1% 441,207 460,4168047 1.16 0.97 0.84 0.77 16.4% 13.4% 8.3% 0.18 42.97% 8.0% 521,274 446,8683146 2.08 2.19 2.22 2.25 5.3% 1.4% 1.4% 0.03 8.17% 3.9% 445,040 444,9869016 2.63 2.74 2.85 2.83 4.2% 4.0% 0.7% 0.04 9.13% 4.9% 385,208 431,3162039 2.41 2.49 2.50 2.68 3.3% 0.4% 7.2% 0.05 11.20% 6.8% 433,000 427,4935160 2.38 2.16 2.02 1.96 9.2% 6.5% 3.0% 0.09 19.78% 6.3% 424,211 425,156

NCCI Missouri Loss Cost Filing Effective January 1, 2021Analysis of the Absolute Loss Cost Change from Loss Costs that are Effective from January 1, 2018 to January 1, 2021 Sorted by 2018 Payroll
SwingLoss Cost Percent Change Loss Cost Absolute Max Min Payroll (100's)
Class Code 2018 2019 2020 2021 2019 2020 2021 Coef. Var Change Change 2017 20189156 1.92 2.04 2.10 2.19 6.3% 2.9% 4.3% 0.05 14.06% 3.3% 383,059 420,2515102 5.84 5.49 5.20 4.96 6.0% 5.3% 4.6% 0.07 16.74% 1.4% 368,358 416,5298800 1.27 1.30 1.23 1.21 2.4% 5.4% 1.6% 0.03 9.63% 7.7% 349,466 414,2473257 2.44 2.50 2.47 2.48 2.5% 1.2% 0.4% 0.01 4.11% 3.7% 365,001 413,6772731 3.51 3.49 3.68 3.47 0.6% 5.4% 5.7% 0.03 12.10% 11.2% 394,027 409,3528021 3.03 2.83 2.67 2.69 6.6% 5.7% 0.7% 0.06 13.47% 7.3% 394,553 403,6844034 6.48 6.77 6.33 6.28 4.5% 6.5% 0.8% 0.03 12.14% 11.0% 382,878 398,0268001 1.77 1.74 1.88 1.95 1.7% 8.0% 3.7% 0.05 13.97% 9.7% 384,731 398,0208856 0.23 0.26 0.30 0.36 13.0% 15.4% 20.0% 0.20 56.52% 7.0% 388,287 396,9285146 4.65 4.56 4.38 4.46 1.9% 3.9% 1.8% 0.03 7.89% 5.8% 359,801 386,7558015 0.81 0.78 0.73 0.68 3.7% 6.4% 6.8% 0.08 17.91% 3.1% 381,701 375,4505057 4.08 3.69 3.66 4.34 9.6% 0.8% 18.6% 0.08 30.97% 28.1% 325,894 367,3827230 6.05 6.20 6.01 6.30 2.5% 3.1% 4.8% 0.02 10.72% 7.9% 281,679 366,2482111 2.16 2.15 2.06 1.98 0.5% 4.2% 3.9% 0.04 8.73% 3.7% 298,315 363,1527515 0.95 1.03 0.99 0.95 8.4% 3.9% 4.0% 0.04 17.18% 12.5% 332,705 357,4897390 6.59 5.19 4.84 4.54 21.2% 6.7% 6.2% 0.17 37.44% 15.0% 321,983 357,2919522 2.97 3.08 3.60 4.35 3.7% 16.9% 20.8% 0.18 46.46% 17.1% 468,363 354,2004635 3.19 3.01 2.94 2.77 5.6% 2.3% 5.8% 0.06 14.35% 3.5% 326,682 348,1788392 2.36 2.17 2.12 2.10 8.1% 2.3% 0.9% 0.05 11.58% 7.1% 323,614 346,8973300 3.84 3.92 3.93 4.28 2.1% 0.3% 8.9% 0.05 11.46% 8.7% 350,380 346,1897421 0.53 0.51 0.55 0.58 3.8% 7.8% 5.5% 0.06 18.02% 11.6% 311,890 345,8328032 1.84 1.74 1.70 1.75 5.4% 2.3% 2.9% 0.03 11.03% 8.4% 277,539 344,2974279 2.18 2.16 2.24 2.33 0.9% 3.7% 4.0% 0.03 8.86% 4.9% 306,460 341,1035462 5.39 5.37 4.99 4.67 0.4% 7.1% 6.4% 0.07 14.37% 6.7% 372,133 338,7067360 3.94 3.73 3.66 3.73 5.3% 1.9% 1.9% 0.03 9.36% 7.2% 249,567 336,7054771 2.36 2.51 2.52 2.52 6.4% 0.4% 0.0% 0.03 6.78% 6.4% 334,620 334,1433808 3.76 3.55 3.50 3.59 5.6% 1.4% 2.6% 0.03 9.83% 8.2% 303,619 326,2499061 1.66 1.45 1.30 1.25 12.7% 10.3% 3.8% 0.13 29.09% 8.8% 312,823 322,7672802 5.28 4.92 4.92 4.88 6.8% 0.0% 0.8% 0.04 7.69% 6.8% 302,048 322,2989033 1.63 1.66 1.73 1.71 1.8% 4.2% 1.2% 0.03 7.36% 5.4% 314,514 316,2712759 6.23 6.19 6.08 5.91 0.6% 1.8% 2.8% 0.02 5.29% 2.2% 283,849 315,6944114 3.68 3.29 3.11 3.11 10.6% 5.5% 0.0% 0.08 16.65% 10.6% 306,076 313,2067580 2.07 2.17 2.23 2.50 4.8% 2.8% 12.1% 0.08 20.77% 9.3% 292,739 310,3828265 5.45 4.68 4.13 4.13 14.1% 11.8% 0.0% 0.14 27.54% 14.1% 277,053 308,3657232 5.85 6.66 6.86 7.53 13.8% 3.0% 9.8% 0.10 28.72% 10.8% 287,516 308,0324583 3.78 3.95 4.08 4.43 4.5% 3.3% 8.6% 0.07 17.20% 5.3% 299,699 304,7543227 2.95 3.00 2.89 2.83 1.7% 3.7% 2.1% 0.03 7.61% 5.4% 228,764 300,7313241 3.56 3.24 2.74 2.60 9.0% 15.4% 5.1% 0.15 32.24% 10.3% 257,941 300,1083365 3.92 3.47 3.31 3.28 11.5% 4.6% 0.9% 0.08 17.68% 10.6% 225,721 296,5114692 0.78 0.81 0.82 0.86 3.8% 1.2% 4.9% 0.04 10.26% 3.6% 282,864 296,4511438 12.34 11.66 12.64 12.78 5.5% 8.4% 1.1% 0.04 15.65% 13.9% 49,458 295,5458291 3.08 3.01 2.89 2.99 2.3% 4.0% 3.5% 0.03 10.03% 7.4% 265,911 291,8653040 5.62 5.18 4.84 4.76 7.8% 6.6% 1.7% 0.08 16.81% 6.2% 270,429 290,1561925 3.27 3.23 3.25 3.35 1.2% 0.6% 3.1% 0.02 4.98% 4.3% 256,802 285,7723220 2.42 2.22 2.15 2.19 8.3% 3.2% 1.9% 0.05 13.76% 10.1% 290,975 283,3253188 2.15 2.31 2.16 2.19 7.4% 6.5% 1.4% 0.03 16.01% 13.9% 280,118 270,9587855 3.28 3.09 3.10 3.17 5.8% 0.3% 2.3% 0.03 8.53% 8.1% 236,200 270,0518304 3.50 3.57 4.03 4.26 2.0% 12.9% 5.7% 0.10 21.71% 10.9% 283,147 267,6512660 2.74 2.70 2.70 2.83 1.5% 0.0% 4.8% 0.02 6.34% 6.3% 192,307 265,0037425 2.71 2.51 2.02 1.82 7.4% 19.5% 9.9% 0.18 41.05% 12.1% 253,715 263,9348353 3.55 3.31 3.21 3.44 6.8% 3.0% 7.2% 0.04 17.87% 13.9% 282,971 262,1695222 7.20 6.85 6.74 6.70 4.9% 1.6% 0.6% 0.03 7.18% 4.3% 234,569 261,2923821 5.16 4.67 4.46 4.57 9.5% 4.5% 2.5% 0.07 17.24% 12.0% 218,433 258,6213303 2.31 1.98 2.01 2.04 14.3% 1.5% 1.5% 0.07 17.75% 15.8% 189,230 255,3638072 0.53 0.52 0.51 0.51 1.9% 1.9% 0.0% 0.02 3.85% 1.9% 252,465 254,7518721 0.25 0.25 0.25 0.26 0.0% 0.0% 4.0% 0.02 4.00% 4.0% 252,408 254,2053851 4.35 3.40 2.69 2.38 21.8% 20.9% 11.5% 0.27 64.25% 10.3% 457,125 248,5178799 0.46 0.41 0.35 0.36 10.9% 14.6% 2.9% 0.13 30.73% 17.5% 165,314 247,6462016 2.62 2.93 2.88 2.84 11.8% 1.7% 1.4% 0.05 15.32% 13.5% 223,858 246,791

NCCI Missouri Loss Cost Filing Effective January 1, 2021Analysis of the Absolute Loss Cost Change from Loss Costs that are Effective from January 1, 2018 to January 1, 2021 Sorted by 2018 Payroll
SwingLoss Cost Percent Change Loss Cost Absolute Max Min Payroll (100's)
Class Code 2018 2019 2020 2021 2019 2020 2021 Coef. Var Change Change 2017 20189501 2.90 2.83 2.84 2.99 2.4% 0.4% 5.3% 0.03 8.20% 7.7% 215,197 238,2597431 0.86 0.94 0.99 1.04 9.3% 5.3% 5.1% 0.08 20.93% 4.3% 218,864 236,5584304 7.15 6.45 5.73 5.07 9.8% 11.2% 11.5% 0.15 36.10% 1.7% 241,751 236,1658264 5.05 4.63 4.52 4.43 8.3% 2.4% 2.0% 0.06 13.10% 6.3% 215,577 235,4919093 1.47 1.26 1.23 1.16 14.3% 2.4% 5.7% 0.10 23.67% 11.9% 230,029 232,4634557 2.29 2.09 2.00 2.23 8.7% 4.3% 11.5% 0.06 26.46% 20.2% 229,661 230,1951472 2.54 2.55 2.68 2.74 0.4% 5.1% 2.2% 0.04 7.87% 4.7% 206,977 226,6393726 3.40 3.32 3.18 3.25 2.4% 4.2% 2.2% 0.03 9.02% 6.4% 159,054 226,0032002 2.53 2.80 2.91 3.08 10.7% 3.9% 5.8% 0.08 21.74% 6.7% 286,338 224,2603807 2.03 2.00 2.02 2.28 1.5% 1.0% 12.9% 0.06 15.68% 14.3% 216,020 222,5453180 2.69 2.78 2.64 2.65 3.3% 5.0% 0.4% 0.02 8.96% 8.4% 171,174 222,3901642 2.71 2.47 2.43 2.60 8.9% 1.6% 7.0% 0.05 18.36% 15.9% 338,385 221,7694283 1.55 1.42 1.38 1.28 8.4% 2.8% 7.2% 0.08 19.52% 5.6% 239,305 221,4022881 3.20 3.12 2.93 2.78 2.5% 6.1% 5.1% 0.06 14.31% 3.6% 227,858 218,9879180 3.36 3.95 3.85 3.87 17.6% 2.5% 0.5% 0.07 21.16% 20.1% 189,396 211,8319410 3.00 2.75 2.63 2.71 8.3% 4.4% 3.0% 0.06 16.50% 11.4% 212,555 210,6898034 2.22 2.09 1.92 2.01 5.9% 8.1% 4.7% 0.06 19.83% 12.8% 184,107 207,8802130 1.74 1.72 1.68 1.72 1.1% 2.3% 2.4% 0.01 5.97% 4.7% 179,138 205,9566400 4.45 4.49 5.06 4.94 0.9% 12.7% 2.4% 0.07 16.40% 15.1% 193,922 203,3372589 1.91 1.91 1.88 1.96 0.0% 1.6% 4.3% 0.02 5.89% 5.8% 214,680 197,8093881 4.15 3.77 3.69 3.57 9.2% 2.1% 3.3% 0.07 15.10% 7.0% 183,066 197,7968102 2.24 2.03 1.92 2.01 9.4% 5.4% 4.7% 0.07 20.71% 14.1% 150,959 197,1228602 0.71 0.82 0.96 1.11 15.5% 17.1% 15.6% 0.19 56.34% 1.6% 184,263 195,7851699 2.93 2.80 2.56 2.50 4.4% 8.6% 2.3% 0.07 16.05% 6.2% 74,357 192,8363028 4.34 3.79 3.60 3.71 12.7% 5.0% 3.1% 0.09 21.94% 15.7% 408,667 192,5484703 2.20 1.96 1.91 1.87 10.9% 2.6% 2.1% 0.07 16.12% 8.8% 185,415 189,7228031 1.75 2.03 1.98 2.01 16.0% 2.5% 1.5% 0.07 20.66% 18.5% 170,284 188,5591430 5.21 5.15 5.40 5.22 1.2% 4.9% 3.3% 0.02 9.60% 8.2% 177,994 186,5369554 9.01 8.04 7.50 7.40 10.8% 6.7% 1.3% 0.09 19.78% 9.4% 173,440 186,3489521 3.87 3.53 3.29 3.45 8.8% 6.8% 4.9% 0.07 21.83% 13.6% 170,514 183,2843803 1.72 1.73 2.00 2.28 0.6% 15.6% 14.0% 0.14 32.56% 15.0% 166,857 182,1780035 1.77 1.88 2.07 2.03 6.2% 10.1% 1.9% 0.07 19.21% 12.0% 195,375 181,9339220 3.62 3.62 3.45 3.53 0.0% 4.7% 2.3% 0.02 7.12% 7.0% 169,496 179,9987225 6.19 6.15 6.02 7.28 0.6% 2.1% 20.9% 0.09 24.28% 23.0% 0 176,3660917 3.97 3.67 3.39 3.31 7.6% 7.6% 2.4% 0.08 18.49% 5.3% 178,221 175,7541803 7.43 7.08 7.16 7.24 4.7% 1.1% 1.1% 0.02 7.08% 5.8% 160,263 175,7060005 3.31 2.98 2.84 2.90 10.0% 4.7% 2.1% 0.07 17.57% 12.1% 181,264 175,2224000 4.91 4.89 4.50 3.99 0.4% 8.0% 11.3% 0.09 20.70% 10.9% 144,124 173,8354149 0.89 0.86 0.82 0.77 3.4% 4.7% 6.1% 0.06 14.77% 2.7% 159,696 173,6296233 1.76 1.79 1.89 2.07 1.7% 5.6% 9.5% 0.07 17.61% 7.8% 123,598 172,4975507 3.58 3.21 3.20 3.28 10.3% 0.3% 2.5% 0.05 13.45% 12.8% 122,683 170,8569534 4.40 4.17 4.02 3.99 5.2% 3.6% 0.7% 0.05 9.83% 4.5% 151,341 169,3945479 7.13 6.44 6.14 6.14 9.7% 4.7% 0.0% 0.07 14.79% 9.7% 154,867 168,3596836 2.99 3.19 3.02 3.09 6.7% 5.3% 2.3% 0.03 14.98% 12.0% 129,200 162,0683372 3.59 3.41 3.13 2.99 5.0% 8.2% 4.5% 0.08 18.72% 3.7% 246,152 158,0360050 4.84 4.46 4.48 4.55 7.9% 0.4% 1.6% 0.04 10.03% 9.4% 132,497 157,9344130 3.32 3.17 3.09 3.03 4.5% 2.5% 1.9% 0.04 9.24% 2.6% 151,569 156,8534018 4.91 4.87 4.95 5.34 0.8% 1.6% 7.9% 0.04 10.54% 8.7% 144,069 156,5896825 2.91 2.95 2.74 2.58 1.4% 7.1% 5.8% 0.06 14.93% 8.5% 311,921 155,4187711 4.00 4.06 4.08 4.12 1.5% 0.5% 1.0% 0.01 3.00% 1.0% 155,950 155,1773270 4.18 3.67 3.65 3.62 12.2% 0.5% 0.8% 0.07 13.74% 11.7% 135,829 154,1537370 4.78 4.50 4.12 4.02 5.9% 8.4% 2.4% 0.08 17.58% 6.0% 141,593 150,3423638 1.92 1.79 1.88 2.18 6.8% 5.0% 16.0% 0.09 30.03% 22.7% 133,025 149,4644251 3.37 3.36 3.28 3.41 0.3% 2.4% 4.0% 0.02 6.75% 6.3% 115,984 148,0583064 3.32 3.16 3.32 3.45 4.8% 5.1% 3.9% 0.04 14.44% 9.9% 131,653 147,2994693 0.68 0.75 0.82 0.92 10.3% 9.3% 12.2% 0.13 35.29% 2.9% 169,544 146,2358288 7.60 6.94 6.89 6.96 8.7% 0.7% 1.0% 0.05 10.58% 9.7% 159,929 145,1595223 6.16 5.78 5.27 4.97 6.2% 8.8% 5.7% 0.10 22.11% 3.1% 126,156 141,2316204 12.64 9.45 8.43 7.30 25.2% 10.8% 13.4% 0.24 57.35% 14.4% 110,201 137,008

NCCI Missouri Loss Cost Filing Effective January 1, 2021Analysis of the Absolute Loss Cost Change from Loss Costs that are Effective from January 1, 2018 to January 1, 2021 Sorted by 2018 Payroll
SwingLoss Cost Percent Change Loss Cost Absolute Max Min Payroll (100's)
Class Code 2018 2019 2020 2021 2019 2020 2021 Coef. Var Change Change 2017 20183022 3.85 3.54 3.44 3.28 8.1% 2.8% 4.7% 0.07 16.27% 5.2% 119,430 136,7174686 2.51 2.61 2.41 2.16 4.0% 7.7% 10.4% 0.08 23.57% 14.4% 96,361 134,3661463 10.84 9.29 9.01 8.77 14.3% 3.0% 2.7% 0.10 20.88% 11.6% 148,785 133,5665040 14.34 11.95 11.04 9.71 16.7% 7.6% 12.0% 0.17 40.68% 9.1% 110,190 130,0192710 15.12 13.52 12.46 12.62 10.6% 7.8% 1.3% 0.09 20.78% 11.9% 135,590 129,7215610 5.04 4.73 4.25 3.68 6.2% 10.1% 13.4% 0.13 32.60% 7.3% 108,090 127,6068235 3.23 3.54 3.54 3.58 9.6% 0.0% 1.1% 0.05 10.84% 9.6% 127,854 127,5997590 2.83 2.70 2.59 2.62 4.6% 4.1% 1.2% 0.04 10.12% 5.8% 121,854 126,4502143 1.82 2.05 2.17 2.31 12.6% 5.9% 6.5% 0.10 26.92% 6.8% 114,218 126,1904902 2.91 2.60 2.39 2.34 10.7% 8.1% 2.1% 0.10 22.09% 8.6% 123,640 125,9073826 0.97 1.02 1.00 1.07 5.2% 2.0% 7.0% 0.04 14.72% 9.0% 138,465 123,8553145 2.48 2.31 2.26 2.33 6.9% 2.2% 3.1% 0.04 12.55% 10.0% 106,383 120,4299178 10.97 10.78 10.14 10.32 1.7% 5.9% 1.8% 0.04 9.68% 7.7% 114,952 111,4183334 1.92 1.86 1.80 1.79 3.1% 3.2% 0.6% 0.03 7.04% 2.7% 100,198 105,2172288 4.03 3.68 3.55 3.84 8.7% 3.5% 8.2% 0.05 21.72% 16.9% 111,919 102,5872021 1.76 1.86 2.06 2.49 5.7% 10.8% 20.9% 0.16 41.48% 15.2% 84,763 102,4113081 3.53 3.85 3.95 4.27 9.1% 2.6% 8.1% 0.08 20.96% 6.5% 104,760 102,3615473 7.67 7.13 6.81 6.85 7.0% 4.5% 0.6% 0.06 12.50% 7.6% 103,032 101,6662305 2.99 2.44 2.26 2.18 18.4% 7.4% 3.5% 0.15 31.63% 14.9% 37,461 99,4377422 2.56 2.12 1.73 1.52 17.2% 18.4% 12.1% 0.23 55.59% 6.3% 75,072 98,7654101 2.32 2.35 2.22 2.21 1.3% 5.5% 0.5% 0.03 7.38% 6.8% 69,377 98,2586229 4.07 4.03 3.91 4.14 1.0% 3.0% 5.9% 0.02 10.11% 8.9% 99,095 96,8521924 4.14 3.84 3.58 3.32 7.2% 6.8% 7.3% 0.09 22.82% 0.5% 88,820 96,2739505 3.62 3.99 3.98 3.87 10.2% 0.3% 2.8% 0.04 13.55% 13.0% 82,453 95,5332388 1.50 1.50 1.52 1.55 0.0% 1.3% 2.0% 0.02 3.33% 2.0% 72,010 95,2443648 1.48 1.43 1.46 1.55 3.4% 2.1% 6.2% 0.03 12.05% 9.5% 88,748 94,3929062 1.41 1.28 1.16 1.20 9.2% 9.4% 3.4% 0.09 23.58% 12.8% 96,195 92,6444239 1.80 1.79 1.90 2.01 0.6% 6.1% 5.8% 0.05 12.91% 6.7% 85,368 90,3974470 2.07 2.10 2.17 2.15 1.4% 3.3% 0.9% 0.02 5.80% 4.3% 82,885 89,3719179 17.25 16.95 17.37 17.95 1.7% 2.5% 3.3% 0.02 7.74% 5.1% 88,002 89,2504109 0.63 0.56 0.55 0.57 11.1% 1.8% 3.6% 0.06 17.21% 14.7% 153,854 88,9078500 4.81 4.83 4.60 4.61 0.4% 4.8% 0.2% 0.03 5.43% 5.2% 83,296 88,5844250 1.77 1.68 1.68 1.72 5.1% 0.0% 2.4% 0.02 7.59% 7.5% 109,533 88,4573336 2.92 2.78 2.63 2.72 4.8% 5.4% 3.4% 0.04 14.23% 8.8% 75,594 87,9322131 2.33 2.21 2.22 2.34 5.2% 0.5% 5.4% 0.03 11.34% 10.6% 86,271 86,4945020 4.48 4.51 4.23 4.07 0.7% 6.2% 3.8% 0.05 10.96% 6.9% 97,758 86,1705472 5.25 5.09 4.55 4.36 3.0% 10.6% 4.2% 0.09 18.74% 7.6% 78,001 84,9317502 3.65 3.06 2.47 2.07 16.2% 19.3% 16.2% 0.25 61.00% 3.1% 137,040 84,7314740 0.83 0.89 0.98 1.01 7.2% 10.1% 3.1% 0.09 21.69% 7.1% 57,329 84,0490036 8.35 7.39 6.61 5.93 11.5% 10.6% 10.3% 0.15 35.95% 1.2% 64,154 83,6654307 1.58 1.70 1.68 1.79 7.6% 1.2% 6.5% 0.05 15.99% 8.8% 101,471 83,4896251 3.64 3.42 3.06 2.90 6.0% 10.5% 5.2% 0.10 23.33% 5.3% 37,455 81,6244741 2.29 2.14 2.22 2.31 6.6% 3.7% 4.1% 0.03 15.01% 10.6% 123,956 80,8534717 1.86 1.99 2.05 2.11 7.0% 3.0% 2.9% 0.05 13.44% 4.1% 80,736 79,8698381 2.33 2.31 2.10 2.06 0.9% 9.1% 1.9% 0.06 12.12% 8.2% 73,001 78,2518203 5.79 5.89 5.92 5.86 1.7% 0.5% 1.0% 0.01 3.28% 2.7% 77,363 78,0324240 3.00 3.49 3.48 3.37 16.3% 0.3% 3.2% 0.07 20.35% 19.5% 79,837 76,9272651 1.97 2.13 2.21 2.23 8.1% 3.8% 0.9% 0.06 13.20% 7.2% 85,208 75,8143373 5.22 4.62 4.45 4.37 11.5% 3.7% 1.8% 0.08 17.68% 9.7% 66,663 75,2823169 1.98 2.08 2.22 2.48 5.1% 6.7% 11.7% 0.10 25.25% 6.7% 58,056 74,8963307 4.14 3.58 3.27 2.92 13.5% 8.7% 10.7% 0.15 36.56% 4.9% 69,028 74,0910008 2.80 2.60 2.53 2.39 7.1% 2.7% 5.5% 0.07 16.12% 4.5% 72,693 72,0443581 1.22 1.16 1.22 1.27 4.9% 5.2% 4.1% 0.04 14.87% 10.1% 85,685 67,3030401 10.08 10.31 10.47 10.77 2.3% 1.6% 2.9% 0.03 6.85% 1.3% 59,383 66,8582041 2.47 2.46 2.47 2.54 0.4% 0.4% 2.8% 0.01 3.67% 3.2% 69,127 64,4502688 2.99 2.71 2.42 2.30 9.4% 10.7% 5.0% 0.12 27.07% 5.7% 58,736 62,6422586 2.05 2.22 2.50 2.78 8.3% 12.6% 11.2% 0.13 35.61% 4.3% 58,298 60,7625059 28.25 25.77 24.30 23.46 8.8% 5.7% 3.5% 0.08 18.96% 5.3% 45,627 58,4203559 2.40 2.32 2.36 2.35 3.3% 1.7% 0.4% 0.01 5.56% 5.1% 57,249 56,885

NCCI Missouri Loss Cost Filing Effective January 1, 2021Analysis of the Absolute Loss Cost Change from Loss Costs that are Effective from January 1, 2018 to January 1, 2021 Sorted by 2018 Payroll
SwingLoss Cost Percent Change Loss Cost Absolute Max Min Payroll (100's)
Class Code 2018 2019 2020 2021 2019 2020 2021 Coef. Var Change Change 2017 20184777 4.06 4.05 3.89 3.86 0.2% 4.0% 0.8% 0.03 5.01% 3.7% 17,196 55,4153114 2.81 3.06 3.25 3.35 8.9% 6.2% 3.1% 0.08 19.22% 5.8% 29,702 55,0224683 4.01 3.73 3.58 3.60 7.0% 4.0% 0.6% 0.05 11.91% 7.5% 6,143 54,6775480 5.16 5.17 5.08 4.91 0.2% 1.7% 3.3% 0.02 5.35% 3.5% 48,066 53,2953635 2.19 2.13 2.10 2.08 2.7% 1.4% 1.0% 0.02 5.18% 1.8% 59,697 52,1782841 3.70 3.55 3.55 3.94 4.1% 0.0% 11.0% 0.05 15.49% 15.0% 47,794 51,2116252 3.45 3.08 2.95 2.79 10.7% 4.2% 5.4% 0.09 21.66% 6.5% 28,828 51,0573865 1.70 1.85 2.05 2.47 8.8% 10.8% 20.5% 0.17 45.29% 11.7% 37,740 49,8653082 4.71 4.60 4.61 4.76 2.3% 0.2% 3.3% 0.02 5.89% 5.6% 36,493 48,5704036 2.76 2.62 2.40 2.25 5.1% 8.4% 6.3% 0.09 21.01% 3.3% 41,436 47,9944110 1.47 1.28 1.21 1.16 12.9% 5.5% 4.1% 0.11 24.02% 8.8% 13,047 47,5663110 5.33 4.71 4.21 4.19 11.6% 10.6% 0.5% 0.12 24.07% 11.2% 46,915 46,6342735 3.92 3.72 3.48 3.69 5.1% 6.5% 6.0% 0.05 18.63% 12.5% 42,339 46,5551747 1.59 1.69 1.95 1.99 6.3% 15.4% 2.1% 0.11 25.16% 13.3% 23,663 46,1923018 5.93 5.08 4.37 3.87 14.3% 14.0% 11.4% 0.19 45.22% 2.9% 49,612 45,8122110 2.00 1.89 1.80 1.76 5.5% 4.8% 2.2% 0.06 12.98% 3.3% 54,858 45,3278279 5.42 5.21 5.01 5.10 3.9% 3.8% 1.8% 0.03 9.80% 5.7% 61,467 45,0799170 9.54 9.68 10.34 10.85 1.5% 6.8% 4.9% 0.06 13.73% 5.4% 42,254 40,9688204 3.27 3.20 3.36 3.36 2.1% 5.0% 0.0% 0.02 7.25% 7.1% 40,277 40,6643315 3.56 3.22 3.04 2.97 9.6% 5.6% 2.3% 0.08 18.34% 7.2% 13,066 40,3135951 0.34 0.34 0.35 0.39 0.0% 2.9% 11.4% 0.07 14.71% 11.4% 94,838 38,2012799 4.66 5.05 5.03 4.69 8.4% 0.4% 6.8% 0.04 16.15% 15.1% 36,300 36,7363126 1.17 1.27 1.31 1.36 8.5% 3.1% 3.8% 0.06 16.24% 5.4% 26,511 35,7066503 2.00 1.98 1.96 2.00 1.0% 1.0% 2.0% 0.01 4.10% 3.1% 34,776 34,7312790 1.58 1.62 1.63 1.80 2.5% 0.6% 10.4% 0.06 13.92% 9.8% 34,746 34,7143383 1.42 1.48 1.51 1.55 4.2% 2.0% 2.6% 0.04 9.15% 2.2% 32,653 32,7418263 4.65 4.58 4.33 4.58 1.5% 5.5% 5.8% 0.03 13.23% 11.2% 48,854 31,9588233 1.99 2.05 1.97 1.96 3.0% 3.9% 0.5% 0.02 7.58% 6.9% 41,133 30,1021710 3.10 3.06 3.03 3.28 1.3% 1.0% 8.3% 0.04 10.72% 9.5% 25,469 29,8251654 3.71 3.77 3.47 3.45 1.6% 8.0% 0.6% 0.05 10.34% 9.6% 30,265 29,8114923 0.99 0.93 0.97 0.99 6.1% 4.3% 2.1% 0.03 12.90% 10.4% 24,030 29,4812570 4.02 3.87 3.77 3.86 3.7% 2.6% 2.4% 0.03 8.95% 6.1% 18,355 29,3673548 1.52 1.44 1.43 1.48 5.3% 0.7% 3.5% 0.03 9.70% 8.8% 25,666 29,2062623 7.33 6.61 6.02 5.79 9.8% 8.9% 3.8% 0.11 24.20% 6.0% 28,949 28,3472797 3.69 4.35 4.75 5.07 17.9% 9.2% 6.7% 0.13 37.40% 11.1% 20,129 26,1074263 4.20 3.59 3.32 3.36 14.5% 7.5% 1.2% 0.11 24.62% 15.7% 32,872 25,9762960 6.56 5.54 5.19 4.97 15.5% 6.3% 4.2% 0.13 28.06% 11.3% 32,383 25,6989186 16.69 16.85 14.81 13.02 1.0% 12.1% 12.1% 0.12 26.86% 13.1% 20,139 25,6174352 1.72 1.62 1.65 1.66 5.8% 1.9% 0.6% 0.03 8.43% 7.7% 27,928 25,5882081 5.65 4.87 4.79 4.79 13.8% 1.6% 0.0% 0.08 15.67% 13.8% 33,038 24,8795491 1.58 1.50 1.54 1.49 5.1% 2.7% 3.2% 0.03 11.37% 7.7% 28,258 23,9578103 2.00 1.93 1.92 2.24 3.5% 0.5% 16.7% 0.07 21.38% 20.2% 23,988 23,0484351 0.78 0.78 0.83 0.89 0.0% 6.4% 7.2% 0.06 14.10% 7.2% 37,094 22,7502417 1.39 1.29 1.34 1.40 7.2% 3.9% 4.5% 0.04 16.33% 11.7% 18,677 21,9153822 3.87 3.62 3.50 3.45 6.5% 3.3% 1.4% 0.05 11.56% 5.0% 12,257 21,2640016 6.77 5.75 5.19 4.80 15.1% 9.7% 7.5% 0.15 35.76% 7.6% 22,316 19,7684062 2.44 2.52 2.63 2.67 3.3% 4.4% 1.5% 0.04 9.43% 2.8% 15,157 19,3580079 5.23 4.24 3.57 3.42 18.9% 15.8% 4.2% 0.20 43.51% 14.7% 23,268 18,4942835 2.69 2.47 2.22 2.26 8.2% 10.1% 1.8% 0.09 21.27% 11.9% 12,044 18,4582503 1.37 1.43 1.31 1.21 4.4% 8.4% 7.6% 0.07 21.78% 12.8% 16,699 18,4457133 2.13 2.22 2.26 2.57 4.2% 1.8% 13.7% 0.08 20.66% 11.9% 20,250 17,6173041 4.92 4.44 4.07 3.96 9.8% 8.3% 2.7% 0.10 22.12% 7.1% 15,938 17,1152065 1.94 1.89 1.75 1.70 2.6% 7.4% 2.9% 0.06 13.32% 4.8% 28,401 15,7121452 3.48 2.95 2.81 2.96 15.2% 4.7% 5.3% 0.10 27.14% 20.6% 15,312 15,3323118 2.19 2.14 2.05 1.99 2.3% 4.2% 2.9% 0.04 9.70% 1.9% 17,087 15,2722702 20.10 17.87 15.86 15.80 11.1% 11.2% 0.4% 0.12 24.06% 10.9% 21,077 15,1796003 4.44 4.17 4.26 4.58 6.1% 2.2% 7.5% 0.04 16.51% 13.6% 12,110 15,1094431 1.31 1.27 1.26 1.26 3.1% 0.8% 0.0% 0.02 3.86% 3.1% 21,004 14,5778745 4.65 4.14 3.49 3.19 11.0% 15.7% 8.6% 0.17 39.43% 7.1% 11,780 14,177

NCCI Missouri Loss Cost Filing Effective January 1, 2021Analysis of the Absolute Loss Cost Change from Loss Costs that are Effective from January 1, 2018 to January 1, 2021 Sorted by 2018 Payroll
SwingLoss Cost Percent Change Loss Cost Absolute Max Min Payroll (100's)
Class Code 2018 2019 2020 2021 2019 2020 2021 Coef. Var Change Change 2017 20187309 10.88 10.95 10.26 9.20 0.6% 6.3% 10.3% 0.08 18.04% 11.0% 13,024 14,1704581 1.13 1.33 1.58 1.91 17.7% 18.8% 20.9% 0.23 69.03% 3.2% 16,906 13,4288725 1.83 1.87 1.99 2.05 2.2% 6.4% 3.0% 0.05 12.02% 4.2% 18,964 13,3732220 1.91 1.90 1.92 2.03 0.5% 1.1% 5.7% 0.03 7.40% 6.3% 11,397 13,3113719 1.53 1.17 1.04 0.95 23.5% 11.1% 8.7% 0.22 49.13% 14.9% 1,039 12,5363027 2.75 2.55 2.45 2.28 7.3% 3.9% 6.9% 0.08 19.21% 3.4% 13,485 12,4624038 4.97 4.26 3.83 3.71 14.3% 10.1% 3.1% 0.14 29.76% 11.2% 9,396 12,4101005 3.93 4.68 5.21 5.70 19.1% 11.3% 9.4% 0.16 45.04% 9.7% 14,894 11,9574665 8.99 8.73 9.01 9.02 2.9% 3.2% 0.1% 0.02 6.31% 6.1% 16,625 11,4304206 2.38 2.35 2.34 2.49 1.3% 0.4% 6.4% 0.03 8.21% 7.7% 9,045 11,2990113 6.10 5.04 4.54 4.39 17.4% 9.9% 3.3% 0.15 33.28% 14.1% 8,936 10,8306216 4.39 4.20 3.96 4.01 4.3% 5.7% 1.3% 0.05 11.68% 7.0% 11,090 10,2487317 7.96 8.38 8.02 7.99 5.3% 4.3% 0.4% 0.02 10.21% 9.6% 13,103 10,2004568 4.63 4.41 3.71 3.30 4.8% 15.9% 11.1% 0.15 34.79% 11.1% 7,605 9,5027420 7.58 7.18 6.86 6.50 5.3% 4.5% 5.2% 0.07 15.74% 0.8% 9,776 9,3536045 3.16 2.96 3.12 3.52 6.3% 5.4% 12.8% 0.07 26.45% 19.1% 8,672 9,2667350 12.01 11.43 10.48 9.46 4.8% 8.3% 9.7% 0.10 24.59% 4.9% 2,718 9,2204493 5.78 5.62 4.44 3.66 2.8% 21.0% 17.6% 0.21 46.19% 18.2% 10,009 8,9101320 1.47 1.46 1.40 1.42 0.7% 4.1% 1.4% 0.02 6.32% 5.5% 6,161 8,7900251 3.56 3.52 3.35 3.38 1.1% 4.8% 0.9% 0.03 6.96% 5.7% 8,454 8,7887402 0.12 0.11 0.10 0.10 8.3% 9.1% 0.0% 0.09 18.18% 9.1% 8,326 8,7232923 1.98 1.91 1.85 1.77 3.5% 3.1% 4.3% 0.05 11.41% 1.2% 9,190 8,6466235 6.63 5.49 5.33 5.18 17.2% 2.9% 2.8% 0.12 24.00% 14.4% 1,297 8,4113132 3.80 3.68 3.68 4.45 3.2% 0.0% 20.9% 0.09 24.74% 24.1% 6,961 8,4045037 12.09 11.20 10.46 9.86 7.4% 6.6% 5.7% 0.09 21.02% 1.6% 5,910 7,9339600 2.79 2.83 2.96 3.17 1.4% 4.6% 7.1% 0.06 13.62% 5.7% 2,791 7,8552413 2.36 2.45 2.52 2.65 3.8% 2.9% 5.2% 0.05 12.29% 2.3% 8,340 7,8324111 1.83 1.75 1.73 1.79 4.4% 1.1% 3.5% 0.02 9.23% 7.8% 88,324 7,4667222 5.36 5.60 5.63 5.80 4.5% 0.5% 3.0% 0.03 8.21% 3.9% 1,207 7,3504653 1.34 1.28 1.29 1.41 4.5% 0.8% 9.3% 0.04 15.09% 13.8% 3,974 7,0042836 1.97 2.08 2.16 2.48 5.6% 3.8% 14.8% 0.10 25.89% 11.0% 4,598 6,9595402 3.37 3.31 3.72 4.26 1.8% 12.4% 14.5% 0.12 30.99% 16.3% 6,349 6,6002683 1.69 1.81 2.10 2.53 7.1% 16.0% 20.5% 0.18 49.70% 13.4% 15,759 6,4132105 3.18 3.23 3.42 4.00 1.6% 5.9% 17.0% 0.11 25.79% 15.4% 5,122 6,0332701 9.01 10.12 10.48 10.42 12.3% 3.6% 0.6% 0.07 16.98% 12.9% 5,256 5,9921165 3.72 3.40 3.12 3.00 8.6% 8.2% 3.8% 0.10 22.07% 4.8% 6,649 5,8854133 1.70 1.85 1.80 1.96 8.8% 2.7% 8.9% 0.06 21.70% 11.6% 5,379 5,5003385 0.84 0.81 0.82 0.88 3.6% 1.2% 7.3% 0.04 12.52% 10.9% 12,589 4,8023515 2.77 2.65 2.59 2.57 4.3% 2.3% 0.8% 0.03 7.52% 3.6% 4,219 4,5884021 7.53 6.46 6.19 5.40 14.2% 4.2% 12.8% 0.14 34.17% 10.0% 4,087 4,2963111 2.33 2.32 2.15 2.08 0.4% 7.3% 3.3% 0.06 11.30% 6.9% 1,118 4,1128726 1.86 1.88 1.78 1.82 1.1% 5.3% 2.2% 0.02 8.84% 7.6% 2,101 3,8147024 2.01 2.21 2.60 2.93 10.0% 17.6% 12.7% 0.17 45.77% 7.7% 1,383 3,8056882 3.72 3.60 3.32 3.16 3.2% 7.8% 4.8% 0.07 16.62% 4.6% 0 3,7853240 1.98 2.32 2.71 2.48 17.2% 16.8% 8.5% 0.13 48.48% 25.7% 8,386 3,7086237 1.42 1.26 1.19 1.16 11.3% 5.6% 2.5% 0.09 20.41% 8.7% 4,017 3,4845443 2.80 2.62 2.80 2.82 6.4% 6.9% 0.7% 0.03 14.55% 13.3% 7,630 3,4592361 1.88 1.84 1.80 1.74 2.1% 2.2% 3.3% 0.03 7.83% 1.2% 2,573 3,1802112 3.49 3.64 3.57 3.57 4.3% 1.9% 0.0% 0.02 6.30% 6.2% 2,865 3,0159089 1.12 1.04 0.99 0.94 7.1% 4.8% 5.1% 0.08 17.97% 2.3% 2,795 3,0119019 1.28 1.53 1.80 1.94 19.5% 17.6% 7.8% 0.18 51.56% 11.8% 2,883 2,9986213 1.46 1.28 1.15 1.11 12.3% 10.2% 3.5% 0.13 28.04% 8.9% 866 2,9372709 14.43 16.64 16.56 19.92 15.3% 0.5% 20.3% 0.13 39.38% 20.8% 1,260 2,5213642 1.32 1.28 1.21 1.12 3.0% 5.5% 7.4% 0.07 16.75% 4.4% 9,557 2,0598606 1.92 1.78 1.69 1.68 7.3% 5.1% 0.6% 0.06 13.38% 6.7% 1,437 2,0395703 9.82 9.47 10.02 11.90 3.6% 5.8% 18.8% 0.11 30.14% 22.3% 879 1,8152916 4.64 4.03 3.71 3.41 13.1% 7.9% 8.1% 0.13 32.01% 5.2% 4,947 1,7822362 1.56 1.65 1.73 1.94 5.8% 4.8% 12.1% 0.09 24.36% 7.3% 2,806 1,7242587 1.84 1.74 1.73 1.95 5.4% 0.6% 12.7% 0.06 19.53% 18.2% 11,880 1,653

NCCI Missouri Loss Cost Filing Effective January 1, 2021Analysis of the Absolute Loss Cost Change from Loss Costs that are Effective from January 1, 2018 to January 1, 2021 Sorted by 2018 Payroll
SwingLoss Cost Percent Change Loss Cost Absolute Max Min Payroll (100's)
Class Code 2018 2019 2020 2021 2019 2020 2021 Coef. Var Change Change 2017 20182402 2.27 2.36 2.46 2.54 4.0% 4.2% 3.3% 0.05 11.89% 1.0% 1,238 1,5327395 3.72 3.73 3.92 4.14 0.3% 5.1% 5.6% 0.05 11.29% 5.3% 361 1,5024420 4.12 4.09 3.92 3.89 0.7% 4.2% 0.8% 0.03 5.72% 3.4% 53 1,4236005 5.41 4.86 4.55 4.32 10.2% 6.4% 5.1% 0.10 23.12% 5.1% 611 1,4128719 2.11 1.91 1.76 1.73 9.5% 7.9% 1.7% 0.09 20.09% 7.8% 1,929 1,3533827 2.55 2.41 2.35 2.39 5.5% 2.5% 1.7% 0.04 9.96% 7.2% 4,495 1,0557090 5.83 5.95 5.67 5.33 2.1% 4.7% 6.0% 0.05 13.27% 8.1% 645 1,0356872 10.83 10.59 10.12 9.12 2.2% 4.4% 9.9% 0.07 17.30% 7.7% 2,960 8454131 3.91 3.98 4.55 4.58 1.8% 14.3% 0.7% 0.08 17.14% 13.7% 715 7993122 2.02 1.96 2.03 2.08 3.0% 3.6% 2.5% 0.02 9.27% 6.5% 819 7408709 4.16 4.36 4.35 4.12 4.8% 0.2% 5.3% 0.03 10.60% 10.1% 753 7363119 1.63 1.48 1.37 1.41 9.2% 7.4% 2.9% 0.08 20.74% 12.1% 47 7352380 2.26 2.10 1.98 2.00 7.1% 5.7% 1.0% 0.06 14.34% 8.1% 9,834 6482714 5.06 4.74 4.62 4.50 6.3% 2.5% 2.6% 0.05 11.85% 3.8% 353 6085705 27.20 24.22 22.38 19.95 11.0% 7.6% 10.9% 0.13 32.35% 3.4% 1,295 5050913 361.00 381.00 394.00 423.00 5.5% 3.4% 7.4% 0.07 17.17% 3.9% 0 4943042 5.85 5.01 4.76 4.79 14.4% 5.0% 0.6% 0.10 20.82% 15.0% 0 4428209 4.52 3.69 3.57 3.56 18.4% 3.3% 0.3% 0.12 22.55% 18.1% 4,449 4142172 1.54 1.53 1.47 1.48 0.6% 3.9% 0.7% 0.02 5.31% 4.6% 3,984 3790908 115.00 121.00 116.00 117.00 5.2% 4.1% 0.9% 0.02 10.51% 9.3% 0 3762174 2.95 2.75 2.76 2.93 6.8% 0.4% 6.2% 0.04 13.77% 12.9% 3,391 1587540 2.80 2.72 2.55 2.51 2.9% 6.3% 1.6% 0.05 11.00% 4.7% 8 1503131 1.81 1.84 1.81 1.79 1.7% 1.6% 1.1% 0.01 4.46% 3.3% 372 1412211 11.21 10.16 9.36 8.97 9.4% 7.9% 4.2% 0.10 22.89% 5.2% 131 1226206 2.33 2.09 2.10 2.28 10.3% 0.5% 8.6% 0.06 20.33% 18.9% 219 892302 1.82 1.72 1.62 1.71 5.5% 5.8% 5.6% 0.05 17.83% 11.4% 0 457313 3.02 3.28 3.38 3.25 8.6% 3.0% 3.8% 0.05 16.23% 12.5% 2,671 371016 10.54 11.22 12.52 14.64 6.5% 11.6% 16.9% 0.15 38.90% 10.5% 466 310170 2.25 2.05 1.99 1.99 8.9% 2.9% 0.0% 0.06 12.08% 8.9% 27 313004 2.24 1.93 1.77 1.71 13.8% 8.3% 3.4% 0.12 27.46% 10.4% 122 251322 6.49 6.25 6.10 6.44 3.7% 2.4% 5.6% 0.03 12.11% 9.3% 0 256214 1.91 1.68 1.58 1.52 12.0% 6.0% 3.8% 0.10 23.22% 8.2% 0 257335 2.00 2.15 2.05 2.19 7.5% 4.7% 6.8% 0.04 20.18% 12.2% 0 147098 10.86 10.66 10.44 10.54 1.8% 2.1% 1.0% 0.02 4.94% 3.0% 0 106826 4.15 4.34 4.21 3.93 4.6% 3.0% 6.7% 0.04 14.87% 11.2% 57 04751 1.81 1.70 1.75 2.05 6.1% 2.9% 17.1% 0.08 27.92% 23.2% 56 06835 2.67 2.65 2.59 2.62 0.7% 2.3% 1.2% 0.01 4.22% 3.4% 201 06884 5.67 5.41 5.16 5.03 4.6% 4.6% 2.5% 0.05 12.18% 2.1% 38 0

NCCI Missouri Loss Cost Filing Effective January 1, 2021Analysis of the Loss Costs that are Effective from January 1, 2018 to January 1, 2021 Sorted by 2018 Absolute Cumulative Change Percent
SwingLoss Cost Percent Change Loss Cost Absolute Max Min Payroll (100's)
Class Code 2018 2019 2020 2021 2019 2020 2021 Coef. Var Change Change 2017 20184581 1.13 1.33 1.58 1.91 17.7% 18.8% 20.9% 0.23 69.03% 3.2% 16,906 13,4283574 1.80 2.09 1.72 2.08 16.1% 17.7% 20.9% 0.10 65.27% 38.6% 513,164 1,467,7373851 4.35 3.40 2.69 2.38 21.8% 20.9% 11.5% 0.27 64.25% 10.3% 457,125 248,5177502 3.65 3.06 2.47 2.07 16.2% 19.3% 16.2% 0.25 61.00% 3.1% 137,040 84,7316204 12.64 9.45 8.43 7.30 25.2% 10.8% 13.4% 0.24 57.35% 14.4% 110,201 137,0088856 0.23 0.26 0.30 0.36 13.0% 15.4% 20.0% 0.20 56.52% 7.0% 388,287 396,9288602 0.71 0.82 0.96 1.11 15.5% 17.1% 15.6% 0.19 56.34% 1.6% 184,263 195,7857422 2.56 2.12 1.73 1.52 17.2% 18.4% 12.1% 0.23 55.59% 6.3% 75,072 98,7659019 1.28 1.53 1.80 1.94 19.5% 17.6% 7.8% 0.18 51.56% 11.8% 2,883 2,9982683 1.69 1.81 2.10 2.53 7.1% 16.0% 20.5% 0.18 49.70% 13.4% 15,759 6,4133719 1.53 1.17 1.04 0.95 23.5% 11.1% 8.7% 0.22 49.13% 14.9% 1,039 12,5363240 1.98 2.32 2.71 2.48 17.2% 16.8% 8.5% 0.13 48.48% 25.7% 8,386 3,7088755 0.48 0.37 0.31 0.30 22.9% 16.2% 3.2% 0.23 47.46% 19.7% 638,779 604,6279522 2.97 3.08 3.60 4.35 3.7% 16.9% 20.8% 0.18 46.46% 17.1% 468,363 354,2004493 5.78 5.62 4.44 3.66 2.8% 21.0% 17.6% 0.21 46.19% 18.2% 10,009 8,9107024 2.01 2.21 2.60 2.93 10.0% 17.6% 12.7% 0.17 45.77% 7.7% 1,383 3,8053865 1.70 1.85 2.05 2.47 8.8% 10.8% 20.5% 0.17 45.29% 11.7% 37,740 49,8653018 5.93 5.08 4.37 3.87 14.3% 14.0% 11.4% 0.19 45.22% 2.9% 49,612 45,8121005 3.93 4.68 5.21 5.70 19.1% 11.3% 9.4% 0.16 45.04% 9.7% 14,894 11,9577539 2.50 2.05 1.69 1.62 18.0% 17.6% 4.1% 0.21 44.47% 13.9% 521,686 536,7256306 6.93 5.42 4.92 4.53 21.8% 9.2% 7.9% 0.19 43.57% 13.9% 450,582 496,7090079 5.23 4.24 3.57 3.42 18.9% 15.8% 4.2% 0.20 43.51% 14.7% 23,268 18,4941624 3.71 3.33 2.90 2.46 10.2% 12.9% 15.2% 0.17 43.36% 4.9% 865,153 866,7598047 1.16 0.97 0.84 0.77 16.4% 13.4% 8.3% 0.18 42.97% 8.0% 521,274 446,8689516 3.51 3.07 2.63 2.35 12.5% 14.3% 10.6% 0.18 42.36% 3.7% 496,687 465,5722021 1.76 1.86 2.06 2.49 5.7% 10.8% 20.9% 0.16 41.48% 15.2% 84,763 102,4117425 2.71 2.51 2.02 1.82 7.4% 19.5% 9.9% 0.18 41.05% 12.1% 253,715 263,9345040 14.34 11.95 11.04 9.71 16.7% 7.6% 12.0% 0.17 40.68% 9.1% 110,190 130,0198745 4.65 4.14 3.49 3.19 11.0% 15.7% 8.6% 0.17 39.43% 7.1% 11,780 14,1772709 14.43 16.64 16.56 19.92 15.3% 0.5% 20.3% 0.13 39.38% 20.8% 1,260 2,5211016 10.54 11.22 12.52 14.64 6.5% 11.6% 16.9% 0.15 38.90% 10.5% 466 319012 1.03 0.85 0.77 0.71 17.5% 9.4% 7.8% 0.17 38.55% 9.7% 4,769,208 4,699,1127390 6.59 5.19 4.84 4.54 21.2% 6.7% 6.2% 0.17 37.44% 15.0% 321,983 357,2912797 3.69 4.35 4.75 5.07 17.9% 9.2% 6.7% 0.13 37.40% 11.1% 20,129 26,1073307 4.14 3.58 3.27 2.92 13.5% 8.7% 10.7% 0.15 36.56% 4.9% 69,028 74,0914304 7.15 6.45 5.73 5.07 9.8% 11.2% 11.5% 0.15 36.10% 1.7% 241,751 236,1650036 8.35 7.39 6.61 5.93 11.5% 10.6% 10.3% 0.15 35.95% 1.2% 64,154 83,6650016 6.77 5.75 5.19 4.80 15.1% 9.7% 7.5% 0.15 35.76% 7.6% 22,316 19,7682586 2.05 2.22 2.50 2.78 8.3% 12.6% 11.2% 0.13 35.61% 4.3% 58,298 60,7625478 6.18 5.57 5.05 4.41 9.9% 9.3% 12.7% 0.14 35.35% 3.3% 631,459 619,7354693 0.68 0.75 0.82 0.92 10.3% 9.3% 12.2% 0.13 35.29% 2.9% 169,544 146,2354568 4.63 4.41 3.71 3.30 4.8% 15.9% 11.1% 0.15 34.79% 11.1% 7,605 9,5024021 7.53 6.46 6.19 5.40 14.2% 4.2% 12.8% 0.14 34.17% 10.0% 4,087 4,2968803 0.07 0.06 0.06 0.05 14.3% 0.0% 16.7% 0.14 33.33% 16.7% 18,065,042 20,776,3880113 6.10 5.04 4.54 4.39 17.4% 9.9% 3.3% 0.15 33.28% 14.1% 8,936 10,8307520 3.50 3.02 2.78 2.55 13.7% 7.9% 8.3% 0.14 32.91% 5.8% 859,352 1,023,7628720 1.41 1.19 1.04 1.02 15.6% 12.6% 1.9% 0.15 32.68% 13.7% 1,022,911 1,063,4275610 5.04 4.73 4.25 3.68 6.2% 10.1% 13.4% 0.13 32.60% 7.3% 108,090 127,6063803 1.72 1.73 2.00 2.28 0.6% 15.6% 14.0% 0.14 32.56% 15.0% 166,857 182,1786834 3.59 3.40 3.09 2.62 5.3% 9.1% 15.2% 0.13 32.37% 9.9% 377,822 913,3225705 27.20 24.22 22.38 19.95 11.0% 7.6% 10.9% 0.13 32.35% 3.4% 1,295 5058728 0.31 0.34 0.37 0.41 9.7% 8.8% 10.8% 0.12 32.26% 2.0% 463,191 483,2323241 3.56 3.24 2.74 2.60 9.0% 15.4% 5.1% 0.15 32.24% 10.3% 257,941 300,1082916 4.64 4.03 3.71 3.41 13.1% 7.9% 8.1% 0.13 32.01% 5.2% 4,947 1,7828820 0.15 0.14 0.13 0.11 6.7% 7.1% 15.4% 0.13 31.87% 8.7% 12,575,621 12,553,5332305 2.99 2.44 2.26 2.18 18.4% 7.4% 3.5% 0.15 31.63% 14.9% 37,461 99,4375402 3.37 3.31 3.72 4.26 1.8% 12.4% 14.5% 0.12 30.99% 16.3% 6,349 6,6005057 4.08 3.69 3.66 4.34 9.6% 0.8% 18.6% 0.08 30.97% 28.1% 325,894 367,3828799 0.46 0.41 0.35 0.36 10.9% 14.6% 2.9% 0.13 30.73% 17.5% 165,314 247,646

NCCI Missouri Loss Cost Filing Effective January 1, 2021Analysis of the Loss Costs that are Effective from January 1, 2018 to January 1, 2021 Sorted by 2018 Absolute Cumulative Change Percent
SwingLoss Cost Percent Change Loss Cost Absolute Max Min Payroll (100's)
Class Code 2018 2019 2020 2021 2019 2020 2021 Coef. Var Change Change 2017 20185703 9.82 9.47 10.02 11.90 3.6% 5.8% 18.8% 0.11 30.14% 22.3% 879 1,8153638 1.92 1.79 1.88 2.18 6.8% 5.0% 16.0% 0.09 30.03% 22.7% 133,025 149,4642121 1.47 1.28 1.18 1.26 12.9% 7.8% 6.8% 0.09 30.00% 19.7% 798,918 816,2184038 4.97 4.26 3.83 3.71 14.3% 10.1% 3.1% 0.14 29.76% 11.2% 9,396 12,4100034 2.02 2.25 2.41 2.62 11.4% 7.1% 8.7% 0.11 29.70% 4.3% 377,904 480,8506217 4.18 3.84 3.40 3.15 8.1% 11.5% 7.4% 0.13 29.39% 4.1% 2,323,776 2,377,4609061 1.66 1.45 1.30 1.25 12.7% 10.3% 3.8% 0.13 29.09% 8.8% 312,823 322,7677232 5.85 6.66 6.86 7.53 13.8% 3.0% 9.8% 0.10 28.72% 10.8% 287,516 308,0322960 6.56 5.54 5.19 4.97 15.5% 6.3% 4.2% 0.13 28.06% 11.3% 32,383 25,6986213 1.46 1.28 1.15 1.11 12.3% 10.2% 3.5% 0.13 28.04% 8.9% 866 2,9374751 1.81 1.70 1.75 2.05 6.1% 2.9% 17.1% 0.08 27.92% 23.2% 56 08265 5.45 4.68 4.13 4.13 14.1% 11.8% 0.0% 0.14 27.54% 14.1% 277,053 308,3653004 2.24 1.93 1.77 1.71 13.8% 8.3% 3.4% 0.12 27.46% 10.4% 122 255348 4.59 3.88 3.73 3.50 15.5% 3.9% 6.2% 0.12 27.33% 11.6% 607,208 676,2631452 3.48 2.95 2.81 2.96 15.2% 4.7% 5.3% 0.10 27.14% 20.6% 15,312 15,3322688 2.99 2.71 2.42 2.30 9.4% 10.7% 5.0% 0.12 27.07% 5.7% 58,736 62,6422143 1.82 2.05 2.17 2.31 12.6% 5.9% 6.5% 0.10 26.92% 6.8% 114,218 126,1909186 16.69 16.85 14.81 13.02 1.0% 12.1% 12.1% 0.12 26.86% 13.1% 20,139 25,6174557 2.29 2.09 2.00 2.23 8.7% 4.3% 11.5% 0.06 26.46% 20.2% 229,661 230,1956045 3.16 2.96 3.12 3.52 6.3% 5.4% 12.8% 0.07 26.45% 19.1% 8,672 9,2668215 4.28 3.56 3.50 3.71 16.8% 1.7% 6.0% 0.09 25.92% 22.8% 1,009,787 1,113,8542836 1.97 2.08 2.16 2.48 5.6% 3.8% 14.8% 0.10 25.89% 11.0% 4,598 6,9592105 3.18 3.23 3.42 4.00 1.6% 5.9% 17.0% 0.11 25.79% 15.4% 5,122 6,0334361 0.86 0.76 0.71 0.67 11.6% 6.6% 5.6% 0.11 25.67% 6.0% 757,031 746,3093169 1.98 2.08 2.22 2.48 5.1% 6.7% 11.7% 0.10 25.25% 6.7% 58,056 74,8961747 1.59 1.69 1.95 1.99 6.3% 15.4% 2.1% 0.11 25.16% 13.3% 23,663 46,1925213 6.22 6.06 5.39 4.86 2.6% 11.1% 9.8% 0.11 25.11% 8.5% 1,389,996 1,493,2123132 3.80 3.68 3.68 4.45 3.2% 0.0% 20.9% 0.09 24.74% 24.1% 6,961 8,4044263 4.20 3.59 3.32 3.36 14.5% 7.5% 1.2% 0.11 24.62% 15.7% 32,872 25,9767350 12.01 11.43 10.48 9.46 4.8% 8.3% 9.7% 0.10 24.59% 4.9% 2,718 9,2202362 1.56 1.65 1.73 1.94 5.8% 4.8% 12.1% 0.09 24.36% 7.3% 2,806 1,7247225 6.19 6.15 6.02 7.28 0.6% 2.1% 20.9% 0.09 24.28% 23.0% 0 176,3662623 7.33 6.61 6.02 5.79 9.8% 8.9% 3.8% 0.11 24.20% 6.0% 28,949 28,3473110 5.33 4.71 4.21 4.19 11.6% 10.6% 0.5% 0.12 24.07% 11.2% 46,915 46,6342702 20.10 17.87 15.86 15.80 11.1% 11.2% 0.4% 0.12 24.06% 10.9% 21,077 15,1793643 2.20 2.18 2.41 2.68 0.9% 10.6% 11.2% 0.10 24.05% 12.1% 1,329,683 1,935,0984110 1.47 1.28 1.21 1.16 12.9% 5.5% 4.1% 0.11 24.02% 8.8% 13,047 47,5666235 6.63 5.49 5.33 5.18 17.2% 2.9% 2.8% 0.12 24.00% 14.4% 1,297 8,4119093 1.47 1.26 1.23 1.16 14.3% 2.4% 5.7% 0.10 23.67% 11.9% 230,029 232,4638106 4.07 3.87 4.17 4.56 4.9% 7.8% 9.4% 0.07 23.62% 14.3% 464,766 506,2249062 1.41 1.28 1.16 1.20 9.2% 9.4% 3.4% 0.09 23.58% 12.8% 96,195 92,6444686 2.51 2.61 2.41 2.16 4.0% 7.7% 10.4% 0.08 23.57% 14.4% 96,361 134,3663685 1.37 1.22 1.16 1.09 10.9% 4.9% 6.0% 0.10 23.43% 6.0% 1,395,129 1,357,6026251 3.64 3.42 3.06 2.90 6.0% 10.5% 5.2% 0.10 23.33% 5.3% 37,455 81,6244828 2.13 1.96 1.82 1.94 8.0% 7.1% 6.6% 0.07 23.32% 14.6% 1,170,027 1,365,0406214 1.91 1.68 1.58 1.52 12.0% 6.0% 3.8% 0.10 23.22% 8.2% 0 256005 5.41 4.86 4.55 4.32 10.2% 6.4% 5.1% 0.10 23.12% 5.1% 611 1,4127403 4.40 3.93 3.88 4.26 10.7% 1.3% 9.8% 0.06 23.07% 20.5% 2,042,578 2,146,3308824 2.36 2.32 1.88 1.91 1.7% 19.0% 1.6% 0.12 22.91% 20.6% 1,295,292 1,462,3732211 11.21 10.16 9.36 8.97 9.4% 7.9% 4.2% 0.10 22.89% 5.2% 131 1221924 4.14 3.84 3.58 3.32 7.2% 6.8% 7.3% 0.09 22.82% 0.5% 88,820 96,2738826 1.73 1.62 1.74 1.87 6.4% 7.4% 7.5% 0.06 22.77% 13.8% 732,634 1,370,3948387 3.10 2.79 2.55 2.48 10.0% 8.6% 2.7% 0.10 22.74% 7.3% 1,982,326 2,070,5828209 4.52 3.69 3.57 3.56 18.4% 3.3% 0.3% 0.12 22.55% 18.1% 4,449 4146319 4.12 3.63 3.42 3.30 11.9% 5.8% 3.5% 0.10 22.52% 8.4% 597,604 555,8679063 0.77 0.72 0.69 0.76 6.5% 4.2% 10.1% 0.05 22.18% 16.6% 2,271,633 2,262,0103041 4.92 4.44 4.07 3.96 9.8% 8.3% 2.7% 0.10 22.12% 7.1% 15,938 17,1155223 6.16 5.78 5.27 4.97 6.2% 8.8% 5.7% 0.10 22.11% 3.1% 126,156 141,2310042 6.19 5.34 5.32 5.69 13.7% 0.4% 7.0% 0.07 22.10% 20.7% 657,098 677,173

NCCI Missouri Loss Cost Filing Effective January 1, 2021Analysis of the Loss Costs that are Effective from January 1, 2018 to January 1, 2021 Sorted by 2018 Absolute Cumulative Change Percent
SwingLoss Cost Percent Change Loss Cost Absolute Max Min Payroll (100's)
Class Code 2018 2019 2020 2021 2019 2020 2021 Coef. Var Change Change 2017 20184902 2.91 2.60 2.39 2.34 10.7% 8.1% 2.1% 0.10 22.09% 8.6% 123,640 125,9071165 3.72 3.40 3.12 3.00 8.6% 8.2% 3.8% 0.10 22.07% 4.8% 6,649 5,8853028 4.34 3.79 3.60 3.71 12.7% 5.0% 3.1% 0.09 21.94% 15.7% 408,667 192,5489521 3.87 3.53 3.29 3.45 8.8% 6.8% 4.9% 0.07 21.83% 13.6% 170,514 183,2842503 1.37 1.43 1.31 1.21 4.4% 8.4% 7.6% 0.07 21.78% 12.8% 16,699 18,4452002 2.53 2.80 2.91 3.08 10.7% 3.9% 5.8% 0.08 21.74% 6.7% 286,338 224,2602288 4.03 3.68 3.55 3.84 8.7% 3.5% 8.2% 0.05 21.72% 16.9% 111,919 102,5878304 3.50 3.57 4.03 4.26 2.0% 12.9% 5.7% 0.10 21.71% 10.9% 283,147 267,6514133 1.70 1.85 1.80 1.96 8.8% 2.7% 8.9% 0.06 21.70% 11.6% 5,379 5,5004740 0.83 0.89 0.98 1.01 7.2% 10.1% 3.1% 0.09 21.69% 7.1% 57,329 84,0496252 3.45 3.08 2.95 2.79 10.7% 4.2% 5.4% 0.09 21.66% 6.5% 28,828 51,0573824 4.84 4.59 4.04 3.91 5.2% 12.0% 3.2% 0.10 21.56% 8.8% 778,106 921,8843085 5.15 4.37 4.41 4.61 15.1% 0.9% 4.5% 0.08 21.47% 19.7% 644,461 624,7965192 2.16 2.13 2.19 2.55 1.4% 2.8% 16.4% 0.09 21.38% 17.8% 547,627 545,0028103 2.00 1.93 1.92 2.24 3.5% 0.5% 16.7% 0.07 21.38% 20.2% 23,988 23,0480106 6.18 6.78 7.12 6.74 9.7% 5.0% 5.3% 0.06 21.36% 15.0% 733,553 721,9942157 6.56 6.25 5.97 5.32 4.7% 4.5% 10.9% 0.09 21.33% 6.4% 678,966 709,3164720 1.69 1.78 1.93 2.05 5.3% 8.4% 6.2% 0.09 21.30% 3.1% 1,172,580 862,0402835 2.69 2.47 2.22 2.26 8.2% 10.1% 1.8% 0.09 21.27% 11.9% 12,044 18,4589180 3.36 3.95 3.85 3.87 17.6% 2.5% 0.5% 0.07 21.16% 20.1% 189,396 211,8315037 12.09 11.20 10.46 9.86 7.4% 6.6% 5.7% 0.09 21.02% 1.6% 5,910 7,9334036 2.76 2.62 2.40 2.25 5.1% 8.4% 6.3% 0.09 21.01% 3.3% 41,436 47,9943081 3.53 3.85 3.95 4.27 9.1% 2.6% 8.1% 0.08 20.96% 6.5% 104,760 102,3617431 0.86 0.94 0.99 1.04 9.3% 5.3% 5.1% 0.08 20.93% 4.3% 218,864 236,5581463 10.84 9.29 9.01 8.77 14.3% 3.0% 2.7% 0.10 20.88% 11.6% 148,785 133,5663042 5.85 5.01 4.76 4.79 14.4% 5.0% 0.6% 0.10 20.82% 15.0% 0 4422710 15.12 13.52 12.46 12.62 10.6% 7.8% 1.3% 0.09 20.78% 11.9% 135,590 129,7217580 2.07 2.17 2.23 2.50 4.8% 2.8% 12.1% 0.08 20.77% 9.3% 292,739 310,3823119 1.63 1.48 1.37 1.41 9.2% 7.4% 2.9% 0.08 20.74% 12.1% 47 7358102 2.24 2.03 1.92 2.01 9.4% 5.4% 4.7% 0.07 20.71% 14.1% 150,959 197,1224000 4.91 4.89 4.50 3.99 0.4% 8.0% 11.3% 0.09 20.70% 10.9% 144,124 173,8358031 1.75 2.03 1.98 2.01 16.0% 2.5% 1.5% 0.07 20.66% 18.5% 170,284 188,5597133 2.13 2.22 2.26 2.57 4.2% 1.8% 13.7% 0.08 20.66% 11.9% 20,250 17,6176237 1.42 1.26 1.19 1.16 11.3% 5.6% 2.5% 0.09 20.41% 8.7% 4,017 3,4844240 3.00 3.49 3.48 3.37 16.3% 0.3% 3.2% 0.07 20.35% 19.5% 79,837 76,9276206 2.33 2.09 2.10 2.28 10.3% 0.5% 8.6% 0.06 20.33% 18.9% 219 897335 2.00 2.15 2.05 2.19 7.5% 4.7% 6.8% 0.04 20.18% 12.2% 0 148719 2.11 1.91 1.76 1.73 9.5% 7.9% 1.7% 0.09 20.09% 7.8% 1,929 1,3532095 2.85 2.87 3.23 3.42 0.7% 12.5% 5.9% 0.09 20.00% 11.8% 1,663,499 1,714,7518742 0.28 0.25 0.24 0.25 10.7% 4.0% 4.2% 0.07 19.94% 14.9% 60,950,716 62,480,6164244 2.63 2.36 2.32 2.48 10.3% 1.7% 6.9% 0.06 19.87% 17.2% 897,624 1,065,5068034 2.22 2.09 1.92 2.01 5.9% 8.1% 4.7% 0.06 19.83% 12.8% 184,107 207,8809554 9.01 8.04 7.50 7.40 10.8% 6.7% 1.3% 0.09 19.78% 9.4% 173,440 186,3485160 2.38 2.16 2.02 1.96 9.2% 6.5% 3.0% 0.09 19.78% 6.3% 424,211 425,1568748 0.57 0.52 0.49 0.51 8.8% 5.8% 4.1% 0.07 19.74% 12.9% 3,211,586 3,342,3289154 1.44 1.40 1.47 1.63 2.8% 5.0% 10.9% 0.07 19.66% 13.7% 930,979 1,030,7612587 1.84 1.74 1.73 1.95 5.4% 0.6% 12.7% 0.06 19.53% 18.2% 11,880 1,6534283 1.55 1.42 1.38 1.28 8.4% 2.8% 7.2% 0.08 19.52% 5.6% 239,305 221,4023114 2.81 3.06 3.25 3.35 8.9% 6.2% 3.1% 0.08 19.22% 5.8% 29,702 55,0223027 2.75 2.55 2.45 2.28 7.3% 3.9% 6.9% 0.08 19.21% 3.4% 13,485 12,4620035 1.77 1.88 2.07 2.03 6.2% 10.1% 1.9% 0.07 19.21% 12.0% 195,375 181,9338045 0.47 0.50 0.54 0.52 6.4% 8.0% 3.7% 0.06 19.15% 11.7% 4,541,227 4,434,0659084 1.30 1.20 1.12 1.16 7.7% 6.7% 3.6% 0.06 18.97% 11.3% 759,618 848,6465059 28.25 25.77 24.30 23.46 8.8% 5.7% 3.5% 0.08 18.96% 5.3% 45,627 58,4205472 5.25 5.09 4.55 4.36 3.0% 10.6% 4.2% 0.09 18.74% 7.6% 78,001 84,9313372 3.59 3.41 3.13 2.99 5.0% 8.2% 4.5% 0.08 18.72% 3.7% 246,152 158,0368002 1.50 1.58 1.62 1.78 5.3% 2.5% 9.9% 0.07 18.67% 7.3% 683,403 614,7292735 3.92 3.72 3.48 3.69 5.1% 6.5% 6.0% 0.05 18.63% 12.5% 42,339 46,5558037 1.80 1.75 1.61 1.72 2.8% 8.0% 6.8% 0.05 18.58% 14.8% 9,810,553 9,949,723
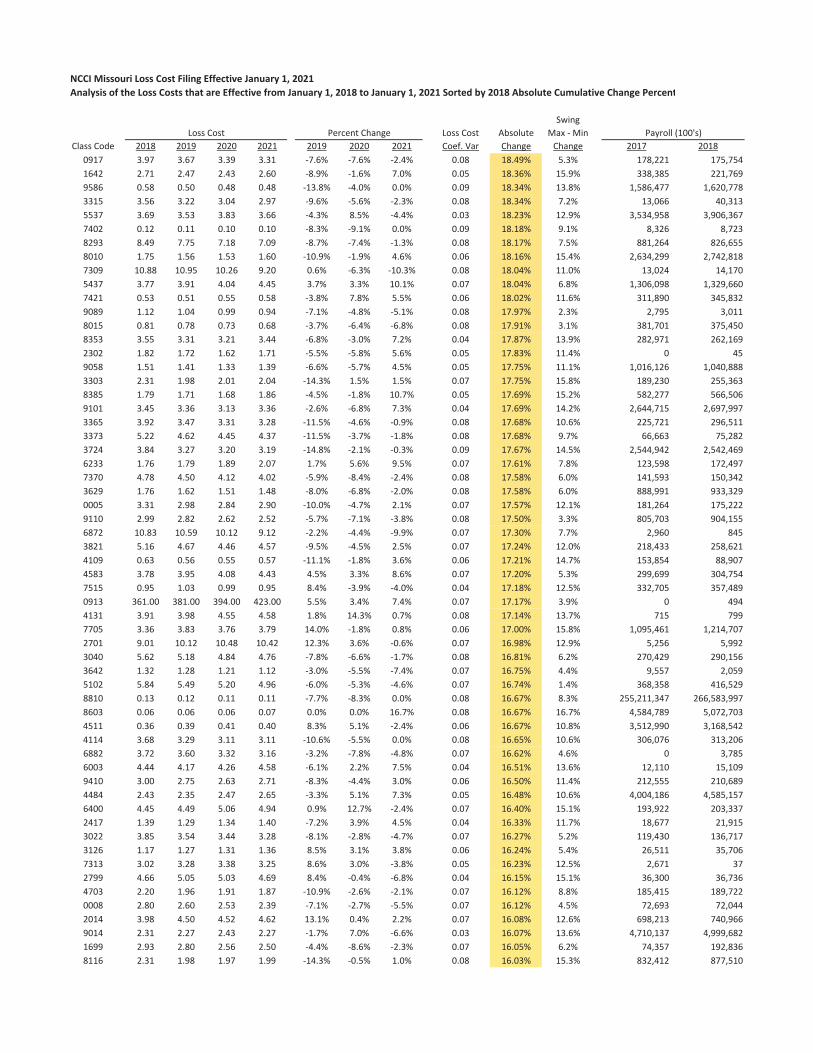
NCCI Missouri Loss Cost Filing Effective January 1, 2021Analysis of the Loss Costs that are Effective from January 1, 2018 to January 1, 2021 Sorted by 2018 Absolute Cumulative Change Percent
SwingLoss Cost Percent Change Loss Cost Absolute Max Min Payroll (100's)
Class Code 2018 2019 2020 2021 2019 2020 2021 Coef. Var Change Change 2017 20180917 3.97 3.67 3.39 3.31 7.6% 7.6% 2.4% 0.08 18.49% 5.3% 178,221 175,7541642 2.71 2.47 2.43 2.60 8.9% 1.6% 7.0% 0.05 18.36% 15.9% 338,385 221,7699586 0.58 0.50 0.48 0.48 13.8% 4.0% 0.0% 0.09 18.34% 13.8% 1,586,477 1,620,7783315 3.56 3.22 3.04 2.97 9.6% 5.6% 2.3% 0.08 18.34% 7.2% 13,066 40,3135537 3.69 3.53 3.83 3.66 4.3% 8.5% 4.4% 0.03 18.23% 12.9% 3,534,958 3,906,3677402 0.12 0.11 0.10 0.10 8.3% 9.1% 0.0% 0.09 18.18% 9.1% 8,326 8,7238293 8.49 7.75 7.18 7.09 8.7% 7.4% 1.3% 0.08 18.17% 7.5% 881,264 826,6558010 1.75 1.56 1.53 1.60 10.9% 1.9% 4.6% 0.06 18.16% 15.4% 2,634,299 2,742,8187309 10.88 10.95 10.26 9.20 0.6% 6.3% 10.3% 0.08 18.04% 11.0% 13,024 14,1705437 3.77 3.91 4.04 4.45 3.7% 3.3% 10.1% 0.07 18.04% 6.8% 1,306,098 1,329,6607421 0.53 0.51 0.55 0.58 3.8% 7.8% 5.5% 0.06 18.02% 11.6% 311,890 345,8329089 1.12 1.04 0.99 0.94 7.1% 4.8% 5.1% 0.08 17.97% 2.3% 2,795 3,0118015 0.81 0.78 0.73 0.68 3.7% 6.4% 6.8% 0.08 17.91% 3.1% 381,701 375,4508353 3.55 3.31 3.21 3.44 6.8% 3.0% 7.2% 0.04 17.87% 13.9% 282,971 262,1692302 1.82 1.72 1.62 1.71 5.5% 5.8% 5.6% 0.05 17.83% 11.4% 0 459058 1.51 1.41 1.33 1.39 6.6% 5.7% 4.5% 0.05 17.75% 11.1% 1,016,126 1,040,8883303 2.31 1.98 2.01 2.04 14.3% 1.5% 1.5% 0.07 17.75% 15.8% 189,230 255,3638385 1.79 1.71 1.68 1.86 4.5% 1.8% 10.7% 0.05 17.69% 15.2% 582,277 566,5069101 3.45 3.36 3.13 3.36 2.6% 6.8% 7.3% 0.04 17.69% 14.2% 2,644,715 2,697,9973365 3.92 3.47 3.31 3.28 11.5% 4.6% 0.9% 0.08 17.68% 10.6% 225,721 296,5113373 5.22 4.62 4.45 4.37 11.5% 3.7% 1.8% 0.08 17.68% 9.7% 66,663 75,2823724 3.84 3.27 3.20 3.19 14.8% 2.1% 0.3% 0.09 17.67% 14.5% 2,544,942 2,542,4696233 1.76 1.79 1.89 2.07 1.7% 5.6% 9.5% 0.07 17.61% 7.8% 123,598 172,4977370 4.78 4.50 4.12 4.02 5.9% 8.4% 2.4% 0.08 17.58% 6.0% 141,593 150,3423629 1.76 1.62 1.51 1.48 8.0% 6.8% 2.0% 0.08 17.58% 6.0% 888,991 933,3290005 3.31 2.98 2.84 2.90 10.0% 4.7% 2.1% 0.07 17.57% 12.1% 181,264 175,2229110 2.99 2.82 2.62 2.52 5.7% 7.1% 3.8% 0.08 17.50% 3.3% 805,703 904,1556872 10.83 10.59 10.12 9.12 2.2% 4.4% 9.9% 0.07 17.30% 7.7% 2,960 8453821 5.16 4.67 4.46 4.57 9.5% 4.5% 2.5% 0.07 17.24% 12.0% 218,433 258,6214109 0.63 0.56 0.55 0.57 11.1% 1.8% 3.6% 0.06 17.21% 14.7% 153,854 88,9074583 3.78 3.95 4.08 4.43 4.5% 3.3% 8.6% 0.07 17.20% 5.3% 299,699 304,7547515 0.95 1.03 0.99 0.95 8.4% 3.9% 4.0% 0.04 17.18% 12.5% 332,705 357,4890913 361.00 381.00 394.00 423.00 5.5% 3.4% 7.4% 0.07 17.17% 3.9% 0 4944131 3.91 3.98 4.55 4.58 1.8% 14.3% 0.7% 0.08 17.14% 13.7% 715 7997705 3.36 3.83 3.76 3.79 14.0% 1.8% 0.8% 0.06 17.00% 15.8% 1,095,461 1,214,7072701 9.01 10.12 10.48 10.42 12.3% 3.6% 0.6% 0.07 16.98% 12.9% 5,256 5,9923040 5.62 5.18 4.84 4.76 7.8% 6.6% 1.7% 0.08 16.81% 6.2% 270,429 290,1563642 1.32 1.28 1.21 1.12 3.0% 5.5% 7.4% 0.07 16.75% 4.4% 9,557 2,0595102 5.84 5.49 5.20 4.96 6.0% 5.3% 4.6% 0.07 16.74% 1.4% 368,358 416,5298810 0.13 0.12 0.11 0.11 7.7% 8.3% 0.0% 0.08 16.67% 8.3% 255,211,347 266,583,9978603 0.06 0.06 0.06 0.07 0.0% 0.0% 16.7% 0.08 16.67% 16.7% 4,584,789 5,072,7034511 0.36 0.39 0.41 0.40 8.3% 5.1% 2.4% 0.06 16.67% 10.8% 3,512,990 3,168,5424114 3.68 3.29 3.11 3.11 10.6% 5.5% 0.0% 0.08 16.65% 10.6% 306,076 313,2066882 3.72 3.60 3.32 3.16 3.2% 7.8% 4.8% 0.07 16.62% 4.6% 0 3,7856003 4.44 4.17 4.26 4.58 6.1% 2.2% 7.5% 0.04 16.51% 13.6% 12,110 15,1099410 3.00 2.75 2.63 2.71 8.3% 4.4% 3.0% 0.06 16.50% 11.4% 212,555 210,6894484 2.43 2.35 2.47 2.65 3.3% 5.1% 7.3% 0.05 16.48% 10.6% 4,004,186 4,585,1576400 4.45 4.49 5.06 4.94 0.9% 12.7% 2.4% 0.07 16.40% 15.1% 193,922 203,3372417 1.39 1.29 1.34 1.40 7.2% 3.9% 4.5% 0.04 16.33% 11.7% 18,677 21,9153022 3.85 3.54 3.44 3.28 8.1% 2.8% 4.7% 0.07 16.27% 5.2% 119,430 136,7173126 1.17 1.27 1.31 1.36 8.5% 3.1% 3.8% 0.06 16.24% 5.4% 26,511 35,7067313 3.02 3.28 3.38 3.25 8.6% 3.0% 3.8% 0.05 16.23% 12.5% 2,671 372799 4.66 5.05 5.03 4.69 8.4% 0.4% 6.8% 0.04 16.15% 15.1% 36,300 36,7364703 2.20 1.96 1.91 1.87 10.9% 2.6% 2.1% 0.07 16.12% 8.8% 185,415 189,7220008 2.80 2.60 2.53 2.39 7.1% 2.7% 5.5% 0.07 16.12% 4.5% 72,693 72,0442014 3.98 4.50 4.52 4.62 13.1% 0.4% 2.2% 0.07 16.08% 12.6% 698,213 740,9669014 2.31 2.27 2.43 2.27 1.7% 7.0% 6.6% 0.03 16.07% 13.6% 4,710,137 4,999,6821699 2.93 2.80 2.56 2.50 4.4% 8.6% 2.3% 0.07 16.05% 6.2% 74,357 192,8368116 2.31 1.98 1.97 1.99 14.3% 0.5% 1.0% 0.08 16.03% 15.3% 832,412 877,510

NCCI Missouri Loss Cost Filing Effective January 1, 2021Analysis of the Loss Costs that are Effective from January 1, 2018 to January 1, 2021 Sorted by 2018 Absolute Cumulative Change Percent
SwingLoss Cost Percent Change Loss Cost Absolute Max Min Payroll (100's)
Class Code 2018 2019 2020 2021 2019 2020 2021 Coef. Var Change Change 2017 20183188 2.15 2.31 2.16 2.19 7.4% 6.5% 1.4% 0.03 16.01% 13.9% 280,118 270,9584307 1.58 1.70 1.68 1.79 7.6% 1.2% 6.5% 0.05 15.99% 8.8% 101,471 83,4895535 6.10 5.43 5.36 5.52 11.0% 1.3% 3.0% 0.06 15.77% 14.0% 1,004,638 964,3967420 7.58 7.18 6.86 6.50 5.3% 4.5% 5.2% 0.07 15.74% 0.8% 9,776 9,3533807 2.03 2.00 2.02 2.28 1.5% 1.0% 12.9% 0.06 15.68% 14.3% 216,020 222,5452081 5.65 4.87 4.79 4.79 13.8% 1.6% 0.0% 0.08 15.67% 13.8% 33,038 24,8791438 12.34 11.66 12.64 12.78 5.5% 8.4% 1.1% 0.04 15.65% 13.9% 49,458 295,5454611 1.04 0.99 0.98 1.07 4.8% 1.0% 9.2% 0.04 15.59% 14.0% 3,157,722 3,066,9412841 3.70 3.55 3.55 3.94 4.1% 0.0% 11.0% 0.05 15.49% 15.0% 47,794 51,2115183 3.02 2.75 2.65 2.59 8.9% 3.6% 2.3% 0.07 15.46% 6.7% 4,282,023 4,403,4818227 3.27 2.93 2.85 2.90 10.4% 2.7% 1.8% 0.06 15.40% 12.2% 1,122,259 1,170,0642016 2.62 2.93 2.88 2.84 11.8% 1.7% 1.4% 0.05 15.32% 13.5% 223,858 246,7918039 1.11 1.07 1.11 1.19 3.6% 3.7% 7.2% 0.04 15.22% 10.8% 1,152,381 1,056,2955474 5.48 5.06 4.73 4.75 7.7% 6.5% 0.4% 0.07 15.17% 8.1% 1,933,498 1,918,3135445 4.62 4.42 4.38 3.97 4.3% 0.9% 9.4% 0.06 15.13% 8.5% 1,805,940 1,792,9453881 4.15 3.77 3.69 3.57 9.2% 2.1% 3.3% 0.07 15.10% 7.0% 183,066 197,7964653 1.34 1.28 1.29 1.41 4.5% 0.8% 9.3% 0.04 15.09% 13.8% 3,974 7,0044741 2.29 2.14 2.22 2.31 6.6% 3.7% 4.1% 0.03 15.01% 10.6% 123,956 80,8536836 2.99 3.19 3.02 3.09 6.7% 5.3% 2.3% 0.03 14.98% 12.0% 129,200 162,0689102 2.56 2.71 2.50 2.48 5.9% 7.7% 0.8% 0.04 14.98% 13.6% 2,248,866 2,435,0986825 2.91 2.95 2.74 2.58 1.4% 7.1% 5.8% 0.06 14.93% 8.5% 311,921 155,4186826 4.15 4.34 4.21 3.93 4.6% 3.0% 6.7% 0.04 14.87% 11.2% 57 03581 1.22 1.16 1.22 1.27 4.9% 5.2% 4.1% 0.04 14.87% 10.1% 85,685 67,3035479 7.13 6.44 6.14 6.14 9.7% 4.7% 0.0% 0.07 14.79% 9.7% 154,867 168,3594149 0.89 0.86 0.82 0.77 3.4% 4.7% 6.1% 0.06 14.77% 2.7% 159,696 173,6293826 0.97 1.02 1.00 1.07 5.2% 2.0% 7.0% 0.04 14.72% 9.0% 138,465 123,8555951 0.34 0.34 0.35 0.39 0.0% 2.9% 11.4% 0.07 14.71% 11.4% 94,838 38,2016325 3.24 3.06 2.83 2.80 5.6% 7.5% 1.1% 0.07 14.69% 6.5% 544,279 601,5935551 15.17 13.75 13.67 14.25 9.4% 0.6% 4.2% 0.05 14.66% 13.6% 867,605 813,6205443 2.80 2.62 2.80 2.82 6.4% 6.9% 0.7% 0.03 14.55% 13.3% 7,630 3,4598292 3.61 3.32 3.42 3.52 8.0% 3.0% 2.9% 0.04 14.54% 11.0% 1,465,865 1,596,8603064 3.32 3.16 3.32 3.45 4.8% 5.1% 3.9% 0.04 14.44% 9.9% 131,653 147,2997720 2.58 2.47 2.53 2.71 4.3% 2.4% 7.1% 0.04 14.39% 11.4% 3,432,603 3,694,7165462 5.39 5.37 4.99 4.67 0.4% 7.1% 6.4% 0.07 14.37% 6.7% 372,133 338,7064635 3.19 3.01 2.94 2.77 5.6% 2.3% 5.8% 0.06 14.35% 3.5% 326,682 348,1782380 2.26 2.10 1.98 2.00 7.1% 5.7% 1.0% 0.06 14.34% 8.1% 9,834 6482881 3.20 3.12 2.93 2.78 2.5% 6.1% 5.1% 0.06 14.31% 3.6% 227,858 218,9878601 0.21 0.23 0.22 0.22 9.5% 4.3% 0.0% 0.04 14.29% 13.9% 10,878,465 11,011,0918871 0.07 0.07 0.06 0.06 0.0% 14.3% 0.0% 0.09 14.29% 14.3% 2,456,877 3,116,0843336 2.92 2.78 2.63 2.72 4.8% 5.4% 3.4% 0.04 14.23% 8.8% 75,594 87,9324243 2.20 2.06 2.06 2.21 6.4% 0.0% 7.3% 0.04 14.11% 13.6% 490,558 528,6674351 0.78 0.78 0.83 0.89 0.0% 6.4% 7.2% 0.06 14.10% 7.2% 37,094 22,7509156 1.92 2.04 2.10 2.19 6.3% 2.9% 4.3% 0.05 14.06% 3.3% 383,059 420,2518061 1.78 1.66 1.61 1.55 6.7% 3.0% 3.7% 0.06 14.05% 3.7% 1,776,589 1,819,6518001 1.77 1.74 1.88 1.95 1.7% 8.0% 3.7% 0.05 13.97% 9.7% 384,731 398,0209519 3.21 3.30 3.15 3.34 2.8% 4.5% 6.0% 0.03 13.96% 10.6% 464,515 474,0501701 3.38 3.10 3.08 2.94 8.3% 0.6% 4.5% 0.06 13.94% 7.6% 772,916 856,5105221 3.95 3.79 3.94 4.15 4.1% 4.0% 5.3% 0.04 13.93% 9.4% 2,685,246 2,795,0212790 1.58 1.62 1.63 1.80 2.5% 0.6% 10.4% 0.06 13.92% 9.8% 34,746 34,7147610 0.36 0.37 0.39 0.41 2.8% 5.4% 5.1% 0.06 13.89% 2.6% 2,660,830 2,845,3448393 1.31 1.22 1.24 1.30 6.9% 1.6% 4.8% 0.03 13.88% 11.7% 1,760,453 1,983,3394410 2.82 2.95 2.88 3.06 4.6% 2.4% 6.3% 0.04 13.79% 8.6% 1,310,351 1,404,2402174 2.95 2.75 2.76 2.93 6.8% 0.4% 6.2% 0.04 13.77% 12.9% 3,391 1583220 2.42 2.22 2.15 2.19 8.3% 3.2% 1.9% 0.05 13.76% 10.1% 290,975 283,3253270 4.18 3.67 3.65 3.62 12.2% 0.5% 0.8% 0.07 13.74% 11.7% 135,829 154,1539170 9.54 9.68 10.34 10.85 1.5% 6.8% 4.9% 0.06 13.73% 5.4% 42,254 40,9689600 2.79 2.83 2.96 3.17 1.4% 4.6% 7.1% 0.06 13.62% 5.7% 2,791 7,8553634 1.59 1.65 1.54 1.50 3.8% 6.7% 2.6% 0.04 13.57% 10.4% 410,059 487,4929505 3.62 3.99 3.98 3.87 10.2% 0.3% 2.8% 0.04 13.55% 13.0% 82,453 95,533

NCCI Missouri Loss Cost Filing Effective January 1, 2021Analysis of the Loss Costs that are Effective from January 1, 2018 to January 1, 2021 Sorted by 2018 Absolute Cumulative Change Percent
SwingLoss Cost Percent Change Loss Cost Absolute Max Min Payroll (100's)
Class Code 2018 2019 2020 2021 2019 2020 2021 Coef. Var Change Change 2017 20188021 3.03 2.83 2.67 2.69 6.6% 5.7% 0.7% 0.06 13.47% 7.3% 394,553 403,6845507 3.58 3.21 3.20 3.28 10.3% 0.3% 2.5% 0.05 13.45% 12.8% 122,683 170,8564717 1.86 1.99 2.05 2.11 7.0% 3.0% 2.9% 0.05 13.44% 4.1% 80,736 79,8698861 1.18 1.16 1.14 1.25 1.7% 1.7% 9.6% 0.04 13.43% 11.4% 5,358,532 5,866,3398606 1.92 1.78 1.69 1.68 7.3% 5.1% 0.6% 0.06 13.38% 6.7% 1,437 2,0398855 0.16 0.15 0.14 0.14 6.3% 6.7% 0.0% 0.06 13.33% 6.7% 25,075,510 28,781,8449060 1.14 1.11 1.06 1.12 2.6% 4.5% 5.7% 0.03 13.33% 10.2% 1,341,056 1,420,8762065 1.94 1.89 1.75 1.70 2.6% 7.4% 2.9% 0.06 13.32% 4.8% 28,401 15,7127090 5.83 5.95 5.67 5.33 2.1% 4.7% 6.0% 0.05 13.27% 8.1% 645 1,0358263 4.65 4.58 4.33 4.58 1.5% 5.5% 5.8% 0.03 13.23% 11.2% 48,854 31,9582651 1.97 2.13 2.21 2.23 8.1% 3.8% 0.9% 0.06 13.20% 7.2% 85,208 75,8148264 5.05 4.63 4.52 4.43 8.3% 2.4% 2.0% 0.06 13.10% 6.3% 215,577 235,4913179 2.21 2.04 2.01 2.08 7.7% 1.5% 3.5% 0.04 13.08% 11.2% 1,643,733 1,922,4092110 2.00 1.89 1.80 1.76 5.5% 4.8% 2.2% 0.06 12.98% 3.3% 54,858 45,3274239 1.80 1.79 1.90 2.01 0.6% 6.1% 5.8% 0.05 12.91% 6.7% 85,368 90,3974923 0.99 0.93 0.97 0.99 6.1% 4.3% 2.1% 0.03 12.90% 10.4% 24,030 29,4817405 1.21 1.26 1.19 1.22 4.1% 5.6% 2.5% 0.02 12.69% 9.7% 832,298 891,3148058 2.25 2.23 2.33 2.49 0.9% 4.5% 6.9% 0.05 12.65% 7.8% 1,902,765 1,974,0999620 1.10 1.02 1.01 1.05 7.3% 1.0% 4.0% 0.04 12.61% 11.2% 549,067 527,2093145 2.48 2.31 2.26 2.33 6.9% 2.2% 3.1% 0.04 12.55% 10.0% 106,383 120,4293385 0.84 0.81 0.82 0.88 3.6% 1.2% 7.3% 0.04 12.52% 10.9% 12,589 4,8025473 7.67 7.13 6.81 6.85 7.0% 4.5% 0.6% 0.06 12.50% 7.6% 103,032 101,6668013 0.34 0.32 0.32 0.34 5.9% 0.0% 6.3% 0.03 12.50% 12.1% 1,397,188 1,338,7649182 1.71 1.63 1.67 1.75 4.7% 2.5% 4.8% 0.03 12.38% 9.5% 450,631 526,6544452 2.79 2.73 2.59 2.47 2.2% 5.1% 4.6% 0.05 12.36% 3.0% 515,162 631,2432413 2.36 2.45 2.52 2.65 3.8% 2.9% 5.2% 0.05 12.29% 2.3% 8,340 7,8324299 2.21 2.13 2.07 1.96 3.6% 2.8% 5.3% 0.05 12.20% 2.5% 2,380,979 2,263,9426884 5.67 5.41 5.16 5.03 4.6% 4.6% 2.5% 0.05 12.18% 2.1% 38 08391 2.11 1.97 1.94 2.01 6.6% 1.5% 3.6% 0.04 12.17% 10.2% 7,833,459 8,388,3184034 6.48 6.77 6.33 6.28 4.5% 6.5% 0.8% 0.03 12.14% 11.0% 382,878 398,0268381 2.33 2.31 2.10 2.06 0.9% 9.1% 1.9% 0.06 12.12% 8.2% 73,001 78,2511322 6.49 6.25 6.10 6.44 3.7% 2.4% 5.6% 0.03 12.11% 9.3% 0 254273 2.48 2.32 2.27 2.34 6.5% 2.2% 3.1% 0.04 12.10% 9.5% 644,283 644,7409402 3.72 3.81 3.87 4.17 2.4% 1.6% 7.8% 0.05 12.10% 6.2% 438,231 525,6032731 3.51 3.49 3.68 3.47 0.6% 5.4% 5.7% 0.03 12.10% 11.2% 394,027 409,3520170 2.25 2.05 1.99 1.99 8.9% 2.9% 0.0% 0.06 12.08% 8.9% 27 313648 1.48 1.43 1.46 1.55 3.4% 2.1% 6.2% 0.03 12.05% 9.5% 88,748 94,3928725 1.83 1.87 1.99 2.05 2.2% 6.4% 3.0% 0.05 12.02% 4.2% 18,964 13,3733113 1.85 1.85 1.76 1.64 0.0% 4.9% 6.8% 0.06 12.01% 6.8% 1,426,505 1,438,3432501 2.26 2.35 2.45 2.53 4.0% 4.3% 3.3% 0.05 11.95% 1.0% 1,077,937 1,113,9764683 4.01 3.73 3.58 3.60 7.0% 4.0% 0.6% 0.05 11.91% 7.5% 6,143 54,6773681 0.81 0.77 0.73 0.72 4.9% 5.2% 1.4% 0.05 11.90% 3.8% 2,446,154 3,200,6602402 2.27 2.36 2.46 2.54 4.0% 4.2% 3.3% 0.05 11.89% 1.0% 1,238 1,5322714 5.06 4.74 4.62 4.50 6.3% 2.5% 2.6% 0.05 11.85% 3.8% 353 6088901 0.18 0.18 0.17 0.16 0.0% 5.6% 5.9% 0.06 11.76% 5.9% 11,414,928 10,920,5416216 4.39 4.20 3.96 4.01 4.3% 5.7% 1.3% 0.05 11.68% 7.0% 11,090 10,2488008 0.91 0.86 0.88 0.91 5.5% 2.3% 3.4% 0.03 11.63% 8.9% 3,667,061 3,637,1198392 2.36 2.17 2.12 2.10 8.1% 2.3% 0.9% 0.05 11.58% 7.1% 323,614 346,8973822 3.87 3.62 3.50 3.45 6.5% 3.3% 1.4% 0.05 11.56% 5.0% 12,257 21,2643300 3.84 3.92 3.93 4.28 2.1% 0.3% 8.9% 0.05 11.46% 8.7% 350,380 346,1892923 1.98 1.91 1.85 1.77 3.5% 3.1% 4.3% 0.05 11.41% 1.2% 9,190 8,6468835 1.95 1.90 1.76 1.74 2.6% 7.4% 1.1% 0.06 11.37% 6.2% 5,714,031 5,932,0845491 1.58 1.50 1.54 1.49 5.1% 2.7% 3.2% 0.03 11.37% 7.7% 28,258 23,9572131 2.33 2.21 2.22 2.34 5.2% 0.5% 5.4% 0.03 11.34% 10.6% 86,271 86,4945403 5.51 5.12 4.98 4.92 7.1% 2.7% 1.2% 0.05 11.33% 5.9% 2,787,745 2,937,9418232 5.39 4.90 5.00 5.00 9.1% 2.0% 0.0% 0.04 11.32% 11.1% 2,831,565 2,975,5143111 2.33 2.32 2.15 2.08 0.4% 7.3% 3.3% 0.06 11.30% 6.9% 1,118 4,1123647 2.48 2.49 2.49 2.76 0.4% 0.0% 10.8% 0.05 11.29% 10.8% 1,110,849 1,135,1407395 3.72 3.73 3.92 4.14 0.3% 5.1% 5.6% 0.05 11.29% 5.3% 361 1,502

NCCI Missouri Loss Cost Filing Effective January 1, 2021Analysis of the Loss Costs that are Effective from January 1, 2018 to January 1, 2021 Sorted by 2018 Absolute Cumulative Change Percent
SwingLoss Cost Percent Change Loss Cost Absolute Max Min Payroll (100's)
Class Code 2018 2019 2020 2021 2019 2020 2021 Coef. Var Change Change 2017 20182039 2.41 2.49 2.50 2.68 3.3% 0.4% 7.2% 0.05 11.20% 6.8% 433,000 427,4938370 3.74 3.43 3.45 3.52 8.3% 0.6% 2.0% 0.04 11.13% 10.3% 494,192 503,3682070 4.31 4.03 3.91 3.86 6.5% 3.0% 1.3% 0.05 11.07% 5.2% 531,989 996,7948032 1.84 1.74 1.70 1.75 5.4% 2.3% 2.9% 0.03 11.03% 8.4% 277,539 344,2977540 2.80 2.72 2.55 2.51 2.9% 6.3% 1.6% 0.05 11.00% 4.7% 8 1505020 4.48 4.51 4.23 4.07 0.7% 6.2% 3.8% 0.05 10.96% 6.9% 97,758 86,1704459 2.42 2.29 2.40 2.39 5.4% 4.8% 0.4% 0.02 10.89% 10.2% 793,725 1,103,4938235 3.23 3.54 3.54 3.58 9.6% 0.0% 1.1% 0.05 10.84% 9.6% 127,854 127,5999403 6.20 6.58 6.79 6.87 6.1% 3.2% 1.2% 0.05 10.81% 5.0% 1,342,733 1,385,4861710 3.10 3.06 3.03 3.28 1.3% 1.0% 8.3% 0.04 10.72% 9.5% 25,469 29,8257230 6.05 6.20 6.01 6.30 2.5% 3.1% 4.8% 0.02 10.72% 7.9% 281,679 366,2487605 1.85 1.70 1.66 1.66 8.1% 2.4% 0.0% 0.05 10.65% 8.1% 935,580 953,7948709 4.16 4.36 4.35 4.12 4.8% 0.2% 5.3% 0.03 10.60% 10.1% 753 7368288 7.60 6.94 6.89 6.96 8.7% 0.7% 1.0% 0.05 10.58% 9.7% 159,929 145,1594018 4.91 4.87 4.95 5.34 0.8% 1.6% 7.9% 0.04 10.54% 8.7% 144,069 156,5890908 115.00 121.00 116.00 117.00 5.2% 4.1% 0.9% 0.02 10.51% 9.3% 0 3768018 2.15 2.12 2.19 2.31 1.4% 3.3% 5.5% 0.04 10.48% 6.9% 5,246,371 5,668,3368831 1.27 1.15 1.14 1.14 9.4% 0.9% 0.0% 0.05 10.40% 9.4% 2,526,353 2,668,2261654 3.71 3.77 3.47 3.45 1.6% 8.0% 0.6% 0.05 10.34% 9.6% 30,265 29,8114692 0.78 0.81 0.82 0.86 3.8% 1.2% 4.9% 0.04 10.26% 3.6% 282,864 296,4517317 7.96 8.38 8.02 7.99 5.3% 4.3% 0.4% 0.02 10.21% 9.6% 13,103 10,2007590 2.83 2.70 2.59 2.62 4.6% 4.1% 1.2% 0.04 10.12% 5.8% 121,854 126,4506229 4.07 4.03 3.91 4.14 1.0% 3.0% 5.9% 0.02 10.11% 8.9% 99,095 96,8529083 0.94 0.92 0.91 0.97 2.1% 1.1% 6.6% 0.03 10.04% 8.7% 11,249,827 11,831,2857382 4.42 4.32 4.07 4.14 2.3% 5.8% 1.7% 0.04 10.04% 7.5% 1,327,485 1,371,3598291 3.08 3.01 2.89 2.99 2.3% 4.0% 3.5% 0.03 10.03% 7.4% 265,911 291,8650050 4.84 4.46 4.48 4.55 7.9% 0.4% 1.6% 0.04 10.03% 9.4% 132,497 157,9343827 2.55 2.41 2.35 2.39 5.5% 2.5% 1.7% 0.04 9.96% 7.2% 4,495 1,0552883 2.90 2.96 2.83 2.74 2.1% 4.4% 3.2% 0.03 9.94% 6.5% 1,273,831 1,362,0817538 5.39 5.51 5.13 5.10 2.2% 6.9% 0.6% 0.04 9.92% 9.1% 759,145 781,6499534 4.40 4.17 4.02 3.99 5.2% 3.6% 0.7% 0.05 9.83% 4.5% 151,341 169,3943808 3.76 3.55 3.50 3.59 5.6% 1.4% 2.6% 0.03 9.83% 8.2% 303,619 326,2498279 5.42 5.21 5.01 5.10 3.9% 3.8% 1.8% 0.03 9.80% 5.7% 61,467 45,0790037 3.30 3.25 3.02 2.99 1.5% 7.1% 1.0% 0.05 9.78% 6.1% 467,083 516,0318017 1.41 1.38 1.31 1.28 2.1% 5.1% 2.3% 0.04 9.77% 2.9% 8,750,505 9,161,5845645 9.27 8.92 9.19 8.95 3.8% 3.0% 2.6% 0.02 9.71% 6.8% 2,236,385 2,302,3603118 2.19 2.14 2.05 1.99 2.3% 4.2% 2.9% 0.04 9.70% 1.9% 17,087 15,2723548 1.52 1.44 1.43 1.48 5.3% 0.7% 3.5% 0.03 9.70% 8.8% 25,666 29,2069178 10.97 10.78 10.14 10.32 1.7% 5.9% 1.8% 0.04 9.68% 7.7% 114,952 111,4188800 1.27 1.30 1.23 1.21 2.4% 5.4% 1.6% 0.03 9.63% 7.7% 349,466 414,2471430 5.21 5.15 5.40 5.22 1.2% 4.9% 3.3% 0.02 9.60% 8.2% 177,994 186,5364558 1.87 1.79 1.71 1.72 4.3% 4.5% 0.6% 0.04 9.58% 5.1% 441,207 460,4165506 4.82 4.56 4.68 4.62 5.4% 2.6% 1.3% 0.02 9.55% 8.0% 1,835,083 1,910,7023632 3.07 2.86 2.80 2.81 6.8% 2.1% 0.4% 0.04 9.47% 7.2% 3,679,662 4,028,3324062 2.44 2.52 2.63 2.67 3.3% 4.4% 1.5% 0.04 9.43% 2.8% 15,157 19,3588350 5.75 5.36 5.32 5.23 6.8% 0.7% 1.7% 0.04 9.40% 6.0% 717,830 768,0757360 3.94 3.73 3.66 3.73 5.3% 1.9% 1.9% 0.03 9.36% 7.2% 249,567 336,7055191 0.67 0.65 0.66 0.69 3.0% 1.5% 4.5% 0.03 9.32% 7.5% 3,463,112 3,400,4873122 2.02 1.96 2.03 2.08 3.0% 3.6% 2.5% 0.02 9.27% 6.5% 819 7404130 3.32 3.17 3.09 3.03 4.5% 2.5% 1.9% 0.04 9.24% 2.6% 151,569 156,8534111 1.83 1.75 1.73 1.79 4.4% 1.1% 3.5% 0.02 9.23% 7.8% 88,324 7,4662089 3.43 3.33 3.17 3.13 2.9% 4.8% 1.3% 0.04 9.22% 3.5% 1,986,321 2,186,5443383 1.42 1.48 1.51 1.55 4.2% 2.0% 2.6% 0.04 9.15% 2.2% 32,653 32,7419016 2.63 2.74 2.85 2.83 4.2% 4.0% 0.7% 0.04 9.13% 4.9% 385,208 431,3163726 3.40 3.32 3.18 3.25 2.4% 4.2% 2.2% 0.03 9.02% 6.4% 159,054 226,0033180 2.69 2.78 2.64 2.65 3.3% 5.0% 0.4% 0.02 8.96% 8.4% 171,174 222,3902570 4.02 3.87 3.77 3.86 3.7% 2.6% 2.4% 0.03 8.95% 6.1% 18,355 29,3674279 2.18 2.16 2.24 2.33 0.9% 3.7% 4.0% 0.03 8.86% 4.9% 306,460 341,1031164 4.64 4.59 4.39 4.25 1.1% 4.4% 3.2% 0.04 8.85% 3.3% 628,282 880,843
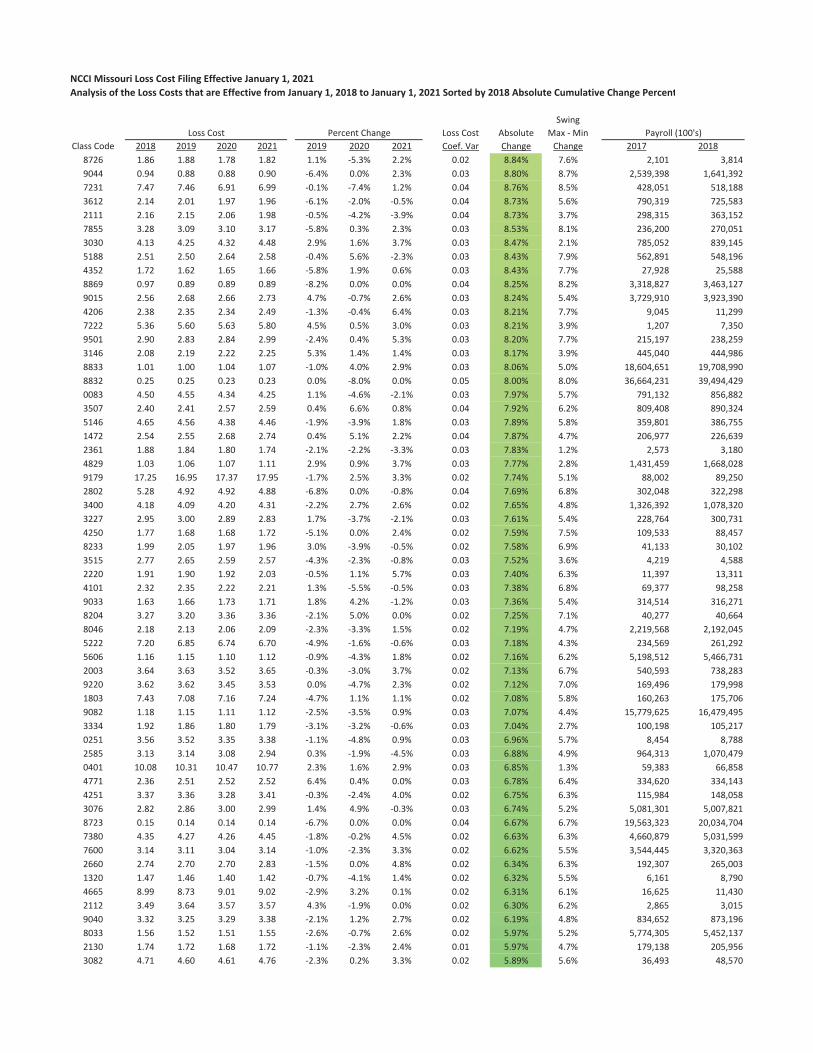
NCCI Missouri Loss Cost Filing Effective January 1, 2021Analysis of the Loss Costs that are Effective from January 1, 2018 to January 1, 2021 Sorted by 2018 Absolute Cumulative Change Percent
SwingLoss Cost Percent Change Loss Cost Absolute Max Min Payroll (100's)
Class Code 2018 2019 2020 2021 2019 2020 2021 Coef. Var Change Change 2017 20188726 1.86 1.88 1.78 1.82 1.1% 5.3% 2.2% 0.02 8.84% 7.6% 2,101 3,8149044 0.94 0.88 0.88 0.90 6.4% 0.0% 2.3% 0.03 8.80% 8.7% 2,539,398 1,641,3927231 7.47 7.46 6.91 6.99 0.1% 7.4% 1.2% 0.04 8.76% 8.5% 428,051 518,1883612 2.14 2.01 1.97 1.96 6.1% 2.0% 0.5% 0.04 8.73% 5.6% 790,319 725,5832111 2.16 2.15 2.06 1.98 0.5% 4.2% 3.9% 0.04 8.73% 3.7% 298,315 363,1527855 3.28 3.09 3.10 3.17 5.8% 0.3% 2.3% 0.03 8.53% 8.1% 236,200 270,0513030 4.13 4.25 4.32 4.48 2.9% 1.6% 3.7% 0.03 8.47% 2.1% 785,052 839,1455188 2.51 2.50 2.64 2.58 0.4% 5.6% 2.3% 0.03 8.43% 7.9% 562,891 548,1964352 1.72 1.62 1.65 1.66 5.8% 1.9% 0.6% 0.03 8.43% 7.7% 27,928 25,5888869 0.97 0.89 0.89 0.89 8.2% 0.0% 0.0% 0.04 8.25% 8.2% 3,318,827 3,463,1279015 2.56 2.68 2.66 2.73 4.7% 0.7% 2.6% 0.03 8.24% 5.4% 3,729,910 3,923,3904206 2.38 2.35 2.34 2.49 1.3% 0.4% 6.4% 0.03 8.21% 7.7% 9,045 11,2997222 5.36 5.60 5.63 5.80 4.5% 0.5% 3.0% 0.03 8.21% 3.9% 1,207 7,3509501 2.90 2.83 2.84 2.99 2.4% 0.4% 5.3% 0.03 8.20% 7.7% 215,197 238,2593146 2.08 2.19 2.22 2.25 5.3% 1.4% 1.4% 0.03 8.17% 3.9% 445,040 444,9868833 1.01 1.00 1.04 1.07 1.0% 4.0% 2.9% 0.03 8.06% 5.0% 18,604,651 19,708,9908832 0.25 0.25 0.23 0.23 0.0% 8.0% 0.0% 0.05 8.00% 8.0% 36,664,231 39,494,4290083 4.50 4.55 4.34 4.25 1.1% 4.6% 2.1% 0.03 7.97% 5.7% 791,132 856,8823507 2.40 2.41 2.57 2.59 0.4% 6.6% 0.8% 0.04 7.92% 6.2% 809,408 890,3245146 4.65 4.56 4.38 4.46 1.9% 3.9% 1.8% 0.03 7.89% 5.8% 359,801 386,7551472 2.54 2.55 2.68 2.74 0.4% 5.1% 2.2% 0.04 7.87% 4.7% 206,977 226,6392361 1.88 1.84 1.80 1.74 2.1% 2.2% 3.3% 0.03 7.83% 1.2% 2,573 3,1804829 1.03 1.06 1.07 1.11 2.9% 0.9% 3.7% 0.03 7.77% 2.8% 1,431,459 1,668,0289179 17.25 16.95 17.37 17.95 1.7% 2.5% 3.3% 0.02 7.74% 5.1% 88,002 89,2502802 5.28 4.92 4.92 4.88 6.8% 0.0% 0.8% 0.04 7.69% 6.8% 302,048 322,2983400 4.18 4.09 4.20 4.31 2.2% 2.7% 2.6% 0.02 7.65% 4.8% 1,326,392 1,078,3203227 2.95 3.00 2.89 2.83 1.7% 3.7% 2.1% 0.03 7.61% 5.4% 228,764 300,7314250 1.77 1.68 1.68 1.72 5.1% 0.0% 2.4% 0.02 7.59% 7.5% 109,533 88,4578233 1.99 2.05 1.97 1.96 3.0% 3.9% 0.5% 0.02 7.58% 6.9% 41,133 30,1023515 2.77 2.65 2.59 2.57 4.3% 2.3% 0.8% 0.03 7.52% 3.6% 4,219 4,5882220 1.91 1.90 1.92 2.03 0.5% 1.1% 5.7% 0.03 7.40% 6.3% 11,397 13,3114101 2.32 2.35 2.22 2.21 1.3% 5.5% 0.5% 0.03 7.38% 6.8% 69,377 98,2589033 1.63 1.66 1.73 1.71 1.8% 4.2% 1.2% 0.03 7.36% 5.4% 314,514 316,2718204 3.27 3.20 3.36 3.36 2.1% 5.0% 0.0% 0.02 7.25% 7.1% 40,277 40,6648046 2.18 2.13 2.06 2.09 2.3% 3.3% 1.5% 0.02 7.19% 4.7% 2,219,568 2,192,0455222 7.20 6.85 6.74 6.70 4.9% 1.6% 0.6% 0.03 7.18% 4.3% 234,569 261,2925606 1.16 1.15 1.10 1.12 0.9% 4.3% 1.8% 0.02 7.16% 6.2% 5,198,512 5,466,7312003 3.64 3.63 3.52 3.65 0.3% 3.0% 3.7% 0.02 7.13% 6.7% 540,593 738,2839220 3.62 3.62 3.45 3.53 0.0% 4.7% 2.3% 0.02 7.12% 7.0% 169,496 179,9981803 7.43 7.08 7.16 7.24 4.7% 1.1% 1.1% 0.02 7.08% 5.8% 160,263 175,7069082 1.18 1.15 1.11 1.12 2.5% 3.5% 0.9% 0.03 7.07% 4.4% 15,779,625 16,479,4953334 1.92 1.86 1.80 1.79 3.1% 3.2% 0.6% 0.03 7.04% 2.7% 100,198 105,2170251 3.56 3.52 3.35 3.38 1.1% 4.8% 0.9% 0.03 6.96% 5.7% 8,454 8,7882585 3.13 3.14 3.08 2.94 0.3% 1.9% 4.5% 0.03 6.88% 4.9% 964,313 1,070,4790401 10.08 10.31 10.47 10.77 2.3% 1.6% 2.9% 0.03 6.85% 1.3% 59,383 66,8584771 2.36 2.51 2.52 2.52 6.4% 0.4% 0.0% 0.03 6.78% 6.4% 334,620 334,1434251 3.37 3.36 3.28 3.41 0.3% 2.4% 4.0% 0.02 6.75% 6.3% 115,984 148,0583076 2.82 2.86 3.00 2.99 1.4% 4.9% 0.3% 0.03 6.74% 5.2% 5,081,301 5,007,8218723 0.15 0.14 0.14 0.14 6.7% 0.0% 0.0% 0.04 6.67% 6.7% 19,563,323 20,034,7047380 4.35 4.27 4.26 4.45 1.8% 0.2% 4.5% 0.02 6.63% 6.3% 4,660,879 5,031,5997600 3.14 3.11 3.04 3.14 1.0% 2.3% 3.3% 0.02 6.62% 5.5% 3,544,445 3,320,3632660 2.74 2.70 2.70 2.83 1.5% 0.0% 4.8% 0.02 6.34% 6.3% 192,307 265,0031320 1.47 1.46 1.40 1.42 0.7% 4.1% 1.4% 0.02 6.32% 5.5% 6,161 8,7904665 8.99 8.73 9.01 9.02 2.9% 3.2% 0.1% 0.02 6.31% 6.1% 16,625 11,4302112 3.49 3.64 3.57 3.57 4.3% 1.9% 0.0% 0.02 6.30% 6.2% 2,865 3,0159040 3.32 3.25 3.29 3.38 2.1% 1.2% 2.7% 0.02 6.19% 4.8% 834,652 873,1968033 1.56 1.52 1.51 1.55 2.6% 0.7% 2.6% 0.02 5.97% 5.2% 5,774,305 5,452,1372130 1.74 1.72 1.68 1.72 1.1% 2.3% 2.4% 0.01 5.97% 4.7% 179,138 205,9563082 4.71 4.60 4.61 4.76 2.3% 0.2% 3.3% 0.02 5.89% 5.6% 36,493 48,570

NCCI Missouri Loss Cost Filing Effective January 1, 2021Analysis of the Loss Costs that are Effective from January 1, 2018 to January 1, 2021 Sorted by 2018 Absolute Cumulative Change Percent
SwingLoss Cost Percent Change Loss Cost Absolute Max Min Payroll (100's)
Class Code 2018 2019 2020 2021 2019 2020 2021 Coef. Var Change Change 2017 20182589 1.91 1.91 1.88 1.96 0.0% 1.6% 4.3% 0.02 5.89% 5.8% 214,680 197,8093830 0.68 0.71 0.70 0.70 4.4% 1.4% 0.0% 0.02 5.88% 5.8% 9,096,560 9,338,7748107 2.46 2.44 2.35 2.32 0.8% 3.7% 1.3% 0.03 5.87% 2.9% 1,818,342 1,999,7718111 1.61 1.57 1.54 1.52 2.5% 1.9% 1.3% 0.03 5.80% 1.2% 707,498 670,3824470 2.07 2.10 2.17 2.15 1.4% 3.3% 0.9% 0.02 5.80% 4.3% 82,885 89,3718044 2.33 2.30 2.26 2.20 1.3% 1.7% 2.7% 0.02 5.78% 1.4% 1,590,757 1,655,1834420 4.12 4.09 3.92 3.89 0.7% 4.2% 0.8% 0.03 5.72% 3.4% 53 1,4233559 2.40 2.32 2.36 2.35 3.3% 1.7% 0.4% 0.01 5.56% 5.1% 57,249 56,8858500 4.81 4.83 4.60 4.61 0.4% 4.8% 0.2% 0.03 5.43% 5.2% 83,296 88,5848868 0.37 0.37 0.38 0.39 0.0% 2.7% 2.6% 0.03 5.41% 2.7% 35,525,434 36,697,1335480 5.16 5.17 5.08 4.91 0.2% 1.7% 3.3% 0.02 5.35% 3.5% 48,066 53,2952172 1.54 1.53 1.47 1.48 0.6% 3.9% 0.7% 0.02 5.31% 4.6% 3,984 3792759 6.23 6.19 6.08 5.91 0.6% 1.8% 2.8% 0.02 5.29% 2.2% 283,849 315,6944825 0.76 0.72 0.72 0.72 5.3% 0.0% 0.0% 0.03 5.26% 5.3% 2,061,898 2,183,2003635 2.19 2.13 2.10 2.08 2.7% 1.4% 1.0% 0.02 5.18% 1.8% 59,697 52,1784777 4.06 4.05 3.89 3.86 0.2% 4.0% 0.8% 0.03 5.01% 3.7% 17,196 55,4151925 3.27 3.23 3.25 3.35 1.2% 0.6% 3.1% 0.02 4.98% 4.3% 256,802 285,7727098 10.86 10.66 10.44 10.54 1.8% 2.1% 1.0% 0.02 4.94% 3.0% 0 109052 1.72 1.70 1.71 1.66 1.2% 0.6% 2.9% 0.02 4.73% 3.5% 4,041,664 4,595,0553131 1.81 1.84 1.81 1.79 1.7% 1.6% 1.1% 0.01 4.46% 3.3% 372 1416504 2.27 2.31 2.29 2.25 1.8% 0.9% 1.7% 0.01 4.44% 3.5% 3,686,151 4,309,7225215 5.08 4.89 4.87 4.86 3.7% 0.4% 0.2% 0.02 4.38% 3.5% 548,826 536,1786835 2.67 2.65 2.59 2.62 0.7% 2.3% 1.2% 0.01 4.22% 3.4% 201 03257 2.44 2.50 2.47 2.48 2.5% 1.2% 0.4% 0.01 4.11% 3.7% 365,001 413,6776503 2.00 1.98 1.96 2.00 1.0% 1.0% 2.0% 0.01 4.10% 3.1% 34,776 34,7318721 0.25 0.25 0.25 0.26 0.0% 0.0% 4.0% 0.02 4.00% 4.0% 252,408 254,2054431 1.31 1.27 1.26 1.26 3.1% 0.8% 0.0% 0.02 3.86% 3.1% 21,004 14,5775022 5.47 5.46 5.46 5.66 0.2% 0.0% 3.7% 0.02 3.85% 3.8% 1,295,269 1,286,6168072 0.53 0.52 0.51 0.51 1.9% 1.9% 0.0% 0.02 3.85% 1.9% 252,465 254,7518006 1.62 1.61 1.58 1.60 0.6% 1.9% 1.3% 0.01 3.79% 3.1% 2,635,938 2,778,1622041 2.47 2.46 2.47 2.54 0.4% 0.4% 2.8% 0.01 3.67% 3.2% 69,127 64,4502388 1.50 1.50 1.52 1.55 0.0% 1.3% 2.0% 0.02 3.33% 2.0% 72,010 95,2448203 5.79 5.89 5.92 5.86 1.7% 0.5% 1.0% 0.01 3.28% 2.7% 77,363 78,0327219 6.49 6.54 6.43 6.38 0.8% 1.7% 0.8% 0.01 3.26% 2.5% 12,166,683 12,624,4905190 2.57 2.50 2.50 2.49 2.7% 0.0% 0.4% 0.01 3.13% 2.7% 5,150,803 5,343,2387710 4.00 4.06 4.08 4.12 1.5% 0.5% 1.0% 0.01 3.00% 1.0% 1,085,275 1,245,5207711 4.00 4.06 4.08 4.12 1.5% 0.5% 1.0% 0.01 3.00% 1.0% 155,950 155,1773620 3.67 3.68 3.69 3.64 0.3% 0.3% 1.4% 0.01 1.91% 1.6% 523,729 546,839

NCCI Missouri Loss Cost Filing Effective January 1, 2021Analysis of the Absolute Loss Cost Change from Loss Costs that are Effective from January 1, 2018 to January 1, 2021 Sorted by Swing
SwingLoss Cost Percent Change Loss Cost Absolute Max Min Payroll (100's)
Class Code 2018 2019 2020 2021 2019 2020 2021 Coef. Var Change Change 2017 20183574 1.80 2.09 1.72 2.08 16.1% 17.7% 20.9% 0.10 65.27% 38.6% 513,164 1,467,7375057 4.08 3.69 3.66 4.34 9.6% 0.8% 18.6% 0.08 30.97% 28.1% 325,894 367,3823240 1.98 2.32 2.71 2.48 17.2% 16.8% 8.5% 0.13 48.48% 25.7% 8,386 3,7083132 3.80 3.68 3.68 4.45 3.2% 0.0% 20.9% 0.09 24.74% 24.1% 6,961 8,4044751 1.81 1.70 1.75 2.05 6.1% 2.9% 17.1% 0.08 27.92% 23.2% 56 07225 6.19 6.15 6.02 7.28 0.6% 2.1% 20.9% 0.09 24.28% 23.0% 0 176,3668215 4.28 3.56 3.50 3.71 16.8% 1.7% 6.0% 0.09 25.92% 22.8% 1,009,787 1,113,8543638 1.92 1.79 1.88 2.18 6.8% 5.0% 16.0% 0.09 30.03% 22.7% 133,025 149,4645703 9.82 9.47 10.02 11.90 3.6% 5.8% 18.8% 0.11 30.14% 22.3% 879 1,8152709 14.43 16.64 16.56 19.92 15.3% 0.5% 20.3% 0.13 39.38% 20.8% 1,260 2,5210042 6.19 5.34 5.32 5.69 13.7% 0.4% 7.0% 0.07 22.10% 20.7% 657,098 677,1731452 3.48 2.95 2.81 2.96 15.2% 4.7% 5.3% 0.10 27.14% 20.6% 15,312 15,3328824 2.36 2.32 1.88 1.91 1.7% 19.0% 1.6% 0.12 22.91% 20.6% 1,295,292 1,462,3737403 4.40 3.93 3.88 4.26 10.7% 1.3% 9.8% 0.06 23.07% 20.5% 2,042,578 2,146,3304557 2.29 2.09 2.00 2.23 8.7% 4.3% 11.5% 0.06 26.46% 20.2% 229,661 230,1958103 2.00 1.93 1.92 2.24 3.5% 0.5% 16.7% 0.07 21.38% 20.2% 23,988 23,0489180 3.36 3.95 3.85 3.87 17.6% 2.5% 0.5% 0.07 21.16% 20.1% 189,396 211,8312121 1.47 1.28 1.18 1.26 12.9% 7.8% 6.8% 0.09 30.00% 19.7% 798,918 816,2188755 0.48 0.37 0.31 0.30 22.9% 16.2% 3.2% 0.23 47.46% 19.7% 638,779 604,6273085 5.15 4.37 4.41 4.61 15.1% 0.9% 4.5% 0.08 21.47% 19.7% 644,461 624,7964240 3.00 3.49 3.48 3.37 16.3% 0.3% 3.2% 0.07 20.35% 19.5% 79,837 76,9276045 3.16 2.96 3.12 3.52 6.3% 5.4% 12.8% 0.07 26.45% 19.1% 8,672 9,2666206 2.33 2.09 2.10 2.28 10.3% 0.5% 8.6% 0.06 20.33% 18.9% 219 898031 1.75 2.03 1.98 2.01 16.0% 2.5% 1.5% 0.07 20.66% 18.5% 170,284 188,5594493 5.78 5.62 4.44 3.66 2.8% 21.0% 17.6% 0.21 46.19% 18.2% 10,009 8,9102587 1.84 1.74 1.73 1.95 5.4% 0.6% 12.7% 0.06 19.53% 18.2% 11,880 1,6538209 4.52 3.69 3.57 3.56 18.4% 3.3% 0.3% 0.12 22.55% 18.1% 4,449 4145192 2.16 2.13 2.19 2.55 1.4% 2.8% 16.4% 0.09 21.38% 17.8% 547,627 545,0028799 0.46 0.41 0.35 0.36 10.9% 14.6% 2.9% 0.13 30.73% 17.5% 165,314 247,6464244 2.63 2.36 2.32 2.48 10.3% 1.7% 6.9% 0.06 19.87% 17.2% 897,624 1,065,5069522 2.97 3.08 3.60 4.35 3.7% 16.9% 20.8% 0.18 46.46% 17.1% 468,363 354,2002288 4.03 3.68 3.55 3.84 8.7% 3.5% 8.2% 0.05 21.72% 16.9% 111,919 102,5878603 0.06 0.06 0.06 0.07 0.0% 0.0% 16.7% 0.08 16.67% 16.7% 4,584,789 5,072,7038803 0.07 0.06 0.06 0.05 14.3% 0.0% 16.7% 0.14 33.33% 16.7% 18,065,042 20,776,3889063 0.77 0.72 0.69 0.76 6.5% 4.2% 10.1% 0.05 22.18% 16.6% 2,271,633 2,262,0105402 3.37 3.31 3.72 4.26 1.8% 12.4% 14.5% 0.12 30.99% 16.3% 6,349 6,6001642 2.71 2.47 2.43 2.60 8.9% 1.6% 7.0% 0.05 18.36% 15.9% 338,385 221,7697705 3.36 3.83 3.76 3.79 14.0% 1.8% 0.8% 0.06 17.00% 15.8% 1,095,461 1,214,7073303 2.31 1.98 2.01 2.04 14.3% 1.5% 1.5% 0.07 17.75% 15.8% 189,230 255,3634263 4.20 3.59 3.32 3.36 14.5% 7.5% 1.2% 0.11 24.62% 15.7% 32,872 25,9763028 4.34 3.79 3.60 3.71 12.7% 5.0% 3.1% 0.09 21.94% 15.7% 408,667 192,5488010 1.75 1.56 1.53 1.60 10.9% 1.9% 4.6% 0.06 18.16% 15.4% 2,634,299 2,742,8182105 3.18 3.23 3.42 4.00 1.6% 5.9% 17.0% 0.11 25.79% 15.4% 5,122 6,0338116 2.31 1.98 1.97 1.99 14.3% 0.5% 1.0% 0.08 16.03% 15.3% 832,412 877,5102021 1.76 1.86 2.06 2.49 5.7% 10.8% 20.9% 0.16 41.48% 15.2% 84,763 102,4118385 1.79 1.71 1.68 1.86 4.5% 1.8% 10.7% 0.05 17.69% 15.2% 582,277 566,5062799 4.66 5.05 5.03 4.69 8.4% 0.4% 6.8% 0.04 16.15% 15.1% 36,300 36,7366400 4.45 4.49 5.06 4.94 0.9% 12.7% 2.4% 0.07 16.40% 15.1% 193,922 203,3377390 6.59 5.19 4.84 4.54 21.2% 6.7% 6.2% 0.17 37.44% 15.0% 321,983 357,2910106 6.18 6.78 7.12 6.74 9.7% 5.0% 5.3% 0.06 21.36% 15.0% 733,553 721,9942841 3.70 3.55 3.55 3.94 4.1% 0.0% 11.0% 0.05 15.49% 15.0% 47,794 51,2113803 1.72 1.73 2.00 2.28 0.6% 15.6% 14.0% 0.14 32.56% 15.0% 166,857 182,1783042 5.85 5.01 4.76 4.79 14.4% 5.0% 0.6% 0.10 20.82% 15.0% 0 4428742 0.28 0.25 0.24 0.25 10.7% 4.0% 4.2% 0.07 19.94% 14.9% 60,950,716 62,480,6163719 1.53 1.17 1.04 0.95 23.5% 11.1% 8.7% 0.22 49.13% 14.9% 1,039 12,5362305 2.99 2.44 2.26 2.18 18.4% 7.4% 3.5% 0.15 31.63% 14.9% 37,461 99,4378037 1.80 1.75 1.61 1.72 2.8% 8.0% 6.8% 0.05 18.58% 14.8% 9,810,553 9,949,7234109 0.63 0.56 0.55 0.57 11.1% 1.8% 3.6% 0.06 17.21% 14.7% 153,854 88,9070079 5.23 4.24 3.57 3.42 18.9% 15.8% 4.2% 0.20 43.51% 14.7% 23,268 18,494

NCCI Missouri Loss Cost Filing Effective January 1, 2021Analysis of the Absolute Loss Cost Change from Loss Costs that are Effective from January 1, 2018 to January 1, 2021 Sorted by Swing
SwingLoss Cost Percent Change Loss Cost Absolute Max Min Payroll (100's)
Class Code 2018 2019 2020 2021 2019 2020 2021 Coef. Var Change Change 2017 20184828 2.13 1.96 1.82 1.94 8.0% 7.1% 6.6% 0.07 23.32% 14.6% 1,170,027 1,365,0403724 3.84 3.27 3.20 3.19 14.8% 2.1% 0.3% 0.09 17.67% 14.5% 2,544,942 2,542,4696204 12.64 9.45 8.43 7.30 25.2% 10.8% 13.4% 0.24 57.35% 14.4% 110,201 137,0086235 6.63 5.49 5.33 5.18 17.2% 2.9% 2.8% 0.12 24.00% 14.4% 1,297 8,4114686 2.51 2.61 2.41 2.16 4.0% 7.7% 10.4% 0.08 23.57% 14.4% 96,361 134,3663807 2.03 2.00 2.02 2.28 1.5% 1.0% 12.9% 0.06 15.68% 14.3% 216,020 222,5458871 0.07 0.07 0.06 0.06 0.0% 14.3% 0.0% 0.09 14.29% 14.3% 2,456,877 3,116,0848106 4.07 3.87 4.17 4.56 4.9% 7.8% 9.4% 0.07 23.62% 14.3% 464,766 506,2249101 3.45 3.36 3.13 3.36 2.6% 6.8% 7.3% 0.04 17.69% 14.2% 2,644,715 2,697,9978265 5.45 4.68 4.13 4.13 14.1% 11.8% 0.0% 0.14 27.54% 14.1% 277,053 308,3650113 6.10 5.04 4.54 4.39 17.4% 9.9% 3.3% 0.15 33.28% 14.1% 8,936 10,8308102 2.24 2.03 1.92 2.01 9.4% 5.4% 4.7% 0.07 20.71% 14.1% 150,959 197,1224611 1.04 0.99 0.98 1.07 4.8% 1.0% 9.2% 0.04 15.59% 14.0% 3,157,722 3,066,9415535 6.10 5.43 5.36 5.52 11.0% 1.3% 3.0% 0.06 15.77% 14.0% 1,004,638 964,3963188 2.15 2.31 2.16 2.19 7.4% 6.5% 1.4% 0.03 16.01% 13.9% 280,118 270,9588353 3.55 3.31 3.21 3.44 6.8% 3.0% 7.2% 0.04 17.87% 13.9% 282,971 262,1691438 12.34 11.66 12.64 12.78 5.5% 8.4% 1.1% 0.04 15.65% 13.9% 49,458 295,5458601 0.21 0.23 0.22 0.22 9.5% 4.3% 0.0% 0.04 14.29% 13.9% 10,878,465 11,011,0916306 6.93 5.42 4.92 4.53 21.8% 9.2% 7.9% 0.19 43.57% 13.9% 450,582 496,7097539 2.50 2.05 1.69 1.62 18.0% 17.6% 4.1% 0.21 44.47% 13.9% 521,686 536,7258826 1.73 1.62 1.74 1.87 6.4% 7.4% 7.5% 0.06 22.77% 13.8% 732,634 1,370,3942081 5.65 4.87 4.79 4.79 13.8% 1.6% 0.0% 0.08 15.67% 13.8% 33,038 24,8799586 0.58 0.50 0.48 0.48 13.8% 4.0% 0.0% 0.09 18.34% 13.8% 1,586,477 1,620,7784653 1.34 1.28 1.29 1.41 4.5% 0.8% 9.3% 0.04 15.09% 13.8% 3,974 7,0048720 1.41 1.19 1.04 1.02 15.6% 12.6% 1.9% 0.15 32.68% 13.7% 1,022,911 1,063,4274131 3.91 3.98 4.55 4.58 1.8% 14.3% 0.7% 0.08 17.14% 13.7% 715 7999154 1.44 1.40 1.47 1.63 2.8% 5.0% 10.9% 0.07 19.66% 13.7% 930,979 1,030,7619521 3.87 3.53 3.29 3.45 8.8% 6.8% 4.9% 0.07 21.83% 13.6% 170,514 183,2844243 2.20 2.06 2.06 2.21 6.4% 0.0% 7.3% 0.04 14.11% 13.6% 490,558 528,6679014 2.31 2.27 2.43 2.27 1.7% 7.0% 6.6% 0.03 16.07% 13.6% 4,710,137 4,999,6829102 2.56 2.71 2.50 2.48 5.9% 7.7% 0.8% 0.04 14.98% 13.6% 2,248,866 2,435,0985551 15.17 13.75 13.67 14.25 9.4% 0.6% 4.2% 0.05 14.66% 13.6% 867,605 813,6206003 4.44 4.17 4.26 4.58 6.1% 2.2% 7.5% 0.04 16.51% 13.6% 12,110 15,1092016 2.62 2.93 2.88 2.84 11.8% 1.7% 1.4% 0.05 15.32% 13.5% 223,858 246,7912683 1.69 1.81 2.10 2.53 7.1% 16.0% 20.5% 0.18 49.70% 13.4% 15,759 6,4131747 1.59 1.69 1.95 1.99 6.3% 15.4% 2.1% 0.11 25.16% 13.3% 23,663 46,1925443 2.80 2.62 2.80 2.82 6.4% 6.9% 0.7% 0.03 14.55% 13.3% 7,630 3,4599186 16.69 16.85 14.81 13.02 1.0% 12.1% 12.1% 0.12 26.86% 13.1% 20,139 25,6179505 3.62 3.99 3.98 3.87 10.2% 0.3% 2.8% 0.04 13.55% 13.0% 82,453 95,5332174 2.95 2.75 2.76 2.93 6.8% 0.4% 6.2% 0.04 13.77% 12.9% 3,391 1585537 3.69 3.53 3.83 3.66 4.3% 8.5% 4.4% 0.03 18.23% 12.9% 3,534,958 3,906,3672701 9.01 10.12 10.48 10.42 12.3% 3.6% 0.6% 0.07 16.98% 12.9% 5,256 5,9928748 0.57 0.52 0.49 0.51 8.8% 5.8% 4.1% 0.07 19.74% 12.9% 3,211,586 3,342,3285507 3.58 3.21 3.20 3.28 10.3% 0.3% 2.5% 0.05 13.45% 12.8% 122,683 170,8569062 1.41 1.28 1.16 1.20 9.2% 9.4% 3.4% 0.09 23.58% 12.8% 96,195 92,6448034 2.22 2.09 1.92 2.01 5.9% 8.1% 4.7% 0.06 19.83% 12.8% 184,107 207,8802503 1.37 1.43 1.31 1.21 4.4% 8.4% 7.6% 0.07 21.78% 12.8% 16,699 18,4452014 3.98 4.50 4.52 4.62 13.1% 0.4% 2.2% 0.07 16.08% 12.6% 698,213 740,9662735 3.92 3.72 3.48 3.69 5.1% 6.5% 6.0% 0.05 18.63% 12.5% 42,339 46,5557515 0.95 1.03 0.99 0.95 8.4% 3.9% 4.0% 0.04 17.18% 12.5% 332,705 357,4897313 3.02 3.28 3.38 3.25 8.6% 3.0% 3.8% 0.05 16.23% 12.5% 2,671 378227 3.27 2.93 2.85 2.90 10.4% 2.7% 1.8% 0.06 15.40% 12.2% 1,122,259 1,170,0647335 2.00 2.15 2.05 2.19 7.5% 4.7% 6.8% 0.04 20.18% 12.2% 0 147425 2.71 2.51 2.02 1.82 7.4% 19.5% 9.9% 0.18 41.05% 12.1% 253,715 263,9348013 0.34 0.32 0.32 0.34 5.9% 0.0% 6.3% 0.03 12.50% 12.1% 1,397,188 1,338,7643119 1.63 1.48 1.37 1.41 9.2% 7.4% 2.9% 0.08 20.74% 12.1% 47 7353643 2.20 2.18 2.41 2.68 0.9% 10.6% 11.2% 0.10 24.05% 12.1% 1,329,683 1,935,0980005 3.31 2.98 2.84 2.90 10.0% 4.7% 2.1% 0.07 17.57% 12.1% 181,264 175,2220035 1.77 1.88 2.07 2.03 6.2% 10.1% 1.9% 0.07 19.21% 12.0% 195,375 181,933

NCCI Missouri Loss Cost Filing Effective January 1, 2021Analysis of the Absolute Loss Cost Change from Loss Costs that are Effective from January 1, 2018 to January 1, 2021 Sorted by Swing
SwingLoss Cost Percent Change Loss Cost Absolute Max Min Payroll (100's)
Class Code 2018 2019 2020 2021 2019 2020 2021 Coef. Var Change Change 2017 20186836 2.99 3.19 3.02 3.09 6.7% 5.3% 2.3% 0.03 14.98% 12.0% 129,200 162,0683821 5.16 4.67 4.46 4.57 9.5% 4.5% 2.5% 0.07 17.24% 12.0% 218,433 258,6212835 2.69 2.47 2.22 2.26 8.2% 10.1% 1.8% 0.09 21.27% 11.9% 12,044 18,4587133 2.13 2.22 2.26 2.57 4.2% 1.8% 13.7% 0.08 20.66% 11.9% 20,250 17,6179093 1.47 1.26 1.23 1.16 14.3% 2.4% 5.7% 0.10 23.67% 11.9% 230,029 232,4632710 15.12 13.52 12.46 12.62 10.6% 7.8% 1.3% 0.09 20.78% 11.9% 135,590 129,7212095 2.85 2.87 3.23 3.42 0.7% 12.5% 5.9% 0.09 20.00% 11.8% 1,663,499 1,714,7519019 1.28 1.53 1.80 1.94 19.5% 17.6% 7.8% 0.18 51.56% 11.8% 2,883 2,9988393 1.31 1.22 1.24 1.30 6.9% 1.6% 4.8% 0.03 13.88% 11.7% 1,760,453 1,983,3398045 0.47 0.50 0.54 0.52 6.4% 8.0% 3.7% 0.06 19.15% 11.7% 4,541,227 4,434,0652417 1.39 1.29 1.34 1.40 7.2% 3.9% 4.5% 0.04 16.33% 11.7% 18,677 21,9153865 1.70 1.85 2.05 2.47 8.8% 10.8% 20.5% 0.17 45.29% 11.7% 37,740 49,8653270 4.18 3.67 3.65 3.62 12.2% 0.5% 0.8% 0.07 13.74% 11.7% 135,829 154,1531463 10.84 9.29 9.01 8.77 14.3% 3.0% 2.7% 0.10 20.88% 11.6% 148,785 133,5667421 0.53 0.51 0.55 0.58 3.8% 7.8% 5.5% 0.06 18.02% 11.6% 311,890 345,8325348 4.59 3.88 3.73 3.50 15.5% 3.9% 6.2% 0.12 27.33% 11.6% 607,208 676,2634133 1.70 1.85 1.80 1.96 8.8% 2.7% 8.9% 0.06 21.70% 11.6% 5,379 5,5005951 0.34 0.34 0.35 0.39 0.0% 2.9% 11.4% 0.07 14.71% 11.4% 94,838 38,2017720 2.58 2.47 2.53 2.71 4.3% 2.4% 7.1% 0.04 14.39% 11.4% 3,432,603 3,694,7169410 3.00 2.75 2.63 2.71 8.3% 4.4% 3.0% 0.06 16.50% 11.4% 212,555 210,6898861 1.18 1.16 1.14 1.25 1.7% 1.7% 9.6% 0.04 13.43% 11.4% 5,358,532 5,866,3392302 1.82 1.72 1.62 1.71 5.5% 5.8% 5.6% 0.05 17.83% 11.4% 0 452960 6.56 5.54 5.19 4.97 15.5% 6.3% 4.2% 0.13 28.06% 11.3% 32,383 25,6989084 1.30 1.20 1.12 1.16 7.7% 6.7% 3.6% 0.06 18.97% 11.3% 759,618 848,6469620 1.10 1.02 1.01 1.05 7.3% 1.0% 4.0% 0.04 12.61% 11.2% 549,067 527,2098263 4.65 4.58 4.33 4.58 1.5% 5.5% 5.8% 0.03 13.23% 11.2% 48,854 31,9586826 4.15 4.34 4.21 3.93 4.6% 3.0% 6.7% 0.04 14.87% 11.2% 57 03179 2.21 2.04 2.01 2.08 7.7% 1.5% 3.5% 0.04 13.08% 11.2% 1,643,733 1,922,4093110 5.33 4.71 4.21 4.19 11.6% 10.6% 0.5% 0.12 24.07% 11.2% 46,915 46,6344038 4.97 4.26 3.83 3.71 14.3% 10.1% 3.1% 0.14 29.76% 11.2% 9,396 12,4102731 3.51 3.49 3.68 3.47 0.6% 5.4% 5.7% 0.03 12.10% 11.2% 394,027 409,3522797 3.69 4.35 4.75 5.07 17.9% 9.2% 6.7% 0.13 37.40% 11.1% 20,129 26,1079058 1.51 1.41 1.33 1.39 6.6% 5.7% 4.5% 0.05 17.75% 11.1% 1,016,126 1,040,8888232 5.39 4.90 5.00 5.00 9.1% 2.0% 0.0% 0.04 11.32% 11.1% 2,831,565 2,975,5144568 4.63 4.41 3.71 3.30 4.8% 15.9% 11.1% 0.15 34.79% 11.1% 7,605 9,5028292 3.61 3.32 3.42 3.52 8.0% 3.0% 2.9% 0.04 14.54% 11.0% 1,465,865 1,596,8607309 10.88 10.95 10.26 9.20 0.6% 6.3% 10.3% 0.08 18.04% 11.0% 13,024 14,1704034 6.48 6.77 6.33 6.28 4.5% 6.5% 0.8% 0.03 12.14% 11.0% 382,878 398,0262836 1.97 2.08 2.16 2.48 5.6% 3.8% 14.8% 0.10 25.89% 11.0% 4,598 6,9594000 4.91 4.89 4.50 3.99 0.4% 8.0% 11.3% 0.09 20.70% 10.9% 144,124 173,8353385 0.84 0.81 0.82 0.88 3.6% 1.2% 7.3% 0.04 12.52% 10.9% 12,589 4,8028304 3.50 3.57 4.03 4.26 2.0% 12.9% 5.7% 0.10 21.71% 10.9% 283,147 267,6512702 20.10 17.87 15.86 15.80 11.1% 11.2% 0.4% 0.12 24.06% 10.9% 21,077 15,1793647 2.48 2.49 2.49 2.76 0.4% 0.0% 10.8% 0.05 11.29% 10.8% 1,110,849 1,135,1407232 5.85 6.66 6.86 7.53 13.8% 3.0% 9.8% 0.10 28.72% 10.8% 287,516 308,0328039 1.11 1.07 1.11 1.19 3.6% 3.7% 7.2% 0.04 15.22% 10.8% 1,152,381 1,056,2954511 0.36 0.39 0.41 0.40 8.3% 5.1% 2.4% 0.06 16.67% 10.8% 3,512,990 3,168,5424741 2.29 2.14 2.22 2.31 6.6% 3.7% 4.1% 0.03 15.01% 10.6% 123,956 80,8534114 3.68 3.29 3.11 3.11 10.6% 5.5% 0.0% 0.08 16.65% 10.6% 306,076 313,2064484 2.43 2.35 2.47 2.65 3.3% 5.1% 7.3% 0.05 16.48% 10.6% 4,004,186 4,585,1579519 3.21 3.30 3.15 3.34 2.8% 4.5% 6.0% 0.03 13.96% 10.6% 464,515 474,0503365 3.92 3.47 3.31 3.28 11.5% 4.6% 0.9% 0.08 17.68% 10.6% 225,721 296,5112131 2.33 2.21 2.22 2.34 5.2% 0.5% 5.4% 0.03 11.34% 10.6% 86,271 86,4941016 10.54 11.22 12.52 14.64 6.5% 11.6% 16.9% 0.15 38.90% 10.5% 466 313004 2.24 1.93 1.77 1.71 13.8% 8.3% 3.4% 0.12 27.46% 10.4% 122 253634 1.59 1.65 1.54 1.50 3.8% 6.7% 2.6% 0.04 13.57% 10.4% 410,059 487,4924923 0.99 0.93 0.97 0.99 6.1% 4.3% 2.1% 0.03 12.90% 10.4% 24,030 29,4813241 3.56 3.24 2.74 2.60 9.0% 15.4% 5.1% 0.15 32.24% 10.3% 257,941 300,1088370 3.74 3.43 3.45 3.52 8.3% 0.6% 2.0% 0.04 11.13% 10.3% 494,192 503,368

NCCI Missouri Loss Cost Filing Effective January 1, 2021Analysis of the Absolute Loss Cost Change from Loss Costs that are Effective from January 1, 2018 to January 1, 2021 Sorted by Swing
SwingLoss Cost Percent Change Loss Cost Absolute Max Min Payroll (100's)
Class Code 2018 2019 2020 2021 2019 2020 2021 Coef. Var Change Change 2017 20183851 4.35 3.40 2.69 2.38 21.8% 20.9% 11.5% 0.27 64.25% 10.3% 457,125 248,5178391 2.11 1.97 1.94 2.01 6.6% 1.5% 3.6% 0.04 12.17% 10.2% 7,833,459 8,388,3184459 2.42 2.29 2.40 2.39 5.4% 4.8% 0.4% 0.02 10.89% 10.2% 793,725 1,103,4939060 1.14 1.11 1.06 1.12 2.6% 4.5% 5.7% 0.03 13.33% 10.2% 1,341,056 1,420,8763220 2.42 2.22 2.15 2.19 8.3% 3.2% 1.9% 0.05 13.76% 10.1% 290,975 283,3258709 4.16 4.36 4.35 4.12 4.8% 0.2% 5.3% 0.03 10.60% 10.1% 753 7363581 1.22 1.16 1.22 1.27 4.9% 5.2% 4.1% 0.04 14.87% 10.1% 85,685 67,3034021 7.53 6.46 6.19 5.40 14.2% 4.2% 12.8% 0.14 34.17% 10.0% 4,087 4,2963145 2.48 2.31 2.26 2.33 6.9% 2.2% 3.1% 0.04 12.55% 10.0% 106,383 120,4296834 3.59 3.40 3.09 2.62 5.3% 9.1% 15.2% 0.13 32.37% 9.9% 377,822 913,3223064 3.32 3.16 3.32 3.45 4.8% 5.1% 3.9% 0.04 14.44% 9.9% 131,653 147,2992790 1.58 1.62 1.63 1.80 2.5% 0.6% 10.4% 0.06 13.92% 9.8% 34,746 34,7148001 1.77 1.74 1.88 1.95 1.7% 8.0% 3.7% 0.05 13.97% 9.7% 384,731 398,0208288 7.60 6.94 6.89 6.96 8.7% 0.7% 1.0% 0.05 10.58% 9.7% 159,929 145,1593373 5.22 4.62 4.45 4.37 11.5% 3.7% 1.8% 0.08 17.68% 9.7% 66,663 75,2827405 1.21 1.26 1.19 1.22 4.1% 5.6% 2.5% 0.02 12.69% 9.7% 832,298 891,3149012 1.03 0.85 0.77 0.71 17.5% 9.4% 7.8% 0.17 38.55% 9.7% 4,769,208 4,699,1121005 3.93 4.68 5.21 5.70 19.1% 11.3% 9.4% 0.16 45.04% 9.7% 14,894 11,9575479 7.13 6.44 6.14 6.14 9.7% 4.7% 0.0% 0.07 14.79% 9.7% 154,867 168,3598235 3.23 3.54 3.54 3.58 9.6% 0.0% 1.1% 0.05 10.84% 9.6% 127,854 127,5991654 3.71 3.77 3.47 3.45 1.6% 8.0% 0.6% 0.05 10.34% 9.6% 30,265 29,8117317 7.96 8.38 8.02 7.99 5.3% 4.3% 0.4% 0.02 10.21% 9.6% 13,103 10,2003648 1.48 1.43 1.46 1.55 3.4% 2.1% 6.2% 0.03 12.05% 9.5% 88,748 94,3921710 3.10 3.06 3.03 3.28 1.3% 1.0% 8.3% 0.04 10.72% 9.5% 25,469 29,8254273 2.48 2.32 2.27 2.34 6.5% 2.2% 3.1% 0.04 12.10% 9.5% 644,283 644,7409182 1.71 1.63 1.67 1.75 4.7% 2.5% 4.8% 0.03 12.38% 9.5% 450,631 526,6548831 1.27 1.15 1.14 1.14 9.4% 0.9% 0.0% 0.05 10.40% 9.4% 2,526,353 2,668,2269554 9.01 8.04 7.50 7.40 10.8% 6.7% 1.3% 0.09 19.78% 9.4% 173,440 186,3480050 4.84 4.46 4.48 4.55 7.9% 0.4% 1.6% 0.04 10.03% 9.4% 132,497 157,9345221 3.95 3.79 3.94 4.15 4.1% 4.0% 5.3% 0.04 13.93% 9.4% 2,685,246 2,795,0210908 115.00 121.00 116.00 117.00 5.2% 4.1% 0.9% 0.02 10.51% 9.3% 0 3767580 2.07 2.17 2.23 2.50 4.8% 2.8% 12.1% 0.08 20.77% 9.3% 292,739 310,3821322 6.49 6.25 6.10 6.44 3.7% 2.4% 5.6% 0.03 12.11% 9.3% 0 257538 5.39 5.51 5.13 5.10 2.2% 6.9% 0.6% 0.04 9.92% 9.1% 759,145 781,6497402 0.12 0.11 0.10 0.10 8.3% 9.1% 0.0% 0.09 18.18% 9.1% 8,326 8,7235040 14.34 11.95 11.04 9.71 16.7% 7.6% 12.0% 0.17 40.68% 9.1% 110,190 130,0193826 0.97 1.02 1.00 1.07 5.2% 2.0% 7.0% 0.04 14.72% 9.0% 138,465 123,8558008 0.91 0.86 0.88 0.91 5.5% 2.3% 3.4% 0.03 11.63% 8.9% 3,667,061 3,637,1190170 2.25 2.05 1.99 1.99 8.9% 2.9% 0.0% 0.06 12.08% 8.9% 27 316229 4.07 4.03 3.91 4.14 1.0% 3.0% 5.9% 0.02 10.11% 8.9% 99,095 96,8526213 1.46 1.28 1.15 1.11 12.3% 10.2% 3.5% 0.13 28.04% 8.9% 866 2,9373336 2.92 2.78 2.63 2.72 4.8% 5.4% 3.4% 0.04 14.23% 8.8% 75,594 87,9324703 2.20 1.96 1.91 1.87 10.9% 2.6% 2.1% 0.07 16.12% 8.8% 185,415 189,7229061 1.66 1.45 1.30 1.25 12.7% 10.3% 3.8% 0.13 29.09% 8.8% 312,823 322,7674110 1.47 1.28 1.21 1.16 12.9% 5.5% 4.1% 0.11 24.02% 8.8% 13,047 47,5664307 1.58 1.70 1.68 1.79 7.6% 1.2% 6.5% 0.05 15.99% 8.8% 101,471 83,4893824 4.84 4.59 4.04 3.91 5.2% 12.0% 3.2% 0.10 21.56% 8.8% 778,106 921,8843548 1.52 1.44 1.43 1.48 5.3% 0.7% 3.5% 0.03 9.70% 8.8% 25,666 29,2066237 1.42 1.26 1.19 1.16 11.3% 5.6% 2.5% 0.09 20.41% 8.7% 4,017 3,4849083 0.94 0.92 0.91 0.97 2.1% 1.1% 6.6% 0.03 10.04% 8.7% 11,249,827 11,831,2858820 0.15 0.14 0.13 0.11 6.7% 7.1% 15.4% 0.13 31.87% 8.7% 12,575,621 12,553,5334018 4.91 4.87 4.95 5.34 0.8% 1.6% 7.9% 0.04 10.54% 8.7% 144,069 156,5899044 0.94 0.88 0.88 0.90 6.4% 0.0% 2.3% 0.03 8.80% 8.7% 2,539,398 1,641,3923300 3.84 3.92 3.93 4.28 2.1% 0.3% 8.9% 0.05 11.46% 8.7% 350,380 346,1894410 2.82 2.95 2.88 3.06 4.6% 2.4% 6.3% 0.04 13.79% 8.6% 1,310,351 1,404,2404902 2.91 2.60 2.39 2.34 10.7% 8.1% 2.1% 0.10 22.09% 8.6% 123,640 125,9077231 7.47 7.46 6.91 6.99 0.1% 7.4% 1.2% 0.04 8.76% 8.5% 428,051 518,1886825 2.91 2.95 2.74 2.58 1.4% 7.1% 5.8% 0.06 14.93% 8.5% 311,921 155,4185213 6.22 6.06 5.39 4.86 2.6% 11.1% 9.8% 0.11 25.11% 8.5% 1,389,996 1,493,212

NCCI Missouri Loss Cost Filing Effective January 1, 2021Analysis of the Absolute Loss Cost Change from Loss Costs that are Effective from January 1, 2018 to January 1, 2021 Sorted by Swing
SwingLoss Cost Percent Change Loss Cost Absolute Max Min Payroll (100's)
Class Code 2018 2019 2020 2021 2019 2020 2021 Coef. Var Change Change 2017 20185445 4.62 4.42 4.38 3.97 4.3% 0.9% 9.4% 0.06 15.13% 8.5% 1,805,940 1,792,9456319 4.12 3.63 3.42 3.30 11.9% 5.8% 3.5% 0.10 22.52% 8.4% 597,604 555,8673180 2.69 2.78 2.64 2.65 3.3% 5.0% 0.4% 0.02 8.96% 8.4% 171,174 222,3908032 1.84 1.74 1.70 1.75 5.4% 2.3% 2.9% 0.03 11.03% 8.4% 277,539 344,2978810 0.13 0.12 0.11 0.11 7.7% 8.3% 0.0% 0.08 16.67% 8.3% 255,211,347 266,583,9978869 0.97 0.89 0.89 0.89 8.2% 0.0% 0.0% 0.04 8.25% 8.2% 3,318,827 3,463,1276214 1.91 1.68 1.58 1.52 12.0% 6.0% 3.8% 0.10 23.22% 8.2% 0 258381 2.33 2.31 2.10 2.06 0.9% 9.1% 1.9% 0.06 12.12% 8.2% 73,001 78,2511430 5.21 5.15 5.40 5.22 1.2% 4.9% 3.3% 0.02 9.60% 8.2% 177,994 186,5363808 3.76 3.55 3.50 3.59 5.6% 1.4% 2.6% 0.03 9.83% 8.2% 303,619 326,2497605 1.85 1.70 1.66 1.66 8.1% 2.4% 0.0% 0.05 10.65% 8.1% 935,580 953,7942380 2.26 2.10 1.98 2.00 7.1% 5.7% 1.0% 0.06 14.34% 8.1% 9,834 6485474 5.48 5.06 4.73 4.75 7.7% 6.5% 0.4% 0.07 15.17% 8.1% 1,933,498 1,918,3137090 5.83 5.95 5.67 5.33 2.1% 4.7% 6.0% 0.05 13.27% 8.1% 645 1,0357855 3.28 3.09 3.10 3.17 5.8% 0.3% 2.3% 0.03 8.53% 8.1% 236,200 270,0518047 1.16 0.97 0.84 0.77 16.4% 13.4% 8.3% 0.18 42.97% 8.0% 521,274 446,8685506 4.82 4.56 4.68 4.62 5.4% 2.6% 1.3% 0.02 9.55% 8.0% 1,835,083 1,910,7028832 0.25 0.25 0.23 0.23 0.0% 8.0% 0.0% 0.05 8.00% 8.0% 36,664,231 39,494,4297230 6.05 6.20 6.01 6.30 2.5% 3.1% 4.8% 0.02 10.72% 7.9% 281,679 366,2485188 2.51 2.50 2.64 2.58 0.4% 5.6% 2.3% 0.03 8.43% 7.9% 562,891 548,1964111 1.83 1.75 1.73 1.79 4.4% 1.1% 3.5% 0.02 9.23% 7.8% 88,324 7,4666233 1.76 1.79 1.89 2.07 1.7% 5.6% 9.5% 0.07 17.61% 7.8% 123,598 172,4978719 2.11 1.91 1.76 1.73 9.5% 7.9% 1.7% 0.09 20.09% 7.8% 1,929 1,3538058 2.25 2.23 2.33 2.49 0.9% 4.5% 6.9% 0.05 12.65% 7.8% 1,902,765 1,974,0998800 1.27 1.30 1.23 1.21 2.4% 5.4% 1.6% 0.03 9.63% 7.7% 349,466 414,2475491 1.58 1.50 1.54 1.49 5.1% 2.7% 3.2% 0.03 11.37% 7.7% 28,258 23,9579178 10.97 10.78 10.14 10.32 1.7% 5.9% 1.8% 0.04 9.68% 7.7% 114,952 111,4187024 2.01 2.21 2.60 2.93 10.0% 17.6% 12.7% 0.17 45.77% 7.7% 1,383 3,8059501 2.90 2.83 2.84 2.99 2.4% 0.4% 5.3% 0.03 8.20% 7.7% 215,197 238,2594206 2.38 2.35 2.34 2.49 1.3% 0.4% 6.4% 0.03 8.21% 7.7% 9,045 11,2994352 1.72 1.62 1.65 1.66 5.8% 1.9% 0.6% 0.03 8.43% 7.7% 27,928 25,5886872 10.83 10.59 10.12 9.12 2.2% 4.4% 9.9% 0.07 17.30% 7.7% 2,960 8451701 3.38 3.10 3.08 2.94 8.3% 0.6% 4.5% 0.06 13.94% 7.6% 772,916 856,5105473 7.67 7.13 6.81 6.85 7.0% 4.5% 0.6% 0.06 12.50% 7.6% 103,032 101,6668726 1.86 1.88 1.78 1.82 1.1% 5.3% 2.2% 0.02 8.84% 7.6% 2,101 3,8145472 5.25 5.09 4.55 4.36 3.0% 10.6% 4.2% 0.09 18.74% 7.6% 78,001 84,9310016 6.77 5.75 5.19 4.80 15.1% 9.7% 7.5% 0.15 35.76% 7.6% 22,316 19,7684683 4.01 3.73 3.58 3.60 7.0% 4.0% 0.6% 0.05 11.91% 7.5% 6,143 54,6775191 0.67 0.65 0.66 0.69 3.0% 1.5% 4.5% 0.03 9.32% 7.5% 3,463,112 3,400,4877382 4.42 4.32 4.07 4.14 2.3% 5.8% 1.7% 0.04 10.04% 7.5% 1,327,485 1,371,3594250 1.77 1.68 1.68 1.72 5.1% 0.0% 2.4% 0.02 7.59% 7.5% 109,533 88,4578293 8.49 7.75 7.18 7.09 8.7% 7.4% 1.3% 0.08 18.17% 7.5% 881,264 826,6558291 3.08 3.01 2.89 2.99 2.3% 4.0% 3.5% 0.03 10.03% 7.4% 265,911 291,8658021 3.03 2.83 2.67 2.69 6.6% 5.7% 0.7% 0.06 13.47% 7.3% 394,553 403,6848002 1.50 1.58 1.62 1.78 5.3% 2.5% 9.9% 0.07 18.67% 7.3% 683,403 614,7292362 1.56 1.65 1.73 1.94 5.8% 4.8% 12.1% 0.09 24.36% 7.3% 2,806 1,7245610 5.04 4.73 4.25 3.68 6.2% 10.1% 13.4% 0.13 32.60% 7.3% 108,090 127,6068387 3.10 2.79 2.55 2.48 10.0% 8.6% 2.7% 0.10 22.74% 7.3% 1,982,326 2,070,5823315 3.56 3.22 3.04 2.97 9.6% 5.6% 2.3% 0.08 18.34% 7.2% 13,066 40,3137360 3.94 3.73 3.66 3.73 5.3% 1.9% 1.9% 0.03 9.36% 7.2% 249,567 336,7054351 0.78 0.78 0.83 0.89 0.0% 6.4% 7.2% 0.06 14.10% 7.2% 37,094 22,7502651 1.97 2.13 2.21 2.23 8.1% 3.8% 0.9% 0.06 13.20% 7.2% 85,208 75,8143632 3.07 2.86 2.80 2.81 6.8% 2.1% 0.4% 0.04 9.47% 7.2% 3,679,662 4,028,3323827 2.55 2.41 2.35 2.39 5.5% 2.5% 1.7% 0.04 9.96% 7.2% 4,495 1,0558204 3.27 3.20 3.36 3.36 2.1% 5.0% 0.0% 0.02 7.25% 7.1% 40,277 40,6648392 2.36 2.17 2.12 2.10 8.1% 2.3% 0.9% 0.05 11.58% 7.1% 323,614 346,8978745 4.65 4.14 3.49 3.19 11.0% 15.7% 8.6% 0.17 39.43% 7.1% 11,780 14,1773041 4.92 4.44 4.07 3.96 9.8% 8.3% 2.7% 0.10 22.12% 7.1% 15,938 17,1154740 0.83 0.89 0.98 1.01 7.2% 10.1% 3.1% 0.09 21.69% 7.1% 57,329 84,049

NCCI Missouri Loss Cost Filing Effective January 1, 2021Analysis of the Absolute Loss Cost Change from Loss Costs that are Effective from January 1, 2018 to January 1, 2021 Sorted by Swing
SwingLoss Cost Percent Change Loss Cost Absolute Max Min Payroll (100's)
Class Code 2018 2019 2020 2021 2019 2020 2021 Coef. Var Change Change 2017 20183881 4.15 3.77 3.69 3.57 9.2% 2.1% 3.3% 0.07 15.10% 7.0% 183,066 197,7969220 3.62 3.62 3.45 3.53 0.0% 4.7% 2.3% 0.02 7.12% 7.0% 169,496 179,9986216 4.39 4.20 3.96 4.01 4.3% 5.7% 1.3% 0.05 11.68% 7.0% 11,090 10,2488856 0.23 0.26 0.30 0.36 13.0% 15.4% 20.0% 0.20 56.52% 7.0% 388,287 396,9288233 1.99 2.05 1.97 1.96 3.0% 3.9% 0.5% 0.02 7.58% 6.9% 41,133 30,1023111 2.33 2.32 2.15 2.08 0.4% 7.3% 3.3% 0.06 11.30% 6.9% 1,118 4,1125020 4.48 4.51 4.23 4.07 0.7% 6.2% 3.8% 0.05 10.96% 6.9% 97,758 86,1708018 2.15 2.12 2.19 2.31 1.4% 3.3% 5.5% 0.04 10.48% 6.9% 5,246,371 5,668,3364101 2.32 2.35 2.22 2.21 1.3% 5.5% 0.5% 0.03 7.38% 6.8% 69,377 98,2585437 3.77 3.91 4.04 4.45 3.7% 3.3% 10.1% 0.07 18.04% 6.8% 1,306,098 1,329,6603113 1.85 1.85 1.76 1.64 0.0% 4.9% 6.8% 0.06 12.01% 6.8% 1,426,505 1,438,3432802 5.28 4.92 4.92 4.88 6.8% 0.0% 0.8% 0.04 7.69% 6.8% 302,048 322,2985645 9.27 8.92 9.19 8.95 3.8% 3.0% 2.6% 0.02 9.71% 6.8% 2,236,385 2,302,3602039 2.41 2.49 2.50 2.68 3.3% 0.4% 7.2% 0.05 11.20% 6.8% 433,000 427,4932143 1.82 2.05 2.17 2.31 12.6% 5.9% 6.5% 0.10 26.92% 6.8% 114,218 126,1902002 2.53 2.80 2.91 3.08 10.7% 3.9% 5.8% 0.08 21.74% 6.7% 286,338 224,2602003 3.64 3.63 3.52 3.65 0.3% 3.0% 3.7% 0.02 7.13% 6.7% 540,593 738,2835462 5.39 5.37 4.99 4.67 0.4% 7.1% 6.4% 0.07 14.37% 6.7% 372,133 338,7064239 1.80 1.79 1.90 2.01 0.6% 6.1% 5.8% 0.05 12.91% 6.7% 85,368 90,3978606 1.92 1.78 1.69 1.68 7.3% 5.1% 0.6% 0.06 13.38% 6.7% 1,437 2,0395183 3.02 2.75 2.65 2.59 8.9% 3.6% 2.3% 0.07 15.46% 6.7% 4,282,023 4,403,4818855 0.16 0.15 0.14 0.14 6.3% 6.7% 0.0% 0.06 13.33% 6.7% 25,075,510 28,781,8448723 0.15 0.14 0.14 0.14 6.7% 0.0% 0.0% 0.04 6.67% 6.7% 19,563,323 20,034,7043169 1.98 2.08 2.22 2.48 5.1% 6.7% 11.7% 0.10 25.25% 6.7% 58,056 74,8963122 2.02 1.96 2.03 2.08 3.0% 3.6% 2.5% 0.02 9.27% 6.5% 819 7406252 3.45 3.08 2.95 2.79 10.7% 4.2% 5.4% 0.09 21.66% 6.5% 28,828 51,0573081 3.53 3.85 3.95 4.27 9.1% 2.6% 8.1% 0.08 20.96% 6.5% 104,760 102,3612883 2.90 2.96 2.83 2.74 2.1% 4.4% 3.2% 0.03 9.94% 6.5% 1,273,831 1,362,0816325 3.24 3.06 2.83 2.80 5.6% 7.5% 1.1% 0.07 14.69% 6.5% 544,279 601,5933726 3.40 3.32 3.18 3.25 2.4% 4.2% 2.2% 0.03 9.02% 6.4% 159,054 226,0032157 6.56 6.25 5.97 5.32 4.7% 4.5% 10.9% 0.09 21.33% 6.4% 678,966 709,3164771 2.36 2.51 2.52 2.52 6.4% 0.4% 0.0% 0.03 6.78% 6.4% 334,620 334,1434251 3.37 3.36 3.28 3.41 0.3% 2.4% 4.0% 0.02 6.75% 6.3% 115,984 148,0588264 5.05 4.63 4.52 4.43 8.3% 2.4% 2.0% 0.06 13.10% 6.3% 215,577 235,4917380 4.35 4.27 4.26 4.45 1.8% 0.2% 4.5% 0.02 6.63% 6.3% 4,660,879 5,031,5992660 2.74 2.70 2.70 2.83 1.5% 0.0% 4.8% 0.02 6.34% 6.3% 192,307 265,0035160 2.38 2.16 2.02 1.96 9.2% 6.5% 3.0% 0.09 19.78% 6.3% 424,211 425,1567422 2.56 2.12 1.73 1.52 17.2% 18.4% 12.1% 0.23 55.59% 6.3% 75,072 98,7652220 1.91 1.90 1.92 2.03 0.5% 1.1% 5.7% 0.03 7.40% 6.3% 11,397 13,3118835 1.95 1.90 1.76 1.74 2.6% 7.4% 1.1% 0.06 11.37% 6.2% 5,714,031 5,932,0841699 2.93 2.80 2.56 2.50 4.4% 8.6% 2.3% 0.07 16.05% 6.2% 74,357 192,8363507 2.40 2.41 2.57 2.59 0.4% 6.6% 0.8% 0.04 7.92% 6.2% 809,408 890,3242112 3.49 3.64 3.57 3.57 4.3% 1.9% 0.0% 0.02 6.30% 6.2% 2,865 3,0159402 3.72 3.81 3.87 4.17 2.4% 1.6% 7.8% 0.05 12.10% 6.2% 438,231 525,6033040 5.62 5.18 4.84 4.76 7.8% 6.6% 1.7% 0.08 16.81% 6.2% 270,429 290,1565606 1.16 1.15 1.10 1.12 0.9% 4.3% 1.8% 0.02 7.16% 6.2% 5,198,512 5,466,7312570 4.02 3.87 3.77 3.86 3.7% 2.6% 2.4% 0.03 8.95% 6.1% 18,355 29,3674665 8.99 8.73 9.01 9.02 2.9% 3.2% 0.1% 0.02 6.31% 6.1% 16,625 11,4300037 3.30 3.25 3.02 2.99 1.5% 7.1% 1.0% 0.05 9.78% 6.1% 467,083 516,0318350 5.75 5.36 5.32 5.23 6.8% 0.7% 1.7% 0.04 9.40% 6.0% 717,830 768,0753685 1.37 1.22 1.16 1.09 10.9% 4.9% 6.0% 0.10 23.43% 6.0% 1,395,129 1,357,6027370 4.78 4.50 4.12 4.02 5.9% 8.4% 2.4% 0.08 17.58% 6.0% 141,593 150,3422623 7.33 6.61 6.02 5.79 9.8% 8.9% 3.8% 0.11 24.20% 6.0% 28,949 28,3474361 0.86 0.76 0.71 0.67 11.6% 6.6% 5.6% 0.11 25.67% 6.0% 757,031 746,3093629 1.76 1.62 1.51 1.48 8.0% 6.8% 2.0% 0.08 17.58% 6.0% 888,991 933,3298901 0.18 0.18 0.17 0.16 0.0% 5.6% 5.9% 0.06 11.76% 5.9% 11,414,928 10,920,5415403 5.51 5.12 4.98 4.92 7.1% 2.7% 1.2% 0.05 11.33% 5.9% 2,787,745 2,937,9411803 7.43 7.08 7.16 7.24 4.7% 1.1% 1.1% 0.02 7.08% 5.8% 160,263 175,7062589 1.91 1.91 1.88 1.96 0.0% 1.6% 4.3% 0.02 5.89% 5.8% 214,680 197,809

NCCI Missouri Loss Cost Filing Effective January 1, 2021Analysis of the Absolute Loss Cost Change from Loss Costs that are Effective from January 1, 2018 to January 1, 2021 Sorted by Swing
SwingLoss Cost Percent Change Loss Cost Absolute Max Min Payroll (100's)
Class Code 2018 2019 2020 2021 2019 2020 2021 Coef. Var Change Change 2017 20183830 0.68 0.71 0.70 0.70 4.4% 1.4% 0.0% 0.02 5.88% 5.8% 9,096,560 9,338,7743114 2.81 3.06 3.25 3.35 8.9% 6.2% 3.1% 0.08 19.22% 5.8% 29,702 55,0225146 4.65 4.56 4.38 4.46 1.9% 3.9% 1.8% 0.03 7.89% 5.8% 359,801 386,7557520 3.50 3.02 2.78 2.55 13.7% 7.9% 8.3% 0.14 32.91% 5.8% 859,352 1,023,7627590 2.83 2.70 2.59 2.62 4.6% 4.1% 1.2% 0.04 10.12% 5.8% 121,854 126,4502688 2.99 2.71 2.42 2.30 9.4% 10.7% 5.0% 0.12 27.07% 5.7% 58,736 62,6420083 4.50 4.55 4.34 4.25 1.1% 4.6% 2.1% 0.03 7.97% 5.7% 791,132 856,8820251 3.56 3.52 3.35 3.38 1.1% 4.8% 0.9% 0.03 6.96% 5.7% 8,454 8,7888279 5.42 5.21 5.01 5.10 3.9% 3.8% 1.8% 0.03 9.80% 5.7% 61,467 45,0799600 2.79 2.83 2.96 3.17 1.4% 4.6% 7.1% 0.06 13.62% 5.7% 2,791 7,8553082 4.71 4.60 4.61 4.76 2.3% 0.2% 3.3% 0.02 5.89% 5.6% 36,493 48,5704283 1.55 1.42 1.38 1.28 8.4% 2.8% 7.2% 0.08 19.52% 5.6% 239,305 221,4023612 2.14 2.01 1.97 1.96 6.1% 2.0% 0.5% 0.04 8.73% 5.6% 790,319 725,5837600 3.14 3.11 3.04 3.14 1.0% 2.3% 3.3% 0.02 6.62% 5.5% 3,544,445 3,320,3631320 1.47 1.46 1.40 1.42 0.7% 4.1% 1.4% 0.02 6.32% 5.5% 6,161 8,7909015 2.56 2.68 2.66 2.73 4.7% 0.7% 2.6% 0.03 8.24% 5.4% 3,729,910 3,923,3903126 1.17 1.27 1.31 1.36 8.5% 3.1% 3.8% 0.06 16.24% 5.4% 26,511 35,7069033 1.63 1.66 1.73 1.71 1.8% 4.2% 1.2% 0.03 7.36% 5.4% 314,514 316,2713227 2.95 3.00 2.89 2.83 1.7% 3.7% 2.1% 0.03 7.61% 5.4% 228,764 300,7319170 9.54 9.68 10.34 10.85 1.5% 6.8% 4.9% 0.06 13.73% 5.4% 42,254 40,9687395 3.72 3.73 3.92 4.14 0.3% 5.1% 5.6% 0.05 11.29% 5.3% 361 1,5025059 28.25 25.77 24.30 23.46 8.8% 5.7% 3.5% 0.08 18.96% 5.3% 45,627 58,4206251 3.64 3.42 3.06 2.90 6.0% 10.5% 5.2% 0.10 23.33% 5.3% 37,455 81,6244583 3.78 3.95 4.08 4.43 4.5% 3.3% 8.6% 0.07 17.20% 5.3% 299,699 304,7540917 3.97 3.67 3.39 3.31 7.6% 7.6% 2.4% 0.08 18.49% 5.3% 178,221 175,7544825 0.76 0.72 0.72 0.72 5.3% 0.0% 0.0% 0.03 5.26% 5.3% 2,061,898 2,183,2003076 2.82 2.86 3.00 2.99 1.4% 4.9% 0.3% 0.03 6.74% 5.2% 5,081,301 5,007,8213022 3.85 3.54 3.44 3.28 8.1% 2.8% 4.7% 0.07 16.27% 5.2% 119,430 136,7172070 4.31 4.03 3.91 3.86 6.5% 3.0% 1.3% 0.05 11.07% 5.2% 531,989 996,7948033 1.56 1.52 1.51 1.55 2.6% 0.7% 2.6% 0.02 5.97% 5.2% 5,774,305 5,452,1372916 4.64 4.03 3.71 3.41 13.1% 7.9% 8.1% 0.13 32.01% 5.2% 4,947 1,7822211 11.21 10.16 9.36 8.97 9.4% 7.9% 4.2% 0.10 22.89% 5.2% 131 1228500 4.81 4.83 4.60 4.61 0.4% 4.8% 0.2% 0.03 5.43% 5.2% 83,296 88,5846005 5.41 4.86 4.55 4.32 10.2% 6.4% 5.1% 0.10 23.12% 5.1% 611 1,4129179 17.25 16.95 17.37 17.95 1.7% 2.5% 3.3% 0.02 7.74% 5.1% 88,002 89,2503559 2.40 2.32 2.36 2.35 3.3% 1.7% 0.4% 0.01 5.56% 5.1% 57,249 56,8854558 1.87 1.79 1.71 1.72 4.3% 4.5% 0.6% 0.04 9.58% 5.1% 441,207 460,4163822 3.87 3.62 3.50 3.45 6.5% 3.3% 1.4% 0.05 11.56% 5.0% 12,257 21,2648833 1.01 1.00 1.04 1.07 1.0% 4.0% 2.9% 0.03 8.06% 5.0% 18,604,651 19,708,9909403 6.20 6.58 6.79 6.87 6.1% 3.2% 1.2% 0.05 10.81% 5.0% 1,342,733 1,385,4864279 2.18 2.16 2.24 2.33 0.9% 3.7% 4.0% 0.03 8.86% 4.9% 306,460 341,1031624 3.71 3.33 2.90 2.46 10.2% 12.9% 15.2% 0.17 43.36% 4.9% 865,153 866,7597350 12.01 11.43 10.48 9.46 4.8% 8.3% 9.7% 0.10 24.59% 4.9% 2,718 9,2209016 2.63 2.74 2.85 2.83 4.2% 4.0% 0.7% 0.04 9.13% 4.9% 385,208 431,3163307 4.14 3.58 3.27 2.92 13.5% 8.7% 10.7% 0.15 36.56% 4.9% 69,028 74,0912585 3.13 3.14 3.08 2.94 0.3% 1.9% 4.5% 0.03 6.88% 4.9% 964,313 1,070,4799040 3.32 3.25 3.29 3.38 2.1% 1.2% 2.7% 0.02 6.19% 4.8% 834,652 873,1963400 4.18 4.09 4.20 4.31 2.2% 2.7% 2.6% 0.02 7.65% 4.8% 1,326,392 1,078,3202065 1.94 1.89 1.75 1.70 2.6% 7.4% 2.9% 0.06 13.32% 4.8% 28,401 15,7121165 3.72 3.40 3.12 3.00 8.6% 8.2% 3.8% 0.10 22.07% 4.8% 6,649 5,8858046 2.18 2.13 2.06 2.09 2.3% 3.3% 1.5% 0.02 7.19% 4.7% 2,219,568 2,192,0452130 1.74 1.72 1.68 1.72 1.1% 2.3% 2.4% 0.01 5.97% 4.7% 179,138 205,9561472 2.54 2.55 2.68 2.74 0.4% 5.1% 2.2% 0.04 7.87% 4.7% 206,977 226,6397540 2.80 2.72 2.55 2.51 2.9% 6.3% 1.6% 0.05 11.00% 4.7% 8 1502172 1.54 1.53 1.47 1.48 0.6% 3.9% 0.7% 0.02 5.31% 4.6% 3,984 3796882 3.72 3.60 3.32 3.16 3.2% 7.8% 4.8% 0.07 16.62% 4.6% 0 3,7859534 4.40 4.17 4.02 3.99 5.2% 3.6% 0.7% 0.05 9.83% 4.5% 151,341 169,3940008 2.80 2.60 2.53 2.39 7.1% 2.7% 5.5% 0.07 16.12% 4.5% 72,693 72,0443642 1.32 1.28 1.21 1.12 3.0% 5.5% 7.4% 0.07 16.75% 4.4% 9,557 2,059

NCCI Missouri Loss Cost Filing Effective January 1, 2021Analysis of the Absolute Loss Cost Change from Loss Costs that are Effective from January 1, 2018 to January 1, 2021 Sorted by Swing
SwingLoss Cost Percent Change Loss Cost Absolute Max Min Payroll (100's)
Class Code 2018 2019 2020 2021 2019 2020 2021 Coef. Var Change Change 2017 20189082 1.18 1.15 1.11 1.12 2.5% 3.5% 0.9% 0.03 7.07% 4.4% 15,779,625 16,479,4952586 2.05 2.22 2.50 2.78 8.3% 12.6% 11.2% 0.13 35.61% 4.3% 58,298 60,7621925 3.27 3.23 3.25 3.35 1.2% 0.6% 3.1% 0.02 4.98% 4.3% 256,802 285,7720034 2.02 2.25 2.41 2.62 11.4% 7.1% 8.7% 0.11 29.70% 4.3% 377,904 480,8505222 7.20 6.85 6.74 6.70 4.9% 1.6% 0.6% 0.03 7.18% 4.3% 234,569 261,2924470 2.07 2.10 2.17 2.15 1.4% 3.3% 0.9% 0.02 5.80% 4.3% 82,885 89,3717431 0.86 0.94 0.99 1.04 9.3% 5.3% 5.1% 0.08 20.93% 4.3% 218,864 236,5588725 1.83 1.87 1.99 2.05 2.2% 6.4% 3.0% 0.05 12.02% 4.2% 18,964 13,3736217 4.18 3.84 3.40 3.15 8.1% 11.5% 7.4% 0.13 29.39% 4.1% 2,323,776 2,377,4604717 1.86 1.99 2.05 2.11 7.0% 3.0% 2.9% 0.05 13.44% 4.1% 80,736 79,8698721 0.25 0.25 0.25 0.26 0.0% 0.0% 4.0% 0.02 4.00% 4.0% 252,408 254,2050913 361.00 381.00 394.00 423.00 5.5% 3.4% 7.4% 0.07 17.17% 3.9% 0 4947222 5.36 5.60 5.63 5.80 4.5% 0.5% 3.0% 0.03 8.21% 3.9% 1,207 7,3503146 2.08 2.19 2.22 2.25 5.3% 1.4% 1.4% 0.03 8.17% 3.9% 445,040 444,9865022 5.47 5.46 5.46 5.66 0.2% 0.0% 3.7% 0.02 3.85% 3.8% 1,295,269 1,286,6163681 0.81 0.77 0.73 0.72 4.9% 5.2% 1.4% 0.05 11.90% 3.8% 2,446,154 3,200,6602714 5.06 4.74 4.62 4.50 6.3% 2.5% 2.6% 0.05 11.85% 3.8% 353 6083372 3.59 3.41 3.13 2.99 5.0% 8.2% 4.5% 0.08 18.72% 3.7% 246,152 158,0368061 1.78 1.66 1.61 1.55 6.7% 3.0% 3.7% 0.06 14.05% 3.7% 1,776,589 1,819,6512111 2.16 2.15 2.06 1.98 0.5% 4.2% 3.9% 0.04 8.73% 3.7% 298,315 363,1524777 4.06 4.05 3.89 3.86 0.2% 4.0% 0.8% 0.03 5.01% 3.7% 17,196 55,4159516 3.51 3.07 2.63 2.35 12.5% 14.3% 10.6% 0.18 42.36% 3.7% 496,687 465,5723257 2.44 2.50 2.47 2.48 2.5% 1.2% 0.4% 0.01 4.11% 3.7% 365,001 413,6774692 0.78 0.81 0.82 0.86 3.8% 1.2% 4.9% 0.04 10.26% 3.6% 282,864 296,4512881 3.20 3.12 2.93 2.78 2.5% 6.1% 5.1% 0.06 14.31% 3.6% 227,858 218,9873515 2.77 2.65 2.59 2.57 4.3% 2.3% 0.8% 0.03 7.52% 3.6% 4,219 4,5882089 3.43 3.33 3.17 3.13 2.9% 4.8% 1.3% 0.04 9.22% 3.5% 1,986,321 2,186,5445480 5.16 5.17 5.08 4.91 0.2% 1.7% 3.3% 0.02 5.35% 3.5% 48,066 53,2955215 5.08 4.89 4.87 4.86 3.7% 0.4% 0.2% 0.02 4.38% 3.5% 548,826 536,1789052 1.72 1.70 1.71 1.66 1.2% 0.6% 2.9% 0.02 4.73% 3.5% 4,041,664 4,595,0556504 2.27 2.31 2.29 2.25 1.8% 0.9% 1.7% 0.01 4.44% 3.5% 3,686,151 4,309,7224635 3.19 3.01 2.94 2.77 5.6% 2.3% 5.8% 0.06 14.35% 3.5% 326,682 348,1784420 4.12 4.09 3.92 3.89 0.7% 4.2% 0.8% 0.03 5.72% 3.4% 53 1,4236835 2.67 2.65 2.59 2.62 0.7% 2.3% 1.2% 0.01 4.22% 3.4% 201 05705 27.20 24.22 22.38 19.95 11.0% 7.6% 10.9% 0.13 32.35% 3.4% 1,295 5053027 2.75 2.55 2.45 2.28 7.3% 3.9% 6.9% 0.08 19.21% 3.4% 13,485 12,4625478 6.18 5.57 5.05 4.41 9.9% 9.3% 12.7% 0.14 35.35% 3.3% 631,459 619,7354036 2.76 2.62 2.40 2.25 5.1% 8.4% 6.3% 0.09 21.01% 3.3% 41,436 47,9949156 1.92 2.04 2.10 2.19 6.3% 2.9% 4.3% 0.05 14.06% 3.3% 383,059 420,2513131 1.81 1.84 1.81 1.79 1.7% 1.6% 1.1% 0.01 4.46% 3.3% 372 1411164 4.64 4.59 4.39 4.25 1.1% 4.4% 3.2% 0.04 8.85% 3.3% 628,282 880,8432110 2.00 1.89 1.80 1.76 5.5% 4.8% 2.2% 0.06 12.98% 3.3% 54,858 45,3279110 2.99 2.82 2.62 2.52 5.7% 7.1% 3.8% 0.08 17.50% 3.3% 805,703 904,1552041 2.47 2.46 2.47 2.54 0.4% 0.4% 2.8% 0.01 3.67% 3.2% 69,127 64,4504581 1.13 1.33 1.58 1.91 17.7% 18.8% 20.9% 0.23 69.03% 3.2% 16,906 13,4288015 0.81 0.78 0.73 0.68 3.7% 6.4% 6.8% 0.08 17.91% 3.1% 381,701 375,4505223 6.16 5.78 5.27 4.97 6.2% 8.8% 5.7% 0.10 22.11% 3.1% 126,156 141,2318006 1.62 1.61 1.58 1.60 0.6% 1.9% 1.3% 0.01 3.79% 3.1% 2,635,938 2,778,1627502 3.65 3.06 2.47 2.07 16.2% 19.3% 16.2% 0.25 61.00% 3.1% 137,040 84,7314720 1.69 1.78 1.93 2.05 5.3% 8.4% 6.2% 0.09 21.30% 3.1% 1,172,580 862,0404431 1.31 1.27 1.26 1.26 3.1% 0.8% 0.0% 0.02 3.86% 3.1% 21,004 14,5776503 2.00 1.98 1.96 2.00 1.0% 1.0% 2.0% 0.01 4.10% 3.1% 34,776 34,7317098 10.86 10.66 10.44 10.54 1.8% 2.1% 1.0% 0.02 4.94% 3.0% 0 104452 2.79 2.73 2.59 2.47 2.2% 5.1% 4.6% 0.05 12.36% 3.0% 515,162 631,2438017 1.41 1.38 1.31 1.28 2.1% 5.1% 2.3% 0.04 9.77% 2.9% 8,750,505 9,161,5843018 5.93 5.08 4.37 3.87 14.3% 14.0% 11.4% 0.19 45.22% 2.9% 49,612 45,8128107 2.46 2.44 2.35 2.32 0.8% 3.7% 1.3% 0.03 5.87% 2.9% 1,818,342 1,999,7714693 0.68 0.75 0.82 0.92 10.3% 9.3% 12.2% 0.13 35.29% 2.9% 169,544 146,2354062 2.44 2.52 2.63 2.67 3.3% 4.4% 1.5% 0.04 9.43% 2.8% 15,157 19,358
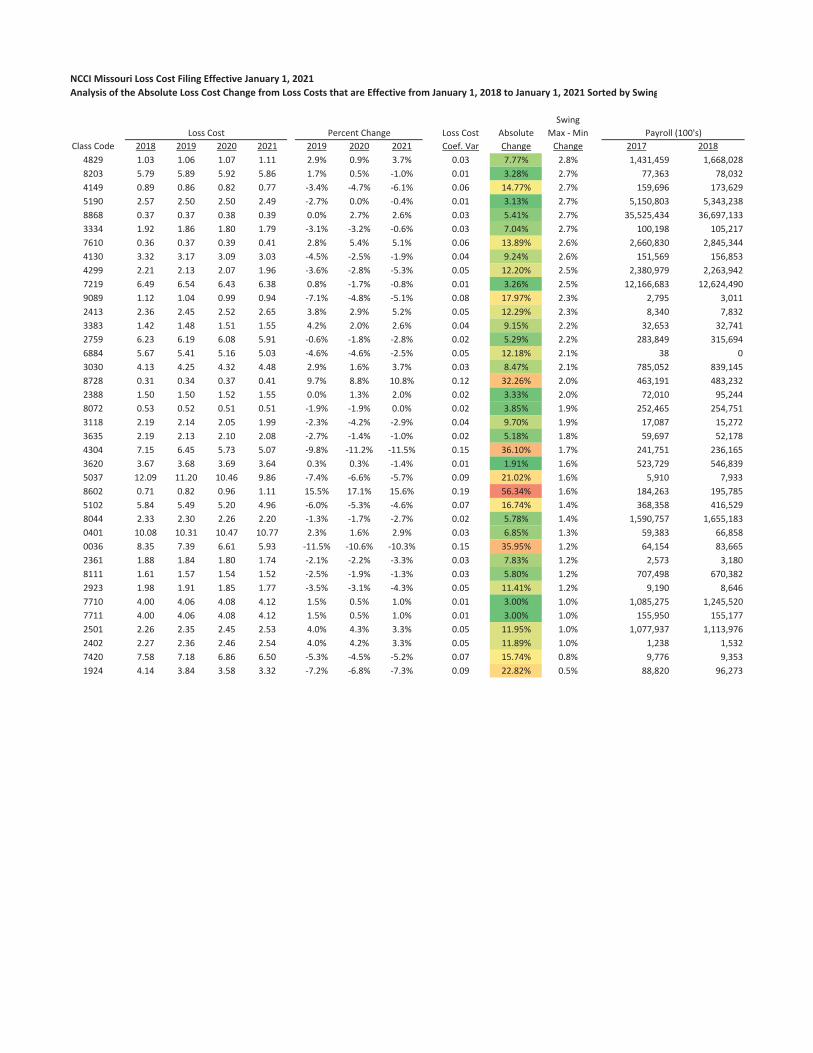
NCCI Missouri Loss Cost Filing Effective January 1, 2021Analysis of the Absolute Loss Cost Change from Loss Costs that are Effective from January 1, 2018 to January 1, 2021 Sorted by Swing
SwingLoss Cost Percent Change Loss Cost Absolute Max Min Payroll (100's)
Class Code 2018 2019 2020 2021 2019 2020 2021 Coef. Var Change Change 2017 20184829 1.03 1.06 1.07 1.11 2.9% 0.9% 3.7% 0.03 7.77% 2.8% 1,431,459 1,668,0288203 5.79 5.89 5.92 5.86 1.7% 0.5% 1.0% 0.01 3.28% 2.7% 77,363 78,0324149 0.89 0.86 0.82 0.77 3.4% 4.7% 6.1% 0.06 14.77% 2.7% 159,696 173,6295190 2.57 2.50 2.50 2.49 2.7% 0.0% 0.4% 0.01 3.13% 2.7% 5,150,803 5,343,2388868 0.37 0.37 0.38 0.39 0.0% 2.7% 2.6% 0.03 5.41% 2.7% 35,525,434 36,697,1333334 1.92 1.86 1.80 1.79 3.1% 3.2% 0.6% 0.03 7.04% 2.7% 100,198 105,2177610 0.36 0.37 0.39 0.41 2.8% 5.4% 5.1% 0.06 13.89% 2.6% 2,660,830 2,845,3444130 3.32 3.17 3.09 3.03 4.5% 2.5% 1.9% 0.04 9.24% 2.6% 151,569 156,8534299 2.21 2.13 2.07 1.96 3.6% 2.8% 5.3% 0.05 12.20% 2.5% 2,380,979 2,263,9427219 6.49 6.54 6.43 6.38 0.8% 1.7% 0.8% 0.01 3.26% 2.5% 12,166,683 12,624,4909089 1.12 1.04 0.99 0.94 7.1% 4.8% 5.1% 0.08 17.97% 2.3% 2,795 3,0112413 2.36 2.45 2.52 2.65 3.8% 2.9% 5.2% 0.05 12.29% 2.3% 8,340 7,8323383 1.42 1.48 1.51 1.55 4.2% 2.0% 2.6% 0.04 9.15% 2.2% 32,653 32,7412759 6.23 6.19 6.08 5.91 0.6% 1.8% 2.8% 0.02 5.29% 2.2% 283,849 315,6946884 5.67 5.41 5.16 5.03 4.6% 4.6% 2.5% 0.05 12.18% 2.1% 38 03030 4.13 4.25 4.32 4.48 2.9% 1.6% 3.7% 0.03 8.47% 2.1% 785,052 839,1458728 0.31 0.34 0.37 0.41 9.7% 8.8% 10.8% 0.12 32.26% 2.0% 463,191 483,2322388 1.50 1.50 1.52 1.55 0.0% 1.3% 2.0% 0.02 3.33% 2.0% 72,010 95,2448072 0.53 0.52 0.51 0.51 1.9% 1.9% 0.0% 0.02 3.85% 1.9% 252,465 254,7513118 2.19 2.14 2.05 1.99 2.3% 4.2% 2.9% 0.04 9.70% 1.9% 17,087 15,2723635 2.19 2.13 2.10 2.08 2.7% 1.4% 1.0% 0.02 5.18% 1.8% 59,697 52,1784304 7.15 6.45 5.73 5.07 9.8% 11.2% 11.5% 0.15 36.10% 1.7% 241,751 236,1653620 3.67 3.68 3.69 3.64 0.3% 0.3% 1.4% 0.01 1.91% 1.6% 523,729 546,8395037 12.09 11.20 10.46 9.86 7.4% 6.6% 5.7% 0.09 21.02% 1.6% 5,910 7,9338602 0.71 0.82 0.96 1.11 15.5% 17.1% 15.6% 0.19 56.34% 1.6% 184,263 195,7855102 5.84 5.49 5.20 4.96 6.0% 5.3% 4.6% 0.07 16.74% 1.4% 368,358 416,5298044 2.33 2.30 2.26 2.20 1.3% 1.7% 2.7% 0.02 5.78% 1.4% 1,590,757 1,655,1830401 10.08 10.31 10.47 10.77 2.3% 1.6% 2.9% 0.03 6.85% 1.3% 59,383 66,8580036 8.35 7.39 6.61 5.93 11.5% 10.6% 10.3% 0.15 35.95% 1.2% 64,154 83,6652361 1.88 1.84 1.80 1.74 2.1% 2.2% 3.3% 0.03 7.83% 1.2% 2,573 3,1808111 1.61 1.57 1.54 1.52 2.5% 1.9% 1.3% 0.03 5.80% 1.2% 707,498 670,3822923 1.98 1.91 1.85 1.77 3.5% 3.1% 4.3% 0.05 11.41% 1.2% 9,190 8,6467710 4.00 4.06 4.08 4.12 1.5% 0.5% 1.0% 0.01 3.00% 1.0% 1,085,275 1,245,5207711 4.00 4.06 4.08 4.12 1.5% 0.5% 1.0% 0.01 3.00% 1.0% 155,950 155,1772501 2.26 2.35 2.45 2.53 4.0% 4.3% 3.3% 0.05 11.95% 1.0% 1,077,937 1,113,9762402 2.27 2.36 2.46 2.54 4.0% 4.2% 3.3% 0.05 11.89% 1.0% 1,238 1,5327420 7.58 7.18 6.86 6.50 5.3% 4.5% 5.2% 0.07 15.74% 0.8% 9,776 9,3531924 4.14 3.84 3.58 3.32 7.2% 6.8% 7.3% 0.09 22.82% 0.5% 88,820 96,273

For questions about your insurance policy or to file a complaint
against an insurance company or agent:
insurance.mo.gov800-726-7390
Harry S Truman Building, Room 530301 W. High St.
PO Box 690Jefferson City, MO 65102