Missouri Department of Natural Resources Air Pollution ... · Air Pollution Control Program 2007...
45
Missouri Department of Natural Resources Air Pollution Control Program 2007 Monitoring Network Plan May 1, 2007
Transcript of Missouri Department of Natural Resources Air Pollution ... · Air Pollution Control Program 2007...
Missouri Department of Natural ResourcesAir Pollution Control Program2007 Monitoring Network Plan
May 1, 2007

Table of ContentsINTRODUCTION ........................................................................................................................................ 3
MONITORING NETWORK PLAN........................................................................................................... 4
NETWORK DESCRIPTION COMPONENTS......................................................................................... 5
1. SITE DATA............................................................................................................................................... 5AQS Site Code ....................................................................................................................................... 5Street Address......................................................................................................................................... 5Geographical Coordinates ...................................................................................................................... 5Air Quality Control Region .................................................................................................................... 6Metropolitan Statistical Area.................................................................................................................. 6
2. MONITOR DATA ...................................................................................................................................... 6Pollutant.................................................................................................................................................. 6AQS Pollutant Code ............................................................................................................................... 6POC ........................................................................................................................................................ 7Collocated............................................................................................................................................... 7Sampling Frequency............................................................................................................................... 8Scale of Representation .......................................................................................................................... 8Monitoring Objective ............................................................................................................................. 8Units ....................................................................................................................................................... 8Monitoring/Analytical Method............................................................................................................... 9
PM2.5 STANDARDS ..................................................................................................................................... 9
PROPOSED CHANGES TO NETWORK................................................................................................. 9
1. MOUND ST. REDESIGNATION TO NEIGHBORHOOD SCALE. .................................................................... 102. FERGUSON PM10 MONITORING SITE RELOCATION ................................................................................ 12
MISSOURI AIR QUALITY MONITORING SITES, 2007 ................................................................... 17
MISSOURI AMBIENT AIR MONITORING NETWORK .....................................................................19
Introduction
Between the years of 1900 and 1970, emissions of pollutants into theenvironment increased significantly. To counter this trend and protectpublic and environmental health, the United States passed several lawsgoverning pollution, including the Clean Air Act (CAA) in 1970. As a resultof the CAA and its amendments, state agencies are required to establish andmaintain State Implementation Plans (SIP) which outline the policies andprocedures used to assure CAA compliance with the National Ambient AirQuality Standards (NAAQS) for the criteria pollutants: PM10, PM2.5, sulfurdioxide, carbon monoxide, nitrogen dioxide, ozone, and lead. Great successhas taken place in reducing ambient levels of many of these pollutants inmost of the nation. However, some areas, including several in Missouri, arestill in violation.
In 2006, the United States Environmental Protection Agency (EPA)published new particulate matter regulations. The 24-hour PM2.5 NAAQSwas reduced substantially from 65 to 35 µg/m3 and the annual PM10 NAAQSwas revoked. The reduction of the 24-hour PM2.5 standard will have asignificant impact on the Missouri Department of Natural Resources’(MDNR) approach to air quality in St. Louis. The MDNR is preparing a SIPto address this problem.
The EPA is implementing a new National Ambient Air Monitoring Strategy(NAAMS). In the past, monitoring networks were deployed as separate,pollutant specific networks. The new strategy replaces this with acomprehensive network of multiple- and single-pollutant sites. The researchsites (3-10 nationwide) are comprehensive, research and technology orientedsites, such as the PM2.5 Supersite in St. Louis. The ‘NCore’ (National Core)sites (+/- 75 nationwide) include most criteria pollutants, PM2.5 Speciation,and air toxics instruments. Missouri is scheduled to have two NCore sites,one each in St. Louis and Kansas City. The ‘SLAMS’ (State/Local AirMonitoring Stations) sites are pollutant specific sites, primarily ozone andPM2.5. A major goal of NAAMS is integrating more sensitive and timeresponsive instruments, such as continous PM2.5 monitors. For several yearsMDNR has been restructuring it’s monitoring network with this strategy inmind. The result is the more streamlined and efficient network described inthe Missouri Ambient Air Monitoring Network table, beginning on page 18.

In addition, EPA Region VII is also developing a regional monitoringstrategy for rural sites. The NAAMS does not adequately address the uniquerural ambient air conditions of the Midwest. The Region VII states aregeographically located in the transition zone between the sulfate-dominatedPM2.5 of the eastern U.S. and the nitrate-dominated PM2.5 of the westernU.S. Midwestern states are also among the highest emitters of ammonia andhave the highest monitored values of aerosol ammonium nitrate in thenation.
The SLAMS/NCore/SPMS/PM2.5 Ambient Air Quality Monitoring NetworkProgram consists of three major categories of monitoring stations ornetworks that measure the criteria pollutants. These stations are describedbelow.
• The SLAMS consists of a network of single-pollutant monitoringstations that focus on determining NAAQS compliance.
• The NCore sites are multi-pollutant sites that focus on long-termtrends and collecting data for ambient air characterization.
• The SPMS are a subset of SLAMS, i.e. single-pollutant sites, that arechosen for shorter-term monitoring projects for information and notnecessarily NAAQS compliance.
The Missouri Department of Natural Resources operates an extensivenetwork of 62 ambient air monitors at 44 sites to comply with the Clean AirAct and it’s amendments (see map, page 16).
Monitoring Network Plan
The annual monitoring network plan, as provided for in 40 CFR Part 58.10,Annual monitoring network plan and periodic network assessment, mustcontain the following information for each monitoring station in thenetwork:
1. The Air Quality System (AQS) site identification number forexisting stations.2. The location, including the street address and geographicalcoordinates, for each monitoring station.

3. The sampling and analysis method used for each measuredparameter.4. The operating schedule for each monitor.5. Any proposal to remove or move a monitoring station with in aperiod of eighteen months following the plan submittal.6. The monitoring objective and spatial scale of representativeness foreach monitor.7. The identification of any sites that are or are not suitable forcomparison against the annual PM2.5 NAAQS.8. The Metropolitan Statistical Area (MSA), Core-Based StatisticalArea (CBSA), Combined Statistical Area (CSA) or other arearepresented by the monitor.
Network Description ComponentsThe required information described in the previous section is supplied in theAmbient Air Monitoring Network table, which begins on page 19.Components of the table are described below:
1. Site DataAll ambient air monitoring sites are recorded in the EPA’s Air QualitySystem (AQS) database. Data includes location data such as latitude &longitutde.
AQS Site CodeThe site code includes a numerical designation for State, county, andindividual site. The state and county codes are assigned a numberbased on the alphabetical order of the State or county. Site numbersare assigned sequentially by date established in most counties. St.Louis County sites also have a division for municipality within St.Louis County.
Street AddressThe official Post Office address of the lot where the monitors arelocated. Because not all sites are located in cities or towns, the streetaddress is occasionally given as the intersection of the nearest streetsor hiways.
Geographical CoordinatesThe coordinate system used by MDNR is latitude and longitude.

Air Quality Control RegionAir Quality Control Region are defined by EPA and designate eitherurban regions, like St. Louis or Kansas City, or rural sections of aState, such as northeast or southwest Missouri.
AQCR AQCR Name070 Metropolitan St. Louis094 Metropolitan Kansas City137 Northern Missouri138 SE Missouri139 SW Missouri
Metropolitan Statistical AreaMSAs are defined by the U.S. Census Bureau.
MSA Code MSA Name0000 Not in a MSA1740 Columbia, MO3710 Joplin, MO3760 Kansas City, MO-KS7000 St. Joseph, MO7040 St. Louis, MO-IL7920 Springfield, MO
2. Monitor DataEach monitor is designed to detect a specific chemical pollutant or group ofrelated pollutants. A site may have one or many monitors and not all siteswill have the same monitors.
PollutantThe common name of the pollutant. “Criteria” pollutants are definedby statute in the Clean Air Act.
AQS Pollutant CodeEach pollutant has a specific numerical code to distinguish it fromothers. One monitor in St. Louis City uses a code of ‘00000’ becausethe monitor detects an entire group of chemicals, volitile organicpollutants, which are too numerous to list individually.
Pollutant Code Pollutant
00000 VOCs12128 Lead42101 Carbon Monoxide42242 Mercury vapor42401 Sulfur Dioxide42402 Hydrogen Sulfide42406 Sulfur Dioxide 5-min42602 Nitrogen Dioxide42604 Ammonia43502 Formaldehyde44201 Ozone45201 Benzene45202 Toluene61103 Resultant Wind Speed61104 Resultant Wind Direct62101 Outdoor Temperature62107 Indoor Temperature62201 Relative Humidity63301 Solar Radiation64101 Barometric Pressure81102 PM1084313 Black Carbon88101 PM 2.5 FRM88500 PM 2.5 Tot Atmospheric88501 PM 2.5 Raw Data88502 PM 2.5 AQI/Speciation88503 PM 2.5 reference
POCThe Position Occurance Code distinguishes between differentmonitors for the same pollutant, most often collocated monitors usedfor precision and quality assurance. For PM2.5, different POCs areassigned to FRM, collocated FRM, continuous, and speciationmonitors.
CollocatedCollocated monitors are used for precision and quality assuranceactivities, and for redundancy for critical pollutants such as ozone.

Sampling FrequencySampling frequency varies for each pollutant, depending on the natureof the NAAQS standard and the technology used in the monitoringmethod. Most gaseous pollutants use continuous monitors and areaveraged over one hour. Particulate pollutants are mostly filter-basedand averaged over one day.
Scale of RepresentationEach monitor is intended to represent an area with similar pollutantconcentration. The scales range from only a few meters to manykilometers.
MIC Microscale - defines the concentration in air volumes associatedwith area dimensions ranging from several meters up to about 100 meters.MID Middle - defines the concentration typical of areas up to severalcity blocks in size with dimensions ranging from about 100 meters to 0.5kilometers.NBR Neighborhood - defines concentrations within an extended area ofa city that has relatively uniform land use with dimensions in the 0.5 to 4.0kilometers.URB Urban - defines an overall citywide condition with dimensions onthe order of 4 to 50 kilometers.REG Regional - defines air quality levels over areas having dimensionsof 50 to hundreds of kilometers.
Monitoring ObjectiveEach monitor has a distinct objective such as providing real-time datafor public awareness or use in determining compliance withregulations.
ObjectiveCode ObjectiveAQI Public InformationCOM NAAQS ComplianceMET Meterological DataRES ResearchSTA State Standard
UnitsThe physical terms used to quantify the pollutant concentration, suchas parts per million or micrograms per cubic meter.
Unit Code Unit Description001 µg/m3
007 parts per million008 parts per billion012 miles per hour013 knots014 degree, compass015 degree Fahrenheit017 degree Celcius018 Langleys019 percent humidity022 inches Mercury025 Langleys per minute105 µg/m3 LC121 parts per tillion
Monitoring/Analytical MethodEach monitor relies on a scientific principle to detemine the polltantconcentration, which is described by the sampling method. Eachmethod code is specific for a particular pollutant, therefore a threenumeral code may be used for different methods for differentpollutants.
PM2.5 Standards
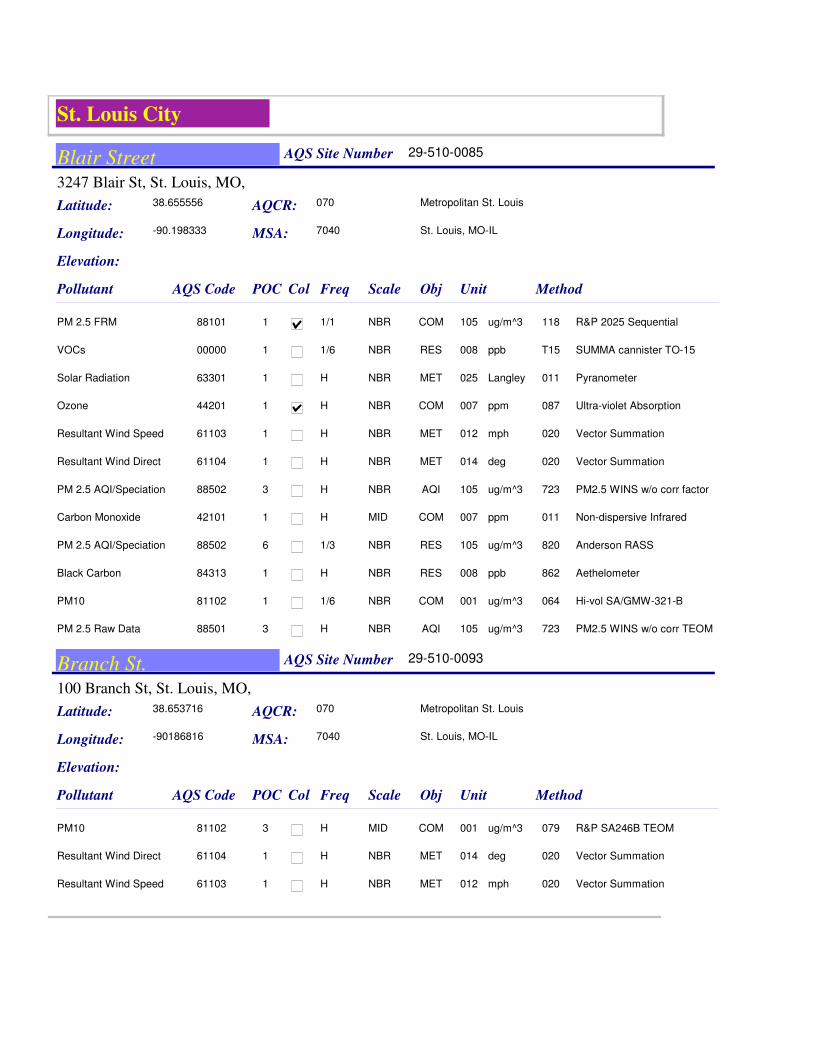
All sites are eligible for comparison to the annual standard except theBranch Street site. This middle-scale site is eligible only for comparison tothe 24-hour standard.
Proposed Changes to Network
Missouri’s ambient air network has been modified extensively in recentyears in anticipation of adapting to the new National Ambient AirMonitoring Strategy. Many NO2, SO2, and CO monitors have beenremoved, many PM2.5 FRM samplers replaced by continuous PM2.5
samplers, and sites identified for future NCore sites. Minimal changes to thenetwork are described here. In the future, a network assessment willevaluate further changes.
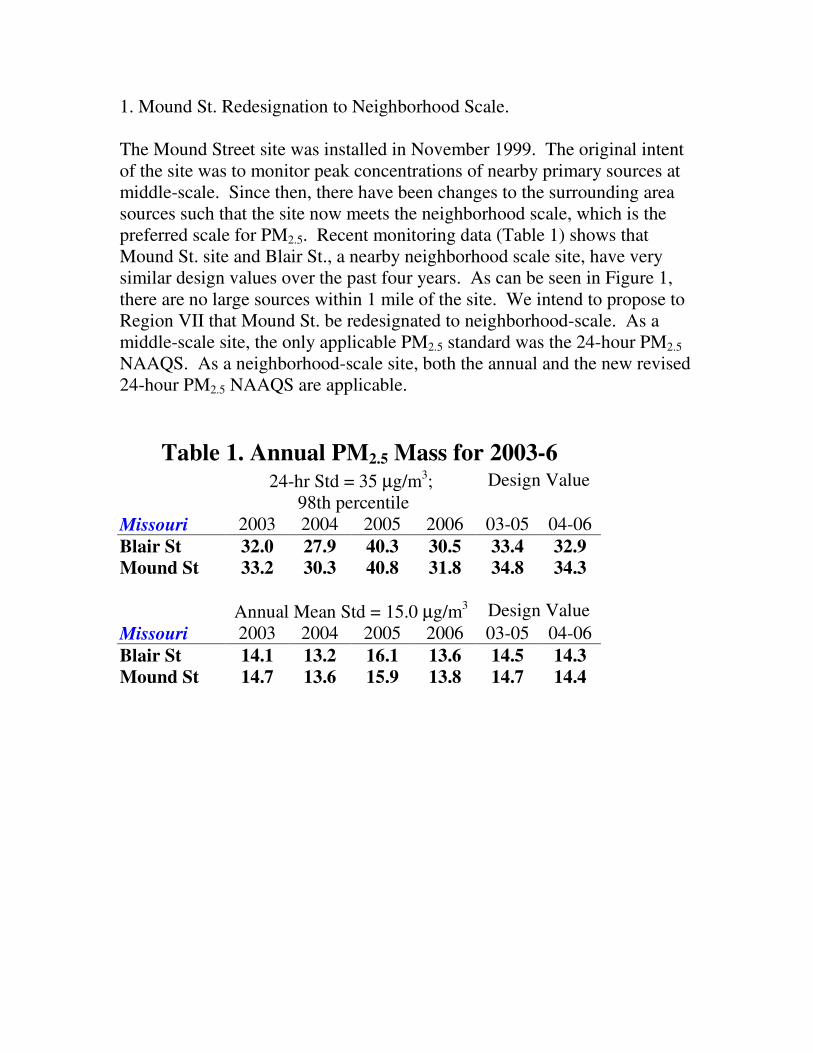
1. Mound St. Redesignation to Neighborhood Scale.
The Mound Street site was installed in November 1999. The original intentof the site was to monitor peak concentrations of nearby primary sources atmiddle-scale. Since then, there have been changes to the surrounding areasources such that the site now meets the neighborhood scale, which is thepreferred scale for PM2.5. Recent monitoring data (Table 1) shows thatMound St. site and Blair St., a nearby neighborhood scale site, have verysimilar design values over the past four years. As can be seen in Figure 1,there are no large sources within 1 mile of the site. We intend to propose toRegion VII that Mound St. be redesignated to neighborhood-scale. As amiddle-scale site, the only applicable PM2.5 standard was the 24-hour PM2.5
NAAQS. As a neighborhood-scale site, both the annual and the new revised24-hour PM2.5 NAAQS are applicable.
Table 1. Annual PM2.5 Mass for 2003-624-hr Std = 35 µg/m3;
98th percentileDesign Value
Missouri 2003 2004 2005 2006 03-05 04-06Blair St 32.0 27.9 40.3 30.5 33.4 32.9Mound St 33.2 30.3 40.8 31.8 34.8 34.3
Annual Mean Std = 15.0 µg/m3 Design ValueMissouri 2003 2004 2005 2006 03-05 04-06Blair St 14.1 13.2 16.1 13.6 14.5 14.3Mound St 14.7 13.6 15.9 13.8 14.7 14.4
Figure 1
2. Ferguson PM10 Monitoring Site Relocation
The current PM10 network of the St. Louis area meets the new minimumrequirement of 6 monitoring sites in an urban area with >1,000,000population and having PM10 Design Criteria that has exceeded NAAQS by20% or more.
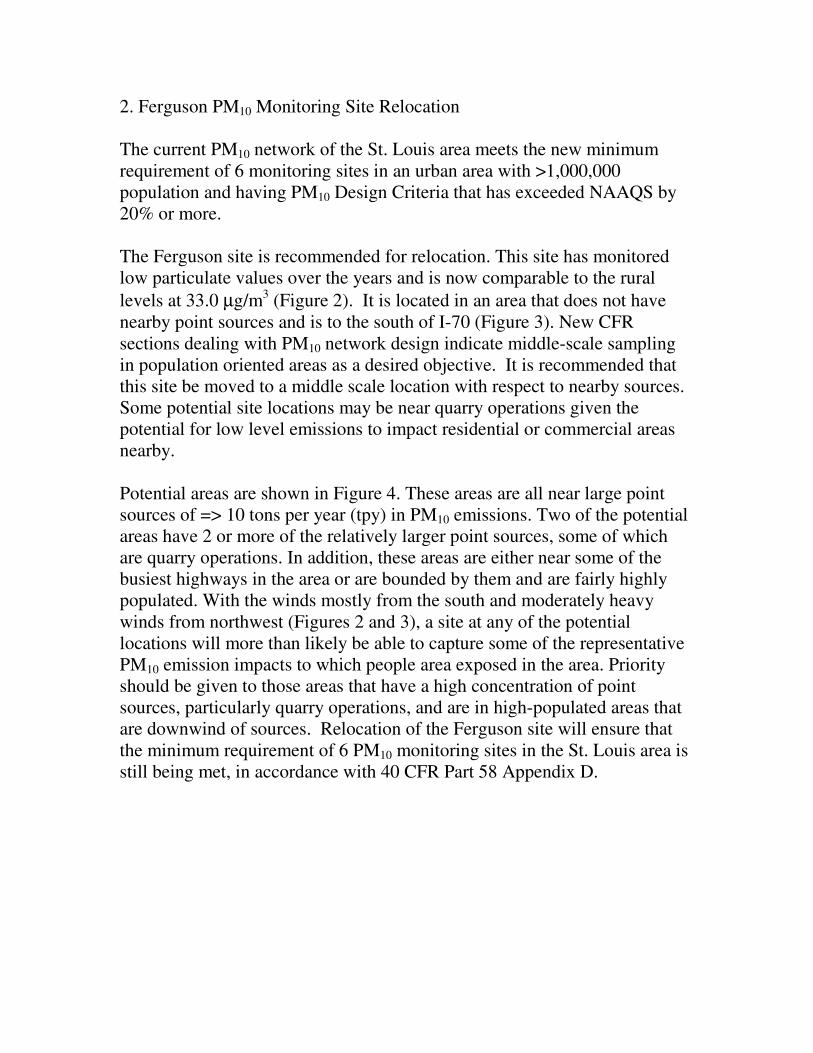
The Ferguson site is recommended for relocation. This site has monitoredlow particulate values over the years and is now comparable to the rurallevels at 33.0 µg/m3 (Figure 2). It is located in an area that does not havenearby point sources and is to the south of I-70 (Figure 3). New CFRsections dealing with PM10 network design indicate middle-scale samplingin population oriented areas as a desired objective. It is recommended thatthis site be moved to a middle scale location with respect to nearby sources.Some potential site locations may be near quarry operations given thepotential for low level emissions to impact residential or commercial areasnearby.
Potential areas are shown in Figure 4. These areas are all near large pointsources of => 10 tons per year (tpy) in PM10 emissions. Two of the potentialareas have 2 or more of the relatively larger point sources, some of whichare quarry operations. In addition, these areas are either near some of thebusiest highways in the area or are bounded by them and are fairly highlypopulated. With the winds mostly from the south and moderately heavywinds from northwest (Figures 2 and 3), a site at any of the potentiallocations will more than likely be able to capture some of the representativePM10 emission impacts to which people area exposed in the area. Priorityshould be given to those areas that have a high concentration of pointsources, particularly quarry operations, and are in high-populated areas thatare downwind of sources. Relocation of the Ferguson site will ensure thatthe minimum requirement of 6 PM10 monitoring sites in the St. Louis area isstill being met, in accordance with 40 CFR Part 58 Appendix D.
Figure 2: St. Louis (MO) Area 1st Maximum PM10 Concentration
0
50
100
150
200
250
300
350
400
450
1995 1996 1997 1998 1999 2000 2001 2002 2003 2004 2005 2006
Year
Con
cent
ratio
n (u
g/m
3)
Ferguson Mark Twain State Park (Background Conc.) Line 6 Line 7 Line 8
24-Hour Std
High Conc.
Low Conc.
Medium Conc.

2004-2005 St. Louis Wind Data AnalysisResults
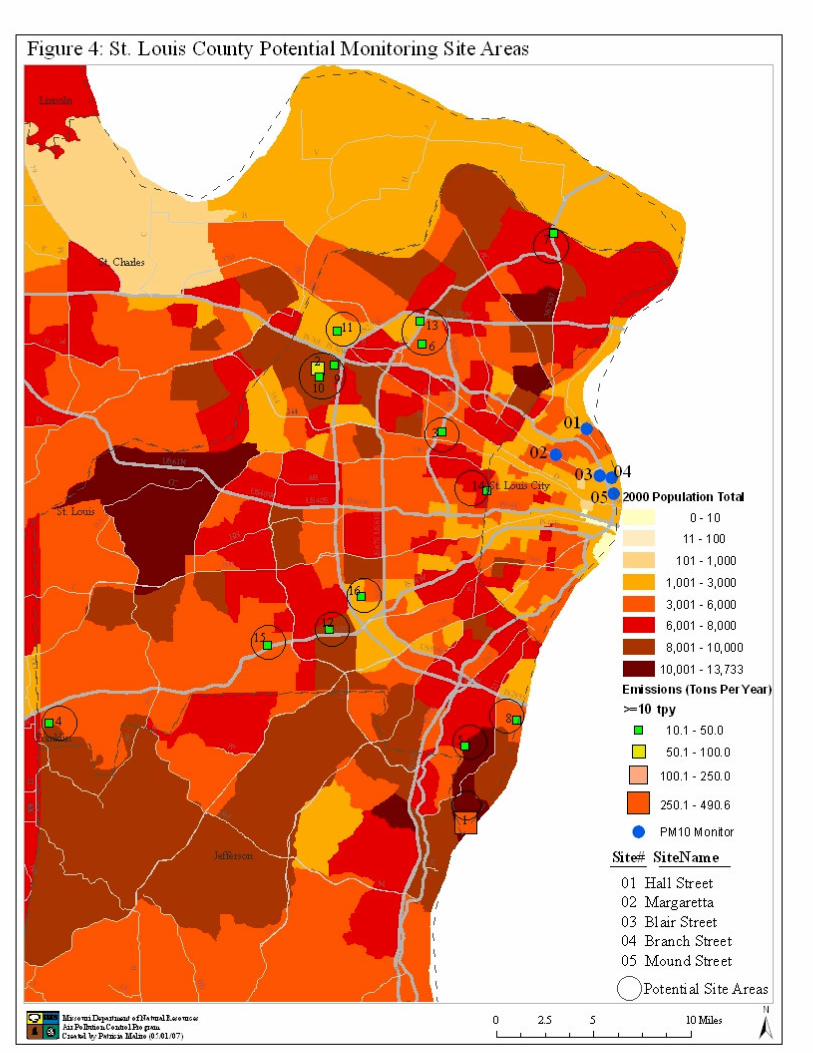
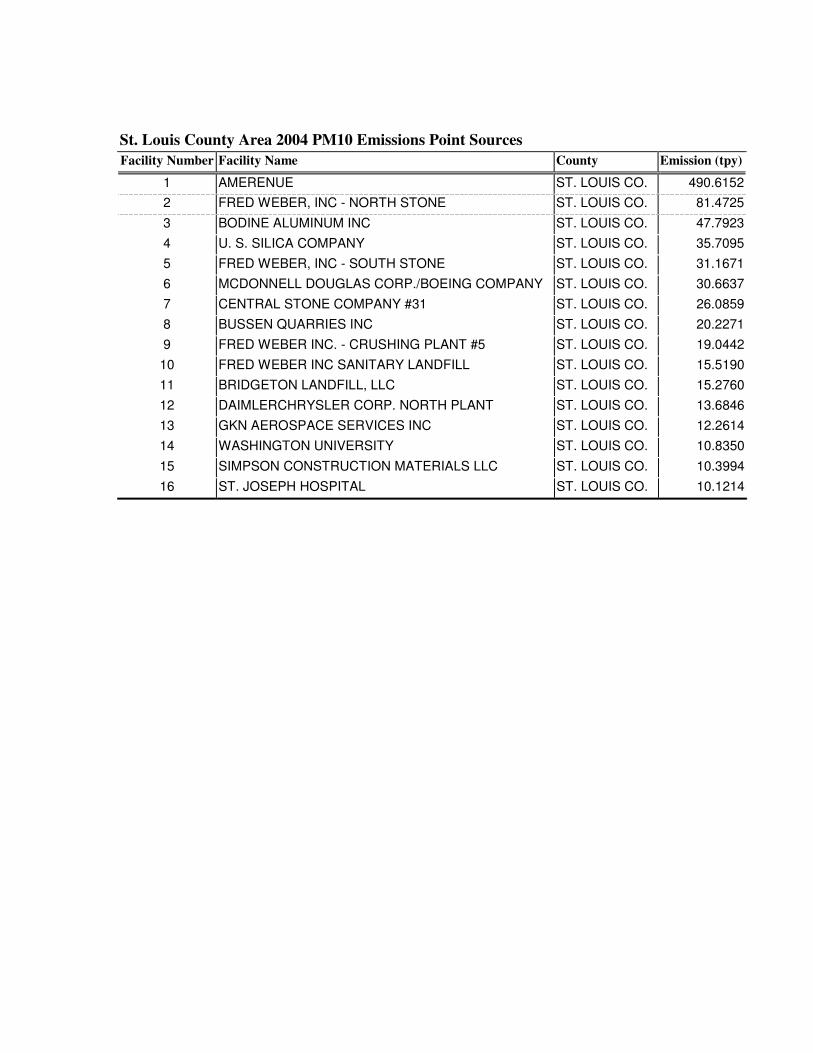
St. Louis County Area 2004 PM10 Emissions Point SourcesFacility Number Facility Name County Emission (tpy)
1 AMERENUE ST. LOUIS CO. 490.61522 FRED WEBER, INC - NORTH STONE ST. LOUIS CO. 81.47253 BODINE ALUMINUM INC ST. LOUIS CO. 47.79234 U. S. SILICA COMPANY ST. LOUIS CO. 35.70955 FRED WEBER, INC - SOUTH STONE ST. LOUIS CO. 31.16716 MCDONNELL DOUGLAS CORP./BOEING COMPANY ST. LOUIS CO. 30.66377 CENTRAL STONE COMPANY #31 ST. LOUIS CO. 26.08598 BUSSEN QUARRIES INC ST. LOUIS CO. 20.22719 FRED WEBER INC. - CRUSHING PLANT #5 ST. LOUIS CO. 19.044210 FRED WEBER INC SANITARY LANDFILL ST. LOUIS CO. 15.519011 BRIDGETON LANDFILL, LLC ST. LOUIS CO. 15.276012 DAIMLERCHRYSLER CORP. NORTH PLANT ST. LOUIS CO. 13.684613 GKN AEROSPACE SERVICES INC ST. LOUIS CO. 12.261414 WASHINGTON UNIVERSITY ST. LOUIS CO. 10.835015 SIMPSON CONSTRUCTION MATERIALS LLC ST. LOUIS CO. 10.399416 ST. JOSEPH HOSPITAL ST. LOUIS CO. 10.1214

Missouri Air Quality Monitoring Sites, 2007

This page intentionally left blank


Missouri Ambient Air Monitoring Network
MIC Microscale 1 to 100 square metersMID Middle .1 to. 5 square kilometerNBR Neighborhood .5 to 4 square kilometersREG Regional > 10 square kilometers, ruralURB Urban 4 to 50 square kilometers, city COM NAAQS ComplianceMET Meterological DataRES ResearchSTA State Standard
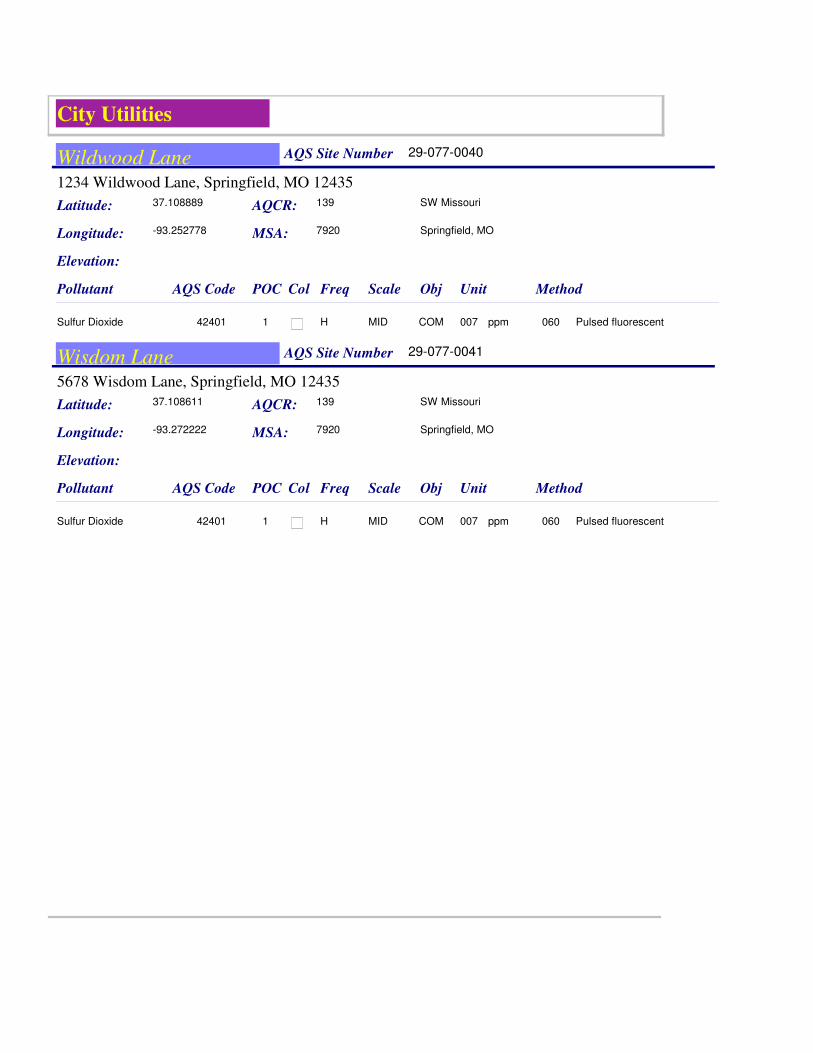
City Utilities
Wildwood Lane AQS Site Number
Latitude:
Longitude:
AQS CodePollutant POC Col MethodUnit
37.108889
-93.252778
29-077-0040
AQCR: 139 SW Missouri
Elevation:
Freq
MSA: 7920 Springfield, MO
1234 Wildwood Lane, Springfield, MO 12435
ObjScale
42401Sulfur Dioxide 0600071 ppmH Pulsed fluorescentCOMMID
Wisdom Lane AQS Site Number
Latitude:
Longitude:
AQS CodePollutant POC Col MethodUnit
37.108611
-93.272222
29-077-0041
AQCR: 139 SW Missouri
Elevation:
Freq
MSA: 7920 Springfield, MO
5678 Wisdom Lane, Springfield, MO 12435
ObjScale
42401Sulfur Dioxide 0600071 ppmH Pulsed fluorescentCOMMID
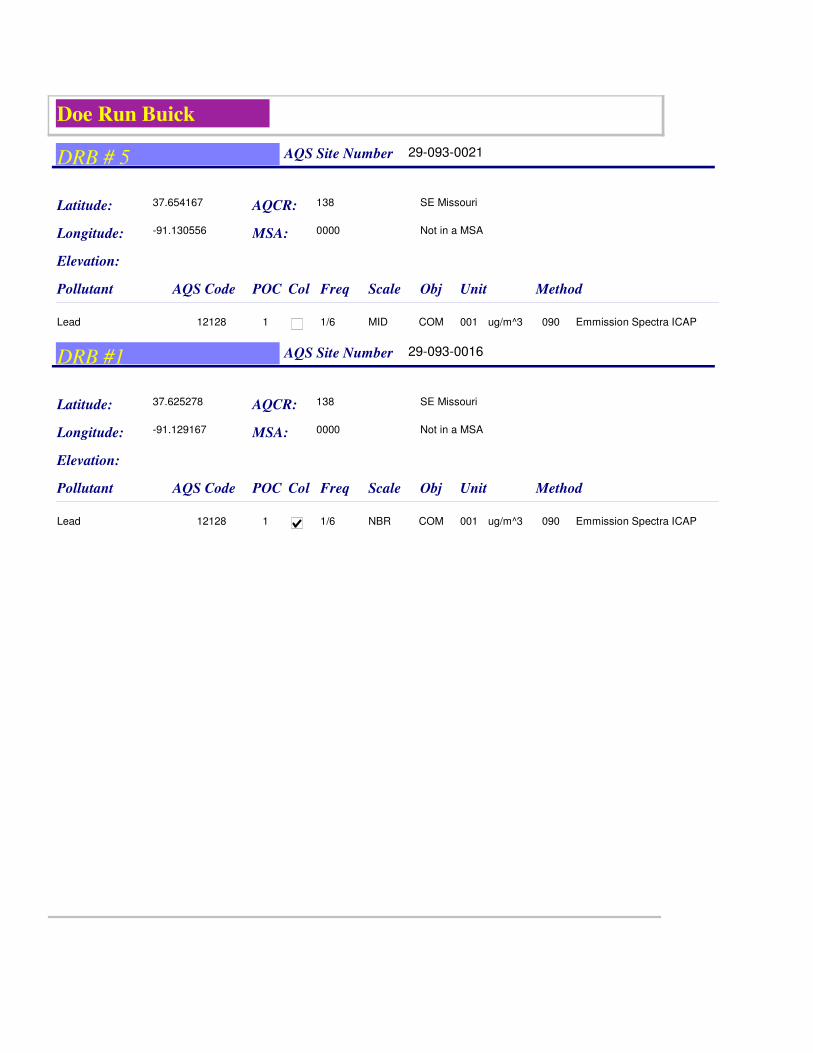
Doe Run Buick
DRB # 5 AQS Site Number
Latitude:
Longitude:
AQS CodePollutant POC Col MethodUnit
37.654167
-91.130556
29-093-0021
AQCR: 138 SE Missouri
Elevation:
Freq
MSA: 0000 Not in a MSA
ObjScale
12128Lead 0900011 ug/m^31/6 Emmission Spectra ICAPCOMMID
DRB #1 AQS Site Number
Latitude:
Longitude:
AQS CodePollutant POC Col MethodUnit
37.625278
-91.129167
29-093-0016
AQCR: 138 SE Missouri
Elevation:
Freq
MSA: 0000 Not in a MSA
ObjScale
12128Lead 0900011 ug/m^31/6 Emmission Spectra ICAPCOMNBR

Doe Run Glover
DRG - Big Creek #5 AQS Site Number
Latitude:
Longitude:
AQS CodePollutant POC Col MethodUnit
37.471667
-90.689444
29-093-0029
AQCR: 138 SE Missouri
Elevation:
Freq
MSA: 0000 Not in a MSA
ObjScale
12128Lead 0900011 ug/m^31/6 Emmission Spectra ICAPCOMNBR
DRG - Post Office #2 AQS Site Number
Latitude:
Longitude:
AQS CodePollutant POC Col MethodUnit
37.486111
-90.69
29-093-0027
AQCR: 138 SE Missouri
Elevation:
Freq
MSA: 0000 Not in a MSA
ObjScale
12128Lead 0900011 ug/m^31/6 Emmission Spectra ICAPCOMNBR
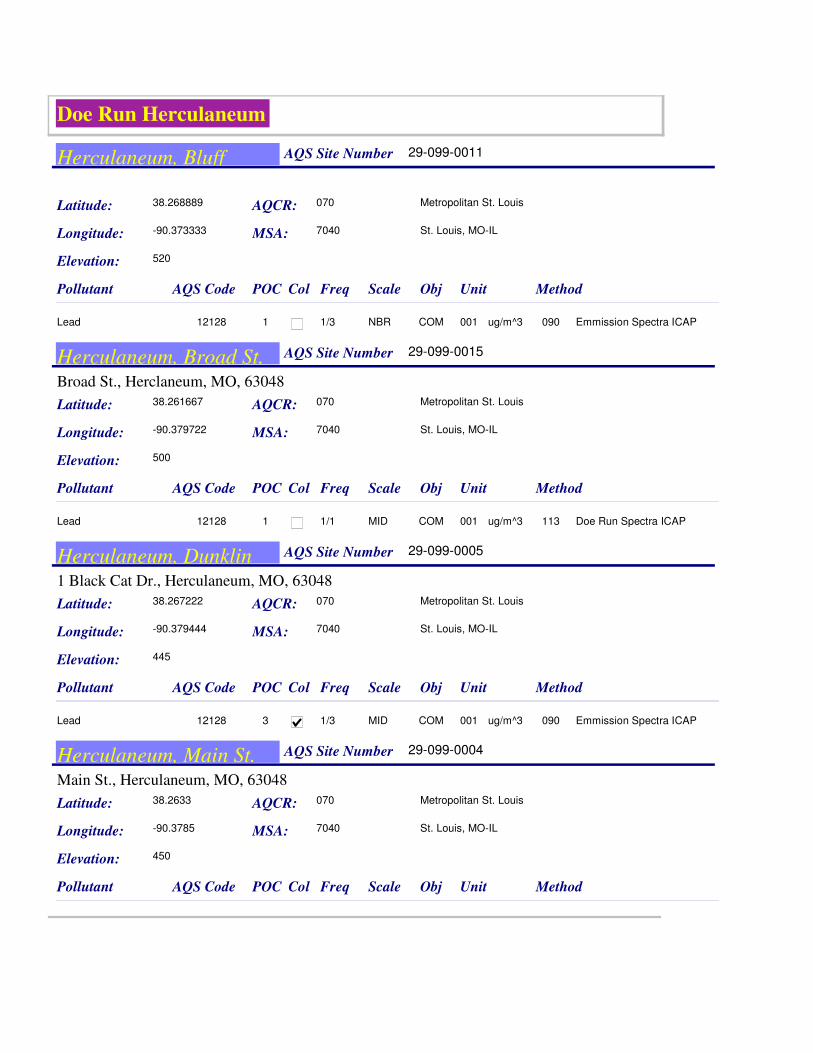
Doe Run Herculaneum
Herculaneum, Bluff AQS Site Number
Latitude:
Longitude:
AQS CodePollutant POC Col MethodUnit
38.268889
-90.373333
29-099-0011
AQCR: 070 Metropolitan St. Louis
Elevation: 520
Freq
MSA: 7040 St. Louis, MO-IL
ObjScale
12128Lead 0900011 ug/m^31/3 Emmission Spectra ICAPCOMNBR
Herculaneum, Broad St. AQS Site Number
Latitude:
Longitude:
AQS CodePollutant POC Col MethodUnit
38.261667
-90.379722
29-099-0015
AQCR: 070 Metropolitan St. Louis
Elevation: 500
Freq
MSA: 7040 St. Louis, MO-IL
Broad St., Herclaneum, MO, 63048
ObjScale
12128Lead 1130011 ug/m^31/1 Doe Run Spectra ICAPCOMMID
Herculaneum, Dunklin AQS Site Number
Latitude:
Longitude:
AQS CodePollutant POC Col MethodUnit
38.267222
-90.379444
29-099-0005
AQCR: 070 Metropolitan St. Louis
Elevation: 445
Freq
MSA: 7040 St. Louis, MO-IL
1 Black Cat Dr., Herculaneum, MO, 63048
ObjScale
12128Lead 0900013 ug/m^31/3 Emmission Spectra ICAPCOMMID
Herculaneum, Main St. AQS Site Number
Latitude:
Longitude:
AQS CodePollutant POC Col MethodUnit
38.2633
-90.3785
29-099-0004
AQCR: 070 Metropolitan St. Louis
Elevation: 450
Freq
MSA: 7040 St. Louis, MO-IL
Main St., Herculaneum, MO, 63048
ObjScale
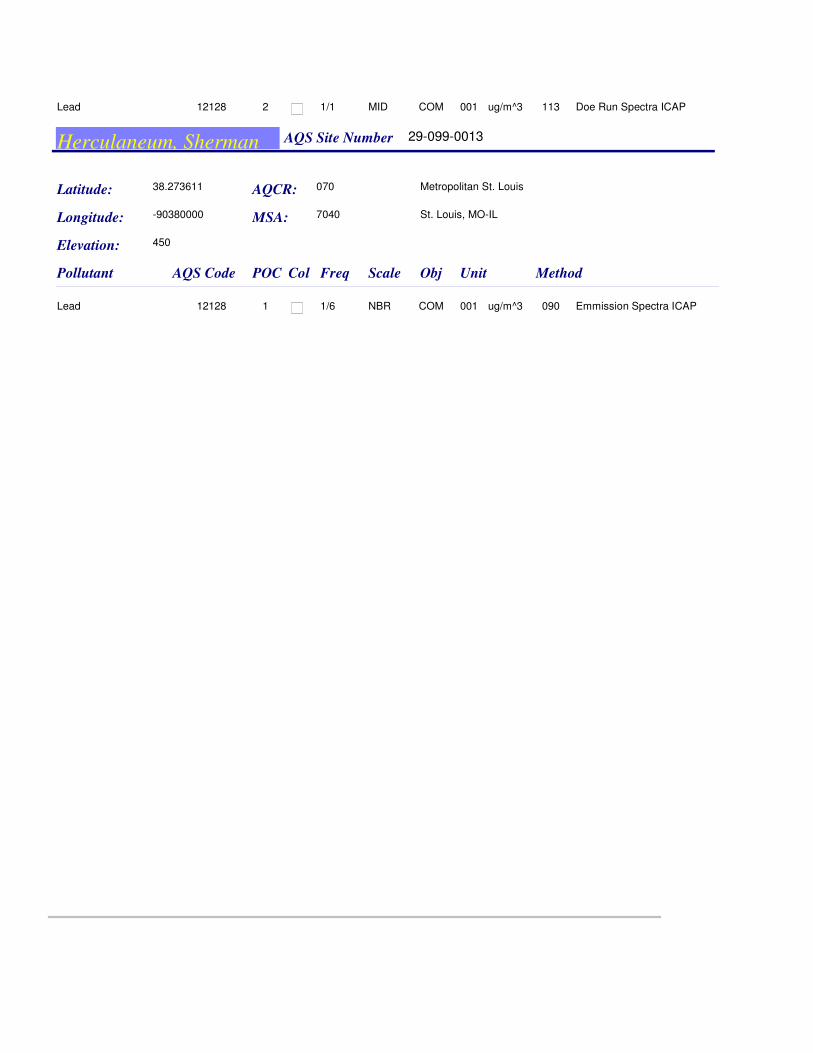
12128Lead 1130012 ug/m^31/1 Doe Run Spectra ICAPCOMMID
Herculaneum, Sherman AQS Site Number
Latitude:
Longitude:
AQS CodePollutant POC Col MethodUnit
38.273611
-90380000
29-099-0013
AQCR: 070 Metropolitan St. Louis
Elevation: 450
Freq
MSA: 7040 St. Louis, MO-IL
ObjScale
12128Lead 0900011 ug/m^31/6 Emmission Spectra ICAPCOMNBR
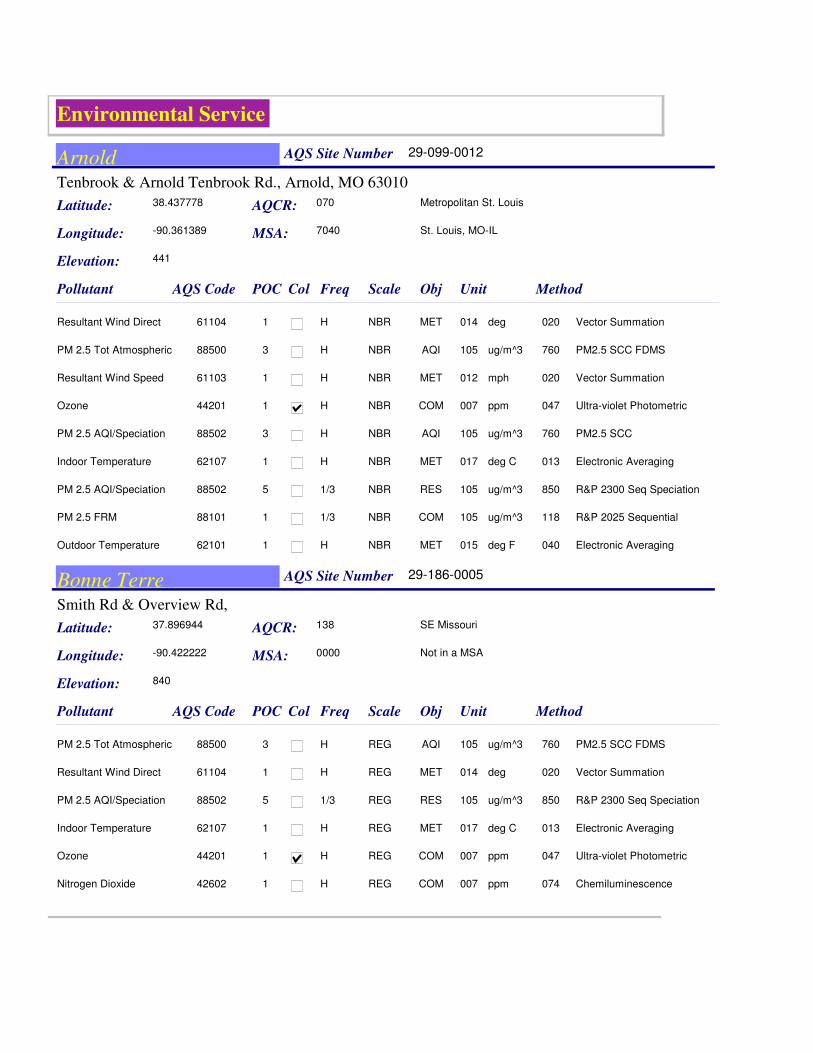
Environmental Service
Arnold AQS Site Number
Latitude:
Longitude:
AQS CodePollutant POC Col MethodUnit
38.437778
-90.361389
29-099-0012
AQCR: 070 Metropolitan St. Louis
Elevation: 441
Freq
MSA: 7040 St. Louis, MO-IL
Tenbrook & Arnold Tenbrook Rd., Arnold, MO 63010
ObjScale
61104Resultant Wind Direct 0200141 degH Vector SummationMETNBR
88500PM 2.5 Tot Atmospheric 7601053 ug/m^3 H PM2.5 SCC FDMSAQINBR
61103Resultant Wind Speed 0200121 mphH Vector SummationMETNBR
44201Ozone 0470071 ppmH Ultra-violet PhotometricCOMNBR
88502PM 2.5 AQI/Speciation 7601053 ug/m^3 H PM2.5 SCCAQINBR
62107Indoor Temperature 0130171 deg CH Electronic AveragingMETNBR
88502PM 2.5 AQI/Speciation 8501055 ug/m^3 1/3 R&P 2300 Seq SpeciationRESNBR
88101PM 2.5 FRM 1181051 ug/m^3 1/3 R&P 2025 SequentialCOMNBR
62101Outdoor Temperature 0400151 deg FH Electronic AveragingMETNBR
Bonne Terre AQS Site Number
Latitude:
Longitude:
AQS CodePollutant POC Col MethodUnit
37.896944
-90.422222
29-186-0005
AQCR: 138 SE Missouri
Elevation: 840
Freq
MSA: 0000 Not in a MSA
Smith Rd & Overview Rd,
ObjScale
88500PM 2.5 Tot Atmospheric 7601053 ug/m^3 H PM2.5 SCC FDMSAQIREG
61104Resultant Wind Direct 0200141 degH Vector SummationMETREG
88502PM 2.5 AQI/Speciation 8501055 ug/m^3 1/3 R&P 2300 Seq SpeciationRESREG
62107Indoor Temperature 0130171 deg CH Electronic AveragingMETREG
44201Ozone 0470071 ppmH Ultra-violet PhotometricCOMREG
42602Nitrogen Dioxide 0740071 ppmH ChemiluminescenceCOMREG
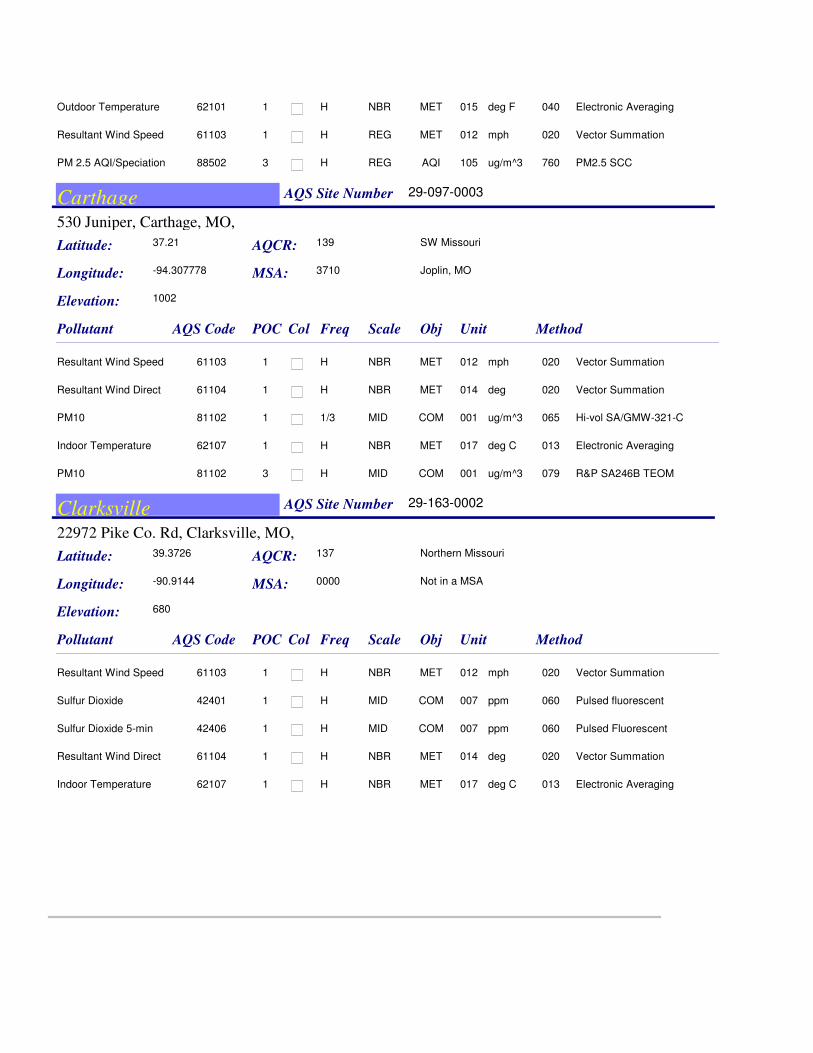
62101Outdoor Temperature 0400151 deg FH Electronic AveragingMETNBR
61103Resultant Wind Speed 0200121 mphH Vector SummationMETREG
88502PM 2.5 AQI/Speciation 7601053 ug/m^3 H PM2.5 SCCAQIREG
Carthage AQS Site Number
Latitude:
Longitude:
AQS CodePollutant POC Col MethodUnit
37.21
-94.307778
29-097-0003
AQCR: 139 SW Missouri
Elevation: 1002
Freq
MSA: 3710 Joplin, MO
530 Juniper, Carthage, MO,
ObjScale
61103Resultant Wind Speed 0200121 mphH Vector SummationMETNBR
61104Resultant Wind Direct 0200141 degH Vector SummationMETNBR
81102PM10 0650011 ug/m^31/3 Hi-vol SA/GMW-321-CCOMMID
62107Indoor Temperature 0130171 deg CH Electronic AveragingMETNBR
81102PM10 0790013 ug/m^3H R&P SA246B TEOMCOMMID
Clarksville AQS Site Number
Latitude:
Longitude:
AQS CodePollutant POC Col MethodUnit
39.3726
-90.9144
29-163-0002
AQCR: 137 Northern Missouri
Elevation: 680
Freq
MSA: 0000 Not in a MSA
22972 Pike Co. Rd, Clarksville, MO,
ObjScale
61103Resultant Wind Speed 0200121 mphH Vector SummationMETNBR
42401Sulfur Dioxide 0600071 ppmH Pulsed fluorescentCOMMID
42406Sulfur Dioxide 5-min 0600071 ppmH Pulsed FluorescentCOMMID
61104Resultant Wind Direct 0200141 degH Vector SummationMETNBR
62107Indoor Temperature 0130171 deg CH Electronic AveragingMETNBR
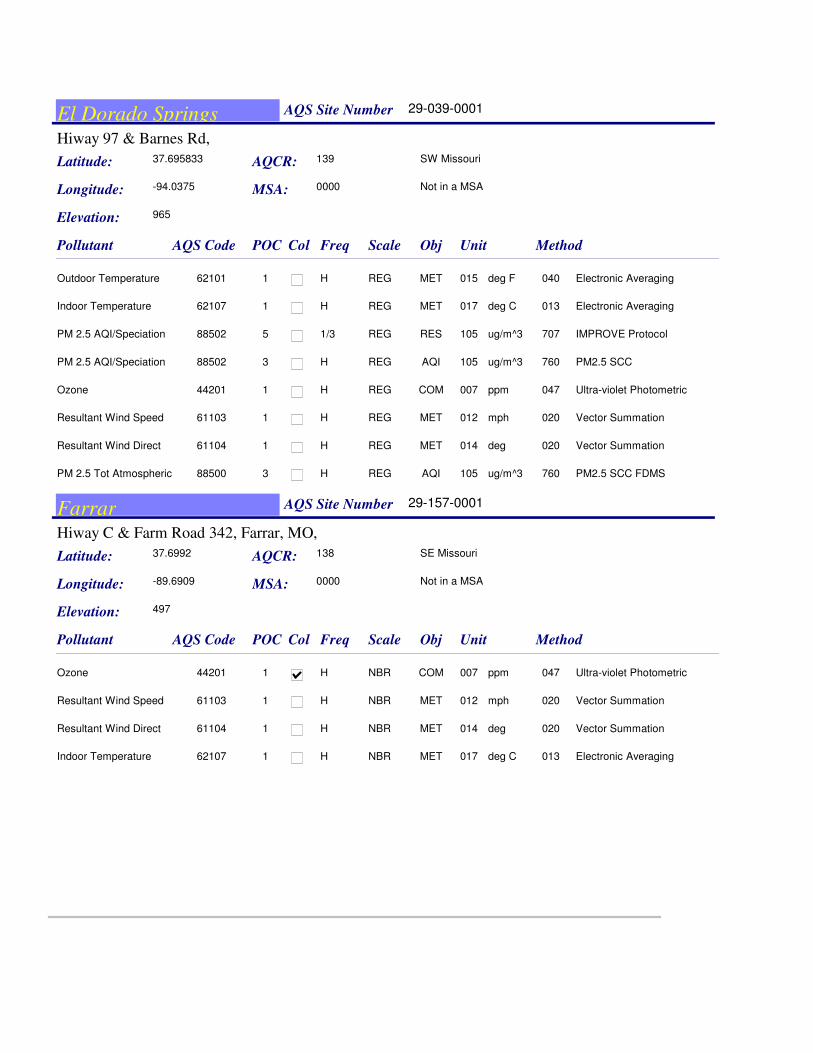
El Dorado Springs AQS Site Number
Latitude:
Longitude:
AQS CodePollutant POC Col MethodUnit
37.695833
-94.0375
29-039-0001
AQCR: 139 SW Missouri
Elevation: 965
Freq
MSA: 0000 Not in a MSA
Hiway 97 & Barnes Rd,
ObjScale
62101Outdoor Temperature 0400151 deg FH Electronic AveragingMETREG
62107Indoor Temperature 0130171 deg CH Electronic AveragingMETREG
88502PM 2.5 AQI/Speciation 7071055 ug/m^3 1/3 IMPROVE ProtocolRESREG
88502PM 2.5 AQI/Speciation 7601053 ug/m^3 H PM2.5 SCCAQIREG
44201Ozone 0470071 ppmH Ultra-violet PhotometricCOMREG
61103Resultant Wind Speed 0200121 mphH Vector SummationMETREG
61104Resultant Wind Direct 0200141 degH Vector SummationMETREG
88500PM 2.5 Tot Atmospheric 7601053 ug/m^3 H PM2.5 SCC FDMSAQIREG
Farrar AQS Site Number
Latitude:
Longitude:
AQS CodePollutant POC Col MethodUnit
37.6992
-89.6909
29-157-0001
AQCR: 138 SE Missouri
Elevation: 497
Freq
MSA: 0000 Not in a MSA
Hiway C & Farm Road 342, Farrar, MO,
ObjScale
44201Ozone 0470071 ppmH Ultra-violet PhotometricCOMNBR
61103Resultant Wind Speed 0200121 mphH Vector SummationMETNBR
61104Resultant Wind Direct 0200141 degH Vector SummationMETNBR
62107Indoor Temperature 0130171 deg CH Electronic AveragingMETNBR
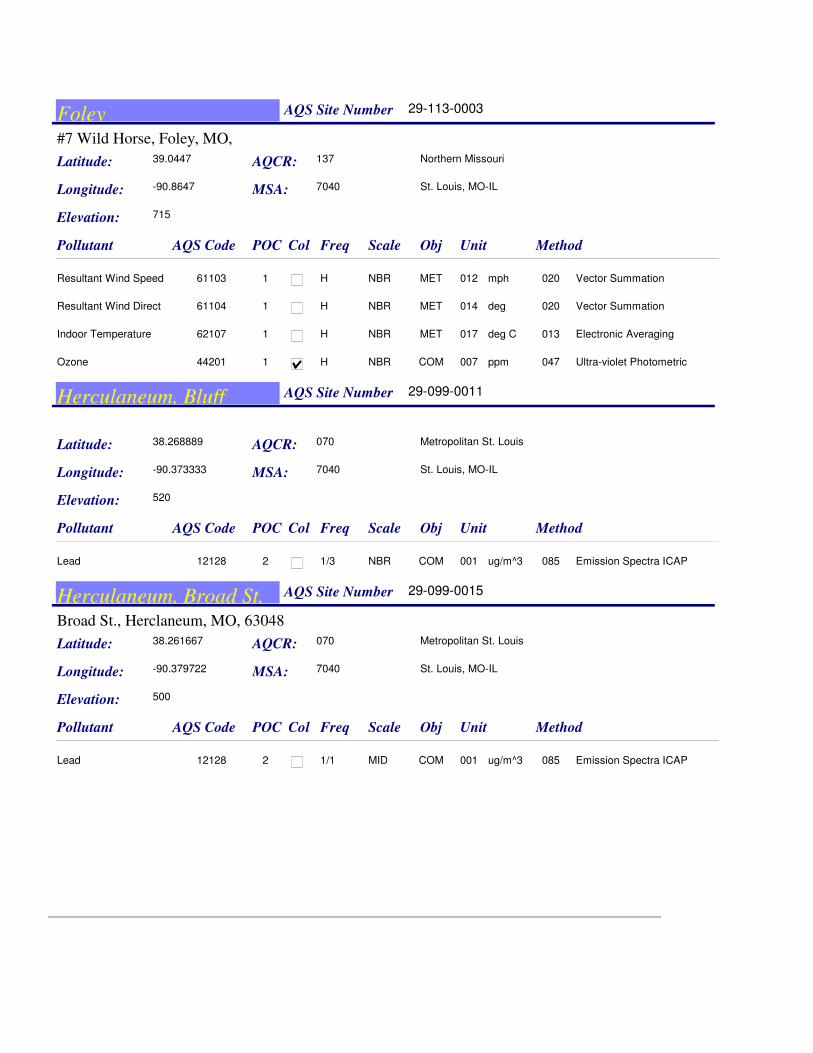
Foley AQS Site Number
Latitude:
Longitude:
AQS CodePollutant POC Col MethodUnit
39.0447
-90.8647
29-113-0003
AQCR: 137 Northern Missouri
Elevation: 715
Freq
MSA: 7040 St. Louis, MO-IL
#7 Wild Horse, Foley, MO,
ObjScale
61103Resultant Wind Speed 0200121 mphH Vector SummationMETNBR
61104Resultant Wind Direct 0200141 degH Vector SummationMETNBR
62107Indoor Temperature 0130171 deg CH Electronic AveragingMETNBR
44201Ozone 0470071 ppmH Ultra-violet PhotometricCOMNBR
Herculaneum, Bluff AQS Site Number
Latitude:
Longitude:
AQS CodePollutant POC Col MethodUnit
38.268889
-90.373333
29-099-0011
AQCR: 070 Metropolitan St. Louis
Elevation: 520
Freq
MSA: 7040 St. Louis, MO-IL
ObjScale
12128Lead 0850012 ug/m^31/3 Emission Spectra ICAPCOMNBR
Herculaneum, Broad St. AQS Site Number
Latitude:
Longitude:
AQS CodePollutant POC Col MethodUnit
38.261667
-90.379722
29-099-0015
AQCR: 070 Metropolitan St. Louis
Elevation: 500
Freq
MSA: 7040 St. Louis, MO-IL
Broad St., Herclaneum, MO, 63048
ObjScale
12128Lead 0850012 ug/m^31/1 Emission Spectra ICAPCOMMID

Herculaneum, Circle St. AQS Site Number
Latitude:
Longitude:
AQS CodePollutant POC Col MethodUnit
38.264833
-90377667
29-099-0021
AQCR: 070 Metropolitan St. Louis
Elevation:
Freq
MSA: 7040 St. Louis, MO-IL
206 Circle Street, Herculaneum, MO 63048
ObjScale
12128Lead 0850012 ug/m^31/1 Emission Spectra ICAPCOMMID
Herculaneum, Dunklin AQS Site Number
Latitude:
Longitude:
AQS CodePollutant POC Col MethodUnit
38.267222
-90.379444
29-099-0005
AQCR: 070 Metropolitan St. Louis
Elevation: 445
Freq
MSA: 7040 St. Louis, MO-IL
1 Black Cat Dr., Herculaneum, MO, 63048
ObjScale
12128Lead 0850011 ug/m^31/3 Emission Spectra ICAPCOMNBR
Herculaneum, Main St. AQS Site Number
Latitude:
Longitude:
AQS CodePollutant POC Col MethodUnit
38.2633
-90.3785
29-099-0004
AQCR: 070 Metropolitan St. Louis
Elevation: 450
Freq
MSA: 7040 St. Louis, MO-IL
Main St., Herculaneum, MO, 63048
ObjScale
62107Indoor Temperature 0130171 deg CH Electronic AveragingMETNBR
12128Lead 0850011 ug/m^31/1 Emission Spectra ICAPCOMMID
61104Resultant Wind Direct 0200141 degH Vector SummationMETNBR
61103Resultant Wind Speed 0200121 mphH Vector SummationMETNBR
62101Outdoor Temperature 0400151 deg FH Electronic AveragingMETNBR
42406Sulfur Dioxide 5-min 0600071 ppmH Pulsed FluorescentCOMMID
42401Sulfur Dioxide 0600071 ppmH Pulsed fluorescentCOMMID

Liberty AQS Site Number
Latitude:
Longitude:
AQS CodePollutant POC Col MethodUnit
39.303056
-94.376389
29-047-0005
AQCR: 094 Metropolitan Kansas City
Elevation: 930
Freq
MSA: 3760 Kansas City, MO-KS
116th, Liberty, MO,
ObjScale
62101Outdoor Temperature 0400151 deg FH Electronic AveragingMETURB
88500PM 2.5 Tot Atmospheric 7601053 ug/m^3 H PM2.5 SCC FDMSAQINBR
88502PM 2.5 AQI/Speciation 8501055 ug/m^3 1/3 R&P 2300 Seq SpeciationRESNBR
88101PM 2.5 FRM 1181051 ug/m^3 1/3 R&P 2025 SequentialCOMNBR
63301Solar Radiation 0110251 LangleyH PyranometerMETURB
61104Resultant Wind Direct 0200141 degH Vector SummationMETURB
61103Resultant Wind Speed 0200121 mphH Vector SummationMETURB
44201Ozone 0470071 ppmH Ultra-violet PhotometricCOMNBR
88502PM 2.5 AQI/Speciation 7601053 ug/m^3 H PM2.5 SCCAQINBR
62107Indoor Temperature 0130171 deg CH Electronic AveragingMETURB
42602Nitrogen Dioxide 0740071 ppmH ChemiluminescenceCOMURB
Mark Twain State Park AQS Site Number
Latitude:
Longitude:
AQS CodePollutant POC Col MethodUnit
39.473056
-91.789167
29-137-0001
AQCR: 137 Northern Missouri
Elevation: 714
Freq
MSA: 0000 Not in a MSA
Hiway V & 107, Mark Twain State Park, MO
ObjScale
44201Ozone 0470071 ppmH Ultra-violet PhotometricCOMREG
62107Indoor Temperature 0130171 deg CH Electronic AveragingMETREG
81102PM10 0650011 ug/m^31/6 Hi-vol SA/GMW-321-CCOMREG
61104Resultant Wind Direct 0200141 degH Vector SummationMETREG
42401Sulfur Dioxide 0600071 ppmH Pulsed fluorescentCOMNBR
61103Resultant Wind Speed 0200121 mphH Vector SummationMETREG
42406Sulfur Dioxide 5-min 0600071 ppmH Pulsed FluorescentCOMNBR
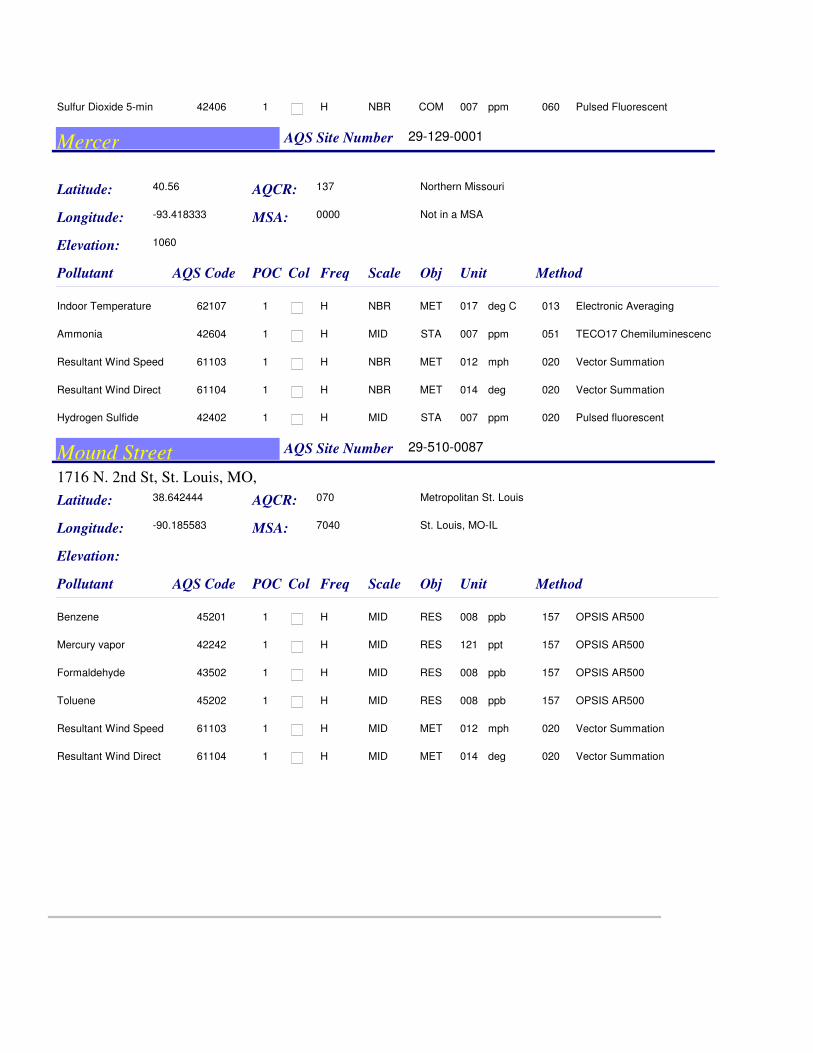
Mercer AQS Site Number
Latitude:
Longitude:
AQS CodePollutant POC Col MethodUnit
40.56
-93.418333
29-129-0001
AQCR: 137 Northern Missouri
Elevation: 1060
Freq
MSA: 0000 Not in a MSA
ObjScale
62107Indoor Temperature 0130171 deg CH Electronic AveragingMETNBR
42604Ammonia 0510071 ppmH TECO17 ChemiluminescencSTAMID
61103Resultant Wind Speed 0200121 mphH Vector SummationMETNBR
61104Resultant Wind Direct 0200141 degH Vector SummationMETNBR
42402Hydrogen Sulfide 0200071 ppmH Pulsed fluorescentSTAMID
Mound Street AQS Site Number
Latitude:
Longitude:
AQS CodePollutant POC Col MethodUnit
38.642444
-90.185583
29-510-0087
AQCR: 070 Metropolitan St. Louis
Elevation:
Freq
MSA: 7040 St. Louis, MO-IL
1716 N. 2nd St, St. Louis, MO,
ObjScale
45201Benzene 1570081 ppbH OPSIS AR500RESMID
42242Mercury vapor 1571211 pptH OPSIS AR500RESMID
43502Formaldehyde 1570081 ppbH OPSIS AR500RESMID
45202Toluene 1570081 ppbH OPSIS AR500RESMID
61103Resultant Wind Speed 0200121 mphH Vector SummationMETMID
61104Resultant Wind Direct 0200141 degH Vector SummationMETMID

Orchard Farm AQS Site Number
Latitude:
Longitude:
AQS CodePollutant POC Col MethodUnit
38.902222
-90.446944
29-183-1004
AQCR: 070 Metropolitan St. Louis
Elevation: 441
Freq
MSA: 7040 St. Louis, MO-IL
2165 Hiway V, St. Charles, MO, 63301
ObjScale
62107Indoor Temperature 0130171 deg CH Electronic AveragingMETNBR
44201Ozone 0470071 ppmH Ultra-violet PhotometricCOMURB
RG - South AQS Site Number
Latitude:
Longitude:
AQS CodePollutant POC Col MethodUnit
38.770278
-94.58
29-037-0003
AQCR: 094 Metropolitan Kansas City
Elevation: 1072
Freq
MSA: 3760 Kansas City, MO-KS
1802 E. 203rd St, Belton, MO,
ObjScale
44201Ozone 0470071 ppmH Ultra-violet PhotometricCOMNBR
61103Resultant Wind Speed 0200121 mphH Vector SummationMETURB
61104Resultant Wind Direct 0200141 degH Vector SummationMETURB
88101PM 2.5 FRM 1181051 ug/m^3 1/3 R&P 2025 SequentialCOMNBR
62107Indoor Temperature 0130171 deg CH Electronic AveragingMETURB
Rocky Creek AQS Site Number
Latitude:
Longitude:
AQS CodePollutant POC Col MethodUnit
39.3322
-94.5806
29-047-0006
AQCR: 094 Metropolitan Kansas City
Elevation: 983
Freq
MSA: 3760 Kansas City, MO-KS
13131 Hiway 169 NE, Kansas City, MO
ObjScale
61103Resultant Wind Speed 0200121 mphH Vector SummationMETURB
61104Resultant Wind Direct 0200141 degH Vector SummationMETURB
44201Ozone 0470071 ppmH Ultra-violet PhotometricCOMNBR
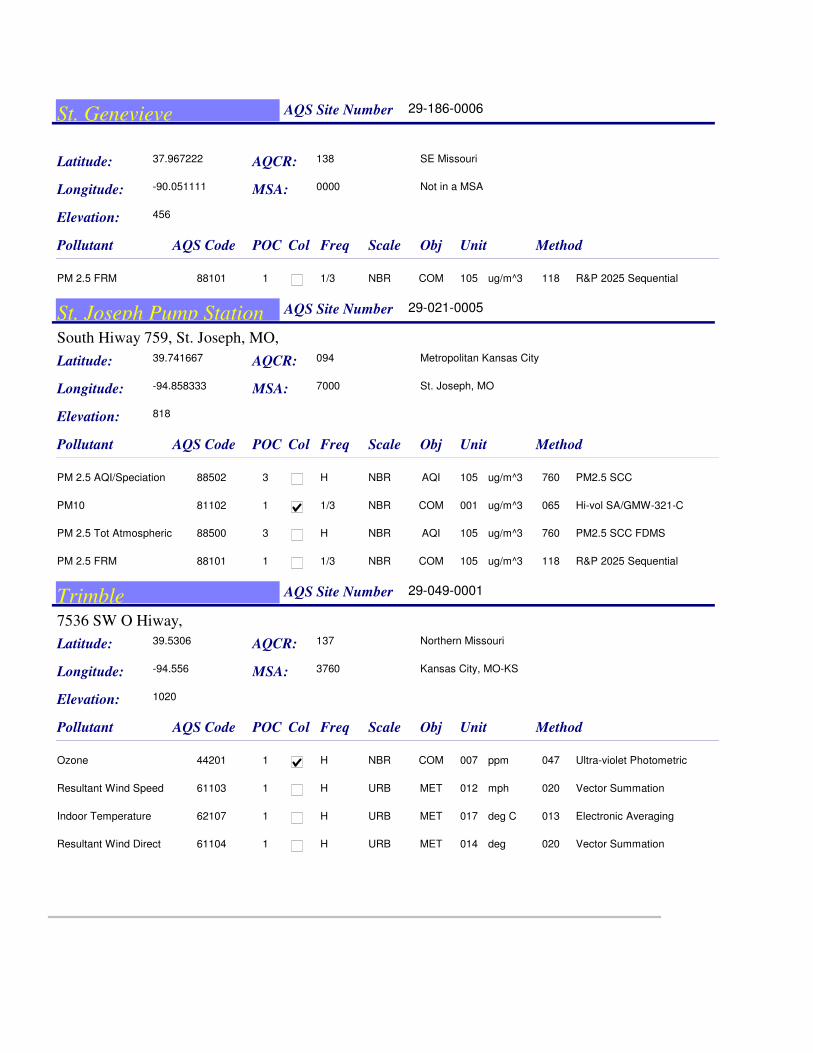
St. Genevieve AQS Site Number
Latitude:
Longitude:
AQS CodePollutant POC Col MethodUnit
37.967222
-90.051111
29-186-0006
AQCR: 138 SE Missouri
Elevation: 456
Freq
MSA: 0000 Not in a MSA
ObjScale
88101PM 2.5 FRM 1181051 ug/m^3 1/3 R&P 2025 SequentialCOMNBR
St. Joseph Pump Station AQS Site Number
Latitude:
Longitude:
AQS CodePollutant POC Col MethodUnit
39.741667
-94.858333
29-021-0005
AQCR: 094 Metropolitan Kansas City
Elevation: 818
Freq
MSA: 7000 St. Joseph, MO
South Hiway 759, St. Joseph, MO,
ObjScale
88502PM 2.5 AQI/Speciation 7601053 ug/m^3 H PM2.5 SCCAQINBR
81102PM10 0650011 ug/m^31/3 Hi-vol SA/GMW-321-CCOMNBR
88500PM 2.5 Tot Atmospheric 7601053 ug/m^3 H PM2.5 SCC FDMSAQINBR
88101PM 2.5 FRM 1181051 ug/m^3 1/3 R&P 2025 SequentialCOMNBR
Trimble AQS Site Number
Latitude:
Longitude:
AQS CodePollutant POC Col MethodUnit
39.5306
-94.556
29-049-0001
AQCR: 137 Northern Missouri
Elevation: 1020
Freq
MSA: 3760 Kansas City, MO-KS
7536 SW O Hiway,
ObjScale
44201Ozone 0470071 ppmH Ultra-violet PhotometricCOMNBR
61103Resultant Wind Speed 0200121 mphH Vector SummationMETURB
62107Indoor Temperature 0130171 deg CH Electronic AveragingMETURB
61104Resultant Wind Direct 0200141 degH Vector SummationMETURB
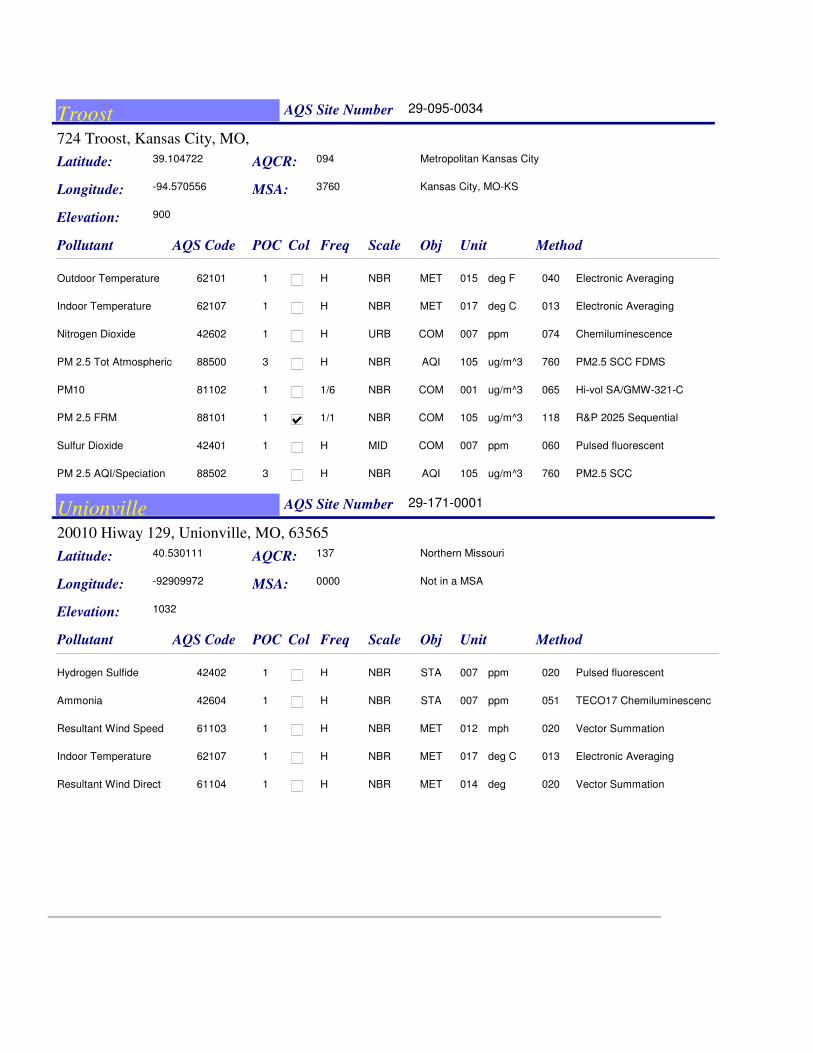
Troost AQS Site Number
Latitude:
Longitude:
AQS CodePollutant POC Col MethodUnit
39.104722
-94.570556
29-095-0034
AQCR: 094 Metropolitan Kansas City
Elevation: 900
Freq
MSA: 3760 Kansas City, MO-KS
724 Troost, Kansas City, MO,
ObjScale
62101Outdoor Temperature 0400151 deg FH Electronic AveragingMETNBR
62107Indoor Temperature 0130171 deg CH Electronic AveragingMETNBR
42602Nitrogen Dioxide 0740071 ppmH ChemiluminescenceCOMURB
88500PM 2.5 Tot Atmospheric 7601053 ug/m^3 H PM2.5 SCC FDMSAQINBR
81102PM10 0650011 ug/m^31/6 Hi-vol SA/GMW-321-CCOMNBR
88101PM 2.5 FRM 1181051 ug/m^3 1/1 R&P 2025 SequentialCOMNBR
42401Sulfur Dioxide 0600071 ppmH Pulsed fluorescentCOMMID
88502PM 2.5 AQI/Speciation 7601053 ug/m^3 H PM2.5 SCCAQINBR
Unionville AQS Site Number
Latitude:
Longitude:
AQS CodePollutant POC Col MethodUnit
40.530111
-92909972
29-171-0001
AQCR: 137 Northern Missouri
Elevation: 1032
Freq
MSA: 0000 Not in a MSA
20010 Hiway 129, Unionville, MO, 63565
ObjScale
42402Hydrogen Sulfide 0200071 ppmH Pulsed fluorescentSTANBR
42604Ammonia 0510071 ppmH TECO17 ChemiluminescencSTANBR
61103Resultant Wind Speed 0200121 mphH Vector SummationMETNBR
62107Indoor Temperature 0130171 deg CH Electronic AveragingMETNBR
61104Resultant Wind Direct 0200141 degH Vector SummationMETNBR
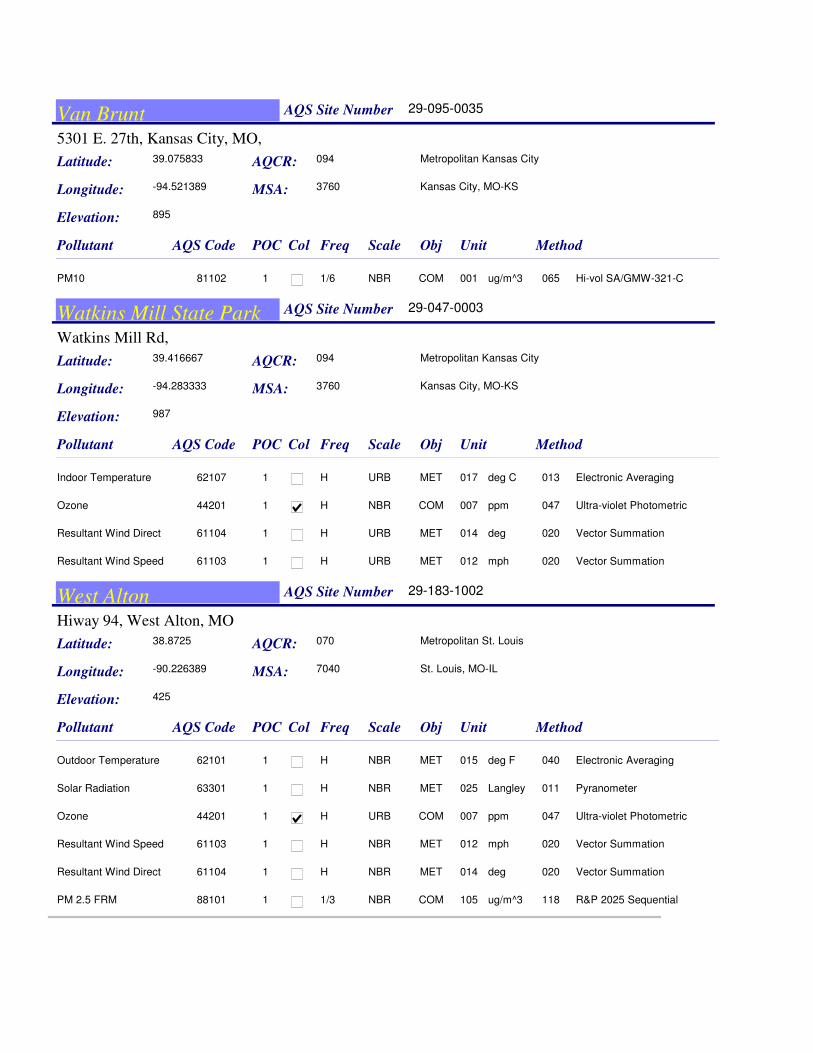
Van Brunt AQS Site Number
Latitude:
Longitude:
AQS CodePollutant POC Col MethodUnit
39.075833
-94.521389
29-095-0035
AQCR: 094 Metropolitan Kansas City
Elevation: 895
Freq
MSA: 3760 Kansas City, MO-KS
5301 E. 27th, Kansas City, MO,
ObjScale
81102PM10 0650011 ug/m^31/6 Hi-vol SA/GMW-321-CCOMNBR
Watkins Mill State Park AQS Site Number
Latitude:
Longitude:
AQS CodePollutant POC Col MethodUnit
39.416667
-94.283333
29-047-0003
AQCR: 094 Metropolitan Kansas City
Elevation: 987
Freq
MSA: 3760 Kansas City, MO-KS
Watkins Mill Rd,
ObjScale
62107Indoor Temperature 0130171 deg CH Electronic AveragingMETURB
44201Ozone 0470071 ppmH Ultra-violet PhotometricCOMNBR
61104Resultant Wind Direct 0200141 degH Vector SummationMETURB
61103Resultant Wind Speed 0200121 mphH Vector SummationMETURB
West Alton AQS Site Number
Latitude:
Longitude:
AQS CodePollutant POC Col MethodUnit
38.8725
-90.226389
29-183-1002
AQCR: 070 Metropolitan St. Louis
Elevation: 425
Freq
MSA: 7040 St. Louis, MO-IL
Hiway 94, West Alton, MO
ObjScale
62101Outdoor Temperature 0400151 deg FH Electronic AveragingMETNBR
63301Solar Radiation 0110251 LangleyH PyranometerMETNBR
44201Ozone 0470071 ppmH Ultra-violet PhotometricCOMURB
61103Resultant Wind Speed 0200121 mphH Vector SummationMETNBR
61104Resultant Wind Direct 0200141 degH Vector SummationMETNBR
88101PM 2.5 FRM 1181051 ug/m^3 1/3 R&P 2025 SequentialCOMNBR

42602Nitrogen Dioxide 0740071 ppmH ChemiluminescenceCOMURB
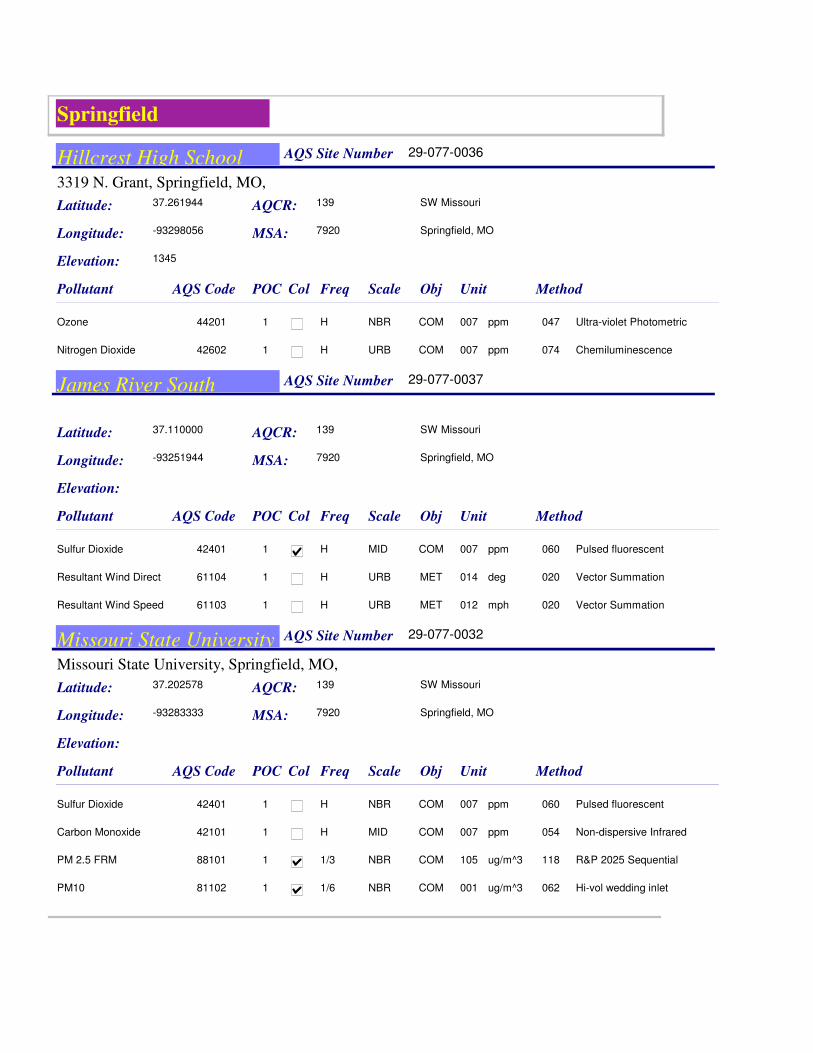
Springfield
Hillcrest High School AQS Site Number
Latitude:
Longitude:
AQS CodePollutant POC Col MethodUnit
37.261944
-93298056
29-077-0036
AQCR: 139 SW Missouri
Elevation: 1345
Freq
MSA: 7920 Springfield, MO
3319 N. Grant, Springfield, MO,
ObjScale
44201Ozone 0470071 ppmH Ultra-violet PhotometricCOMNBR
42602Nitrogen Dioxide 0740071 ppmH ChemiluminescenceCOMURB
James River South AQS Site Number
Latitude:
Longitude:
AQS CodePollutant POC Col MethodUnit
37.110000
-93251944
29-077-0037
AQCR: 139 SW Missouri
Elevation:
Freq
MSA: 7920 Springfield, MO
ObjScale
42401Sulfur Dioxide 0600071 ppmH Pulsed fluorescentCOMMID
61104Resultant Wind Direct 0200141 degH Vector SummationMETURB
61103Resultant Wind Speed 0200121 mphH Vector SummationMETURB
Missouri State University AQS Site Number
Latitude:
Longitude:
AQS CodePollutant POC Col MethodUnit
37.202578
-93283333
29-077-0032
AQCR: 139 SW Missouri
Elevation:
Freq
MSA: 7920 Springfield, MO
Missouri State University, Springfield, MO,
ObjScale
42401Sulfur Dioxide 0600071 ppmH Pulsed fluorescentCOMNBR
42101Carbon Monoxide 0540071 ppmH Non-dispersive InfraredCOMMID
88101PM 2.5 FRM 1181051 ug/m^3 1/3 R&P 2025 SequentialCOMNBR
81102PM10 0620011 ug/m^31/6 Hi-vol wedding inletCOMNBR
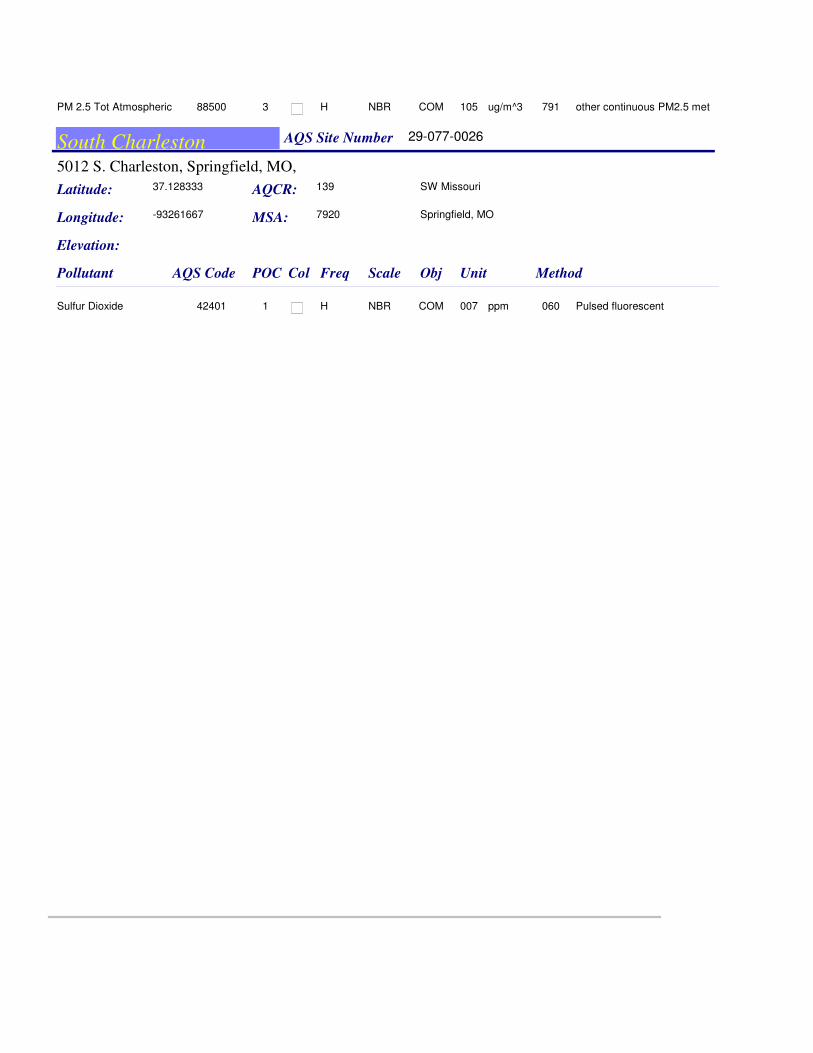
88500PM 2.5 Tot Atmospheric 7911053 ug/m^3 H other continuous PM2.5 metCOMNBR
South Charleston AQS Site Number
Latitude:
Longitude:
AQS CodePollutant POC Col MethodUnit
37.128333
-93261667
29-077-0026
AQCR: 139 SW Missouri
Elevation:
Freq
MSA: 7920 Springfield, MO
5012 S. Charleston, Springfield, MO,
ObjScale
42401Sulfur Dioxide 0600071 ppmH Pulsed fluorescentCOMNBR
St. Louis City
Blair Street AQS Site Number
Latitude:
Longitude:
AQS CodePollutant POC Col MethodUnit
38.655556
-90.198333
29-510-0085
AQCR: 070 Metropolitan St. Louis
Elevation:
Freq
MSA: 7040 St. Louis, MO-IL
3247 Blair St, St. Louis, MO,
ObjScale
88101PM 2.5 FRM 1181051 ug/m^3 1/1 R&P 2025 SequentialCOMNBR
00000VOCs T150081 ppb1/6 SUMMA cannister TO-15RESNBR
63301Solar Radiation 0110251 LangleyH PyranometerMETNBR
44201Ozone 0870071 ppmH Ultra-violet AbsorptionCOMNBR
61103Resultant Wind Speed 0200121 mphH Vector SummationMETNBR
61104Resultant Wind Direct 0200141 degH Vector SummationMETNBR
88502PM 2.5 AQI/Speciation 7231053 ug/m^3 H PM2.5 WINS w/o corr factorAQINBR
42101Carbon Monoxide 0110071 ppmH Non-dispersive InfraredCOMMID
88502PM 2.5 AQI/Speciation 8201056 ug/m^3 1/3 Anderson RASSRESNBR
84313Black Carbon 8620081 ppbH AethelometerRESNBR
81102PM10 0640011 ug/m^31/6 Hi-vol SA/GMW-321-BCOMNBR
88501PM 2.5 Raw Data 7231053 ug/m^3 H PM2.5 WINS w/o corr TEOMAQINBR
Branch St. AQS Site Number
Latitude:
Longitude:
AQS CodePollutant POC Col MethodUnit
38.653716
-90186816
29-510-0093
AQCR: 070 Metropolitan St. Louis
Elevation:
Freq
MSA: 7040 St. Louis, MO-IL
100 Branch St, St. Louis, MO,
ObjScale
81102PM10 0790013 ug/m^3H R&P SA246B TEOMCOMMID
61104Resultant Wind Direct 0200141 degH Vector SummationMETNBR
61103Resultant Wind Speed 0200121 mphH Vector SummationMETNBR

88101PM 2.5 FRM 1181051 ug/m^3 1/3 R&P 2025 SequentialCOMNBR
Hall Street AQS Site Number
Latitude:
Longitude:
AQS CodePollutant POC Col MethodUnit
38.69075
-90.209306
29-510-0088
AQCR: 070 Metropolitan St. Louis
Elevation:
Freq
MSA: 7040 St. Louis, MO-IL
6204 Hall St., St. Louis, MO,
ObjScale
81102PM10 0810011 ug/m^3H Beta attenuationCOMMID
Margaretta AQS Site Number
Latitude:
Longitude:
AQS CodePollutant POC Col MethodUnit
38.672222
-90.238889
29-510-0086
AQCR: 070 Metropolitan St. Louis
Elevation:
Freq
MSA: 7040 St. Louis, MO-IL
4520 Margaretta, St. Louis, MO,
ObjScale
61104Resultant Wind Direct 0200141 degH Vector SummationMETNBR
81102PM10 0640011 ug/m^31/6 Hi-vol SA/GMW-321-BCOMNBR
42401Sulfur Dioxide 0390071 ppmH Ultra-violet stimulatedCOMNBR
61103Resultant Wind Speed 0200121 mphH Vector SummationMETNBR
42602Nitrogen Dioxide 0740071 ppmH ChemiluminescenceCOMURB
44201Ozone 0870071 ppmH Ultra-violet AbsorptionCOMNBR
42101Carbon Monoxide 0110071 ppmH Non-dispersive InfraredCOMMID
Mound Street AQS Site Number
Latitude:
Longitude:
AQS CodePollutant POC Col MethodUnit
38.642444
-90.185583
29-510-0087
AQCR: 070 Metropolitan St. Louis
Elevation:
Freq
MSA: 7040 St. Louis, MO-IL
1716 N. 2nd St, St. Louis, MO,
ObjScale
88101PM 2.5 FRM 1181051 ug/m^3 1/3 R&P 2025 SequentialCOMMID
81102PM10 0640011 ug/m^31/6 Hi-vol SA/GMW-321-BCOMMID
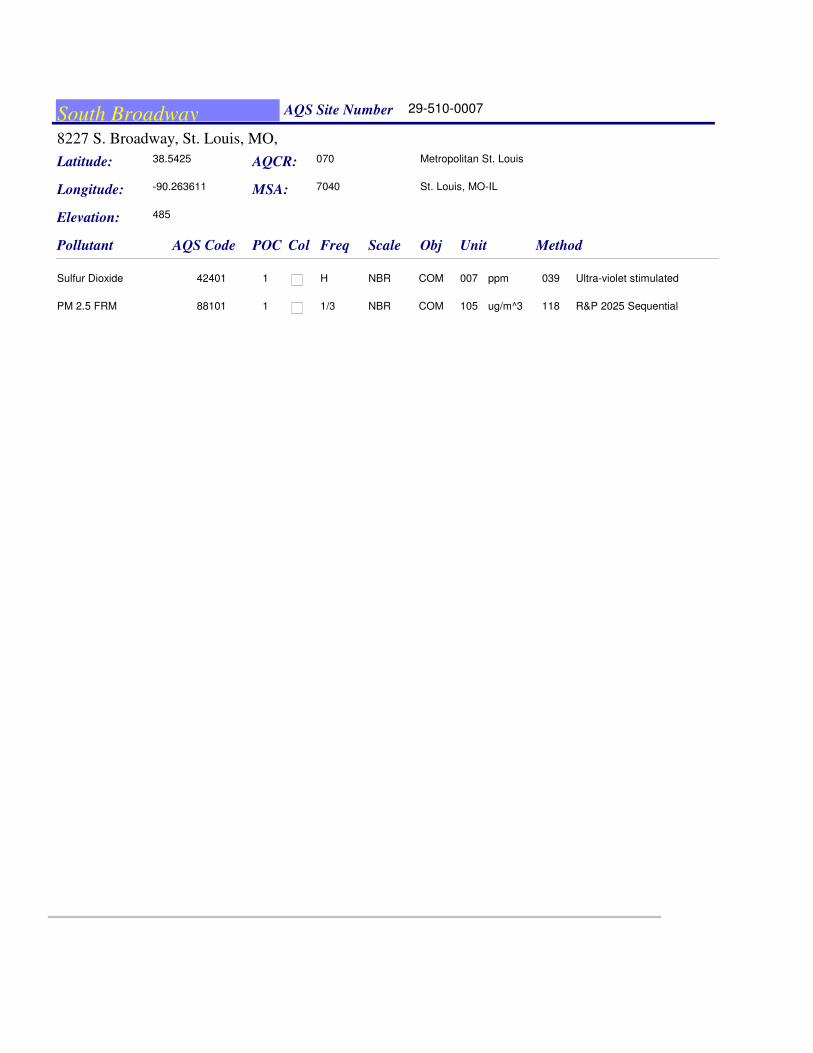
South Broadway AQS Site Number
Latitude:
Longitude:
AQS CodePollutant POC Col MethodUnit
38.5425
-90.263611
29-510-0007
AQCR: 070 Metropolitan St. Louis
Elevation: 485
Freq
MSA: 7040 St. Louis, MO-IL
8227 S. Broadway, St. Louis, MO,
ObjScale
42401Sulfur Dioxide 0390071 ppmH Ultra-violet stimulatedCOMNBR
88101PM 2.5 FRM 1181051 ug/m^3 1/3 R&P 2025 SequentialCOMNBR

St. Louis County
Clayton Animal Shelter AQS Site Number
Latitude:
Longitude:
AQS CodePollutant POC Col MethodUnit
38.649722
-90.350556
29-189-2003
AQCR: 070 Metropolitan St. Louis
Elevation: 528
Freq
MSA: 7040 St. Louis, MO-IL
77 Hunter Ave, Clayton, MO,
ObjScale
88101PM 2.5 FRM 1181051 ug/m^3 1/3 R&P 2025 SequentialCOMNBR
12128Lead 8030011 ug/m^31/6 Atomic AbsorptionCOMNBR
Ferguson AQS Site Number
Latitude:
Longitude:
AQS CodePollutant POC Col MethodUnit
38.766111
-90.285833
29-189-5001
AQCR: 070 Metropolitan St. Louis
Elevation: 551
Freq
MSA: 7040 St. Louis, MO-IL
3400 Pershall Rd, Ferguson, MO,
ObjScale
81102PM10 0620011 ug/m^31/6 Hi-vol wedding inletCOMNBR
Ladue AQS Site Number
Latitude:
Longitude:
AQS CodePollutant POC Col MethodUnit
38.641389
-90.345833
29-189-3001
AQCR: 070 Metropolitan St. Louis
Elevation: 528
Freq
MSA: 7040 St. Louis, MO-IL
55 Hunter Ave, Clayton, MO,
ObjScale
88502PM 2.5 AQI/Speciation 7601053 ug/m^3 H PM2.5 SCCAQINBR
88500PM 2.5 Tot Atmospheric 7601053 ug/m^3 H PM2.5 SCC FDMSAQINBR
62101Outdoor Temperature 0400151 deg FH Electronic AveragingMETNBR
61104Resultant Wind Direct 0200141 degH Vector SummationMETNBR
61103Resultant Wind Speed 0200121 mphH Vector SummationMETNBR
42602Nitrogen Dioxide 0740071 ppmH ChemiluminescenceCOMURB

42401Sulfur Dioxide 0390071 ppmH Ultra-violet stimulatedCOMNBR
Maryland Heights AQS Site Number
Latitude:
Longitude:
AQS CodePollutant POC Col MethodUnit
38.7109
-90.4759
29-189-0014
AQCR: 070 Metropolitan St. Louis
Elevation: 633
Freq
MSA: 7040 St. Louis, MO-IL
13044 Marine Ave, Maryland Hts, MO,
ObjScale
62101Outdoor Temperature 0400151 deg FH Electronic AveragingMETNBR
44201Ozone 0870071 ppmH Ultra-violet AbsorptionCOMNBR
42602Nitrogen Dioxide 0740071 ppmH ChemiluminescenceCOMURB
42401Sulfur Dioxide 0390071 ppmH Ultra-violet stimulatedCOMNBR
61104Resultant Wind Direct 0200141 degH Vector SummationMETNBR
61103Resultant Wind Speed 0200121 mphH Vector SummationMETNBR
Pacific AQS Site Number
Latitude:
Longitude:
AQS CodePollutant POC Col MethodUnit
38.4902
-90.7052
29-189-0005
AQCR: 070 Metropolitan St. Louis
Elevation: 524
Freq
MSA: 7040 St. Louis, MO-IL
18701 Old Hiway 66, Pacific, MO,
ObjScale
61103Resultant Wind Speed 0200121 mphH Vector SummationMETNBR
61104Resultant Wind Direct 0200141 degH Vector SummationMETNBR
44201Ozone 0870071 ppmH Ultra-violet AbsorptionCOMNBR
Sunset Hills AQS Site Number
Latitude:
Longitude:
AQS CodePollutant POC Col MethodUnit
38.5325
-90.382778
29-189-0004
AQCR: 070 Metropolitan St. Louis
Elevation: 600
Freq
MSA: 7040 St. Louis, MO-IL
4580 S. Lindbergh, Sunset Hills, MO,
ObjScale
88101PM 2.5 FRM 1181051 ug/m^3 1/3 R&P 2025 SequentialCOMNBR

42101Carbon Monoxide 0110071 ppmH Non-dispersive InfraredCOMMID
42401Sulfur Dioxide 0390071 ppmH Ultra-violet stimulatedCOMNBR
42602Nitrogen Dioxide 0740071 ppmH ChemiluminescenceCOMURB
44201Ozone 0870071 ppmH Ultra-violet AbsorptionCOMNBR
61103Resultant Wind Speed 0200121 mphH Vector SummationMETNBR
61104Resultant Wind Direct 0200141 degH Vector SummationMETNBR
62101Outdoor Temperature 0400151 deg FH Electronic AveragingMETNBR

![wl I MISSOURI€¦ · ~[§] wl MISSOURI fil I DEPARTMENT oF l_gJ t:J:) NATURAL RESOURCES Air Pollution Control Program PART 70 PERMIT TO OPERATE Under the authority of RSMo 643 and](https://static.fdocuments.in/doc/165x107/5f3c093a0447414e8c3b1b19/wl-i-missouri-wl-missouri-fil-i-department-of-lgj-tj-natural-resources.jpg)