REINZ PKW HONDA - VICTOR · PDF filehonda a mls mls mls mls, honda a mls mls mls

2019 MISSOULA HOUSING REPORT
Released March 2019A community service provided by
the Missoula Organization of REALTORS®
current knowledge, common wisdom: growing a missoula to treasure
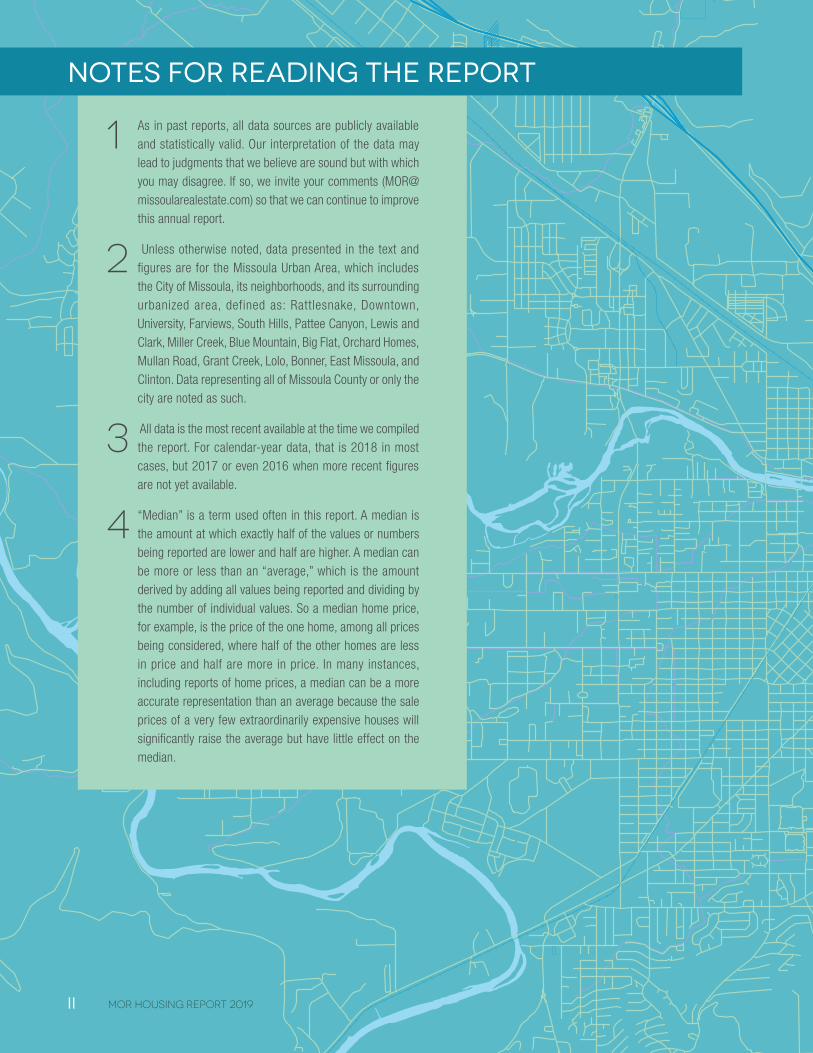
1 As in past reports, all data sources are publicly available and statistically valid. Our interpretation of the data may lead to judgments that we believe are sound but with which you may disagree. If so, we invite your comments ([email protected]) so that we can continue to improve this annual report.
2 Unless otherwise noted, data presented in the text and figures are for the Missoula Urban Area, which includes the City of Missoula, its neighborhoods, and its surrounding urbanized area, defined as: Rattlesnake, Downtown, University, Farviews, South Hills, Pattee Canyon, Lewis and Clark, Miller Creek, Blue Mountain, Big Flat, Orchard Homes, Mullan Road, Grant Creek, Lolo, Bonner, East Missoula, and Clinton. Data representing all of Missoula County or only the city are noted as such.
3 All data is the most recent available at the time we compiled the report. For calendar-year data, that is 2018 in most cases, but 2017 or even 2016 when more recent figures are not yet available.
4 “Median” is a term used often in this report. A median is the amount at which exactly half of the values or numbers being reported are lower and half are higher. A median can be more or less than an “average,” which is the amount derived by adding all values being reported and dividing by the number of individual values. So a median home price, for example, is the price of the one home, among all prices being considered, where half of the other homes are less in price and half are more in price. In many instances, including reports of home prices, a median can be a more accurate representation than an average because the sale prices of a very few extraordinarily expensive houses will significantly raise the average but have little effect on the median.
NOTES FOR READING THE REPORT
II MOR HOUSING REPORT 2019
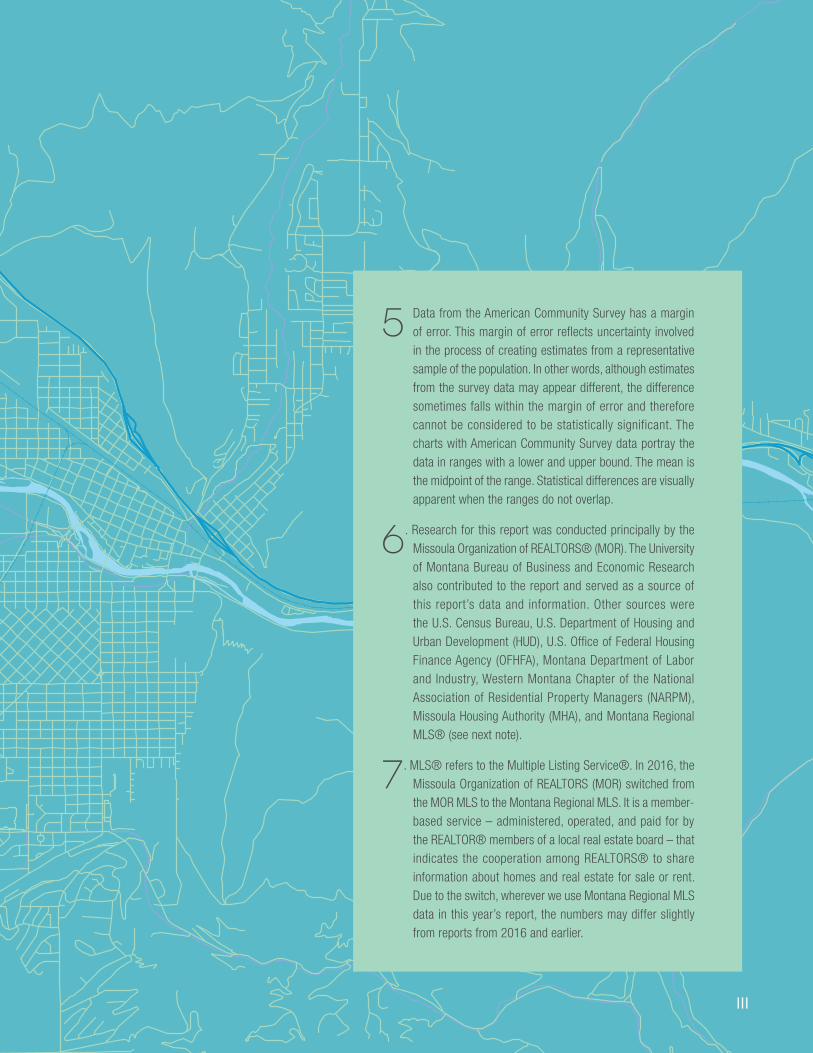
5 Data from the American Community Survey has a margin of error. This margin of error reflects uncertainty involved in the process of creating estimates from a representative sample of the population. In other words, although estimates from the survey data may appear different, the difference sometimes falls within the margin of error and therefore cannot be considered to be statistically significant. The charts with American Community Survey data portray the data in ranges with a lower and upper bound. The mean is the midpoint of the range. Statistical differences are visually apparent when the ranges do not overlap.
6. Research for this report was conducted principally by the Missoula Organization of REALTORS® (MOR). The University of Montana Bureau of Business and Economic Research also contributed to the report and served as a source of this report’s data and information. Other sources were the U.S. Census Bureau, U.S. Department of Housing and Urban Development (HUD), U.S. Office of Federal Housing Finance Agency (OFHFA), Montana Department of Labor and Industry, Western Montana Chapter of the National Association of Residential Property Managers (NARPM), Missoula Housing Authority (MHA), and Montana Regional MLS® (see next note).
7. MLS® refers to the Multiple Listing Service®. In 2016, the Missoula Organization of REALTORS (MOR) switched from the MOR MLS to the Montana Regional MLS. It is a member-based service – administered, operated, and paid for by the REALTOR® members of a local real estate board – that indicates the cooperation among REALTORS® to share information about homes and real estate for sale or rent. Due to the switch, wherever we use Montana Regional MLS data in this year’s report, the numbers may differ slightly from reports from 2016 and earlier.
III

TABLE OF CONTENTS
NOTES FOR READING THE REPORT II
TABLE OF CONTENTS IV
MESSAGE FROM COORDINATING COMMITTEE 1
Coordinating Committee
EXECUTIVE SUMMARY 2
HOUSING SUPPLY: DEVELOPMENT & OCCUPANCY 4
Lot DevelopmentPace of DevelopmentOccupancy Rates in Missoula
HOUSING DEMAND: POPULATION & INCOME 8
Age DistributionPopulation DynamicsMigrationIncome Trends
RENTAL HOUSING 12
Rental OccupancyRental PricesRental Assistance Programs
HOUSING SALES & PRICES 16
Home Sales in 2018Condominiums & TownhousesNew Construction SalesSales Trends in NeighborhoodsComparative Trends in Home PricesPace of Home Sales
MORTGAGE FINANCE 24
Interest RatesCost of ConstructionOther Financing NewsImpacts of Mortgage InsuranceDown PaymentsForeclosuresHome Ownership Programs
HOUSING AFFORDABILITY 28
The Housing Affordability IndexShare of Income Spent on HousingUnemploymentPovertyHomelessness
CONCLUSION & OUTLOOK 34IV MOR HOUSING REPORT 2019
s w
eave
r
b ki
lgus
t | c
c fli
ckr
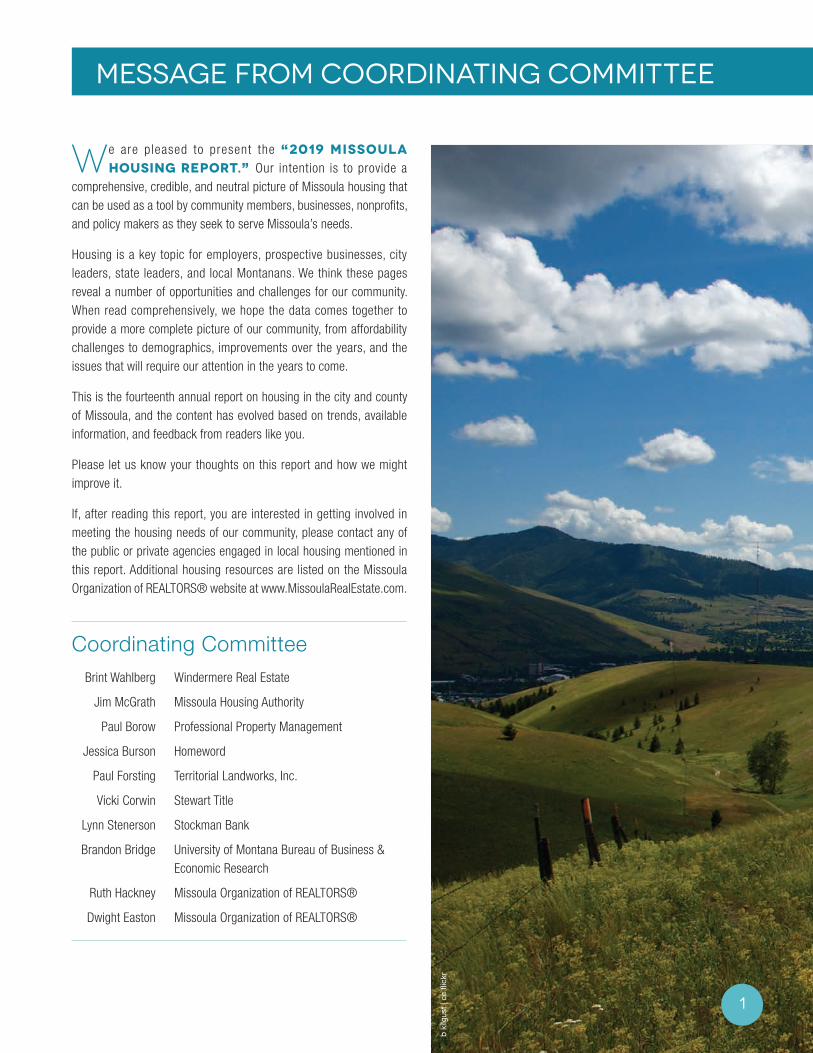
We are pleased to present the “2019 MISSOULA HOUSING REPORT.” Our intention is to provide a
comprehensive, credible, and neutral picture of Missoula housing that can be used as a tool by community members, businesses, nonprofits, and policy makers as they seek to serve Missoula’s needs.
Housing is a key topic for employers, prospective businesses, city leaders, state leaders, and local Montanans. We think these pages reveal a number of opportunities and challenges for our community. When read comprehensively, we hope the data comes together to provide a more complete picture of our community, from affordability challenges to demographics, improvements over the years, and the issues that will require our attention in the years to come.
This is the fourteenth annual report on housing in the city and county of Missoula, and the content has evolved based on trends, available information, and feedback from readers like you.
Please let us know your thoughts on this report and how we might improve it.
If, after reading this report, you are interested in getting involved in meeting the housing needs of our community, please contact any of the public or private agencies engaged in local housing mentioned in this report. Additional housing resources are listed on the Missoula Organization of REALTORS® website at www.MissoulaRealEstate.com.
Coordinating Committee Brint Wahlberg Windermere Real Estate
Jim McGrath Missoula Housing Authority
Paul Borow Professional Property Management
Jessica Burson Homeword
Paul Forsting Territorial Landworks, Inc.
Vicki Corwin Stewart Title
Lynn Stenerson Stockman Bank
Brandon Bridge University of Montana Bureau of Business & Economic Research
Ruth Hackney Missoula Organization of REALTORS®
Dwight Easton Missoula Organization of REALTORS®
MESSAGE FROM COORDINATING COMMITTEE
1
d fo
ltz |
cc fl
ickr
Housing Development & Occupancy
D espite a growing population, a tight supply of real estate and a relatively tight rental market,
construction did not increase in Missoula in 2018.
Multi-family unit construction, which had enjoyed significant increases from 2016 to 2017, suddenly dropped in 2018. Within the City of Missoula, permits for new multi-family units declined 64 percent, while county permits dropped 48 percent. However, duplex permits increased and single-family permits remained relatively level.
Residential lot sales remained the same in 2018 as they were in 2017, with 169 lots sold. The median price was $90,000.
Several large, previously approved subdivisions completed development phases in 2018, raising the total number of subdivision lots that had received final approval and were ready for building up to 322. However, only 18 residential lots entered the first stage of preliminary plat approval, none of them within the city.
In the City of Missoula, about 46 percent of housing units are occupied by their owners; in Missoula County owners occupy approximately 58 percent of the units.
Population & Income
M issoula County continued to grow, adding another 1,311 residents between 2016 and 2017. While
most of that growth is owed to more people moving to Missoula than moving away, net migration did see a slight decrease in 2017. Even with new rentals and single-family homes being added to the market, a growing population kept the markets for both in tight supply.
Economically, Missoula experienced signif icant improvements, although they didn’t transfer to all demographics. Unemployment reached a low of 3.8 percent in 2018, and the 2017 median income in Missoula County increased 17 percent, to $54,311. Homeowners also saw a large jump in their median income, to $75,940. Conversely, the median income for renters declined 4 percent, to $29,793. Such disparity, coupled with rising real estate prices, illustrates the difficulty many residents have in affording real estate as well as rentals.
As has been the case for several years, about 15 percent of Missoulians live in poverty. While the number of homeless individuals identified by a single point-in-time survey declined to 319 in January 2018, an estimated 500 children were homeless or in unstable housing during the 2017-18 school year, according to the Missoula County Public Schools.
EXECUTIVE SUMMARY
2 MOR HOUSING REPORT 2019
c st
eel |
cc
flick
r

Rental Housing
M issoula recorded an annual vacancy rate of 3.9 percent in 2018, which is slightly above
recent years but still considered a tight rental market. Multiplexes saw a bigger increase in vacancy rates thanks to new units coming on line, but homes and duplexes had vacancy rates of 2 percent or less. Overall, rental prices declined 1.55 percent in 2018, giving renters some relief.
The Missoula Housing Authority (MHA) provided 774 Section 8 vouchers to subsidize rent, but it didn’t come close to meeting the demand for such assistance. With 1,777 households on their Section 8 waiting list (up 8.5 percent from 2017), it’s clear that there isn’t enough affordable housing. No new affordable housing units were added in 2018, but MHA plans to bring on 200 new units in 2020.
Housing Sales & Prices
T he pace of home sales remained brisk in 2018 but did decline by 3.8 percent, with 1,482 homes
sold. The median price of a home rose 8.1 percent, to $290,000, while that of a newly constructed single-family home rose 26 percent to $383,500. The largest portion of sales (32.6 percent) occurred in the $200,000 to $275,000 range, and homes over $275,000 all saw an increase in number of sales. Sales of condominiums and townhouses also kept pace, though a decline in newly constructed condominiums did cause overall condo/townhouse sales to drop by 9.6 percent in 2018.
The market continued its trend of having a tight supply, and competition among buyers likely contributed to rising prices. Homes under $350,000 were typically in under-supply throughout 2018.
Housing Finance
H ome buying became more of a challenge for many would-be buyers in 2018. Higher mortgage rates
drove up borrowing costs, and the cost of construction created financing issues for those looking to build. Foreclosures, however, remained low in 2018.
Missoula homebuyers have continued access to a number of down-payment assistance programs, as well as homebuyer and financial education. However, with such a tight supply of homes at affordable price points many buyers are unable to afford to purchase a home even with down payment assistance programs.
Housing Affordability
H ousing affordability remains a challenge for both renters and prospective homebuyers. As
the median price of a home continued to increase, the Missoula Housing Affordability Index declined. To purchase a $290,000 home in 2018 with a 5-percent down payment, a family would have needed an income of at least $95,731 to have it considered affordable.
While the percentage of homeowners spending a worrisome portion of their income on housing decreased to 22 percent in Missoula, according to the most recent 2017 data, the number of renters spending more than 30 percent of their income on housing increased, reaching almost 49 percent.
3

j yar
dley
Lot Development
With a continued tight housing supply, one might expect to see a larger increase in lot sales, but
that has not been the case. While the total number of residential lot sales in the Missoula urban area remained high, there was no increase in 2018 (TABLE 1, FIGURE 1). The median price of a residential lot was $90,000 (FIGURE 2).
TABLE 1: The same number of residential lots were sold in 2018 as were sold in 2017, with the median price dropping slightly.
FIGURE 1: Residential lot sales remained steady 2018.
FIGURE 2: The median price of a residential lot in Missoula was $90,000 in 2018.
HOUSING SUPPLY: DEVELOPMENT & OCCUPANCY
0
45
90
135
180
201820172016201520142013201220112010
Number of Residential Lots Sold
Source: Montana Regional MLSFIGURE 1
Residential Lot Sales
Year Lot Sales % Change Median Price % Change
2010 33 -8.3% $86,000 21.0%
2011 33 0.0% $92,000 6.5%
2012 47 29.8% $55,000 -67.3%
2013 83 43.4% $75,000 26.7%
2014 89 6.7% $85,000 11.8%
2015 133 33.1% $85,500 0.6%
2016 175 24.0% $85,000 -0.6%
2017 169 -3.6% $92,500 8.1%
2018 169 0.0% $90,000 -2.7%
TABLE 1 Source: Montana Regional MLS
$0
$20,000
$40,000
$60,000
$80,000
$100,000
20142013201220112010 2015 2016 2017 2018
Median Price of Residential Lots Sold
Source: Montana Regional MLSFIGURE 24 MOR HOUSING REPORT 2019

Pace of Development
After two years of surging numbers of multi-family unit development projects within the city, overall
construction slowed in 2018. While building permits for single-family homes remained relatively level in 2018, permits for multi-family units took a dive. Permits for duplexes and townhomes remained high. Increased construction costs, building regulations, and lending may be factors impacting the pace of development in Missoula.
Permits for multi-family units (including both apartments and condominiums) in the city dropped 64 percent, from 505 in 2017 to 181 in 2018 (FIGURE 3). Building permits at the county level decreased 13 percent for single-family units and 48 percent for multi-family units, respectively (FIGURE 4). The city issued 246 single-family residential building permits in 2018, compared to 236 in 2017. Both the county and the city saw an increase in duplex permits in 2018.
Townhome unit permits, which have varied widely over the years, totaled 96 in the city for 2018 (TABLE 2).
Townhome Exemption Development Residential Units Permitted
2014 2015 2016 2017 2018
City of Missoula 33 165 60 99 96
Missoula County 30
TABLE 2 Source: City of Missoula Development Services
FIGURE 3: Total building permits in the City of Missoula dropped significantly in 2018 due to a decline in multi-family unit permits.
FIGURE 4: At the county level, duplex permits increased in 2018.
TABLE 2: A total of 96 townhome units were developed in the City of Missoula under exemption in 2018.
5
0
100
200
300
400
500
600
700
800
2016201520142013 20182017
single family
duplex
multi family
City of Missoula Residential Building Permits
Source: City of Missoula Development ServicesFIGURE 3
0
75
150
225
300
2016201520142013 20182017
single family
duplex
multi family
Missoula County Residential Building Permits
Source: Missoula County Public Works - Building DivisionFIGURE 4

j yar
dley
When taking a longer view, for the three-year period of 2016 to 2018, a total of 2,581 building permits were issued by the city and county, up 59 percent from the period of 2005 to 2007 (TABLE 3). Most of that increase came from multi-family units. Likewise, 2018’s total of 676 combined permits issued by the city and county is slightly above the average of the last two decades. From 2000 to 2009, an average of 624 building permits were issued by the city and county each year, which is very similar to the average of 632 issued from 2010 to 2018 (TABLE 4). The biggest shift has been more multi-family permits being issued on average in the last 9 years and, correspondingly, fewer permits for single-family homes.
Missoula saw several large, previously approved subdivisions completed development phases in 2018, contributing to a rise in subdivision lots receiving final approval. However, there were signs of development slowing with very few subdivisions entering the preliminary phase. Preliminary plat approval is the first step in creating new lots through the subdivision process. Once a subdivision achieves final plat approval, the lots may be utilized for new homes. After 2017’s 95 lots gaining subdivision preliminary plat approvals, only 18 residential lots received preliminary approval in 2018; none of those were in the city (TABLE 5).
HOUSING SUPPLY: DEVELOPMENT & OCCUPANCY
TABLE 3: For the three-year period of 2016 to 2018, 59 percent more building permits were issued in Missoula than in the period from 2005 to 2007.
TABLE 4: From 2000 to 2009, single-family building permits made up the majority of permits issued in Missoula, but from 2010 to 2018, multi-family permits took that position, with an average of 337 permits issued each year.
TABLE 5: In 2018, no new residential subdivision lots received preliminary plat approvals in the city, while 18 were approved at the county level.
Building Permits, City and County2005-2007 2016-2018
Single Family 1,239 1,156
Duplex 76 103
Multi-Family 309 1,300
TOTAL 1,624 2,581
TABLE 3Source: US Census Bureau Building Permit Survey, City
of Missoula, Missoula County
Average Building Permits Per Year, City and County
2000-2009 2010-2018
Single Family 374 275
Duplex 42 20
Multi-Family 208 337
TOTAL 624 632
TABLE 4Source: US Census Bureau Building Permit Survey,
City of Missoula, Missoula County
Subdivision Preliminary Plat Approvals2014 2015 2016 2017 2018
County Subdivisions 1 1 1 5 6
County Residential Lots 3 1 6 61 18
City Subdivisions 0 0 1 3 0
City Residential Lots 0 0 2 34 0
Total Residential Lots 3 1 8 95 18
TABLE 5 Source: Missoula County and City of Missoula
6 MOR HOUSING REPORT 2019

l fish
er v
ia fl
ickr
A total of 322 subdivision lots received final approval in 2018, with 46 in the city and 276 at the county level (TABLE 6). With the lack of subdivision preliminary plat approvals, the inventory of future buildable lots is becoming depleted
In discussing new construction, it’s worth taking into account the age of Missoula’s homes. More than half of Missoula County’s housing stock was built prior to 1980, and approximately 2 percent were built after 2010 (FIGURE 5).
20% 30% 40% 50% 60% 70%
Renter-occupied
Owner-occupied
Renter-occupied
Owner-occupied
Missoula County
Missoula City
percentage of occupied housing units
Occupied Housing Units by Tenure | 2017
Source: U.S. Census Bureau, American Community Survey, 2017 5 year data.FIGURE 6
0
1940-19491950-19591960-19691970-19791980-19891990-19992000-20092010-2013
2014 or later
1939 or earlier
11,0008,2505,5002,750
Age of Residential StructuresMissoula County
Source: U.S. Census Bureau, American Community SurveyFIGURE 5
Occupancy rates in MissoulaAbout 51 percent of housing units in the city were occupied by renters and about 46 percent by owners in 2017, which was similar to prior years and typical for a university community. County wide though, around 58 percent of units were owner occupied (FIGURE 6).
FIGURE 6: In Missoula County, the majority of housing units are owner-occupied, while in the city, approximately 51 percent are renter-occupied.
TABLE 6: In 2018, the number of subdivision lots available for building increased, with 322 lots receiving final plat approval.
FIGURE 5: The majority of structures in Missoula County were built in 1979 or earlier.
Subdivision Final Plat Approvals2014 2015 2016 2017 2018
County Final Plat Residential Lots 31 1 38 35 276
City Final Plat Residential Lots 99 200 75 75 46
Total Final Plat Residential Lots 130 201 113 110 322
TABLE 6 Source: Missoula County and City of Missoula
7

HOUSING DEMAND: POPULATION & INCOME
Age Distribution
Residents ages 20 to 24 remain the largest age demographic in Missoula County (FIGURE 7),
according to the most recent American Community Survey data. With few significant changes from the previous year, the age distribution remains similar to 2016.
Keep in mind that data from the American Community Survey is from 2017 and is a year behind some of our other figures on home sales and rentals.
FIGURE 7: University-age students dominate the population pyramid in Missoula County.
Population Dynamics
The total population of Missoula County increased 1.1 percent from 2016 to 2017, reaching a total
population of 117,441 (FIGURE 8). This is a slightly slower rate than the previous year. From 2008 to 2017, the total population increased by 9,694 people, or 9 percent, a number that has a significant impact on Missoula’s housing situation. The majority of that growth has occurred within the City of Missoula, which added 7,664 residents (up 11.6 percent) during that period. Unincorporated Missoula County increased by 2,030 people (or 4.8 percent) in the last decade.
FIGURE 8: Missoula County’s population continues to increase by less than 2 percent each year. In 2017, the population grew by 1,311.
8 MOR HOUSING REPORT 2019
0% 6%3%3% 9%6% 12%9%12%
5-910-1415-1920-2425-2930-3435-3940-4445-4950-55
60-6455-59
65-6970-7475-7980-84
85+
under 5
men women
Source: U.S. Census Bureau, American Community Survey
Population Pyramid | Missoula County 2017
FIGURE 7
0
30,000
60,000
90,000
120,000
2016 2017201320112008 2009 2010 2014 20152012Missoula City Unicorporated Missoula County
Population | Missoula County
Source: U.S. Census Bureau,UM Bureau of Business and Economic ResearchFIGURE 8

u.s.
dep
artm
ent o
f agr
icul
ture
via
flic
kr
Migration
Three factors influence population change: birth, death, and net migration. Net migration factors in
the number of individuals moving to the area, as well as those leaving. Typically, more people move to Missoula than move away, giving it a positive net migration. Net migration in Missoula County, while still positive in 2017, decreased for the first time since 2013. In 2017, the net migration was 1,174 people, compared to 1,758 in 2016 (FIGURE 9).
Where do people migrating into Missoula come from? The best data available comes from a 2016 analysis of tax returns. While tax returns are not a perfect surrogate for number of households or persons, they nevertheless shed light on the relative proportions of where people come from when they move to Missoula County. These data indicate that in 2016, the majority of people moving into Missoula County came from outside of Montana while 41 percent came from within Montana (FIGURE 10). Almost half of those who migrated to Missoula County from out of state came from the western U.S. (FIGURE 11).
FIGURE 9: The net migration in Missoula County decreased by 33 percent from 2016 to 2017.
FIGURE 10: The majority of people moving to Missoula County came from outside of Montana in 2016.
FIGURE 11: Among those moving to Missoula from out of state, the majority came from the western U.S.
9
2,200
2,000
1,800
1,600
1,400
1,200
1,000
800
600
400
200
0
2016 201720152014201320122011201020092008
natural increase
net migration
Components Of Population Change | Missoula County
FIGURE 9 Source: U.S. Census Bureau,UM Bureau of Business and Economic Research
136From outside the United States
2,190From a different state
1,615From within Montana
In-Migration to Missoula County | 2016
Source: Internal Revenue ServiceFIGURE 10
0
400
200
600
800
1,400
1,200
1,000
SouthMidwestNortheast West
In-Migration to Missoula County by Region of United States | 2016
Source: Internal Revenue ServiceFIGURE 11

Income Trends
The estimated median income for all households in Missoula County in 2017 was $54,311 (FIGURE
12), a 17-percent increase from $46,550 in 2016. This marks the first time in recent years that Missoula’s median income has exceeded that of Montana households ($53,386). In comparison, the U.S. median income for all households was $60,336 in 2017.
However, when looking at the housing market, assessing the median income of homeowners versus renters gives us more useful information, as evidenced by a widening economic gap between the two demographics. Missoula homeowners had a median income of $75,940 in 2017 (up 17.5% from the previous year). Meanwhile, Missoula renters saw a slight decline, with their median income dropping from $31,146 in 2016 to $29,793 in 2017.
It’s important to note that there can be a large margin of error in this aggregated data, represented by the blocks of color in Figure 12. For a detailed picture of how median income is related to household size and housing affordability, see the Housing Affordability Index (TABLE 14).
FIGURE 12: The median income of homeowners in Missoula County was $54,311 in 2017. Renters had a median income of $29,793.
HOUSING DEMAND: POPULATION & INCOME
10 MOR HOUSING REPORT 2019
s w
eave
r | c
c fli
ckr
$10,000
$30,000
$50,000
$70,000
$90,000
All Households Homeowners Renters
Missoula County Montana United States
Median Income | 2017
Source: U.S. Census Bureau, American Community SurveyFIGURE 12

j yar
dley 11
f kel
sey
| cc
flick
r

Rental Occupancy
Missoula has experienced several years of low vacancy rates, and while 2017 was no exception,
the annual vacancy rate did increase slightly to 3.9 percent (FIGURE 13). However, by quarter, vacancy rates did not follow the typical seasonal fluctuation of a university town. Instead, Quarter 1 had the highest vacancy rate at 6.4 percent, while Quarter 2 was the lowest (FIGURE 14).
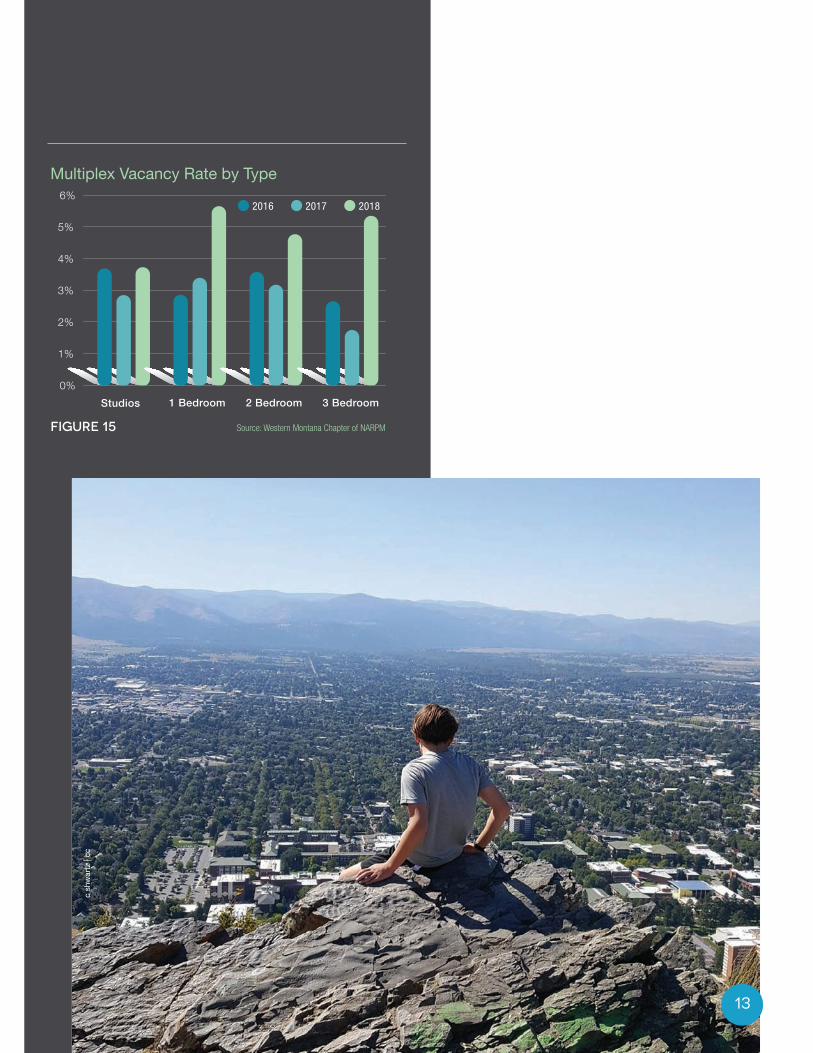
Likely thanks to the addition of newly constructed multi-family units, the vacancy rates did increase for all multiplex rental types in 2018, with an annual vacancy rate of 5.1 percent, which is considered good. Houses and duplexes had much lower vacancy rates of 2 percent or less (FIGURE 15); there’s little new construction of homes and duplexes for the rental market.
FIGURE 13: The overall annual rental vacancy rate was 3.9 percent for 2018.
FIGURE 14: Rental vacancy rates in Missoula were at their highest during the first quarter of 2018.
FIGURE 15: Among multiplex rentals, all vacancy rates increased in 2018.
RENTAL HOUSING
12 MOR HOUSING REPORT 2019
0%
1%
2%
3%
4%
5%
201820172016
Source: Western Montana Chapter of NARPMFIGURE 13
2.9% 3.0%
3.9%
Annual Rental Vacancy Rates
0%
2%
4%
3%
1%
5%
6%
7%
Quarter 4Quarter 3Quarter 2Quarter 1
201820172016
Rental Vacancy Rates by Quarter
Source: Western Montana Chapter of NARPMFIGURE 14
13
c sh
war
tz |
cc
0%
6%
2%
1%
3%
5%
4%
201820172016
3 Bedroom2 Bedroom1 BedroomStudios
Multiplex Vacancy Rate by Type
Source: Western Montana Chapter of NARPMFIGURE 15

Rental Prices
After Missoula’s 2017 increase in rental prices in nearly every category, the majority of rental types
saw some kind of price decrease in 2018 (FIGURE 16). Overall, rental prices dropped 1.55 percent in 2018. Houses and duplexes reported rent decreases of 0.37 percent while multiplex rents fell 4.23 percent from 2017 rates. It could be that more multifamily units coming onto the market and an increase in the vacancy rates helped to reduce rent prices.
The average rent for a one-bedroom apartment in a multiplex in 2018 was $581 while average rent for a 3-bedroom house was $1,136.
The most recent data available for comparing the average Missoula County rent to the average Montana rent comes from 2017. In 2017, Missoula County’s average rent of $792 was $41 more than the Montana average of $751 (FIGURE 17). From 2009 to 2017, Missoula’s average rent increased 5.5 percent while Montana’s average rent increased 11.4 percent.
It should be noted that reporting practices do not account for incentives, such as move-in bonuses or other marketing methods that may be used to attract renters.
FIGURE 16: The average cost of rent in Missoula decreased in the majority of rental types in 2018.
FIGURE 17: While the average Missoula County rent was slightly higher than the Montana average in 2018, the gap has lessened in recent years.
RENTAL HOUSING
14 MOR HOUSING REPORT 2019
2018
2017
2016
4+ Bedroom
2 Bedroom
1 Bedroom
Studios
3 Bedroom
4+ Bedroom
2 Bedroom
1 Bedroom
Studios
3 Bedroom
4+ Bedroom
2 Bedroom
1 Bedroom
Studios
hous
esdu
plex
esm
ultip
lexe
s 3 Bedroom
$0 $375 $750 $1,125 $1,500
Average Cost of Rent
Source: Western Montana Chapter of NARPMFIGURE 16
201620152014201320122011 2017$600
$650
$700
$750
$800
Missoula County
Change in Rent
Source: U.S. Census Bureau, American Community SurveyFIGURE 17
Montana

Rental Assistance Programs
Housing choice vouchers make private-market housing affordable for low-income families
and individuals by paying a portion of the family’s rent. The Missoula Housing Authority (MHA) has 774 available Section 8 vouchers that subsidize rent to private landlords for eligible participants. The Montana Department of Commerce provides another 262 vouchers. Federal funding remained sufficient in 2018 to support all available Section 8 vouchers.
Nevertheless, the demand for this type of rental assistance remains high. In September 2018, 1,777 households were on MHA’s Section 8 waiting list, up 8.5 percent from 2017’s 1,637 (TABLE 7). A total of 1,913 unduplicated households were on all MHA waitlists.
MHA also provides permanent supportive housing vouchers for disabled homeless families and has been able to stretch funding to serve as many as 135 households. MHA is actively involved in the new community effort, known as the Missoula Community Entry System, to address the hardest-to-serve homeless, (see Housing Affordability and Homelessness section). This “work in progress” made slow progress in 2018 but should make the limited resources more effective.
While 266 units of new affordable housing have been built since 2009, no new units of rent-restricted affordable housing went on line in 2018 (TABLE 8). At an average of 26.6 units per year, this seriously falls short of needed production.
Fortunately, MHA will be building 12 units of permanent supportive housing for the homeless in 2019 and 200 units of affordable housing in 2020. This unprecedented scale of new housing will nearly match that produced in the last ten years. Other developers and the City Housing Department are actively working to produce more affordable housing, especially for vulnerable populations.
TABLE 7: The waitlist in Missoula for Section 8 Vouchers, which subsidize rent, increased 8.5 percent, with 1,777 families waiting for assistance in 2018.
TABLE 8: In 2018, no new affordable housing units were built in Missoula County.
MHA WaitLists
Waiting Lists 2009 2010 2011 2012 2013 2014 2015 2016 2017 2018
MHA Sec 8 Voucher 1,395 1,393 1,666 1,555 1,751 1,595 1,725 1,654 1,637 1,777
TABLE 7 Source: Missoula Housing Authority
Affordable Housing Units Built in Missoula County2009 2010 2011 2012 2013 2014 2015 2016 2017 2018 TOTAL
37 5 34 115 0 36 6 0 33 0 266
TABLE 8 Source: Montana Board of Housing
15
HOUSING SALES & PRICES
Home Sales in 2018
The Missoula real estate market experienced another year of rising prices mixed with a limited supply of
more affordable price points.
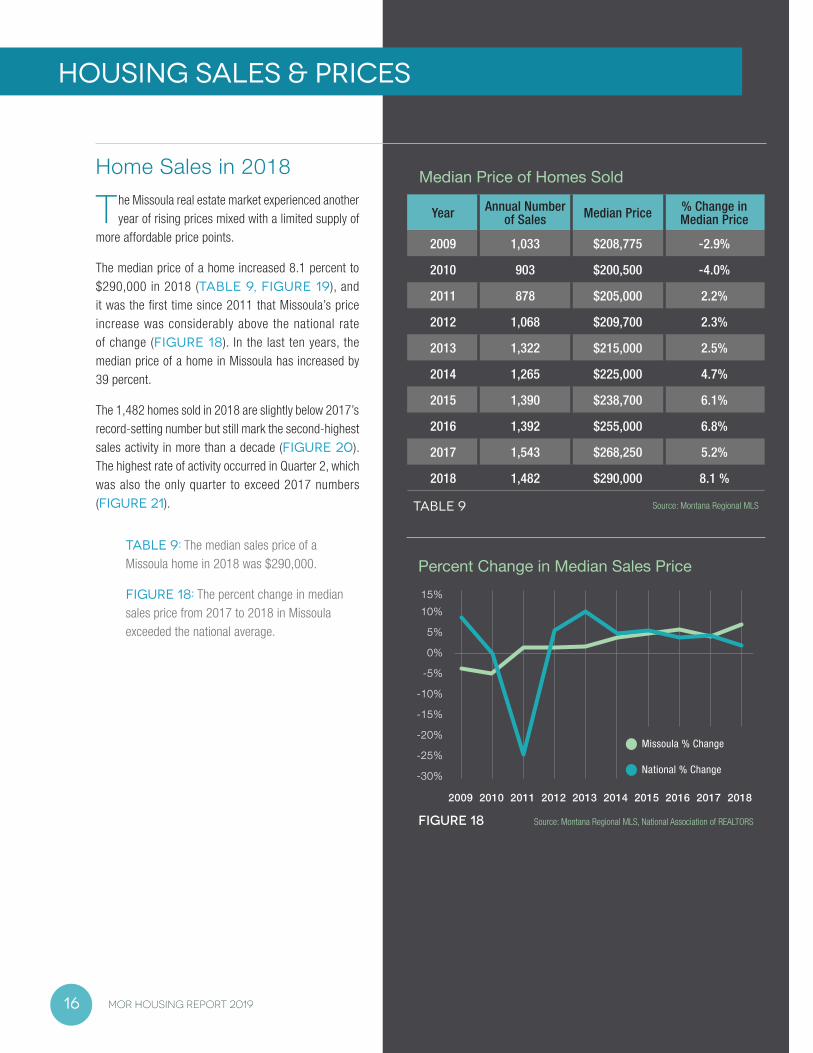
The median price of a home increased 8.1 percent to $290,000 in 2018 (TABLE 9, FIGURE 19), and it was the first time since 2011 that Missoula’s price increase was considerably above the national rate of change (FIGURE 18). In the last ten years, the median price of a home in Missoula has increased by 39 percent.
The 1,482 homes sold in 2018 are slightly below 2017’s record-setting number but still mark the second-highest sales activity in more than a decade (FIGURE 20). The highest rate of activity occurred in Quarter 2, which was also the only quarter to exceed 2017 numbers (FIGURE 21).
TABLE 9: The median sales price of a Missoula home in 2018 was $290,000.
FIGURE 18: The percent change in median sales price from 2017 to 2018 in Missoula exceeded the national average.
Median Price of Homes Sold
Year Annual Number of Sales Median Price % Change in
Median Price
2009 1,033 $208,775 -2.9%
2010 903 $200,500 -4.0%
2011 878 $205,000 2.2%
2012 1,068 $209,700 2.3%
2013 1,322 $215,000 2.5%
2014 1,265 $225,000 4.7%
2015 1,390 $238,700 6.1%
2016 1,392 $255,000 6.8%
2017 1,543 $268,250 5.2%
2018 1,482 $290,000 8.1 %
TABLE 9 Source: Montana Regional MLS
16 MOR HOUSING REPORT 2019
-30%
-25%
-20%
-15%
-10%
-5%
0%
5%
10%15%
Missoula % Change
National % Change
Percent Change in Median Sales Price
Source: Montana Regional MLS, National Association of REALTORSFIGURE 18
20162015201420132012201120102009 2017 2018

FIGURE 19: Since 2011, the median sales price of Missoula homes has steadily increased.
FIGURE 20: Home sales in 2018 cooled slightly, with 1,482 homes being sold.
FIGURE 21: Sales were highest in Quarters 2 and 3 of 2018.
j yar
dley
| cc 17
20162015201420132012201120102009 2017 20180
800
400
1,200
1,600
Number of Homes Sold
Source: Montana Regional MLSFIGURE 20
0
125
250
375
500
Quarter 4Quarter 3Quarter 2Quarter 1
2016
2017
2018
Number of Sales by Quarter
Source: Montana Regional MLSFIGURE 21
$0
$72,500
$145,500
$217,500
$290,000
20162015201420132012201120102009 2017 2018
Median Sales Price of Homes Sold
Source: Montana Regional MLSFIGURE 19
j yar
dley
HOUSING SALES & PRICES
94%
95%
96%
97%
98%
99%
20162015201420132012201120102009 2017 2018
Original List to Final Sales Price
Source: Montana Regional MLSFIGURE 22
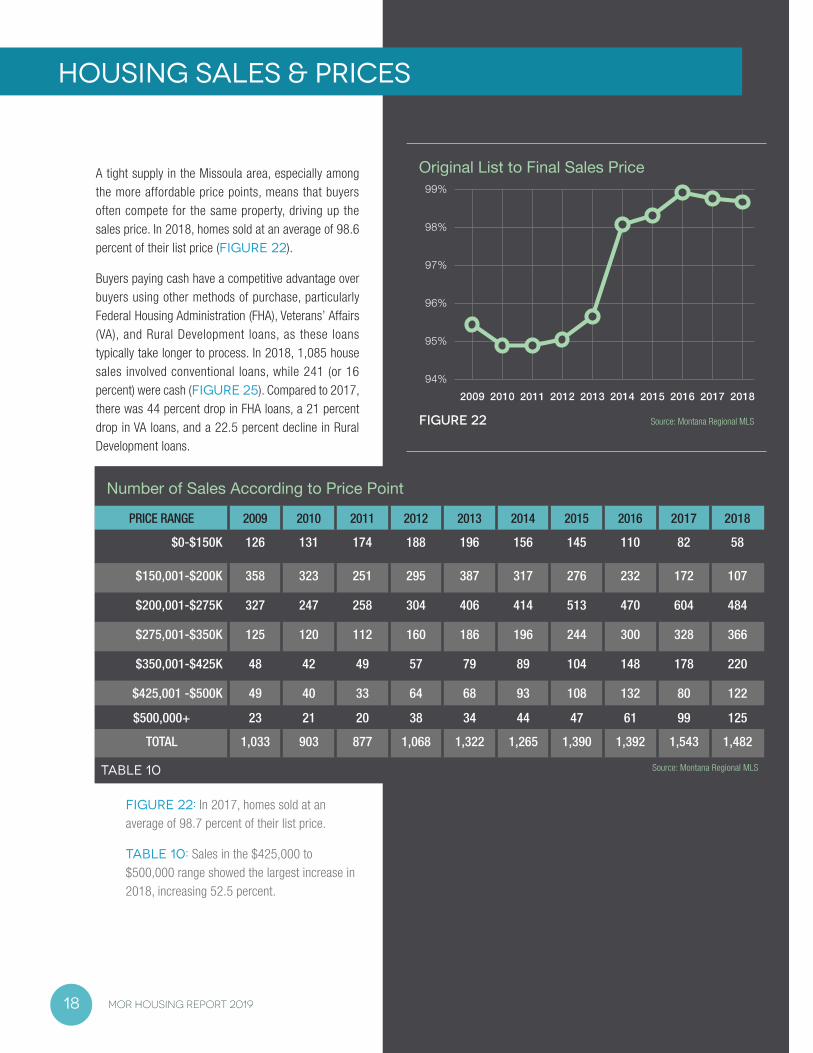
A tight supply in the Missoula area, especially among the more affordable price points, means that buyers often compete for the same property, driving up the sales price. In 2018, homes sold at an average of 98.6 percent of their list price (FIGURE 22).
Buyers paying cash have a competitive advantage over buyers using other methods of purchase, particularly Federal Housing Administration (FHA), Veterans’ Affairs (VA), and Rural Development loans, as these loans typically take longer to process. In 2018, 1,085 house sales involved conventional loans, while 241 (or 16 percent) were cash (FIGURE 25). Compared to 2017, there was 44 percent drop in FHA loans, a 21 percent drop in VA loans, and a 22.5 percent decline in Rural Development loans.
FIGURE 22: In 2017, homes sold at an average of 98.7 percent of their list price.
TABLE 10: Sales in the $425,000 to $500,000 range showed the largest increase in 2018, increasing 52.5 percent.
Number of Sales According to Price Point
PRICE RANGE 2009 2010 2011 2012 2013 2014 2015 2016 2017 2018
$0-$150K 126 131 174 188 196 156 145 110 82 58
$150,001-$200K 358 323 251 295 387 317 276 232 172 107
$200,001-$275K 327 247 258 304 406 414 513 470 604 484
$275,001-$350K 125 120 112 160 186 196 244 300 328 366
$350,001-$425K 48 42 49 57 79 89 104 148 178 220
$425,001 -$500K 49 40 33 64 68 93 108 132 80 122
$500,000+ 23 21 20 38 34 44 47 61 99 125
TOTAL 1,033 903 877 1,068 1,322 1,265 1,390 1,392 1,543 1,482
TABLE 10 Source: Montana Regional MLS
18 MOR HOUSING REPORT 2019

0
350
175
525
700
$0-$150,000
$425,001-$500K
$500,000+
$150,001-$200K
$200,001-$275K
$275,001-$350K
$350,001-$425K
20162015201420132012201120102009 2017 2018
Number of Sales Price Range Breakout
Source: Montana Regional MLSFIGURE 23
Sales Price Distribution of Homes Sold | 2018
Source: Montana Regional MLS
$0-$150,000
$425,001-$500K
$500,000+
$150,001-$200K$200,001-$275K
$275,001-$350K$350,001-$425K
FIGURE 24
FHA | 50
Cash | 241
Conventional | 1,085
VA | 60Rural Development | 24Other | 14Owner Financed | 8
Number of Sales by Method of Purchase | 2018
Source: Montana Regional MLSFIGURE 25
While fewer affordable homes are selling, the sales of more expensive price points have been on the rise. Sales of homes under $275,000 declined 24 percent from 2017 to 2018. Meanwhile, the number of sales increased for all categories over $275,000. Homes between $425,000 and $500,000 had the largest increase in sales, up 52.5 percent. Home sales over $500,000, while still a relatively small share of the Missoula market, increased by 26 percent (TABLE 10).
Homes in the $200,000 to $275,000 range still made up the largest portion of home sales, at 32.6 percent (FIGURE 24).
FIGURE 23: The number of sales for the three lowest price points declined in 2018 while more expensive homes all increased.
FIGURE 24: Homes between $200,001 and $275,000 continued to make up the largest proportion (32.6 percent) of home sales in 2018.
FIGURE 25: In 2018, most buyers bought their homes through conventional mortgages, while 16 percent had the advantage of buying
with cash.
19

HOUSING SALES & PRICES
Condominiums & Townhouses
Sales of condominiums and townhouses dropped 9.6 percent in 2018 but still outpaced sales from 2009
to 2016 (FIGURE 26). Units priced above $200,000 had increased sales activity while those below had a marked decrease. In the last three years, condos and townhouses have increased in popularity among buyers partly due to their costs often being lower than a starter house. As well, the market has also provided a new supply of such units, with 51 new townhomes being sold in 2018 (TABLE 11).
New condominium construction sales did drop 48 percent in 2018, which accounts for most of the 9-percent overall drop in total sales. Meanwhile, higher-end projects drove up the median price of a newly constructed condo 121 percent, to $453,815 (TABLE 11). The median price of both new and existing condominiums sold was $199,950 in 2018.
FIGURE 26: Sales of condominiums and townhouses declined by 9.6 percent in 2018.
New Construction Sales
After hitting a historic high of 191 new construction units sold in 2017, a total of 121 units were
sold in 2018, down 37 percent (FIGURE 27). However, the median price of all new construction saw marked increases. New condominiums had the largest increase, at 121 percent, while new single family homes in Missoula had a median price of $383,500, up 26 percent (TABLE 11). Both an increase in building costs as well costs associated with regulatory issues may be influencing these numbers.
TABLE 11: While the sales of new construction slowed in 2018, their median prices increased dramatically.
FIGURE 27: Sales of new construction units declined to 121 sold in 2018.
New Construction Sales2016 2017 2018 median %
changeunits median units median units median
Condos 40 $207,900 50 $205,600 26 $453,815 120.7%
Townhomes 14 $235,000 54 $236,000 51 $254,353 7.8%
Single Family 66 $310,688 87 $305,140 44 $383,500 25.7%
TABLE 11 Source: Montana Regional MLS
20 MOR HOUSING REPORT 2019
0
100
200
300
400
$200,001-$300K
$150,001-$200K
$0-$150K
$300,001+
Condominium & Townhouse Sales
Source: Montana Regional MLSFIGURE 26
20162015201420132012201120102009 2017 2018
0
50
100
150
200
New Construction Sales
Source: Montana Regional MLSFIGURE 27
20162015201420132012201120102009 2017 2018

Sales Trends in Neighborhoods
In 2018, the areas of Mullan Road/Expressway, Central Missoula, South Hills, and Lewis and Clark were the
top-selling neighborhoods (FIGURE 28). Central Missoula and East Missoula/Clinton had the lowest median prices (FIGURE 29).
All of Missoula’s neighborhoods experienced increases in their median price. The Downtown/Northside neighborhood, which had the largest jump in number of sales in 2017, saw a drop in sales in 2018 paired with a 17-percent increase in median sales price.
Grant Creek, Miller Creek, and the Rattlesnake neighbor-hoods had the highest median prices.
FIGURE 28: Five of Missoula’s neighborhoods saw increased home sales in 2018 while seven had declining numbers.
FIGURE 29: The median sales price increased in all neighborhoods in 2018.
21
0 50 100 150 200 250 300 350
E.Missoula/Clinton
Lolo
Grant Creek
Mullan Rd./Expressway
Target Range
Miller Creek
Central Missoula
Lewis & Clark
South Hills
U-Area/Slant
Downtown/Northside
Rattlesnake
Home Sales by Neighborhood
Source: Montana Regional MLSFIGURE 28
2018
2017
2016
E.Missoula/Clinton
Lolo
Grant Creek
Mullan Rd./Expressway
Target Range
Miller Creek
Central Missoula
Lewis & Clark
South Hills
U-Area/Slant
Downtown/Northside
Rattlesnake
2018
2017
2016
Median Price
$0 $125K $250K $375K $500K
Median Sales Price by Neighborhood
Source: Montana Regional MLSFIGURE 29
HOUSING SALES & PRICES
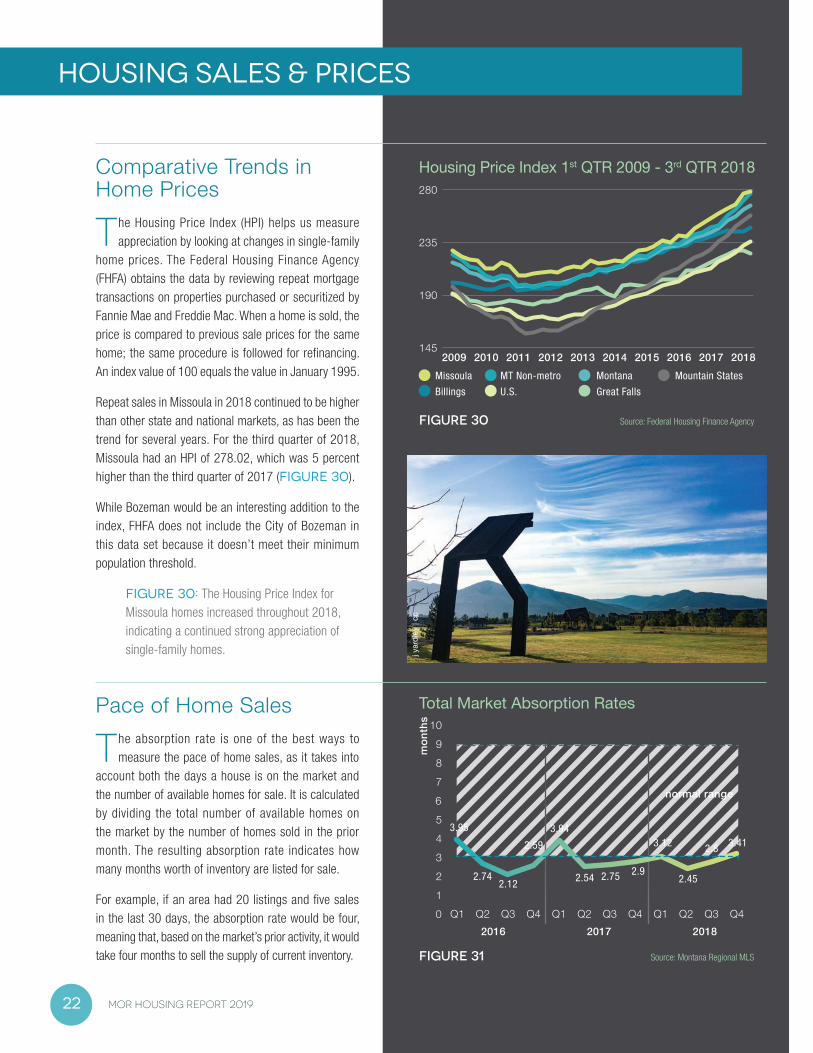
Comparative Trends in Home Prices
The Housing Price Index (HPI) helps us measure appreciation by looking at changes in single-family
home prices. The Federal Housing Finance Agency (FHFA) obtains the data by reviewing repeat mortgage transactions on properties purchased or securitized by Fannie Mae and Freddie Mac. When a home is sold, the price is compared to previous sale prices for the same home; the same procedure is followed for refinancing. An index value of 100 equals the value in January 1995.
Repeat sales in Missoula in 2018 continued to be higher than other state and national markets, as has been the trend for several years. For the third quarter of 2018, Missoula had an HPI of 278.02, which was 5 percent higher than the third quarter of 2017 (FIGURE 30).
While Bozeman would be an interesting addition to the index, FHFA does not include the City of Bozeman in this data set because it doesn’t meet their minimum population threshold.
FIGURE 30: The Housing Price Index for Missoula homes increased throughout 2018, indicating a continued strong appreciation of single-family homes.
Pace of Home Sales
The absorption rate is one of the best ways to measure the pace of home sales, as it takes into
account both the days a house is on the market and the number of available homes for sale. It is calculated by dividing the total number of available homes on the market by the number of homes sold in the prior month. The resulting absorption rate indicates how many months worth of inventory are listed for sale.
For example, if an area had 20 listings and five sales in the last 30 days, the absorption rate would be four, meaning that, based on the market’s prior activity, it would take four months to sell the supply of current inventory.
j yar
dley
| cc
22 MOR HOUSING REPORT 2019
145
190
235
280
2016 2017 20182015201420132012201120102009
Housing Price Index 1st QTR 2009 - 3rd QTR 2018
Source: Federal Housing Finance AgencyFIGURE 30
Missoula MT Non-metro Montana Mountain States
Billings U.S. Great Falls
201820172016
FIGURE 31
01
65432
987
10
Q4Q3Q2Q1Q3Q2 Q4Q1Q4Q3Q2Q1
3.95
2.742.12
2.59
3.94
2.54 2.75 2.9
3.12
2.45
2.8 3.41
normal range
Source: Montana Regional MLS
Total Market Absorption Rates
mon
ths
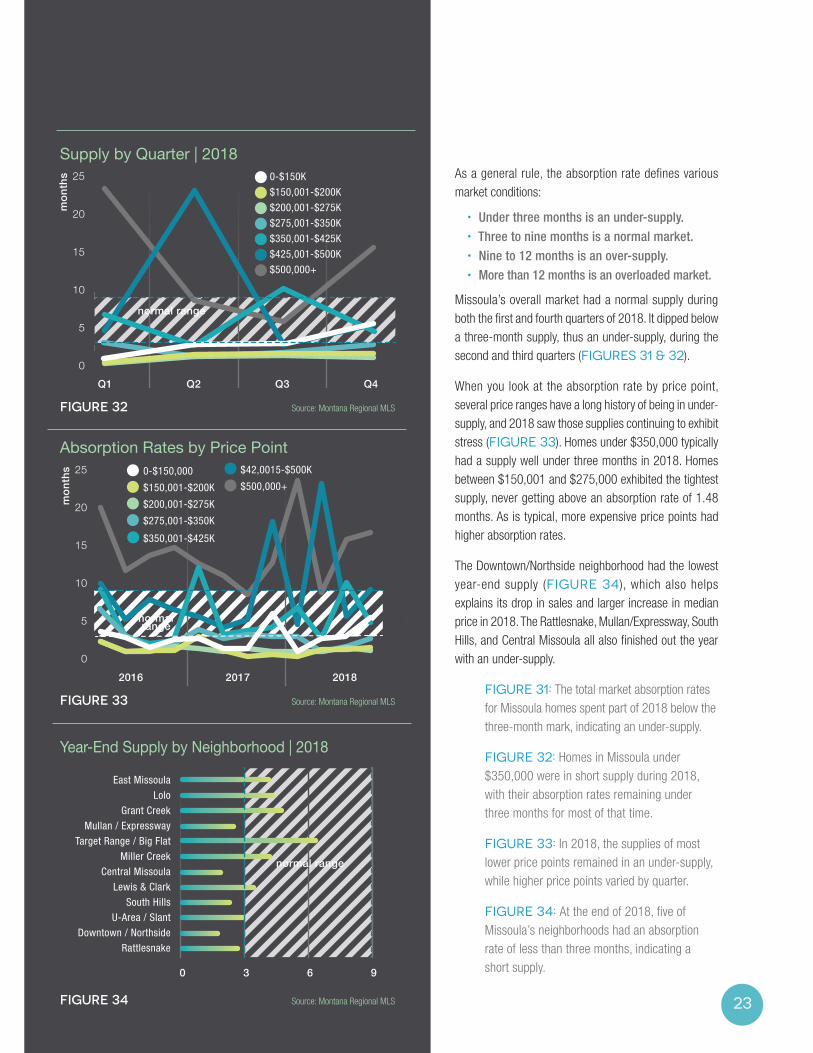
As a general rule, the absorption rate defines various market conditions:
• Under three months is an under-supply.• Three to nine months is a normal market.• Nine to 12 months is an over-supply.• More than 12 months is an overloaded market.
Missoula’s overall market had a normal supply during both the first and fourth quarters of 2018. It dipped below a three-month supply, thus an under-supply, during the second and third quarters (FIGURES 31 & 32).
When you look at the absorption rate by price point, several price ranges have a long history of being in under-supply, and 2018 saw those supplies continuing to exhibit stress (FIGURE 33). Homes under $350,000 typically had a supply well under three months in 2018. Homes between $150,001 and $275,000 exhibited the tightest supply, never getting above an absorption rate of 1.48 months. As is typical, more expensive price points had higher absorption rates.
The Downtown/Northside neighborhood had the lowest year-end supply (FIGURE 34), which also helps explains its drop in sales and larger increase in median price in 2018. The Rattlesnake, Mullan/Expressway, South Hills, and Central Missoula all also finished out the year with an under-supply.
FIGURE 31: The total market absorption rates for Missoula homes spent part of 2018 below the three-month mark, indicating an under-supply.
FIGURE 32: Homes in Missoula under $350,000 were in short supply during 2018, with their absorption rates remaining under three months for most of that time.
FIGURE 33: In 2018, the supplies of most lower price points remained in an under-supply, while higher price points varied by quarter.
FIGURE 34: At the end of 2018, five of Missoula’s neighborhoods had an absorption rate of less than three months, indicating a short supply.
23
0
5
10
15
20
25
Q4Q3Q2Q1
mon
ths
$500,000+
$425,001-$500K
$350,001-$425K
$275,001-$350K
$200,001-$275K
$150,001-$200K
0-$150K
normal range
Source: Montana Regional MLS
Supply by Quarter | 2018
FIGURE 32
0
5
10
15
20
25
201820172016
mon
ths
normalrange
$42,0015-$500K
$350,001-$425K
$275,001-$350K
$200,001-$275K
$150,001-$200K
0-$150,000
$500,000+
Absorption Rates by Price Point
Source: Montana Regional MLSFIGURE 33
0 3 6 9
Downtown / Northside
Central Missoula
South Hills
Mullan / Expressway
Rattlesnake
U-Area / Slant
Lewis & Clark
East Missoula
Miller Creek
Lolo
Grant Creek
Target Range / Big Flat
Year-End Supply by Neighborhood | 2018
Source: Montana Regional MLSFIGURE 34
normal range

MORTGAGE FINANCE
Interest RatesHigher mortgage rates drove up borrowing costs in 2018, stretching the limits of affordability for many would-be buyers. This, on top of an increase in home prices and a tight supply of homes on the market, has made home buying more of a challenge.
The New Year began under the pressure of expected higher interest rates, with rates for a 30-year fixed term in the low 4-percent range.
Any upward pressure on economic growth or inflation is bad for rates. Economic growth increases market returns, forcing rates to move higher to keep up. Both economic news and the volatility of the stock market can change mortgage rates on a daily basis. Strong jobs data can also be the nemesis of low interest rates.
In October and November 2018, rates spiked into the 5-percent range—the highest level in nearly seven years. This increase was the result of a stronger-than-expected jobs report. The Employment Situation (one of the most important pieces of labor market data and the most important economic report as far as mortgage rates are concerned) showed the highest pace of wage
growth since before the recession plus a robust addition of new jobs in October.
In mid November and December, interest rates started to fall due to economic news that included concerns about slower economic growth; a new, weaker-than-expected jobs report; and comments from Fed Chair Powell on future monetary policies with the possibility of fewer rate hikes. Then, the stock market tanked in the fourth quarter. Mortgage rates ended the year with interest rates the lowest they had been in eight months, at 4.625 percent for a 30-year fixed term (FIGURES 35 & 36).
The Federal Reserve raised the key short-term interest rate four times during 2018. The rate hike increased the borrowing cost for variable-rate consumer loans such as credit cards, home equity lines of credit, construction financing, auto loans and adjustable-rate mortgages. This benchmark rate has increased nine times since 2015.
With 2019 ringing in with mortgage rates at the lowest levels since early 2018, there’s hope of less rate volatility in the coming year.
Cost of Construction
Over the last year the increase in new construction costs created some f inancing issues for
borrowers looking to build a new home. When seeking construction financing to build a home, lenders use the cost breakdown provided by the builder/borrower and order an appraisal report based on the cost breakdown, plans, and specifications. The appraisal report provides a “cost approach to value” and a “comparable sales approach” based on sales of existing homes within the last six to twelve months. For lending purposes, more weight is given to the “sales approach” when deriving the end value for the appraisal report. The costs to build a home often exceeded what the appraisal report supported, creating some financing challenges.
j yar
dley
| cc24 MOR HOUSING REPORT 2019

Other Financing News
The Conforming Conventional Loan Limit increased from $453,100 in 2018 to $484,300, effective
January 1, 2019. These are the loan limits set by government-sponsored enterprises that purchase most home loans (Fannie Mae and Freddie Mac). There are options (called “jumbo loans”) for financing mortgage loan amounts that exceed the conventional loan limit. Jumbo financing usually has stricter underwriting guidelines and requires higher credit scores, lower debt-to-income ratio, and greater reserves. The down payment required for a jumbo loan averages 15 to 20 percent.
Student loan debt is still a hurdle for individuals qualifying for a home purchase. For any FHA or USDA Rural Development financing, applicants must report their monthly student loan payment as 1 percent of the principal balance for qualification purposes unless documentation is provided with a fully amortized monthly payment. Conventional financing will allow lenders to use the monthly payment reflected on the applicant’s credit report or documentation to support “income-based repayment.”
25
0%
2%
4%
6%
20162015201420132012201120102009 2017 2018
4.19%4.19%4.13%
4.75%
3.25%
3.75%
4.75%
5.50%
4.50%
4.63%
Year-end Interest Rates
Source: Stockman BankFIGURE 35
2,500
4,500
4,000
3,500
3,000
5,000
5,500
MARFEBJAN APR MAY AUGJULJUN SEP OCT NOV DEC
30-Year Conventiaonal Mortgage Rates
FIGURE 36 Source: Stockman Bank
Inte
rest
Rat
e
201820172016

MORTGAGE FINANCE
Impacts of Mortgage Insurance
Private mortgage insurance (PMI) is a policy, paid for by the homeowner, that protects the lender in
the event the homeowner defaults on payments. While not all loans require PMI, it is required on conventional loans when the first mortgage is greater than 80 percent
of the property value/purchase price. Federal Housing Administration (FHA) and Rural Development loans also require mortgage insurance. Thus, low down payments generally translate to the additional cost of PMI for homeowners.
Down Payments
There are a lot of misconceptions about needing to have 20 percent down to purchase a home;
this could not be further from the truth. Borrowers who qualify can put as little as 3 percent down with a conventional loan. Federal Housing Administration (FHA) loans require 3.5 percent down, while a Veteran Administration (VA) loan will provide an eligible veteran 100-percent financing. USDA Rural Development will also provide 100-percent financing on a home purchase outside the Missoula city limits; this program does have income limitations.
Even with low down-payment options, coming up with a down payment is still a challenge for a lot of potential homebuyers. However, there are down-payment assistance programs available.
For those who make 80 percent or less of the area median income, there are the Neighbor Works of Great Falls and the Federal Home Loan Bank/HomeStart Grant programs. Additionally, qualified applicants can use the Human Resource Council’s down-payment assistance program for their gap financing.
There are also down-payment assistance programs available for those who make more than 80 percent of the area median income. Second mortgage options can be found with the help of Montana Housing and Neighbor Works of Great Falls.
All these programs require that applicants wishing to use down-payment ass is tance complete a cert i f ied First-Time Homebuyer class and that they can save some of their own funds to contribute towards the purchase.
The MoFi HomeNow Zero Down Loan Program, available through participating lenders, funds up to 100 percent of a borrower’s cash requirements to close. The grant does not need to be repaid and can be used for a down payment, closing costs and related mortgage loan expenses. However, buyers who use this program will also pay higher interest rates on their mortgage loan.
Potential borrowers should contact their local mortgage lenders to help find the best program(s) for financing a home purchase.
26 MOR HOUSING REPORT 2019

w fr
yer v
ia fl
ickr
Foreclosures
Home mortgage delinquencies and foreclosures remained low, with only 95 properties being
given a notice of sale and just 29 reaching foreclosure in 2018 (TABLE 12 & FIGURE 37). In addition to a strong economy, those numbers may be due to homebuyer education programs, financial fitness classes, foreclosure prevention, and more conservative underwriting standards.
TABLE 12 Fewer properties are experiencing home mortgage delinquencies (notices of sale) and foreclosures in Missoula.
FIGURE 37 Foreclosures on homes in Missoula remained low, at just 29, in 2018.
j yar
dley
| cc
27
ForeclosuresYear Notice of Sale Cancellation of Sale Net Foreclosures
2009 565 303 262
2010 719 486 233
2011 493 351 142
2012 431 280 151
2013 270 162 108
2014 206 144 62
2015 248 196 52
2016 137 93 44
2017 102 78 24
2018 95 66 29
TABLE 12 Source: Stewart Title
0
50
100
150
200
250
300
20162015201420132012201120102009 2017 2018
Bank Foreclosures | Missoula County
Source: Stewart TitleFIGURE 37

MORTGAGE FINANCE
Home Ownership Programs
HOMEWORD
Established in 1994, Homeword is a local nonprofit that develops homes people can afford across
Montana and serves as a HUD-approved Housing Counseling Agency through one of only three Regional HomeOwnership Centers® in Montana.
Over 13,500 people have been empowered through Homeword’s programs since its HomeOwnership Center opened in 1997. Homeword provides a full-continuum of services to develop well-informed consumers, including financial, renter and homebuyer education, and counseling.
In 2018, 23 seniors learned critical homeowner and financial skills, while 47 Veterans gained home buying, rental and financial information.
Homeword predominantly serves people living on low and moderate incomes. Of those receiving financial education and/or counseling, 53 percent earned less than $21,407 (which is 50 percent of the area media income) and 78 percent were women. All services are provided at no cost with the exception of the homebuyer education class, which is $25 per person or $40 per household. Free childcare is offered during classes to make them more accessible to parents.
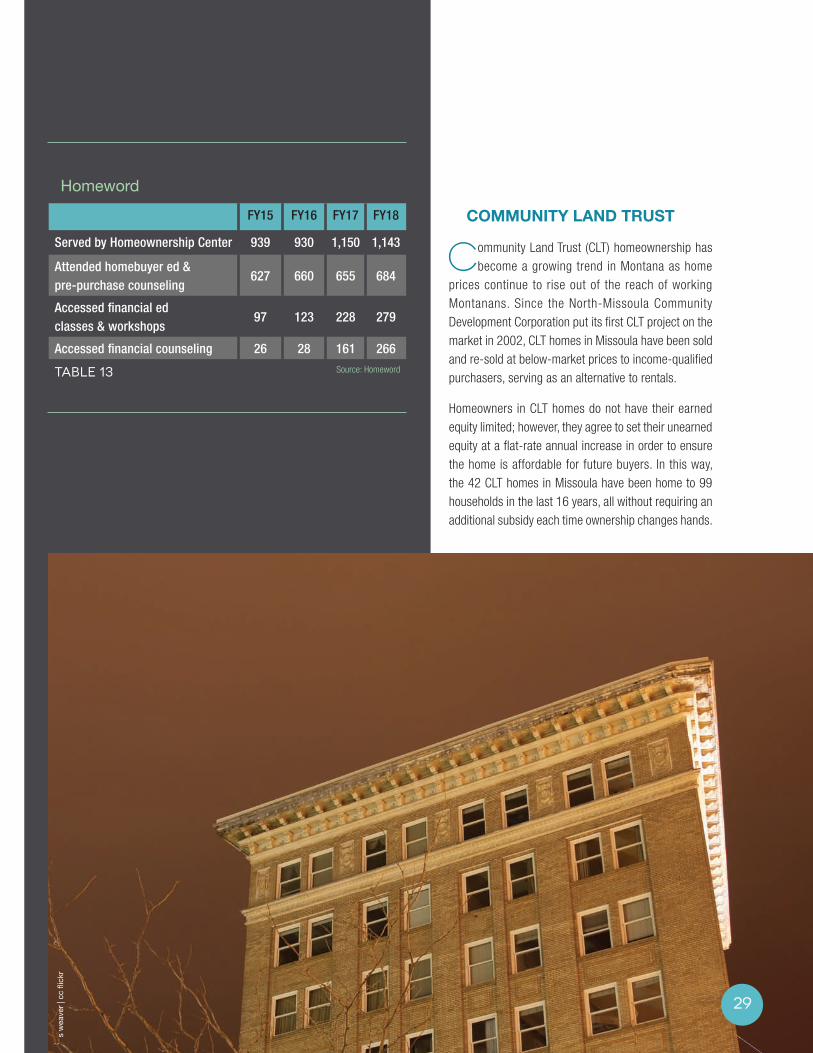
Homeword continued to see a high demand for homebuyer education and pre-purchase housing counseling in 2018 with classes at capacity and most having a wait list (TABLE 13). This is reflective of the need for such services as defined in the 2018 Making Missoula Home Report. The demand for financial and renter education and counseling also increased.
The impacts of these programs are far reaching. Included in those who took advantage of Homeword programs in 2018 were the parents of 370 children—parents who were empowered to make wise financial decisions for their families. Studies show that children who grow up in homes with low financial stress are more likely to reach their full potential. NeighborWorks America found that homebuyer education and pre-purchase housing counseling are keys to successful homeownership. Homeowners who receive pre-purchase housing counseling and education are about one-third less likely to become seriously delinquent on their mortgage payments within the first two years of owning their home as compared to those who do not receive such services.
TABLE 13 An increasing number of people accessed financial education and homebuyer education in 2018.
28 MOR HOUSING REPORT 2019
w fr
yer v
ia fl
ickr
s w
eave
r | c
c fli
ckr
COMMUNITY LAND TRUST
Community Land Trust (CLT) homeownership has become a growing trend in Montana as home
prices continue to rise out of the reach of working Montanans. Since the North-Missoula Community Development Corporation put its first CLT project on the market in 2002, CLT homes in Missoula have been sold and re-sold at below-market prices to income-qualified purchasers, serving as an alternative to rentals.
Homeowners in CLT homes do not have their earned equity limited; however, they agree to set their unearned equity at a flat-rate annual increase in order to ensure the home is affordable for future buyers. In this way, the 42 CLT homes in Missoula have been home to 99 households in the last 16 years, all without requiring an additional subsidy each time ownership changes hands.
29
HomewordFY15 FY16 FY17 FY18
Served by Homeownership Center 939 930 1,150 1,143
Attended homebuyer ed & pre-purchase counseling
627 660 655 684
Accessed financial ed classes & workshops
97 123 228 279
Accessed financial counseling 26 28 161 266
TABLE 13 Source: Homeword

HOUSING AFFORDABILITY
The Housing Affordability Index
The Housing Affordability Index (HAI) measures the ability of a family earning a median income
to purchase a median-priced home. An index value of 100 means that a household with a median income has exactly enough income to spend 25 percent of their income on a mortgage for a median-priced home. A value higher than 100 indicates that family has more than enough income to qualify for a mortgage on a median-priced home. Conversely, if the HAI is below 100 (as it is in Missoula), it indicates that a median-priced home would not be as affordable for that household.
The HAI Index for Missoula fell well below 100 in 2018 when assuming a 5-percent down payment, ranging from a value of 51 for a one-person household to 74 for a four-person household (FIGURE 38). That indicates that a family with a median income would have a difficult, if not impossible, time qualifying for a mortgage on a median-priced home.
At the bottom of Table 14, you can see the effect a down payment has on affordability. If a family tried to purchase a median-priced home that cost $290,000 in Missoula in 2018 with a 5-percent down payment, they would have needed a median family income of $95,731. However, if that same family had a larger 20-percent down payment, they only would need an income of $75,408. (By comparison, in 2017, they would have needed an income of $65,968 to afford a median-priced
home of $268,250.) The reality, however, is that few people have 20-percent down unless they are bringing proceeds from a previous real estate sale to the table.
In determining HAI, we show data for two different scenarios: one assuming a 5-percent down payment, which is reflected in Figure 38, and one assuming a 20-percent down payment, which is how the national HAI is calculated. Comparing the two shows how a lower 5-percent down payment, plus the necessary mortgage insurance, significantly lowers the overall affordability (TABLE 14). The 20-percent down payment does not include mortgage insurance. Both scenarios figure in property taxes and homeowner insurance.
This is the second year that this report has used reconfigured data for the HAI model. It now reflects a 5-percent down payment (rather than 4 percent), decreased mortgage insurance payment amounts that are closer to actuals, and increased property tax payments to reflect higher property tax rates.
FIGURE 38: The Housing Affordability Index (HAI) dropped slightly in 2018, still indicating that a median-income household would have a difficult time affording a median-priced home if they were putting 5-percent down.
TABLE 14: A household would need an income of $95,731 to afford a median-priced home with a 5-percent down payment in 2018. In comparison, they would need a median income of $75,408 to purchase that same home with a 20-percent down payment.
j yar
dley
| cc
30 MOR HOUSING REPORT 2019

m m
ccor
mic
k
j yar
dley
| cc
31
40
20
0
60
80
100
120
2016 2017 2018201520142013
four person
three person
two person
one person
Housing Affordablilty Index
Source: Montana Regional MLS, HUDFIGURE 38
Missoula Housing Affordablity Index | 2016-20182016 2017 2018 YEAR 2016 2017 2018
$255,000 $268,250 $290,000 Median Home Price (MOR) $255,000 $268,250 $290,000
5% 5% 5% Downpayment 20% 20% 20%
4.50% 4.00% 4.625% Interest Rate 4.50% 4.00% 4.625%
$176 $185 $200 Mortgage Insurance $0 $0 $0
MEDIAN FAMILY INCOME
$43,200 $46,125 $49,300 1 person $43,200 $46,125 $49,300
$49,300 $52,750 $56,400 2 person $49,300 $52,750 $56,400
$56,500 $59,313 $63,400 3 person $55,500 $59,313 $63,400
$61,600 $65,875 $70,400 4 person $61,600 $65,875 $70,400
HOUSING AFFORDABILITY INDEX*
53 55 51 1 person 69 70 65
61 63 59 2 person 78 80 75
68 71 66 3 person 88 90 84
76 78 77 4 person 98 100 93
MEDIAN FAMILY INCOME NEEDED TO PURCHASE MEDIAN PRICED HOME
$81,210 $84,058 $95,731 Income $62,892 $65,968 $75,408
TABLE 14 KEY: *Includes taxes and homeowners insurance on a 30 year fixed loan

HOUSING AFFORDABILITY
Share of Income Spent on Housing
It is generally accepted that no more than 30 percent (and, more safely, 25 percent) of a household’s gross
monthly income should be spent on housing. Households that must spend a large portion of income on housing have a difficult time meeting other obligations and are considered “cost burdened.”
Historically, a worrisome proportion of Missoula residents spend 30 percent or more of their income on housing. In both 2015 and 2016, approximately 47 percent of Missoula renters spent more than 30 percent of their income on housing; that increased to almost 49 percent in 2017. In contrast, the percentage of homeowners spending more than 30 percent of their income on housing costs continued to decline, dropping from more than 30 percent in 2015 to 22 percent in 2017 (FIGURE 39).
FIGURE 39: In 2017, approximately 49 percent of Missoula renters spent more than 30 percent of their income on housing. (The colored blocks represent the margin for error with this data.)
UnemploymentThe unemployment rate is the percentage of the total labor force that is unemployed but still able to work and actively seeking employment. Missoula’s unemployment rate was at a six-year low, hitting 3.8 percent in 2018 (FIGURE 40). According to the U.S. Department of Labor, the national unemployment rate was 3.9 percent in December 2018.
FIGURE 40: Missoula County had an unemployment rate of 3.8 percent in 2018.
32 MOR HOUSING REPORT 2019
60% 70%50%40%30%20%10%0%
2017
2016
homeowners
renters
2017
2016
percent of households
Source: U.S. Census Bureau, American Community SurveyFIGURE 39
Missoula County Households that Spend 30% or More on Housing
Source: Montana Department of Labor and Industry
0%
1%
2%
3%
4%
5%
6%
7%
8%
201820172016201520142013
FIGURE 40
Unemployment Rate | Missoula County

PovertyTo determine who is in poverty, the U.S. Census Bureau sets an income threshold under which an individual or family is deemed to be living in poverty. This threshold varies based on family size, living situation, and age. In 2017, approximately 15 percent of Missoula County residents were considered to be living in poverty (FIGURE 41).
FIGURE 41: TThe number of Missoula residents living in poverty has remained around 15 and 16 percent for the last several years. (The bars of color represent the margin of error for this data.)
d ba
rton
| cc
flick
r
33
14%
16%
10%
12%
20%
22%
24%
18%
2013 2014 201520122011 2016 2017
Poverty Level | Missoula County
FIGURE 41 Source: U.S.Census Bureau, American Community Survey

j yar
dley
| cc
HOUSING AFFORDABILITY
Homelessness
The January point-in-time homeless census in 2018 counted 319 homeless individuals, which is 7.26
percent less than 2017’s 344 and down 19 percent over three years (FIGURE 42). The point-in-time data is a nationally coordinated, simultaneous effort to identify the number of persons experiencing homelessness on a single night during the last week in January. The data collected is essential for at least $2.4 million in grants that Montana receives annually. It also helps build the case to establish more affordable and supportive housing options at the local level.
In November, homeless and housing providers involved in Missoula’s Homeless and Housing Coordinated Entry System began using the same software and technology to track characteristics and service needs of people experiencing homelessness. It is beginning to provide some real-time data in Missoula and across the state. Missoula’s total homeless population comprises 23 percent of the statewide population, the highest portion in the state.
The number of homeless children in Missoula county Public Schools (MCPS) increased to 500 during the 2017-2018 school year, up from 438 the year before (FIGURE 43). This figure represents the number of unstably housed children identified throughout the school year. Unstable housing varies, from periods of brief, literal homelessness to a pattern of frequent moves and other situations. This is one of the better ways to identify the size of this at-risk group, as families with children in school often do everything they can to avoid living on the street or in shelters if they don’t have permanent housing.
The number of homeless children in Missoula has been an ongoing concern; the 2017 Annual Homeless Assessment Report to Congress identified Montana as one of five states with the highest rates of unsheltered people in families with children. Natural disaster events, such as fires and floods, are thought to be a contributor to the 2017-18 increase, since these events caused families to lose their housing. However, the school district reports that the trend is continuing with the current 2018-19 school year without those contributing factors.
Missoula and other communities in Montana are working smarter and more collaboratively in order to ensure homelessness is rare, brief, and one-time only.
34 MOR HOUSING REPORT 2019

FIGURE 42 The number of homeless individuals counted during a single point-in-time survey continued to decline in 2018, with 319 being identified on a single night in January.
FIGURE 43 The number of homeless children in the Missoula County Public Schools was estimated at 500 during the 2017-18 school year, up 14 percent from the previous year.
35
200
100
0
300
400
500
600
201620152014 20182017
Total Homeless Individualson a Single Night in January
FIGURE 42 Source: Montana Continuum of Care
0
200
400
600
2015-162014-152013-14 2016-17 2017-18
Homeless Children
FIGURE 43 Source: Missoula County Public Schools

E conomically, Missoula experienced a strong 2018, but those positive gains have not entirely caught up
with the housing market. The median income increased 17 percent, to $54,311, and Missoula had its lowest unemployment rate in several years. Yet, with continued population growth, Missoula still had a short supply of affordable homes for sale, a tight rental market, and increasing home prices.
The rental and real estate markets presented a vastly different picture of income, pricing, affordability, and availability.
Rental housing had a low annual vacancy rate of 3.9 percent in 2018. While rent prices did decline 1.55 percent, an increasing portion of renters spent more than 30 percent of their income on housing costs, putting them in an economically vulnerable position where it can be difficult to meet other financial obligations. In conjunction, the median income for a Missoula renter declined 4 percent, to $29,793. The affordability challenge for renters is further illustrated by the growing wait list of 1,777 households still hoping to receive one of 774 available Section 8 vouchers.
The community has been working for some time on strategic ways to reduce the homeless population. Numbers for Missoula’s single-point-in-time count of homeless individuals declined again in 2018, but the number of children identified as homeless or in unstable housing increased during the 2017-2018 school year. All of this points towards a stressed housing situation for many of Missoula’s residents.
While the Missoula Housing Authority was not able to add any new affordable housing units in 2018, they do have plans for 200 new units in 2020, which will be a welcome addition to the housing stock.
In contrast, Missoula homeowners saw a large jump in their median income, to $75,940, and the number of homeowners spending more than 30 percent of their income on housing dropped down to just 22 percent. Despite this, the Housing Affordability Index did still decline in 2018, due to the median price of a home increasing 8.1 percent, to $290,000.
CONCLUSION & OUTLOOK
36 MOR HOUSING REPORT 2019
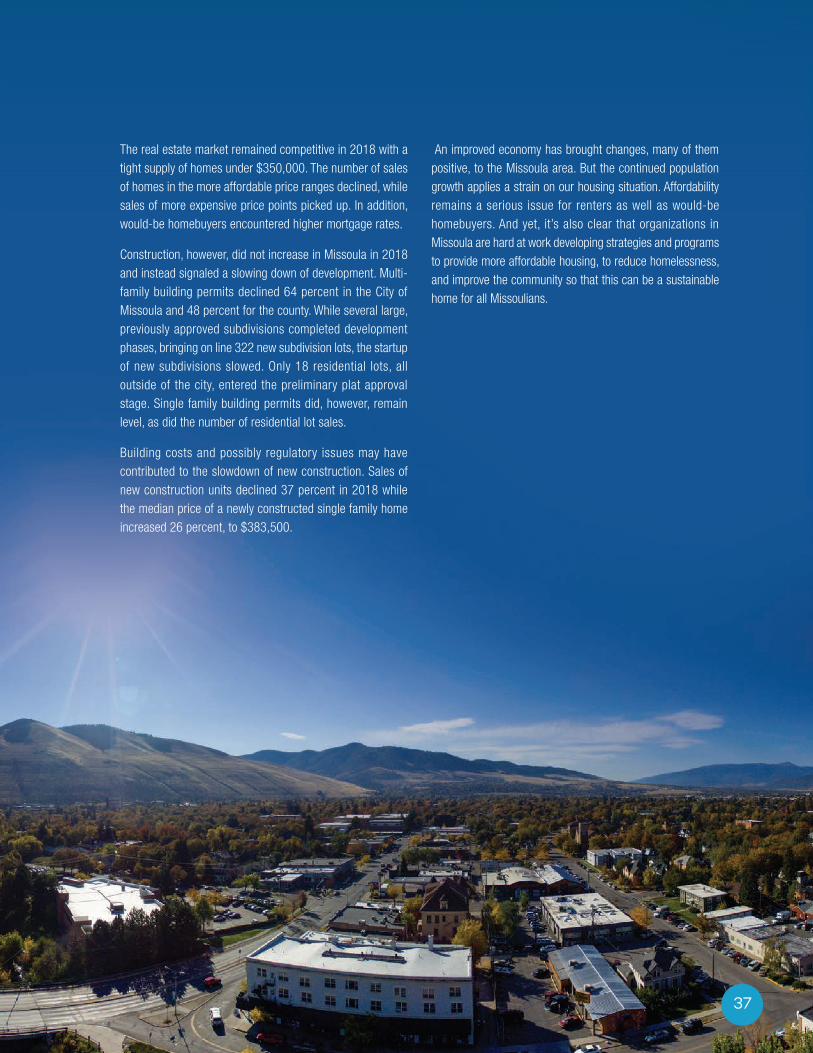
The real estate market remained competitive in 2018 with a tight supply of homes under $350,000. The number of sales of homes in the more affordable price ranges declined, while sales of more expensive price points picked up. In addition, would-be homebuyers encountered higher mortgage rates.
Construction, however, did not increase in Missoula in 2018 and instead signaled a slowing down of development. Multi-family building permits declined 64 percent in the City of Missoula and 48 percent for the county. While several large, previously approved subdivisions completed development phases, bringing on line 322 new subdivision lots, the startup of new subdivisions slowed. Only 18 residential lots, all outside of the city, entered the preliminary plat approval stage. Single family building permits did, however, remain level, as did the number of residential lot sales.
Building costs and possibly regulatory issues may have contributed to the slowdown of new construction. Sales of new construction units declined 37 percent in 2018 while the median price of a newly constructed single family home increased 26 percent, to $383,500.
An improved economy has brought changes, many of them positive, to the Missoula area. But the continued population growth applies a strain on our housing situation. Affordability remains a serious issue for renters as well as would-be homebuyers. And yet, it’s also clear that organizations in Missoula are hard at work developing strategies and programs to provide more affordable housing, to reduce homelessness, and improve the community so that this can be a sustainable home for all Missoulians.
37

a co
seo
| cc
Report Available Online: www.MissoulaRealEstate.com
Under “News & Information”
724 Burlington AveMissoula, Mt 59801
P: 406-728-0560Comments@ MissoulaRealEstate.com
desi
gn +
illu
stra
tion
= jo
anna
yar
dley
| m
y-de
sign
.net