MISSOULA HOUSING REPORT...2020 MISSOULA HOUSING REPORT Released March 2020 A community service...
44
2020 MISSOULA HOUSING REPORT Released March 2020 A community service provided by the Missoula Organization of REALTORS ® current knowledge, common wisdom: growing a missoula to treasure
Transcript of MISSOULA HOUSING REPORT...2020 MISSOULA HOUSING REPORT Released March 2020 A community service...

2020 MISSOULA HOUSING REPORT
Released March 2020A community service provided by
the Missoula Organization of REALTORS®
current knowledge, common wisdom: growing a missoula to treasure
NOTES FOR READING THE REPORT
1 As in past reports, all data sources are publicly available and statistically valid. Our interpretation of the data may lead to judgments that we believe are sound, however, others may disagree. If so, we invite comments ([email protected]) so that we can continue to improve this annual report.
2 Unless otherwise noted, data presented in the text and figures are for the Missoula Urban Area, which includes the City of Missoula, its neighborhoods, and its surrounding urbanized area, defined as: Rattlesnake, Downtown, University, Fairviews, South Hills, Pattee Canyon, Lewis and Clark, Miller Creek, Blue Mountain, Big Flat, Orchard Homes, Mullan Road, Grant Creek, Lolo, Bonner, East Missoula, and Clinton. Data representing all of Missoula County or only the city are noted as such.
3 All data is the most recent available as of February 2020. Most calendar-year data in this report was as of 2019, but 2018 or even 2017 data when more recent figures are not yet available.
4 “Median” is a term used often in this report. A median is the amount at which exactly half of the values or numbers being reported are lower and half are higher. A median can be more or less than an “average,” which is the amount derived by adding all values being reported and dividing by the number of individual values. A median home price, for example, is the price of the one home, among all prices being considered, where half of the other homes are less in price and half are more in price. In many instances, including reports of home prices, a median can be a more accurate representation than an average because the sale prices of a very few expensive houses will significantly raise the average though have little effect on the median.
5 The report uses the terms homes, units, and dwellings. These are data-driven terms. Whether called a home, a unit, or a dwelling, they include all forms of homes, both rentals and owner-occupied.
II MOR housing report 2020
6 Data from the American Community Survey has a margin of error. This margin of error reflects uncertainty involved in the process of creating estimates from a representative sample of the population. Although estimates from the survey data may appear different, the difference sometimes falls within the margin of error and therefore cannot be considered to be statistically significant. The charts with American Community Survey data portray the data in ranges with a lower and upper bound. The mean is the midpoint of the range. Statistical differences are visually apparent when the ranges do not overlap.
7 Research for this report was conducted principally by the Missoula Organization of REALTORS® (MOR). The University of Montana Bureau of Business and Economic Research also contributed to the report and served as a source of this report’s data and information. Other sources were the U.S. Census Bureau, U.S. Department of Housing and Urban Development (HUD), U.S. Office of Federal Housing Finance Agency (OFHFA), Montana Department of Labor and Industry, Missoula Property Management, Professional Property Management, Summit Property Management, Missoula Housing Authority (MHA), Stockman Bank, and Montana Regional MLS®.
8 MLS® refers to the Multiple Listing Service®. In 2016, the Missoula Organization of REALTORS (MOR) switched from the MOR MLS to the Montana Regional MLS. It is a member-based service – administered, operated, and paid for by the REALTOR® members of a local real estate board – that indicates the cooperation among REALTORS® to share information about homes and real estate for sale or rent. Due to the switch, wherever we use Montana Regional MLS data in this year’s report, the numbers may differ slightly from reports from 2016 and earlier.
9 In 2019, we began obtaining rental information data from a new source, Rental Information Resources. Prior to 2019, rental data came from a survey of the National Association of Residential Property Managers (NARPM). Rental Information Resources uses a direct survey of the largest property managers in Missoula: Missoula Property Management, Professional Property Management and Summit Property Management. Thus, keep in mind the different data sources when comparing 2019 rental data to previous years.
III

TABLE OF CONTENTS
NOTES FOR READING THE REPORT II
TABLE OF CONTENTS IV
MESSAGE FROM COORDINATING COMMITTEE 1
Coordinating Committee
EXECUTIVE SUMMARY 2
HOUSING SUPPLY: DEVELOPMENT & OCCUPANCY 4
Lot DevelopmentPace of DevelopmentOccupancy Rates in Missoula
HOUSING DEMAND: POPULATION & INCOME 8
Age DistributionPopulation DynamicsMigrationIncome Trends
RENTAL HOUSING 12
Rental OccupancyRental PricesRental Assistance Programs
HOUSING SALES & PRICES 16
Home Sales in 2019Condominiums & TownhousesNew Construction SalesSales Trends in NeighborhoodsComparative Trends in Home PricesPace of Home Sales
MORTGAGE FINANCE 26
Interest RatesCost of ConstructionOther Financing NewsImpacts of Mortgage InsuranceDown PaymentsForeclosuresHome Ownership Programs
HOUSING AFFORDABILITY 32
The Housing Affordability IndexShare of Income Spent on HousingUnemploymentPovertyHomelessness
CONCLUSION & OUTLOOK 38IV MOR housing report 2020
s w
eave
r

b k
ilgus
t |
cc fl
ickr
MESSAGE FROM COORDINATING COMMITTEE
We are pleased to present the “2020 Missoula Housing Report.” Our intention is to provide a comprehensive, credible, and
neutral picture of Missoula housing that can be used as a tool by community members, businesses, nonprofits, and policy makers as they seek to serve Missoula’s needs.
We think these pages reveal a number of opportunities and challenges for our community. When read comprehensively, we hope the data provides a more complete picture of our community, from affordability challenges to demographics, improvements over the years, and issues requiring our attention in the years to come.
This is the fifteenth annual report on housing in the city and county of Missoula, and the content has evolved based on trends, available information, and feedback from readers like you.
Please let us know your thoughts on this report and how we might improve it.
If, after reading this report, you are interested in getting involved in meeting the housing needs of our community, please contact any of the public or private agencies engaged in local housing mentioned in this report. Addit ional housing resources are listed on the Missoula Organization of REALTORS® website at (www.MissoulaRealEstate.com).
Coordinating Committee Brint Wahlberg Windermere Real Estate
Jim McGrath Missoula Housing Authority
Paul Burow Professional Property Management
Karissa Trujillo Homeword
Paul Forsting IMEG / Territorial Landworks, Inc.
Vicki Corwin Stewart Title
Lynn Stenerson Stockman Bank
Brandon Bridge University of Montana Bureau of Business & Economic Research
Jim Bachand Missoula Organization of REALTORS®
Dwight Easton Missoula Organization of REALTORS®
We invite your comments: [email protected]
1

d fo
ltz |
cc fl
ickr
EXECUTIVE SUMMARY
Housing Development & Occupancy
A limited supply of real estate listings, low rental vacancy rates and limited new development
(459 units total, a six-year low) in the City of Missoula is resulting in a continued trend of increased real estate prices.
Single-family construction projects in the City of Missoula grew in 2019, consistent with the last 10 years. However, building permits for duplexes declined and multi-family construction accounted for 197 units, similar to 2018 but 58% of the 5-year average. Missoula County permits increased slightly, accounting for 228 new units total.
The number of residential lots sold in the Missoula urban area declined 16 percent in 2019. The median price of those lots jumped 28.3 percent to $115,500, matching a trend of new construction homes moving into higher price categories.
Looking at future development, 45 new residential lots received preliminary approval in both the city and county in 2019. Meanwhile 104 residential lots attained final plat approvals, making them ready for building in the coming year.
In Missoula County, approximately 58 percent of housing units are occupied by their owners. Within the city limits of Missoula, 53 percent of homes (or units) are renter occupied.
Population & Income
M issoula County’s population growth rose 1.1 percent in 2018, adding another 1,350 residents.
In the last decade, this steady annual increase has resulted in 10,074 more people living in the area. Even with new construction, population growth puts pressure on the already constrained supply of rentals and real estate.
Unemployment hit a 20-year low of 3.1 percent in 2019. Missoula’s median income has improved considerably in the last two years of available data, reaching $56,598 in 2018.
With both rental and home prices seeing increases in 2019, home availability and affordability remains a considerable challenge for many in Missoula. A large gap exists between the median income of homeowners and that of renters, concurrently homes Missoulians can afford are becoming increasingly limited.
The most recent figures on poverty indicate that 13 percent of Missoula County residents live in poverty. During a single point-in-time survey of individuals experiencing homelessness, Missoula counted 367 on a single January night. Meanwhile, Missoula County Public Schools identified 419 children who had unstable housing (either experiencing homelessness or at risk of being homeless) during the 2018-19 school year.
2 MOR housing report 2020
Rental Housing
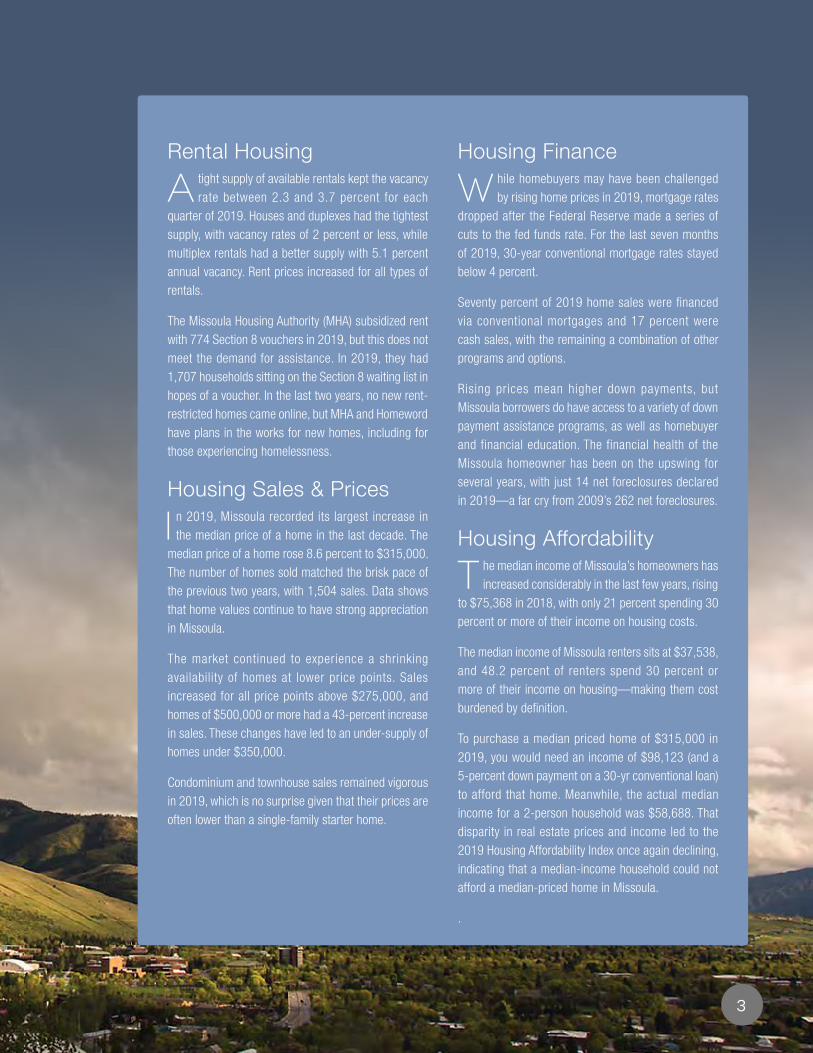
A tight supply of available rentals kept the vacancy rate between 2.3 and 3.7 percent for each
quarter of 2019. Houses and duplexes had the tightest supply, with vacancy rates of 2 percent or less, while multiplex rentals had a better supply with 5.1 percent annual vacancy. Rent prices increased for all types of rentals.
The Missoula Housing Authority (MHA) subsidized rent with 774 Section 8 vouchers in 2019, but this does not meet the demand for assistance. In 2019, they had 1,707 households sitting on the Section 8 waiting list in hopes of a voucher. In the last two years, no new rent-restricted homes came online, but MHA and Homeword have plans in the works for new homes, including for those experiencing homelessness.
Housing Sales & Prices
I n 2019, Missoula recorded its largest increase in the median price of a home in the last decade. The
median price of a home rose 8.6 percent to $315,000. The number of homes sold matched the brisk pace of the previous two years, with 1,504 sales. Data shows that home values continue to have strong appreciation in Missoula.
The market continued to experience a shrinking availability of homes at lower price points. Sales increased for all price points above $275,000, and homes of $500,000 or more had a 43-percent increase in sales. These changes have led to an under-supply of homes under $350,000.
Condominium and townhouse sales remained vigorous in 2019, which is no surprise given that their prices are often lower than a single-family starter home.
Housing Finance
W hile homebuyers may have been challenged by rising home prices in 2019, mortgage rates
dropped after the Federal Reserve made a series of cuts to the fed funds rate. For the last seven months of 2019, 30-year conventional mortgage rates stayed below 4 percent.
Seventy percent of 2019 home sales were financed via conventional mortgages and 17 percent were cash sales, with the remaining a combination of other programs and options.
Rising prices mean higher down payments, but Missoula borrowers do have access to a variety of down payment assistance programs, as well as homebuyer and financial education. The financial health of the Missoula homeowner has been on the upswing for several years, with just 14 net foreclosures declared in 2019—a far cry from 2009’s 262 net foreclosures.
Housing Affordability
T he median income of Missoula’s homeowners has increased considerably in the last few years, rising
to $75,368 in 2018, with only 21 percent spending 30 percent or more of their income on housing costs.
The median income of Missoula renters sits at $37,538, and 48.2 percent of renters spend 30 percent or more of their income on housing—making them cost burdened by definition.
To purchase a median priced home of $315,000 in 2019, you would need an income of $98,123 (and a 5-percent down payment on a 30-yr conventional loan) to afford that home. Meanwhile, the actual median income for a 2-person household was $58,688. That disparity in real estate prices and income led to the 2019 Housing Affordability Index once again declining, indicating that a median-income household could not afford a median-priced home in Missoula.
.
3

HOUSING SUPPLY: DEVELOPMENT & OCCUPANCY
LOT DEVELOPMENT
Residential lot sales in the Missoula urban area declined 16 percent in 2019 (TABLE 1, FIGURE
1). However, the median price of those lots jumped 28.3 percent (FIGURE 2). This coincides with a trend of more new housing starts being higher-priced homes.
TABLE 1: Fewer residential lots were sold in 2019 compared to 2018. After several years of price stability, the median price of a lot jumped 28.3 percent.
FIGURE 1: The number of residential lots sold declined in 2019 but still outpaced lot sales from 2010 to 2015.
FIGURE 2: The median price of a residential lot in Missoula increased 28 percent, to $115,500 in 2019.
4 MOR housing report 2020
0
45
90
135
180
Number of Residential Lots Sold
Source: Montana Regional MLSFIGURE 1
2019201820172016201520142013201220112010
$0
$30,000
$60,000
$90,000
$120,000
Median Price of Residential Lots Sold
Source: Montana Regional MLSFIGURE 2
2019201820172016201520142013201220112010
Residential Lot Sales
Year Lot Sales % Change Median Price % Change
2010 33 -8.3% $86,000 21.0%
2011 33 0.0% $92,000 6.5%
2012 47 29.8% $55,000 -67.3%
2013 83 43.4% $75,000 26.7%
2014 89 6.7% $85,000 11.8%
2015 133 33.1% $85,500 0.6%
2016 175 24.0% $85,000 -0.6%
2017 169 -3.6% $92,500 8.1%
2018 169 0.0% $90,000 -2.7%
2019 142 -16.0% $115,000 28.3%
TABLE 1 Source: Montana Regional MLS

PACE OF DEVELOPMENT
s ingle-family construction projects in the City of Missoula continued to increase in 2019, as they
have each year for the last 10 years, whereas the pace of development for duplex and multi-family projects has slowed. The 197 permits for multi-family unit development projects within the city in 2019 was similar those issued in 2018, significantly down from the 2016 and 2017 totals, and approximately 58% of the five-year average. (FIGURE 3). Duplex permits fell to just six. The total number of single-family homes constructed within the city limits in 2019 was 256. Overall, when compared to the previous year, the city experienced a decline of four residential units permitted in 2019.
Missoula County total permits were up in 2019. Again, it was the single-family units that increased (up 14.8 percent), while duplexes had a significant drop and multi-family units displayed their typical erratic behavior. The total number of residential units permitted within the county rose by 15 units in 2019 with a year-end total of 228 units (FIGURE 4).
FIGURE 3: The City of Missoula issued 197 permits for multi-family unit development projects in 2019, on par with 2018. Significantly down from 2016 and 2017 totals.
FIGURE 4: In Missoula County, single-family unit permits increased nearly 15 percent while duplexes experienced a significant drop.
TABLE 5: A total of 111 townhome exemption development units were permitted in the City of Missoula in 2019.
5
0
100
200
300
400
500
600
700
800
single family
duplex
multi family
201920162015 20182017
City of Missoula Residential Building Permits
Source: City of Missoula Development ServicesFIGURE 3
0
75
150
225
300
201720162015 20192018
single family
duplex
multi family
Missoula County Residential Building Permits
Source: Missoula County Public Works - Building DivisionFIGURE 4
Townhome Exemption Development Residential Units Permitted
2014 2015 2016 2017 2018 2019
City of Missoula 33 165 60 99 96 111
Missoula County 30 3
TABLE 2 Source: Missoula County and City of Missoula
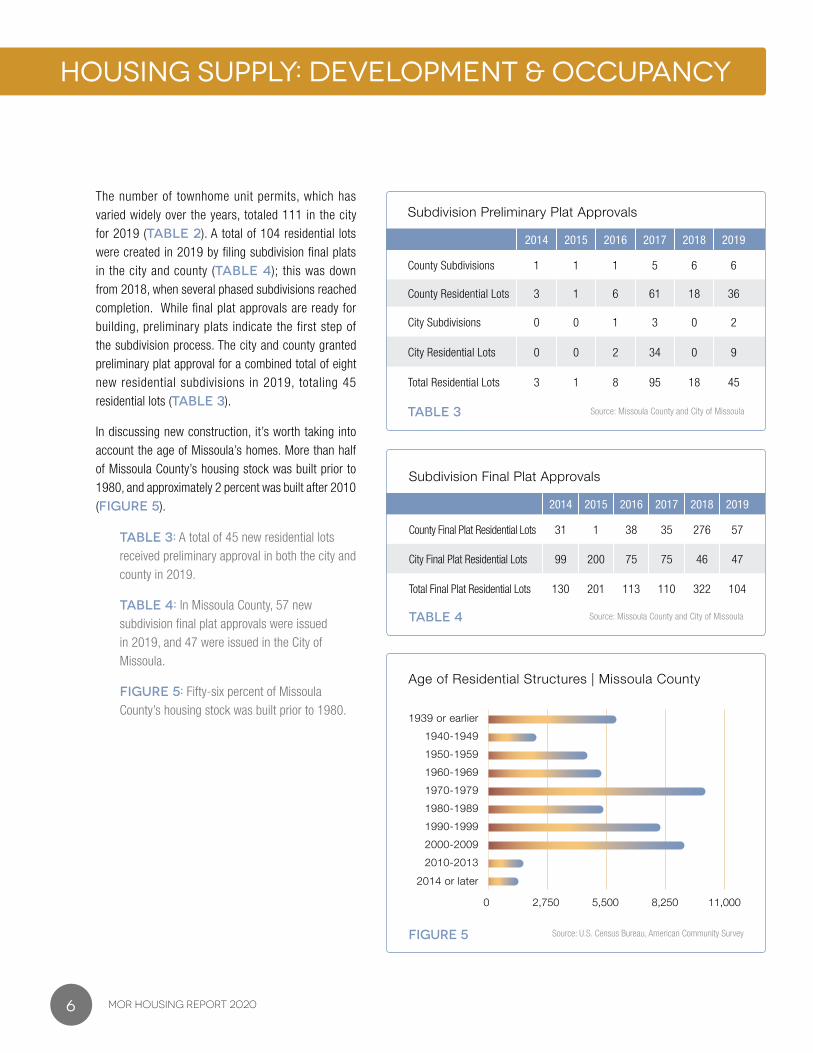
The number of townhome unit permits, which has varied widely over the years, totaled 111 in the city for 2019 (TABLE 2). A total of 104 residential lots were created in 2019 by filing subdivision final plats in the city and county (TABLE 4); this was down from 2018, when several phased subdivisions reached completion. While final plat approvals are ready for building, preliminary plats indicate the first step of the subdivision process. The city and county granted preliminary plat approval for a combined total of eight new residential subdivisions in 2019, totaling 45 residential lots (TABLE 3).
In discussing new construction, it’s worth taking into account the age of Missoula’s homes. More than half of Missoula County’s housing stock was built prior to 1980, and approximately 2 percent was built after 2010 (FIGURE 5).
TABLE 3: A total of 45 new residential lots received preliminary approval in both the city and county in 2019.
TABLE 4: In Missoula County, 57 new subdivision final plat approvals were issued in 2019, and 47 were issued in the City of Missoula.
FIGURE 5: Fifty-six percent of Missoula County’s housing stock was built prior to 1980.
HOUSING SUPPLY: DEVELOPMENT & OCCUPANCY
6 MOR housing report 2020
Subdivision Preliminary Plat Approvals
2014 2015 2016 2017 2018 2019
County Subdivisions 1 1 1 5 6 6
County Residential Lots 3 1 6 61 18 36
City Subdivisions 0 0 1 3 0 2
City Residential Lots 0 0 2 34 0 9
Total Residential Lots 3 1 8 95 18 45
TABLE 3 Source: Missoula County and City of Missoula
Subdivision Final Plat Approvals
2014 2015 2016 2017 2018 2019
County Final Plat Residential Lots 31 1 38 35 276 57
City Final Plat Residential Lots 99 200 75 75 46 47
Total Final Plat Residential Lots 130 201 113 110 322 104
TABLE 4 Source: Missoula County and City of Missoula
0 11,0008,2505,5002,750
1940-1949
1950-1959
1960-1969
1970-1979
1980-1989
1990-1999
2000-2009
2010-2013
2014 or later
1939 or earlier
Age of Residential Structures | Missoula County
Source: U.S. Census Bureau, American Community SurveyFIGURE 5
OCCUPANCY RATES IN MISSOULA
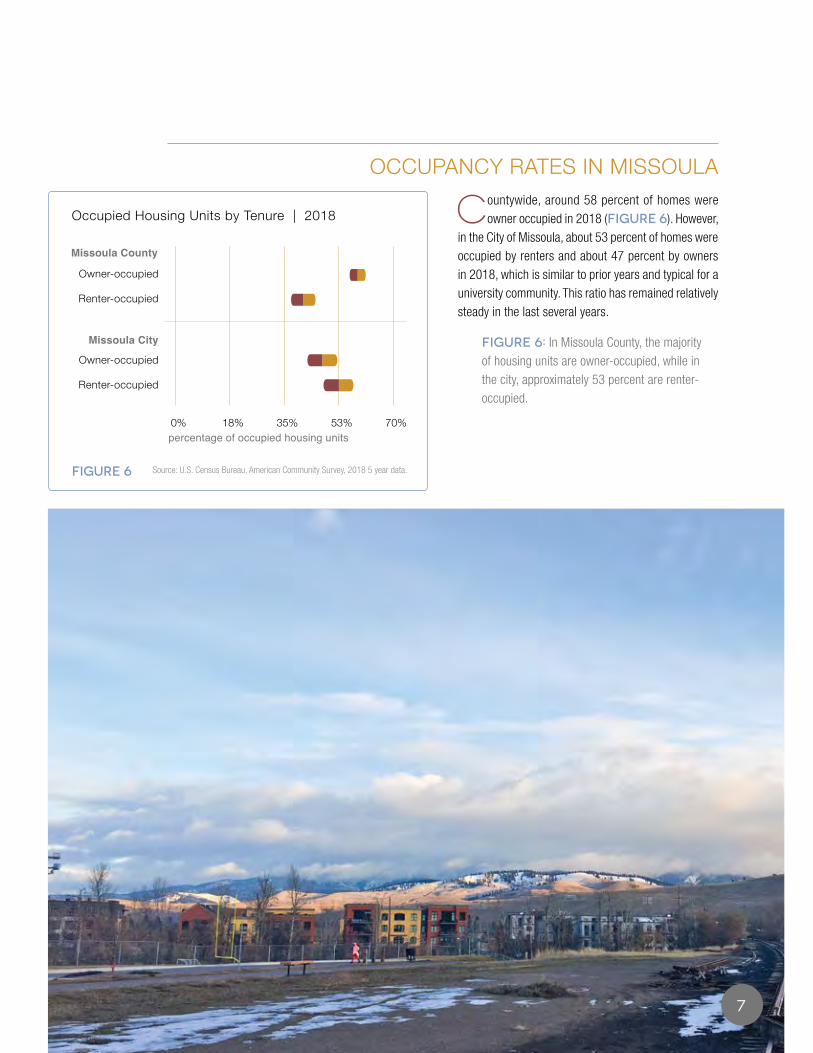
Countywide, around 58 percent of homes were owner occupied in 2018 (FIGURE 6). However,
in the City of Missoula, about 53 percent of homes were occupied by renters and about 47 percent by owners in 2018, which is similar to prior years and typical for a university community. This ratio has remained relatively steady in the last several years.
FIGURE 6: In Missoula County, the majority of housing units are owner-occupied, while in the city, approximately 53 percent are renter-occupied.
7
0% 18% 35% 53% 70%
Renter-occupied
Owner-occupied
Renter-occupied
Owner-occupied
Missoula County
Missoula City
percentage of occupied housing units
Occupied Housing Units by Tenure | 2018
Source: U.S. Census Bureau, American Community Survey, 2018 5 year data.FIGURE 6

AGE DISTRIBUTION
The age distribution of Missoula County has remained nearly identical over the past several
years. Residents ages 20 to 24 make up the largest age demographic (FIGURE 7), according to the most recent American Community Survey data. Keep in mind that data from the American Community Survey is from 2018 and is a year behind some of our other figures on home sales and rentals.
FIGURE 7: University-age students account for the largest age demographic in Missoula County.
POPULATION DYNAMICS
The population of Missoula County continued its steady increase, adding another 1,350 residents
in 2018. The 1.1 percent increase from 2017 to 2018 brought the total population to 118,791 (FIGURE 8). This rate of increase is nearly identical to the previous year.
From 2009 to 2018, the total population increased by 10,074 people, or 9.27 percent, a number that has a significant impact on Missoula’s housing market. For comparison, Montana’s population grew by 8 percent in the last nine years, and all of Gallatin County, home to the Bozeman market, increased by 22,225 residents in the last eight years, a 24 percent increase. Meanwhile, the average growth for U.S. counties between 2010 and 2018 was about 1 percent.
Most of Missoula’s growth has occurred within the City of Missoula, which added 8,065 residents (up 12.15 percent) during the last decade. Unincorporated Missoula County increased by 2,009 people (or 4.74 percent) in the last decade.
FIGURE 8: Missoula’s population continues to increase by about 1 percent each year, with most of that growth occurring within the city limits of Missoula.
HOUSING DEMAND: POPULATION & INCOME
8 MOR housing report 2020
0% 6%3%3% 9%6% 12%9%12% 0%
men women
Source: U.S. Census Bureau, American Community Survey
Population Pyramid | Missoula County 2018
FIGURE 7
5-910-1415-1920-2425-2930-3435-3940-4445-4950-55
60-6455-59
65-6970-7475-7980-8485+
under 5
0
30,000
60,000
90,000
120,000
2016 2017201320112009 2010 2014 20152012 2018
Missoula City Unicorporated Missoula County
Population | Missoula County
Source: U.S. Census Bureau, UM Bureau of Business & Economic ResearchFIGURE 8

MIGRATION
Three factors influence population change: birth, death and net migration. Net migration factors in
the number of individuals moving to the area, as well as those leaving. Typically, more people move to Missoula than move away, giving it a positive net migration. For the second year in a row net migration declined in Missoula County (FIGURE 9). In 2018, the net migration was 1,150 people, compared to 1,758 in 2016. The natural increase in population (births versus deaths) in 2018 was 200, a new low when looking at the natural increase as far back as 1991.
Most new Missoula residents come from the western U.S. (FIGURE 11).The best data available comes from an analysis of 2017-18 tax returns. While tax returns are not a perfect surrogate for number of households or persons, they nevertheless shed light on the relative proportions of where people come from when they move to Missoula County. Data indicate 58 percent of people moving into Missoula are coming from out-of state. A total of 2,566 reported they came from somewhere else in Montana (FIGURE 10).
FIGURE 9: In 2018, when comparing the number of people who moved to Missoula versus those who moved away, there was a net migration (or total gain) of 1,150. Missoula had a natural increase of 200 individuals via births and deaths in that year.
FIGURE 10: Most people moving to Missoula came from outside of Montana.
FIGURE 11: Of those moving to Montana from a different state, 62 percent came from the western U.S.
9
2,2002,0001,8001,6001,4001,2001,000
800600400200
0
2016 20172015201420132012201120102009 2018
natural increase
net migration
Components Of Population Change | Missoula County
FIGURE 9 Source: U.S. Census Bureau,UM Bureau of Business and Economic Research
In-Migration to Missoula County
FIGURE 10
0
2250
4500
6750
9000
2016-17 2017-182015-162014-152013-14
from another statefrom within Montanafrom outside the United States
Source: Internal Revenue Service
0
750
3,000
2,250
1,500
Source: Internal Revenue ServiceFIGURE 11
In-Migration to Missoula County by Region of United States | 2018
SouthMidwestNortheast West

INCOME TRENDS
From 2016 to 2017, the estimated median income for all households in Missoula County underwent
considerable change, increasing 17 percent. The most recent figures show 2018 median income increasing 4.2 percent, to $56,598 (FIGURE 12). This puts the median income in Missoula on par with Montana as a whole, but below the U.S. median income of $61,937 for all households.
However, when looking at the housing market, we gain a useful perspective by considering the median income of homeowners versus renters. The 17 percent increase in median income for all households reported in 2017 was entirely due to an increase in the median income of homeowners. Renters did not experience an increase in 2017, and the income gap between these two groups widened. In 2018 (the most recent data available), Missoula renters seemed to make up ground, earning an average median income of $37,538, up 26 percent. The median income of homeowners showed a slight decline from $75,940 in 2017 to $75,363 in 2018. (However, the margin of error on this particular data set is large, as explained in Reading Note #6.)
For a detailed picture of how median income is related to household size and housing affordability, see the Housing Affordability Index (FIGURE 38).
FIGURE 12: Homeowners in Missoula County had a median income of $75,368 in 2018. Renters median income is $37,538.
HOUSING DEMAND: POPULATION & INCOME
10 MOR housing report 2020
$10,000
$30,000
$50,000
$70,000
$90,000
All Households Homeowners Renters
Missoula County Montana United States
Median Income | 2018
Source: U.S. Census Bureau, American Community SurveyFIGURE 12

j yar
dle
y 11

RENTAL OCCUPANCY
M issoula is no stranger to low vacancy rates in the rental market. After a 0.9 percent increase in the
vacancy rates in 2018, rates dropped again in 2019, landing at 3.1 percent (FIGURE 13). Historically, these vacancy rates vary between quarters, sometimes dramatically, as one might expect in a university town. However, in 2019 the vacancy rate in Missoula remained between 2.3 and 3.7 percent for each quarter (FIGURE 14). A month-by-month view of vacancy rates for two-bedroom multiplexes showed a high of 7 percent in June and a low of 1 percent in October (FIGURE 15).
Likely thanks to the recent addit ions of newly constructed multi-family units, the vacancy rates did increase for all multiplex rental types in 2019, with an annual vacancy rate of 5.1 percent, which is considered a good rental supply. Houses and duplexes had much lower vacancy rates of 2 percent or less (FIGURE 16); there is little new construction of homes and duplexes for the rental market.
FIGURE 13: Rental vacancy rates in Missoula dropped slightly in 2019, with an average of 3.1 percent vacancy.
FIGURE 14: Rental vacancies remained fairly consistent for each quarter of 2019.
FIGURE 15: In 2019, unlike other years, the availability of two-bedroom multiplex units peaked in June.
RENTAL HOUSING
12 MOR housing report 2020
0%
1%
2%
3%
4%
5%
FIGURE 13
2.9% 3.0%
3.9%
3.1%
4.1%
Source: Rental Information Resources
Annual Rental Vacancy Rates
2019201820172015 2016
0%
2%
4%
3%
1%
5%
6%
7%
Rental Vacancy Rates by Quarter
Source: Rental Information ResourcesFIGURE 14
Quarter 4Quarter 3Quarter 2Quarter 1
2017
2018
2019

SHORT-TERM RENTAL MARKETWe are often asked how the vacation rental market has impacted housing availability. The City of Missoula reports that there are currently 116 approved vacation rental units (these include both single-family homes and apartments). Those who rent rooms in their house or who rent outside of the city limits do not need to be registered. However, there is no historical data to see how registered short-term rentals compare to previous years, and this also does not take into account short-term rentals that have not gone through proper registration with the city.
Thus, with no history, we do not have a sense of how these numbers are trending yet.
RENTAL PRICES
Rent prices increased in every single category in 2019 (FIGURE 16). The largest increases
came from single-family houses, where, for example, a 3-bedroom home averaged $1,366 per month, an increase of 20 percent from 2018. The average rent for one- and two-bedroom apartments in a multiplex also saw significant changes in rent from 2018 to 2019. A one-bedroom apartment went from $581 to $756 and two bedrooms went from $729 to $893.
In 2019, there was a change from anonymously reported numbers from the National Association of Residential Property Managers (NARPM) to a direct survey of the largest property managers in Missoula. In addition to the two different data sources, it appears the new inventory of rental housing coming onto the market have a base rental price above Missoula’s historic prices. Most property managers report existing rents increased only 0 to 5 percent. There are many factors at work here, including the replacement of aging rental
13
2017
2018
2019
0%
2%
4%
6%
8%
10%
DecNovOctSepAugJulJunMayAprMarFebJan
FIGURE 15
Rental Vacancy Rates by MonthTwo-Bedroom Multiplexes
Source: Rental Information Resources
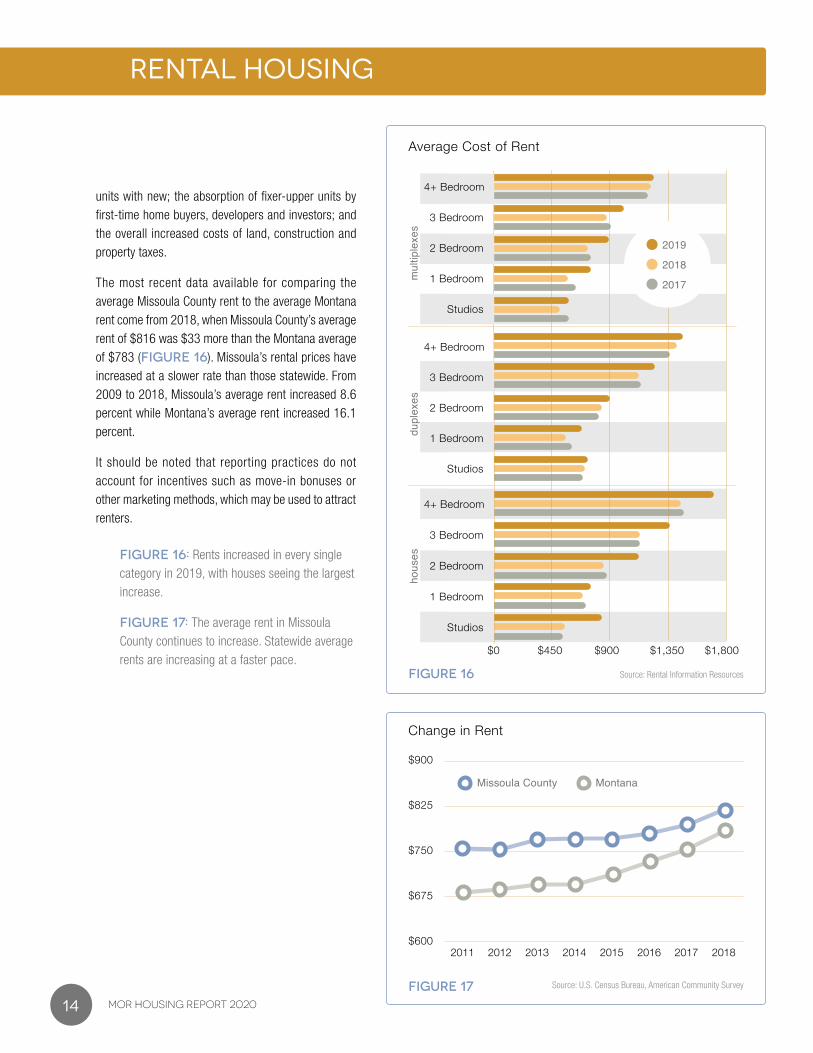
units with new; the absorption of fixer-upper units by first-time home buyers, developers and investors; and the overall increased costs of land, construction and property taxes.
The most recent data available for comparing the average Missoula County rent to the average Montana rent come from 2018, when Missoula County’s average rent of $816 was $33 more than the Montana average of $783 (FIGURE 16). Missoula’s rental prices have increased at a slower rate than those statewide. From 2009 to 2018, Missoula’s average rent increased 8.6 percent while Montana’s average rent increased 16.1 percent.
It should be noted that reporting practices do not account for incentives such as move-in bonuses or other marketing methods, which may be used to attract renters.
FIGURE 16: Rents increased in every single category in 2019, with houses seeing the largest increase.
FIGURE 17: The average rent in Missoula County continues to increase. Statewide average rents are increasing at a faster pace.
RENTAL HOUSING
14 MOR housing report 2020
hous
esdu
plex
esm
ultip
lexe
s
4+ Bedroom
2 Bedroom
1 Bedroom
Studios
3 Bedroom
4+ Bedroom
2 Bedroom
1 Bedroom
Studios
3 Bedroom
4+ Bedroom
2 Bedroom
1 Bedroom
Studios
3 Bedroom
$0 $450 $900 $1,350 $1,800
2019
2018
2017
Average Cost of Rent
Source: Rental Information ResourcesFIGURE 16
201620152014201320122011 2017 2018$600
$675
$750
$825
$900
Missoula County
Change in Rent
Source: U.S. Census Bureau, American Community SurveyFIGURE 17
Montana
RENTAL ASSISTANCE PROGRAMS
Housing choice vouchers make private-market housing affordable for low-income families and
individuals by paying a portion of the family’s rent. The Missoula Housing Authority (MHA) has 774 available Section 8 vouchers that subsidize rent to private landlords for eligible participants, helping to make private-market housing affordable for low-income families and individuals. The Montana Department of Commerce provides another 262 vouchers. Federal funding remained sufficient in 2019 to support all available Section 8 vouchers.
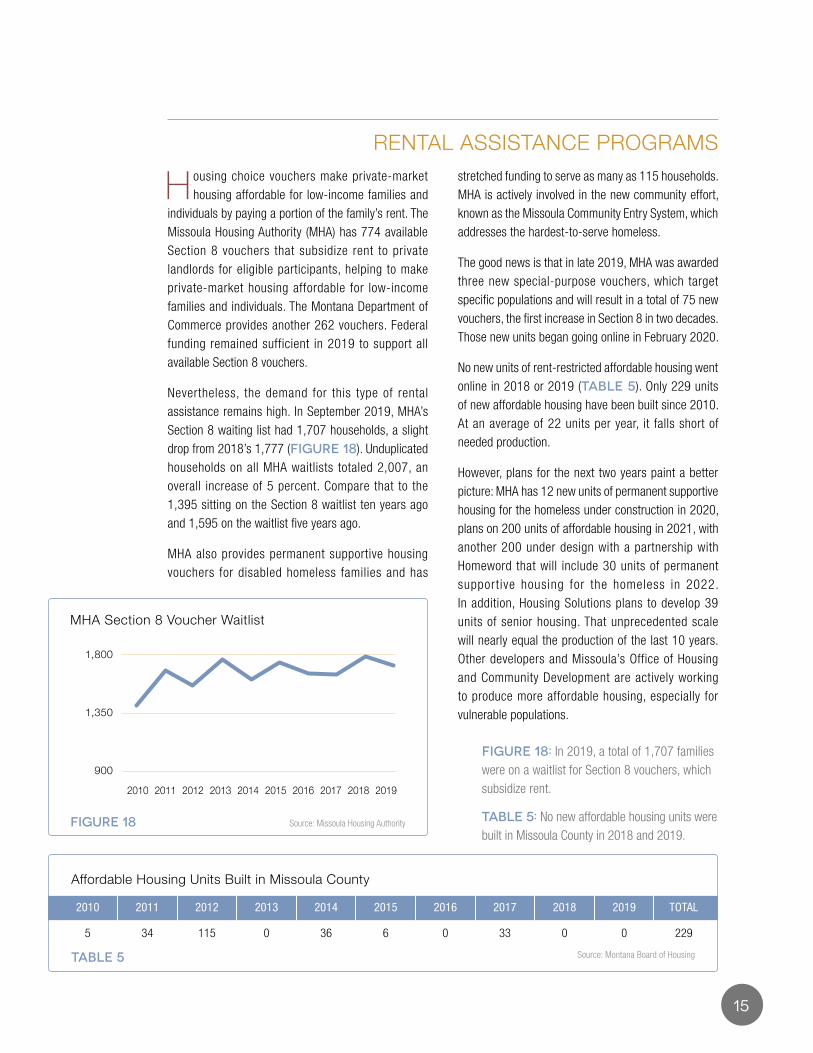
Nevertheless, the demand for this type of rental assistance remains high. In September 2019, MHA’s Section 8 waiting list had 1,707 households, a slight drop from 2018’s 1,777 (FIGURE 18). Unduplicated households on all MHA waitlists totaled 2,007, an overall increase of 5 percent. Compare that to the 1,395 sitting on the Section 8 waitlist ten years ago and 1,595 on the waitlist five years ago.
MHA also provides permanent supportive housing vouchers for disabled homeless families and has
stretched funding to serve as many as 115 households. MHA is actively involved in the new community effort, known as the Missoula Community Entry System, which addresses the hardest-to-serve homeless.
The good news is that in late 2019, MHA was awarded three new special-purpose vouchers, which target specific populations and will result in a total of 75 new vouchers, the first increase in Section 8 in two decades. Those new units began going online in February 2020.
No new units of rent-restricted affordable housing went online in 2018 or 2019 (TABLE 5). Only 229 units of new affordable housing have been built since 2010. At an average of 22 units per year, it falls short of needed production.
However, plans for the next two years paint a better picture: MHA has 12 new units of permanent supportive housing for the homeless under construction in 2020, plans on 200 units of affordable housing in 2021, with another 200 under design with a partnership with Homeword that will include 30 units of permanent supportive housing for the homeless in 2022. In addition, Housing Solutions plans to develop 39 units of senior housing. That unprecedented scale will nearly equal the production of the last 10 years. Other developers and Missoula’s Office of Housing and Community Development are actively working to produce more affordable housing, especially for vulnerable populations.
FIGURE 18: In 2019, a total of 1,707 families were on a waitlist for Section 8 vouchers, which subsidize rent.
TABLE 5: No new affordable housing units were built in Missoula County in 2018 and 2019.
15
Affordable Housing Units Built in Missoula County
2010 2011 2012 2013 2014 2015 2016 2017 2018 2019 TOTAL
5 34 115 0 36 6 0 33 0 0 229
TABLE 5 Source: Montana Board of Housing
1,350
900
1,800
201220112010 2013 2014 201720162015 2018 2019
MHA Section 8 Voucher Waitlist
FIGURE 18 Source: Missoula Housing Authority
HOUSING SALES & PRICES
HOME SALES IN 2019
The Missoula real estate market completed another year of rising prices mixed with a limited supply
on the market.
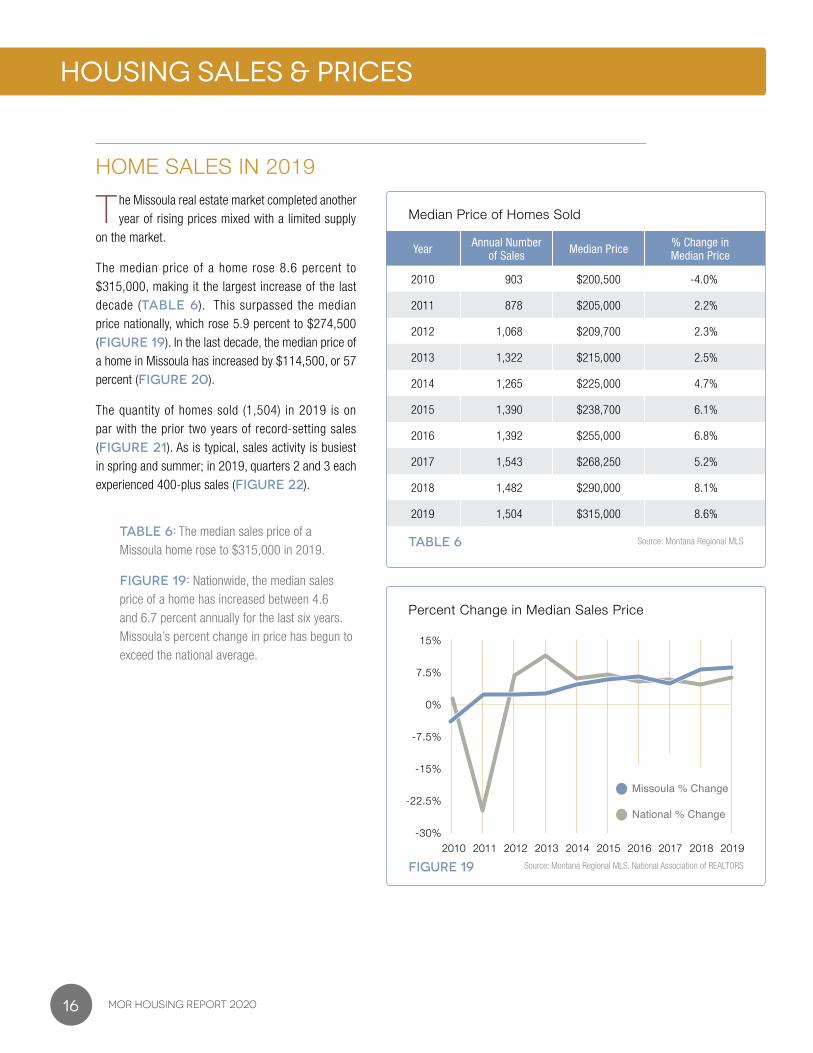
The median price of a home rose 8.6 percent to $315,000, making it the largest increase of the last decade (TABLE 6). This surpassed the median price nationally, which rose 5.9 percent to $274,500 (FIGURE 19). In the last decade, the median price of a home in Missoula has increased by $114,500, or 57 percent (FIGURE 20).
The quantity of homes sold (1,504) in 2019 is on par with the prior two years of record-setting sales (FIGURE 21). As is typical, sales activity is busiest in spring and summer; in 2019, quarters 2 and 3 each experienced 400-plus sales (FIGURE 22).
TABLE 6: The median sales price of a Missoula home rose to $315,000 in 2019.
FIGURE 19: Nationwide, the median sales price of a home has increased between 4.6 and 6.7 percent annually for the last six years.Missoula’s percent change in price has begun to exceed the national average.
16 MOR housing report 2020
Median Price of Homes Sold
Year Annual Number of Sales Median Price % Change in
Median Price
2010 903 $200,500 -4.0%
2011 878 $205,000 2.2%
2012 1,068 $209,700 2.3%
2013 1,322 $215,000 2.5%
2014 1,265 $225,000 4.7%
2015 1,390 $238,700 6.1%
2016 1,392 $255,000 6.8%
2017 1,543 $268,250 5.2%
2018 1,482 $290,000 8.1%
2019 1,504 $315,000 8.6%
TABLE 6 Source: Montana Regional MLS
-30%
-22.5%
-15%
-7.5%
0%
7.5%
15%
Missoula % Change
National % Change
Percent Change in Median Sales Price
Source: Montana Regional MLS, National Association of REALTORSFIGURE 192016201520142013201220112010 20192017 2018
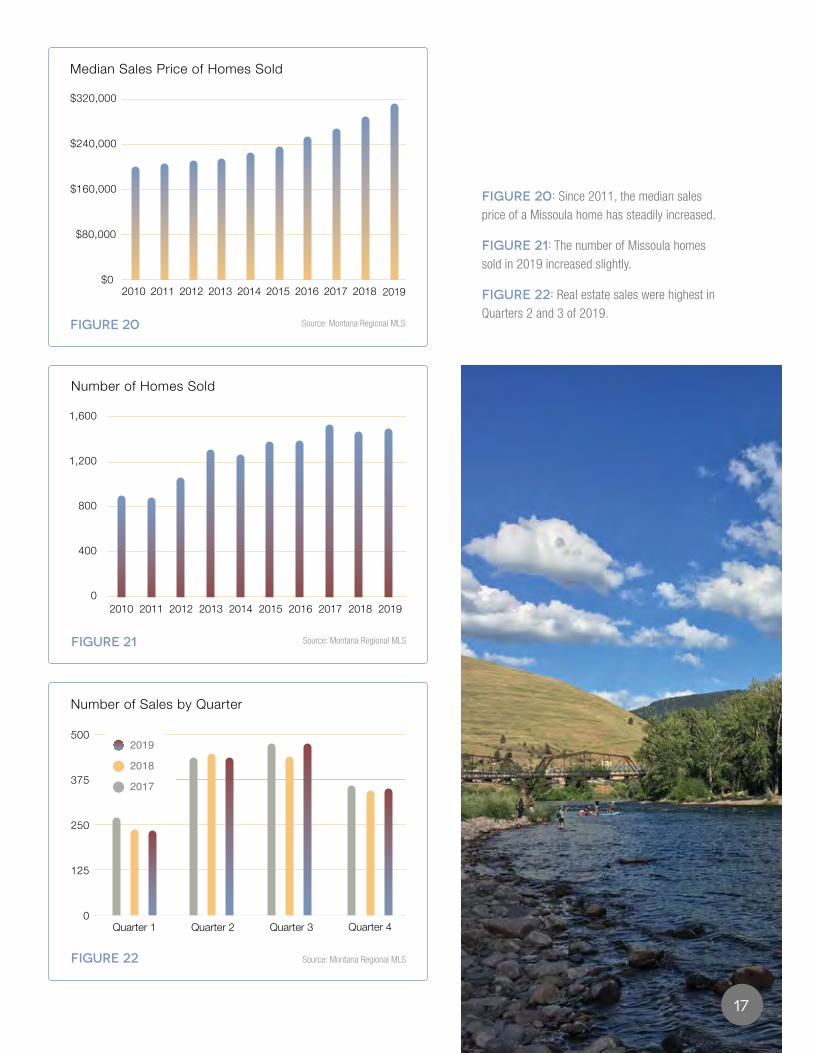
FIGURE 20: Since 2011, the median sales price of a Missoula home has steadily increased.
FIGURE 21: The number of Missoula homes sold in 2019 increased slightly.
FIGURE 22: Real estate sales were highest in Quarters 2 and 3 of 2019.
17
$0
$80,000
$160,000
$240,000
$320,000
Median Sales Price of Homes Sold
Source: Montana Regional MLSFIGURE 20
201520142013201220112010 201920182016 2017
Number of Sales by Quarter
Source: Montana Regional MLSFIGURE 22
Quarter 4Quarter 3Quarter 2Quarter 10
125
0
250
375
500
2017
2018
2019
0
800
400
1,200
1,600
Number of Homes Sold
Source: Montana Regional MLSFIGURE 21
2016201520142013201220112010 20192017 2018

j yar
dle
y
With a tight supply of listings, heated competition between buyers drives up final sales prices. For the last five years, homes have sold at an average of 98 percent of their original listing price. In 2019, they sold at 98.4 percent of their listing price (FIGURE 23).
If you breakout the number of sales by price range, a clear picture of Missoula’s squeezed real estate market and shortage of affordable homes emerges. Sales of homes under $200,000 have been shrinking since 2014 (TABLE 7). Meanwhile, the $200,001 to $275,000 price point peaked in 2017, with 604 sales that year, and it has spent the last two years steadily dropping (FIGURE 24). In 2019, sales of all homes below $275,000 fell 19 percent. Meanwhile, we saw a surge in the sales of higher priced homes. Sixty-five percent of 2019 sales were above $275,000 (FIGURE 25).
Homes over $500,000 have historically made up a small part of the Missoula market, but that’s changing. Homes in that category experienced a 43% increase in sales, and if you look at “Pace of Home Sales (page 25)” you’ll see that the absorption rate of that segment is much lower than in years past.
FIGURE 23: Homes sold at an average of 98.4 percent of their list price in 2019.
TABLE 7: The number of sales increased for all price points above $275,000 in 2019.
HOUSING SALES & PRICES
18 MOR housing report 2020
Number of Sales According to Price Point
PRICE RANGE 2010 2011 2012 2013 2014 2015 2016 2017 2018 2019
$0-$150K 131 174 188 196 156 145 110 82 58 57
$150,001-$200K 323 251 295 387 317 276 232 172 107 90
$200,001-$275K 247 258 304 406 414 513 470 604 484 379
$275,001-$350K 120 112 160 186 196 244 300 328 366 411
$350,001-$425K 42 49 57 79 89 104 148 178 220 255
$425,001-$500K 40 33 64 68 93 108 132 80 122 133
$500,001-$750K 13 18 33 28 37 36 49 83 113 150
$750,001+ 3 2 5 6 7 11 12 16 12 29
total 903 877 1,068 1,322 1,265 1,390 1,392 1,543 1,482 1,504
TABLE 7 Source: Montana Regional MLS
94%
95%
96%
97%
98%
99%
2016201520142013201220112010 20192017 2018
Original List to Final Sales Price
Source: Montana Regional MLSFIGURE 23

Buyers paying cash have a competitive advantage over buyers using other methods of purchase, particularly Federal Housing Administration (FHA), Veterans’ Affairs (VA) and Rural Development loans, as these loans typically take longer to process. In 2019, 70 percent of Missoula home sales involved conventional loans and 17 percent were cash. While FHA and VA loans declined in 2018, they rebounded slightly in 2019 to each make up 5 percent of the pie (FIGURE 26).
FIGURE 24: The number of sales continued to decline for the three lowest price points.
FIGURE 25: The largest portion of sales occurred in the $275,000 to $350,000 range in 2019.
FIGURE 26: Most buyers bought their homes via conventional mortgages. Seventeen percent had the advantage of buying with cash.
19
$0-$150,000
$750,001+
$425,001-$500K
$500,001-$750K
$150,001-$200K
$200,001-$275K
$275,001-$350K
$350,001-$425K
2016201520142013201220112010 20192017 20180
350
175
525
700
Number of Sales Price Range Breakout
Source: Montana Regional MLSFIGURE 24
Sales Price Distribution of Homes Sold | 2019
Source: Montana Regional MLS
$0-$150,000
$425,001-$500K
$500,001-$750K$750,001+
$150,001-$200K
$200,001-$275K
$275,001-$350K
$350,001-$425K
FIGURE 25
FHA - 4.85%
Conventional - 70.48%Cash - 17.15%
Conventional | 1,085
VA - 5.12%Rural Development - 1.06%Other - 0.8%Owner Financed - 0.53%
Percent of Sales by Method of Purchase | 2019
Source: Montana Regional MLSFIGURE 26
CONDOMINIUMS & TOWNHOUSES
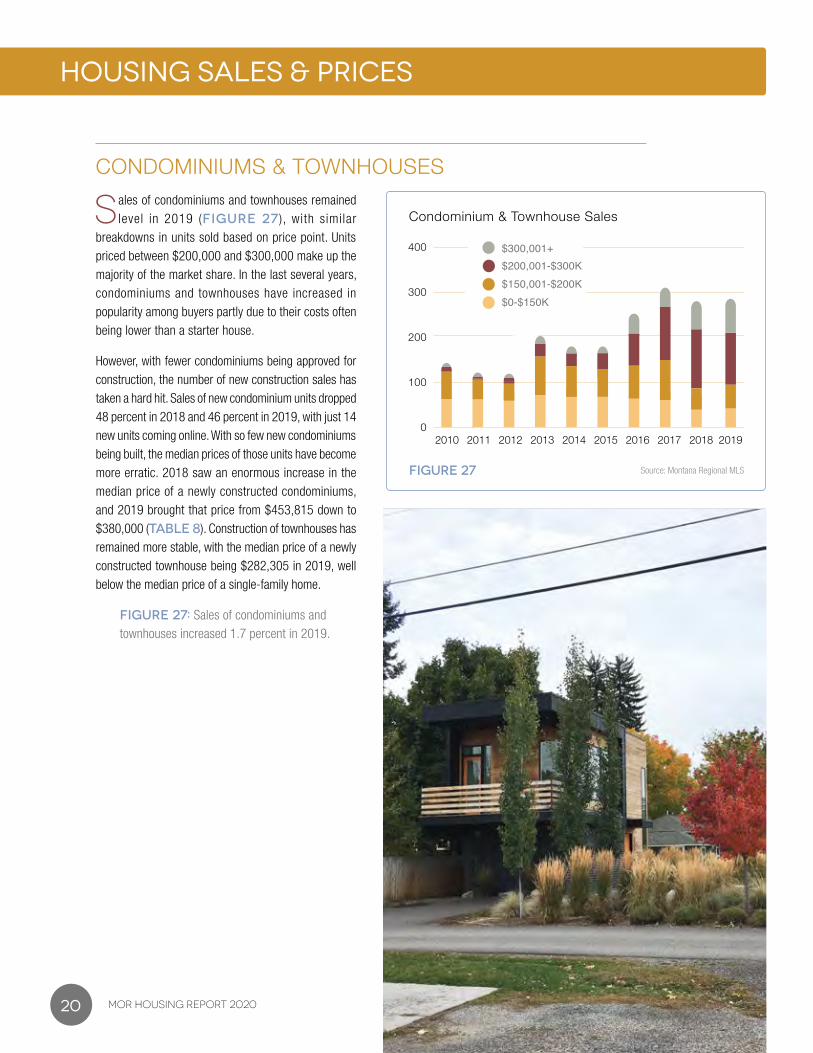
Sales of condominiums and townhouses remained level in 2019 (FIGURE 27 ), with similar
breakdowns in units sold based on price point. Units priced between $200,000 and $300,000 make up the majority of the market share. In the last several years, condominiums and townhouses have increased in popularity among buyers partly due to their costs often being lower than a starter house.
However, with fewer condominiums being approved for construction, the number of new construction sales has taken a hard hit. Sales of new condominium units dropped 48 percent in 2018 and 46 percent in 2019, with just 14 new units coming online. With so few new condominiums being built, the median prices of those units have become more erratic. 2018 saw an enormous increase in the median price of a newly constructed condominiums, and 2019 brought that price from $453,815 down to $380,000 (TABLE 8). Construction of townhouses has remained more stable, with the median price of a newly constructed townhouse being $282,305 in 2019, well below the median price of a single-family home.
FIGURE 27: Sales of condominiums and townhouses increased 1.7 percent in 2019.
HOUSING SALES & PRICES
20 MOR housing report 2020
0
100
200
300
400
$200,001-$300K$150,001-$200K$0-$150K
$300,001+
Condominium & Townhouse Sales
Source: Montana Regional MLSFIGURE 27
2016201520142013201220112010 2017 2018 2019

NEW CONSTRUCTION SALES
After a major slowdown in new construction sales in 2018, sales recovered some in 2019, with 166
new construction units sold (FIGURE 28). Those new units are predominately selling for more. The median price of a new single-family house increased 6.9 percent, to $410,000, while a new townhouse increased 11 percent (TABLE 8). The median price of condominiums dropped 16 percent, however keep in mind that number is only based on the declining sales of 14 units sold (see Condominiums & Townhouses). Both an increase in building costs as well costs associated with regulatory issues may be influencing these numbers.
FIGURE 28: Sales of new construction units increased 37 percent in 2019.
TABLE 8: Sales of new condominium units continued to decline in 2019, but both new townhouses and single-family homes experienced more sales in 2019.
21
New Construction Sales
2017 2018 2019 median % changeunits median units median units median
Condominiums 50 $205,600 26 $453,815 14 $380,000 -16.3%
Townhomes 54 $236,000 51 $254,353 61 $282,305 11.0%
Single Family 87 $305,140 44 $383,500 91 $410,000 6.9%
TABLE 8 Source: Montana Regional MLS
0
50
100
150
200
2016201520142013201220112010 20192017 2018
New Construction Sales
Source: Montana Regional MLSFIGURE 28

SALES TRENDS IN NEIGHBORHOODS
The top-selling neighborhoods in 2019 were Mullan Road/Expressway, Central Missoula, Miller
Creek, and Lewis and Clark (FIGURE 29). The only neighborhood to fall off that list of top sellers was South Hills, which had 12 percent fewer sales in 2019 compared to the previous year. Sales in Miller Creek increased 30 percent, while East Missoula jumped 40 percent.
Downtown/Northside, Central Missoula and East Missoula/Clinton had the lowest median prices (FIGURE 30). Meanwhile the neighborhoods of Rattlesnake, Grant Creek and Miller Creek had the highest median prices. All but two of Missoula’s neighborhoods had increases in their median price in 2019.
Grant Creek, Miller Creek, and the Rattlesnake neighborhoods had the highest median prices. For those looking for affordable real estate, it’s worth noting that half of the neighborhoods had median prices below Missoula’s median price of $315,000.
FIGURE 29: Six Missoula neighborhoods saw increased sales activity in 2019 and six had declining sales.
FIGURE 30: Median sales prices rose in all but two neighborhoods from 2018 to 2019.
HOUSING SALES & PRICES
22 MOR housing report 2020
0 100 200 300 400
FIGURE 29
2019
2018
2017
Grant Creek
Rattlesnake
East Missoula /Clinton
Downtown /Northside
U-Area / Slant Streets
Target Range
South Hills
Lolo
Lewis & Clark
Miller Creek
Central Missoula
Mullan Road /Expressway
Home Sales by Neighborhood
Source: Montana Regional MLS

COMPARATIVE TRENDS IN HOME PRICES
The Housing Price Index (HPI) helps us measure appreciation by looking at changes in single-family
home prices. The Federal Housing Finance Agency (FHFA) obtains the data by reviewing repeat mortgage transactions on properties purchased or securitized by Fannie Mae and Freddie Mac. When a home is sold, the price is compared to previous sale prices for the same home; the same procedure is followed for refinancing. An index value of 100 equals the value in January 1995.
Repeat sales in Missoula in 2018 continued to be higher than other state and national markets, as has been the trend for several years. For the third quarter of 2018, Missoula had an HPI of 278.02, which was 5 percent higher than the third quarter of 2017 (FIGURE 30).
Although Bozeman would be an interesting addition to the index, FHFA does not include the City of Bozeman in this data set because it doesn’t meet their minimum population threshold.
FIGURE 31: The Housing Price Index for Missoula homes increased throughout 2018, indicating a continued strong appreciation of single-family homes.
23
150
200
250
300
2019201820172016201520142013201220112010
MissoulaMT Non-metroMontanaMountain StatesBillingsU.S.Great Falls
Source: Federal Housing Finance AgencyFIGURE 31
Housing Price Index | 2010 Q1- 2019 Q3
Median Price
2019
2018
2017
$0 $125K $250K $375K $500K
Median Sales Price by Neighborhood
Source: Montana Regional MLSFIGURE 30
East Missoula / Clinton
Grant Creek
Mullan Road /Expressway
Target Range
Miller Creek
Central Missoula
Lewis & Clark
Lolo
South Hills
U-Area / Slant Streets
Downtown /Northside
Rattlesnake
PACE OF HOME SALES
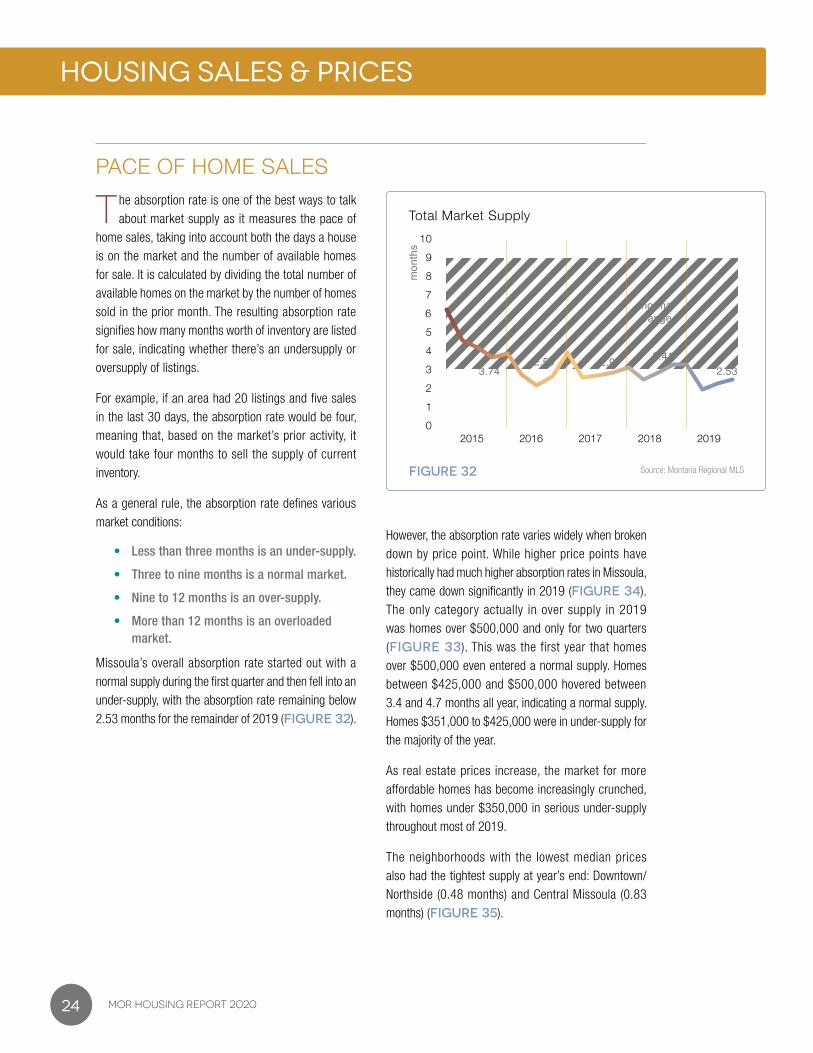
The absorption rate is one of the best ways to talk about market supply as it measures the pace of
home sales, taking into account both the days a house is on the market and the number of available homes for sale. It is calculated by dividing the total number of available homes on the market by the number of homes sold in the prior month. The resulting absorption rate signifies how many months worth of inventory are listed for sale, indicating whether there’s an undersupply or oversupply of listings.
For example, if an area had 20 listings and five sales in the last 30 days, the absorption rate would be four, meaning that, based on the market’s prior activity, it would take four months to sell the supply of current inventory.
As a general rule, the absorption rate defines various market conditions:
• Less than three months is an under-supply.
• Three to nine months is a normal market.
• Nine to 12 months is an over-supply.
• More than 12 months is an overloaded market.
Missoula’s overall absorption rate started out with a normal supply during the first quarter and then fell into an under-supply, with the absorption rate remaining below 2.53 months for the remainder of 2019 (FIGURE 32).
However, the absorption rate varies widely when broken down by price point. While higher price points have historically had much higher absorption rates in Missoula, they came down significantly in 2019 (FIGURE 34). The only category actually in over supply in 2019 was homes over $500,000 and only for two quarters (FIGURE 33). This was the first year that homes over $500,000 even entered a normal supply. Homes between $425,000 and $500,000 hovered between 3.4 and 4.7 months all year, indicating a normal supply. Homes $351,000 to $425,000 were in under-supply for the majority of the year.
As real estate prices increase, the market for more affordable homes has become increasingly crunched, with homes under $350,000 in serious under-supply throughout most of 2019.
The neighborhoods with the lowest median prices also had the tightest supply at year’s end: Downtown/Northside (0.48 months) and Central Missoula (0.83 months) (FIGURE 35).
24 MOR housing report 2020
HOUSING SALES & PRICES
2018 2019201720162015
FIGURE 32
0
1
6
5
4
3
2
9
8
7
10
3.742.59 2.9
2.533.41
normalrange
Source: Montana Regional MLS
Total Market Supply
mon
ths

FIGURE 32: The total market absorption rates for Missoula homes showed a normal supply of real estate listings only in the first quarter of 2019; the rest of the year it was in under-supply.
FIGURE 33: The only price category to register an over-supply in 2019 was homes over $500,000, and that was only for the first quarter and third quarters.
FIGURE 34: While higher price points have historically had much higher absorption rates in Missoula, they came down significantly in 2019.
FIGURE 35: The Downtown/Northside and Central Missoula neighborhoods had the tightest supply of real estate listings at year’s end. These neighborhoods also have the lowest median prices.
m g
auld
oni |
flic
kr c
c
25
0
4
8
12
16
20
Q4Q3Q2Q1
mon
ths
$500,001+$425,001-$500K$350,001-$425K$275,001-$350K$200,001-$275K$150,001-$200K0-$150K
normal range
Source: Montana Regional MLS
Supply by Quarter | 2019
FIGURE 33
normal range
0
7.5
15
22.5
30
201920182017
mon
ths
$500,001+$425,001-$500K$350,001-$425K$275,001-$350K$200,001-$275K
$150,001-$200K0-$150,000
Absorption Rates by Price Point
Source: Montana Regional MLSFIGURE 34
0 3 6 9
Downtown / Northside
Central Missoula
South Hills
Mullan / Expressway
Rattlesnake
U-Area / Slant
Lewis & Clark / Fairviews
East Missoula
Miller Creek
Lolo
Grant Creek
Target Range / Big Flat
Year-End Supply by Neighborhood | 2019
Source: Montana Regional MLSFIGURE 35
normal range

MORTGAGE FINANCE
INTEREST RATES
Economists and analysts charged with predicting lending activity for the coming year were surprised
about midway through 2019 when the Federal Reserve (led by Chairman Jerome Powell) made the first of a series of cuts to the fed funds rate. Ultimately, 2019 saw three reductions in the fed funds rate. Not only was this unexpected, but it was the first time the fed made cuts to its benchmark rate since 2008.
Nationally, the average rate on a 30-year fixed mortgage in January of 2019 was in the 4.5 to 4.6 percent range. By December it fell to 3.6 to 3.7 percent (FIGURES 36 & 37), which fueled a refinance increase. Lending companies capitalized on the opportunity to help borrowers lower their monthly payment, and homeowners all over the country benefited from the rate rally. With mortgage lending accounting for a significant portion of overall U.S. economy, the “refi boom” contributed to continuing the longest-running bull market our country has ever seen.
In addition, the Fannie Mae and Freddie Mac conforming loan limits increased from $484,350 in 2019 to $510,400 in 2020 for a single-family residence. That increase will now make the purchaser of a $500,000 home eligible for the lower conforming interest rates, as opposed to the higher rates of jumbo or high-balance loans. Homebuyers will be able to leverage their borrowing power by benefiting from inexpensive borrowing costs with high loan limits.
FIGURE 36: Year-end mortgage interest rates fell below 4 percent for the first time since 2012.
FIGURE 37: Rates for 30-year conventional mortgages remained below 4 percent for the last seven months of 2019.
26 MOR housing report 2020
0%
3%
1%
2%
4%
5%
4.00%4.50%
4.19%4.13%
3.25%
3.25%
4.75%
3.75%
4.63%
3.75%
2016201520142013201220112010 20192017 2018
FIGURE 36
Year-end Interest Rates
Source: Stockman Bank
2,500
3,750
3,125
4,375
5,000
MARFEBJAN APR MAY AUGJULJUN SEP OCT NOV DEC
30-Year Conventional Mortgage Rates
FIGURE 37 Source: Stockman Bank
Inte
rest
Rat
e
201920182017

THE IMPACT OF MORTGAGE INSURANCE
Mortgage insurance unnecessarily receives a lot of negativity, largely because it is misunderstood.
Bring up the term “mortgage insurance” at a social gathering and you’re often met with groans of homeowners keen on the idea of getting rid of it as quickly as possible. Augmenting those groans are the worries of soon-to-be homeowners concerned with how a monthly mortgage insurance (MI) premium will negatively impact how much they can afford to spend on a home.
Mortgage insurance came into the mainstream of mortgage lending for one purpose: to mitigate risk. Lending institutions determine the price at which they lend money based largely on risk. The riskier the characteristics of the loan are, the more costly the loan will be. Mortgage insurance was introduced to lessen the risk to the lender. By having an MI company assume some of the risk in the event of non-payment by the borrower, it makes the credit more attractive to the lender and therefore decreases the cost at which they will lend. Prior to MI, loans with down payments less than 20 percent simply weren’t made, or they were made on a very limited basis based on past relationships with long-time customers demonstrating excellent repayment history.
While it appears that the MI premiums paid only benefit the lending institutions that impose them, buyers who apply for the loan are also benefactors. Without MI, the cost of the loan would be unrealistic or, more likely, the loan simply would not be available.
Buyers can expect to have a MI policy when the first mortgage is greater than 80 percent of the property value/purchase price. Any Federal Housing Administration or Rural Development loan also requires MI.
b v
a | fl
ickr
cc
27

DOWN PAYMENT ASSISTANCE PROGRAMS
While homebuyers may make down payments of anywhere from 3 percent to 20 percent, in
2019 we saw some of the most significant housing appreciation in recent history. This was especially evident in the higher cost areas of the state (such as Missoula, Bozeman and Billings). Increasing home values put a mounting pressure on buyers to come up with higher down payments. Missoula’s median price increase equates to an additional $5,000 that a buyer would need for a 20% down conventional 30-yr loan.
One of the more popular and successful ways to address this issue is with Down Payment Assistance (DPA) programs for homebuyers. These can take the form of grants, loans and subsidies. The specifications vary widely between each program (TABLE 10), and often use the Area Media Income (AMI) to qualify applicants (TABLE 9).
These DPAs fill a void in community development when the cost of homeownership outpaces the wage appreciation within the area. They make home ownership available to a more economically diverse demographic that otherwise would not be able to afford the down payment.
Potential borrowers should work with their local lenders to identify programs that are a good match for financing. Many of these programs require that applicants wishing to use down-payment assistance complete a certified First-Time Homebuyer class and that they can save some of their own funds to contribute towards the purchase.
TABLE 9: The Area Median Income (AMI) is often used to determine the income limits for qualifying for certain down payment assistance programs.
TABLE 10: Homebuyers have several programs available to help with down payments, closing costs and overall financing.
MORTGAGE FINANCE
28 MOR housing report 2020
Area Median Income (AMI) for Missoula County
HOUSEHOLD SIZE 1 2 3 4 5 6 7 8
100% $51,375.00 $58,688.00 $66,000.00 $73,313.00 $79,188.00 $85,063.00 $90,938.00 $96,813.00
80% $41,100.00 $46,950.00 $52,800.00 $58,688.00 $63,350.00 $68,050.00 $72,750.00 $77,450.00
115% $59,081.00 $67,491.00 $75,900.00 $84,309.00 $91,066.00 $97,822.00 $104,578.00 $111,334.00
120% $61,650.00 $70,425.00 $79,200.00 $87,795.00 $95,025.00 $102,075.00 $109,125.00 $116,175.00
125% $64,219.00 $73,359.00 $82,500.00 $91,641.00 $98,984.00 $106,328.00 $113,672.00 $121,016.00
TABLE 9 Source: HUD Eff. April 2019

29
Down Payment Assistance Programs Available (Home Buyer Education Required)
DPA Program Income Limits Amount Terms/Other Info
HOMESTART 80% of AMI $7,500 No monthly payment - Forgiven after 5 years of ownership
Household size Based on funds available Must be First Time Home Buyer
Grant funds
HUMAN RESOURCE COUNCIL / (HRC)
80% of AMI up to $35,000 No monthly payment - 0% interest/ repayment deferred
Household size Based on funds available 2nd mortgage
NEIGHBORHOOD LIFT 100% HUD’s AMI $10,000 No monthly payment - Forgiven after 5 years of ownership
$73,300 1-4 household $12,500* *First Responders, Military Personnel or Teachers
higher for larger households Based on funds available 2nd mortgage
DREAM MAKERS 80% of AMI 2:1 match No monthly payment - Forgiven after 5 years of ownership
(Veterans Only) Household size Max $5000 Must be First Time Home Buyer - Active/Reserve/Guard/Veteran
MONTANA HOUSING $55,000 up to $6500 No monthly payment - 0% interest/repayment deferred
0% Deferred DPA regardless of household size 2nd mortgage
MONTANA HOUSING $87,960 1-2 Household up to $10,000 Monthly payment calculated over 15 years at fixed rate
Bond Advantage DPA $102,620 3+ Household matching 1st mortgage with MT Housing
NEIGHBORWORKS MT At or below 120% AMI Min $10,000 2nd Mortgage for 20% or less of purchase price
20+ Community Second Household size Max based on qualifications 30 year fixed rate - 2% above first mortgage rate
NEIGHBORWORKS MT 115-125% of AMI $1,500-$10,000 2nd Mortgage: 30 yr fixed rate if income is at or below 80% AMI
2nd Mortgage Household size $10,000 15 yr fixed rate if income is greater than 80-125% AMI
Other Loan Programs
MoFi HOMENOW Varies 3-5% of Loan Amount 30 year fixed rate mortgage - Conv/ FHA/VA or USDA RD
0% down/One Time Grant for down payment & closing costs
MONTANA HOUSING No Income Limit Loan Limit $269,180 30 year fixed rate VA or FHA loan at interest rate 1% below
Veterans Home Loan Program Fannie Mae/MT Housing posted rate
Must be First Time Home Buyer
$2500 down payment required
Standard Mortgage Loans
CONVENTIONAL MORTGAGE No Up to $510,400 Minimum 3% Down for First Time Home Buyers (at least one borrower)
Minimum 5% Down non first time buyers
FEDERAL HOUSING ADMINISTRATION (FHA)
No Up to $350,750 Minimum 3.5% Down payment required
VETERAN’S ADMINSTRATION (VA)
No Based on ability to qualify Must be Veteran/Active/Reserve/National Guard or Surviving Spouse
100% financing - VA Funding Fee may apply - added to loan amount
USDA RURALDEVELOPMENT (RD)
$86,850 1-4 Household Based on ability to qualify 100% Financing - property must be outside of Missoula City Limits
$114,650 5+ Household 1% Guarantee Fee applies - added to loan amount
TABLE 10 Information as of 1/2020 See your Local Lender for more specifics Source: Stockman Bank

FORECLOSURES
Home mortgage delinquencies and foreclosures declined in 2019, with only 75 properties being
given a notice of sale and just 14 reaching foreclosure (TABLE 11). This is a remarkable turnaround from 2010, when 233 properties went through foreclosures and 719 received a notice of sale. In addition to a strong economy, those numbers may be due to homebuyer education programs, financial fitness classes, foreclosure prevention and more conservative underwriting standards.
TABLE 11: Foreclosures in Missoula have made a remarkable turnaround in the last decade, with only 14 foreclosures in 2019.
HOMEOWNERSHIP PROGRAMS
Established in 1994, Homeword is a local nonprofit that creates homes people can afford across
Montana and that serves as a HUD-approved Housing Counseling Agency through one of only three Regional HomeOwnership Centers® in Montana.
After 25 years of success, over 15,500 people have been empowered through Homeword’s programs. Homeword provides a full continuum of services to develop well-informed consumers, including financial, renter and homebuyer education and counseling.
In 2019, 30 seniors learned critical homeowner and financial skills, and 46 Veterans gained home buying, rental and financial information.
Homeword predominantly empowers people living on low and moderate incomes. Of those receiving financial education and/or counseling, 83 percent earned less than $41,100 (80 percent of the area median income
for a one-person family). All services are provided at no cost except for the homebuyer education class, which is $35 per person. Free childcare is offered during classes to make them more accessible to parents.
MORTGAGE FINANCE
TABLE 12: Homeword continued to see a high demand for classes and counseling in 2019.
30 MOR housing report 2020
Foreclosures
Year Notice of Sale Cancellation of Sale Net Foreclosures
2010 719 486 233
2011 493 351 142
2012 431 280 151
2013 270 162 108
2014 206 144 62
2015 248 196 52
2016 137 93 44
2017 102 78 24
2018 95 66 29
2019 75 50 14
TABLE 11 Source: Stewart Title
Homeword
FY17 FY18 FY19
Served by Homeownership Center 1,150 1,143 1,182
Attended homebuyer ed &
pre-purchase counseling 678 665 638
Accessed financial ed classes & workshops 389 387 422
Accessed financial counseling 83 91 122
TABLE 12 Fiscal year July 1 - June 30 Source: Homeword

s w
eave
r | c
c fli
ckr
Homeword continued to see a consistently high demand for classes and counseling (TABLE 12). Homebuyer education and counseling slowed slightly, with classes still at capacity but with smaller waitlists. Anecdotally, Homeword heard from clients who were self-selecting out of education because of a lack of homes in their price range and the median home price continuing to grow.
The impacts of these programs are far reaching. Included in those who participated in Homeword’s programs in 2019 were the parents of over 625 children—parents who were empowered to make wise financial decisions for their families. Studies show that children who grow up in homes with low financial stress are more likely to reach their full potential.
A NeighborWorks America study found that homebuyer education and pre-purchase homebuyer counseling are key to successful homeownership. Homeowners who receive pre-purchase counseling and education are about one-third less likely to become seriously delinquent on their mortgage payments within the first two years of owning their home as compared to those who do not participate in pre-purchase counseling.
COMMUNITY LAND TRUST
C ommunity Land Trust (CLT) ownership has become a growing trend in Montana as home
prices continue to rise out of the reach of working Montanans. Since the North-Missoula Community Development Corporation put its first CLT project on the market in 2002, CLT homes in Missoula have been sold and re-sold at below-market prices to income-qualified purchasers, serving as an alternative to rentals.
Homeowners in CLT homes do not have their earned equity limited; however, they agree to their unearned equity at a flat-rate annual increase in order to ensure the home is affordable for future buyers. In this way, 54 CLT homes in Missoula have been home to 120 households in the last 17 years, all without requiring an additional subsidy each time ownership changes hands.
31

HOUSING AFFORDABILITY
THE HOUSING AFFORDABILITY INDEX
The Housing Affordability Index (HAI) measures the ability of a family earning a median income
to purchase a median-priced home. An index value of 100 means that a household with a median income has exactly enough income to spend 25 percent of their income on a mortgage for a median-priced home. A value higher than 100 indicates the family has more than enough income to qualify for a mortgage on a median-priced home. Conversely, if the HAI is below 100 (as it is in Missoula), it indicates that a median-priced home would not be as affordable for that household.
The HAI changed little in Missoula in 2019; it registered well below the affordable standard when assuming a 5-percent down payment, ranging from a score of 52 for a one-person household to 75 for a four-person household (FIGURE 38, TABLE 13). That indicates that a family with a median income would have a difficult, if not impossible, time qualifying for a mortgage on a median-priced home should they only put 5 percent down.
At the bottom of TABLE 13, you can see the effect a down payment has on affordability. If a family tried to purchase a median-priced home that cost $315,000 in Missoula in 2019 with a 5-percent down payment, they would have needed a median family income of $98,123. However, if that same family had a larger 20-percent down payment, they only would need an income of $76,973 to make that same home affordable. (By comparison, in 2017, they would have needed an income of $65,968 to afford a median-priced home of $268,250 with 20 percent down.) The reality, however, is that few people have 20 percent down unless they are bringing proceeds from a previous real estate sale to the table.
In determining HAI, we show data for two different scenarios: one assuming a 5-percent down payment, which is reflected in Figure 38, and one assuming a 20-percent down payment, which is how the national
HAI is calculated. Comparing the two shows how a lower 5-percent down payment, plus the necessary mortgage insurance, significantly lowers the overall affordability (TABLE 13). The 20-percent down payment does not include mortgage insurance. Both scenarios also figure in property taxes and homeowner insurance.
FIGURE 38: The Housing Affordability Index (HAI) remained nearly unchanged in 2019, still indicating that a median-income household would have a difficult time affording a median-priced home if they were putting 5 percent down. (A score of 100 means they would have exactly enough money to afford that home.)
TABLE 13: A household would need an income of $98,123 to afford a median-priced home with a 5-percent down payment ($15,750) in 2019. In comparison, they would require an income of at least $76,973 if they could present a 20-percent down payment ($63,000).
32 MOR housing report 2020
40
20
0
60
80
100
120
2016 2017 2018 201920152014201220112010 2013
four personthree persontwo personone person
Housing Affordablilty Index
Source: Montana Regional MLS, HUDFIGURE 38

33
Missoula Housing Affordablity Index | 2017-2019
2017 2018 2019 2017 2018 2019
MEDIAN HOUSE PRICE (MOR) $268,250 $290,000 $315,000 $268,250 $290,000 $315,000
DOWN PAYMENT 5% 5% 5% 20% 20% 20%
INTEREST RATE 4.00% 4.625% 3.750% 4.00% 4.625% 3.750%
LOAN TERM 30 30 30 30 30 30
ACTUAL LOAN AMOUNT $254,838 $275,500 $299,250 $214,600 $232,000 $252,000
MONTHLY PAYMENT ON LOAN 1,216.60 1,416.45 1,416.45 1,024.50 1,192.80 1,192.80
HOMEOWNERS INSURANCE $70 $76 $83 $70 $76 $83
MORTGAGE INSURANCE $185 $200 $217 $0 $0 $0
TAXES 279 $302 $328 $279 $302 $328
TOTAL MONTHLY PAYMENTS* $1,751 $1,994 $2,044 $1,374 $1,571 $1,604
Median Family Income
1 PERSON $46,125 $49,300 $51,375 $46,125 $49,300 $51,375
2 PERSON $52,750 $56,400 $58,688 $52,750 $56,400 $58,688
3 PERSON $59,313 $63,400 $66,000 $59,313 $63,400 $66,000
4 PERSON $65,875 $70,400 $73,313 $65,875 $70,400 $73,313
Housing Affordability Index
1 PERSON 55 51 52 70 65 67
2 PERSON 63 59 60 80 75 76
3 PERSON 71 66 67 90 84 86
4 PERSON 78 74 75 100 93 95
Median Family Income Needed to Purchase Median Priced Home
INCOME $84,058 $95,731 $98,123 $65,968 $75,408 $76,973
TABLE 13 KEY: *Includes taxes and homeowners insurance on a 30 year fixed loan

SHARE OF INCOME SPENT ON HOUSING
It is generally accepted that no more than 30 percent (and, more safely, 25 percent) of a household’s gross
monthly income should be spent on housing. Households that must spend a large portion of income on housing have a difficult time meeting other obligations and are considered “cost burdened.”
Historically, a large proportion of Missoula residents spend 30 percent or more of their income on housing. For the last three years of data, 47 to 48 percent of Missoula renters have spent more than 30 percent of their income on housing. In contrast, Missoula homeowners present an improving picture, with 20.9 percent falling into that category (FIGURE 39). Compare that to 2016 when 30 percent of homeowners spent more than 30 percent of their income on housing costs.
UNEMPLOYMENT
The unemployment rate is the percentage of the total labor force that is unemployed but still able
to work and actively seeking employment. Missoula’s unemployment rate hit a 20-year low in 2019, with 3.1 percent unemployment (FIGURE 40).
FIGURE 40: Missoula County had an unemployment rate of 3.1 percent in 2019.
HOUSING AFFORDABILITY
FIGURE 39: In 2018, approximately 48 percent of Missoula renters spent more than 30 percent of their income on housing.
34 MOR housing report 2020
60% 70%50%40%30%20%10%0%
homeowners
renters
percent of households
2016
2017
2018
2016
2017
2018
Source: U.S. Census Bureau, American Community SurveyFIGURE 39
Missoula County Households that Spend 30% or More on Housing
Source: Montana Department of Labor and Industry
0%
2%
4%
6%
8%
2019201820172016201520142013
FIGURE 40
Unemployment Rate | Missoula County

POVERTY
To determine who is in poverty, the U.S. Census Bureau sets an income threshold under which an
individual or family is deemed to be living in poverty. This threshold varies based on family size, living situation and age. In 2018, approximately 13 percent of Missoula County residents were considered to be living in poverty (FIGURE 41). While this data does show a decline from 2017, there is a large margin of error to consider with the American Community Survey.
FIGURE 41: The number of Missoula residents living in poverty was approximately 13 percent in 2018. (The bars of color represent the margin of error for this data.)
k ew
ing
| flic
kr c
c
35
14%
10%
20%
24%
18%
2013 2014 201520122011 2016 20182017
Poverty Level | Missoula County
FIGURE 41 Source: U.S.Census Bureau, American Community Survey

HOMELESSNESS
The January point-in-time homeless census in 2019 counted 367 individuals, a 15-percent
increase from the 2018 census of 319 (FIGURE 42). While the 2019 census is still down from past years (and 2015’s peak of 538), it is the highest in the state. The point-in-time data is a nationally coordinated, simultaneous effort to identify the number of persons experiencing homelessness on a single night during the last week in January.
The number of homeless and at-risk children in Missoula County Public Schools (MCPS) declined to 419 in the 2018-2019 school year, down from 500 in 2017-2018 (FIGURE 43). This figure represents the number of unstably housed children identified throughout the school year. Unstable housing varies from periods of brief, literal homelessness to a pattern of frequent moves and other situations. This is one of the better ways to identify the size of this at-risk group, as families with children in school often do everything they can to avoid living on the street or in shelters if they don’t have permanent housing.
FIGURE 42: The number of homeless individuals counted during a single point-in-time survey increased in 2019, with 367 being identified on a single night in January.
FIGURE 43: Missoula County Public Schools (MCPS) identified 419 children who were homeless or at risk of being homeless during the 2018-2019 school year.
HOUSING AFFORDABILITY
36 MOR housing report 2020
200
100
0
300
400
500
600
201620152014 2018 20192017
Total Homeless Individualson a Single Night in January
FIGURE 42 Source: Montana Continuum of Care
0
200
400
600
2016-172015-162014-15 2017-18 2018-19
Homeless Children
FIGURE 43 Source: Missoula County Public Schools

m s
held
on |
flick
r cc
37

M issoula continues to experience the strain of a growing population and under supply of
housing. Median income and housing costs both increased in 2019. The median price of a Missoula home increased along with rent in every category.
• Vacancy rate stayed between 2.3 and 3.7 putting upward pressure on rents
• Median home price increased 8.6%, bringing the median home to $315,000
• New construction of a single-family home had a median price of $410,000
• Residential lot price increased by 28.3%
• 48.2% of renters are cost-burdened, spending 30% of their income on housing
Despite the shortage of listings, new construction has not grown at the same rate, particularly for multi-unit housing. While single-family construction projects did increase, they tended to be high priced homes. Residential lot sales actually declined in number.
Missoula homes cont inue to have a strong appreciation, and sellers have a market where homes sell for 98% percent of their original list price. Buyers face a higher price than previous years but have an advantage in lower mortgage rates.
Missoula has much to celebrate, including the lowest unemployment rate in 20 years and a significant increase in median income in the last few years. That growth has highlighted disparities in Missoula’s population and the challenge of many to find housing that fits their budget. Homeowners had a median income of $75,368 in 2018; renters, however, had a median income of $37,538. In 2019, there were 1,707 households on the wait list for Section 8 vouchers to subsidize their rent.
Homeword and Missoula Housing Authority continue to work on housing issues by providing low-income options and units to support those that have experienced homelessness. Together they have 412 new units of needs-based housing in the pipeline, which would nearly equal the production of such units over the last 10 years. Of those, 42 units would be dedicated to those experiencing chronic homelessness.
It remains a juggling act for Missoula to absorb the impacts of a growing town and economy. As the upticks in jobs and wages bring good tidings to many, the Missoula community needs its housing to grow with it.
CONCLUSION & OUTLOOK
38 MOR housing report 2020
39

j yar
dle
y | c
c
Report Available Online: www.MissoulaRealEstate.com
Under “News & Information”
724 Burlington AveMissoula, Mt 59801
P: 406-728-0560Comments@ MissoulaRealEstate.com
des
ign
+ il
lust
ratio
n =
joan
na y
ard
ley
| m
y-d
esig
n.ne
t