MISSISSIPPI SAND, LLC - Illinois
135
May 14, 2012 and May 16, 2012 MISSISSIPPI SAND, LLC CONSTRUCTION PERMIT APPLICATION FOR: AN INDUSTRIAL SAND PLANT SOUTH OTTAWA TOWNSHIP, LASALLE COUNTY, ILLINOIS Introduction 1 Site Location Map 2 Site Layout Plan 3 Plant Site Plan 5 Project Description 4 Wet Plant Process Flow Diagram 6 Dry Plant Process Flow Diagram 7 Project Emission Units 8 Regulations and Emissions Standards Applicability 12 Facility-wide Potential Emissions Summary 18 Facility-wide Potential HAP Emissions Summary 19 Emission Unit Descriptions and References for Emission Factors 20 Emissions Calculations 22 I. Fugitive Emissions 22 II. Wet Plant I 28 III. Wet Plant II 35 IV. Sand Drying and Natural Gas Combustion 38 V. Dry Sand Processes 49 VI. Storage Silos 55
Transcript of MISSISSIPPI SAND, LLC - Illinois

May 14, 2012 and May 16, 2012
MISSISSIPPI SAND, LLC
CONSTRUCTION PERMIT APPLICATION FOR:AN INDUSTRIAL SAND PLANTSOUTH OTTAWA TOWNSHIP, LASALLE COUNTY, ILLINOIS
Introduction 1
Site Location Map 2
Site Layout Plan 3
Plant Site Plan 5
Project Description 4
Wet Plant Process Flow Diagram 6
Dry Plant Process Flow Diagram 7
Project Emission Units 8
Regulations and Emissions Standards Applicability 12
Facility-wide Potential Emissions Summary 18
Facility-wide Potential HAP Emissions Summary 19
Emission Unit Descriptions and References for Emission Factors 20
Emissions Calculations 22
I. Fugitive Emissions 22
II. Wet Plant I 28
III. Wet Plant II 35
IV. Sand Drying and Natural Gas Combustion 38
V. Dry Sand Processes 49
VI. Storage Silos 55
May 14, 2012 and May 16, 2012
MISSISSIPPI SAND, LLC
CONSTRUCTION PERMIT APPLICATION FOR:AN INDUSTRIAL SAND PLANTSOUTH OTTAWA TOWNSHIP, LASALLE COUNTY, ILLINOIS
VI. Truck Loadout 58
Fee Determination Form 197 62
Fee Determination Signature Page 63
Application for a FESOP Source Form APC 628 64
APC 628 Signature Page 67
Wet Plant I Process Information Form APC 220 68
Wet Plant II Process Information Form APC 220 78
Dry Sand Process Information Form APC 220 85
Dry Sand Process Baghouse Information Form APC 260 88
Storage Silos Process Information Form APC 220 98
Truck Loadout Process Information Form APC 220 105
Dryer #1 Combustion Source Information Form APC 240 112
Dryer #1 Baghouse Information Form APC 260 115

GENERAL APPLICATION INFORMATION
Owner: Mississippi Sand, LLC
12209 Big Bend Rd.
Saint Louis, Missouri 63122-6837
Operator:
Mississippi Sand, LLC
12209 Big Bend Rd.
Saint Louis, Missouri 63122-6837
Responsible Official: Mr. Tony Giordano
President – Mississippi Sand, LLC
Application Contact Person: Mr. Gordon Stevens
Senior Project Manager
Patrick Engineering, Inc.
4970 Varsity Dr.
Lisle, IL 60532
630-795-7322
INTRODUCTION
Mississippi Sand, LLC is submitting this construction permit application for an industrial sand plant (frac plant) to be located near Ottawa, Illinois. The primary material mined and processed at the plant will be used as a proppant in the hydraulic fracturing process of oil and gas wells. The sand in this region has the size and surface specifications necessary as a proppant.
SOURCE DESCRIPTION
The site occupies approximately 315 acres in South Ottawa Township, LaSalle County, Illinois. The facility this application (Phase I) is proposing to construct and operate will occupy approximately 80 acres of the site. The site is located south of the Illinois River and south of Route 71 west of Ottawa, immediately prior to entering Starved Rock State Park. The mine will be for the extraction of silica sand. All mining activities will be done between the bluffs and the river, and will most likely be concentrated on the eastern half of the parcel but may sprawl westward between 20 and 40 years time. The following maps provide the site location map and layout plan.
Application Revision 5/16/2012, Page 1 of 131

Application Revision 5/14/2012, Page 2 of 131

PROJECT DESCRIPTION
The following block diagram shows the major processes of the proposed plant:
Mining and Wet Plant Raw material is mined on-site and transported to temporary raw feed piles. The pit material is then transported in slurry form to the wet process plant where it is washed to remove unwanted material, hydrosized, classified, and then conveyed to stockpiles. Depending on the material’s classification, it is then conveyed in saturated form to one of many stockpiles for decanting purposes. Note that the moisture content of the stockpiled material is typically greater than 12 percent; therefore, fugitive emissions from the wet plants shown in the following diagram are minimal.
Fluid Bed Dryer The washed stockpiled material is transferred from the decanting stockpiles via below surface feeders to the dryer feed stockpiles. A front-end loader is used to transfer the material to the dryers’ feed bins. The dry plant will consist of a 200 ton per hour fluid bed dryer fitted with a 56 mmBtu/hr natural gas/propane fired burner. Particulate emissions from the dryer are controlled by a fabric filter baghouse.
Dry Processing Plant After the material is dried to a moisture content of less than 1 percent, the sand is conveyed to sizing screens where it is classified and conveyed to storage silos. Particulate emissions from the sand processing building are controlled by a fabric filter baghouse. Emissions from dry sand processing equipment not located in the processing building are either enclosed or controlled by bin vent filters.
Storage Silos The classified sand is conveyed from the screening process to a series of 1500 ton storage silos prior to conveying the final product to the truck loading station. The emissions from loading into and out of the storage silos are controlled by individual bin vent/filters mounted on top of each silo.
Truck Loadout Stored material from the storage silos is transferred and conveyed to the truck loading station. The truck loadout station has four loadout spouts, which are controlled by individual filter modules that exhaust back into the storage silos. As such, emissions from each material transfer point and loadout spout are further controlled by the storage silos bin vent/filters before exhausting to the atmosphere.
Application Revision 5/16/2012, Page 3 of 131

Application Revision 5/14/2012, Page 3 of 131

Application Revision 5/14/2012, Page 5 of 131

S
S
S
P04Pond
S
S
S
? %
3/41/4
8x20
Fines
Decanting Pile
1/2
Dryer Feed
-20 x +70Trash
Oversize
-20 x +70
Winter Pile
S
Decanting Pile
1 2
3
4
5
6
7 98
101112
13
14
15 16 17
55
18 19
20
21
22 23
24
25
26
27
28 29
30
31 32
33 34
35 36
37
38
39 40
41
42
43
44
45
47
48
49
50
5152
53
5456
57
58
59
72
0.0 stph73
74
75
76
77
60 Through 71 are gates in the Tunnel
46
Application Revision 5/14/2012, Page 6 of 131
rkf
Typewritten Text
Ottawa Site Wet Plant Process Flow Diagram

9495
93
143
146
111
#40#70
105
#40#70
104
#40#70
103
#20#40
119
96
97
98
99
100
101
Everything after the dryers is less than 1% moisture and is enclosed and controlled by
S
81
83
86
STACK
S
82
8778
DRYER FEED
SEE WET FLOW SHEET
-20 mesh x +70 mesh
88
S
130131
DUST COLLECTION
129
132
102
STACK
1500 TON
40/70
154
155156
157158
159
1500 TON
147
148149
150
151 152
1500 TON
137
138
139
140141 142
145153
+20
108
109110
106
OVERSIZE MOVED BY TRUCK
TO STORAGE AREA
BIN VENT1500 TON
100 mesh
162
163164
165166
167
123
124
125
126
127
#70
128
160135
113
117
118
114115116
120
122
100 M20/40
40/70
161144
13640/70 20/40
168169
BIN VENTBIN VENT
BIN VENT
S
80
S
79
S
8485
8990
9192
112121
107
133
134
Application Revision 5/14/2012, Page 7 of 131
rkf
Typewritten Text
Ottawa Site Dry Plant Process Flow Diagram

DESCRIPTION OF PROPOSED UNITS
Equipment Group
Item Name Process Name Hours of Operation
Design Capacity
Operating Capacity
Capacity Rate
Fugitive 171 MNG
Mining and Hauling (unpaved roads)
8760 3.914 3.914 VMT/hr
172 OR Overburden Removal 500 NA NA hour
174 SP Storage Piles 8760 NA NA hour
173 PR Traffic on Paved Roads 8760 2.31 2.31 VMT/hr
Wet Plant I 22 F03 Belt Feeder 8760 600 500 tons/hr
17 C11 Conveyors 8760 1000 800 tons/hr
50 C19 Conveyors 8760 500 300 tons/hr
52 C21 Conveyors 8760 800 600 tons/hr
54 C22 Conveyors 8760 800 600 tons/hr
28 C18 Conveyors 8760 500 300 tons/hr
25 C16 Conveyors 8760 500 300 tons/hr
23 C15 Conveyors 8760 600 500 tons/hr
57 C25 Conveyors 8760 800 600 tons/hr
20 C14 Conveyors 8760 1000 800 tons/hr
18 C12 Conveyors 8760 1000 800 tons/hr
16 C10 Conveyors 8760 1000 800 tons/hr
15 C09 Conveyors 8760 1000 800 tons/hr
9 C05 Conveyors 8760 1000 800 tons/hr
8 C04 Conveyors 8760 1000 800 tons/hr
7 C03 Conveyors 8760 1000 800 tons/hr
5 C02 Conveyors 8760 1000 800 tons/hr
4 C01 Conveyors 8760 1000 800 tons/hr
19 C13 Conveyors 8760 1000 800 tons/hr
27 CR02 Crusher 8760 500 300 tons/hr
3 CR01 Crusher 8760 1000 800 tons/hr
39 CY03 Cyclone 8760 500 300 tons/hr
31 CY01 Cyclone 8760 500 300 tons/hr
40 CY04 Cyclone 8760 500 300 tons/hr
32 CY02 Cyclone 8760 500 300 tons/hr
35 DWS01 DW Screen 8760 500 300 tons/hr
41 DWS03 DW Screen 8760 500 300 tons/hr
36 DWS02 DW Screen 8760 500 300 tons/hr
21 FH03 Feed Hopper 8760 600 500 tons/hr
1 FH01 Feed Hopper 8760 1000 800 tons/hr
2 F01 Feeders 8760 1000 800 tons/hr
34 HY02 Hydrosizer 8760 500 300 tons/hr
Application Revision 5/14/2012, Page 8 of 131

DESCRIPTION OF PROPOSED UNITS
Equipment Group
Item Name Process Name Hours of Operation
Design Capacity
Operating Capacity
Capacity Rate
33 HY01 Hydrosizer 8760 500 300 tons/hr
61 G02 Other Transfer Point 8760 400 200 tons/hr
69 G10 Other Transfer Point 8760 400 200 tons/hr
67 G08 Other Transfer Point 8760 400 200 tons/hr
66 G07 Other Transfer Point 8760 400 200 tons/hr
65 G06 Other Transfer Point 8760 400 200 tons/hr
64 G05 Other Transfer Point 8760 400 200 tons/hr
62 G03 Other Transfer Point 8760 400 200 tons/hr
60 G01 Other Transfer Point 8760 400 200 tons/hr
70 G11 Other Transfer Point 8760 400 200 tons/hr
71 G12 Other Transfer Point 8760 400 200 tons/hr
63 G04 Other Transfer Point 8760 400 200 tons/hr
68 G09 Other Transfer Point 8760 400 200 tons/hr
24 SCR01 Screens 8760 600 500 tons/hr
56 C24 Stackers 8760 800 600 tons/hr
26 C17 Stackers 8760 500 300 tons/hr
51 C20 Stackers 8760 500 300 tons/hr
55 C23 Stackers 8760 800 600 tons/hr
58 C26 Stackers 8760 800 600 tons/hr
Wet Plant II 14 F02 Belt Feeder 8760 1000 800 tons/hr
72 C27 Conveyors 8760 600 400 tons/hr
12 C08 Conveyors 8760 1000 800 tons/hr
76 F04 Conveyors 8760 600 400 tons/hr
11 C07 Conveyors 8760 1000 800 tons/hr
10 C06 Conveyors 8760 1000 800 tons/hr
75 FH04 Feed Hopper 8760 600 400 tons/hr
13 FH02 Feed Hopper 8760 1000 800 tons/hr
74 SCR02 Screens 8760 600 400 tons/hr
N.G. Combustion
81 BR01 Natural Gas Combustion 8760 0.055 0.055 million scf/hr.
Sand Drying 81 BR01 Natural Gas Combustion 8760 0.055 0.055
million scf/hr.
Dry Sand Processes
78 DRY01 Sand Drying 8760 400 200 tons/hr
83 BGH01 Sand Drying Baghouse 8760 2.868 200 million dscf/hr
126 F09 Belt Feeder 8760 300 150 tons/hr
117 F08 Belt Feeder 8760 300 150 tons/hr
98 F06 Belt Feeder 8760 133 66 tons/hr
Application Revision 5/14/2012, Page 9 of 131

DESCRIPTION OF PROPOSED UNITS
Equipment Group
Item Name Process Name Hours of Operation
Design Capacity
Operating Capacity
Capacity Rate
100 F07 Belt Feeder 8760 133 66 tons/hr
96 F05 Belt Feeder 8760 133 66 tons/hr
136 BE04 Bucket Elevator 8760 300 200 tons/hr
113 BE02 Bucket Elevator 8760 300 150 tons/hr
92 BE01 Bucket Elevator 8760 400 200 tons/hr
144 BE05 Bucket Elevator 8760 300 200 tons/hr
122 BE03 Bucket Elevator 8760 300 150 tons/hr
161 BE06 Bucket Elevator 8760 300 200 tons/hr
135 C34 Conveyors 8760 300 200 tons/hr
143 C35 Conveyors 8760 300 200 tons/hr
153 C37 Conveyors 8760 300 200 tons/hr
160 C38 Conveyors 8760 300 200 tons/hr
146 C36 Conveyors 8760 300 200 tons/hr
111 C30 Conveyors 8760 200 100 tons/hr
120 C32 Conveyors 8760 200 100 tons/hr
112 C31 Conveyors 8760 300 150 tons/hr
121 C33 Conveyors 8760 300 150 tons/hr
106 C28 Conveyors 8760 200 100 tons/hr
128 SCR07 Dry Screens 8760 300 150 tons/hr
119 SCR06 Dry Screens 8760 300 150 tons/hr
103 SCR03 Dry Screens 8760 133 66 tons/hr
104 SCR04 Dry Screens 8760 133 66 tons/hr
105 SCR05 Dry Screens 8760 133 66 tons/hr
123 FH07 Feed Hopper 8760 300 150 tons/hr
93 FH05 Feed Hopper 8760 400 200 tons/hr
114 FH06 Feed Hopper 8760 300 150 tons/hr
Storage Silos 129 BGH02 Sand Processing 8760 2.04 200
million dscf/hr
107 C29 Stackers 8760 200 100 tons/hr
137 STK01 STK01 8760 300 200 tons/hr
154 STK03 STK02‐3 8760 300 200 tons/hr
147 STK02 STK02‐3 8760 300 200 tons/hr
Truck Loadout 162 STK04 STK04 8760 300 200 tons/hr
108 WTK01 WTK01 8760 200 100 tons/hr
158 BLS03 Truck Loadout 8760 300 200 tons/hr
Application Revision 5/14/2012, Page 10 of 131

OTTAWA PLANT STACK PARAMETERS
Stack Name Exhaust Point Diameter(ft)
Discharge Height (ft)
Actual Flowrate
(acfm)
Maximum Flowrate
(acfm)
Temp(F)
Distance to Property Line (ft)
Fugitive This stack ID represents fugitive emissions from mining, storage piles and paved haul roads.
NA NA NA NA NA 300
Wet Plant I This stack ID represents fugitive sources from wet sand processing.
NA NA NA NA NA 300
Wet Plant II This stack ID represents fugitive sources from wet sand processing.
NA NA NA NA NA 300
Dryer #1 This stack ID has an actual exhaust point on Dwg. No. 050111‐01: 85.
4 60 30000 34350 250 460
Dry Sand Plant
This stack ID has an actual exhaust points on Dwg. No. 050111‐01:131.
3 20 30000 34000 175 300
Storage Silos This stack ID has an actual exhaust points on Dwg. No. 050111‐01: 137, 147, 154, 162 and 108.
0.75 94 900 1200 0 350
Truck Loadout
This stack ID represents items on Dwg. No. 050111‐01: 141, 151,158, 166,140,150,157 and 165, which are vented back into the storage silos and exhausted through points 137, 147, 154 and 162.
NA NA NA NA NA 350
Application Revision 5/14/2012, Page 11 of 131

FACILITY AND PROJECT CLASSIFICATION
The following is a discussion of the proposed project and applicability to state and federal air regulations.
TITLE V CLEAN AIR ACT PROGRAM APPLICABILITY
The potential emission estimates provided on pages 18, 18A and 18B show that the facility’s proposed emissions are below the 100 ton per year Title V operation permit threshold for criteria pollutants. Therefore, the proposed facility is a minor source under Part 70 and Section 112 of the Act. In addition, the source is classified as minor for ozone (volatile organic material) and minor for nitrogen oxides under 35 Ill. Adm. Code Part 203.
PREVENTION OF SIGNIFICANT DETERIORATION (PSD) [40 CFR 52.21 APPLICABILITY]
Mississippi Sand, LLC - Ottawa plant would be classified as a minor source for sulfur dioxide, particulate matter less than 10 microns, carbon monoxide, nitrogen oxides and lead for prevention of significant deterioration under 40 CFR 52.21.
MAJOR STATIONARY SOURCES CONSTRUCTION AND MODIFICATION [35 ILL. ADM. CODE PART 203]
The Mississippi Sand, LLC - Ottawa plant will not be located in a non-attainment area.
NEW SOURCE PERFORMANCE STANDARDS (NSPS) 40 CFR PART 60 APPLICABILITY
The proposed facility has processes is in-line with a source category for which there is an existing NSPS, Subpart OOO—Standards of Performance for Nonmetallic Mineral Processing Plants. The proposed facility includes a dryer that is subject to 40 CFR Part 60, Subpart UUU – Standards of Performance for Calciners and Dryers in Mineral Industries.
NATIONAL EMISSION STANDARDS FOR HAZARDOUS AIR POLLUTANTS (NESHAPS) APPLICABILITY
The proposed project is not subject to any proposed National Emission Standard for Hazardous Air Pollutants (NESHAP) regulations. The proposed project will not be subject to any existing NESHAP regulations. In addition, the proposed project will not be subject to s. 112(g) of the Clean Air Act. The section 112(g) rules only apply to case-by-case MACT standards that are developed for new construction or reconstruction of sources that (by themselves) constitute a new major source of federal hazardous air pollutants.
SPECIFIC RULE APPLICABILITY
Application Revision 5/16/2012, Page 12 of 131

NSPS Applicable Requirements: Wet Plant PFD Item
EID Emission Unit Description Applicable Requirements Compliance Demonstration
57 C25 Belt Conveyor 40 CFR Part 60 Subpart OOO: 7% Opacity
Opacity: Compliance emission test within 60 days after achieving the maximum production rate at which the affected facility will be operated, but not later than 180 days after initial startup using USEPA Methods 9. A repeat performance test according to §60.11of this part and §60.675 of this subpart within 5 years from the previous performance test for fugitive emissions from affected facilities without water sprays.
28 C18 Belt Conveyor
5 C02 Belt Conveyor
4 C01 Belt Conveyor
26 C17 Belt Conveyor
25 C16 Belt Conveyor
50 C19 Belt Conveyor
51 C20 Belt Conveyor
52 C21 Belt Conveyor
54 C22 Belt Conveyor
56 C24 Belt Conveyor
58 C26 Belt Conveyor
17 C11 Belt Conveyor
7 C03 Belt Conveyor
8 C04 Belt Conveyor
9 C05 Belt Conveyor
15 C09 Belt Conveyor
55 C23 Belt Conveyor
16 C10 Belt Conveyor
23 C15 Belt Conveyor
18 C12 Belt Conveyor
19 C13 Belt Conveyor
20 C14 Belt Conveyor
22 F03 Belt Feeder
32 CY02 Dewatering Cyclone
39 CY03 Dewatering Cyclone
31 CY01 Dewatering Cyclone
40 CY04 Dewatering Cyclone
36 DWS02 Dewatering Screen
35 DWS01 Dewatering Screen
41 DWS03 Dewatering Screen
24 SCR01 Double Deck Screen
21 FH03 Feed Hopper
1 FH01 Feed Hopper
70 G11 Gate Feeder
69 G10 Gate Feeder
68 G09 Gate Feeder
67 G08 Gate Feeder
66 G07 Gate Feeder
65 G06 Gate Feeder
64 G05 Gate Feeder
71 G12 Gate Feeder
62 G03 Gate Feeder
61 G02 Gate Feeder
60 G01 Gate Feeder
63 G04 Gate Feeder
2 F01 Grizzly Feeder
Application Revision 5/14/2012, Page 13 of 131

NSPS Applicable Requirements: Wet Plant PFD Item
EID Emission Unit Description Applicable Requirements Compliance Demonstration
34 HY02 Hydrosizer
33 HY01 Hydrosizer
3 CR01 Impact Crusher
76 F04 Belt Conveyor
72 C27 Belt Conveyor
12 C08 Belt Conveyor
11 C07 Belt Conveyor
10 C06 Belt Conveyor
14 F02 Belt Feeder
75 FH04 Feed Hopper
13 FH02 Feed Hopper
74 SCR02 Single Deck Screen
27 CR02 VSI Crusher 40 CFR Part 60 Subpart OOO: 12% Opacity
Opacity: Compliance emission test within 60 days after achieving the maximum production rate at which the affected facility will be operated, but not later than 180 days after initial startup using USEPA Methods 9. A repeat performance test according to §60.11of this part and §60.675 of this subpart within 5 years from the previous performance test for fugitive emissions from affected facilities without water sprays.
NSPS Applicable Requirements: Sand Processing Plant Controlled by Baghouse BH02
PFD Item
EID Emission Unit Description Applicable Requirements Compliance Demonstration
120 C32 Belt Conveyor 40 CFR Part 60 Subpart OOO: No Visible Emissions NSPS limit of less than ore equal to 0.032 g/dscm (0.014 gr/dscf) for PM emissions
Visible Emissions: Conduct quarterly 30‐minute visible emissions inspections using EPA Method 22 (40 CFR part 60, Appendix A–7). The Method 22 test is successful if no visible emissions are observed. If any visible emissions are observed, the affected facility must initiate corrective action within 24 hours to return the baghouse to normal operation.
160 C38 Belt Conveyor
143 C35 Belt Conveyor
106 C28 Belt Conveyor
111 C30 Belt Conveyor
96 F05 Belt Feeder
98 F06 Belt Feeder
100 F07 Belt Feeder
117 F08 Belt Feeder
126 F09 Belt Feeder
103 SCR03 Dry Screen
104 SCR04 Dry Screen
128 SCR07 Dry Screen
105 SCR05 Dry Screen
Application Revision 5/14/2012, Page 14 of 131

NSPS Applicable Requirements: Sand Processing Plant Controlled by Baghouse BH02
PFD Item
EID Emission Unit Description Applicable Requirements Compliance Demonstration
119 SCR06 Dry Screen PM Emissions: Conduct a compliance emission test within 60 days after achieving the maximum production rate at which the affected facility will be operated, but not later than 180 days after initial operation using USEPA Methods 5. The sampling volume for each test run shall be at least 1.70 dscm.
NSPS Applicable Requirements: Dry Processing without Baghouse Control PFD Item
EID Emission Unit Description Applicable Requirements Compliance Demonstration
112 C31 Belt Conveyor 40 CFR Part 60 Subpart OOO: 7% Opacity
Opacity: Compliance emission test within 60 days after achieving the maximum production rate at which the affected facility will be operated, but not later than 180 days after initial startup using USEPA Methods 9. A repeat performance test according to §60.11of this part and §60.675 of this subpart within 5 years from the previous performance test for fugitive emissions from affected facilities without water sprays.
153 C37 Belt Conveyor
146 C36 Belt Conveyor
135 C34 Belt Conveyor
121 C33 Belt Conveyor
113 BE02 Bucket Elevator
136 BE04 Bucket Elevator
92 BE01 Bucket Elevator
161 BE06 Bucket Elevator
144 BE05 Bucket Elevator
122 BE03 Bucket Elevator
107 C29 Belt Conveyor
114 FH06 Feed Hopper
123 FH07 Feed Hopper
93 FH05 Feed Hopper
NSPS Applicable Requirements: Sand Dryer Controlled by Baghouse BH01
PFD Item
EID Emission Unit Description Applicable Requirements Compliance Demonstration
78 DRY01 56 mmBtu/hr (HHV) Dryer 40 CFR Part 60 Subpart UUU: Opacity: 10% Particulate Matter: Emissions from affected dryer shall not contain particulate matter (PM) in excess of 0.057 gram per dry standard cubic meter (g/dscm) [0.025 grain per dry standard cubic foot (gr/dscf)]
Opacity: Method 9 and the procedures in § 60.11 shall be used to determine opacity from stack emissions. PM Emissions: Within 60 days after each affected NSPS dryer achieves its maximum operating rate, but not later than 180 days after initial startup, performance tests
Application Revision 5/14/2012, Page 15 of 131

NSPS Applicable Requirements: Sand Dryer Controlled by Baghouse BH01
PFD Item
EID Emission Unit Description Applicable Requirements Compliance Demonstration
shall be conducted to determine compliance with the particulate matter standards in 40 CFR 60.732 as follows: A. Method 5 shall be used to determine the particulate matter concentration. The sampling time and volume for each test run shall be at least 2 hours and 1.70 dscm (60 dscf). B. Method 9 and the procedures in 40 CFR 60.11 shall be used to determine opacity from stack emissions.
NSPS Applicable Requirements: Storage Silos and Loadout Spouts PFD Item
EID Emission Unit Description Applicable Requirements Compliance Demonstration
162 STK04 Storage Tank 40 CFR Part 60 Subpart OOO: 7% Opacity
Opacity: Conduct quarterly30‐minute visible emissions inspections using EPA Method 22 (40 CFR part 60, Appendix A–7). The Method 22 (40 CFR part 60, Appendix A–7) test shall be conducted while the filter device is operating. The test is successful if no visible emissions are observed. If any visible emissions are observed, the owner or operator of the affected facility must initiate corrective action within 24 hours to return the filter device to normal operation. Record each Method 22 (40 CFR part 60, Appendix A–7) test, including the date and any corrective actions taken, in the logbook required under 40 CFR §60.676(b).
Application Revision 5/14/2012, Page 16 of 131

STATE SPECIFIC RULE APPLICABILITY
35 IAC 212.123 Visible Emissions limitations for All Other Emission Units
Section 212.123 does not specify emission limitations during construction and installation. If implied in the regulation; then, as required under Subpart UUU (for dryers controlled by a fabric filter dust collector), a certified visible emissions reader will be on-site at all times and will perform scheduled observations. The visible emissions reader will also be available to ensure fugitive PM from any emission unit meets the visible emissions criteria under 35 IAC 212.123. In addition, the emissions during startup do not exceed the emission limits during normal operation, which are the FESOP specific limitations and those required under Subpart 000 and Subpart UUU. These are more restrictive limits than the allowable emission rates specified in 35 IAC 212.123; as such, compliance with the FESOP and NSPS limitations during startup will maintain compliance with this regulation.
35 IAC 212.301 Fugitive Particulate Matter
Section 212.301 does not specify emission limitations during construction and installation. If this is implied in the regulation; then, as required under Subpart UUU (for dryers controlled by a fabric filter dust collector), a certified visible emissions reader will be on-site at a" times and will perform scheduled observations. This visible emissions reader will be available to also ensure that fugitive PM from any process meets the visible emissions criteria under 35 IAC 212.301.
35 IAC 212.321 Process Emission Units for Which Construction or Modification Commenced On or After April 14, 1972
Section 212.321 does not specify emission limits for construction and installation. The emissions during startup of the units do not exceed the emission limits during normal operation, which are the FESOP specific limitations and those required under Subpart 000 and Subpart UUU. These are more restrictive limits than the allowable emission rates specified in 35 IAC 212.321(b); as such, compliance with the FESOP and NSPS limitations during startup will maintain compliance with this regulation.
Application Revision 5/14/2012, Page 17 of 131

OTTAWA PLANT PROPOSED PERMIT LIMITATIONS BY POLLUTANT
Pollutant Equipment Group Name TPM TPY
Carbon Dioxide N.G. Combustion 2409.0000 28908.00
Facility‐wide Total 2409.0000 28908.00
Carbon Monoxide N.G. Combustion 4.9144 58.97
Facility‐wide Total 4.9144 58.97
Nitrogen Oxides N.G. Combustion 3.4810 41.77
Facility‐wide Total 3.4810 41.77
PM Dry Sand Processes 4.8889 58.67
N.G. Combustion 0.0002 0.00
Sand Drying 1.4954 17.94
Storage Silos 5.0589 60.71
Truck Loadout 0.0818 0.98
Wet Plant I 4.6202 55.44
Wet Plant II 0.8293 9.95
Facility‐wide Total 16.9746 203.69
PM‐10 Dry Sand Processes 1.7230 20.68
N.G. Combustion 0.0002 0.00
Sand Drying 1.4954 17.94
Storage Silos 0.8176 9.81
Truck Loadout 0.0385 0.46
Wet Plant I 1.7670 21.20
Wet Plant II 0.2762 3.31
Facility‐wide Total 6.1178 73.41
PM2.5 Dry Sand Processes 1.2994 15.59
N.G. Combustion 0.0153 0.18
Sand Drying 1.4954 17.94
Storage Silos 0.3066 3.68
Truck Loadout 0.0120 0.14
Wet Plant I 0.2251 2.70
Wet Plant II 0.0432 0.52
Facility‐wide Total 3.3970 40.76
Sulfur Dioxide N.G. Combustion 0.0120 0.14
Facility‐wide Total 0.0120 0.14
Volatile Organic Compounds
N.G. Combustion 0.1104 1.32
Facility‐wide Total 0.1104 1.32
Application Revision 5/16/2012, Page 18 of 131

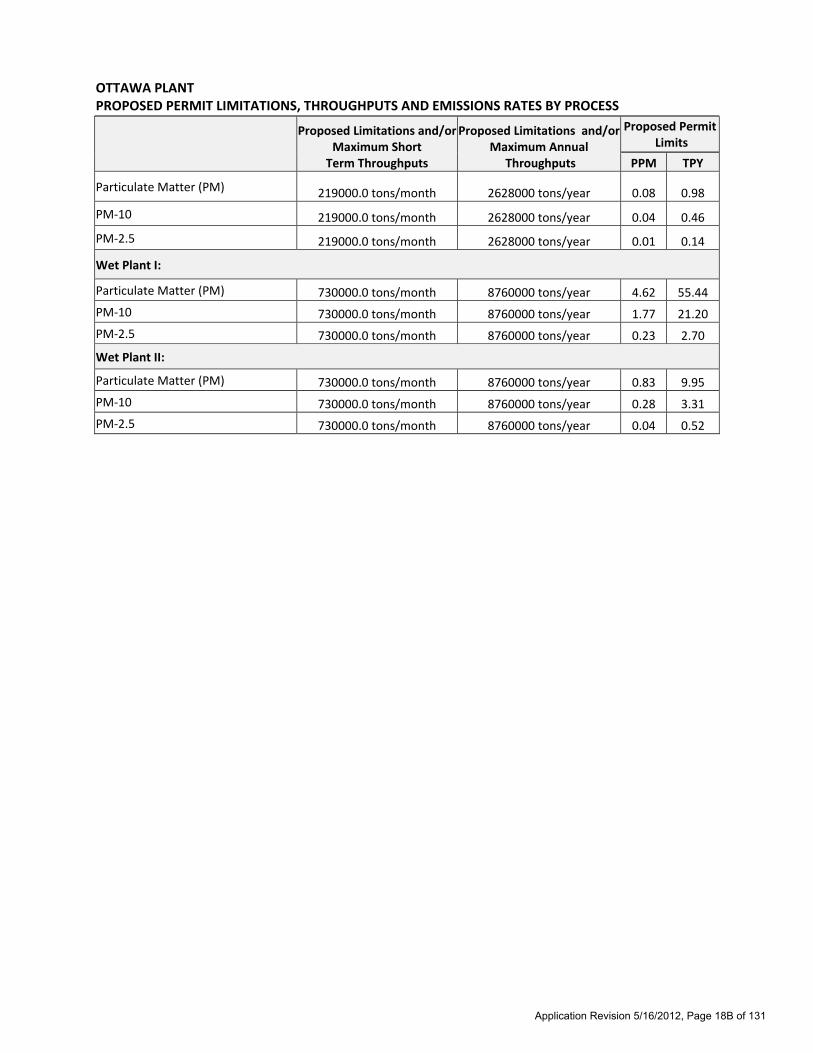
OTTAWA PLANT PROPOSED PERMIT LIMITATIONS, THROUGHPUTS AND EMISSIONS RATES BY PROCESS
Proposed Limitations and/or Maximum Short
Term Throughputs
Proposed Limitations and/or Maximum Annual Throughputs
Proposed Permit Limits
PPM TPY
Dry Sand Processes:
Particulate Matter (PM)
0.01 grains per dry standard cubic feet gr/dscf and
97090.0 tons/month
0.01 grains per dry standard cubic feet gr/dscf and
3504000 tons/year 4.89 58.67
PM‐10
0.01 grains per dry standard cubic feet gr/dscf and
97090.0 tons/month
0.01 grains per dry standard cubic feet gr/dscf and
3504000 tons/year 1.72 20.68
PM‐2.5
0.01 grains per dry standard cubic feet gr/dscf and
97090.0 tons/month
0.01 grains per dry standard cubic feet gr/dscf and
3504000 tons/year 1.30 15.59
Dryer #1 ‐ N.G. Combustion:
Carbon Dioxide 40.2 million scf N.G./month 481.8 million scf N.G./year 2409.00 28908.00
Carbon Monoxide 40.2 million scf N.G./month 481.8 million scf N.G./year 4.91 58.97
Nitrogen Oxides 40.2 million scf N.G./month 481.8 million scf N.G./year 3.48 41.77
Particulate Matter (PM) 40.2 million scf N.G./month 481.8 million scf N.G./year 0.00 0.00
PM‐10 40.2 million scf N.G./month 481.8 million scf N.G./year 0.00 0.00
PM‐2.5 40.2 million scf N.G./month 481.8 million scf N.G./year 0.02 0.18
Sulfur Dioxide 40.2 million scf N.G./month 481.8 million scf N.G./year 0.01 0.14
Volatile Organic Compounds 40.2 million scf N.G./month 481.8 million scf N.G./year 0.11 1.32
Dryer #1 ‐ Sand Drying:
Particulate Matter (PM)
0.01 grains per dry standard cubic feet gr/dscf and
2093.6 million dscf/month
0.01 grains per dry standard cubic feet gr/dscf and
25123.68 million dscf/year 1.50 17.94
PM‐10
0.01 grains per dry standard cubic feet gr/dscf and
2093.6 million dscf/month
0.01 grains per dry standard cubic feet gr/dscf and
25123.68 million dscf/year 1.50 17.94
PM‐2.5
0.01 grains per dry standard cubic feet gr/dscf and
2093.6 million dscf/month
0.01 grains per dry standard cubic feet gr/dscf and
25123.68 million dscf/year 1.50 17.94
Storage Silos:
Particulate Matter (PM) 219000.0 tons/month 2628000 tons/year 5.06 60.71
PM‐10 219000.0 tons/month 2628000 tons/year 0.82 9.81
PM‐2.5 219000.0 tons/month 2628000 tons/year 0.31 3.68
Truck Loadout:
Application Revision 5/16/2012, Page 18A of 131
OTTAWA PLANT PROPOSED PERMIT LIMITATIONS, THROUGHPUTS AND EMISSIONS RATES BY PROCESS
Proposed Limitations and/or Maximum Short
Term Throughputs
Proposed Limitations and/or Maximum Annual Throughputs
Proposed Permit Limits
PPM TPY
Particulate Matter (PM) 219000.0 tons/month 2628000 tons/year 0.08 0.98
PM‐10 219000.0 tons/month 2628000 tons/year 0.04 0.46
PM‐2.5 219000.0 tons/month 2628000 tons/year 0.01 0.14
Wet Plant I:
Particulate Matter (PM) 730000.0 tons/month 8760000 tons/year 4.62 55.44
PM‐10 730000.0 tons/month 8760000 tons/year 1.77 21.20
PM‐2.5 730000.0 tons/month 8760000 tons/year 0.23 2.70
Wet Plant II:
Particulate Matter (PM) 730000.0 tons/month 8760000 tons/year 0.83 9.95
PM‐10 730000.0 tons/month 8760000 tons/year 0.28 3.31
PM‐2.5 730000.0 tons/month 8760000 tons/year 0.04 0.52
Application Revision 5/16/2012, Page 18B of 131

OTTAWA PLANT POTENTIAL HAP EMISSIONS SUMMARY
Hazardous Air Pollutant Emissions by Highest to Smallest PTE PPY TPY
Ammonia 1541.7600 0.77
Ethane 1493.5800 0.75
N‐Pentane 1252.6800 0.63
Methane 1108.1400 0.55
n‐Butane 1011.7800 0.51
N‐Hexane 867.2400 0.43
Propane 770.8800 0.39
Formaldehyde 36.1350 0.02
Toluene 1.6381 0.00
Zinc 1.3972 0.00
Benzene 1.0118 0.00
Nickel 1.0118 0.00
Dichlorobenzene, mixed isomers 0.5782 0.00
Molybdenum 0.5300 0.00
Copper 0.4095 0.00
Naphthalene 0.2939 0.00
Barium 0.2120 0.00
Manganese 0.1831 0.00
Mercury 0.1253 0.00
Vanadium 0.1108 0.00
Chromium 0.0675 0.00
Cadmium 0.0530 0.00
Lead 0.0241 0.00
Selenium 0.0116 0.00
2‐Methyl Naphthalene 0.0116 0.00
Arsenic 0.0096 0.00
Phenanthrene 0.0082 0.00
Dimethylbenz(a)anthracene 0.0077 0.00
Cobalt 0.0040 0.00
Pyrene 0.0024 0.00
Fluoranthene 0.0014 0.00
Fluorene 0.0013 0.00
Anthracene 0.0012 0.00
Chrysene 0.0009 0.00
Acenaphthene 0.0009 0.00
3‐Methylcholanthrene 0.0009 0.00
Benzo (b) fluoranthene 0.0009 0.00
Benzo (k) fluoranthene 0.0009 0.00
Benzo (a) anthracene 0.0009 0.00
Indeno(1,2,3‐cd)pyrene 0.0009 0.00
Benzo (g,h,i) perylene 0.0006 0.00
Benzo (a) pyrene 0.0006 0.00
Dibenzo(a,h) anthracene 0.0006 0.00
Beryllium 0.0006 0.00
Total 8089.9086 4.04
Application Revision 5/14/2012, Page 19 of 131

Coarse Sand
Figure 1- Conveyor, SCC: 30502006 (controlled)
Storage Piles
Wet Sand (moisture content > 12%)
Stacking Conveyor
Figure 4 – Belt Conveyor, SCC: RADIALSTACKER
1.3
1.4
5*(0.0032) * (lb / ton)
2
U
E kM
Where:k = 0.11/0.35/0.74 (particle size multiplier (dimensionless), PM2.5/PM-10/PM respectively)U = 10.7 mph, Average Annual Wind Speed - AP-42, Table 7.1-9, PeoriaM = 12%, material moisture content (%). This is accounted for in the equation so no further control for wet processing is applied to the emission calculations
Basis for Batch Drop Equation Reference: AP-42 - Section 13.2.4 Aggregate Handling & Storage Piles; Batch/Continuous Drop Equation (1)
Wet Sand (moisture content > 12%)
Basis for Conveyors: AP-42, Table 11.19.2-2 Crushed Stone Processing and Pulverized Mineral Processing, SCC 30502006 (controlled)
11.19.2.2 Emissions and Controls Crushed Stone Processing states:“Typically, wet material contains >1.5 percent water”
Figure 2 - Gate Feeder, SCC: 30502006 (controlled)
Basis for Gate Feeder: AP-42, Table 11.19.2-2 Crushed Stone Processing and Pulverized Mineral Processing, SCC 30502006 (controlled)
Wet Sand (moisture content > 5%)Below
Ground Tunnel
Storage Piles
The operation is essentially a wet sand transfer point so the same controlled emission factor for SCC 30502006 (controlled) would apply.
As shown, the fugitive dust from the transfer operation is 100% captured.
The tunnel acts as a gravity control chamber so an additional control efficiency of 90% was applied to the emission factor.
Figure 6 – Hydrosizer, SCC: 30502006 (controlled)Basis for Hydrosizer: AP-42, Table 11.19.2-2 Crushed Stone Processing and Pulverized Mineral Processing, SCC 30502006 (controlled)
Wet Sand
Wet Sand (moisture content > 12%)
Belt Feeder
Figure 3 - Feed Hopper and Belt Feeder, SCC: 30502006 (controlled)Basis for Feed Hoppers and Belt Feeders: AP-42, Table 11.19.2-2 Crushed Stone Processing and Pulverized Mineral Processing, SCC 30502006 (controlled)
The process is essentially a wet sand transfer point, so the controlled emission factor for a conveyor transfer point SCC 30502006 (controlled) was applied.
The process fits the definition of conveyor transfer point as identified in Table 11.19.2-2 “Conveyor Transfer Point (controlled) (SCC 3-05-020-06). AP-42 states: “Controlled sources (with wet suppression) are those that are part of the processing plant that employs current wet suppression technology similar to the study group. The moisture content of the study group without wet suppression systems operating (uncontrolled) ranged from 0.21 to 1.3 percent, and the same facilities operating wet suppression systems (controlled) ranged from 0.55 to 2.88 percent.”
The batch drop equation describedin Figure 4 applies.
Stacking Cyclone
Wet Sand
Figure 5 – Dewatering Cyclone SCC: CYCLONEBasis for Batch Drop Equation Reference: AP-42 - Section 13.2.4 Aggregate Handling & Storage Piles; Batch/Continuous Drop Equation (1)
Water to pond
Sand/Water Slurry
Storage Piles
Material Feed
fine light material in slurry sent to water
trough
Turbid Water
wet dense material in slurry sent to water trough
The process is a separation activity and the water layer acts as an enclosure; as such, the material transfer in and out of the unit was conservatively assumed as similar to a conveyor transfer point SCC 30502006 (controlled).
EMISSION UNIT DESCRIPTIONS AND REFERENCES FOR EMISSION FACTORS
Application Revision 5/14/2012, Page 20 of 131

Water and Fines Conveyor
Screen
Figure 7- Dewatering Screen, SCC: 30502002 (controlled)
Wet Sand (moisture content > 5 to 12%)
Basis for Screen: AP-42, Table 11.19.2-2 Crushed Stone Processing and Pulverized Mineral Processing, Screening (controlled) SCC 3-05-020-02
Water
Dry Sand
Belt Feeder
Figure 8 - Feed Hopper, SCC: 30503813
Basis for Feed Hoppers: AP-42, Table 11.19.2-4 Crushed Stone Processing and Pulverized Mineral Processing, SCC 30503813, Product Storage with Fabric Filter Control
The feed hopper exhaust is controlled by a fabric filter bin vent control device.
The process is completely covered (enclosed)
Feed Hopper
Dry SandTo
Atmosphere
Figure 9 - Belt Feeder, Bucket Elevator, SCC: 30502006 (controlled)
Basis for Conveyors: AP-42, Table 11.19.2-2 Crushed Stone Processing and Pulverized Mineral Processing, SCC 30502006 (controlled)
Belt Conveyor
The process is covered by shrouds, skirts and other enclosures to prevent fugitive dust as shown by the hard line drawn around the belt conveyor.
The dust from the process is carried on in the process line until it is picked up and exhausted to a control device.
The emission unit is indirectly controlled, to account for this the controlled emission factor for this type of transfer point was applied.
Dry Sand
Dust Control Tap
Figure 10 – Emission Units Controlled by Baghouse, SCC: NONEBasis for Conveyors: AP-42, Table 11.19.2-2 Crushed Stone Processing and Pulverized Mineral Processing, SCC 30502006 (controlled)
The process is covered by shrouds, skirts and/or other enclosures to prevent fugitive dust as shown by the hard line drawn around the emission unit. The example illustration is for a screen; however, all the emission units controlled by the dust collector are configured in a similar manner.
The dust from the process either has a dust collection tap or is carried on in the process line until it is picked up and exhausted to the control device.
Dry Sand
Next Process
Baghouse BH02 Dust Control Tap
Screen
Covered Coveyor
Fine Material
Coarse Material
Dry Sand
Basis for Feed Hoppers: AP-42, Table 11.19.2-4 Crushed Stone Processing and Pulverized Mineral Processing, SCC 30503813, Product Storage with Fabric Filter Control
The exhaust is vented to a fabric filter bin vent control device.
The process is covered and completely (enclosed).
StorageSilo
Dry SandTo
Atmosphere
Figure 11 – Dry Screen, SCC: 30502006 (controlled)
Cargo Trailer
Figure 12 – Loading Spout, SCC: LOADOUT
The emissions calculated from the batch drop equation are exhausted to a filter module and vented back into the storage silo.
The process is completely covered (enclosed).
The connection between the cargo trailer and loadout spout is sealed during loading.
Filter Module
1.3
1.4
5*(0.0032) * (lb / ton)
2
U
E kM
Where:k = 0.11/0.35/0.74 (particle size multiplier (dimensionless), PM2.5/PM-10/PM respectively)U = 10.7 mph, Average Annual Wind Speed - AP-42, Table 7.1-9, PeoriaM = 1%, material moisture content (%)
Basis for Batch Drop Equation Reference: AP-42 - Section 13.2.4 Aggregate Handling & Storage Piles; Batch/Continuous Drop Equation (1)
EMISSION UNIT DESCRIPTIONS AND REFERENCES FOR EMISSION FACTORS
Bucket Elevator
Next Process
Application Revision 5/14/2012, Page 21 of 131

EMISSION{ CALCULATIONS
I. Fugitive Emissions Mining A Emission Factor Calculation for Emissions from Overburden Removal
PM10 Equation Factor Reference: AP-42, Table 11.9-1 Emission Factor Equations for Uncontrolled Open Dust Sources at Western Surface Coal Mines
1.5
1.4
1.(6.9)*0.75 0.75lbPM10 / hr
(7.9)
PM Equation Factor Reference: AP-42, Table 11.9-1 Emission Factor Equations for Uncontrolled Open Dust Sources at Western Surface Coal Mines
1.2
1.3
5.7(6.9)3.94lbPM / hr
(7.9)
Where: Surface Moisture Content = 7.9 percent Silt Content - Overburden = 6.9 percent
B. Emission Factor Calculation for Emissions from Ore Mining on Unpaved Roads
Ore-mining transport distance calculation Plant mining capacity: = 2,000,000 ton wet sand/yr Haul capacity: 12 tons/load Hauling distance to feeder: 0.25 miles (conveyors are used to transfer the raw feed to the wet processing area) Hauling vehicle miles travelled: 2,000,000 ton/yr / 12 ton/load = 200,000 loads x 0.1 mile (roundtrip)/load = 20,000 VMT/yr
Equation Reference: AP-42, Section 13.2.2 Unpaved Roads, Equation 1a
* (3* ( 65) P / 365) **12
(T)3
)( a bs Wk
Where: k (lb/VMT) = 0.15/1.5/4.9 (Table 13.2.2-2. Constants for Equations 1a, PM2.5/PM10/PM respectively) a = 0.9/0.9/0.7 (Table 13.2.2-2. Constants for Equations 1a, PM2.5/PM10/PM respectively)
Application Revision 5/14/2012, Page 22 of 131

b = 0.45 (Table 13.2.2-2. Constants for Equations 1a, PM2.5/PM10/PM) S = 8.3 (Table 13.2.2-1. Typical Silt Content Values Of Surface Material on Industrial Unpaved Roads) W = 50 (mean vehicle weight (tons)) P = number of "wet" days with at least 0.254 mm (0.01 in) of precipitation during the averaging period: P = 120 wet days for the region of Illinois that the proposed source will operate T = Site specific techniques to reduce fugitive dust (assumes 90 percent reduction efficiency)
0.9 0.45
*[(365 120) /8.3 50
0.15* * 0.0256lb PM2.5 / VMT1
365]*0.12 3
0.9 0.45
*[(365 120)8.3 50
1.5* * 0.256 lb PM10 / VMT12
/ 365]*0.13
0.7 0.45
[(365 128.3 50
4.9* * 0.837 lb PM / V0) / 365]*0.1 MT12 3
Storage Piles A. Emission Factor for Storage Piles Calculation: AP-42 - Section 13.2.5 Industrial Wind Erosion, Table 13.2.5-5 Truck Haul Roads A. Basis for semi-trailer hauling distance
Proposed maximum permitted transfer capacity: 1,600,000 ton/yr Haul truck capacity: 20 ton/load Distance travelled: 1200 feet (round trip)2 Hauling vehicle miles travelled: 1,600,000 ton/yr/20 tons/load x 1200 feet/trip/5280 feet/mile = 18,181 VMT
B. Emission Factor Calculation for Emissions from Paved Roads
Equation Reference: AP-42 - Section 13.2.1 Fugitive Emissions from Paved Roads 0.91 1.02* (sL) * ( *(1 P / 4N)) E k W
Where: k = 0.00054 (particle size multiplier for PM2.5)
Application Revision 5/14/2012, Page 23 of 131

k = 0.0022 (particle size multiplier for PM10) k = 0.011 (particle size multiplier for PM) sL = 8.2 (road surface silt loading (grams per square meter) (g/m2), AP-42, Table 13.2.1-3 for the quarry industry) W = 40 (average weight (tons) of the vehicles traveling the road) P = number of "wet" days with at least 0.254 mm (0.01 in) of precipitation during the averaging period: P = 120 wet days for the region of Illinois that the proposed source will operate N = number of days in the averaging period (e.g., 365 for annual, 91 for seasonal, 30 for monthly)
0.91 1.02 *[1 120 / (4 *30.00054 * (8.2) * (28) 0.10 lb PM6 2.5 / VMT5)] 0.91 1.02 *[1 120 / (4 *30.0022 * (8.2) * (28) 0.41 lb P65 M) MT] 10 / V
0.91 1.02 *[1 120 / (4 *360.011* (8.2) * (28) 2.05lb PM5 ] M) / V T
Application Revision 5/14/2012, Page 24 of 131

EMISSIONS CALCULATIONS
I. Fugitive: Total PM Emissions (TPY): 37.39
A. PM Emissions by Equipment Unit ID (EID):
(1)Item
(3)Emission Unit Desription
(4)Max Short Term Throughput
(5)Max Annual Throughput
(6)Emission Factor
(7)* Capture
Efficiency(10)TPM
(11)TPY
(2)EID
(8)**Control
Efficiency(9)
Control Description(12)
Emission Factor Reference ID
2857.2 VMT/month 34286.64 VMT/year 0.837 lb/VMT NA 1.1957 14.35MNG171 NA >12 percent moisture Mining
41.7 hour/month 500 hour/year 3.94 lb/hour NA 0.0821 0.99OR172 NA Overburden
1686.3 VMT/month 20235.6 VMT/year 2.05 lb/VMT NA 1.7285 20.74PR173 NA Truck traffic
730.0 hour/month 8760 hour/year 0.3 lb/hr/50 piles NA 0.1095 1.31SP174 NA Stockpile
B. Proposed Permit Limits for PM from Fugitive:
730.0 hour/month 8760 hour/year 37.393.1158
E. Notes:
As defined in I.A. (7), (8) and (9) for sources with capture and/or control efficiencies for pollution control equipment.
*The term “capture system” for the purpose of this application means the equipment (including hoods, ducts, etc.) used to contain, capture, or transport an air contaminant to a control device. In addition, the term “capture efficiency” means the weight per unit time of an air contaminant entering a capture system and delivered to a control device, divided by the weight per unit time of the air contaminant generated by the source, expressed as a percentage. Therefore, if the emission unit is not exhausted to a control device, the capture system and capture efficiency is not applicable (NA). If the emission unit is using an emission factor with an overall emission reduction efficiency included in the factor, “AP‐42” has been assigned to the capture efficiency.
**The term “control system” for the purpose of this application means any control device or technique which is designed and operated to reduce the quantity of air contaminants emitted to the atmosphere. The term “control efficiency” means the percentage by which a control device or technique reduces the emissions from a stationary source. If the emission unit is controlled by a control device, the capture and control efficiencies are identified. If the emission unit is using an emission factor with an overall emission reduction efficiency included in the factor, “AP‐42” has been assigned to the control efficiency.
C. Emission Factor Source by Reference ID:
Mining AP‐42, Section 13.2.2 Unpaved Roads, Equation 1a
Overburden AP‐42, Table 11.9‐1 Emission Factor Equations for Uncontrolled Open Dust Sources at Western Surface Coal Mines
Stockpile AP‐42 ‐ Section 13.2.5 Industrial Wind Erosion, Table 13.2.5‐5
Truck traffic AP‐42 ‐ Section 13.2.1 Fugitive Emissions from Paved Roads
D. Example Calculation for Item 174:
1 hour
hour
0.3 lb
hr/50 piles * ((1 ‐ 0 % capture/100) + (1 ‐ 0 % control/100))
ton
2000 lb=
year
1.31 ton PM
year
8760 Hours
Application Revision 5/14/2012, Page 25 of 131

EMISSIONS CALCULATIONS
I. Fugitive: Total PM‐10 Emissions (TPY): 9.38
A. PM‐10 Emissions by Equipment Unit ID (EID):
(1)Item
(3)Emission Unit Desription
(4)Max Short Term Throughput
(5)Max Annual Throughput
(6)Emission Factor
(7)* Capture
Efficiency(10)TPM
(11)TPY
(2)EID
(8)**Control
Efficiency(9)
Control Description(12)
Emission Factor Reference ID
2857.2 VMT/month 34286.64 VMT/year 0.256 lb/VMT NA 0.3657 4.39MNG171 NA >12 percent moisture Mining
41.7 hour/month 500 hour/year 0.75 lb/hour NA 0.0156 0.19OR172 NA Overburden
1686.3 VMT/month 20235.6 VMT/year 0.41 lb/VMT NA 0.3457 4.15PR173 NA Truck traffic
730.0 hour/month 8760 hour/year 0.15 lb/hr/50 piles NA 0.0548 0.66SP174 NA Stockpile
B. Proposed Permit Limits for PM‐10 from Fugitive:
730.0 hour/month 8760 hour/year 9.380.7818
E. Notes:
As defined in I.A. (7), (8) and (9) for sources with capture and/or control efficiencies for pollution control equipment.
*The term “capture system” for the purpose of this application means the equipment (including hoods, ducts, etc.) used to contain, capture, or transport an air contaminant to a control device. In addition, the term “capture efficiency” means the weight per unit time of an air contaminant entering a capture system and delivered to a control device, divided by the weight per unit time of the air contaminant generated by the source, expressed as a percentage. Therefore, if the emission unit is not exhausted to a control device, the capture system and capture efficiency is not applicable (NA). If the emission unit is using an emission factor with an overall emission reduction efficiency included in the factor, “AP‐42” has been assigned to the capture efficiency.
**The term “control system” for the purpose of this application means any control device or technique which is designed and operated to reduce the quantity of air contaminants emitted to the atmosphere. The term “control efficiency” means the percentage by which a control device or technique reduces the emissions from a stationary source. If the emission unit is controlled by a control device, the capture and control efficiencies are identified. If the emission unit is using an emission factor with an overall emission reduction efficiency included in the factor, “AP‐42” has been assigned to the control efficiency.
C. Emission Factor Source by Reference ID:
Mining AP‐42, Section 13.2.2 Unpaved Roads, Equation 1a
Overburden AP‐42, Table 11.9‐1 Emission Factor Equations for Uncontrolled Open Dust Sources at Western Surface Coal Mines
Stockpile AP‐42 ‐ Section 13.2.5 Industrial Wind Erosion, Table 13.2.5‐5
Truck traffic AP‐42 ‐ Section 13.2.1 Fugitive Emissions from Paved Roads
D. Example Calculation for Item 174:
1 hour
hour
0.15 lb
hr/50 piles * ((1 ‐ 0 % capture/100) + (1 ‐ 0 % control/100))
ton
2000 lb=
year
0.66 ton PM‐10
year
8760 Hours
Application Revision 5/14/2012, Page 26 of 131

EMISSIONS CALCULATIONS
I. Fugitive: Total PM2.5 Emissions (TPY): 1.75
A. PM2.5 Emissions by Equipment Unit ID (EID):
(1)Item
(3)Emission Unit Desription
(4)Max Short Term Throughput
(5)Max Annual Throughput
(6)Emission Factor
(7)* Capture
Efficiency(10)TPM
(11)TPY
(2)EID
(8)**Control
Efficiency(9)
Control Description(12)
Emission Factor Reference ID
2857.2 VMT/month 34286.64 VMT/year 0.0256 lb/VMT NA 0.0366 0.44MNG171 NA >12 percent moisture Mining
41.7 hour/month 500 hour/year 0.75 lb/hour NA 0.0156 0.19OR172 NA Overburden
1686.3 VMT/month 20235.6 VMT/year 0.1 lb/VMT NA 0.0843 1.01PR173 NA Truck traffic
730.0 hour/month 8760 hour/year 0.025 lb/hr/50 piles NA 0.0091 0.11SP174 NA Stockpile
B. Proposed Permit Limits for PM2.5 from Fugitive:
730.0 hour/month 8760 hour/year 1.750.1456
E. Notes:
As defined in I.A. (7), (8) and (9) for sources with capture and/or control efficiencies for pollution control equipment.
*The term “capture system” for the purpose of this application means the equipment (including hoods, ducts, etc.) used to contain, capture, or transport an air contaminant to a control device. In addition, the term “capture efficiency” means the weight per unit time of an air contaminant entering a capture system and delivered to a control device, divided by the weight per unit time of the air contaminant generated by the source, expressed as a percentage. Therefore, if the emission unit is not exhausted to a control device, the capture system and capture efficiency is not applicable (NA). If the emission unit is using an emission factor with an overall emission reduction efficiency included in the factor, “AP‐42” has been assigned to the capture efficiency.
**The term “control system” for the purpose of this application means any control device or technique which is designed and operated to reduce the quantity of air contaminants emitted to the atmosphere. The term “control efficiency” means the percentage by which a control device or technique reduces the emissions from a stationary source. If the emission unit is controlled by a control device, the capture and control efficiencies are identified. If the emission unit is using an emission factor with an overall emission reduction efficiency included in the factor, “AP‐42” has been assigned to the control efficiency.
C. Emission Factor Source by Reference ID:
Mining AP‐42, Section 13.2.2 Unpaved Roads, Equation 1a
Overburden AP‐42, Table 11.9‐1 Emission Factor Equations for Uncontrolled Open Dust Sources at Western Surface Coal Mines
Stockpile AP‐42 ‐ Section 13.2.5 Industrial Wind Erosion, Table 13.2.5‐5
Truck traffic AP‐42 ‐ Section 13.2.1 Fugitive Emissions from Paved Roads
D. Example Calculation for Item 174:
1 hour
hour
0.025 lb
hr/50 piles * ((1 ‐ 0 % capture/100) + (1 ‐ 0 % control/100))
ton
2000 lb=
year
0.11 ton PM2.5
year
8760 Hours
Application Revision 5/14/2012, Page 27 of 131

II. Wet Plant I A. Emission Factor Calculation for Emissions from Batch Dropping of Raw Material
Equation Reference: AP-42 - Section 13.2.4 Aggregate Handling & Storage Piles; Batch/Continuous Drop Equation (1)
1.3
1.4
5*(0.0032)* (lb / ton)
2
U
E kM
Where: k = 0.11/0.35/0.74 (particle size multiplier (dimensionless), PM2.5/PM-10/PM respectively) U = 10.7 mph, Average Annual Wind Speed - AP-42, Table 7.1-9, Peoria M = 12%, material moisture content (%)
1.3
1.4
10.70.00008 lb PM2.55
0.11*(0.0032)* (lb PM2.5 / ton)ton12
2
1.3
1.4
10.70.00025lb PM105
0.35*(0.0032) * (lb PM10 / ton)ton12
2
1.3
1.4
10.70.00052lb PM5
0.74*(0.0032)* (lb PM / ton)ton12
2
Application Revision 5/14/2012, Page 28 of 131

EMISSIONS CALCULATIONS
II. Wet Plant I: Total PM Emissions (TPY): 55.44
A. PM Emissions by Equipment Unit ID (EID):
(1)Item
(3)Emission Unit Desription
(4)Max Short Term Throughput
(5)Max Annual Throughput
(6)Emission Factor
(7)* Capture
Efficiency(10)TPM
(11)TPY
(2)EID
(8)**Control
Efficiency(9)
Control Description(12)
Emission Factor Reference ID
Belt Conveyor 730000.0 tons/month 8760000 tons/year 0.00014 lb/ton AP‐42 0.0511 0.61C1218 AP‐42 >12% moisture (See Figure 1) 30502006 (controlled)
Belt Conveyor 730000.0 tons/month 8760000 tons/year 0.00014 lb/ton AP‐42 0.0511 0.61C1319 AP‐42 >12% moisture (See Figure 1) 30502006 (controlled)
Belt Conveyor 730000.0 tons/month 8760000 tons/year 0.00014 lb/ton AP‐42 0.0511 0.61C014 AP‐42 >12% moisture (See Figure 1) 30502006 (controlled)
Belt Conveyor 438000.0 tons/month 5256000 tons/year 0.00014 lb/ton AP‐42 0.0307 0.37C1523 AP‐42 >12% moisture (See Figure 1) 30502006 (controlled)
Belt Conveyor 365000.0 tons/month 4380000 tons/year 0.00014 lb/ton AP‐42 0.0256 0.31C1625 AP‐42 >12% moisture (See Figure 1) 30502006 (controlled)
Belt Conveyor 365000.0 tons/month 4380000 tons/year 0.00014 lb/ton AP‐42 0.0256 0.31C1828 AP‐42 >12% moisture (See Figure 4) 30502006 (controlled)
Belt Conveyor 365000.0 tons/month 4380000 tons/year 0.00014 lb/ton AP‐42 0.0256 0.31C1950 AP‐42 >12% moisture (See Figure 1) 30502006 (controlled)
Belt Conveyor 584000.0 tons/month 7008000 tons/year 0.00014 lb/ton AP‐42 0.0409 0.49C2152 AP‐42 >12% moisture (See Figure 1) 30502006 (controlled)
Belt Conveyor 584000.0 tons/month 7008000 tons/year 0.00014 lb/ton AP‐42 0.0409 0.49C2254 AP‐42 >12% moisture (See Figure 1) 30502006 (controlled)
Belt Conveyor 584000.0 tons/month 7008000 tons/year 0.00014 lb/ton AP‐42 0.0409 0.49C2557 AP‐42 >12% moisture (See Figure 1) 30502006 (controlled)
Belt Conveyor 730000.0 tons/month 8760000 tons/year 0.00014 lb/ton AP‐42 0.0511 0.61C025 AP‐42 >12% moisture (See Figure 1) 30502006 (controlled)
Belt Conveyor 730000.0 tons/month 8760000 tons/year 0.00014 lb/ton AP‐42 0.0511 0.61C037 AP‐42 >12% moisture (See Figure 1) 30502006 (controlled)
Belt Conveyor 730000.0 tons/month 8760000 tons/year 0.00014 lb/ton AP‐42 0.0511 0.61C048 AP‐42 >12% moisture (See Figure 1) 30502006 (controlled)
Belt Conveyor 730000.0 tons/month 8760000 tons/year 0.00014 lb/ton AP‐42 0.0511 0.61C059 AP‐42 >12% moisture (See Figure 4) 30502006 (controlled)
Belt Conveyor 730000.0 tons/month 8760000 tons/year 0.00014 lb/ton AP‐42 0.0511 0.61C0915 AP‐42 >12% moisture (See Figure 1) 30502006 (controlled)
Belt Conveyor 730000.0 tons/month 8760000 tons/year 0.00014 lb/ton AP‐42 0.0511 0.61C1016 AP‐42 >12% moisture (See Figure 1) 30502006 (controlled)
Belt Conveyor 730000.0 tons/month 8760000 tons/year 0.00014 lb/ton AP‐42 0.0511 0.61C1117 AP‐42 >12% moisture (See Figure 1) 30502006 (controlled)
Belt Conveyor 730000.0 tons/month 8760000 tons/year 0.00014 lb/ton AP‐42 0.0511 0.61C1420 AP‐42 >12% moisture (See Figure 1) 30502006 (controlled)
Belt Conveyor 365000.0 tons/month 4380000 tons/year 0.00052 lb/ton NA 0.0949 1.14C1726 NA >12% moisture (See Figure 4) RadialStacker
Belt Conveyor 365000.0 tons/month 4380000 tons/year 0.00052 lb/ton NA 0.0949 1.14C2051 NA >12% moisture (See Figure 4) RadialStacker
Belt Conveyor 584000.0 tons/month 7008000 tons/year 0.00052 lb/ton NA 0.1518 1.82C2355 NA >12% moisture (See Figure 4) RadialStacker
Belt Conveyor 584000.0 tons/month 7008000 tons/year 0.00052 lb/ton NA 0.1518 1.82C2456 NA >12% moisture (See Figure 4) RadialStacker
Belt Conveyor 584000.0 tons/month 7008000 tons/year 0.00052 lb/ton NA 0.1518 1.82C2658 NA >12% moisture (See Figure 4) RadialStacker
Belt Feeder 438000.0 tons/month 5256000 tons/year 0.00014 lb/ton AP‐42 0.0307 0.37F0322 AP‐42 >12% moisture (See Figure 3) 30502006 (controlled)
Dewatering Cyclone 365000.0 tons/month 4380000 tons/year 0.00052 lb/ton NA 0.0949 1.14CY0131 NA >12% moisture (See Figure 5) Cyclone
Dewatering Cyclone 365000.0 tons/month 4380000 tons/year 0.00052 lb/ton NA 0.0949 1.14CY0232 NA >12% moisture (See Figure 5) Cyclone
Dewatering Cyclone 365000.0 tons/month 4380000 tons/year 0.00052 lb/ton NA 0.0949 1.14CY0339 NA >12% moisture (See Figure 5) Cyclone
Dewatering Cyclone 365000.0 tons/month 4380000 tons/year 0.00052 lb/ton NA 0.0949 1.14CY0440 NA >12% moisture (See Figure 5) Cyclone
Dewatering Screen 365000.0 tons/month 4380000 tons/year 0.0022 lb/ton AP‐42 0.4015 4.82DWS0135 AP‐42 >12% moisture (See Figure 7) 30502002 (controlled)
Dewatering Screen 365000.0 tons/month 4380000 tons/year 0.0022 lb/ton AP‐42 0.4015 4.82DWS0236 AP‐42 >12% moisture (See Figure 7) 30502002 (controlled)
Dewatering Screen 365000.0 tons/month 4380000 tons/year 0.0022 lb/ton AP‐42 0.4015 4.82DWS0341 AP‐42 >12% moisture (See Figure 7) 30502002 (controlled)
Double Deck Screen 438000.0 tons/month 5256000 tons/year 0.0022 lb/ton AP‐42 0.4818 5.78SCR0124 AP‐42 >12% moisture (See Figure 7) 30502002 (controlled)
Feed Hopper 730000.0 tons/month 8760000 tons/year 0.00014 lb/ton AP‐42 0.0511 0.61FH011 AP‐42 >12% moisture (See Figure 3) 30502006 (controlled)
Feed Hopper 438000.0 tons/month 5256000 tons/year 0.00014 lb/ton AP‐42 0.0307 0.37FH0321 AP‐42 >12% moisture (See Figure 3) 30502006 (controlled)
Gate Feeder 292000.0 tons/month 3504000 tons/year 0.00014 lb/ton AP‐42 0.0204 0.25G0160 AP‐42 >5% moisture (See Figure 2) 30502006 (controlled)
Gate Feeder 292000.0 tons/month 3504000 tons/year 0.00014 lb/ton AP‐42 0.0204 0.25G0261 AP‐42 >5% moisture (See Figure 2) 30502006 (controlled)
Gate Feeder 292000.0 tons/month 3504000 tons/year 0.00014 lb/ton AP‐42 0.0204 0.25G0362 AP‐42 >5% moisture (See Figure 2) 30502006 (controlled)
Gate Feeder 292000.0 tons/month 3504000 tons/year 0.00014 lb/ton AP‐42 0.0204 0.25G0463 AP‐42 >5% moisture (See Figure 2) 30502006 (controlled)
Gate Feeder 292000.0 tons/month 3504000 tons/year 0.00014 lb/ton AP‐42 0.0204 0.25G0564 AP‐42 >5% moisture (See Figure 2) 30502006 (controlled)
Application Revision 5/14/2012, Page 29 of 131

EMISSIONS CALCULATIONS
II. Wet Plant I: Total PM Emissions (TPY): 55.44
A. PM Emissions by Equipment Unit ID (EID):
(1)Item
(3)Emission Unit Desription
(4)Max Short Term Throughput
(5)Max Annual Throughput
(6)Emission Factor
(7)* Capture
Efficiency(10)TPM
(11)TPY
(2)EID
(8)**Control
Efficiency(9)
Control Description(12)
Emission Factor Reference ID
Gate Feeder 292000.0 tons/month 3504000 tons/year 0.00014 lb/ton AP‐42 0.0204 0.25G0665 AP‐42 >5% moisture (See Figure 2) 30502006 (controlled)
Gate Feeder 292000.0 tons/month 3504000 tons/year 0.00014 lb/ton AP‐42 0.0204 0.25G0766 AP‐42 >5% moisture (See Figure 2) 30502006 (controlled)
Gate Feeder 292000.0 tons/month 3504000 tons/year 0.00014 lb/ton AP‐42 0.0204 0.25G0867 AP‐42 >5% moisture (See Figure 2) 30502006 (controlled)
Gate Feeder 292000.0 tons/month 3504000 tons/year 0.00014 lb/ton AP‐42 0.0204 0.25G0968 AP‐42 >5% moisture (See Figure 2) 30502006 (controlled)
Gate Feeder 292000.0 tons/month 3504000 tons/year 0.00014 lb/ton AP‐42 0.0204 0.25G1069 AP‐42 >5% moisture (See Figure 2) 30502006 (controlled)
Gate Feeder 292000.0 tons/month 3504000 tons/year 0.00014 lb/ton AP‐42 0.0204 0.25G1170 AP‐42 >5% moisture (See Figure 2) 30502006 (controlled)
Gate Feeder 292000.0 tons/month 3504000 tons/year 0.00014 lb/ton AP‐42 0.0204 0.25G1271 AP‐42 >5% moisture (See Figure 2) 30502006 (controlled)
Grizzly Feeder 730000.0 tons/month 8760000 tons/year 0.00014 lb/ton AP‐42 0.0511 0.61F012 AP‐42 >12% moisture (See Figure 2) 30502006 (controlled)
Hydrosizer 365000.0 tons/month 4380000 tons/year 0.00014 lb/ton AP‐42 0.0256 0.31HY0133 AP‐42 >12% moisture (See Figure 6) 30502006 (controlled)
Hydrosizer 365000.0 tons/month 4380000 tons/year 0.00014 lb/ton AP‐42 0.0256 0.31HY0234 AP‐42 >12% moisture (See Figure 6) 30502006 (controlled)
Impact Crusher 730000.0 tons/month 8760000 tons/year 0.0012 lb/ton AP‐42 0.4380 5.26CR013 AP‐42 >12% moisture 30502003 (controlled)
VSI Crusher 365000.0 tons/month 4380000 tons/year 0.0012 lb/ton AP‐42 0.2190 2.63CR0227 AP‐42 >12% moisture 30502003 (controlled)
B. Proposed Permit Limits for PM from Wet Plant I:
730000.0 tons/month 8760000 tons/year 55.444.6202
E. Notes:
As defined in I.A. (7), (8) and (9) for sources with capture and/or control efficiencies for pollution control equipment.
*The term “capture system” for the purpose of this application means the equipment (including hoods, ducts, etc.) used to contain, capture, or transport an air contaminant to a control device. In addition, the term “capture efficiency” means the weight per unit time of an air contaminant entering a capture system and delivered to a control device, divided by the weight per unit time of the air contaminant generated by the source, expressed as a percentage. Therefore, if the emission unit is not exhausted to a control device, the capture system and capture efficiency is not applicable (NA). If the emission unit is using an emission factor with an overall emission reduction efficiency included in the factor, “AP‐42” has been assigned to the capture efficiency.
**The term “control system” for the purpose of this application means any control device or technique which is designed and operated to reduce the quantity of air contaminants emitted to the atmosphere. The term “control efficiency” means the percentage by which a control device or technique reduces the emissions from a stationary source. If the emission unit is controlled by a control device, the capture and control efficiencies are identified. If the emission unit is using an emission factor with an overall emission reduction efficiency included in the factor, “AP‐42” has been assigned to the control efficiency.
C. Emission Factor Source by Reference ID:
30502002 (controlled) AP‐42, Table 11.19.2‐2 Crushed Stone Processing and Pulverized Mineral Processing, SCC 30502002, Screening (controlled)
30502003 (controlled) AP‐42, Table 11.19.2‐2 Crushed Stone Processing and Pulverized Mineral Processing, SCC 30502003, Tertiary Crushing (controlled)
30502006 (controlled) AP‐42, Table 11.19.2‐2 Crushed Stone Processing and Pulverized Mineral Processing, SCC 30502006, Conveyor Transfer Point (controlled)
Cyclone AP‐42 ‐ Section 13.2.4 Aggregate Handling & Storage Piles; Batch/Continuous Drop Equation (1)
RadialStacker AP‐42 ‐ Section 13.2.4 Aggregate Handling & Storage Piles; Batch/Continuous Drop Equation (1)
D. Example Calculation for Item 27:
500 tons
hour
0.0012 lb
ton * ((1 ‐ 100 % capture/100) + (1 ‐ 0 % control/100))
ton
2000 lb=
year
2.63 ton PM
year
8760 Hours
Application Revision 5/14/2012, Page 30 of 131

EMISSIONS CALCULATIONS
II. Wet Plant I: Total PM‐10 Emissions (TPY): 21.2
A. PM‐10 Emissions by Equipment Unit ID (EID):
(1)Item
(3)Emission Unit Desription
(4)Max Short Term Throughput
(5)Max Annual Throughput
(6)Emission Factor
(7)* Capture
Efficiency(10)TPM
(11)TPY
(2)EID
(8)**Control
Efficiency(9)
Control Description(12)
Emission Factor Reference ID
Belt Conveyor 730000.0 tons/month 8760000 tons/year 0.000046 lb/ton AP‐42 0.0168 0.20C1218 AP‐42 >12% moisture (See Figure 1) 30502006 (controlled)
Belt Conveyor 730000.0 tons/month 8760000 tons/year 0.000046 lb/ton AP‐42 0.0168 0.20C1319 AP‐42 >12% moisture (See Figure 1) 30502006 (controlled)
Belt Conveyor 730000.0 tons/month 8760000 tons/year 0.000046 lb/ton AP‐42 0.0168 0.20C014 AP‐42 >12% moisture (See Figure 1) 30502006 (controlled)
Belt Conveyor 438000.0 tons/month 5256000 tons/year 0.000046 lb/ton AP‐42 0.0101 0.12C1523 AP‐42 >12% moisture (See Figure 1) 30502006 (controlled)
Belt Conveyor 365000.0 tons/month 4380000 tons/year 0.000046 lb/ton AP‐42 0.0084 0.10C1625 AP‐42 >12% moisture (See Figure 1) 30502006 (controlled)
Belt Conveyor 365000.0 tons/month 4380000 tons/year 0.000046 lb/ton AP‐42 0.0084 0.10C1828 AP‐42 >12% moisture (See Figure 4) 30502006 (controlled)
Belt Conveyor 365000.0 tons/month 4380000 tons/year 0.000046 lb/ton AP‐42 0.0084 0.10C1950 AP‐42 >12% moisture (See Figure 1) 30502006 (controlled)
Belt Conveyor 584000.0 tons/month 7008000 tons/year 0.000046 lb/ton AP‐42 0.0134 0.16C2152 AP‐42 >12% moisture (See Figure 1) 30502006 (controlled)
Belt Conveyor 584000.0 tons/month 7008000 tons/year 0.000046 lb/ton AP‐42 0.0134 0.16C2254 AP‐42 >12% moisture (See Figure 1) 30502006 (controlled)
Belt Conveyor 584000.0 tons/month 7008000 tons/year 0.000046 lb/ton AP‐42 0.0134 0.16C2557 AP‐42 >12% moisture (See Figure 1) 30502006 (controlled)
Belt Conveyor 730000.0 tons/month 8760000 tons/year 0.000046 lb/ton AP‐42 0.0168 0.20C025 AP‐42 >12% moisture (See Figure 1) 30502006 (controlled)
Belt Conveyor 730000.0 tons/month 8760000 tons/year 0.000046 lb/ton AP‐42 0.0168 0.20C037 AP‐42 >12% moisture (See Figure 1) 30502006 (controlled)
Belt Conveyor 730000.0 tons/month 8760000 tons/year 0.000046 lb/ton AP‐42 0.0168 0.20C048 AP‐42 >12% moisture (See Figure 1) 30502006 (controlled)
Belt Conveyor 730000.0 tons/month 8760000 tons/year 0.000046 lb/ton AP‐42 0.0168 0.20C059 AP‐42 >12% moisture (See Figure 4) 30502006 (controlled)
Belt Conveyor 730000.0 tons/month 8760000 tons/year 0.000046 lb/ton AP‐42 0.0168 0.20C0915 AP‐42 >12% moisture (See Figure 1) 30502006 (controlled)
Belt Conveyor 730000.0 tons/month 8760000 tons/year 0.000046 lb/ton AP‐42 0.0168 0.20C1016 AP‐42 >12% moisture (See Figure 1) 30502006 (controlled)
Belt Conveyor 730000.0 tons/month 8760000 tons/year 0.000046 lb/ton AP‐42 0.0168 0.20C1117 AP‐42 >12% moisture (See Figure 1) 30502006 (controlled)
Belt Conveyor 730000.0 tons/month 8760000 tons/year 0.000046 lb/ton AP‐42 0.0168 0.20C1420 AP‐42 >12% moisture (See Figure 1) 30502006 (controlled)
Belt Conveyor 365000.0 tons/month 4380000 tons/year 0.00025 lb/ton NA 0.0456 0.55C1726 NA >12% moisture (See Figure 4) RadialStacker
Belt Conveyor 365000.0 tons/month 4380000 tons/year 0.00025 lb/ton NA 0.0456 0.55C2051 NA >12% moisture (See Figure 4) RadialStacker
Belt Conveyor 584000.0 tons/month 7008000 tons/year 0.00025 lb/ton NA 0.0730 0.88C2355 NA >12% moisture (See Figure 4) RadialStacker
Belt Conveyor 584000.0 tons/month 7008000 tons/year 0.00025 lb/ton NA 0.0730 0.88C2456 NA >12% moisture (See Figure 4) RadialStacker
Belt Conveyor 584000.0 tons/month 7008000 tons/year 0.00025 lb/ton NA 0.0730 0.88C2658 NA >12% moisture (See Figure 4) RadialStacker
Belt Feeder 438000.0 tons/month 5256000 tons/year 0.000046 lb/ton AP‐42 0.0101 0.12F0322 AP‐42 >12% moisture (See Figure 3) 30502006 (controlled)
Dewatering Cyclone 365000.0 tons/month 4380000 tons/year 0.00025 lb/ton NA 0.0456 0.55CY0131 NA >12% moisture (See Figure 5) Cyclone
Dewatering Cyclone 365000.0 tons/month 4380000 tons/year 0.00025 lb/ton NA 0.0456 0.55CY0232 NA >12% moisture (See Figure 5) Cyclone
Dewatering Cyclone 365000.0 tons/month 4380000 tons/year 0.00025 lb/ton NA 0.0456 0.55CY0339 NA >12% moisture (See Figure 5) Cyclone
Dewatering Cyclone 365000.0 tons/month 4380000 tons/year 0.00025 lb/ton NA 0.0456 0.55CY0440 NA >12% moisture (See Figure 5) Cyclone
Dewatering Screen 365000.0 tons/month 4380000 tons/year 0.00074 lb/ton AP‐42 0.1351 1.62DWS0135 AP‐42 >12% moisture (See Figure 7) 30502002 (controlled)
Dewatering Screen 365000.0 tons/month 4380000 tons/year 0.00074 lb/ton AP‐42 0.1351 1.62DWS0236 AP‐42 >12% moisture (See Figure 7) 30502002 (controlled)
Dewatering Screen 365000.0 tons/month 4380000 tons/year 0.00074 lb/ton AP‐42 0.1351 1.62DWS0341 AP‐42 >12% moisture (See Figure 7) 30502002 (controlled)
Double Deck Screen 438000.0 tons/month 5256000 tons/year 0.00074 lb/ton AP‐42 0.1621 1.94SCR0124 AP‐42 >12% moisture (See Figure 7) 30502002 (controlled)
Feed Hopper 730000.0 tons/month 8760000 tons/year 0.000046 lb/ton AP‐42 0.0168 0.20FH011 AP‐42 >12% moisture (See Figure 3) 30502006 (controlled)
Feed Hopper 438000.0 tons/month 5256000 tons/year 0.000046 lb/ton AP‐42 0.0101 0.12FH0321 AP‐42 >12% moisture (See Figure 3) 30502006 (controlled)
Gate Feeder 292000.0 tons/month 3504000 tons/year 0.000046 lb/ton AP‐42 0.0067 0.08G0160 AP‐42 >5% moisture (See Figure 2) 30502006 (controlled)
Gate Feeder 292000.0 tons/month 3504000 tons/year 0.000046 lb/ton AP‐42 0.0067 0.08G0261 AP‐42 >5% moisture (See Figure 2) 30502006 (controlled)
Gate Feeder 292000.0 tons/month 3504000 tons/year 0.000046 lb/ton AP‐42 0.0067 0.08G0362 AP‐42 >5% moisture (See Figure 2) 30502006 (controlled)
Gate Feeder 292000.0 tons/month 3504000 tons/year 0.000046 lb/ton AP‐42 0.0067 0.08G0463 AP‐42 >5% moisture (See Figure 2) 30502006 (controlled)
Gate Feeder 292000.0 tons/month 3504000 tons/year 0.000046 lb/ton AP‐42 0.0067 0.08G0564 AP‐42 >5% moisture (See Figure 2) 30502006 (controlled)
Application Revision 5/14/2012, Page 31 of 131

EMISSIONS CALCULATIONS
II. Wet Plant I: Total PM‐10 Emissions (TPY): 21.2
A. PM‐10 Emissions by Equipment Unit ID (EID):
(1)Item
(3)Emission Unit Desription
(4)Max Short Term Throughput
(5)Max Annual Throughput
(6)Emission Factor
(7)* Capture
Efficiency(10)TPM
(11)TPY
(2)EID
(8)**Control
Efficiency(9)
Control Description(12)
Emission Factor Reference ID
Gate Feeder 292000.0 tons/month 3504000 tons/year 0.000046 lb/ton AP‐42 0.0067 0.08G0665 AP‐42 >5% moisture (See Figure 2) 30502006 (controlled)
Gate Feeder 292000.0 tons/month 3504000 tons/year 0.000046 lb/ton AP‐42 0.0067 0.08G0766 AP‐42 >5% moisture (See Figure 2) 30502006 (controlled)
Gate Feeder 292000.0 tons/month 3504000 tons/year 0.000046 lb/ton AP‐42 0.0067 0.08G0867 AP‐42 >5% moisture (See Figure 2) 30502006 (controlled)
Gate Feeder 292000.0 tons/month 3504000 tons/year 0.000046 lb/ton AP‐42 0.0067 0.08G0968 AP‐42 >5% moisture (See Figure 2) 30502006 (controlled)
Gate Feeder 292000.0 tons/month 3504000 tons/year 0.000046 lb/ton AP‐42 0.0067 0.08G1069 AP‐42 >5% moisture (See Figure 2) 30502006 (controlled)
Gate Feeder 292000.0 tons/month 3504000 tons/year 0.000046 lb/ton AP‐42 0.0067 0.08G1170 AP‐42 >5% moisture (See Figure 2) 30502006 (controlled)
Gate Feeder 292000.0 tons/month 3504000 tons/year 0.000046 lb/ton AP‐42 0.0067 0.08G1271 AP‐42 >5% moisture (See Figure 2) 30502006 (controlled)
Grizzly Feeder 730000.0 tons/month 8760000 tons/year 0.000046 lb/ton AP‐42 0.0168 0.20F012 AP‐42 >12% moisture (See Figure 2) 30502006 (controlled)
Hydrosizer 365000.0 tons/month 4380000 tons/year 0.000046 lb/ton AP‐42 0.0084 0.10HY0133 AP‐42 >12% moisture (See Figure 6) 30502006 (controlled)
Hydrosizer 365000.0 tons/month 4380000 tons/year 0.000046 lb/ton AP‐42 0.0084 0.10HY0234 AP‐42 >12% moisture (See Figure 6) 30502006 (controlled)
Impact Crusher 730000.0 tons/month 8760000 tons/year 0.00054 lb/ton AP‐42 0.1971 2.37CR013 AP‐42 >12% moisture 30502003 (controlled)
VSI Crusher 365000.0 tons/month 4380000 tons/year 0.00054 lb/ton AP‐42 0.0986 1.18CR0227 AP‐42 >12% moisture 30502003 (controlled)
B. Proposed Permit Limits for PM‐10 from Wet Plant I:
730000.0 tons/month 8760000 tons/year 21.201.7670
E. Notes:
As defined in I.A. (7), (8) and (9) for sources with capture and/or control efficiencies for pollution control equipment.
*The term “capture system” for the purpose of this application means the equipment (including hoods, ducts, etc.) used to contain, capture, or transport an air contaminant to a control device. In addition, the term “capture efficiency” means the weight per unit time of an air contaminant entering a capture system and delivered to a control device, divided by the weight per unit time of the air contaminant generated by the source, expressed as a percentage. Therefore, if the emission unit is not exhausted to a control device, the capture system and capture efficiency is not applicable (NA). If the emission unit is using an emission factor with an overall emission reduction efficiency included in the factor, “AP‐42” has been assigned to the capture efficiency.
**The term “control system” for the purpose of this application means any control device or technique which is designed and operated to reduce the quantity of air contaminants emitted to the atmosphere. The term “control efficiency” means the percentage by which a control device or technique reduces the emissions from a stationary source. If the emission unit is controlled by a control device, the capture and control efficiencies are identified. If the emission unit is using an emission factor with an overall emission reduction efficiency included in the factor, “AP‐42” has been assigned to the control efficiency.
C. Emission Factor Source by Reference ID:
30502002 (controlled) AP‐42, Table 11.19.2‐2 Crushed Stone Processing and Pulverized Mineral Processing, SCC 30502002, Screening (controlled)
30502003 (controlled) AP‐42, Table 11.19.2‐2 Crushed Stone Processing and Pulverized Mineral Processing, SCC 30502003, Tertiary Crushing (controlled)
30502006 (controlled) AP‐42, Table 11.19.2‐2 Crushed Stone Processing and Pulverized Mineral Processing, SCC 30502006, Conveyor Transfer Point (controlled)
Cyclone AP‐42 ‐ Section 13.2.4 Aggregate Handling & Storage Piles; Batch/Continuous Drop Equation (1)
RadialStacker AP‐42 ‐ Section 13.2.4 Aggregate Handling & Storage Piles; Batch/Continuous Drop Equation (1)
D. Example Calculation for Item 27:
500 tons
hour
0.00054 lb
ton * ((1 ‐ 100 % capture/100) + (1 ‐ 0 % control/100))
ton
2000 lb=
year
1.18 ton PM‐10
year
8760 Hours
Application Revision 5/14/2012, Page 32 of 131

EMISSIONS CALCULATIONS
II. Wet Plant I: Total PM2.5 Emissions (TPY): 2.7
A. PM2.5 Emissions by Equipment Unit ID (EID):
(1)Item
(3)Emission Unit Desription
(4)Max Short Term Throughput
(5)Max Annual Throughput
(6)Emission Factor
(7)* Capture
Efficiency(10)TPM
(11)TPY
(2)EID
(8)**Control
Efficiency(9)
Control Description(12)
Emission Factor Reference ID
Belt Conveyor 730000.0 tons/month 8760000 tons/year 0.000013 lb/ton AP‐42 0.0047 0.06C1218 AP‐42 >12% moisture (See Figure 1) 30502006 (controlled)
Belt Conveyor 730000.0 tons/month 8760000 tons/year 0.000013 lb/ton AP‐42 0.0047 0.06C1319 AP‐42 >12% moisture (See Figure 1) 30502006 (controlled)
Belt Conveyor 730000.0 tons/month 8760000 tons/year 0.000013 lb/ton AP‐42 0.0047 0.06C014 AP‐42 >12% moisture (See Figure 1) 30502006 (controlled)
Belt Conveyor 438000.0 tons/month 5256000 tons/year 0.000013 lb/ton AP‐42 0.0028 0.03C1523 AP‐42 >12% moisture (See Figure 1) 30502006 (controlled)
Belt Conveyor 365000.0 tons/month 4380000 tons/year 0.000013 lb/ton AP‐42 0.0024 0.03C1625 AP‐42 >12% moisture (See Figure 1) 30502006 (controlled)
Belt Conveyor 365000.0 tons/month 4380000 tons/year 0.000013 lb/ton AP‐42 0.0024 0.03C1828 AP‐42 >12% moisture (See Figure 4) 30502006 (controlled)
Belt Conveyor 365000.0 tons/month 4380000 tons/year 0.000013 lb/ton AP‐42 0.0024 0.03C1950 AP‐42 >12% moisture (See Figure 1) 30502006 (controlled)
Belt Conveyor 584000.0 tons/month 7008000 tons/year 0.000013 lb/ton AP‐42 0.0038 0.05C2152 AP‐42 >12% moisture (See Figure 1) 30502006 (controlled)
Belt Conveyor 584000.0 tons/month 7008000 tons/year 0.000013 lb/ton AP‐42 0.0038 0.05C2254 AP‐42 >12% moisture (See Figure 1) 30502006 (controlled)
Belt Conveyor 584000.0 tons/month 7008000 tons/year 0.000013 lb/ton AP‐42 0.0038 0.05C2557 AP‐42 >12% moisture (See Figure 1) 30502006 (controlled)
Belt Conveyor 730000.0 tons/month 8760000 tons/year 0.000013 lb/ton AP‐42 0.0047 0.06C025 AP‐42 >12% moisture (See Figure 1) 30502006 (controlled)
Belt Conveyor 730000.0 tons/month 8760000 tons/year 0.000013 lb/ton AP‐42 0.0047 0.06C037 AP‐42 >12% moisture (See Figure 1) 30502006 (controlled)
Belt Conveyor 730000.0 tons/month 8760000 tons/year 0.000013 lb/ton AP‐42 0.0047 0.06C048 AP‐42 >12% moisture (See Figure 1) 30502006 (controlled)
Belt Conveyor 730000.0 tons/month 8760000 tons/year 0.000013 lb/ton AP‐42 0.0047 0.06C059 AP‐42 >12% moisture (See Figure 4) 30502006 (controlled)
Belt Conveyor 730000.0 tons/month 8760000 tons/year 0.000013 lb/ton AP‐42 0.0047 0.06C0915 AP‐42 >12% moisture (See Figure 1) 30502006 (controlled)
Belt Conveyor 730000.0 tons/month 8760000 tons/year 0.000013 lb/ton AP‐42 0.0047 0.06C1016 AP‐42 >12% moisture (See Figure 1) 30502006 (controlled)
Belt Conveyor 730000.0 tons/month 8760000 tons/year 0.000013 lb/ton AP‐42 0.0047 0.06C1117 AP‐42 >12% moisture (See Figure 1) 30502006 (controlled)
Belt Conveyor 730000.0 tons/month 8760000 tons/year 0.000013 lb/ton AP‐42 0.0047 0.06C1420 AP‐42 >12% moisture (See Figure 1) 30502006 (controlled)
Belt Conveyor 365000.0 tons/month 4380000 tons/year 0.000008 lb/ton NA 0.0015 0.02C1726 NA >12% moisture (See Figure 4) RadialStacker
Belt Conveyor 365000.0 tons/month 4380000 tons/year 0.000008 lb/ton NA 0.0015 0.02C2051 NA >12% moisture (See Figure 4) RadialStacker
Belt Conveyor 584000.0 tons/month 7008000 tons/year 0.000008 lb/ton NA 0.0023 0.03C2355 NA >12% moisture (See Figure 4) RadialStacker
Belt Conveyor 584000.0 tons/month 7008000 tons/year 0.000008 lb/ton NA 0.0023 0.03C2456 NA >12% moisture (See Figure 4) RadialStacker
Belt Conveyor 584000.0 tons/month 7008000 tons/year 0.000008 lb/ton NA 0.0023 0.03C2658 NA >12% moisture (See Figure 4) RadialStacker
Belt Feeder 438000.0 tons/month 5256000 tons/year 0.000013 lb/ton AP‐42 0.0028 0.03F0322 AP‐42 >12% moisture (See Figure 3) 30502006 (controlled)
Dewatering Cyclone 365000.0 tons/month 4380000 tons/year 0.000008 lb/ton NA 0.0015 0.02CY0131 NA >12% moisture (See Figure 5) Cyclone
Dewatering Cyclone 365000.0 tons/month 4380000 tons/year 0.000008 lb/ton NA 0.0015 0.02CY0232 NA >12% moisture (See Figure 5) Cyclone
Dewatering Cyclone 365000.0 tons/month 4380000 tons/year 0.000008 lb/ton NA 0.0015 0.02CY0339 NA >12% moisture (See Figure 5) Cyclone
Dewatering Cyclone 365000.0 tons/month 4380000 tons/year 0.000008 lb/ton NA 0.0015 0.02CY0440 NA >12% moisture (See Figure 5) Cyclone
Dewatering Screen 365000.0 tons/month 4380000 tons/year 0.00005 lb/ton AP‐42 0.0091 0.11DWS0135 AP‐42 >12% moisture (See Figure 7) 30502002 (controlled)
Dewatering Screen 365000.0 tons/month 4380000 tons/year 0.00005 lb/ton AP‐42 0.0091 0.11DWS0236 AP‐42 >12% moisture (See Figure 7) 30502002 (controlled)
Dewatering Screen 365000.0 tons/month 4380000 tons/year 0.00005 lb/ton AP‐42 0.0091 0.11DWS0341 AP‐42 >12% moisture (See Figure 7) 30502002 (controlled)
Double Deck Screen 438000.0 tons/month 5256000 tons/year 0.00005 lb/ton AP‐42 0.0110 0.13SCR0124 AP‐42 >12% moisture (See Figure 7) 30502002 (controlled)
Feed Hopper 730000.0 tons/month 8760000 tons/year 0.000013 lb/ton AP‐42 0.0047 0.06FH011 AP‐42 >12% moisture (See Figure 3) 30502006 (controlled)
Feed Hopper 438000.0 tons/month 5256000 tons/year 0.000013 lb/ton AP‐42 0.0028 0.03FH0321 AP‐42 >12% moisture (See Figure 3) 30502006 (controlled)
Gate Feeder 292000.0 tons/month 3504000 tons/year 0.000013 lb/ton AP‐42 0.0019 0.02G0160 AP‐42 >5% moisture (See Figure 2) 30502006 (controlled)
Gate Feeder 292000.0 tons/month 3504000 tons/year 0.000013 lb/ton AP‐42 0.0019 0.02G0261 AP‐42 >5% moisture (See Figure 2) 30502006 (controlled)
Gate Feeder 292000.0 tons/month 3504000 tons/year 0.000013 lb/ton AP‐42 0.0019 0.02G0362 AP‐42 >5% moisture (See Figure 2) 30502006 (controlled)
Gate Feeder 292000.0 tons/month 3504000 tons/year 0.000013 lb/ton AP‐42 0.0019 0.02G0463 AP‐42 >5% moisture (See Figure 2) 30502006 (controlled)
Gate Feeder 292000.0 tons/month 3504000 tons/year 0.000013 lb/ton AP‐42 0.0019 0.02G0564 AP‐42 >5% moisture (See Figure 2) 30502006 (controlled)
Application Revision 5/14/2012, Page 33 of 131

EMISSIONS CALCULATIONS
II. Wet Plant I: Total PM2.5 Emissions (TPY): 2.7
A. PM2.5 Emissions by Equipment Unit ID (EID):
(1)Item
(3)Emission Unit Desription
(4)Max Short Term Throughput
(5)Max Annual Throughput
(6)Emission Factor
(7)* Capture
Efficiency(10)TPM
(11)TPY
(2)EID
(8)**Control
Efficiency(9)
Control Description(12)
Emission Factor Reference ID
Gate Feeder 292000.0 tons/month 3504000 tons/year 0.000013 lb/ton AP‐42 0.0019 0.02G0665 AP‐42 >5% moisture (See Figure 2) 30502006 (controlled)
Gate Feeder 292000.0 tons/month 3504000 tons/year 0.000013 lb/ton AP‐42 0.0019 0.02G0766 AP‐42 >5% moisture (See Figure 2) 30502006 (controlled)
Gate Feeder 292000.0 tons/month 3504000 tons/year 0.000013 lb/ton AP‐42 0.0019 0.02G0867 AP‐42 >5% moisture (See Figure 2) 30502006 (controlled)
Gate Feeder 292000.0 tons/month 3504000 tons/year 0.000013 lb/ton AP‐42 0.0019 0.02G0968 AP‐42 >5% moisture (See Figure 2) 30502006 (controlled)
Gate Feeder 292000.0 tons/month 3504000 tons/year 0.000013 lb/ton AP‐42 0.0019 0.02G1069 AP‐42 >5% moisture (See Figure 2) 30502006 (controlled)
Gate Feeder 292000.0 tons/month 3504000 tons/year 0.000013 lb/ton AP‐42 0.0019 0.02G1170 AP‐42 >5% moisture (See Figure 2) 30502006 (controlled)
Gate Feeder 292000.0 tons/month 3504000 tons/year 0.000013 lb/ton AP‐42 0.0019 0.02G1271 AP‐42 >5% moisture (See Figure 2) 30502006 (controlled)
Grizzly Feeder 730000.0 tons/month 8760000 tons/year 0.000013 lb/ton AP‐42 0.0047 0.06F012 AP‐42 >12% moisture (See Figure 2) 30502006 (controlled)
Hydrosizer 365000.0 tons/month 4380000 tons/year 0.000013 lb/ton AP‐42 0.0024 0.03HY0133 AP‐42 >12% moisture (See Figure 6) 30502006 (controlled)
Hydrosizer 365000.0 tons/month 4380000 tons/year 0.000013 lb/ton AP‐42 0.0024 0.03HY0234 AP‐42 >12% moisture (See Figure 6) 30502006 (controlled)
Impact Crusher 730000.0 tons/month 8760000 tons/year 0.0001 lb/ton AP‐42 0.0365 0.44CR013 AP‐42 >12% moisture 30502003 (controlled)
VSI Crusher 365000.0 tons/month 4380000 tons/year 0.0001 lb/ton AP‐42 0.0183 0.22CR0227 AP‐42 >12% moisture 30502003 (controlled)
B. Proposed Permit Limits for PM2.5 from Wet Plant I:
730000.0 tons/month 8760000 tons/year 2.700.2251
E. Notes:
As defined in I.A. (7), (8) and (9) for sources with capture and/or control efficiencies for pollution control equipment.
*The term “capture system” for the purpose of this application means the equipment (including hoods, ducts, etc.) used to contain, capture, or transport an air contaminant to a control device. In addition, the term “capture efficiency” means the weight per unit time of an air contaminant entering a capture system and delivered to a control device, divided by the weight per unit time of the air contaminant generated by the source, expressed as a percentage. Therefore, if the emission unit is not exhausted to a control device, the capture system and capture efficiency is not applicable (NA). If the emission unit is using an emission factor with an overall emission reduction efficiency included in the factor, “AP‐42” has been assigned to the capture efficiency.
**The term “control system” for the purpose of this application means any control device or technique which is designed and operated to reduce the quantity of air contaminants emitted to the atmosphere. The term “control efficiency” means the percentage by which a control device or technique reduces the emissions from a stationary source. If the emission unit is controlled by a control device, the capture and control efficiencies are identified. If the emission unit is using an emission factor with an overall emission reduction efficiency included in the factor, “AP‐42” has been assigned to the control efficiency.
C. Emission Factor Source by Reference ID:
30502002 (controlled) AP‐42, Table 11.19.2‐2 Crushed Stone Processing and Pulverized Mineral Processing, SCC 30502002, Screening (controlled)
30502003 (controlled) AP‐42, Table 11.19.2‐2 Crushed Stone Processing and Pulverized Mineral Processing, SCC 30502003, Tertiary Crushing (controlled)
30502006 (controlled) AP‐42, Table 11.19.2‐2 Crushed Stone Processing and Pulverized Mineral Processing, SCC 30502006, Conveyor Transfer Point (controlled)
Cyclone AP‐42 ‐ Section 13.2.4 Aggregate Handling & Storage Piles; Batch/Continuous Drop Equation (1)
RadialStacker AP‐42 ‐ Section 13.2.4 Aggregate Handling & Storage Piles; Batch/Continuous Drop Equation (1)
D. Example Calculation for Item 27:
500 tons
hour
0.0001 lb
ton * ((1 ‐ 100 % capture/100) + (1 ‐ 0 % control/100))
ton
2000 lb=
year
0.22 ton PM2.5
year
8760 Hours
Application Revision 5/14/2012, Page 34 of 131

EMISSIONS CALCULATIONS
III. Wet Plant II: Total PM Emissions (TPY): 9.95
A. PM Emissions by Equipment Unit ID (EID):
(1)Item
(3)Emission Unit Desription
(4)Max Short Term Throughput
(5)Max Annual Throughput
(6)Emission Factor
(7)* Capture
Efficiency(10)TPM
(11)TPY
(2)EID
(8)**Control
Efficiency(9)
Control Description(12)
Emission Factor Reference ID
Belt Conveyor 438000.0 tons/month 5256000 tons/year 0.00014 lb/ton AP‐42 0.0307 0.37C2772 AP‐42 >5% moisture (See Figure 1) 30502006 (controlled)
Belt Conveyor 730000.0 tons/month 8760000 tons/year 0.00014 lb/ton AP‐42 0.0511 0.61C0610 AP‐42 >12% moisture (See Figure 1) 30502006 (controlled)
Belt Conveyor 730000.0 tons/month 8760000 tons/year 0.00014 lb/ton AP‐42 0.0511 0.61C0711 AP‐42 >12% moisture (See Figure 1) 30502006 (controlled)
Belt Conveyor 730000.0 tons/month 8760000 tons/year 0.00014 lb/ton AP‐42 0.0511 0.61C0812 AP‐42 >12% moisture (See Figure 1) 30502006 (controlled)
Belt Conveyor 438000.0 tons/month 5256000 tons/year 0.00014 lb/ton AP‐42 0.0307 0.37F0476 AP‐42 >5% moisture (See Figure 1) 30502006 (controlled)
Belt Feeder 730000.0 tons/month 8760000 tons/year 0.00014 lb/ton AP‐42 0.0511 0.61F0214 AP‐42 >12% moisture (See Figure 3) 30502006 (controlled)
Feed Hopper 730000.0 tons/month 8760000 tons/year 0.00014 lb/ton AP‐42 0.0511 0.61FH0213 AP‐42 >12% moisture (See Figure 3) 30502006 (controlled)
Feed Hopper 438000.0 tons/month 5256000 tons/year 0.00014 lb/ton AP‐42 0.0307 0.37FH0475 AP‐42 >5% moisture (See Figure 3) 30502006 (controlled)
Single Deck Screen 438000.0 tons/month 5256000 tons/year 0.0022 lb/ton AP‐42 0.4818 5.78SCR0274 AP‐42 >5% moisture (See Figure 7) 30502002 (controlled)
B. Proposed Permit Limits for PM from Wet Plant II:
730000.0 tons/month 8760000 tons/year 9.950.8293
E. Notes:
As defined in I.A. (7), (8) and (9) for sources with capture and/or control efficiencies for pollution control equipment.
*The term “capture system” for the purpose of this application means the equipment (including hoods, ducts, etc.) used to contain, capture, or transport an air contaminant to a control device. In addition, the term “capture efficiency” means the weight per unit time of an air contaminant entering a capture system and delivered to a control device, divided by the weight per unit time of the air contaminant generated by the source, expressed as a percentage. Therefore, if the emission unit is not exhausted to a control device, the capture system and capture efficiency is not applicable (NA). If the emission unit is using an emission factor with an overall emission reduction efficiency included in the factor, “AP‐42” has been assigned to the capture efficiency.
**The term “control system” for the purpose of this application means any control device or technique which is designed and operated to reduce the quantity of air contaminants emitted to the atmosphere. The term “control efficiency” means the percentage by which a control device or technique reduces the emissions from a stationary source. If the emission unit is controlled by a control device, the capture and control efficiencies are identified. If the emission unit is using an emission factor with an overall emission reduction efficiency included in the factor, “AP‐42” has been assigned to the control efficiency.
C. Emission Factor Source by Reference ID:
30502002 (controlled) AP‐42, Table 11.19.2‐2 Crushed Stone Processing and Pulverized Mineral Processing, SCC 30502002, Screening (controlled)
30502006 (controlled) AP‐42, Table 11.19.2‐2 Crushed Stone Processing and Pulverized Mineral Processing, SCC 30502006, Conveyor Transfer Point (controlled)
D. Example Calculation for Item 74:
600 tons
hour
0.0022 lb
ton * ((1 ‐ 100 % capture/100) + (1 ‐ 0 % control/100))
ton
2000 lb=
year
5.78 ton PM
year
8760 Hours
Application Revision 5/14/2012, Page 35 of 131

EMISSIONS CALCULATIONS
III. Wet Plant II: Total PM‐10 Emissions (TPY): 3.31
A. PM‐10 Emissions by Equipment Unit ID (EID):
(1)Item
(3)Emission Unit Desription
(4)Max Short Term Throughput
(5)Max Annual Throughput
(6)Emission Factor
(7)* Capture
Efficiency(10)TPM
(11)TPY
(2)EID
(8)**Control
Efficiency(9)
Control Description(12)
Emission Factor Reference ID
Belt Conveyor 438000.0 tons/month 5256000 tons/year 0.000046 lb/ton AP‐42 0.0101 0.12C2772 AP‐42 >5% moisture (See Figure 1) 30502006 (controlled)
Belt Conveyor 730000.0 tons/month 8760000 tons/year 0.000046 lb/ton AP‐42 0.0168 0.20C0610 AP‐42 >12% moisture (See Figure 1) 30502006 (controlled)
Belt Conveyor 730000.0 tons/month 8760000 tons/year 0.000046 lb/ton AP‐42 0.0168 0.20C0711 AP‐42 >12% moisture (See Figure 1) 30502006 (controlled)
Belt Conveyor 730000.0 tons/month 8760000 tons/year 0.000046 lb/ton AP‐42 0.0168 0.20C0812 AP‐42 >12% moisture (See Figure 1) 30502006 (controlled)
Belt Conveyor 438000.0 tons/month 5256000 tons/year 0.000046 lb/ton AP‐42 0.0101 0.12F0476 AP‐42 >5% moisture (See Figure 1) 30502006 (controlled)
Belt Feeder 730000.0 tons/month 8760000 tons/year 0.000046 lb/ton AP‐42 0.0168 0.20F0214 AP‐42 >12% moisture (See Figure 3) 30502006 (controlled)
Feed Hopper 730000.0 tons/month 8760000 tons/year 0.000046 lb/ton AP‐42 0.0168 0.20FH0213 AP‐42 >12% moisture (See Figure 3) 30502006 (controlled)
Feed Hopper 438000.0 tons/month 5256000 tons/year 0.000046 lb/ton AP‐42 0.0101 0.12FH0475 AP‐42 >5% moisture (See Figure 3) 30502006 (controlled)
Single Deck Screen 438000.0 tons/month 5256000 tons/year 0.00074 lb/ton AP‐42 0.1621 1.94SCR0274 AP‐42 >5% moisture (See Figure 7) 30502002 (controlled)
B. Proposed Permit Limits for PM‐10 from Wet Plant II:
730000.0 tons/month 8760000 tons/year 3.310.2762
E. Notes:
As defined in I.A. (7), (8) and (9) for sources with capture and/or control efficiencies for pollution control equipment.
*The term “capture system” for the purpose of this application means the equipment (including hoods, ducts, etc.) used to contain, capture, or transport an air contaminant to a control device. In addition, the term “capture efficiency” means the weight per unit time of an air contaminant entering a capture system and delivered to a control device, divided by the weight per unit time of the air contaminant generated by the source, expressed as a percentage. Therefore, if the emission unit is not exhausted to a control device, the capture system and capture efficiency is not applicable (NA). If the emission unit is using an emission factor with an overall emission reduction efficiency included in the factor, “AP‐42” has been assigned to the capture efficiency.
**The term “control system” for the purpose of this application means any control device or technique which is designed and operated to reduce the quantity of air contaminants emitted to the atmosphere. The term “control efficiency” means the percentage by which a control device or technique reduces the emissions from a stationary source. If the emission unit is controlled by a control device, the capture and control efficiencies are identified. If the emission unit is using an emission factor with an overall emission reduction efficiency included in the factor, “AP‐42” has been assigned to the control efficiency.
C. Emission Factor Source by Reference ID:
30502002 (controlled) AP‐42, Table 11.19.2‐2 Crushed Stone Processing and Pulverized Mineral Processing, SCC 30502002, Screening (controlled)
30502006 (controlled) AP‐42, Table 11.19.2‐2 Crushed Stone Processing and Pulverized Mineral Processing, SCC 30502006, Conveyor Transfer Point (controlled)
D. Example Calculation for Item 74:
600 tons
hour
0.00074 lb
ton * ((1 ‐ 100 % capture/100) + (1 ‐ 0 % control/100))
ton
2000 lb=
year
1.94 ton PM‐10
year
8760 Hours
Application Revision 5/14/2012, Page 36 of 131

EMISSIONS CALCULATIONS
III. Wet Plant II: Total PM2.5 Emissions (TPY): 0.52
A. PM2.5 Emissions by Equipment Unit ID (EID):
(1)Item
(3)Emission Unit Desription
(4)Max Short Term Throughput
(5)Max Annual Throughput
(6)Emission Factor
(7)* Capture
Efficiency(10)TPM
(11)TPY
(2)EID
(8)**Control
Efficiency(9)
Control Description(12)
Emission Factor Reference ID
Belt Conveyor 438000.0 tons/month 5256000 tons/year 0.000013 lb/ton AP‐42 0.0028 0.03C2772 AP‐42 >5% moisture (See Figure 1) 30502006 (controlled)
Belt Conveyor 730000.0 tons/month 8760000 tons/year 0.000013 lb/ton AP‐42 0.0047 0.06C0610 AP‐42 >12% moisture (See Figure 1) 30502006 (controlled)
Belt Conveyor 730000.0 tons/month 8760000 tons/year 0.000013 lb/ton AP‐42 0.0047 0.06C0711 AP‐42 >12% moisture (See Figure 1) 30502006 (controlled)
Belt Conveyor 730000.0 tons/month 8760000 tons/year 0.000013 lb/ton AP‐42 0.0047 0.06C0812 AP‐42 >12% moisture (See Figure 1) 30502006 (controlled)
Belt Conveyor 438000.0 tons/month 5256000 tons/year 0.000013 lb/ton AP‐42 0.0028 0.03F0476 AP‐42 >5% moisture (See Figure 1) 30502006 (controlled)
Belt Feeder 730000.0 tons/month 8760000 tons/year 0.000013 lb/ton AP‐42 0.0047 0.06F0214 AP‐42 >12% moisture (See Figure 3) 30502006 (controlled)
Feed Hopper 730000.0 tons/month 8760000 tons/year 0.000013 lb/ton AP‐42 0.0047 0.06FH0213 AP‐42 >12% moisture (See Figure 3) 30502006 (controlled)
Feed Hopper 438000.0 tons/month 5256000 tons/year 0.000013 lb/ton AP‐42 0.0028 0.03FH0475 AP‐42 >5% moisture (See Figure 3) 30502006 (controlled)
Single Deck Screen 438000.0 tons/month 5256000 tons/year 0.00005 lb/ton AP‐42 0.0110 0.13SCR0274 AP‐42 >5% moisture (See Figure 7) 30502002 (controlled)
B. Proposed Permit Limits for PM2.5 from Wet Plant II:
730000.0 tons/month 8760000 tons/year 0.520.0432
E. Notes:
As defined in I.A. (7), (8) and (9) for sources with capture and/or control efficiencies for pollution control equipment.
*The term “capture system” for the purpose of this application means the equipment (including hoods, ducts, etc.) used to contain, capture, or transport an air contaminant to a control device. In addition, the term “capture efficiency” means the weight per unit time of an air contaminant entering a capture system and delivered to a control device, divided by the weight per unit time of the air contaminant generated by the source, expressed as a percentage. Therefore, if the emission unit is not exhausted to a control device, the capture system and capture efficiency is not applicable (NA). If the emission unit is using an emission factor with an overall emission reduction efficiency included in the factor, “AP‐42” has been assigned to the capture efficiency.
**The term “control system” for the purpose of this application means any control device or technique which is designed and operated to reduce the quantity of air contaminants emitted to the atmosphere. The term “control efficiency” means the percentage by which a control device or technique reduces the emissions from a stationary source. If the emission unit is controlled by a control device, the capture and control efficiencies are identified. If the emission unit is using an emission factor with an overall emission reduction efficiency included in the factor, “AP‐42” has been assigned to the control efficiency.
C. Emission Factor Source by Reference ID:
30502002 (controlled) AP‐42, Table 11.19.2‐2 Crushed Stone Processing and Pulverized Mineral Processing, SCC 30502002, Screening (controlled)
30502006 (controlled) AP‐42, Table 11.19.2‐2 Crushed Stone Processing and Pulverized Mineral Processing, SCC 30502006, Conveyor Transfer Point (controlled)
D. Example Calculation for Item 74:
600 tons
hour
0.00005 lb
ton * ((1 ‐ 100 % capture/100) + (1 ‐ 0 % control/100))
ton
2000 lb=
year
0.13 ton PM2.5
year
8760 Hours
Application Revision 5/14/2012, Page 37 of 131

EMISSIONS CALCULATIONS
IV. Sand Drying: Total PM Emissions (TPY): 17.94
A. PM Emissions by Equipment Unit ID (EID):
(1)Item
(3)Emission Unit Desription
(4)Max Short Term Throughput
(5)Max Annual Throughput
(6)Emission Factor
(7)* Capture
Efficiency(10)TPM
(11)TPY
(2)EID
(8)**Control
Efficiency(9)
Control Description(12)
Emission Factor Reference ID
Dryer Baghouse 2093.6 million dscf/month 25123.68 million dscf/year 1428.5 lb/million dscf 100 1.4954 17.94BGH0183 99.9 Fabric filter baghouse dust collector (Proposed 0.01 gr/dscf of exhaust)
BH01
B. Proposed Permit Limits for PM from Sand Drying:
2093.6 million dscf/month 25123.68 million dscf/year 17.941.4954
E. Notes:
As defined in I.A. (7), (8) and (9) for sources with capture and/or control efficiencies for pollution control equipment.
*The term “capture system” for the purpose of this application means the equipment (including hoods, ducts, etc.) used to contain, capture, or transport an air contaminant to a control device. In addition, the term “capture efficiency” means the weight per unit time of an air contaminant entering a capture system and delivered to a control device, divided by the weight per unit time of the air contaminant generated by the source, expressed as a percentage. Therefore, if the emission unit is not exhausted to a control device, the capture system and capture efficiency is not applicable (NA). If the emission unit is using an emission factor with an overall emission reduction efficiency included in the factor, “AP‐42” has been assigned to the capture efficiency.
**The term “control system” for the purpose of this application means any control device or technique which is designed and operated to reduce the quantity of air contaminants emitted to the atmosphere. The term “control efficiency” means the percentage by which a control device or technique reduces the emissions from a stationary source. If the emission unit is controlled by a control device, the capture and control efficiencies are identified. If the emission unit is using an emission factor with an overall emission reduction efficiency included in the factor, “AP‐42” has been assigned to the control efficiency.
C. Emission Factor Source by Reference ID:
BH01 Proposed limit of 0.01 grains per dry standard cubic foot of exhaust
D. Example Calculation for Item 83:
2.868 million dscf
hour
1428.5 lb
million dscf* ((1 ‐ 100 % capture/100) + (1 ‐ 99.9 % control/100))
ton
2000 lb=
year
17.94 ton PM
year
8760 Hours
Application Revision 5/14/2012, Page 38 of 131

EMISSIONS CALCULATIONS
IV. Sand Drying: Total PM‐10 Emissions (TPY): 17.94
A. PM‐10 Emissions by Equipment Unit ID (EID):
(1)Item
(3)Emission Unit Desription
(4)Max Short Term Throughput
(5)Max Annual Throughput
(6)Emission Factor
(7)* Capture
Efficiency(10)TPM
(11)TPY
(2)EID
(8)**Control
Efficiency(9)
Control Description(12)
Emission Factor Reference ID
Dryer Baghouse 2093.6 million dscf/month 25123.68 million dscf/year 1428.5 lb/million dscf 100 1.4954 17.94BGH0183 99.9 Fabric filter baghouse dust collector (Proposed 0.01 gr/dscf of exhaust)
BH01
B. Proposed Permit Limits for PM‐10 from Sand Drying:
2093.6 million dscf/month 25123.68 million dscf/year 17.941.4954
E. Notes:
As defined in I.A. (7), (8) and (9) for sources with capture and/or control efficiencies for pollution control equipment.
*The term “capture system” for the purpose of this application means the equipment (including hoods, ducts, etc.) used to contain, capture, or transport an air contaminant to a control device. In addition, the term “capture efficiency” means the weight per unit time of an air contaminant entering a capture system and delivered to a control device, divided by the weight per unit time of the air contaminant generated by the source, expressed as a percentage. Therefore, if the emission unit is not exhausted to a control device, the capture system and capture efficiency is not applicable (NA). If the emission unit is using an emission factor with an overall emission reduction efficiency included in the factor, “AP‐42” has been assigned to the capture efficiency.
**The term “control system” for the purpose of this application means any control device or technique which is designed and operated to reduce the quantity of air contaminants emitted to the atmosphere. The term “control efficiency” means the percentage by which a control device or technique reduces the emissions from a stationary source. If the emission unit is controlled by a control device, the capture and control efficiencies are identified. If the emission unit is using an emission factor with an overall emission reduction efficiency included in the factor, “AP‐42” has been assigned to the control efficiency.
C. Emission Factor Source by Reference ID:
BH01 Proposed limit of 0.01 grains per dry standard cubic foot of exhaust
D. Example Calculation for Item 83:
2.868 million dscf
hour
1428.5 lb
million dscf* ((1 ‐ 100 % capture/100) + (1 ‐ 99.9 % control/100))
ton
2000 lb=
year
17.94 ton PM‐10
year
8760 Hours
Application Revision 5/14/2012, Page 39 of 131

EMISSIONS CALCULATIONS
IV. Sand Drying: Total PM2.5 Emissions (TPY): 17.94
A. PM2.5 Emissions by Equipment Unit ID (EID):
(1)Item
(3)Emission Unit Desription
(4)Max Short Term Throughput
(5)Max Annual Throughput
(6)Emission Factor
(7)* Capture
Efficiency(10)TPM
(11)TPY
(2)EID
(8)**Control
Efficiency(9)
Control Description(12)
Emission Factor Reference ID
Dryer Baghouse 2093.6 million dscf/month 25123.68 million dscf/year 1428.5 lb/million dscf 100 1.4954 17.94BGH0183 99.9 Fabric filter baghouse dust collector (Proposed 0.01 gr/dscf of exhaust)
BH01
B. Proposed Permit Limits for PM2.5 from Sand Drying:
2093.6 million dscf/month 25123.68 million dscf/year 17.941.4954
E. Notes:
As defined in I.A. (7), (8) and (9) for sources with capture and/or control efficiencies for pollution control equipment.
*The term “capture system” for the purpose of this application means the equipment (including hoods, ducts, etc.) used to contain, capture, or transport an air contaminant to a control device. In addition, the term “capture efficiency” means the weight per unit time of an air contaminant entering a capture system and delivered to a control device, divided by the weight per unit time of the air contaminant generated by the source, expressed as a percentage. Therefore, if the emission unit is not exhausted to a control device, the capture system and capture efficiency is not applicable (NA). If the emission unit is using an emission factor with an overall emission reduction efficiency included in the factor, “AP‐42” has been assigned to the capture efficiency.
**The term “control system” for the purpose of this application means any control device or technique which is designed and operated to reduce the quantity of air contaminants emitted to the atmosphere. The term “control efficiency” means the percentage by which a control device or technique reduces the emissions from a stationary source. If the emission unit is controlled by a control device, the capture and control efficiencies are identified. If the emission unit is using an emission factor with an overall emission reduction efficiency included in the factor, “AP‐42” has been assigned to the control efficiency.
C. Emission Factor Source by Reference ID:
BH01 Proposed limit of 0.01 grains per dry standard cubic foot of exhaust
D. Example Calculation for Item 83:
2.868 million dscf
hour
1428.5 lb
million dscf* ((1 ‐ 100 % capture/100) + (1 ‐ 99.9 % control/100))
ton
2000 lb=
year
17.94 ton PM2.5
year
8760 Hours
Application Revision 5/14/2012, Page 40 of 131

EMISSIONS CALCULATIONS
IV. N.G. Combustion: Total Carbon Dioxide Emissions (TPY): 28908
A. Carbon Dioxide Emissions by Equipment Unit ID (EID):
(1)Item
(3)Emission Unit Desription
(4)Max Short Term Throughput
(5)Max Annual Throughput
(6)Emission Factor
(7)* Capture
Efficiency(10)TPM
(11)TPY
(2)EID
(8)**Control
Efficiency(9)
Control Description(12)
Emission Factor Reference ID
56 mmBtu/hr (HHV) Dryer 40.2 million scf N.G./month 481.8 million scf N.G./year 120000 lb/million scf N.G. NA 2409.0000 28908.00BR0181 NA Uncontrolled DRY01 Combustion
B. Proposed Permit Limits for Carbon Dioxide from N.G. Combustion:
40.2 million scf N.G./month 481.8 million scf N.G./year 28908.002409.0000
E. Notes:
As defined in I.A. (7), (8) and (9) for sources with capture and/or control efficiencies for pollution control equipment.
*The term “capture system” for the purpose of this application means the equipment (including hoods, ducts, etc.) used to contain, capture, or transport an air contaminant to a control device. In addition, the term “capture efficiency” means the weight per unit time of an air contaminant entering a capture system and delivered to a control device, divided by the weight per unit time of the air contaminant generated by the source, expressed as a percentage. Therefore, if the emission unit is not exhausted to a control device, the capture system and capture efficiency is not applicable (NA). If the emission unit is using an emission factor with an overall emission reduction efficiency included in the factor, “AP‐42” has been assigned to the capture efficiency.
**The term “control system” for the purpose of this application means any control device or technique which is designed and operated to reduce the quantity of air contaminants emitted to the atmosphere. The term “control efficiency” means the percentage by which a control device or technique reduces the emissions from a stationary source. If the emission unit is controlled by a control device, the capture and control efficiencies are identified. If the emission unit is using an emission factor with an overall emission reduction efficiency included in the factor, “AP‐42” has been assigned to the control efficiency.
C. Emission Factor Source by Reference ID:
DRY01 Combustion AP‐42, TABLE 1.4‐2. Emission Factors for Criteria Pollutants and Greenhouse Gases from Natural Gas Combustion Gas Combustion
D. Example Calculation for Item 81:
0.055 million scf N.G.
hour
120000 lb
million scf N.G. * ((1 ‐ 100 % capture/100) + (1 ‐ 0 % control/100))
ton
2000 lb=
year
28908 ton CO2
year
8760 Hours
Application Revision 5/14/2012, Page 41 of 131

EMISSIONS CALCULATIONS
IV. N.G. Combustion: Total Carbon Monoxide Emissions (TPY): 58.97
A. Carbon Monoxide Emissions by Equipment Unit ID (EID):
(1)Item
(3)Emission Unit Desription
(4)Max Short Term Throughput
(5)Max Annual Throughput
(6)Emission Factor
(7)* Capture
Efficiency(10)TPM
(11)TPY
(2)EID
(8)**Control
Efficiency(9)
Control Description(12)
Emission Factor Reference ID
56 mmBtu/hr (HHV) Dryer 40.2 million scf N.G./month 481.8 million scf N.G./year 244.8 lb/million scf N.G. NA 4.9144 58.97BR0181 NA Uncontrolled DRY01 Combustion
B. Proposed Permit Limits for Carbon Monoxide from N.G. Combustion:
40.2 million scf N.G./month 481.8 million scf N.G./year 58.974.9144
E. Notes:
As defined in I.A. (7), (8) and (9) for sources with capture and/or control efficiencies for pollution control equipment.
*The term “capture system” for the purpose of this application means the equipment (including hoods, ducts, etc.) used to contain, capture, or transport an air contaminant to a control device. In addition, the term “capture efficiency” means the weight per unit time of an air contaminant entering a capture system and delivered to a control device, divided by the weight per unit time of the air contaminant generated by the source, expressed as a percentage. Therefore, if the emission unit is not exhausted to a control device, the capture system and capture efficiency is not applicable (NA). If the emission unit is using an emission factor with an overall emission reduction efficiency included in the factor, “AP‐42” has been assigned to the capture efficiency.
**The term “control system” for the purpose of this application means any control device or technique which is designed and operated to reduce the quantity of air contaminants emitted to the atmosphere. The term “control efficiency” means the percentage by which a control device or technique reduces the emissions from a stationary source. If the emission unit is controlled by a control device, the capture and control efficiencies are identified. If the emission unit is using an emission factor with an overall emission reduction efficiency included in the factor, “AP‐42” has been assigned to the control efficiency.
C. Emission Factor Source by Reference ID:
DRY01 Combustion Manufacturer's guarantee
D. Example Calculation for Item 81:
0.055 million scf N.G.
hour
244.8 lb
million scf N.G. * ((1 ‐ 100 % capture/100) + (1 ‐ 0 % control/100))
ton
2000 lb=
year
58.97 ton CO
year
8760 Hours
Application Revision 5/14/2012, Page 42 of 131

EMISSIONS CALCULATIONS
IV. N.G. Combustion: Total Nitrogen Oxides Emissions (TPY): 41.77
A. Nitrogen Oxides Emissions by Equipment Unit ID (EID):
(1)Item
(3)Emission Unit Desription
(4)Max Short Term Throughput
(5)Max Annual Throughput
(6)Emission Factor
(7)* Capture
Efficiency(10)TPM
(11)TPY
(2)EID
(8)**Control
Efficiency(9)
Control Description(12)
Emission Factor Reference ID
56 mmBtu/hr (HHV) Dryer 40.2 million scf N.G./month 481.8 million scf N.G./year 173.4 lb/million scf N.G. NA 3.4810 41.77BR0181 NA Uncontrolled DRY01 Combustion
B. Proposed Permit Limits for Nitrogen Oxides from N.G. Combustion:
40.2 million scf N.G./month 481.8 million scf N.G./year 41.773.4810
E. Notes:
As defined in I.A. (7), (8) and (9) for sources with capture and/or control efficiencies for pollution control equipment.
*The term “capture system” for the purpose of this application means the equipment (including hoods, ducts, etc.) used to contain, capture, or transport an air contaminant to a control device. In addition, the term “capture efficiency” means the weight per unit time of an air contaminant entering a capture system and delivered to a control device, divided by the weight per unit time of the air contaminant generated by the source, expressed as a percentage. Therefore, if the emission unit is not exhausted to a control device, the capture system and capture efficiency is not applicable (NA). If the emission unit is using an emission factor with an overall emission reduction efficiency included in the factor, “AP‐42” has been assigned to the capture efficiency.
**The term “control system” for the purpose of this application means any control device or technique which is designed and operated to reduce the quantity of air contaminants emitted to the atmosphere. The term “control efficiency” means the percentage by which a control device or technique reduces the emissions from a stationary source. If the emission unit is controlled by a control device, the capture and control efficiencies are identified. If the emission unit is using an emission factor with an overall emission reduction efficiency included in the factor, “AP‐42” has been assigned to the control efficiency.
C. Emission Factor Source by Reference ID:
DRY01 Combustion Manufacturer's guarantee
D. Example Calculation for Item 81:
0.055 million scf N.G.
hour
173.4 lb
million scf N.G. * ((1 ‐ 100 % capture/100) + (1 ‐ 0 % control/100))
ton
2000 lb=
year
41.77 ton NOx
year
8760 Hours
Application Revision 5/14/2012, Page 43 of 131

EMISSIONS CALCULATIONS
IV. N.G. Combustion: Total PM Emissions (TPY): 0
A. PM Emissions by Equipment Unit ID (EID):
(1)Item
(3)Emission Unit Desription
(4)Max Short Term Throughput
(5)Max Annual Throughput
(6)Emission Factor
(7)* Capture
Efficiency(10)TPM
(11)TPY
(2)EID
(8)**Control
Efficiency(9)
Control Description(12)
Emission Factor Reference ID
56 mmBtu/hr (HHV) Dryer 40.2 million scf N.G./month 481.8 million scf N.G./year 7.6 lb/million scf N.G. NA 0.0002 0.00BR0181 NA Uncontrolled DRY01 Combustion
B. Proposed Permit Limits for PM from N.G. Combustion:
40.2 million scf N.G./month 481.8 million scf N.G./year 0.000.0002
E. Notes:
As defined in I.A. (7), (8) and (9) for sources with capture and/or control efficiencies for pollution control equipment.
*The term “capture system” for the purpose of this application means the equipment (including hoods, ducts, etc.) used to contain, capture, or transport an air contaminant to a control device. In addition, the term “capture efficiency” means the weight per unit time of an air contaminant entering a capture system and delivered to a control device, divided by the weight per unit time of the air contaminant generated by the source, expressed as a percentage. Therefore, if the emission unit is not exhausted to a control device, the capture system and capture efficiency is not applicable (NA). If the emission unit is using an emission factor with an overall emission reduction efficiency included in the factor, “AP‐42” has been assigned to the capture efficiency.
**The term “control system” for the purpose of this application means any control device or technique which is designed and operated to reduce the quantity of air contaminants emitted to the atmosphere. The term “control efficiency” means the percentage by which a control device or technique reduces the emissions from a stationary source. If the emission unit is controlled by a control device, the capture and control efficiencies are identified. If the emission unit is using an emission factor with an overall emission reduction efficiency included in the factor, “AP‐42” has been assigned to the control efficiency.
C. Emission Factor Source by Reference ID:
DRY01 Combustion AP‐42, TABLE 1.4‐2. Emission Factors for Criteria Pollutants and Greenhouse Gases from Natural Gas Combustion Gas Combustion
D. Example Calculation for Item 81:
0.055 million scf N.G.
hour
7.6 lb
million scf N.G.* ((1 ‐ 100 % capture/100) + (1 ‐ 99.9 % control/100))
ton
2000 lb=
year
0 ton PM
year
8760 Hours
Application Revision 5/14/2012, Page 44 of 131

EMISSIONS CALCULATIONS
IV. N.G. Combustion: Total PM‐10 Emissions (TPY): 0
A. PM‐10 Emissions by Equipment Unit ID (EID):
(1)Item
(3)Emission Unit Desription
(4)Max Short Term Throughput
(5)Max Annual Throughput
(6)Emission Factor
(7)* Capture
Efficiency(10)TPM
(11)TPY
(2)EID
(8)**Control
Efficiency(9)
Control Description(12)
Emission Factor Reference ID
56 mmBtu/hr (HHV) Dryer 40.2 million scf N.G./month 481.8 million scf N.G./year 7.6 lb/million scf N.G. NA 0.0002 0.00BR0181 NA Uncontrolled DRY01 Combustion
B. Proposed Permit Limits for PM‐10 from N.G. Combustion:
40.2 million scf N.G./month 481.8 million scf N.G./year 0.000.0002
E. Notes:
As defined in I.A. (7), (8) and (9) for sources with capture and/or control efficiencies for pollution control equipment.
*The term “capture system” for the purpose of this application means the equipment (including hoods, ducts, etc.) used to contain, capture, or transport an air contaminant to a control device. In addition, the term “capture efficiency” means the weight per unit time of an air contaminant entering a capture system and delivered to a control device, divided by the weight per unit time of the air contaminant generated by the source, expressed as a percentage. Therefore, if the emission unit is not exhausted to a control device, the capture system and capture efficiency is not applicable (NA). If the emission unit is using an emission factor with an overall emission reduction efficiency included in the factor, “AP‐42” has been assigned to the capture efficiency.
**The term “control system” for the purpose of this application means any control device or technique which is designed and operated to reduce the quantity of air contaminants emitted to the atmosphere. The term “control efficiency” means the percentage by which a control device or technique reduces the emissions from a stationary source. If the emission unit is controlled by a control device, the capture and control efficiencies are identified. If the emission unit is using an emission factor with an overall emission reduction efficiency included in the factor, “AP‐42” has been assigned to the control efficiency.
C. Emission Factor Source by Reference ID:
DRY01 Combustion AP‐42, TABLE 1.4‐2. Emission Factors for Criteria Pollutants and Greenhouse Gases from Natural Gas Combustion Gas Combustion
D. Example Calculation for Item 81:
0.055 million scf N.G.
hour
7.6 lb
million scf N.G.* ((1 ‐ 100 % capture/100) + (1 ‐ 99.9 % control/100))
ton
2000 lb=
year
0 ton PM‐10
year
8760 Hours
Application Revision 5/14/2012, Page 45 of 131

EMISSIONS CALCULATIONS
IV. N.G. Combustion: Total PM2.5 Emissions (TPY): 0.18
A. PM2.5 Emissions by Equipment Unit ID (EID):
(1)Item
(3)Emission Unit Desription
(4)Max Short Term Throughput
(5)Max Annual Throughput
(6)Emission Factor
(7)* Capture
Efficiency(10)TPM
(11)TPY
(2)EID
(8)**Control
Efficiency(9)
Control Description(12)
Emission Factor Reference ID
56 mmBtu/hr (HHV) Dryer 40.2 million scf N.G./month 481.8 million scf N.G./year 7.6 lb/million scf N.G. NA 0.0153 0.18BR0181 NA Uncontrolled DRY01 Combustion
B. Proposed Permit Limits for PM2.5 from N.G. Combustion:
40.2 million scf N.G./month 481.8 million scf N.G./year 0.180.0153
E. Notes:
As defined in I.A. (7), (8) and (9) for sources with capture and/or control efficiencies for pollution control equipment.
*The term “capture system” for the purpose of this application means the equipment (including hoods, ducts, etc.) used to contain, capture, or transport an air contaminant to a control device. In addition, the term “capture efficiency” means the weight per unit time of an air contaminant entering a capture system and delivered to a control device, divided by the weight per unit time of the air contaminant generated by the source, expressed as a percentage. Therefore, if the emission unit is not exhausted to a control device, the capture system and capture efficiency is not applicable (NA). If the emission unit is using an emission factor with an overall emission reduction efficiency included in the factor, “AP‐42” has been assigned to the capture efficiency.
**The term “control system” for the purpose of this application means any control device or technique which is designed and operated to reduce the quantity of air contaminants emitted to the atmosphere. The term “control efficiency” means the percentage by which a control device or technique reduces the emissions from a stationary source. If the emission unit is controlled by a control device, the capture and control efficiencies are identified. If the emission unit is using an emission factor with an overall emission reduction efficiency included in the factor, “AP‐42” has been assigned to the control efficiency.
C. Emission Factor Source by Reference ID:
DRY01 Combustion AP‐42, TABLE 1.4‐2. Emission Factors for Criteria Pollutants and Greenhouse Gases from Natural Gas Combustion Gas Combustion
D. Example Calculation for Item 81:
0.055 million scf N.G.
hour
7.6 lb
million scf N.G. * ((1 ‐ 100 % capture/100) + (1 ‐ 90 % control/100))
ton
2000 lb=
year
0.18 ton PM2.5
year
8760 Hours
Application Revision 5/14/2012, Page 46 of 131

EMISSIONS CALCULATIONS
IV. N.G. Combustion: Total Sulfur Dioxide Emissions (TPY): 0.14
A. Sulfur Dioxide Emissions by Equipment Unit ID (EID):
(1)Item
(3)Emission Unit Desription
(4)Max Short Term Throughput
(5)Max Annual Throughput
(6)Emission Factor
(7)* Capture
Efficiency(10)TPM
(11)TPY
(2)EID
(8)**Control
Efficiency(9)
Control Description(12)
Emission Factor Reference ID
56 mmBtu/hr (HHV) Dryer 40.2 million scf N.G./month 481.8 million scf N.G./year 0.6 lb/million scf N.G. NA 0.0120 0.14BR0181 NA Uncontrolled DRY01 Combustion
B. Proposed Permit Limits for Sulfur Dioxide from N.G. Combustion:
40.2 million scf N.G./month 481.8 million scf N.G./year 0.140.0120
E. Notes:
As defined in I.A. (7), (8) and (9) for sources with capture and/or control efficiencies for pollution control equipment.
*The term “capture system” for the purpose of this application means the equipment (including hoods, ducts, etc.) used to contain, capture, or transport an air contaminant to a control device. In addition, the term “capture efficiency” means the weight per unit time of an air contaminant entering a capture system and delivered to a control device, divided by the weight per unit time of the air contaminant generated by the source, expressed as a percentage. Therefore, if the emission unit is not exhausted to a control device, the capture system and capture efficiency is not applicable (NA). If the emission unit is using an emission factor with an overall emission reduction efficiency included in the factor, “AP‐42” has been assigned to the capture efficiency.
**The term “control system” for the purpose of this application means any control device or technique which is designed and operated to reduce the quantity of air contaminants emitted to the atmosphere. The term “control efficiency” means the percentage by which a control device or technique reduces the emissions from a stationary source. If the emission unit is controlled by a control device, the capture and control efficiencies are identified. If the emission unit is using an emission factor with an overall emission reduction efficiency included in the factor, “AP‐42” has been assigned to the control efficiency.
C. Emission Factor Source by Reference ID:
DRY01 Combustion AP‐42, TABLE 1.4‐2. Emission Factors for Criteria Pollutants and Greenhouse Gases from Natural Gas Combustion Gas Combustion
D. Example Calculation for Item 81:
0.055 million scf N.G.
hour
0.6 lb
million scf N.G. * ((1 ‐ 100 % capture/100) + (1 ‐ 0 % control/100))
ton
2000 lb=
year
0.14 ton SO2
year
8760 Hours
Application Revision 5/14/2012, Page 47 of 131

EMISSIONS CALCULATIONS
IV. N.G. Combustion: Total Volatile Organic Compounds Emissions (TPY): 1.32
A. Volatile Organic Compounds Emissions by Equipment Unit ID (EID):
(1)Item
(3)Emission Unit Desription
(4)Max Short Term Throughput
(5)Max Annual Throughput
(6)Emission Factor
(7)* Capture
Efficiency(10)TPM
(11)TPY
(2)EID
(8)**Control
Efficiency(9)
Control Description(12)
Emission Factor Reference ID
56 mmBtu/hr (HHV) Dryer 40.2 million scf N.G./month 481.8 million scf N.G./year 5.5 lb/million scf N.G. NA 0.1104 1.32BR0181 NA Uncontrolled DRY01 Combustion
B. Proposed Permit Limits for Volatile Organic Compounds from N.G. Combustion:
40.2 million scf N.G./month 481.8 million scf N.G./year 1.320.1104
E. Notes:
As defined in I.A. (7), (8) and (9) for sources with capture and/or control efficiencies for pollution control equipment.
*The term “capture system” for the purpose of this application means the equipment (including hoods, ducts, etc.) used to contain, capture, or transport an air contaminant to a control device. In addition, the term “capture efficiency” means the weight per unit time of an air contaminant entering a capture system and delivered to a control device, divided by the weight per unit time of the air contaminant generated by the source, expressed as a percentage. Therefore, if the emission unit is not exhausted to a control device, the capture system and capture efficiency is not applicable (NA). If the emission unit is using an emission factor with an overall emission reduction efficiency included in the factor, “AP‐42” has been assigned to the capture efficiency.
**The term “control system” for the purpose of this application means any control device or technique which is designed and operated to reduce the quantity of air contaminants emitted to the atmosphere. The term “control efficiency” means the percentage by which a control device or technique reduces the emissions from a stationary source. If the emission unit is controlled by a control device, the capture and control efficiencies are identified. If the emission unit is using an emission factor with an overall emission reduction efficiency included in the factor, “AP‐42” has been assigned to the control efficiency.
C. Emission Factor Source by Reference ID:
DRY01 Combustion AP‐42, TABLE 1.4‐2. Emission Factors for Criteria Pollutants and Greenhouse Gases from Natural Gas Combustion Gas Combustion
D. Example Calculation for Item 81:
0.055 million scf N.G.
hour
5.5 lb
million scf N.G. * ((1 ‐ 100 % capture/100) + (1 ‐ 0 % control/100))
ton
2000 lb=
year
1.32 ton VOM
year
8760 Hours
Application Revision 5/14/2012, Page 48 of 131

EMISSIONS CALCULATIONS
V. Dry Sand Processes: Total PM Emissions (TPY): 58.67
A. PM Emissions by Equipment Unit ID (EID):
(1)Item
(3)Emission Unit Desription
(4)Max Short Term Throughput
(5)Max Annual Throughput
(6)Emission Factor
(7)* Capture
Efficiency(10)TPM
(11)TPY
(2)EID
(8)**Control
Efficiency(9)
Control Description(12)
Emission Factor Reference ID
Belt Conveyor 146000.0 tons/month 1752000 tons/year 0 lb/ton 100 0.0000 0.00C28106 0 Controlled by BH02 (See Figure 10) NONE
Belt Conveyor 146000.0 tons/month 1752000 tons/year 0 lb/ton 100 0.0000 0.00C30111 0 Controlled by BH02 (See Figure 10) NONE
Belt Conveyor 219000.0 tons/month 2628000 tons/year 0.00014 lb/ton AP‐42 0.0153 0.18C31112 AP‐42 Covered (See Figure 9) 30502006 (controlled)
Belt Conveyor 146000.0 tons/month 1752000 tons/year 0 lb/ton 100 0.0000 0.00C32120 0 Controlled by BH02 (See Figure 10) NONE
Belt Conveyor 219000.0 tons/month 2628000 tons/year 0.00014 lb/ton AP‐42 0.0153 0.18C33121 AP‐42 Covered (See Figure 9) 30502006 (controlled)
Belt Conveyor 219000.0 tons/month 2628000 tons/year 0.00014 lb/ton AP‐42 0.0153 0.18C34135 AP‐42 Covered (See Figure 10) 30502006 (controlled)
Belt Conveyor 219000.0 tons/month 2628000 tons/year 0 lb/ton 100 0.0000 0.00C35143 0 Controlled by BH02 (See Figure 10) NONE
Belt Conveyor 219000.0 tons/month 2628000 tons/year 0.00014 lb/ton AP‐42 0.0153 0.18C36146 AP‐42 Covered (See Figure 9) 30502006 (controlled)
Belt Conveyor 219000.0 tons/month 2628000 tons/year 0.00014 lb/ton AP‐42 0.0153 0.18C37153 AP‐42 Covered (See Figure 9) 30502006 (controlled)
Belt Conveyor 219000.0 tons/month 2628000 tons/year 0 lb/ton 100 0.0000 0.00C38160 0 Controlled by BH02 (See Figure 10) NONE
Belt Conveyor 146000.0 tons/month 1752000 tons/year 0.00052 lb/ton 100 0.0380 0.46C29107 0 Covered & controlled by bin vent dust collector (See Figure 4)
RadialStacker
Belt Feeder 97090.0 tons/month 1165080 tons/year 0 lb/ton 100 0.0000 0.00F0596 0 Controlled by BH02 (See Figure 10) NONE
Belt Feeder 97090.0 tons/month 1165080 tons/year 0 lb/ton 100 0.0000 0.00F0698 0 Controlled by BH02 (See Figure 10) NONE
Belt Feeder 97090.0 tons/month 1165080 tons/year 0 lb/ton 100 0.0000 0.00F07100 0 Controlled by BH02 (See Figure 10) NONE
Belt Feeder 219000.0 tons/month 2628000 tons/year 0 lb/ton 100 0.0000 0.00F08117 0 Controlled by BH02 (See Figure 10) NONE
Belt Feeder 219000.0 tons/month 2628000 tons/year 0 lb/ton 100 0.0000 0.00F09126 0 Controlled by BH02 (See Figure 10) NONE
Bucket Elevator 292000.0 tons/month 3504000 tons/year 0.00014 lb/ton AP‐42 0.0204 0.25BE0192 AP‐42 Covered (See Figure 9) 30502006 (controlled)
Bucket Elevator 219000.0 tons/month 2628000 tons/year 0.00014 lb/ton AP‐42 0.0153 0.18BE02113 AP‐42 Covered (See Figure 9) 30502006 (controlled)
Bucket Elevator 219000.0 tons/month 2628000 tons/year 0.00014 lb/ton AP‐42 0.0153 0.18BE03122 AP‐42 Covered (See Figure 9) 30502006 (controlled)
Bucket Elevator 219000.0 tons/month 2628000 tons/year 0.00014 lb/ton AP‐42 0.0153 0.18BE04136 AP‐42 Covered (See Figure 9) 30502006 (controlled)
Bucket Elevator 219000.0 tons/month 2628000 tons/year 0.00014 lb/ton AP‐42 0.0153 0.18BE05144 AP‐42 Covered (See Figure 9) 30502006 (controlled)
Bucket Elevator 219000.0 tons/month 2628000 tons/year 0.00014 lb/ton AP‐42 0.0153 0.18BE06161 AP‐42 Covered (See Figure 9) 30502006 (controlled)
Dry Screen 97090.0 tons/month 1165080 tons/year 0 lb/ton 100 0.0000 0.00SCR03103 0 Controlled by BH02 (See Figure 10) NONE
Dry Screen 97090.0 tons/month 1165080 tons/year 0 lb/ton 100 0.0000 0.00SCR04104 0 Controlled by BH02 (See Figure 10) NONE
Dry Screen 97090.0 tons/month 1165080 tons/year 0 lb/ton 100 0.0000 0.00SCR05105 0 Controlled by BH02 (See Figure 10) NONE
Dry Screen 219000.0 tons/month 2628000 tons/year 0 lb/ton 100 0.0000 0.00SCR06119 0 Controlled by BH02 (See Figure 10) NONE
Dry Screen 219000.0 tons/month 2628000 tons/year 0 lb/ton 100 0.0000 0.00SCR07128 0 Controlled by BH02 (See Figure 10) NONE
Feed Hopper 292000.0 tons/month 3504000 tons/year 0.0099 lb/ton 100 1.4454 17.34FH0593 0 Covered & controlled by bin vent dust collector (See Figure 8)
30503813
Feed Hopper 219000.0 tons/month 2628000 tons/year 0.0099 lb/ton 100 1.0841 13.01FH06114 0 Covered & controlled by bin vent dust collector (See Figure 8)
30503813
Feed Hopper 219000.0 tons/month 2628000 tons/year 0.0099 lb/ton 100 1.0841 13.01FH07123 0 Covered & controlled by bin vent dust collector (See Figure 8)
30503813
Screening Baghouse 1489.2 million dscf/month 17870.4 million dscf/year 1428.5 lb/million dscf 100 1.0637 12.76BGH02129 99.9 Fabric filter baghouse dust collector (Proposed 0.01 gr/dscf of exhaust)
BH02
Application Revision 5/14/2012, Page 49 of 131

EMISSIONS CALCULATIONS
V. Dry Sand Processes: Total PM Emissions (TPY): 58.67
A. PM Emissions by Equipment Unit ID (EID):
(1)Item
(3)Emission Unit Desription
(4)Max Short Term Throughput
(5)Max Annual Throughput
(6)Emission Factor
(7)* Capture
Efficiency(10)TPM
(11)TPY
(2)EID
(8)**Control
Efficiency(9)
Control Description(12)
Emission Factor Reference ID
B. Proposed Permit Limits for PM from Dry Sand Processes:
97090.0 tons/month 3504000 tons/year 58.674.8889
E. Notes:
As defined in I.A. (7), (8) and (9) for sources with capture and/or control efficiencies for pollution control equipment.
*The term “capture system” for the purpose of this application means the equipment (including hoods, ducts, etc.) used to contain, capture, or transport an air contaminant to a control device. In addition, the term “capture efficiency” means the weight per unit time of an air contaminant entering a capture system and delivered to a control device, divided by the weight per unit time of the air contaminant generated by the source, expressed as a percentage. Therefore, if the emission unit is not exhausted to a control device, the capture system and capture efficiency is not applicable (NA). If the emission unit is using an emission factor with an overall emission reduction efficiency included in the factor, “AP‐42” has been assigned to the capture efficiency.
**The term “control system” for the purpose of this application means any control device or technique which is designed and operated to reduce the quantity of air contaminants emitted to the atmosphere. The term “control efficiency” means the percentage by which a control device or technique reduces the emissions from a stationary source. If the emission unit is controlled by a control device, the capture and control efficiencies are identified. If the emission unit is using an emission factor with an overall emission reduction efficiency included in the factor, “AP‐42” has been assigned to the control efficiency.
C. Emission Factor Source by Reference ID:
30502006 (controlled) AP‐42, Table 11.19.2‐2 Crushed Stone Processing and Pulverized Mineral Processing, SCC 30502006, Conveyor Transfer Point (controlled)
30503813 AP‐42, Table 11.19.2‐4 Crushed Stone Processing and Pulverized Mineral Processing, SCC 30503813, Product Storage with Fabric Filter Control
BH02 Proposed limit of 0.01 grains per dry standard cubic foot of exhaust
NONE Controlled by Baghouse (see Emission Unit ID BGH02 for emissions)
RadialStacker AP‐42 ‐ Section 13.2.4 Aggregate Handling & Storage Piles; Batch/Continuous Drop Equation (1)
D. Example Calculation for Item 129:
2.04 million dscf
hour
1428.5 lb
million dscf* ((1 ‐ 100 % capture/100) + (1 ‐ 99.9 % control/100))
ton
2000 lb=
year
12.76 ton PM
year
8760 Hours
Application Revision 5/14/2012, Page 50 of 131

EMISSIONS CALCULATIONS
V. Dry Sand Processes: Total PM‐10 Emissions (TPY): 20.68
A. PM‐10 Emissions by Equipment Unit ID (EID):
(1)Item
(3)Emission Unit Desription
(4)Max Short Term Throughput
(5)Max Annual Throughput
(6)Emission Factor
(7)* Capture
Efficiency(10)TPM
(11)TPY
(2)EID
(8)**Control
Efficiency(9)
Control Description(12)
Emission Factor Reference ID
Belt Conveyor 146000.0 tons/month 1752000 tons/year 0 lb/ton 100 0.0000 0.00C28106 0 Controlled by BH02 (See Figure 10) NONE
Belt Conveyor 146000.0 tons/month 1752000 tons/year 0 lb/ton 100 0.0000 0.00C30111 0 Controlled by BH02 (See Figure 10) NONE
Belt Conveyor 219000.0 tons/month 2628000 tons/year 0.000046 lb/ton AP‐42 0.0050 0.06C31112 AP‐42 Covered (See Figure 9) 30502006 (controlled)
Belt Conveyor 146000.0 tons/month 1752000 tons/year 0 lb/ton 100 0.0000 0.00C32120 0 Controlled by BH02 (See Figure 10) NONE
Belt Conveyor 219000.0 tons/month 2628000 tons/year 0.000046 lb/ton AP‐42 0.0050 0.06C33121 AP‐42 Covered (See Figure 9) 30502006 (controlled)
Belt Conveyor 219000.0 tons/month 2628000 tons/year 0.000046 lb/ton AP‐42 0.0050 0.06C34135 AP‐42 Covered (See Figure 10) 30502006 (controlled)
Belt Conveyor 219000.0 tons/month 2628000 tons/year 0 lb/ton 100 0.0000 0.00C35143 0 Controlled by BH02 (See Figure 10) NONE
Belt Conveyor 219000.0 tons/month 2628000 tons/year 0.000046 lb/ton AP‐42 0.0050 0.06C36146 AP‐42 Covered (See Figure 9) 30502006 (controlled)
Belt Conveyor 219000.0 tons/month 2628000 tons/year 0.000046 lb/ton AP‐42 0.0050 0.06C37153 AP‐42 Covered (See Figure 9) 30502006 (controlled)
Belt Conveyor 219000.0 tons/month 2628000 tons/year 0 lb/ton 100 0.0000 0.00C38160 0 Controlled by BH02 (See Figure 10) NONE
Belt Conveyor 146000.0 tons/month 1752000 tons/year 0.00025 lb/ton 100 0.0183 0.22C29107 0 Covered & controlled by bin vent dust collector (See Figure 4)
RadialStacker
Belt Feeder 97090.0 tons/month 1165080 tons/year 0 lb/ton 100 0.0000 0.00F0596 0 Controlled by BH02 (See Figure 10) NONE
Belt Feeder 97090.0 tons/month 1165080 tons/year 0 lb/ton 100 0.0000 0.00F0698 0 Controlled by BH02 (See Figure 10) NONE
Belt Feeder 97090.0 tons/month 1165080 tons/year 0 lb/ton 100 0.0000 0.00F07100 0 Controlled by BH02 (See Figure 10) NONE
Belt Feeder 219000.0 tons/month 2628000 tons/year 0 lb/ton 100 0.0000 0.00F08117 0 Controlled by BH02 (See Figure 10) NONE
Belt Feeder 219000.0 tons/month 2628000 tons/year 0 lb/ton 100 0.0000 0.00F09126 0 Controlled by BH02 (See Figure 10) NONE
Bucket Elevator 292000.0 tons/month 3504000 tons/year 0.000046 lb/ton AP‐42 0.0067 0.08BE0192 AP‐42 Covered (See Figure 9) 30502006 (controlled)
Bucket Elevator 219000.0 tons/month 2628000 tons/year 0.000046 lb/ton AP‐42 0.0050 0.06BE02113 AP‐42 Covered (See Figure 9) 30502006 (controlled)
Bucket Elevator 219000.0 tons/month 2628000 tons/year 0.000046 lb/ton AP‐42 0.0050 0.06BE03122 AP‐42 Covered (See Figure 9) 30502006 (controlled)
Bucket Elevator 219000.0 tons/month 2628000 tons/year 0.000046 lb/ton AP‐42 0.0050 0.06BE04136 AP‐42 Covered (See Figure 9) 30502006 (controlled)
Bucket Elevator 219000.0 tons/month 2628000 tons/year 0.000046 lb/ton AP‐42 0.0050 0.06BE05144 AP‐42 Covered (See Figure 9) 30502006 (controlled)
Bucket Elevator 219000.0 tons/month 2628000 tons/year 0.000046 lb/ton AP‐42 0.0050 0.06BE06161 AP‐42 Covered (See Figure 9) 30502006 (controlled)
Dry Screen 97090.0 tons/month 1165080 tons/year 0 lb/ton 100 0.0000 0.00SCR03103 0 Controlled by BH02 (See Figure 10) NONE
Dry Screen 97090.0 tons/month 1165080 tons/year 0 lb/ton 100 0.0000 0.00SCR04104 0 Controlled by BH02 (See Figure 10) NONE
Dry Screen 97090.0 tons/month 1165080 tons/year 0 lb/ton 100 0.0000 0.00SCR05105 0 Controlled by BH02 (See Figure 10) NONE
Dry Screen 219000.0 tons/month 2628000 tons/year 0 lb/ton 100 0.0000 0.00SCR06119 0 Controlled by BH02 (See Figure 10) NONE
Dry Screen 219000.0 tons/month 2628000 tons/year 0 lb/ton 100 0.0000 0.00SCR07128 0 Controlled by BH02 (See Figure 10) NONE
Feed Hopper 292000.0 tons/month 3504000 tons/year 0.0016 lb/ton 100 0.2336 2.80FH0593 0 Covered & controlled by bin vent dust collector (See Figure 8)
30503813
Feed Hopper 219000.0 tons/month 2628000 tons/year 0.0016 lb/ton 100 0.1752 2.10FH06114 0 Covered & controlled by bin vent dust collector (See Figure 8)
30503813
Feed Hopper 219000.0 tons/month 2628000 tons/year 0.0016 lb/ton 100 0.1752 2.10FH07123 0 Covered & controlled by bin vent dust collector (See Figure 8)
30503813
Screening Baghouse 1489.2 million dscf/month 17870.4 million dscf/year 1428.5 lb/million dscf 100 1.0637 12.76BGH02129 99.9 Fabric filter baghouse dust collector (Proposed 0.01 gr/dscf of exhaust)
BH02
Application Revision 5/14/2012, Page 51 of 131

EMISSIONS CALCULATIONS
V. Dry Sand Processes: Total PM‐10 Emissions (TPY): 20.68
A. PM‐10 Emissions by Equipment Unit ID (EID):
(1)Item
(3)Emission Unit Desription
(4)Max Short Term Throughput
(5)Max Annual Throughput
(6)Emission Factor
(7)* Capture
Efficiency(10)TPM
(11)TPY
(2)EID
(8)**Control
Efficiency(9)
Control Description(12)
Emission Factor Reference ID
B. Proposed Permit Limits for PM‐10 from Dry Sand Processes:
97090.0 tons/month 3504000 tons/year 20.681.7230
E. Notes:
As defined in I.A. (7), (8) and (9) for sources with capture and/or control efficiencies for pollution control equipment.
*The term “capture system” for the purpose of this application means the equipment (including hoods, ducts, etc.) used to contain, capture, or transport an air contaminant to a control device. In addition, the term “capture efficiency” means the weight per unit time of an air contaminant entering a capture system and delivered to a control device, divided by the weight per unit time of the air contaminant generated by the source, expressed as a percentage. Therefore, if the emission unit is not exhausted to a control device, the capture system and capture efficiency is not applicable (NA). If the emission unit is using an emission factor with an overall emission reduction efficiency included in the factor, “AP‐42” has been assigned to the capture efficiency.
**The term “control system” for the purpose of this application means any control device or technique which is designed and operated to reduce the quantity of air contaminants emitted to the atmosphere. The term “control efficiency” means the percentage by which a control device or technique reduces the emissions from a stationary source. If the emission unit is controlled by a control device, the capture and control efficiencies are identified. If the emission unit is using an emission factor with an overall emission reduction efficiency included in the factor, “AP‐42” has been assigned to the control efficiency.
C. Emission Factor Source by Reference ID:
30502006 (controlled) AP‐42, Table 11.19.2‐2 Crushed Stone Processing and Pulverized Mineral Processing, SCC 30502006, Conveyor Transfer Point (controlled)
30503813 AP‐42, Table 11.19.2‐4 Crushed Stone Processing and Pulverized Mineral Processing, SCC 30503813, Product Storage with Fabric Filter Control
BH02 Proposed limit of 0.01 grains per dry standard cubic foot of exhaust
NONE Controlled by Baghouse (see Emission Unit ID BGH02 for emissions)
RadialStacker AP‐42 ‐ Section 13.2.4 Aggregate Handling & Storage Piles; Batch/Continuous Drop Equation (1)
D. Example Calculation for Item 129:
2.04 million dscf
hour
1428.5 lb
million dscf* ((1 ‐ 100 % capture/100) + (1 ‐ 99.9 % control/100))
ton
2000 lb=
year
12.76 ton PM‐10
year
8760 Hours
Application Revision 5/14/2012, Page 52 of 131

EMISSIONS CALCULATIONS
V. Dry Sand Processes: Total PM2.5 Emissions (TPY): 15.59
A. PM2.5 Emissions by Equipment Unit ID (EID):
(1)Item
(3)Emission Unit Desription
(4)Max Short Term Throughput
(5)Max Annual Throughput
(6)Emission Factor
(7)* Capture
Efficiency(10)TPM
(11)TPY
(2)EID
(8)**Control
Efficiency(9)
Control Description(12)
Emission Factor Reference ID
Belt Conveyor 146000.0 tons/month 1752000 tons/year 0 lb/ton 100 0.0000 0.00C28106 0 Controlled by BH02 (See Figure 10) NONE
Belt Conveyor 146000.0 tons/month 1752000 tons/year 0 lb/ton 100 0.0000 0.00C30111 0 Controlled by BH02 (See Figure 10) NONE
Belt Conveyor 219000.0 tons/month 2628000 tons/year 0.000013 lb/ton AP‐42 0.0014 0.02C31112 AP‐42 Covered (See Figure 9) 30502006 (controlled)
Belt Conveyor 146000.0 tons/month 1752000 tons/year 0 lb/ton 100 0.0000 0.00C32120 0 Controlled by BH02 (See Figure 10) NONE
Belt Conveyor 219000.0 tons/month 2628000 tons/year 0.000013 lb/ton AP‐42 0.0014 0.02C33121 AP‐42 Covered (See Figure 9) 30502006 (controlled)
Belt Conveyor 219000.0 tons/month 2628000 tons/year 0.000013 lb/ton AP‐42 0.0014 0.02C34135 AP‐42 Covered (See Figure 10) 30502006 (controlled)
Belt Conveyor 219000.0 tons/month 2628000 tons/year 0 lb/ton 100 0.0000 0.00C35143 0 Controlled by BH02 (See Figure 10) NONE
Belt Conveyor 219000.0 tons/month 2628000 tons/year 0.000013 lb/ton AP‐42 0.0014 0.02C36146 AP‐42 Covered (See Figure 9) 30502006 (controlled)
Belt Conveyor 219000.0 tons/month 2628000 tons/year 0.000013 lb/ton AP‐42 0.0014 0.02C37153 AP‐42 Covered (See Figure 9) 30502006 (controlled)
Belt Conveyor 219000.0 tons/month 2628000 tons/year 0 lb/ton 100 0.0000 0.00C38160 0 Controlled by BH02 (See Figure 10) NONE
Belt Conveyor 146000.0 tons/month 1752000 tons/year 0.000008 lb/ton 100 0.0006 0.01C29107 0 Covered & controlled by bin vent dust collector (See Figure 4)
RadialStacker
Belt Feeder 97090.0 tons/month 1165080 tons/year 0 lb/ton 100 0.0000 0.00F0596 0 Controlled by BH02 (See Figure 10) NONE
Belt Feeder 97090.0 tons/month 1165080 tons/year 0 lb/ton 100 0.0000 0.00F0698 0 Controlled by BH02 (See Figure 10) NONE
Belt Feeder 97090.0 tons/month 1165080 tons/year 0 lb/ton 100 0.0000 0.00F07100 0 Controlled by BH02 (See Figure 10) NONE
Belt Feeder 219000.0 tons/month 2628000 tons/year 0 lb/ton 100 0.0000 0.00F08117 0 Controlled by BH02 (See Figure 10) NONE
Belt Feeder 219000.0 tons/month 2628000 tons/year 0 lb/ton 100 0.0000 0.00F09126 0 Controlled by BH02 (See Figure 10) NONE
Bucket Elevator 292000.0 tons/month 3504000 tons/year 0.000013 lb/ton AP‐42 0.0019 0.02BE0192 AP‐42 Covered (See Figure 9) 30502006 (controlled)
Bucket Elevator 219000.0 tons/month 2628000 tons/year 0.000013 lb/ton AP‐42 0.0014 0.02BE02113 AP‐42 Covered (See Figure 9) 30502006 (controlled)
Bucket Elevator 219000.0 tons/month 2628000 tons/year 0.000013 lb/ton AP‐42 0.0014 0.02BE03122 AP‐42 Covered (See Figure 9) 30502006 (controlled)
Bucket Elevator 219000.0 tons/month 2628000 tons/year 0.000013 lb/ton AP‐42 0.0014 0.02BE04136 AP‐42 Covered (See Figure 9) 30502006 (controlled)
Bucket Elevator 219000.0 tons/month 2628000 tons/year 0.000013 lb/ton AP‐42 0.0014 0.02BE05144 AP‐42 Covered (See Figure 9) 30502006 (controlled)
Bucket Elevator 219000.0 tons/month 2628000 tons/year 0.000013 lb/ton AP‐42 0.0014 0.02BE06161 AP‐42 Covered (See Figure 9) 30502006 (controlled)
Dry Screen 97090.0 tons/month 1165080 tons/year 0 lb/ton 100 0.0000 0.00SCR03103 0 Controlled by BH02 (See Figure 10) NONE
Dry Screen 97090.0 tons/month 1165080 tons/year 0 lb/ton 100 0.0000 0.00SCR04104 0 Controlled by BH02 (See Figure 10) NONE
Dry Screen 97090.0 tons/month 1165080 tons/year 0 lb/ton 100 0.0000 0.00SCR05105 0 Controlled by BH02 (See Figure 10) NONE
Dry Screen 219000.0 tons/month 2628000 tons/year 0 lb/ton 100 0.0000 0.00SCR06119 0 Controlled by BH02 (See Figure 10) NONE
Dry Screen 219000.0 tons/month 2628000 tons/year 0 lb/ton 100 0.0000 0.00SCR07128 0 Controlled by BH02 (See Figure 10) NONE
Feed Hopper 292000.0 tons/month 3504000 tons/year 0.0006 lb/ton 100 0.0876 1.05FH0593 0 Covered & controlled by bin vent dust collector (See Figure 8)
30503813
Feed Hopper 219000.0 tons/month 2628000 tons/year 0.0006 lb/ton 100 0.0657 0.79FH06114 0 Covered & controlled by bin vent dust collector (See Figure 8)
30503813
Feed Hopper 219000.0 tons/month 2628000 tons/year 0.0006 lb/ton 100 0.0657 0.79FH07123 0 Covered & controlled by bin vent dust collector (See Figure 8)
30503813
Screening Baghouse 1489.2 million dscf/month 17870.4 million dscf/year 1428.5 lb/million dscf 100 1.0637 12.76BGH02129 99.9 Fabric filter baghouse dust collector (Proposed 0.01 gr/dscf of exhaust)
BH02
Application Revision 5/14/2012, Page 53 of 131

EMISSIONS CALCULATIONS
V. Dry Sand Processes: Total PM2.5 Emissions (TPY): 15.59
A. PM2.5 Emissions by Equipment Unit ID (EID):
(1)Item
(3)Emission Unit Desription
(4)Max Short Term Throughput
(5)Max Annual Throughput
(6)Emission Factor
(7)* Capture
Efficiency(10)TPM
(11)TPY
(2)EID
(8)**Control
Efficiency(9)
Control Description(12)
Emission Factor Reference ID
B. Proposed Permit Limits for PM2.5 from Dry Sand Processes:
97090.0 tons/month 3504000 tons/year 15.591.2994
E. Notes:
As defined in I.A. (7), (8) and (9) for sources with capture and/or control efficiencies for pollution control equipment.
*The term “capture system” for the purpose of this application means the equipment (including hoods, ducts, etc.) used to contain, capture, or transport an air contaminant to a control device. In addition, the term “capture efficiency” means the weight per unit time of an air contaminant entering a capture system and delivered to a control device, divided by the weight per unit time of the air contaminant generated by the source, expressed as a percentage. Therefore, if the emission unit is not exhausted to a control device, the capture system and capture efficiency is not applicable (NA). If the emission unit is using an emission factor with an overall emission reduction efficiency included in the factor, “AP‐42” has been assigned to the capture efficiency.
**The term “control system” for the purpose of this application means any control device or technique which is designed and operated to reduce the quantity of air contaminants emitted to the atmosphere. The term “control efficiency” means the percentage by which a control device or technique reduces the emissions from a stationary source. If the emission unit is controlled by a control device, the capture and control efficiencies are identified. If the emission unit is using an emission factor with an overall emission reduction efficiency included in the factor, “AP‐42” has been assigned to the control efficiency.
C. Emission Factor Source by Reference ID:
30502006 (controlled) AP‐42, Table 11.19.2‐2 Crushed Stone Processing and Pulverized Mineral Processing, SCC 30502006, Conveyor Transfer Point (controlled)
30503813 AP‐42, Table 11.19.2‐4 Crushed Stone Processing and Pulverized Mineral Processing, SCC 30503813, Product Storage with Fabric Filter Control
BH02 Proposed limit of 0.01 grains per dry standard cubic foot of exhaust
NONE Controlled by Baghouse (see Emission Unit ID BGH02 for emissions)
RadialStacker AP‐42 ‐ Section 13.2.4 Aggregate Handling & Storage Piles; Batch/Continuous Drop Equation (1)
D. Example Calculation for Item 129:
2.04 million dscf
hour
1428.5 lb
million dscf* ((1 ‐ 100 % capture/100) + (1 ‐ 99.9 % control/100))
ton
2000 lb=
year
12.76 ton PM2.5
year
8760 Hours
Application Revision 5/14/2012, Page 54 of 131

EMISSIONS CALCULATIONS
VI. Storage Silos: Total PM Emissions (TPY): 60.71
A. PM Emissions by Equipment Unit ID (EID):
(1)Item
(3)Emission Unit Desription
(4)Max Short Term Throughput
(5)Max Annual Throughput
(6)Emission Factor
(7)* Capture
Efficiency(10)TPM
(11)TPY
(2)EID
(8)**Control
Efficiency(9)
Control Description(12)
Emission Factor Reference ID
Drive through Oversize Tank
146000.0 tons/month 1752000 tons/year 0.0099 lb/ton 100 0.7227 8.67WTK01108 0 Covered & controlled by bin vent dust collector (See Figure 11)
30503813
Storage Tank 219000.0 tons/month 2628000 tons/year 0.0099 lb/ton 100 1.0841 13.01STK01137 0 Covered & controlled by bin vent dust collector (See Figure 11)
30503813
Storage Tank 219000.0 tons/month 2628000 tons/year 0.0099 lb/ton 100 1.0841 13.01STK02147 0 Covered & controlled by bin vent dust collector (See Figure 11)
30503813
Storage Tank 219000.0 tons/month 2628000 tons/year 0.0099 lb/ton 100 1.0841 13.01STK03154 0 Covered & controlled by bin vent dust collector (See Figure 11)
30503813
Storage Tank 219000.0 tons/month 2628000 tons/year 0.0099 lb/ton 100 1.0841 13.01STK04162 0 Covered & controlled by bin vent dust collector (See Figure 11)
30503813
B. Proposed Permit Limits for PM from Storage Silos:
219000.0 tons/month 2628000 tons/year 60.715.0589
E. Notes:
As defined in I.A. (7), (8) and (9) for sources with capture and/or control efficiencies for pollution control equipment.
*The term “capture system” for the purpose of this application means the equipment (including hoods, ducts, etc.) used to contain, capture, or transport an air contaminant to a control device. In addition, the term “capture efficiency” means the weight per unit time of an air contaminant entering a capture system and delivered to a control device, divided by the weight per unit time of the air contaminant generated by the source, expressed as a percentage. Therefore, if the emission unit is not exhausted to a control device, the capture system and capture efficiency is not applicable (NA). If the emission unit is using an emission factor with an overall emission reduction efficiency included in the factor, “AP‐42” has been assigned to the capture efficiency.
**The term “control system” for the purpose of this application means any control device or technique which is designed and operated to reduce the quantity of air contaminants emitted to the atmosphere. The term “control efficiency” means the percentage by which a control device or technique reduces the emissions from a stationary source. If the emission unit is controlled by a control device, the capture and control efficiencies are identified. If the emission unit is using an emission factor with an overall emission reduction efficiency included in the factor, “AP‐42” has been assigned to the control efficiency.
C. Emission Factor Source by Reference ID:
30503813 AP‐42, Table 11.19.2‐4 Crushed Stone Processing and Pulverized Mineral Processing, SCC 30503813, Product Storage with Fabric Filter Control
D. Example Calculation for Item 162:
300 tons
hour
0.0099 lb
ton * ((1 ‐ 100 % capture/100) + (1 ‐ 0 % control/100))
ton
2000 lb=
year
13.01 ton PM
year
8760 Hours
Application Revision 5/14/2012, Page 55 of 131

EMISSIONS CALCULATIONS
VI. Storage Silos: Total PM‐10 Emissions (TPY): 9.81
A. PM‐10 Emissions by Equipment Unit ID (EID):
(1)Item
(3)Emission Unit Desription
(4)Max Short Term Throughput
(5)Max Annual Throughput
(6)Emission Factor
(7)* Capture
Efficiency(10)TPM
(11)TPY
(2)EID
(8)**Control
Efficiency(9)
Control Description(12)
Emission Factor Reference ID
Drive through Oversize Tank
146000.0 tons/month 1752000 tons/year 0.0016 lb/ton 100 0.1168 1.40WTK01108 0 Covered & controlled by bin vent dust collector (See Figure 11)
30503813
Storage Tank 219000.0 tons/month 2628000 tons/year 0.0016 lb/ton 100 0.1752 2.10STK01137 0 Covered & controlled by bin vent dust collector (See Figure 11)
30503813
Storage Tank 219000.0 tons/month 2628000 tons/year 0.0016 lb/ton 100 0.1752 2.10STK02147 0 Covered & controlled by bin vent dust collector (See Figure 11)
30503813
Storage Tank 219000.0 tons/month 2628000 tons/year 0.0016 lb/ton 100 0.1752 2.10STK03154 0 Covered & controlled by bin vent dust collector (See Figure 11)
30503813
Storage Tank 219000.0 tons/month 2628000 tons/year 0.0016 lb/ton 100 0.1752 2.10STK04162 0 Covered & controlled by bin vent dust collector (See Figure 11)
30503813
B. Proposed Permit Limits for PM‐10 from Storage Silos:
219000.0 tons/month 2628000 tons/year 9.810.8176
E. Notes:
As defined in I.A. (7), (8) and (9) for sources with capture and/or control efficiencies for pollution control equipment.
*The term “capture system” for the purpose of this application means the equipment (including hoods, ducts, etc.) used to contain, capture, or transport an air contaminant to a control device. In addition, the term “capture efficiency” means the weight per unit time of an air contaminant entering a capture system and delivered to a control device, divided by the weight per unit time of the air contaminant generated by the source, expressed as a percentage. Therefore, if the emission unit is not exhausted to a control device, the capture system and capture efficiency is not applicable (NA). If the emission unit is using an emission factor with an overall emission reduction efficiency included in the factor, “AP‐42” has been assigned to the capture efficiency.
**The term “control system” for the purpose of this application means any control device or technique which is designed and operated to reduce the quantity of air contaminants emitted to the atmosphere. The term “control efficiency” means the percentage by which a control device or technique reduces the emissions from a stationary source. If the emission unit is controlled by a control device, the capture and control efficiencies are identified. If the emission unit is using an emission factor with an overall emission reduction efficiency included in the factor, “AP‐42” has been assigned to the control efficiency.
C. Emission Factor Source by Reference ID:
30503813 AP‐42, Table 11.19.2‐4 Crushed Stone Processing and Pulverized Mineral Processing, SCC 30503813, Product Storage with Fabric Filter Control
D. Example Calculation for Item 162:
300 tons
hour
0.0016 lb
ton * ((1 ‐ 100 % capture/100) + (1 ‐ 0 % control/100))
ton
2000 lb=
year
2.1 ton PM‐10
year
8760 Hours
Application Revision 5/14/2012, Page 56 of 131

EMISSIONS CALCULATIONS
VI. Storage Silos: Total PM2.5 Emissions (TPY): 3.68
A. PM2.5 Emissions by Equipment Unit ID (EID):
(1)Item
(3)Emission Unit Desription
(4)Max Short Term Throughput
(5)Max Annual Throughput
(6)Emission Factor
(7)* Capture
Efficiency(10)TPM
(11)TPY
(2)EID
(8)**Control
Efficiency(9)
Control Description(12)
Emission Factor Reference ID
Drive through Oversize Tank
146000.0 tons/month 1752000 tons/year 0.0006 lb/ton 100 0.0438 0.53WTK01108 0 Covered & controlled by bin vent dust collector (See Figure 11)
30503813
Storage Tank 219000.0 tons/month 2628000 tons/year 0.0006 lb/ton 100 0.0657 0.79STK01137 0 Covered & controlled by bin vent dust collector (See Figure 11)
30503813
Storage Tank 219000.0 tons/month 2628000 tons/year 0.0006 lb/ton 100 0.0657 0.79STK02147 0 Covered & controlled by bin vent dust collector (See Figure 11)
30503813
Storage Tank 219000.0 tons/month 2628000 tons/year 0.0006 lb/ton 100 0.0657 0.79STK03154 0 Covered & controlled by bin vent dust collector (See Figure 11)
30503813
Storage Tank 219000.0 tons/month 2628000 tons/year 0.0006 lb/ton 100 0.0657 0.79STK04162 0 Covered & controlled by bin vent dust collector (See Figure 11)
30503813
B. Proposed Permit Limits for PM2.5 from Storage Silos:
219000.0 tons/month 2628000 tons/year 3.680.3066
E. Notes:
As defined in I.A. (7), (8) and (9) for sources with capture and/or control efficiencies for pollution control equipment.
*The term “capture system” for the purpose of this application means the equipment (including hoods, ducts, etc.) used to contain, capture, or transport an air contaminant to a control device. In addition, the term “capture efficiency” means the weight per unit time of an air contaminant entering a capture system and delivered to a control device, divided by the weight per unit time of the air contaminant generated by the source, expressed as a percentage. Therefore, if the emission unit is not exhausted to a control device, the capture system and capture efficiency is not applicable (NA). If the emission unit is using an emission factor with an overall emission reduction efficiency included in the factor, “AP‐42” has been assigned to the capture efficiency.
**The term “control system” for the purpose of this application means any control device or technique which is designed and operated to reduce the quantity of air contaminants emitted to the atmosphere. The term “control efficiency” means the percentage by which a control device or technique reduces the emissions from a stationary source. If the emission unit is controlled by a control device, the capture and control efficiencies are identified. If the emission unit is using an emission factor with an overall emission reduction efficiency included in the factor, “AP‐42” has been assigned to the control efficiency.
C. Emission Factor Source by Reference ID:
30503813 AP‐42, Table 11.19.2‐4 Crushed Stone Processing and Pulverized Mineral Processing, SCC 30503813, Product Storage with Fabric Filter Control
D. Example Calculation for Item 162:
300 tons
hour
0.0006 lb
ton * ((1 ‐ 100 % capture/100) + (1 ‐ 0 % control/100))
ton
2000 lb=
year
0.79 ton PM2.5
year
8760 Hours
Application Revision 5/14/2012, Page 57 of 131

VI. Truck Loadout A. Emission Factor Calculation for Emissions from Batch Dropping of Finished Material
Equation Reference: AP-42 - Section 13.2.4 Aggregate Handling & Storage Piles; Batch/Continuous Drop Equation (1)
1.3
1.4
5*(0.0032)* (lb / ton)
2
U
E kM
Where: k = 0.11/0.35/0.74 (particle size multiplier (dimensionless), PM2.5/PM-10/PM respectively) U = 10.7 mph, Average Annual Wind Speed - AP-42, Table 7.1-9, Peoria M = 1%, material moisture content (%)
1.3
1.4
10.70.0025 lb PM2.55
0.11*(0.0032)* (lb PM2.5 / ton)ton1
2
1.3
1.4
10.70.00795lb PM105
0.35*(0.0032) * (lb PM10 / ton)ton1
2
1.3
1.4
10.70.017lb PM5
0.74*(0.0032) * (lb PM / ton)ton1
2
Application Revision 5/14/2012, Page 58 of 131

EMISSIONS CALCULATIONS
VII. Truck Loadout: Total PM Emissions (TPY): 0.98
A. PM Emissions by Equipment Unit ID (EID):
(1)Item
(3)Emission Unit Desription
(4)Max Short Term Throughput
(5)Max Annual Throughput
(6)Emission Factor
(7)* Capture
Efficiency(10)TPM
(11)TPY
(2)EID
(8)**Control
Efficiency(9)
Control Description(12)
Emission Factor Reference ID
Loading Spout 219000.0 tons/month 2628000 tons/year 0.017 lb/ton 99 0.0205 0.25BLS01141 99.9 Covered/controlled & vented into storage silo (See Figure 12)
LOADOUT
Loading Spout 219000.0 tons/month 2628000 tons/year 0.017 lb/ton 99 0.0205 0.25BLS02151 99.9 Covered/controlled & vented into storage silo (See Figure 12)
LOADOUT
Loading Spout 219000.0 tons/month 2628000 tons/year 0.017 lb/ton 99 0.0205 0.25BLS03158 99.9 Covered/controlled & vented into storage silo (See Figure 12)
LOADOUT
Loading Spout 219000.0 tons/month 2628000 tons/year 0.017 lb/ton 99 0.0205 0.25BLS04166 99.9 Covered/controlled & vented into storage silo (See Figure 12)
LOADOUT
B. Proposed Permit Limits for PM from Truck Loadout:
219000.0 tons/month 2628000 tons/year 0.980.0818
E. Notes:
As defined in I.A. (7), (8) and (9) for sources with capture and/or control efficiencies for pollution control equipment.
*The term “capture system” for the purpose of this application means the equipment (including hoods, ducts, etc.) used to contain, capture, or transport an air contaminant to a control device. In addition, the term “capture efficiency” means the weight per unit time of an air contaminant entering a capture system and delivered to a control device, divided by the weight per unit time of the air contaminant generated by the source, expressed as a percentage. Therefore, if the emission unit is not exhausted to a control device, the capture system and capture efficiency is not applicable (NA). If the emission unit is using an emission factor with an overall emission reduction efficiency included in the factor, “AP‐42” has been assigned to the capture efficiency.
**The term “control system” for the purpose of this application means any control device or technique which is designed and operated to reduce the quantity of air contaminants emitted to the atmosphere. The term “control efficiency” means the percentage by which a control device or technique reduces the emissions from a stationary source. If the emission unit is controlled by a control device, the capture and control efficiencies are identified. If the emission unit is using an emission factor with an overall emission reduction efficiency included in the factor, “AP‐42” has been assigned to the control efficiency.
C. Emission Factor Source by Reference ID:
LOADOUT AP‐42 ‐ Section 13.2.4 Aggregate Handling & Storage Piles; Batch/Continuous Drop Equation (1)
D. Example Calculation for Item 166:
300 tons
hour
0.017 lb
ton * ((1 ‐ 99 % capture/100) + (1 ‐ 99.9 % control/100))
ton
2000 lb=
year
0.25 ton PM
year
8760 Hours
Application Revision 5/14/2012, Page 59 of 131

EMISSIONS CALCULATIONS
VII. Truck Loadout: Total PM‐10 Emissions (TPY): 0.46
A. PM‐10 Emissions by Equipment Unit ID (EID):
(1)Item
(3)Emission Unit Desription
(4)Max Short Term Throughput
(5)Max Annual Throughput
(6)Emission Factor
(7)* Capture
Efficiency(10)TPM
(11)TPY
(2)EID
(8)**Control
Efficiency(9)
Control Description(12)
Emission Factor Reference ID
Loading Spout 219000.0 tons/month 2628000 tons/year 0.008 lb/ton 99 0.0096 0.12BLS01141 99.9 Covered/controlled & vented into storage silo (See Figure 12)
LOADOUT
Loading Spout 219000.0 tons/month 2628000 tons/year 0.008 lb/ton 99 0.0096 0.12BLS02151 99.9 Covered/controlled & vented into storage silo (See Figure 12)
LOADOUT
Loading Spout 219000.0 tons/month 2628000 tons/year 0.008 lb/ton 99 0.0096 0.12BLS03158 99.9 Covered/controlled & vented into storage silo (See Figure 12)
LOADOUT
Loading Spout 219000.0 tons/month 2628000 tons/year 0.008 lb/ton 99 0.0096 0.12BLS04166 99.9 Covered/controlled & vented into storage silo (See Figure 12)
LOADOUT
B. Proposed Permit Limits for PM‐10 from Truck Loadout:
219000.0 tons/month 2628000 tons/year 0.460.0385
E. Notes:
As defined in I.A. (7), (8) and (9) for sources with capture and/or control efficiencies for pollution control equipment.
*The term “capture system” for the purpose of this application means the equipment (including hoods, ducts, etc.) used to contain, capture, or transport an air contaminant to a control device. In addition, the term “capture efficiency” means the weight per unit time of an air contaminant entering a capture system and delivered to a control device, divided by the weight per unit time of the air contaminant generated by the source, expressed as a percentage. Therefore, if the emission unit is not exhausted to a control device, the capture system and capture efficiency is not applicable (NA). If the emission unit is using an emission factor with an overall emission reduction efficiency included in the factor, “AP‐42” has been assigned to the capture efficiency.
**The term “control system” for the purpose of this application means any control device or technique which is designed and operated to reduce the quantity of air contaminants emitted to the atmosphere. The term “control efficiency” means the percentage by which a control device or technique reduces the emissions from a stationary source. If the emission unit is controlled by a control device, the capture and control efficiencies are identified. If the emission unit is using an emission factor with an overall emission reduction efficiency included in the factor, “AP‐42” has been assigned to the control efficiency.
C. Emission Factor Source by Reference ID:
LOADOUT AP‐42 ‐ Section 13.2.4 Aggregate Handling & Storage Piles; Batch/Continuous Drop Equation (1)
D. Example Calculation for Item 166:
300 tons
hour
0.008 lb
ton * ((1 ‐ 99 % capture/100) + (1 ‐ 99.9 % control/100))
ton
2000 lb=
year
0.12 ton PM‐10
year
8760 Hours
Application Revision 5/14/2012, Page 60 of 131

EMISSIONS CALCULATIONS
VII. Truck Loadout: Total PM2.5 Emissions (TPY): 0.14
A. PM2.5 Emissions by Equipment Unit ID (EID):
(1)Item
(3)Emission Unit Desription
(4)Max Short Term Throughput
(5)Max Annual Throughput
(6)Emission Factor
(7)* Capture
Efficiency(10)TPM
(11)TPY
(2)EID
(8)**Control
Efficiency(9)
Control Description(12)
Emission Factor Reference ID
Loading Spout 219000.0 tons/month 2628000 tons/year 0.0025 lb/ton 99 0.0030 0.04BLS01141 99.9 Covered/controlled & vented into storage silo (See Figure 12)
LOADOUT
Loading Spout 219000.0 tons/month 2628000 tons/year 0.0025 lb/ton 99 0.0030 0.04BLS02151 99.9 Covered/controlled & vented into storage silo (See Figure 12)
LOADOUT
Loading Spout 219000.0 tons/month 2628000 tons/year 0.0025 lb/ton 99 0.0030 0.04BLS03158 99.9 Covered/controlled & vented into storage silo (See Figure 12)
LOADOUT
Loading Spout 219000.0 tons/month 2628000 tons/year 0.0025 lb/ton 99 0.0030 0.04BLS04166 99.9 Covered/controlled & vented into storage silo (See Figure 12)
LOADOUT
B. Proposed Permit Limits for PM2.5 from Truck Loadout:
219000.0 tons/month 2628000 tons/year 0.140.0120
E. Notes:
As defined in I.A. (7), (8) and (9) for sources with capture and/or control efficiencies for pollution control equipment.
*The term “capture system” for the purpose of this application means the equipment (including hoods, ducts, etc.) used to contain, capture, or transport an air contaminant to a control device. In addition, the term “capture efficiency” means the weight per unit time of an air contaminant entering a capture system and delivered to a control device, divided by the weight per unit time of the air contaminant generated by the source, expressed as a percentage. Therefore, if the emission unit is not exhausted to a control device, the capture system and capture efficiency is not applicable (NA). If the emission unit is using an emission factor with an overall emission reduction efficiency included in the factor, “AP‐42” has been assigned to the capture efficiency.
**The term “control system” for the purpose of this application means any control device or technique which is designed and operated to reduce the quantity of air contaminants emitted to the atmosphere. The term “control efficiency” means the percentage by which a control device or technique reduces the emissions from a stationary source. If the emission unit is controlled by a control device, the capture and control efficiencies are identified. If the emission unit is using an emission factor with an overall emission reduction efficiency included in the factor, “AP‐42” has been assigned to the control efficiency.
C. Emission Factor Source by Reference ID:
LOADOUT AP‐42 ‐ Section 13.2.4 Aggregate Handling & Storage Piles; Batch/Continuous Drop Equation (1)
D. Example Calculation for Item 166:
300 tons
hour
0.0025 lb
ton * ((1 ‐ 99 % capture/100) + (1 ‐ 99.9 % control/100))
ton
2000 lb=
year
0.04 ton PM2.5
year
8760 Hours
Application Revision 5/14/2012, Page 61 of 131

ILLINOIS ENVIRONMENTAL PROTECTION AGENCY DIVISION OF AIR POLLUTION CONTROL -- PERMIT SECTION
P.O. BOX 19506 SPRINGFIELD, ILLINOIS 62794-9506
THIS AGENCY IS AUTHORIZED TO REQUIRE AND YOU MUST DISCLOSE THIS INFORMATION UNDER 415 ILCS 5/39. FAILURE TO DO SO COULD RESULT IN THE APPLICATION BEING DENIED AND PENALTIES UNDER 415 ILCS 5 ET SEQ. IT IS NOT NECESSARY TO USE THIS FORM IN PROVIDING THIS INFORMATION. THIS FORM HAS BEEN APPROVED BY THE FORMS MANAGEMENT CENTER.
APPLICATION PAGE _______ Printed on Recycled Paper
197-FEE Page 1 of 2
FOR AGENCY USE ONLY ID NUMBER:
PERMIT #:
COMPLETE INCOMPLETE
DATE COMPLETE:
FEE DETERMINATION FOR CONSTRUCTION PERMIT
APPLICATION CHECK #: ACCOUNT NAME:
THIS FORM IS TO BE USED BY ALL SOURCES TO SUPPLY FEE INFORMATION THAT MUST ACCOMPANY ALL CONSTRUCTION PERMIT APPLICATIONS. THIS APPLICATION MUST INCLUDE PAYMENT IN FULL TO BE DEEMED COMPLETE. MAKE CHECK OR MONEY ORDER PAYABLE TO THE ILLINOIS ENVIRONMENTAL PROTECTION AGENCY. SEND TO THE ADDRESS ABOVE. DO NOT SEND CASH. REFER TO INSTRUCTIONS (197-INST) FOR ASSISTANCE.
SOURCE INFORMATION 1) SOURCE NAME:
2) PROJECT NAME: 3) SOURCE ID NO. (IF APPLICABLE):
4) CONTACT NAME: 5) CONTACT PHONE NUMBER:
FEE DETERMINATION 6) FILL IN THE FOLLOWING THREE BOXES AS DETERMINED IN SECTIONS 1 THROUGH 4 BELOW:
$ + $ = $
SECTION 1 SUBTOTAL SECTION 2, 3 OR 4 SUBTOTAL GRAND TOTAL
SECTION 1: STATUS OF SOURCE / PURPOSE OF SUBMITTAL 7) YOUR APPLICATION WILL FALL UNDER ONLY ONE OF THE FOLLOWING SIX CATEGORIES DESCRIBED BELOW.
CHECK THE BOX THAT APPLIES, ENTER THE CORRESPONDING FEE IN THE BOX TO THE RIGHT AND COPY THIS FEE INTO THE SECTION 1 SUBTOTAL BOX ABOVE. PROCEED TO APPLICABLE SECTIONS.
FOR PURPOSES OF THIS FORM: • MAJOR SOURCE IS A SOURCE THAT IS REQUIRED TO OBTAIN A CAAPP PERMIT. • SYNTHETIC MINOR SOURCE IS A SOURCE THAT HAS TAKEN LIMITS ON POTENTIAL TO EMIT IN A
PERMIT TO AVOID CAAPP PERMIT REQUIREMENTS (E.G., FESOP). • NON-MAJOR SOURCE IS A SOURCE THAT IS NOT A MAJOR OR SYNTHETIC MINOR SOURCE.
EXISTING SOURCE WITHOUT STATUS CHANGE OR WITH STATUS CHANGE FROM SYNTHETIC MINOR TO MAJOR SOURCE OR VICE VERSA. ENTER $0 AND PROCEED TO SECTION 2.
EXISTING NON-MAJOR SOURCE THAT WILL BECOME SYNTHETIC MINOR OR MAJOR SOURCE. ENTER $5,000 AND PROCEED TO SECTION 4.
EXISTING MAJOR OR SYNTHETIC MINOR SOURCE THAT WILL BECOME NON-MAJOR SOURCE. ENTER $4,000 AND PROCEED TO SECTION 3.
NEW MAJOR OR SYNTHETIC MINOR SOURCE. ENTER $5,000 AND PROCEED TO SECTION 4.
NEW NON-MAJOR SOURCE. ENTER $500 AND PROCEED TO SECTION 3.
AGENCY ERROR. IF THIS IS A TIMELY REQUEST TO CORRECT AN ISSUED PERMIT THAT INVOLVES ONLY AN AGENCY ERROR AND IF THE REQUEST IS RECEIVED WITHIN THE DEADLINE FOR A PERMIT APPEAL TO THE POLLUTION CONTROL BOARD, THEN ENTER $0. SKIP SECTIONS 2, 3 AND 4. PROCEED DIRECTLY TO SECTION 5.
$____________ SECTION 1 SUBTOTAL
SECTION 2: SPECIAL CASE FILING FEE 8) FILING FEE. IF THE APPLICATION ONLY ADDRESSES ONE OR MORE OF THE FOLLOWING, CHECK THE
APPROPRIATE BOXES, ENTER $500 IN THE SECOND BOX UNDER FEE DETERMINATION ABOVE, SKIP SECTIONS 3 AND 4 AND PROCEED DIRECTLY TO SECTION 5. OTHERWISE, PROCEED TO SECTION 3 OR 4, AS APPROPRIATE.
ADDITION OR REPLACEMENT OF CONTROL DEVICES ON PERMITTED UNITS PILOT PROJECTS/TRIAL BURNS BY A PERMITTED UNIT APPLICATIONS ONLY INVOLVING INSIGNIFICANT ACTIVITIES UNDER 35 IAC 201.210 (MAJOR SOURCES ONLY) LAND REMEDIATION PROJECTS REVISIONS RELATED TO METHODOLOGY OR TIMING FOR EMISSION TESTING MINOR ADMINISTRATIVE-TYPE CHANGE TO A PERMIT
Ottawa Frac Sand Processing Plant
Mississippi Sand Project 099831AAF
Mr. Gordie Stevens (630) 795-7322
5000 20,000 25,000
5000
Application Revision 5/14/2012, Page 62 of 131

Application Revision 5/16/2012, Page 63 of 131

Illinois Environmental Protection Agency Division Of Air Pollution Control -- Permit Section
P.O. Box 19506 Springfield, Illinois 62794-9506
This Agency is authorized to require and you must disclose this information under 415 ILCS 5/39. Failure to do so could result in the application being denied and penalties under 415 ILCS 5 et seq. It is not necessary to use this form in providing this information. This form has been approved by the forms management center.IL 532-2865 APC628 9/07 Printed on Recycled Paper Page 1 of 4
For Illinois EPA use onlyBOA ID No.:
Application No.: Construction Permit Application
For a FESOP Source (FORM APC628)
Date Received:
This form is to be used to supply information to obtain a construction permit for a proposed project involving a Federally EnforceableState Operating Permit (FESOP) or Synthetic Minor source, including construction of a new FESOP source. Other necessary information must accompany this form as discussed in the “General Instructions For Permit Applications,” Form APC-201.
Proposed Project 1. Working Name of Proposed Project:
2. Is the project occurring at a source that already has a permit from the Bureau of Air (BOA)? No Yes If Yes, provide BOA ID Number: __ __ __ __ __ __ __ __ __
3. Does this application request a revision to an existing construction permit issued by the BOA? No Yes If Yes, provide Permit Number: __ __ __ __ __ __ __ __
4. Does this application request that the new/modified emission units be incorporated into an existing FESOP issued by the BOA?
No Yes If Yes, provide Permit Number: __ __ __ __ __ __ __ __
Source Information 5. Source name:*
6. Source street address:*
7. City: 8. County: 9. Zip code:
ONLY COMPLETE THE FOLLOWING FOR A SOURCE WITHOUT AN ID NUMBER.10. Is the source located within city limits? Yes No
If no, provide Township Name: 11. Description of source and product(s) produced: 12. Primary Classification Code of source:
SIC: __ __ __ __ or NAICS: __ __ __ __ __ __
13. Latitude (DD:MM:SS.SSSS): 14. Longitude (DD:MM:SS.SSSS):
* If this information different than previous information, then complete a new Form 200-CAAPP to change the source name in initialFESOP application for the source or Form APC-620 for Air Permit Name and/or Ownership Change if the FESOP has been previously issued.
Applicant Information 15. Who is the applicant?
Owner Operator16. All correspondence to: (check one)
Owner Operator Source 17. Applicant’s FEIN: 18. Attention name and/or title for written correspondence:
Frac Sand Processing Plant
Mississippi Sand, LLC - Ottawa Plant
1222 E Illinois Rte. 71
Ottawa LaSalle 61350
South Ottawa Township
Industrial Sand Processing Plant
41:18:40.824
1446
88:55:38.391
26-1506512 Mr. Tony Giordano, President - Mississippi Sand, LLC
Application Revision 5/14/2012, Page 64 of 131

Owner Information* 19. Name:
20. Address:
21. City: 22. State: 23. Zip code:
* If this information different than previous information, then complete Form 272-CAAPP for a Request for Ownership Change for CAAPP Permit for an initial FESOP application for the source or Form APC-620 for Air Permit Name and/or Ownership Change if the FESOP has been previously issued.
Operator Information (If Different from Owner)* 24. Name
25. Address:
26. City: 27. State: 28. Zip code:
* If this information different than previous information, then complete a new Form 200-CAAPP to change the source name in initialFESOP application for the source or Form APC-620 for Air Permit Name and/or Ownership Change if the FESOP has been previously issued.
Technical Contacts for Application 29. Preferred technical contact: (check one) Applicant’s contact Consultant
30. Applicant’s technical contact person for application:
31. Contact person's telephone number 32. Contact person's email address:
33. Applicant’s consultant for application:
34. Consultant's telephone number: 35. Consultant's email address:
Review Of Contents of the Application 36. Is the emission unit covered by this application already
constructed? If “yes”, provide the date construction was completed:
Note: The Illinois EPA is unable to issue a construction permit for a emission unit that has already been constructed.
Yes No
37. Does the application include a narrative description of the proposed project? Yes No
38. Does the application contain a list or summary that clearly identifies the emission units and air pollution control equipment that are part of the project?
Yes No
39. Does the application include process flow diagram(s) for the project showing new and modified emission units and control equipment and related existing equipment and their relationships?
Yes No
40. If the project is at a source that has not previously received a permit from the BOA, does the application include a source description, plot plan and site map?
Yes No
IL 532-2865 APC628 9/07 Printed on Recycled Paper Page 2 of 4
Mississippi Sand, LLC
12209 Big Bend Rd.
Saint Louis MO 63122-6837
Mississippi Sand, LLC
12209 Big Bend Rd.
Saint Louis Missouri 63122-6837
Mr. Gordie Stevens
630-795-7322 [email protected]
Application Revision 5/14/2012, Page 65 of 131

Review Of Contents of the Application (continued) 41. Does the application include relevant information for the proposed
project as requested on Illinois EPA, BOA application forms (or otherwise contain all the relevant information)?
Yes No
42. Does the application identify and address all applicable or potentially applicable emissions standards, including: a. State emission standards (35 IAC Chapter I, Subtitle B); b. Federal New Source Performance Standards (40 CFR Part 60); c. Federal standards for HAPs (40 CFR Parts 61 and 63)?
Yes No
43. Does the application address whether the proposed project or the source could be a major project for Prevention of Significant Deterioration (PSD), 40 CFR 52.21?
Yes No . N/A
44. Does the application address for which pollutant(s) the proposed project or the source could be a major project for PSD, 40 CFR 52.21?
Yes No . N/A
45. Does the application address whether the proposed project or the source could be a major project for “Nonattainment New Source Review,” (NA NSR), 35 IAC Part 203?
Yes No N/A
46. Does the application address for which pollutant(s) the proposed project or the source could be a major project for NA NSR, 35 IAC Part 203?
Yes No N/A
47. Does the application address whether the proposed project or the source could potentially be subject to federal Maximum Achievable Control Technology (MACT) standard under 40 CFR Part 63 for Hazardous Air Pollutants (HAP) and identify the standard that could be applicable?
Yes No N/A* * Source not major Project not major
48. Does the application identify the HAP(s) from the proposed project or the source that would trigger the applicability of a MACT standard under 40 CFR Part 63?
Yes No N/A
49. Does the application include a summary of the current and the future potential emissions of the source after the proposed project has been completed for each criteria air pollutant and/or HAP (tons/year)?
Yes No N/A* * Applicability of PSD, NA NSR or 40 CFR 63 not applicable to the source’s emissions.
50. Does the application include a summary of the requested permitted annual emissions of the proposed project for the new and modified emission units (tons/year)?
Yes No N/A* * Project does not involve an increase in emissions from new or modified emission units.
51. Does the application include a summary of the requested permitted production, throughput, fuel, or raw material usage limits that correspond to the annual emissions limits of the proposed project for the new and modified emission units?
Yes No N/A* * Project does not involve an increase in emissions from new or modified emission units.
52. Does the application include sample calculations or methodology for the emission estimations and the requested emission limits? Yes No
53. Does the application address the relationships with and implications of the proposed project for the source's FESOP? Yes No N/A*
*FESOP not yet issued. 54. If the application contains information that is considered a TRADE
SECRET, has such information been properly marked and claimed and other requirements to perfect such a claim been satisfied in accordance with 35 IAC Part 130?
Note: “Claimed information will not be legally protected from disclosure to the public if it is not properly claimed or does not qualify as trade secret information.
Yes No N/A* * No information in the application is claimed to be a TRADE SECRET
IL 532-2865 APC628 9/07 Printed on Recycled Paper Page 3 of 4
Application Revision 5/14/2012, Page 66 of 131

Application Revision 5/16/2012, Page 67 of 131

STATE OF ILLINOIS
ENVIRONMENTAL PROTECTION AGENCY
DIVISION OF AIR POLLUTION CONTROL
1021 NORTH GRAND AVENUE, EAST
SPRINGFIELD, ILLINOIS 62702
IL 532-0250
APC 220 Rev. 1/27/77 090-008
* DATA AND INFORMATION
PROCESS EMISSION SOURCE
* THIS INFORMATION FORM IS TO BE COMPLETED FOR AN EMISSION SOURCE OTHER THAN A FUEL COMBUSTION EMISSION SOURCE OR AN
INCINERATOR. A FUEL COMBUSTION EMISSION SOURCE IS A FURNACE, BOILER, OR SIMILAR EQUIPMENT USED PRIMARILY FOR
PRODUCING HEAT OR POWER BY INDIRECT HEAT TRANSFER. AN INCINERATOR IS AN APPARATUS IN WHICH REFUSE IS BURNED.
1. NAME OF PLANT OWNER:
2. NAME OF CORPORATE DIVISION OR PLANT (IF DIFFERENT FROM
OWNER):
3. STREET ADDRESS OF EMISSION SOURCE:
4. CITY OF EMISSION SOURCE:
GENERAL INFORMATION
5. NAME OF PROCESS:
6. NAME OF EMISSION SOURCE EQUIPMENT:
7. EMISSION SOURCE EQUIPMENT MANUFACTURER:
8. MODEL NUMBER:
9. SERIAL NUMBER:
10. FLOW DIAGRAM DESIGNATION(S) OF EMISSION SOURCE:
11. IDENTITY(S) OF ANY SIMILAR SOURCE(S) AT THE PLANT OR PREMISES NOT COVERED BY THE FORM (IF THE SOURCE IS COVERED BY
ANOTHER APPLICATION, IDENTIFY THE APPLICATION):
12. AVERAGE OPERATING TIME OF EMISSION SOURCE:
_________ HRS/DAY _________ DAYS/WK _________ WKS/YR
13. MAXIMUM OPERATING TIME OF EMISSION SOURCE:
_________ HRS/DAY _________ DAYS/WK _________ WKS/YR
14. PERCENT OF ANNUAL THROUGHPUT:
DEC-FEB ____________ % MAR-MAY ____________ % JUN-AUG ____________ % SEPT-NOV ____________ %
INSTRUCTIONS
1. COMPLETE THE ABOVE IDENTIFICATION AND GENERAL INFORMATION SECTION.
2. COMPLETE THE RAW MATERIAL, PRODUCT, WASTE MATERIAL, AND FUEL USAGE SECTIONS FOR THE PARTICULAR SOURCE EQUIPMENT.
COMPOSITIONS OF MATERIALS MUST BE SUFFICIENTLY DETAILED TO ALLOW DETERMINATION OF THE NATURE AND QUANTITY OF
POTENTIAL EMISSIONS. IN PARTICULAR, THE COMPOSITION OF PAINTS, INKS, ETC., AND ANY SOLVENTS MUST BE FULLY DETAILED.
3. EMISSION AND EXHAUST POINT INFORMATION MUST BE COMPLETED, UNLESS EMISSIONS ARE EXHAUSTED THROUGH AIR POLLUTION
CONTROL EQUIPMENT.
4. OPERATION TIME AND CERTAIN OTHER ITEMS REQUIRE BOTH AVERAGE AND MAXIMUM VALUES
5. FOR GENERAL INFORMATION REFER TO “GENERAL INSTRUCTIONS FOR PERMIT APPLICATIONS,” APC-201.
DEFINITIONS
AVERAGE - THE VALUE THAT SUMMARIZES OR REPRESENTS THE GENERAL CONDITION OF THE EMISSION SOURCE, OR THE GENERAL STATE
OF PRODUCTION OF THE EMISSION SOURCE. SPECIFICALLY:
AVERAGE OPERATING TIME - ACTUAL TOTAL HOURS OF OPERATION FOR THE PRECEDING TWELVE MONTH PERIOD.
AVERAGE RATE - ACTUAL TOTAL QUANTITY OF “MATERIAL” FOR THE PRECEDING TWELVE MONTH PERIOD, DIVIDED BY THE AVERAGE
OPERATING TIME.
AVERAGE OPERATION - OPERATION TYPICAL OF THE PRECEDING TWELVE MONTH PERIOD, AS REPRESENTED BY AVERAGE OPERATING
TIME AND AVERAGE RATES.
MAXIMUM - THE GREATEST VALUE ATTAINABLE OR ATTAINED FOR THE EMISSION SOURCE, OR THE PERIOD OF GREATEST OR UTMOST
PRODUCTION OF THE EMISSION SOURCE. SPECIFICALLY:
MAXIMUM OPERATING TIME - GREATEST EXPECTED TOTAL HOURS OF OPERATIONS FOR ANY TWELVE MONTH PERIOD.
MAXIMUM RATE - GREATEST QUANTITY OF “MATERIAL” EXPECTED PER ANY ONE HOUR OF OPERATION.
MAXIMUM OPERATION - GREATEST EXPECTED OPERATION, AS REPRESENTED BY MAXIMUM OPERATING TIME AND MAXIMUM RATES.
This Agency is authorized to require this information under Illinois Revised Statutes, 1979, Chapter 111 1/2, Section 1039. Disclosure of this information is required
under that Section. Failure to do so may prevent this form from being processed and could result in your application being denied. This form has been approved by the
Forms Management Center.
Mississippi Sand, LLC. Same as Owner
2320 Creve Coeur Mill Rd LaSalle County, Ottawa Township
See Attachment 1 to APC 220 --
-- -- --
--
--
-- -- -- -- -- --
-- -- -- --
Application Revision 5/14/2012, Page 68 of 131

APC 220
RAW MATERIAL INFORMATION
NAME OF RAW MATERIAL
AVERAGE RATE
PER IDENTICAL SOURCE
MAXIMUM RATE
PER IDENTICAL SOURCE
20a. b.
LB/HR
c.
LB/HR
21a. b.
LB/HR
c.
LB/HR
22a. b.
LB/HR
c.
LB/HR
23a. b.
LB/HR
c.
LB/HR
24a. b.
LB/HR
c.
LB/HR
PRODUCT INFORMATION
NAME OF PRODUCT
AVERAGE RATE
PER IDENTICAL SOURCE
MAXIMUM RATE
PER IDENTICAL SOURCE
30a. b.
LB/HR
c.
LB/HR
31a. b.
LB/HR
c.
LB/HR
32a. b.
LB/HR
c.
LB/HR
33a. b.
LB/HR
c.
LB/HR
34a. b.
LB/HR
c.
LB/HR
WASTE MATERIAL INFORMATION
NAME OF WASTE MATERIAL
AVERAGE RATE
PER IDENTICAL SOURCE
MAXIMUM RATE
PER IDENTICAL SOURCE
40a. b.
LB/HR
c.
LB/HR
41a. b.
LB/HR
c.
LB/HR
42a. b.
LB/HR
c.
LB/HR
43a. b.
LB/HR
c.
LB/HR
44a. b.
LB/HR
c.
LB/HR
*FUEL USAGE INFORMATION
FUEL USED TYPE HEAT CONTENT
50a. NATURAL GAS b. ----------------------------- c. 1000 BTU/SCF
OTHER GAS BTU/SCF
OIL BTU/GAL
COAL BTU/LB
OTHER BTU/LB
d. AVERAGE FIRING RATE PER IDENTICAL SOURCE:
BTU/HR
e. MAXIMUM FIRING RATE PER IDENTICAL SOURCE:
BTU/HR
*THIS SECTION IS TO BE COMPLETED FOR ANY FUEL USED DIRECTLY IN THE PROCESS EMISSION SOURCE, E. G. GAS IN A DRYER, OR COAL IN
A MELT FURNACE.
See Attachment 2 to APC 220 -- --
See Attachment 3 to APC 220 -- --
NA -- --
NA NA
Application Revision 5/14/2012, Page 69 of 131

Page ______ of ______
APC 220
*EMISSION INFORMATION
51. NUMBER OF IDENTICAL SOURCES (DESCRIBE AS REQUIRED):
AVERAGE OPERATION
CONTAMINANT
CONCENTRATION OR EMISSION RATE PER IDENTICAL
SOURCE
METHOD USED TO DETERMINE CONCENTRATION OR
EMISSION RATE
PARTICULATE
MATTER
52a.
GR/SCF
b.
LB/HR
c.
CARBON
MONOXIDE
53a. PPM
(VOL)
b.
LB/HR
c.
NITROGEN
OXIDES
54a. PPM
(VOL)
b.
LB/HR
c.
ORGANIC
MATERIAL
55a. PPM
(VOL)
b.
LB/HR
c.
SULFUR
DIOXIDE
56a. PPM
(VOL)
b.
LB/HR
c.
**OTHER
(SPECIFY)
57a. PPM
(VOL)
b.
LB/HR
c.
MAXIMUM OPERATION
CONTAMINANT
CONCENTRATION OR EMISSION RATE PER IDENTICAL
SOURCE
METHOD USED TO DETERMINE CONCENTRATION OR
EMISSION RATE
PARTICULATE
MATTER
58a.
GR/SCF
b.
LB/HR
c.
CARBON
MONOXIDE
59a. PPM
(VOL)
b.
LB/HR
c.
NITROGEN
OXIDES
60a. PPM
(VOL)
b.
LB/HR
c.
ORGANIC
MATERIAL
61a. PPM
(VOL)
b.
LB/HR
c.
SULFUR
DIOXIDE
62a. PPM
(VOL)
b.
LB/HR
c.
**OTHER
(SPECIFY)
63a. PPM
(VOL)
b.
LB/HR
c.
*ITEMS 52 THROUGH 63 NEED NOT BE COMPLETED IF EMISSIONS ARE EXHAUSTED THROUGH AIR POLLUTION CONTROL EQUIPMENT.
**“OTHER” CONTAMINANT SHOULD BE USED FOR AN AIR CONTAMINANT NOT SPECIFICALLY NAMED ABOVE. POSSIBLE OTHER
CONTAMINANTS ARE ASBESTOS, BERYLLIUM, MERCURY, VINYL CHLORIDE, LEAD, ETC.
***EXHAUST POINT INFORMATION
64. FLOW DIAGRAM DESIGNATION(S) OF EXHAUST POINT:
65. DESCRIPTION OF EXHAUST POINT (LOCATION IN RELATION TO BUILDINGS, DIRECTION, HOODING, ETC.):
66. EXIT HEIGHT ABOVE GRADE: 67. EXIT DIAMETER:
68. GREATEST HEIGHT OF NEARBY BUILDINGS: 69. EXIT DISTANCE FROM NEAREST PLANT BOUNDARY:
AVERAGE OPERATION MAXIMUM OPERATION
70. EXIT GAS TEMPERATURE:
�F
72. EXIT GAS TEMPERATURE:
�F
71. GAS FLOW RATE THROUGH EACH EXIT:
ACFM
73. GAS FLOW RATE THROUGH EACH EXIT:
ACFM
***THIS SECTION SHOULD NOT BE COMPLETED IF EMISSIONS ARE EXHAUSTED THROUGH AIR POLLUTION CONTROL EQUIPMENT.
See Attachment 4 to APC 220
-- -- --
-- -- --
See Attachment 5 to APC 220
--
-- --
-- --
--
--
--
--
Application Revision 5/14/2012, Page 70 of 131

ATTACHMENTS 1 THROUGH 4 TO APC220
Wet Plant I: Total PM Emissions (TPY): 55.44
A. PM Emissions by Equipment Unit ID (EID):
(1)Item
(3)Emission Unit Desription
(4)Max Short Term Throughput
(5)Max Annual Throughput
(6)Emission Factor
(7)* Capture
Efficiency(10)TPM
(11)TPY
(2)EID
(8)**Control
Efficiency(9)
Control Description(12)
Emission Factor Reference ID
Belt Conveyor 730000.0 tons/month 8760000 tons/year 0.00014 lb/ton AP‐42 0.0511 0.61C1218 AP‐42 >12% moisture (See Figure 1) 30502006 (controlled)
Belt Conveyor 730000.0 tons/month 8760000 tons/year 0.00014 lb/ton AP‐42 0.0511 0.61C1319 AP‐42 >12% moisture (See Figure 1) 30502006 (controlled)
Belt Conveyor 730000.0 tons/month 8760000 tons/year 0.00014 lb/ton AP‐42 0.0511 0.61C014 AP‐42 >12% moisture (See Figure 1) 30502006 (controlled)
Belt Conveyor 438000.0 tons/month 5256000 tons/year 0.00014 lb/ton AP‐42 0.0307 0.37C1523 AP‐42 >12% moisture (See Figure 1) 30502006 (controlled)
Belt Conveyor 365000.0 tons/month 4380000 tons/year 0.00014 lb/ton AP‐42 0.0256 0.31C1625 AP‐42 >12% moisture (See Figure 1) 30502006 (controlled)
Belt Conveyor 365000.0 tons/month 4380000 tons/year 0.00014 lb/ton AP‐42 0.0256 0.31C1828 AP‐42 >12% moisture (See Figure 4) 30502006 (controlled)
Belt Conveyor 365000.0 tons/month 4380000 tons/year 0.00014 lb/ton AP‐42 0.0256 0.31C1950 AP‐42 >12% moisture (See Figure 1) 30502006 (controlled)
Belt Conveyor 584000.0 tons/month 7008000 tons/year 0.00014 lb/ton AP‐42 0.0409 0.49C2152 AP‐42 >12% moisture (See Figure 1) 30502006 (controlled)
Belt Conveyor 584000.0 tons/month 7008000 tons/year 0.00014 lb/ton AP‐42 0.0409 0.49C2254 AP‐42 >12% moisture (See Figure 1) 30502006 (controlled)
Belt Conveyor 584000.0 tons/month 7008000 tons/year 0.00014 lb/ton AP‐42 0.0409 0.49C2557 AP‐42 >12% moisture (See Figure 1) 30502006 (controlled)
Belt Conveyor 730000.0 tons/month 8760000 tons/year 0.00014 lb/ton AP‐42 0.0511 0.61C025 AP‐42 >12% moisture (See Figure 1) 30502006 (controlled)
Belt Conveyor 730000.0 tons/month 8760000 tons/year 0.00014 lb/ton AP‐42 0.0511 0.61C037 AP‐42 >12% moisture (See Figure 1) 30502006 (controlled)
Belt Conveyor 730000.0 tons/month 8760000 tons/year 0.00014 lb/ton AP‐42 0.0511 0.61C048 AP‐42 >12% moisture (See Figure 1) 30502006 (controlled)
Belt Conveyor 730000.0 tons/month 8760000 tons/year 0.00014 lb/ton AP‐42 0.0511 0.61C059 AP‐42 >12% moisture (See Figure 4) 30502006 (controlled)
Belt Conveyor 730000.0 tons/month 8760000 tons/year 0.00014 lb/ton AP‐42 0.0511 0.61C0915 AP‐42 >12% moisture (See Figure 1) 30502006 (controlled)
Belt Conveyor 730000.0 tons/month 8760000 tons/year 0.00014 lb/ton AP‐42 0.0511 0.61C1016 AP‐42 >12% moisture (See Figure 1) 30502006 (controlled)
Belt Conveyor 730000.0 tons/month 8760000 tons/year 0.00014 lb/ton AP‐42 0.0511 0.61C1117 AP‐42 >12% moisture (See Figure 1) 30502006 (controlled)
Belt Conveyor 730000.0 tons/month 8760000 tons/year 0.00014 lb/ton AP‐42 0.0511 0.61C1420 AP‐42 >12% moisture (See Figure 1) 30502006 (controlled)
Belt Conveyor 365000.0 tons/month 4380000 tons/year 0.00052 lb/ton NA 0.0949 1.14C1726 NA >12% moisture (See Figure 4) RadialStacker
Belt Conveyor 365000.0 tons/month 4380000 tons/year 0.00052 lb/ton NA 0.0949 1.14C2051 NA >12% moisture (See Figure 4) RadialStacker
Belt Conveyor 584000.0 tons/month 7008000 tons/year 0.00052 lb/ton NA 0.1518 1.82C2355 NA >12% moisture (See Figure 4) RadialStacker
Belt Conveyor 584000.0 tons/month 7008000 tons/year 0.00052 lb/ton NA 0.1518 1.82C2456 NA >12% moisture (See Figure 4) RadialStacker
Belt Conveyor 584000.0 tons/month 7008000 tons/year 0.00052 lb/ton NA 0.1518 1.82C2658 NA >12% moisture (See Figure 4) RadialStacker
Belt Feeder 438000.0 tons/month 5256000 tons/year 0.00014 lb/ton AP‐42 0.0307 0.37F0322 AP‐42 >12% moisture (See Figure 3) 30502006 (controlled)
Dewatering Cyclone 365000.0 tons/month 4380000 tons/year 0.00052 lb/ton NA 0.0949 1.14CY0131 NA >12% moisture (See Figure 5) Cyclone
Dewatering Cyclone 365000.0 tons/month 4380000 tons/year 0.00052 lb/ton NA 0.0949 1.14CY0232 NA >12% moisture (See Figure 5) Cyclone
Dewatering Cyclone 365000.0 tons/month 4380000 tons/year 0.00052 lb/ton NA 0.0949 1.14CY0339 NA >12% moisture (See Figure 5) Cyclone
Dewatering Cyclone 365000.0 tons/month 4380000 tons/year 0.00052 lb/ton NA 0.0949 1.14CY0440 NA >12% moisture (See Figure 5) Cyclone
Dewatering Screen 365000.0 tons/month 4380000 tons/year 0.0022 lb/ton AP‐42 0.4015 4.82DWS0135 AP‐42 >12% moisture (See Figure 7) 30502002 (controlled)
Dewatering Screen 365000.0 tons/month 4380000 tons/year 0.0022 lb/ton AP‐42 0.4015 4.82DWS0236 AP‐42 >12% moisture (See Figure 7) 30502002 (controlled)
Dewatering Screen 365000.0 tons/month 4380000 tons/year 0.0022 lb/ton AP‐42 0.4015 4.82DWS0341 AP‐42 >12% moisture (See Figure 7) 30502002 (controlled)
Double Deck Screen 438000.0 tons/month 5256000 tons/year 0.0022 lb/ton AP‐42 0.4818 5.78SCR0124 AP‐42 >12% moisture (See Figure 7) 30502002 (controlled)
Feed Hopper 730000.0 tons/month 8760000 tons/year 0.00014 lb/ton AP‐42 0.0511 0.61FH011 AP‐42 >12% moisture (See Figure 3) 30502006 (controlled)
Feed Hopper 438000.0 tons/month 5256000 tons/year 0.00014 lb/ton AP‐42 0.0307 0.37FH0321 AP‐42 >12% moisture (See Figure 3) 30502006 (controlled)
Gate Feeder 292000.0 tons/month 3504000 tons/year 0.00014 lb/ton AP‐42 0.0204 0.25G0160 AP‐42 >5% moisture (See Figure 2) 30502006 (controlled)
Gate Feeder 292000.0 tons/month 3504000 tons/year 0.00014 lb/ton AP‐42 0.0204 0.25G0261 AP‐42 >5% moisture (See Figure 2) 30502006 (controlled)
Gate Feeder 292000.0 tons/month 3504000 tons/year 0.00014 lb/ton AP‐42 0.0204 0.25G0362 AP‐42 >5% moisture (See Figure 2) 30502006 (controlled)
Gate Feeder 292000.0 tons/month 3504000 tons/year 0.00014 lb/ton AP‐42 0.0204 0.25G0463 AP‐42 >5% moisture (See Figure 2) 30502006 (controlled)
Gate Feeder 292000.0 tons/month 3504000 tons/year 0.00014 lb/ton AP‐42 0.0204 0.25G0564 AP‐42 >5% moisture (See Figure 2) 30502006 (controlled)
Application Revision 5/14/2012, Page 71 of 131

ATTACHMENTS 1 THROUGH 4 TO APC220
Wet Plant I: Total PM Emissions (TPY): 55.44
A. PM Emissions by Equipment Unit ID (EID):
(1)Item
(3)Emission Unit Desription
(4)Max Short Term Throughput
(5)Max Annual Throughput
(6)Emission Factor
(7)* Capture
Efficiency(10)TPM
(11)TPY
(2)EID
(8)**Control
Efficiency(9)
Control Description(12)
Emission Factor Reference ID
Gate Feeder 292000.0 tons/month 3504000 tons/year 0.00014 lb/ton AP‐42 0.0204 0.25G0665 AP‐42 >5% moisture (See Figure 2) 30502006 (controlled)
Gate Feeder 292000.0 tons/month 3504000 tons/year 0.00014 lb/ton AP‐42 0.0204 0.25G0766 AP‐42 >5% moisture (See Figure 2) 30502006 (controlled)
Gate Feeder 292000.0 tons/month 3504000 tons/year 0.00014 lb/ton AP‐42 0.0204 0.25G0867 AP‐42 >5% moisture (See Figure 2) 30502006 (controlled)
Gate Feeder 292000.0 tons/month 3504000 tons/year 0.00014 lb/ton AP‐42 0.0204 0.25G0968 AP‐42 >5% moisture (See Figure 2) 30502006 (controlled)
Gate Feeder 292000.0 tons/month 3504000 tons/year 0.00014 lb/ton AP‐42 0.0204 0.25G1069 AP‐42 >5% moisture (See Figure 2) 30502006 (controlled)
Gate Feeder 292000.0 tons/month 3504000 tons/year 0.00014 lb/ton AP‐42 0.0204 0.25G1170 AP‐42 >5% moisture (See Figure 2) 30502006 (controlled)
Gate Feeder 292000.0 tons/month 3504000 tons/year 0.00014 lb/ton AP‐42 0.0204 0.25G1271 AP‐42 >5% moisture (See Figure 2) 30502006 (controlled)
Grizzly Feeder 730000.0 tons/month 8760000 tons/year 0.00014 lb/ton AP‐42 0.0511 0.61F012 AP‐42 >12% moisture (See Figure 2) 30502006 (controlled)
Hydrosizer 365000.0 tons/month 4380000 tons/year 0.00014 lb/ton AP‐42 0.0256 0.31HY0133 AP‐42 >12% moisture (See Figure 6) 30502006 (controlled)
Hydrosizer 365000.0 tons/month 4380000 tons/year 0.00014 lb/ton AP‐42 0.0256 0.31HY0234 AP‐42 >12% moisture (See Figure 6) 30502006 (controlled)
Impact Crusher 730000.0 tons/month 8760000 tons/year 0.0012 lb/ton AP‐42 0.4380 5.26CR013 AP‐42 >12% moisture 30502003 (controlled)
VSI Crusher 365000.0 tons/month 4380000 tons/year 0.0012 lb/ton AP‐42 0.2190 2.63CR0227 AP‐42 >12% moisture 30502003 (controlled)
B. Proposed Permit Limits for PM from Wet Plant I:
730000.0 tons/month 8760000 tons/year 55.444.6202
E. Notes:
As defined in I.A. (7), (8) and (9) for sources with capture and/or control efficiencies for pollution control equipment.
*The term “capture system” for the purpose of this application means the equipment (including hoods, ducts, etc.) used to contain, capture, or transport an air contaminant to a control device. In addition, the term “capture efficiency” means the weight per unit time of an air contaminant entering a capture system and delivered to a control device, divided by the weight per unit time of the air contaminant generated by the source, expressed as a percentage. Therefore, if the emission unit is not exhausted to a control device, the capture system and capture efficiency is not applicable (NA). If the emission unit is using an emission factor with an overall emission reduction efficiency included in the factor, “AP‐42” has been assigned to the capture efficiency.
**The term “control system” for the purpose of this application means any control device or technique which is designed and operated to reduce the quantity of air contaminants emitted to the atmosphere. The term “control efficiency” means the percentage by which a control device or technique reduces the emissions from a stationary source. If the emission unit is controlled by a control device, the capture and control efficiencies are identified. If the emission unit is using an emission factor with an overall emission reduction efficiency included in the factor, “AP‐42” has been assigned to the control efficiency.
C. Emission Factor Source by Reference ID:
30502002 (controlled) AP‐42, Table 11.19.2‐2 Crushed Stone Processing and Pulverized Mineral Processing, SCC 30502002, Screening (controlled)
30502003 (controlled) AP‐42, Table 11.19.2‐2 Crushed Stone Processing and Pulverized Mineral Processing, SCC 30502003, Tertiary Crushing (controlled)
30502006 (controlled) AP‐42, Table 11.19.2‐2 Crushed Stone Processing and Pulverized Mineral Processing, SCC 30502006, Conveyor Transfer Point (controlled)
Cyclone AP‐42 ‐ Section 13.2.4 Aggregate Handling & Storage Piles; Batch/Continuous Drop Equation (1)
RadialStacker AP‐42 ‐ Section 13.2.4 Aggregate Handling & Storage Piles; Batch/Continuous Drop Equation (1)
D. Example Calculation for Item 27:
500 tons
hour
0.0012 lb
ton * ((1 ‐ 100 % capture/100) + (1 ‐ 0 % control/100))
ton
2000 lb=
year
2.63 ton PM
year
8760 Hours
Application Revision 5/14/2012, Page 72 of 131
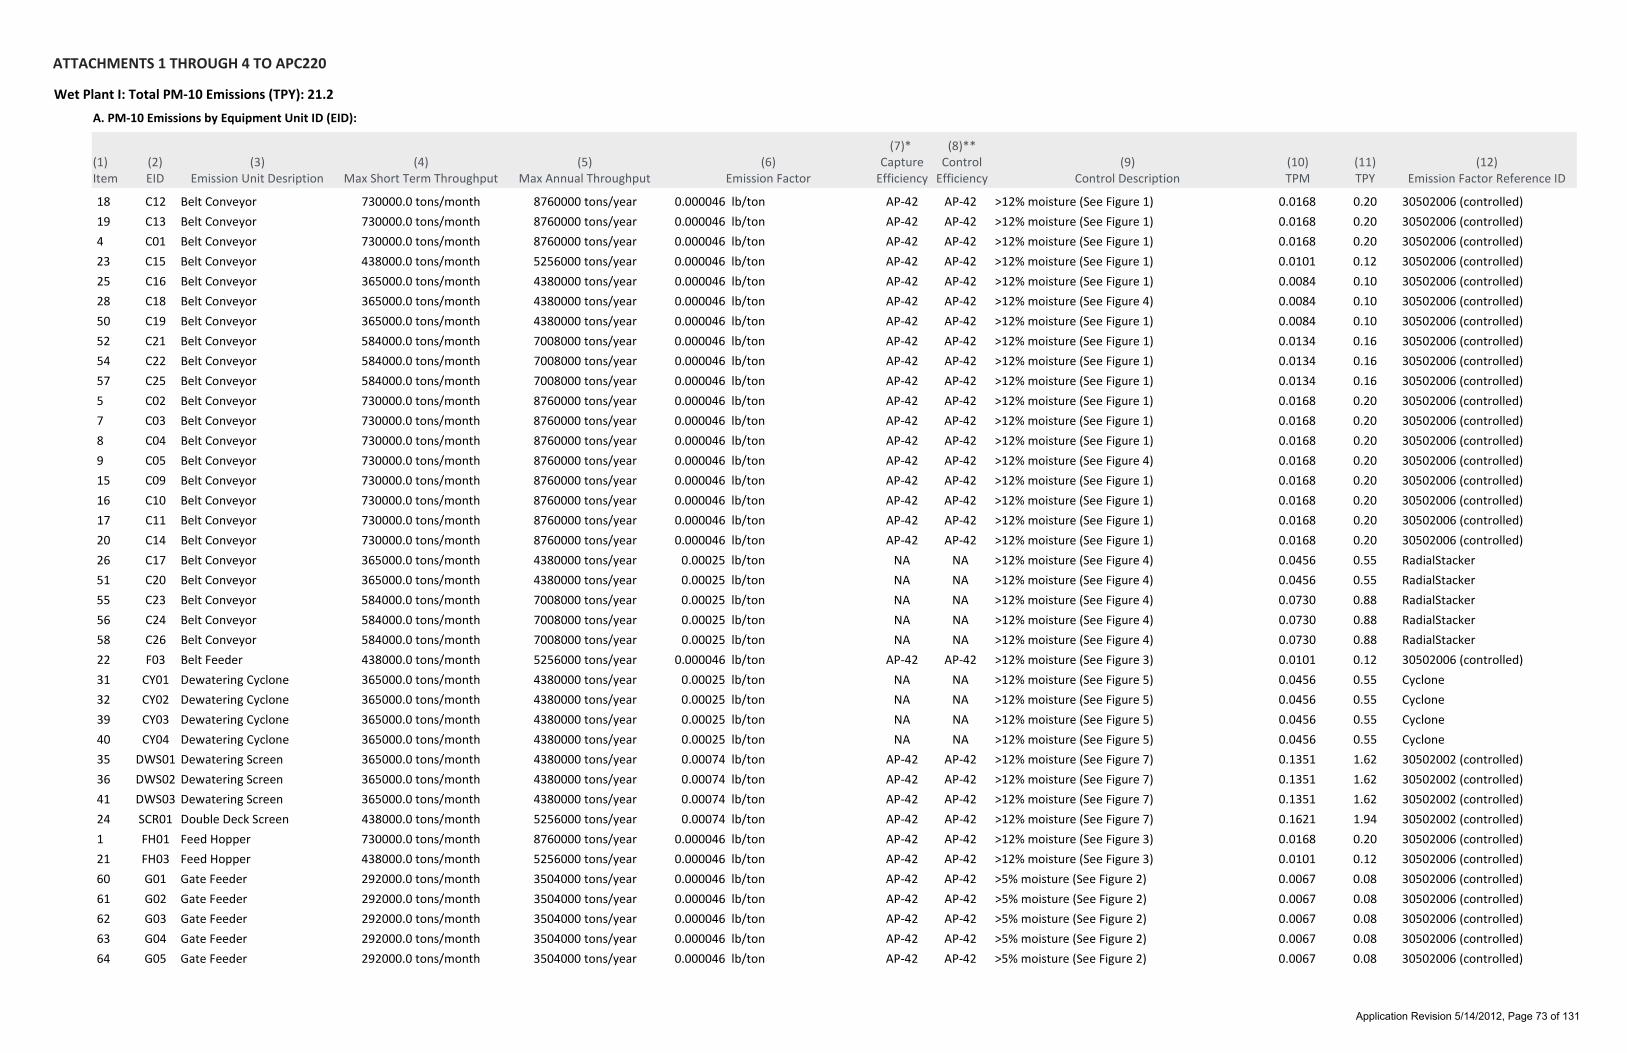
ATTACHMENTS 1 THROUGH 4 TO APC220
Wet Plant I: Total PM‐10 Emissions (TPY): 21.2
A. PM‐10 Emissions by Equipment Unit ID (EID):
(1)Item
(3)Emission Unit Desription
(4)Max Short Term Throughput
(5)Max Annual Throughput
(6)Emission Factor
(7)* Capture
Efficiency(10)TPM
(11)TPY
(2)EID
(8)**Control
Efficiency(9)
Control Description(12)
Emission Factor Reference ID
Belt Conveyor 730000.0 tons/month 8760000 tons/year 0.000046 lb/ton AP‐42 0.0168 0.20C1218 AP‐42 >12% moisture (See Figure 1) 30502006 (controlled)
Belt Conveyor 730000.0 tons/month 8760000 tons/year 0.000046 lb/ton AP‐42 0.0168 0.20C1319 AP‐42 >12% moisture (See Figure 1) 30502006 (controlled)
Belt Conveyor 730000.0 tons/month 8760000 tons/year 0.000046 lb/ton AP‐42 0.0168 0.20C014 AP‐42 >12% moisture (See Figure 1) 30502006 (controlled)
Belt Conveyor 438000.0 tons/month 5256000 tons/year 0.000046 lb/ton AP‐42 0.0101 0.12C1523 AP‐42 >12% moisture (See Figure 1) 30502006 (controlled)
Belt Conveyor 365000.0 tons/month 4380000 tons/year 0.000046 lb/ton AP‐42 0.0084 0.10C1625 AP‐42 >12% moisture (See Figure 1) 30502006 (controlled)
Belt Conveyor 365000.0 tons/month 4380000 tons/year 0.000046 lb/ton AP‐42 0.0084 0.10C1828 AP‐42 >12% moisture (See Figure 4) 30502006 (controlled)
Belt Conveyor 365000.0 tons/month 4380000 tons/year 0.000046 lb/ton AP‐42 0.0084 0.10C1950 AP‐42 >12% moisture (See Figure 1) 30502006 (controlled)
Belt Conveyor 584000.0 tons/month 7008000 tons/year 0.000046 lb/ton AP‐42 0.0134 0.16C2152 AP‐42 >12% moisture (See Figure 1) 30502006 (controlled)
Belt Conveyor 584000.0 tons/month 7008000 tons/year 0.000046 lb/ton AP‐42 0.0134 0.16C2254 AP‐42 >12% moisture (See Figure 1) 30502006 (controlled)
Belt Conveyor 584000.0 tons/month 7008000 tons/year 0.000046 lb/ton AP‐42 0.0134 0.16C2557 AP‐42 >12% moisture (See Figure 1) 30502006 (controlled)
Belt Conveyor 730000.0 tons/month 8760000 tons/year 0.000046 lb/ton AP‐42 0.0168 0.20C025 AP‐42 >12% moisture (See Figure 1) 30502006 (controlled)
Belt Conveyor 730000.0 tons/month 8760000 tons/year 0.000046 lb/ton AP‐42 0.0168 0.20C037 AP‐42 >12% moisture (See Figure 1) 30502006 (controlled)
Belt Conveyor 730000.0 tons/month 8760000 tons/year 0.000046 lb/ton AP‐42 0.0168 0.20C048 AP‐42 >12% moisture (See Figure 1) 30502006 (controlled)
Belt Conveyor 730000.0 tons/month 8760000 tons/year 0.000046 lb/ton AP‐42 0.0168 0.20C059 AP‐42 >12% moisture (See Figure 4) 30502006 (controlled)
Belt Conveyor 730000.0 tons/month 8760000 tons/year 0.000046 lb/ton AP‐42 0.0168 0.20C0915 AP‐42 >12% moisture (See Figure 1) 30502006 (controlled)
Belt Conveyor 730000.0 tons/month 8760000 tons/year 0.000046 lb/ton AP‐42 0.0168 0.20C1016 AP‐42 >12% moisture (See Figure 1) 30502006 (controlled)
Belt Conveyor 730000.0 tons/month 8760000 tons/year 0.000046 lb/ton AP‐42 0.0168 0.20C1117 AP‐42 >12% moisture (See Figure 1) 30502006 (controlled)
Belt Conveyor 730000.0 tons/month 8760000 tons/year 0.000046 lb/ton AP‐42 0.0168 0.20C1420 AP‐42 >12% moisture (See Figure 1) 30502006 (controlled)
Belt Conveyor 365000.0 tons/month 4380000 tons/year 0.00025 lb/ton NA 0.0456 0.55C1726 NA >12% moisture (See Figure 4) RadialStacker
Belt Conveyor 365000.0 tons/month 4380000 tons/year 0.00025 lb/ton NA 0.0456 0.55C2051 NA >12% moisture (See Figure 4) RadialStacker
Belt Conveyor 584000.0 tons/month 7008000 tons/year 0.00025 lb/ton NA 0.0730 0.88C2355 NA >12% moisture (See Figure 4) RadialStacker
Belt Conveyor 584000.0 tons/month 7008000 tons/year 0.00025 lb/ton NA 0.0730 0.88C2456 NA >12% moisture (See Figure 4) RadialStacker
Belt Conveyor 584000.0 tons/month 7008000 tons/year 0.00025 lb/ton NA 0.0730 0.88C2658 NA >12% moisture (See Figure 4) RadialStacker
Belt Feeder 438000.0 tons/month 5256000 tons/year 0.000046 lb/ton AP‐42 0.0101 0.12F0322 AP‐42 >12% moisture (See Figure 3) 30502006 (controlled)
Dewatering Cyclone 365000.0 tons/month 4380000 tons/year 0.00025 lb/ton NA 0.0456 0.55CY0131 NA >12% moisture (See Figure 5) Cyclone
Dewatering Cyclone 365000.0 tons/month 4380000 tons/year 0.00025 lb/ton NA 0.0456 0.55CY0232 NA >12% moisture (See Figure 5) Cyclone
Dewatering Cyclone 365000.0 tons/month 4380000 tons/year 0.00025 lb/ton NA 0.0456 0.55CY0339 NA >12% moisture (See Figure 5) Cyclone
Dewatering Cyclone 365000.0 tons/month 4380000 tons/year 0.00025 lb/ton NA 0.0456 0.55CY0440 NA >12% moisture (See Figure 5) Cyclone
Dewatering Screen 365000.0 tons/month 4380000 tons/year 0.00074 lb/ton AP‐42 0.1351 1.62DWS0135 AP‐42 >12% moisture (See Figure 7) 30502002 (controlled)
Dewatering Screen 365000.0 tons/month 4380000 tons/year 0.00074 lb/ton AP‐42 0.1351 1.62DWS0236 AP‐42 >12% moisture (See Figure 7) 30502002 (controlled)
Dewatering Screen 365000.0 tons/month 4380000 tons/year 0.00074 lb/ton AP‐42 0.1351 1.62DWS0341 AP‐42 >12% moisture (See Figure 7) 30502002 (controlled)
Double Deck Screen 438000.0 tons/month 5256000 tons/year 0.00074 lb/ton AP‐42 0.1621 1.94SCR0124 AP‐42 >12% moisture (See Figure 7) 30502002 (controlled)
Feed Hopper 730000.0 tons/month 8760000 tons/year 0.000046 lb/ton AP‐42 0.0168 0.20FH011 AP‐42 >12% moisture (See Figure 3) 30502006 (controlled)
Feed Hopper 438000.0 tons/month 5256000 tons/year 0.000046 lb/ton AP‐42 0.0101 0.12FH0321 AP‐42 >12% moisture (See Figure 3) 30502006 (controlled)
Gate Feeder 292000.0 tons/month 3504000 tons/year 0.000046 lb/ton AP‐42 0.0067 0.08G0160 AP‐42 >5% moisture (See Figure 2) 30502006 (controlled)
Gate Feeder 292000.0 tons/month 3504000 tons/year 0.000046 lb/ton AP‐42 0.0067 0.08G0261 AP‐42 >5% moisture (See Figure 2) 30502006 (controlled)
Gate Feeder 292000.0 tons/month 3504000 tons/year 0.000046 lb/ton AP‐42 0.0067 0.08G0362 AP‐42 >5% moisture (See Figure 2) 30502006 (controlled)
Gate Feeder 292000.0 tons/month 3504000 tons/year 0.000046 lb/ton AP‐42 0.0067 0.08G0463 AP‐42 >5% moisture (See Figure 2) 30502006 (controlled)
Gate Feeder 292000.0 tons/month 3504000 tons/year 0.000046 lb/ton AP‐42 0.0067 0.08G0564 AP‐42 >5% moisture (See Figure 2) 30502006 (controlled)
Application Revision 5/14/2012, Page 73 of 131

ATTACHMENTS 1 THROUGH 4 TO APC220
Wet Plant I: Total PM‐10 Emissions (TPY): 21.2
A. PM‐10 Emissions by Equipment Unit ID (EID):
(1)Item
(3)Emission Unit Desription
(4)Max Short Term Throughput
(5)Max Annual Throughput
(6)Emission Factor
(7)* Capture
Efficiency(10)TPM
(11)TPY
(2)EID
(8)**Control
Efficiency(9)
Control Description(12)
Emission Factor Reference ID
Gate Feeder 292000.0 tons/month 3504000 tons/year 0.000046 lb/ton AP‐42 0.0067 0.08G0665 AP‐42 >5% moisture (See Figure 2) 30502006 (controlled)
Gate Feeder 292000.0 tons/month 3504000 tons/year 0.000046 lb/ton AP‐42 0.0067 0.08G0766 AP‐42 >5% moisture (See Figure 2) 30502006 (controlled)
Gate Feeder 292000.0 tons/month 3504000 tons/year 0.000046 lb/ton AP‐42 0.0067 0.08G0867 AP‐42 >5% moisture (See Figure 2) 30502006 (controlled)
Gate Feeder 292000.0 tons/month 3504000 tons/year 0.000046 lb/ton AP‐42 0.0067 0.08G0968 AP‐42 >5% moisture (See Figure 2) 30502006 (controlled)
Gate Feeder 292000.0 tons/month 3504000 tons/year 0.000046 lb/ton AP‐42 0.0067 0.08G1069 AP‐42 >5% moisture (See Figure 2) 30502006 (controlled)
Gate Feeder 292000.0 tons/month 3504000 tons/year 0.000046 lb/ton AP‐42 0.0067 0.08G1170 AP‐42 >5% moisture (See Figure 2) 30502006 (controlled)
Gate Feeder 292000.0 tons/month 3504000 tons/year 0.000046 lb/ton AP‐42 0.0067 0.08G1271 AP‐42 >5% moisture (See Figure 2) 30502006 (controlled)
Grizzly Feeder 730000.0 tons/month 8760000 tons/year 0.000046 lb/ton AP‐42 0.0168 0.20F012 AP‐42 >12% moisture (See Figure 2) 30502006 (controlled)
Hydrosizer 365000.0 tons/month 4380000 tons/year 0.000046 lb/ton AP‐42 0.0084 0.10HY0133 AP‐42 >12% moisture (See Figure 6) 30502006 (controlled)
Hydrosizer 365000.0 tons/month 4380000 tons/year 0.000046 lb/ton AP‐42 0.0084 0.10HY0234 AP‐42 >12% moisture (See Figure 6) 30502006 (controlled)
Impact Crusher 730000.0 tons/month 8760000 tons/year 0.00054 lb/ton AP‐42 0.1971 2.37CR013 AP‐42 >12% moisture 30502003 (controlled)
VSI Crusher 365000.0 tons/month 4380000 tons/year 0.00054 lb/ton AP‐42 0.0986 1.18CR0227 AP‐42 >12% moisture 30502003 (controlled)
B. Proposed Permit Limits for PM‐10 from Wet Plant I:
730000.0 tons/month 8760000 tons/year 21.201.7670
E. Notes:
As defined in I.A. (7), (8) and (9) for sources with capture and/or control efficiencies for pollution control equipment.
*The term “capture system” for the purpose of this application means the equipment (including hoods, ducts, etc.) used to contain, capture, or transport an air contaminant to a control device. In addition, the term “capture efficiency” means the weight per unit time of an air contaminant entering a capture system and delivered to a control device, divided by the weight per unit time of the air contaminant generated by the source, expressed as a percentage. Therefore, if the emission unit is not exhausted to a control device, the capture system and capture efficiency is not applicable (NA). If the emission unit is using an emission factor with an overall emission reduction efficiency included in the factor, “AP‐42” has been assigned to the capture efficiency.
**The term “control system” for the purpose of this application means any control device or technique which is designed and operated to reduce the quantity of air contaminants emitted to the atmosphere. The term “control efficiency” means the percentage by which a control device or technique reduces the emissions from a stationary source. If the emission unit is controlled by a control device, the capture and control efficiencies are identified. If the emission unit is using an emission factor with an overall emission reduction efficiency included in the factor, “AP‐42” has been assigned to the control efficiency.
C. Emission Factor Source by Reference ID:
30502002 (controlled) AP‐42, Table 11.19.2‐2 Crushed Stone Processing and Pulverized Mineral Processing, SCC 30502002, Screening (controlled)
30502003 (controlled) AP‐42, Table 11.19.2‐2 Crushed Stone Processing and Pulverized Mineral Processing, SCC 30502003, Tertiary Crushing (controlled)
30502006 (controlled) AP‐42, Table 11.19.2‐2 Crushed Stone Processing and Pulverized Mineral Processing, SCC 30502006, Conveyor Transfer Point (controlled)
Cyclone AP‐42 ‐ Section 13.2.4 Aggregate Handling & Storage Piles; Batch/Continuous Drop Equation (1)
RadialStacker AP‐42 ‐ Section 13.2.4 Aggregate Handling & Storage Piles; Batch/Continuous Drop Equation (1)
D. Example Calculation for Item 27:
500 tons
hour
0.00054 lb
ton * ((1 ‐ 100 % capture/100) + (1 ‐ 0 % control/100))
ton
2000 lb=
year
1.18 ton PM‐10
year
8760 Hours
Application Revision 5/14/2012, Page 74 of 131

ATTACHMENTS 1 THROUGH 4 TO APC220
Wet Plant I: Total PM2.5 Emissions (TPY): 2.7
A. PM2.5 Emissions by Equipment Unit ID (EID):
(1)Item
(3)Emission Unit Desription
(4)Max Short Term Throughput
(5)Max Annual Throughput
(6)Emission Factor
(7)* Capture
Efficiency(10)TPM
(11)TPY
(2)EID
(8)**Control
Efficiency(9)
Control Description(12)
Emission Factor Reference ID
Belt Conveyor 730000.0 tons/month 8760000 tons/year 0.000013 lb/ton AP‐42 0.0047 0.06C1218 AP‐42 >12% moisture (See Figure 1) 30502006 (controlled)
Belt Conveyor 730000.0 tons/month 8760000 tons/year 0.000013 lb/ton AP‐42 0.0047 0.06C1319 AP‐42 >12% moisture (See Figure 1) 30502006 (controlled)
Belt Conveyor 730000.0 tons/month 8760000 tons/year 0.000013 lb/ton AP‐42 0.0047 0.06C014 AP‐42 >12% moisture (See Figure 1) 30502006 (controlled)
Belt Conveyor 438000.0 tons/month 5256000 tons/year 0.000013 lb/ton AP‐42 0.0028 0.03C1523 AP‐42 >12% moisture (See Figure 1) 30502006 (controlled)
Belt Conveyor 365000.0 tons/month 4380000 tons/year 0.000013 lb/ton AP‐42 0.0024 0.03C1625 AP‐42 >12% moisture (See Figure 1) 30502006 (controlled)
Belt Conveyor 365000.0 tons/month 4380000 tons/year 0.000013 lb/ton AP‐42 0.0024 0.03C1828 AP‐42 >12% moisture (See Figure 4) 30502006 (controlled)
Belt Conveyor 365000.0 tons/month 4380000 tons/year 0.000013 lb/ton AP‐42 0.0024 0.03C1950 AP‐42 >12% moisture (See Figure 1) 30502006 (controlled)
Belt Conveyor 584000.0 tons/month 7008000 tons/year 0.000013 lb/ton AP‐42 0.0038 0.05C2152 AP‐42 >12% moisture (See Figure 1) 30502006 (controlled)
Belt Conveyor 584000.0 tons/month 7008000 tons/year 0.000013 lb/ton AP‐42 0.0038 0.05C2254 AP‐42 >12% moisture (See Figure 1) 30502006 (controlled)
Belt Conveyor 584000.0 tons/month 7008000 tons/year 0.000013 lb/ton AP‐42 0.0038 0.05C2557 AP‐42 >12% moisture (See Figure 1) 30502006 (controlled)
Belt Conveyor 730000.0 tons/month 8760000 tons/year 0.000013 lb/ton AP‐42 0.0047 0.06C025 AP‐42 >12% moisture (See Figure 1) 30502006 (controlled)
Belt Conveyor 730000.0 tons/month 8760000 tons/year 0.000013 lb/ton AP‐42 0.0047 0.06C037 AP‐42 >12% moisture (See Figure 1) 30502006 (controlled)
Belt Conveyor 730000.0 tons/month 8760000 tons/year 0.000013 lb/ton AP‐42 0.0047 0.06C048 AP‐42 >12% moisture (See Figure 1) 30502006 (controlled)
Belt Conveyor 730000.0 tons/month 8760000 tons/year 0.000013 lb/ton AP‐42 0.0047 0.06C059 AP‐42 >12% moisture (See Figure 4) 30502006 (controlled)
Belt Conveyor 730000.0 tons/month 8760000 tons/year 0.000013 lb/ton AP‐42 0.0047 0.06C0915 AP‐42 >12% moisture (See Figure 1) 30502006 (controlled)
Belt Conveyor 730000.0 tons/month 8760000 tons/year 0.000013 lb/ton AP‐42 0.0047 0.06C1016 AP‐42 >12% moisture (See Figure 1) 30502006 (controlled)
Belt Conveyor 730000.0 tons/month 8760000 tons/year 0.000013 lb/ton AP‐42 0.0047 0.06C1117 AP‐42 >12% moisture (See Figure 1) 30502006 (controlled)
Belt Conveyor 730000.0 tons/month 8760000 tons/year 0.000013 lb/ton AP‐42 0.0047 0.06C1420 AP‐42 >12% moisture (See Figure 1) 30502006 (controlled)
Belt Conveyor 365000.0 tons/month 4380000 tons/year 0.000008 lb/ton NA 0.0015 0.02C1726 NA >12% moisture (See Figure 4) RadialStacker
Belt Conveyor 365000.0 tons/month 4380000 tons/year 0.000008 lb/ton NA 0.0015 0.02C2051 NA >12% moisture (See Figure 4) RadialStacker
Belt Conveyor 584000.0 tons/month 7008000 tons/year 0.000008 lb/ton NA 0.0023 0.03C2355 NA >12% moisture (See Figure 4) RadialStacker
Belt Conveyor 584000.0 tons/month 7008000 tons/year 0.000008 lb/ton NA 0.0023 0.03C2456 NA >12% moisture (See Figure 4) RadialStacker
Belt Conveyor 584000.0 tons/month 7008000 tons/year 0.000008 lb/ton NA 0.0023 0.03C2658 NA >12% moisture (See Figure 4) RadialStacker
Belt Feeder 438000.0 tons/month 5256000 tons/year 0.000013 lb/ton AP‐42 0.0028 0.03F0322 AP‐42 >12% moisture (See Figure 3) 30502006 (controlled)
Dewatering Cyclone 365000.0 tons/month 4380000 tons/year 0.000008 lb/ton NA 0.0015 0.02CY0131 NA >12% moisture (See Figure 5) Cyclone
Dewatering Cyclone 365000.0 tons/month 4380000 tons/year 0.000008 lb/ton NA 0.0015 0.02CY0232 NA >12% moisture (See Figure 5) Cyclone
Dewatering Cyclone 365000.0 tons/month 4380000 tons/year 0.000008 lb/ton NA 0.0015 0.02CY0339 NA >12% moisture (See Figure 5) Cyclone
Dewatering Cyclone 365000.0 tons/month 4380000 tons/year 0.000008 lb/ton NA 0.0015 0.02CY0440 NA >12% moisture (See Figure 5) Cyclone
Dewatering Screen 365000.0 tons/month 4380000 tons/year 0.00005 lb/ton AP‐42 0.0091 0.11DWS0135 AP‐42 >12% moisture (See Figure 7) 30502002 (controlled)
Dewatering Screen 365000.0 tons/month 4380000 tons/year 0.00005 lb/ton AP‐42 0.0091 0.11DWS0236 AP‐42 >12% moisture (See Figure 7) 30502002 (controlled)
Dewatering Screen 365000.0 tons/month 4380000 tons/year 0.00005 lb/ton AP‐42 0.0091 0.11DWS0341 AP‐42 >12% moisture (See Figure 7) 30502002 (controlled)
Double Deck Screen 438000.0 tons/month 5256000 tons/year 0.00005 lb/ton AP‐42 0.0110 0.13SCR0124 AP‐42 >12% moisture (See Figure 7) 30502002 (controlled)
Feed Hopper 730000.0 tons/month 8760000 tons/year 0.000013 lb/ton AP‐42 0.0047 0.06FH011 AP‐42 >12% moisture (See Figure 3) 30502006 (controlled)
Feed Hopper 438000.0 tons/month 5256000 tons/year 0.000013 lb/ton AP‐42 0.0028 0.03FH0321 AP‐42 >12% moisture (See Figure 3) 30502006 (controlled)
Gate Feeder 292000.0 tons/month 3504000 tons/year 0.000013 lb/ton AP‐42 0.0019 0.02G0160 AP‐42 >5% moisture (See Figure 2) 30502006 (controlled)
Gate Feeder 292000.0 tons/month 3504000 tons/year 0.000013 lb/ton AP‐42 0.0019 0.02G0261 AP‐42 >5% moisture (See Figure 2) 30502006 (controlled)
Gate Feeder 292000.0 tons/month 3504000 tons/year 0.000013 lb/ton AP‐42 0.0019 0.02G0362 AP‐42 >5% moisture (See Figure 2) 30502006 (controlled)
Gate Feeder 292000.0 tons/month 3504000 tons/year 0.000013 lb/ton AP‐42 0.0019 0.02G0463 AP‐42 >5% moisture (See Figure 2) 30502006 (controlled)
Gate Feeder 292000.0 tons/month 3504000 tons/year 0.000013 lb/ton AP‐42 0.0019 0.02G0564 AP‐42 >5% moisture (See Figure 2) 30502006 (controlled)
Application Revision 5/14/2012, Page 75 of 131

ATTACHMENTS 1 THROUGH 4 TO APC220
Wet Plant I: Total PM2.5 Emissions (TPY): 2.7
A. PM2.5 Emissions by Equipment Unit ID (EID):
(1)Item
(3)Emission Unit Desription
(4)Max Short Term Throughput
(5)Max Annual Throughput
(6)Emission Factor
(7)* Capture
Efficiency(10)TPM
(11)TPY
(2)EID
(8)**Control
Efficiency(9)
Control Description(12)
Emission Factor Reference ID
Gate Feeder 292000.0 tons/month 3504000 tons/year 0.000013 lb/ton AP‐42 0.0019 0.02G0665 AP‐42 >5% moisture (See Figure 2) 30502006 (controlled)
Gate Feeder 292000.0 tons/month 3504000 tons/year 0.000013 lb/ton AP‐42 0.0019 0.02G0766 AP‐42 >5% moisture (See Figure 2) 30502006 (controlled)
Gate Feeder 292000.0 tons/month 3504000 tons/year 0.000013 lb/ton AP‐42 0.0019 0.02G0867 AP‐42 >5% moisture (See Figure 2) 30502006 (controlled)
Gate Feeder 292000.0 tons/month 3504000 tons/year 0.000013 lb/ton AP‐42 0.0019 0.02G0968 AP‐42 >5% moisture (See Figure 2) 30502006 (controlled)
Gate Feeder 292000.0 tons/month 3504000 tons/year 0.000013 lb/ton AP‐42 0.0019 0.02G1069 AP‐42 >5% moisture (See Figure 2) 30502006 (controlled)
Gate Feeder 292000.0 tons/month 3504000 tons/year 0.000013 lb/ton AP‐42 0.0019 0.02G1170 AP‐42 >5% moisture (See Figure 2) 30502006 (controlled)
Gate Feeder 292000.0 tons/month 3504000 tons/year 0.000013 lb/ton AP‐42 0.0019 0.02G1271 AP‐42 >5% moisture (See Figure 2) 30502006 (controlled)
Grizzly Feeder 730000.0 tons/month 8760000 tons/year 0.000013 lb/ton AP‐42 0.0047 0.06F012 AP‐42 >12% moisture (See Figure 2) 30502006 (controlled)
Hydrosizer 365000.0 tons/month 4380000 tons/year 0.000013 lb/ton AP‐42 0.0024 0.03HY0133 AP‐42 >12% moisture (See Figure 6) 30502006 (controlled)
Hydrosizer 365000.0 tons/month 4380000 tons/year 0.000013 lb/ton AP‐42 0.0024 0.03HY0234 AP‐42 >12% moisture (See Figure 6) 30502006 (controlled)
Impact Crusher 730000.0 tons/month 8760000 tons/year 0.0001 lb/ton AP‐42 0.0365 0.44CR013 AP‐42 >12% moisture 30502003 (controlled)
VSI Crusher 365000.0 tons/month 4380000 tons/year 0.0001 lb/ton AP‐42 0.0183 0.22CR0227 AP‐42 >12% moisture 30502003 (controlled)
B. Proposed Permit Limits for PM2.5 from Wet Plant I:
730000.0 tons/month 8760000 tons/year 2.700.2251
E. Notes:
As defined in I.A. (7), (8) and (9) for sources with capture and/or control efficiencies for pollution control equipment.
*The term “capture system” for the purpose of this application means the equipment (including hoods, ducts, etc.) used to contain, capture, or transport an air contaminant to a control device. In addition, the term “capture efficiency” means the weight per unit time of an air contaminant entering a capture system and delivered to a control device, divided by the weight per unit time of the air contaminant generated by the source, expressed as a percentage. Therefore, if the emission unit is not exhausted to a control device, the capture system and capture efficiency is not applicable (NA). If the emission unit is using an emission factor with an overall emission reduction efficiency included in the factor, “AP‐42” has been assigned to the capture efficiency.
**The term “control system” for the purpose of this application means any control device or technique which is designed and operated to reduce the quantity of air contaminants emitted to the atmosphere. The term “control efficiency” means the percentage by which a control device or technique reduces the emissions from a stationary source. If the emission unit is controlled by a control device, the capture and control efficiencies are identified. If the emission unit is using an emission factor with an overall emission reduction efficiency included in the factor, “AP‐42” has been assigned to the control efficiency.
C. Emission Factor Source by Reference ID:
30502002 (controlled) AP‐42, Table 11.19.2‐2 Crushed Stone Processing and Pulverized Mineral Processing, SCC 30502002, Screening (controlled)
30502003 (controlled) AP‐42, Table 11.19.2‐2 Crushed Stone Processing and Pulverized Mineral Processing, SCC 30502003, Tertiary Crushing (controlled)
30502006 (controlled) AP‐42, Table 11.19.2‐2 Crushed Stone Processing and Pulverized Mineral Processing, SCC 30502006, Conveyor Transfer Point (controlled)
Cyclone AP‐42 ‐ Section 13.2.4 Aggregate Handling & Storage Piles; Batch/Continuous Drop Equation (1)
RadialStacker AP‐42 ‐ Section 13.2.4 Aggregate Handling & Storage Piles; Batch/Continuous Drop Equation (1)
D. Example Calculation for Item 27:
500 tons
hour
0.0001 lb
ton * ((1 ‐ 100 % capture/100) + (1 ‐ 0 % control/100))
ton
2000 lb=
year
0.22 ton PM2.5
year
8760 Hours
Application Revision 5/14/2012, Page 76 of 131

Attachment 5 to APC220: Stack Information
Item 64. Flow Diagram Designation of Exhaust Point Wet Plant I
Item 65. Description of Exhaust Point This stack ID represents fugitive sources from wet sand processing.
Item 67. Exit Diameter (feet) NA
Item 71. Average Flow Rate (acfm) NA
Item 73. Maximum Flow Rate (acfm) NA
Item 70. Average Exhaust Gas Temperature (F) NA
Item 66. Exit Height above Grade (feet) NA
Item 72. Maximum Exhaust Gas Temperature (F) NA
Item 68. Greatest Height of Nearby Building (feet) To be determined
Item 69. Distance to Nearest Property Line (feet) 300
Application Revision 5/14/2012, Page 77 of 131

STATE OF ILLINOIS
ENVIRONMENTAL PROTECTION AGENCY
DIVISION OF AIR POLLUTION CONTROL
1021 NORTH GRAND AVENUE, EAST
SPRINGFIELD, ILLINOIS 62702
IL 532-0250
APC 220 Rev. 1/27/77
* DATA AND INFORMATION
PROCESS EMISSION SOURCE
* THIS INFORMATION FORM IS TO BE COMPLETED FOR AN EMISSION SOURCE OTHER THAN A FUEL COMBUSTION EMISSION SOURCE OR AN
INCINERATOR. A FUEL COMBUSTION EMISSION SOURCE IS A FURNACE, BOILER, OR SIMILAR EQUIPMENT USED PRIMARILY FOR
PRODUCING HEAT OR POWER BY INDIRECT HEAT TRANSFER. AN INCINERATOR IS AN APPARATUS IN WHICH REFUSE IS BURNED.
1. NAME OF PLANT OWNER:
2. NAME OF CORPORATE DIVISION OR PLANT (IF DIFFERENT FROM
OWNER):
3. STREET ADDRESS OF EMISSION SOURCE:
4. CITY OF EMISSION SOURCE:
GENERAL INFORMATION
5. NAME OF PROCESS:
6. NAME OF EMISSION SOURCE EQUIPMENT:
7. EMISSION SOURCE EQUIPMENT MANUFACTURER:
8. MODEL NUMBER:
9. SERIAL NUMBER:
10. FLOW DIAGRAM DESIGNATION(S) OF EMISSION SOURCE:
11. IDENTITY(S) OF ANY SIMILAR SOURCE(S) AT THE PLANT OR PREMISES NOT COVERED BY THE FORM (IF THE SOURCE IS COVERED BY
ANOTHER APPLICATION, IDENTIFY THE APPLICATION):
12. AVERAGE OPERATING TIME OF EMISSION SOURCE:
_________ HRS/DAY _________ DAYS/WK _________ WKS/YR
13. MAXIMUM OPERATING TIME OF EMISSION SOURCE:
_________ HRS/DAY _________ DAYS/WK _________ WKS/YR
14. PERCENT OF ANNUAL THROUGHPUT:
DEC-FEB ____________ % MAR-MAY ____________ % JUN-AUG ____________ % SEPT-NOV ____________ %
INSTRUCTIONS
1. COMPLETE THE ABOVE IDENTIFICATION AND GENERAL INFORMATION SECTION.
2. COMPLETE THE RAW MATERIAL, PRODUCT, WASTE MATERIAL, AND FUEL USAGE SECTIONS FOR THE PARTICULAR SOURCE EQUIPMENT.
COMPOSITIONS OF MATERIALS MUST BE SUFFICIENTLY DETAILED TO ALLOW DETERMINATION OF THE NATURE AND QUANTITY OF
POTENTIAL EMISSIONS. IN PARTICULAR, THE COMPOSITION OF PAINTS, INKS, ETC., AND ANY SOLVENTS MUST BE FULLY DETAILED.
3. EMISSION AND EXHAUST POINT INFORMATION MUST BE COMPLETED, UNLESS EMISSIONS ARE EXHAUSTED THROUGH AIR POLLUTION
CONTROL EQUIPMENT.
4. OPERATION TIME AND CERTAIN OTHER ITEMS REQUIRE BOTH AVERAGE AND MAXIMUM VALUES
5. FOR GENERAL INFORMATION REFER TO “GENERAL INSTRUCTIONS FOR PERMIT APPLICATIONS,” APC-201.
DEFINITIONS
AVERAGE - THE VALUE THAT SUMMARIZES OR REPRESENTS THE GENERAL CONDITION OF THE EMISSION SOURCE, OR THE GENERAL STATE
OF PRODUCTION OF THE EMISSION SOURCE. SPECIFICALLY:
AVERAGE OPERATING TIME - ACTUAL TOTAL HOURS OF OPERATION FOR THE PRECEDING TWELVE MONTH PERIOD.
AVERAGE RATE - ACTUAL TOTAL QUANTITY OF “MATERIAL” FOR THE PRECEDING TWELVE MONTH PERIOD, DIVIDED BY THE AVERAGE
OPERATING TIME.
AVERAGE OPERATION - OPERATION TYPICAL OF THE PRECEDING TWELVE MONTH PERIOD, AS REPRESENTED BY AVERAGE OPERATING
TIME AND AVERAGE RATES.
MAXIMUM - THE GREATEST VALUE ATTAINABLE OR ATTAINED FOR THE EMISSION SOURCE, OR THE PERIOD OF GREATEST OR UTMOST
PRODUCTION OF THE EMISSION SOURCE. SPECIFICALLY:
MAXIMUM OPERATING TIME - GREATEST EXPECTED TOTAL HOURS OF OPERATIONS FOR ANY TWELVE MONTH PERIOD.
MAXIMUM RATE - GREATEST QUANTITY OF “MATERIAL” EXPECTED PER ANY ONE HOUR OF OPERATION.
MAXIMUM OPERATION - GREATEST EXPECTED OPERATION, AS REPRESENTED BY MAXIMUM OPERATING TIME AND MAXIMUM RATES.
This Agency is authorized to require this information under Illinois Revised Statutes, 1979, Chapter 111 1/2, Section 1039. Disclosure of this information is required
under that Section. Failure to do so may prevent this form from being processed and could result in your application being denied. This form has been approved by the
Forms Management Center.
Mississippi Sand, LLC. Same as Owner
2320 Creve Coeur Mill Rd LaSalle County, Ottawa Township
Wet Plant II See Attachment 1 to APC 220
-- -- --
--
--
-- -- -- -- -- --
-- -- -- --
Application Revision 5/14/2012, Page 78 of 131

APC 220
RAW MATERIAL INFORMATION
NAME OF RAW MATERIAL
AVERAGE RATE
PER IDENTICAL SOURCE
MAXIMUM RATE
PER IDENTICAL SOURCE
20a. b.
LB/HR
c.
LB/HR
21a. b.
LB/HR
c.
LB/HR
22a. b.
LB/HR
c.
LB/HR
23a. b.
LB/HR
c.
LB/HR
24a. b.
LB/HR
c.
LB/HR
PRODUCT INFORMATION
NAME OF PRODUCT
AVERAGE RATE
PER IDENTICAL SOURCE
MAXIMUM RATE
PER IDENTICAL SOURCE
30a. b.
LB/HR
c.
LB/HR
31a. b.
LB/HR
c.
LB/HR
32a. b.
LB/HR
c.
LB/HR
33a. b.
LB/HR
c.
LB/HR
34a. b.
LB/HR
c.
LB/HR
WASTE MATERIAL INFORMATION
NAME OF WASTE MATERIAL
AVERAGE RATE
PER IDENTICAL SOURCE
MAXIMUM RATE
PER IDENTICAL SOURCE
40a. b.
LB/HR
c.
LB/HR
41a. b.
LB/HR
c.
LB/HR
42a. b.
LB/HR
c.
LB/HR
43a. b.
LB/HR
c.
LB/HR
44a. b.
LB/HR
c.
LB/HR
*FUEL USAGE INFORMATION
FUEL USED TYPE HEAT CONTENT
50a. NATURAL GAS b. ----------------------------- c. 1000 BTU/SCF
OTHER GAS BTU/SCF
OIL BTU/GAL
COAL BTU/LB
OTHER BTU/LB
d. AVERAGE FIRING RATE PER IDENTICAL SOURCE:
BTU/HR
e. MAXIMUM FIRING RATE PER IDENTICAL SOURCE:
BTU/HR
*THIS SECTION IS TO BE COMPLETED FOR ANY FUEL USED DIRECTLY IN THE PROCESS EMISSION SOURCE, E. G. GAS IN A DRYER, OR COAL IN
A MELT FURNACE.
See Attachment 2 to APC 220 -- --
See Attachment 3 to APC 220 -- --
NA -- --
NA NA
Application Revision 5/14/2012, Page 79 of 131

Page ______ of ______
APC 220
*EMISSION INFORMATION
51. NUMBER OF IDENTICAL SOURCES (DESCRIBE AS REQUIRED):
AVERAGE OPERATION
CONTAMINANT
CONCENTRATION OR EMISSION RATE PER IDENTICAL
SOURCE
METHOD USED TO DETERMINE CONCENTRATION OR
EMISSION RATE
PARTICULATE
MATTER
52a.
GR/SCF
b.
LB/HR
c.
CARBON
MONOXIDE
53a. PPM
(VOL)
b.
LB/HR
c.
NITROGEN
OXIDES
54a. PPM
(VOL)
b.
LB/HR
c.
ORGANIC
MATERIAL
55a. PPM
(VOL)
b.
LB/HR
c.
SULFUR
DIOXIDE
56a. PPM
(VOL)
b.
LB/HR
c.
**OTHER
(SPECIFY)
57a. PPM
(VOL)
b.
LB/HR
c.
MAXIMUM OPERATION
CONTAMINANT
CONCENTRATION OR EMISSION RATE PER IDENTICAL
SOURCE
METHOD USED TO DETERMINE CONCENTRATION OR
EMISSION RATE
PARTICULATE
MATTER
58a.
GR/SCF
b.
LB/HR
c.
CARBON
MONOXIDE
59a. PPM
(VOL)
b.
LB/HR
c.
NITROGEN
OXIDES
60a. PPM
(VOL)
b.
LB/HR
c.
ORGANIC
MATERIAL
61a. PPM
(VOL)
b.
LB/HR
c.
SULFUR
DIOXIDE
62a. PPM
(VOL)
b.
LB/HR
c.
**OTHER
(SPECIFY)
63a. PPM
(VOL)
b.
LB/HR
c.
*ITEMS 52 THROUGH 63 NEED NOT BE COMPLETED IF EMISSIONS ARE EXHAUSTED THROUGH AIR POLLUTION CONTROL EQUIPMENT.
**“OTHER” CONTAMINANT SHOULD BE USED FOR AN AIR CONTAMINANT NOT SPECIFICALLY NAMED ABOVE. POSSIBLE OTHER
CONTAMINANTS ARE ASBESTOS, BERYLLIUM, MERCURY, VINYL CHLORIDE, LEAD, ETC.
***EXHAUST POINT INFORMATION
64. FLOW DIAGRAM DESIGNATION(S) OF EXHAUST POINT:
65. DESCRIPTION OF EXHAUST POINT (LOCATION IN RELATION TO BUILDINGS, DIRECTION, HOODING, ETC.):
66. EXIT HEIGHT ABOVE GRADE: 67. EXIT DIAMETER:
68. GREATEST HEIGHT OF NEARBY BUILDINGS: 69. EXIT DISTANCE FROM NEAREST PLANT BOUNDARY:
AVERAGE OPERATION MAXIMUM OPERATION
70. EXIT GAS TEMPERATURE:
�F
72. EXIT GAS TEMPERATURE:
�F
71. GAS FLOW RATE THROUGH EACH EXIT:
ACFM
73. GAS FLOW RATE THROUGH EACH EXIT:
ACFM
***THIS SECTION SHOULD NOT BE COMPLETED IF EMISSIONS ARE EXHAUSTED THROUGH AIR POLLUTION CONTROL EQUIPMENT.
See Attachment 4 to APC 220
-- -- --
-- -- --
See Attachment 5 to APC 220
--
-- --
-- --
--
--
--
--
Application Revision 5/14/2012, Page 80 of 131

ATTACHMENTS 1 THROUGH 4 TO APC220
Wet Plant II: Total PM Emissions (TPY): 9.95
A. PM Emissions by Equipment Unit ID (EID):
(1)Item
(3)Emission Unit Desription
(4)Max Short Term Throughput
(5)Max Annual Throughput
(6)Emission Factor
(7)* Capture
Efficiency(10)TPM
(11)TPY
(2)EID
(8)**Control
Efficiency(9)
Control Description(12)
Emission Factor Reference ID
Belt Conveyor 438000.0 tons/month 5256000 tons/year 0.00014 lb/ton AP‐42 0.0307 0.37C2772 AP‐42 >5% moisture (See Figure 1) 30502006 (controlled)
Belt Conveyor 730000.0 tons/month 8760000 tons/year 0.00014 lb/ton AP‐42 0.0511 0.61C0610 AP‐42 >12% moisture (See Figure 1) 30502006 (controlled)
Belt Conveyor 730000.0 tons/month 8760000 tons/year 0.00014 lb/ton AP‐42 0.0511 0.61C0711 AP‐42 >12% moisture (See Figure 1) 30502006 (controlled)
Belt Conveyor 730000.0 tons/month 8760000 tons/year 0.00014 lb/ton AP‐42 0.0511 0.61C0812 AP‐42 >12% moisture (See Figure 1) 30502006 (controlled)
Belt Conveyor 438000.0 tons/month 5256000 tons/year 0.00014 lb/ton AP‐42 0.0307 0.37F0476 AP‐42 >5% moisture (See Figure 1) 30502006 (controlled)
Belt Feeder 730000.0 tons/month 8760000 tons/year 0.00014 lb/ton AP‐42 0.0511 0.61F0214 AP‐42 >12% moisture (See Figure 3) 30502006 (controlled)
Feed Hopper 730000.0 tons/month 8760000 tons/year 0.00014 lb/ton AP‐42 0.0511 0.61FH0213 AP‐42 >12% moisture (See Figure 3) 30502006 (controlled)
Feed Hopper 438000.0 tons/month 5256000 tons/year 0.00014 lb/ton AP‐42 0.0307 0.37FH0475 AP‐42 >5% moisture (See Figure 3) 30502006 (controlled)
Single Deck Screen 438000.0 tons/month 5256000 tons/year 0.0022 lb/ton AP‐42 0.4818 5.78SCR0274 AP‐42 >5% moisture (See Figure 7) 30502002 (controlled)
B. Proposed Permit Limits for PM from Wet Plant II:
730000.0 tons/month 8760000 tons/year 9.950.8293
E. Notes:
As defined in I.A. (7), (8) and (9) for sources with capture and/or control efficiencies for pollution control equipment.
*The term “capture system” for the purpose of this application means the equipment (including hoods, ducts, etc.) used to contain, capture, or transport an air contaminant to a control device. In addition, the term “capture efficiency” means the weight per unit time of an air contaminant entering a capture system and delivered to a control device, divided by the weight per unit time of the air contaminant generated by the source, expressed as a percentage. Therefore, if the emission unit is not exhausted to a control device, the capture system and capture efficiency is not applicable (NA). If the emission unit is using an emission factor with an overall emission reduction efficiency included in the factor, “AP‐42” has been assigned to the capture efficiency.
**The term “control system” for the purpose of this application means any control device or technique which is designed and operated to reduce the quantity of air contaminants emitted to the atmosphere. The term “control efficiency” means the percentage by which a control device or technique reduces the emissions from a stationary source. If the emission unit is controlled by a control device, the capture and control efficiencies are identified. If the emission unit is using an emission factor with an overall emission reduction efficiency included in the factor, “AP‐42” has been assigned to the control efficiency.
C. Emission Factor Source by Reference ID:
30502002 (controlled) AP‐42, Table 11.19.2‐2 Crushed Stone Processing and Pulverized Mineral Processing, SCC 30502002, Screening (controlled)
30502006 (controlled) AP‐42, Table 11.19.2‐2 Crushed Stone Processing and Pulverized Mineral Processing, SCC 30502006, Conveyor Transfer Point (controlled)
D. Example Calculation for Item 74:
600 tons
hour
0.0022 lb
ton * ((1 ‐ 100 % capture/100) + (1 ‐ 0 % control/100))
ton
2000 lb=
year
5.78 ton PM
year
8760 Hours
Application Revision 5/14/2012, Page 81 of 131

ATTACHMENTS 1 THROUGH 4 TO APC220
Wet Plant II: Total PM‐10 Emissions (TPY): 3.31
A. PM‐10 Emissions by Equipment Unit ID (EID):
(1)Item
(3)Emission Unit Desription
(4)Max Short Term Throughput
(5)Max Annual Throughput
(6)Emission Factor
(7)* Capture
Efficiency(10)TPM
(11)TPY
(2)EID
(8)**Control
Efficiency(9)
Control Description(12)
Emission Factor Reference ID
Belt Conveyor 438000.0 tons/month 5256000 tons/year 0.000046 lb/ton AP‐42 0.0101 0.12C2772 AP‐42 >5% moisture (See Figure 1) 30502006 (controlled)
Belt Conveyor 730000.0 tons/month 8760000 tons/year 0.000046 lb/ton AP‐42 0.0168 0.20C0610 AP‐42 >12% moisture (See Figure 1) 30502006 (controlled)
Belt Conveyor 730000.0 tons/month 8760000 tons/year 0.000046 lb/ton AP‐42 0.0168 0.20C0711 AP‐42 >12% moisture (See Figure 1) 30502006 (controlled)
Belt Conveyor 730000.0 tons/month 8760000 tons/year 0.000046 lb/ton AP‐42 0.0168 0.20C0812 AP‐42 >12% moisture (See Figure 1) 30502006 (controlled)
Belt Conveyor 438000.0 tons/month 5256000 tons/year 0.000046 lb/ton AP‐42 0.0101 0.12F0476 AP‐42 >5% moisture (See Figure 1) 30502006 (controlled)
Belt Feeder 730000.0 tons/month 8760000 tons/year 0.000046 lb/ton AP‐42 0.0168 0.20F0214 AP‐42 >12% moisture (See Figure 3) 30502006 (controlled)
Feed Hopper 730000.0 tons/month 8760000 tons/year 0.000046 lb/ton AP‐42 0.0168 0.20FH0213 AP‐42 >12% moisture (See Figure 3) 30502006 (controlled)
Feed Hopper 438000.0 tons/month 5256000 tons/year 0.000046 lb/ton AP‐42 0.0101 0.12FH0475 AP‐42 >5% moisture (See Figure 3) 30502006 (controlled)
Single Deck Screen 438000.0 tons/month 5256000 tons/year 0.00074 lb/ton AP‐42 0.1621 1.94SCR0274 AP‐42 >5% moisture (See Figure 7) 30502002 (controlled)
B. Proposed Permit Limits for PM‐10 from Wet Plant II:
730000.0 tons/month 8760000 tons/year 3.310.2762
E. Notes:
As defined in I.A. (7), (8) and (9) for sources with capture and/or control efficiencies for pollution control equipment.
*The term “capture system” for the purpose of this application means the equipment (including hoods, ducts, etc.) used to contain, capture, or transport an air contaminant to a control device. In addition, the term “capture efficiency” means the weight per unit time of an air contaminant entering a capture system and delivered to a control device, divided by the weight per unit time of the air contaminant generated by the source, expressed as a percentage. Therefore, if the emission unit is not exhausted to a control device, the capture system and capture efficiency is not applicable (NA). If the emission unit is using an emission factor with an overall emission reduction efficiency included in the factor, “AP‐42” has been assigned to the capture efficiency.
**The term “control system” for the purpose of this application means any control device or technique which is designed and operated to reduce the quantity of air contaminants emitted to the atmosphere. The term “control efficiency” means the percentage by which a control device or technique reduces the emissions from a stationary source. If the emission unit is controlled by a control device, the capture and control efficiencies are identified. If the emission unit is using an emission factor with an overall emission reduction efficiency included in the factor, “AP‐42” has been assigned to the control efficiency.
C. Emission Factor Source by Reference ID:
30502002 (controlled) AP‐42, Table 11.19.2‐2 Crushed Stone Processing and Pulverized Mineral Processing, SCC 30502002, Screening (controlled)
30502006 (controlled) AP‐42, Table 11.19.2‐2 Crushed Stone Processing and Pulverized Mineral Processing, SCC 30502006, Conveyor Transfer Point (controlled)
D. Example Calculation for Item 74:
600 tons
hour
0.00074 lb
ton * ((1 ‐ 100 % capture/100) + (1 ‐ 0 % control/100))
ton
2000 lb=
year
1.94 ton PM‐10
year
8760 Hours
Application Revision 5/14/2012, Page 82 of 131

ATTACHMENTS 1 THROUGH 4 TO APC220
Wet Plant II: Total PM2.5 Emissions (TPY): 0.52
A. PM2.5 Emissions by Equipment Unit ID (EID):
(1)Item
(3)Emission Unit Desription
(4)Max Short Term Throughput
(5)Max Annual Throughput
(6)Emission Factor
(7)* Capture
Efficiency(10)TPM
(11)TPY
(2)EID
(8)**Control
Efficiency(9)
Control Description(12)
Emission Factor Reference ID
Belt Conveyor 438000.0 tons/month 5256000 tons/year 0.000013 lb/ton AP‐42 0.0028 0.03C2772 AP‐42 >5% moisture (See Figure 1) 30502006 (controlled)
Belt Conveyor 730000.0 tons/month 8760000 tons/year 0.000013 lb/ton AP‐42 0.0047 0.06C0610 AP‐42 >12% moisture (See Figure 1) 30502006 (controlled)
Belt Conveyor 730000.0 tons/month 8760000 tons/year 0.000013 lb/ton AP‐42 0.0047 0.06C0711 AP‐42 >12% moisture (See Figure 1) 30502006 (controlled)
Belt Conveyor 730000.0 tons/month 8760000 tons/year 0.000013 lb/ton AP‐42 0.0047 0.06C0812 AP‐42 >12% moisture (See Figure 1) 30502006 (controlled)
Belt Conveyor 438000.0 tons/month 5256000 tons/year 0.000013 lb/ton AP‐42 0.0028 0.03F0476 AP‐42 >5% moisture (See Figure 1) 30502006 (controlled)
Belt Feeder 730000.0 tons/month 8760000 tons/year 0.000013 lb/ton AP‐42 0.0047 0.06F0214 AP‐42 >12% moisture (See Figure 3) 30502006 (controlled)
Feed Hopper 730000.0 tons/month 8760000 tons/year 0.000013 lb/ton AP‐42 0.0047 0.06FH0213 AP‐42 >12% moisture (See Figure 3) 30502006 (controlled)
Feed Hopper 438000.0 tons/month 5256000 tons/year 0.000013 lb/ton AP‐42 0.0028 0.03FH0475 AP‐42 >5% moisture (See Figure 3) 30502006 (controlled)
Single Deck Screen 438000.0 tons/month 5256000 tons/year 0.00005 lb/ton AP‐42 0.0110 0.13SCR0274 AP‐42 >5% moisture (See Figure 7) 30502002 (controlled)
B. Proposed Permit Limits for PM2.5 from Wet Plant II:
730000.0 tons/month 8760000 tons/year 0.520.0432
E. Notes:
As defined in I.A. (7), (8) and (9) for sources with capture and/or control efficiencies for pollution control equipment.
*The term “capture system” for the purpose of this application means the equipment (including hoods, ducts, etc.) used to contain, capture, or transport an air contaminant to a control device. In addition, the term “capture efficiency” means the weight per unit time of an air contaminant entering a capture system and delivered to a control device, divided by the weight per unit time of the air contaminant generated by the source, expressed as a percentage. Therefore, if the emission unit is not exhausted to a control device, the capture system and capture efficiency is not applicable (NA). If the emission unit is using an emission factor with an overall emission reduction efficiency included in the factor, “AP‐42” has been assigned to the capture efficiency.
**The term “control system” for the purpose of this application means any control device or technique which is designed and operated to reduce the quantity of air contaminants emitted to the atmosphere. The term “control efficiency” means the percentage by which a control device or technique reduces the emissions from a stationary source. If the emission unit is controlled by a control device, the capture and control efficiencies are identified. If the emission unit is using an emission factor with an overall emission reduction efficiency included in the factor, “AP‐42” has been assigned to the control efficiency.
C. Emission Factor Source by Reference ID:
30502002 (controlled) AP‐42, Table 11.19.2‐2 Crushed Stone Processing and Pulverized Mineral Processing, SCC 30502002, Screening (controlled)
30502006 (controlled) AP‐42, Table 11.19.2‐2 Crushed Stone Processing and Pulverized Mineral Processing, SCC 30502006, Conveyor Transfer Point (controlled)
D. Example Calculation for Item 74:
600 tons
hour
0.00005 lb
ton * ((1 ‐ 100 % capture/100) + (1 ‐ 0 % control/100))
ton
2000 lb=
year
0.13 ton PM2.5
year
8760 Hours
Application Revision 5/14/2012, Page 83 of 131

Attachment 5 to APC220: Stack Information
Item 64. Flow Diagram Designation of Exhaust Point Wet Plant II
Item 65. Description of Exhaust Point This stack ID represents fugitive sources from wet sand processing.
Item 67. Exit Diameter (feet) NA
Item 71. Average Flow Rate (acfm) NA
Item 73. Maximum Flow Rate (acfm) NA
Item 70. Average Exhaust Gas Temperature (F) NA
Item 66. Exit Height above Grade (feet) NA
Item 72. Maximum Exhaust Gas Temperature (F) NA
Item 68. Greatest Height of Nearby Building (feet) To be determined
Item 69. Distance to Nearest Property Line (feet) 300
Application Revision 5/14/2012, Page 84 of 131

STATE OF ILLINOIS
ENVIRONMENTAL PROTECTION AGENCY
DIVISION OF AIR POLLUTION CONTROL
1021 NORTH GRAND AVENUE, EAST
SPRINGFIELD, ILLINOIS 62702
IL 532-0250
APC 220 Rev. 1/27/77
* DATA AND INFORMATION
PROCESS EMISSION SOURCE
* THIS INFORMATION FORM IS TO BE COMPLETED FOR AN EMISSION SOURCE OTHER THAN A FUEL COMBUSTION EMISSION SOURCE OR AN
INCINERATOR. A FUEL COMBUSTION EMISSION SOURCE IS A FURNACE, BOILER, OR SIMILAR EQUIPMENT USED PRIMARILY FOR
PRODUCING HEAT OR POWER BY INDIRECT HEAT TRANSFER. AN INCINERATOR IS AN APPARATUS IN WHICH REFUSE IS BURNED.
1. NAME OF PLANT OWNER:
2. NAME OF CORPORATE DIVISION OR PLANT (IF DIFFERENT FROM
OWNER):
3. STREET ADDRESS OF EMISSION SOURCE:
4. CITY OF EMISSION SOURCE:
GENERAL INFORMATION
5. NAME OF PROCESS:
6. NAME OF EMISSION SOURCE EQUIPMENT:
7. EMISSION SOURCE EQUIPMENT MANUFACTURER:
8. MODEL NUMBER:
9. SERIAL NUMBER:
10. FLOW DIAGRAM DESIGNATION(S) OF EMISSION SOURCE:
11. IDENTITY(S) OF ANY SIMILAR SOURCE(S) AT THE PLANT OR PREMISES NOT COVERED BY THE FORM (IF THE SOURCE IS COVERED BY
ANOTHER APPLICATION, IDENTIFY THE APPLICATION):
12. AVERAGE OPERATING TIME OF EMISSION SOURCE:
_________ HRS/DAY _________ DAYS/WK _________ WKS/YR
13. MAXIMUM OPERATING TIME OF EMISSION SOURCE:
_________ HRS/DAY _________ DAYS/WK _________ WKS/YR
14. PERCENT OF ANNUAL THROUGHPUT:
DEC-FEB ____________ % MAR-MAY ____________ % JUN-AUG ____________ % SEPT-NOV ____________ %
INSTRUCTIONS
1. COMPLETE THE ABOVE IDENTIFICATION AND GENERAL INFORMATION SECTION.
2. COMPLETE THE RAW MATERIAL, PRODUCT, WASTE MATERIAL, AND FUEL USAGE SECTIONS FOR THE PARTICULAR SOURCE EQUIPMENT.
COMPOSITIONS OF MATERIALS MUST BE SUFFICIENTLY DETAILED TO ALLOW DETERMINATION OF THE NATURE AND QUANTITY OF
POTENTIAL EMISSIONS. IN PARTICULAR, THE COMPOSITION OF PAINTS, INKS, ETC., AND ANY SOLVENTS MUST BE FULLY DETAILED.
3. EMISSION AND EXHAUST POINT INFORMATION MUST BE COMPLETED, UNLESS EMISSIONS ARE EXHAUSTED THROUGH AIR POLLUTION
CONTROL EQUIPMENT.
4. OPERATION TIME AND CERTAIN OTHER ITEMS REQUIRE BOTH AVERAGE AND MAXIMUM VALUES
5. FOR GENERAL INFORMATION REFER TO “GENERAL INSTRUCTIONS FOR PERMIT APPLICATIONS,” APC-201.
DEFINITIONS
AVERAGE - THE VALUE THAT SUMMARIZES OR REPRESENTS THE GENERAL CONDITION OF THE EMISSION SOURCE, OR THE GENERAL STATE
OF PRODUCTION OF THE EMISSION SOURCE. SPECIFICALLY:
AVERAGE OPERATING TIME - ACTUAL TOTAL HOURS OF OPERATION FOR THE PRECEDING TWELVE MONTH PERIOD.
AVERAGE RATE - ACTUAL TOTAL QUANTITY OF “MATERIAL” FOR THE PRECEDING TWELVE MONTH PERIOD, DIVIDED BY THE AVERAGE
OPERATING TIME.
AVERAGE OPERATION - OPERATION TYPICAL OF THE PRECEDING TWELVE MONTH PERIOD, AS REPRESENTED BY AVERAGE OPERATING
TIME AND AVERAGE RATES.
MAXIMUM - THE GREATEST VALUE ATTAINABLE OR ATTAINED FOR THE EMISSION SOURCE, OR THE PERIOD OF GREATEST OR UTMOST
PRODUCTION OF THE EMISSION SOURCE. SPECIFICALLY:
MAXIMUM OPERATING TIME - GREATEST EXPECTED TOTAL HOURS OF OPERATIONS FOR ANY TWELVE MONTH PERIOD.
MAXIMUM RATE - GREATEST QUANTITY OF “MATERIAL” EXPECTED PER ANY ONE HOUR OF OPERATION.
MAXIMUM OPERATION - GREATEST EXPECTED OPERATION, AS REPRESENTED BY MAXIMUM OPERATING TIME AND MAXIMUM RATES.
This Agency is authorized to require this information under Illinois Revised Statutes, 1979, Chapter 111 1/2, Section 1039. Disclosure of this information is required
under that Section. Failure to do so may prevent this form from being processed and could result in your application being denied. This form has been approved by the
Forms Management Center.
Mississippi Sand, LLC. Same as Owner
2320 Creve Coeur Mill Rd LaSalle County, Ottawa Township
Dry Sand Processes See Attachment 1 to APC 260
-- -- --
--
--
-- -- -- -- -- --
-- -- -- --
Application Revision 5/14/2012, Page 85 of 131

APC 220
RAW MATERIAL INFORMATION
NAME OF RAW MATERIAL
AVERAGE RATE
PER IDENTICAL SOURCE
MAXIMUM RATE
PER IDENTICAL SOURCE
20a. b.
LB/HR
c.
LB/HR
21a. b.
LB/HR
c.
LB/HR
22a. b.
LB/HR
c.
LB/HR
23a. b.
LB/HR
c.
LB/HR
24a. b.
LB/HR
c.
LB/HR
PRODUCT INFORMATION
NAME OF PRODUCT
AVERAGE RATE
PER IDENTICAL SOURCE
MAXIMUM RATE
PER IDENTICAL SOURCE
30a. b.
LB/HR
c.
LB/HR
31a. b.
LB/HR
c.
LB/HR
32a. b.
LB/HR
c.
LB/HR
33a. b.
LB/HR
c.
LB/HR
34a. b.
LB/HR
c.
LB/HR
WASTE MATERIAL INFORMATION
NAME OF WASTE MATERIAL
AVERAGE RATE
PER IDENTICAL SOURCE
MAXIMUM RATE
PER IDENTICAL SOURCE
40a. b.
LB/HR
c.
LB/HR
41a. b.
LB/HR
c.
LB/HR
42a. b.
LB/HR
c.
LB/HR
43a. b.
LB/HR
c.
LB/HR
44a. b.
LB/HR
c.
LB/HR
*FUEL USAGE INFORMATION
FUEL USED TYPE HEAT CONTENT
50a. NATURAL GAS b. ----------------------------- c. 1000 BTU/SCF
OTHER GAS BTU/SCF
OIL BTU/GAL
COAL BTU/LB
OTHER BTU/LB
d. AVERAGE FIRING RATE PER IDENTICAL SOURCE:
BTU/HR
e. MAXIMUM FIRING RATE PER IDENTICAL SOURCE:
BTU/HR
*THIS SECTION IS TO BE COMPLETED FOR ANY FUEL USED DIRECTLY IN THE PROCESS EMISSION SOURCE, E. G. GAS IN A DRYER, OR COAL IN
A MELT FURNACE.
See Attachment 2 to APC 260 -- --
See Attachment 3 to APC 260 -- --
NA -- --
NA NA
Application Revision 5/14/2012, Page 86 of 131

Page ______ of ______
APC 220
*EMISSION INFORMATION
51. NUMBER OF IDENTICAL SOURCES (DESCRIBE AS REQUIRED):
AVERAGE OPERATION
CONTAMINANT
CONCENTRATION OR EMISSION RATE PER IDENTICAL
SOURCE
METHOD USED TO DETERMINE CONCENTRATION OR
EMISSION RATE
PARTICULATE
MATTER
52a.
GR/SCF
b.
LB/HR
c.
CARBON
MONOXIDE
53a. PPM
(VOL)
b.
LB/HR
c.
NITROGEN
OXIDES
54a. PPM
(VOL)
b.
LB/HR
c.
ORGANIC
MATERIAL
55a. PPM
(VOL)
b.
LB/HR
c.
SULFUR
DIOXIDE
56a. PPM
(VOL)
b.
LB/HR
c.
**OTHER
(SPECIFY)
57a. PPM
(VOL)
b.
LB/HR
c.
MAXIMUM OPERATION
CONTAMINANT
CONCENTRATION OR EMISSION RATE PER IDENTICAL
SOURCE
METHOD USED TO DETERMINE CONCENTRATION OR
EMISSION RATE
PARTICULATE
MATTER
58a.
GR/SCF
b.
LB/HR
c.
CARBON
MONOXIDE
59a. PPM
(VOL)
b.
LB/HR
c.
NITROGEN
OXIDES
60a. PPM
(VOL)
b.
LB/HR
c.
ORGANIC
MATERIAL
61a. PPM
(VOL)
b.
LB/HR
c.
SULFUR
DIOXIDE
62a. PPM
(VOL)
b.
LB/HR
c.
**OTHER
(SPECIFY)
63a. PPM
(VOL)
b.
LB/HR
c.
*ITEMS 52 THROUGH 63 NEED NOT BE COMPLETED IF EMISSIONS ARE EXHAUSTED THROUGH AIR POLLUTION CONTROL EQUIPMENT.
**“OTHER” CONTAMINANT SHOULD BE USED FOR AN AIR CONTAMINANT NOT SPECIFICALLY NAMED ABOVE. POSSIBLE OTHER
CONTAMINANTS ARE ASBESTOS, BERYLLIUM, MERCURY, VINYL CHLORIDE, LEAD, ETC.
***EXHAUST POINT INFORMATION
64. FLOW DIAGRAM DESIGNATION(S) OF EXHAUST POINT:
65. DESCRIPTION OF EXHAUST POINT (LOCATION IN RELATION TO BUILDINGS, DIRECTION, HOODING, ETC.):
66. EXIT HEIGHT ABOVE GRADE: 67. EXIT DIAMETER:
68. GREATEST HEIGHT OF NEARBY BUILDINGS: 69. EXIT DISTANCE FROM NEAREST PLANT BOUNDARY:
AVERAGE OPERATION MAXIMUM OPERATION
70. EXIT GAS TEMPERATURE:
�F
72. EXIT GAS TEMPERATURE:
�F
71. GAS FLOW RATE THROUGH EACH EXIT:
ACFM
73. GAS FLOW RATE THROUGH EACH EXIT:
ACFM
***THIS SECTION SHOULD NOT BE COMPLETED IF EMISSIONS ARE EXHAUSTED THROUGH AIR POLLUTION CONTROL EQUIPMENT.
See Attachment 4 to APC 260
-- -- --
-- -- --
See Attachment 5 to APC 260
--
-- --
-- --
--
--
--
--
Application Revision 5/14/2012, Page 87 of 131

STATE OF ILLINOIS
ENVIRONMENTAL PROTECTION AGENCY
DIVISION OF AIR POLLUTION CONTROL
1021 NORTH GRAND AVENUE, EAST
SPRINGFIELD, ILLINOIS 62702
Page ______ of ______
IL 532-0260
APC 260 Rev. 12/15/78
* DATA AND INFORMATION
AIR POLLUTION CONTROL EQUIPMENT
* THIS INFORMATION FORM IS TO BE COMPLETED FOR AN EMISSION SOURCE OTHER THAN A FUEL COMBUSTION EMISSION SOURCE OR AN
INCINERATOR. A FUEL COMBUSTION EMISSION SOURCE IS A FURNACE, BOILER, OR SIMILAR EQUIPMENT USED PRIMARILY FOR
PRODUCING HEAT OR POWER BY INDIRECT HEAT TRANSFER. AN INCINERATOR IS AN APPARATUS IN WHICH REFUSE IS BURNED.
1. NAME OF OWNER:
2. NAME OF CORPORATE DIVISION OR PLANT (IF DIFFERENT FROM
OWNER):
3. STREET ADDRESS OF CONTROL EQUIPMENT:
4. CITY OF CONTROL EQUIPMENT
5. NAME OF CONTROL EQUIPMENT OR CONTROL SYSTEM:
INSTRUCTIONS
1. COMPLETE THE ABOVE IDENTIFICATION SECTION.
2. COMPLETE THE APPROPRIATE SECTION FOR THE UNIT OF CONTROL EQUIPMENT, OR THE APPROPRIATE SECTIONS FOR THE CONTROL
SYSTEM. BE CERTAIN THAT THE ARRANGEMENT OF VARIOUS UNITS IN A CONTROL SYSTEM IS MADE CLEAR IN THE PROCESS FLOW
DIAGRAM.
3. COMPLETE PAGE 6 OF THIS FORM, EMISSION INFORMATION AND EXHAUST POINT INFORMATION.
4. EFFICIENCY VALUES SHOULD BE SUPPORTED WITH A DETAILED EXPLANATION OF THE METHOD OF CALCULATION, THE MANNER OF
ESTIMATION, OR THE SOURCE OF INFORMATION. REFERENCE TO THIS FORM ANY RELEVANT INFORMATION OR EXPLANATION
INCLUDED IN THIS PERMIT APPLICATION.
5. EFFICIENCY VALUES AND CERTAIN OTHER ITEMS OF INFORMATION ARE TO BE GIVEN FOR AVERAGE AND MAXIMUM OPERATION OR
THE SOURCE EQUIPMENT. FOR EXAMPLE, “MAXIMUM EFFICIENCY” IS THE EFFICIENCY OF THE CONTROL EQUIPMENT WHEN THE
SOURCE IS AT MAXIMUM OPERATION, AND “AVERAGE FLOW RATE” IS THE FLOW RATE INTO HE CONTROL EQUIPMENT WHEN THE
SOURCE IS AT AVERAGE OPERATION.
6. FOR GENERAL INFORMATION REFER TO “GENERAL INSTRUCTIONS FOR PERMIT APPLICATIONS,” APC-201.
DEFINITIONS
AVERAGE - THE VALUE THAT SUMMARIZES OR REPRESENTS THE GENERAL CONDITION OF THE EMISSION SOURCE, OR THE GENERAL
STATE OF PRODUCTION OF THE EMISSION SOURCE. SPECIFICALLY:
AVERAGE OPERATION - OPERATION TYPICAL OF THE PRECEDING TWELVE MONTH PERIOD, AS REPRESENTED BY AVERAGE OPERATING
TIME AND AVERAGE RATES.
MAXIMUM - THE GREATEST VALUE ATTAINABLE OR ATTAINED FOR THE EMISSION SOURCE, OR THE PERIOD OF GREATEST OR UTMOST
PRODUCTION OF THE EMISSION SOURCE. SPECIFICALLY:
MAXIMUM OPERATION - GREATEST EXPECTED OPERATION, AS REPRESENTED BY MAXIMUM OPERATING TIME AND MAXIMUM RATES.
This Agency is authorized to require this information under Illinois Revised Statutes, 1979, Chapter 111 1/2, Section 1039. Disclosure of this information is required
under that Section. Failure to do so may prevent this form from being processed and could result in your application being denied. This form has been approved by the
Forms Management Center.
Mississippi Sand, LLC. Same as Owner
2320 Creve Coeur Mill Rd LaSalle County, Ottawa Township
Baghouse (Fabric Filter) Dust Collector
Application Revision 5/14/2012, Page 88 of 131

IL 532-0260
APC 260
EMISSION INFORMATION
1. NUMBER OF IDENTICAL CONTROL UNITS OR CONTROL SYSTEMS (DESCRIBE AS REQUIRED):
AVERAGE OPERATION
CONTAMINANT
CONCENTRATION OR EMISSION RATE PER IDENTICAL
CONTROL UNITS OR CONTROL SYSTEM
METHOD USED TO DETERMINE CONCENTRATION OR
EMISSION RATE
PARTICULATE
MATTER
2a.
GR/SCF
b.
LB/HR
c.
CARBON
MONOXIDE
3a. PPM
(VOL)
b.
LB/HR
c.
NITROGEN
OXIDES
4a. PPM
(VOL)
b.
LB/HR
c.
ORGANIC
MATERIAL
5a. PPM
(VOL)
b.
LB/HR
c.
SULFUR
DIOXIDE
6a. PPM
(VOL)
b.
LB/HR
c.
**OTHER
(SPECIFY)
7a. PPM
(VOL)
b.
LB/HR
c.
MAXIMUM OPERATION
CONTAMINANT
CONCENTRATION OR EMISSION RATE PER IDENTICAL
CONTROL UNITS OR CONTROL SYSTEM
METHOD USED TO DETERMINE CONCENTRATION OR
EMISSION RATE
PARTICULATE
MATTER
8a.
GR/SCF
b.
LB/HR
c.
CARBON
MONOXIDE
9a. PPM
(VOL)
b.
LB/HR
c.
NITROGEN
OXIDES
10a. PPM
(VOL)
b.
LB/HR
c.
ORGANIC
MATERIAL
11a. PPM
(VOL)
b.
LB/HR
c.
SULFUR
DIOXIDE
12a. PPM
(VOL)
b.
LB/HR
c.
**OTHER
(SPECIFY)
13a. PPM
(VOL)
b.
LB/HR
c.
**“OTHER” CONTAMINANT SHOULD BE USED FOR AN AIR CONTAMINANT NOT SPECIFICALLY NAMED ABOVE. POSSIBLE OTHER
CONTAMINANTS ARE ASBESTOS, BERYLLIUM, MERCURY, VINYL CHLORIDE, LEAD, ETC.
EXHAUST POINT INFORMATION
1. FLOW DIAGRAM DESIGNATION(S) OF EXHAUST POINT:
2. DESCRIPTION OF EXHAUST POINT (LOCATION IN RELATION TO BUILDINGS, DIRECTION, HOODING, ETC.):
3. EXIT HEIGHT ABOVE GRADE: 4. EXIT DIAMETER:
5. GREATEST HEIGHT OF NEARBY BUILDINGS: 6. EXIT DISTANCE FROM NEAREST PLANT BOUNDARY:
AVERAGE OPERATION MAXIMUM OPERATION
7. EXIT GAS TEMPERATURE:
�F
9. EXIT GAS TEMPERATURE:
�F
8. GAS FLOW RATE THROUGH EACH EXIT:
ACFM
10. GAS FLOW RATE THROUGH EACH EXIT:
ACFM
See Attachment 4 to APC 260
See Attachment 5 to APC 260
Application Revision 5/14/2012, Page 89 of 131

IL 532-0260
APC 260
FILTER UNIT
1. FLOW DIAGRAM DESIGNATION(S) OF FILTER UNIT:
2. MANUFACTURER: 3. MODEL NAME AND NUMBER:
4. FILTERING MATERIAL: 5. FILTERING AREA:
FT2
6. CLEANING METHOD:
SHAKER REVERSE AIR PULSE AIR PULSE JET OTHER: SPECIFY ____________________
7. GAS COOLING METHOD: DUCT WORK: LENGTH _____________ FT., DIAM _____________ IN.
BLEED-IN AIR WATER SPRAY OTHER: SPECIFY ____________________
AVERAGE OPERATION OF SOURCE MAXIMUM OPERATION OF SOURCE
8. GAS FLOW RATE (FROM SOURCE):
SCFM
12. GAS FLOW RATE (FROM SOURCE):
SCFM
9. GAS COOLING FLOW RATE:
BLEED-IN AIR _________ SCFM, WATER SPRAY _________ GPM
13. GAS COOLING FLOW RATE:
BLEED-IN AIR _________ SCFM, WATER SPRAY _________ GPM
10. INLET GAS CONDITION:
TEMPERATURE _________ �F DEWPOINT _________ �F
14. INLET GAS CONDITION:
TEMPERATURE _________ �F DEWPOINT _________ �F
11. EFFICIENCY OF FILTER UNIT (SEE INSTRUCTION 4):
%
15. EFFICIENCY OF FILTER UNIT (SEE INSTRUCTION 4):
%
BGH02
To be determined (TBD) TBD
TBD TBD
NA
20800 20800
-- -- -- -
250 -- 250 --
99.9 99.9
Application Revision 5/14/2012, Page 90 of 131

ATTACHMENTS 1 THROUGH 4 TO APC260
Dry Sand Processes: Total PM Emissions (TPY): 58.67
A. PM Emissions by Equipment Unit ID (EID):
(1)Item
(3)Emission Unit Desription
(4)Max Short Term Throughput
(5)Max Annual Throughput
(6)Emission Factor
(7)* Capture
Efficiency(10)TPM
(11)TPY
(2)EID
(8)**Control
Efficiency(9)
Control Description(12)
Emission Factor Reference ID
Belt Conveyor 146000.0 tons/month 1752000 tons/year 0 lb/ton 100 0.0000 0.00C28106 0 Controlled by BH02 (See Figure 10) NONE
Belt Conveyor 146000.0 tons/month 1752000 tons/year 0 lb/ton 100 0.0000 0.00C30111 0 Controlled by BH02 (See Figure 10) NONE
Belt Conveyor 219000.0 tons/month 2628000 tons/year 0.00014 lb/ton AP‐42 0.0153 0.18C31112 AP‐42 Covered (See Figure 9) 30502006 (controlled)
Belt Conveyor 146000.0 tons/month 1752000 tons/year 0 lb/ton 100 0.0000 0.00C32120 0 Controlled by BH02 (See Figure 10) NONE
Belt Conveyor 219000.0 tons/month 2628000 tons/year 0.00014 lb/ton AP‐42 0.0153 0.18C33121 AP‐42 Covered (See Figure 9) 30502006 (controlled)
Belt Conveyor 219000.0 tons/month 2628000 tons/year 0.00014 lb/ton AP‐42 0.0153 0.18C34135 AP‐42 Covered (See Figure 10) 30502006 (controlled)
Belt Conveyor 219000.0 tons/month 2628000 tons/year 0 lb/ton 100 0.0000 0.00C35143 0 Controlled by BH02 (See Figure 10) NONE
Belt Conveyor 219000.0 tons/month 2628000 tons/year 0.00014 lb/ton AP‐42 0.0153 0.18C36146 AP‐42 Covered (See Figure 9) 30502006 (controlled)
Belt Conveyor 219000.0 tons/month 2628000 tons/year 0.00014 lb/ton AP‐42 0.0153 0.18C37153 AP‐42 Covered (See Figure 9) 30502006 (controlled)
Belt Conveyor 219000.0 tons/month 2628000 tons/year 0 lb/ton 100 0.0000 0.00C38160 0 Controlled by BH02 (See Figure 10) NONE
Belt Conveyor 146000.0 tons/month 1752000 tons/year 0.00052 lb/ton 100 0.0380 0.46C29107 0 Covered & controlled by bin vent dust collector (See Figure 4)
RadialStacker
Belt Feeder 97090.0 tons/month 1165080 tons/year 0 lb/ton 100 0.0000 0.00F0596 0 Controlled by BH02 (See Figure 10) NONE
Belt Feeder 97090.0 tons/month 1165080 tons/year 0 lb/ton 100 0.0000 0.00F0698 0 Controlled by BH02 (See Figure 10) NONE
Belt Feeder 97090.0 tons/month 1165080 tons/year 0 lb/ton 100 0.0000 0.00F07100 0 Controlled by BH02 (See Figure 10) NONE
Belt Feeder 219000.0 tons/month 2628000 tons/year 0 lb/ton 100 0.0000 0.00F08117 0 Controlled by BH02 (See Figure 10) NONE
Belt Feeder 219000.0 tons/month 2628000 tons/year 0 lb/ton 100 0.0000 0.00F09126 0 Controlled by BH02 (See Figure 10) NONE
Bucket Elevator 292000.0 tons/month 3504000 tons/year 0.00014 lb/ton AP‐42 0.0204 0.25BE0192 AP‐42 Covered (See Figure 9) 30502006 (controlled)
Bucket Elevator 219000.0 tons/month 2628000 tons/year 0.00014 lb/ton AP‐42 0.0153 0.18BE02113 AP‐42 Covered (See Figure 9) 30502006 (controlled)
Bucket Elevator 219000.0 tons/month 2628000 tons/year 0.00014 lb/ton AP‐42 0.0153 0.18BE03122 AP‐42 Covered (See Figure 9) 30502006 (controlled)
Bucket Elevator 219000.0 tons/month 2628000 tons/year 0.00014 lb/ton AP‐42 0.0153 0.18BE04136 AP‐42 Covered (See Figure 9) 30502006 (controlled)
Bucket Elevator 219000.0 tons/month 2628000 tons/year 0.00014 lb/ton AP‐42 0.0153 0.18BE05144 AP‐42 Covered (See Figure 9) 30502006 (controlled)
Bucket Elevator 219000.0 tons/month 2628000 tons/year 0.00014 lb/ton AP‐42 0.0153 0.18BE06161 AP‐42 Covered (See Figure 9) 30502006 (controlled)
Dry Screen 97090.0 tons/month 1165080 tons/year 0 lb/ton 100 0.0000 0.00SCR03103 0 Controlled by BH02 (See Figure 10) NONE
Dry Screen 97090.0 tons/month 1165080 tons/year 0 lb/ton 100 0.0000 0.00SCR04104 0 Controlled by BH02 (See Figure 10) NONE
Dry Screen 97090.0 tons/month 1165080 tons/year 0 lb/ton 100 0.0000 0.00SCR05105 0 Controlled by BH02 (See Figure 10) NONE
Dry Screen 219000.0 tons/month 2628000 tons/year 0 lb/ton 100 0.0000 0.00SCR06119 0 Controlled by BH02 (See Figure 10) NONE
Dry Screen 219000.0 tons/month 2628000 tons/year 0 lb/ton 100 0.0000 0.00SCR07128 0 Controlled by BH02 (See Figure 10) NONE
Feed Hopper 292000.0 tons/month 3504000 tons/year 0.0099 lb/ton 100 1.4454 17.34FH0593 0 Covered & controlled by bin vent dust collector (See Figure 8)
30503813
Feed Hopper 219000.0 tons/month 2628000 tons/year 0.0099 lb/ton 100 1.0841 13.01FH06114 0 Covered & controlled by bin vent dust collector (See Figure 8)
30503813
Feed Hopper 219000.0 tons/month 2628000 tons/year 0.0099 lb/ton 100 1.0841 13.01FH07123 0 Covered & controlled by bin vent dust collector (See Figure 8)
30503813
Screening Baghouse 1489.2 million dscf/month 17870.4 million dscf/year 1428.5 lb/million dscf 100 1.0637 12.76BGH02129 99.9 .005 gr/[email protected] microns or > BH02
Application Revision 5/14/2012, Page 91 of 131

ATTACHMENTS 1 THROUGH 4 TO APC260
Dry Sand Processes: Total PM Emissions (TPY): 58.67
A. PM Emissions by Equipment Unit ID (EID):
(1)Item
(3)Emission Unit Desription
(4)Max Short Term Throughput
(5)Max Annual Throughput
(6)Emission Factor
(7)* Capture
Efficiency(10)TPM
(11)TPY
(2)EID
(8)**Control
Efficiency(9)
Control Description(12)
Emission Factor Reference ID
B. Proposed Permit Limits for PM from Dry Sand Processes:
97090.0 tons/month 3504000 tons/year 58.674.8889
E. Notes:
As defined in I.A. (7), (8) and (9) for sources with capture and/or control efficiencies for pollution control equipment.
*The term “capture system” for the purpose of this application means the equipment (including hoods, ducts, etc.) used to contain, capture, or transport an air contaminant to a control device. In addition, the term “capture efficiency” means the weight per unit time of an air contaminant entering a capture system and delivered to a control device, divided by the weight per unit time of the air contaminant generated by the source, expressed as a percentage. Therefore, if the emission unit is not exhausted to a control device, the capture system and capture efficiency is not applicable (NA). If the emission unit is using an emission factor with an overall emission reduction efficiency included in the factor, “AP‐42” has been assigned to the capture efficiency.
**The term “control system” for the purpose of this application means any control device or technique which is designed and operated to reduce the quantity of air contaminants emitted to the atmosphere. The term “control efficiency” means the percentage by which a control device or technique reduces the emissions from a stationary source. If the emission unit is controlled by a control device, the capture and control efficiencies are identified. If the emission unit is using an emission factor with an overall emission reduction efficiency included in the factor, “AP‐42” has been assigned to the control efficiency.
C. Emission Factor Source by Reference ID:
30502006 (controlled) AP‐42, Table 11.19.2‐2 Crushed Stone Processing and Pulverized Mineral Processing, SCC 30502006, Conveyor Transfer Point (controlled)
30503813 AP‐42, Table 11.19.2‐4 Crushed Stone Processing and Pulverized Mineral Processing, SCC 30503813, Product Storage with Fabric Filter Control
BH02 Proposed limit of 0.01 grains per dry standard cubic foot of exhaust
NONE Controlled by Baghouse (see Emission Unit ID BGH02 for emissions)
RadialStacker AP‐42 ‐ Section 13.2.4 Aggregate Handling & Storage Piles; Batch/Continuous Drop Equation (1)
D. Example Calculation for Item 129:
2.04 million dscf
hour
1428.5 lb
million dscf* ((1 ‐ 100 % capture/100) + (1 ‐ 99.9 % control/100))
ton
2000 lb=
year
12.76 ton PM
year
8760 Hours
Application Revision 5/14/2012, Page 92 of 131

ATTACHMENTS 1 THROUGH 4 TO APC260
Dry Sand Processes: Total PM‐10 Emissions (TPY): 20.68
A. PM‐10 Emissions by Equipment Unit ID (EID):
(1)Item
(3)Emission Unit Desription
(4)Max Short Term Throughput
(5)Max Annual Throughput
(6)Emission Factor
(7)* Capture
Efficiency(10)TPM
(11)TPY
(2)EID
(8)**Control
Efficiency(9)
Control Description(12)
Emission Factor Reference ID
Belt Conveyor 146000.0 tons/month 1752000 tons/year 0 lb/ton 100 0.0000 0.00C28106 0 Controlled by BH02 (See Figure 10) NONE
Belt Conveyor 146000.0 tons/month 1752000 tons/year 0 lb/ton 100 0.0000 0.00C30111 0 Controlled by BH02 (See Figure 10) NONE
Belt Conveyor 219000.0 tons/month 2628000 tons/year 0.000046 lb/ton AP‐42 0.0050 0.06C31112 AP‐42 Covered (See Figure 9) 30502006 (controlled)
Belt Conveyor 146000.0 tons/month 1752000 tons/year 0 lb/ton 100 0.0000 0.00C32120 0 Controlled by BH02 (See Figure 10) NONE
Belt Conveyor 219000.0 tons/month 2628000 tons/year 0.000046 lb/ton AP‐42 0.0050 0.06C33121 AP‐42 Covered (See Figure 9) 30502006 (controlled)
Belt Conveyor 219000.0 tons/month 2628000 tons/year 0.000046 lb/ton AP‐42 0.0050 0.06C34135 AP‐42 Covered (See Figure 10) 30502006 (controlled)
Belt Conveyor 219000.0 tons/month 2628000 tons/year 0 lb/ton 100 0.0000 0.00C35143 0 Controlled by BH02 (See Figure 10) NONE
Belt Conveyor 219000.0 tons/month 2628000 tons/year 0.000046 lb/ton AP‐42 0.0050 0.06C36146 AP‐42 Covered (See Figure 9) 30502006 (controlled)
Belt Conveyor 219000.0 tons/month 2628000 tons/year 0.000046 lb/ton AP‐42 0.0050 0.06C37153 AP‐42 Covered (See Figure 9) 30502006 (controlled)
Belt Conveyor 219000.0 tons/month 2628000 tons/year 0 lb/ton 100 0.0000 0.00C38160 0 Controlled by BH02 (See Figure 10) NONE
Belt Conveyor 146000.0 tons/month 1752000 tons/year 0.00025 lb/ton 100 0.0183 0.22C29107 0 Covered & controlled by bin vent dust collector (See Figure 4)
RadialStacker
Belt Feeder 97090.0 tons/month 1165080 tons/year 0 lb/ton 100 0.0000 0.00F0596 0 Controlled by BH02 (See Figure 10) NONE
Belt Feeder 97090.0 tons/month 1165080 tons/year 0 lb/ton 100 0.0000 0.00F0698 0 Controlled by BH02 (See Figure 10) NONE
Belt Feeder 97090.0 tons/month 1165080 tons/year 0 lb/ton 100 0.0000 0.00F07100 0 Controlled by BH02 (See Figure 10) NONE
Belt Feeder 219000.0 tons/month 2628000 tons/year 0 lb/ton 100 0.0000 0.00F08117 0 Controlled by BH02 (See Figure 10) NONE
Belt Feeder 219000.0 tons/month 2628000 tons/year 0 lb/ton 100 0.0000 0.00F09126 0 Controlled by BH02 (See Figure 10) NONE
Bucket Elevator 292000.0 tons/month 3504000 tons/year 0.000046 lb/ton AP‐42 0.0067 0.08BE0192 AP‐42 Covered (See Figure 9) 30502006 (controlled)
Bucket Elevator 219000.0 tons/month 2628000 tons/year 0.000046 lb/ton AP‐42 0.0050 0.06BE02113 AP‐42 Covered (See Figure 9) 30502006 (controlled)
Bucket Elevator 219000.0 tons/month 2628000 tons/year 0.000046 lb/ton AP‐42 0.0050 0.06BE03122 AP‐42 Covered (See Figure 9) 30502006 (controlled)
Bucket Elevator 219000.0 tons/month 2628000 tons/year 0.000046 lb/ton AP‐42 0.0050 0.06BE04136 AP‐42 Covered (See Figure 9) 30502006 (controlled)
Bucket Elevator 219000.0 tons/month 2628000 tons/year 0.000046 lb/ton AP‐42 0.0050 0.06BE05144 AP‐42 Covered (See Figure 9) 30502006 (controlled)
Bucket Elevator 219000.0 tons/month 2628000 tons/year 0.000046 lb/ton AP‐42 0.0050 0.06BE06161 AP‐42 Covered (See Figure 9) 30502006 (controlled)
Dry Screen 97090.0 tons/month 1165080 tons/year 0 lb/ton 100 0.0000 0.00SCR03103 0 Controlled by BH02 (See Figure 10) NONE
Dry Screen 97090.0 tons/month 1165080 tons/year 0 lb/ton 100 0.0000 0.00SCR04104 0 Controlled by BH02 (See Figure 10) NONE
Dry Screen 97090.0 tons/month 1165080 tons/year 0 lb/ton 100 0.0000 0.00SCR05105 0 Controlled by BH02 (See Figure 10) NONE
Dry Screen 219000.0 tons/month 2628000 tons/year 0 lb/ton 100 0.0000 0.00SCR06119 0 Controlled by BH02 (See Figure 10) NONE
Dry Screen 219000.0 tons/month 2628000 tons/year 0 lb/ton 100 0.0000 0.00SCR07128 0 Controlled by BH02 (See Figure 10) NONE
Feed Hopper 292000.0 tons/month 3504000 tons/year 0.0016 lb/ton 100 0.2336 2.80FH0593 0 Covered & controlled by bin vent dust collector (See Figure 8)
30503813
Feed Hopper 219000.0 tons/month 2628000 tons/year 0.0016 lb/ton 100 0.1752 2.10FH06114 0 Covered & controlled by bin vent dust collector (See Figure 8)
30503813
Feed Hopper 219000.0 tons/month 2628000 tons/year 0.0016 lb/ton 100 0.1752 2.10FH07123 0 Covered & controlled by bin vent dust collector (See Figure 8)
30503813
Screening Baghouse 1489.2 million dscf/month 17870.4 million dscf/year 1428.5 lb/million dscf 100 1.0637 12.76BGH02129 99.9 .005 gr/[email protected] microns or > BH02
Application Revision 5/14/2012, Page 93 of 131

ATTACHMENTS 1 THROUGH 4 TO APC260
Dry Sand Processes: Total PM‐10 Emissions (TPY): 20.68
A. PM‐10 Emissions by Equipment Unit ID (EID):
(1)Item
(3)Emission Unit Desription
(4)Max Short Term Throughput
(5)Max Annual Throughput
(6)Emission Factor
(7)* Capture
Efficiency(10)TPM
(11)TPY
(2)EID
(8)**Control
Efficiency(9)
Control Description(12)
Emission Factor Reference ID
B. Proposed Permit Limits for PM‐10 from Dry Sand Processes:
97090.0 tons/month 3504000 tons/year 20.681.7230
E. Notes:
As defined in I.A. (7), (8) and (9) for sources with capture and/or control efficiencies for pollution control equipment.
*The term “capture system” for the purpose of this application means the equipment (including hoods, ducts, etc.) used to contain, capture, or transport an air contaminant to a control device. In addition, the term “capture efficiency” means the weight per unit time of an air contaminant entering a capture system and delivered to a control device, divided by the weight per unit time of the air contaminant generated by the source, expressed as a percentage. Therefore, if the emission unit is not exhausted to a control device, the capture system and capture efficiency is not applicable (NA). If the emission unit is using an emission factor with an overall emission reduction efficiency included in the factor, “AP‐42” has been assigned to the capture efficiency.
**The term “control system” for the purpose of this application means any control device or technique which is designed and operated to reduce the quantity of air contaminants emitted to the atmosphere. The term “control efficiency” means the percentage by which a control device or technique reduces the emissions from a stationary source. If the emission unit is controlled by a control device, the capture and control efficiencies are identified. If the emission unit is using an emission factor with an overall emission reduction efficiency included in the factor, “AP‐42” has been assigned to the control efficiency.
C. Emission Factor Source by Reference ID:
30502006 (controlled) AP‐42, Table 11.19.2‐2 Crushed Stone Processing and Pulverized Mineral Processing, SCC 30502006, Conveyor Transfer Point (controlled)
30503813 AP‐42, Table 11.19.2‐4 Crushed Stone Processing and Pulverized Mineral Processing, SCC 30503813, Product Storage with Fabric Filter Control
BH02 Proposed limit of 0.01 grains per dry standard cubic foot of exhaust
NONE Controlled by Baghouse (see Emission Unit ID BGH02 for emissions)
RadialStacker AP‐42 ‐ Section 13.2.4 Aggregate Handling & Storage Piles; Batch/Continuous Drop Equation (1)
D. Example Calculation for Item 129:
2.04 million dscf
hour
1428.5 lb
million dscf* ((1 ‐ 100 % capture/100) + (1 ‐ 99.9 % control/100))
ton
2000 lb=
year
12.76 ton PM‐10
year
8760 Hours
Application Revision 5/14/2012, Page 94 of 131

ATTACHMENTS 1 THROUGH 4 TO APC260
Dry Sand Processes: Total PM2.5 Emissions (TPY): 15.59
A. PM2.5 Emissions by Equipment Unit ID (EID):
(1)Item
(3)Emission Unit Desription
(4)Max Short Term Throughput
(5)Max Annual Throughput
(6)Emission Factor
(7)* Capture
Efficiency(10)TPM
(11)TPY
(2)EID
(8)**Control
Efficiency(9)
Control Description(12)
Emission Factor Reference ID
Belt Conveyor 146000.0 tons/month 1752000 tons/year 0 lb/ton 100 0.0000 0.00C28106 0 Controlled by BH02 (See Figure 10) NONE
Belt Conveyor 146000.0 tons/month 1752000 tons/year 0 lb/ton 100 0.0000 0.00C30111 0 Controlled by BH02 (See Figure 10) NONE
Belt Conveyor 219000.0 tons/month 2628000 tons/year 0.000013 lb/ton AP‐42 0.0014 0.02C31112 AP‐42 Covered (See Figure 9) 30502006 (controlled)
Belt Conveyor 146000.0 tons/month 1752000 tons/year 0 lb/ton 100 0.0000 0.00C32120 0 Controlled by BH02 (See Figure 10) NONE
Belt Conveyor 219000.0 tons/month 2628000 tons/year 0.000013 lb/ton AP‐42 0.0014 0.02C33121 AP‐42 Covered (See Figure 9) 30502006 (controlled)
Belt Conveyor 219000.0 tons/month 2628000 tons/year 0.000013 lb/ton AP‐42 0.0014 0.02C34135 AP‐42 Covered (See Figure 10) 30502006 (controlled)
Belt Conveyor 219000.0 tons/month 2628000 tons/year 0 lb/ton 100 0.0000 0.00C35143 0 Controlled by BH02 (See Figure 10) NONE
Belt Conveyor 219000.0 tons/month 2628000 tons/year 0.000013 lb/ton AP‐42 0.0014 0.02C36146 AP‐42 Covered (See Figure 9) 30502006 (controlled)
Belt Conveyor 219000.0 tons/month 2628000 tons/year 0.000013 lb/ton AP‐42 0.0014 0.02C37153 AP‐42 Covered (See Figure 9) 30502006 (controlled)
Belt Conveyor 219000.0 tons/month 2628000 tons/year 0 lb/ton 100 0.0000 0.00C38160 0 Controlled by BH02 (See Figure 10) NONE
Belt Conveyor 146000.0 tons/month 1752000 tons/year 0.000008 lb/ton 100 0.0006 0.01C29107 0 Covered & controlled by bin vent dust collector (See Figure 4)
RadialStacker
Belt Feeder 97090.0 tons/month 1165080 tons/year 0 lb/ton 100 0.0000 0.00F0596 0 Controlled by BH02 (See Figure 10) NONE
Belt Feeder 97090.0 tons/month 1165080 tons/year 0 lb/ton 100 0.0000 0.00F0698 0 Controlled by BH02 (See Figure 10) NONE
Belt Feeder 97090.0 tons/month 1165080 tons/year 0 lb/ton 100 0.0000 0.00F07100 0 Controlled by BH02 (See Figure 10) NONE
Belt Feeder 219000.0 tons/month 2628000 tons/year 0 lb/ton 100 0.0000 0.00F08117 0 Controlled by BH02 (See Figure 10) NONE
Belt Feeder 219000.0 tons/month 2628000 tons/year 0 lb/ton 100 0.0000 0.00F09126 0 Controlled by BH02 (See Figure 10) NONE
Bucket Elevator 292000.0 tons/month 3504000 tons/year 0.000013 lb/ton AP‐42 0.0019 0.02BE0192 AP‐42 Covered (See Figure 9) 30502006 (controlled)
Bucket Elevator 219000.0 tons/month 2628000 tons/year 0.000013 lb/ton AP‐42 0.0014 0.02BE02113 AP‐42 Covered (See Figure 9) 30502006 (controlled)
Bucket Elevator 219000.0 tons/month 2628000 tons/year 0.000013 lb/ton AP‐42 0.0014 0.02BE03122 AP‐42 Covered (See Figure 9) 30502006 (controlled)
Bucket Elevator 219000.0 tons/month 2628000 tons/year 0.000013 lb/ton AP‐42 0.0014 0.02BE04136 AP‐42 Covered (See Figure 9) 30502006 (controlled)
Bucket Elevator 219000.0 tons/month 2628000 tons/year 0.000013 lb/ton AP‐42 0.0014 0.02BE05144 AP‐42 Covered (See Figure 9) 30502006 (controlled)
Bucket Elevator 219000.0 tons/month 2628000 tons/year 0.000013 lb/ton AP‐42 0.0014 0.02BE06161 AP‐42 Covered (See Figure 9) 30502006 (controlled)
Dry Screen 97090.0 tons/month 1165080 tons/year 0 lb/ton 100 0.0000 0.00SCR03103 0 Controlled by BH02 (See Figure 10) NONE
Dry Screen 97090.0 tons/month 1165080 tons/year 0 lb/ton 100 0.0000 0.00SCR04104 0 Controlled by BH02 (See Figure 10) NONE
Dry Screen 97090.0 tons/month 1165080 tons/year 0 lb/ton 100 0.0000 0.00SCR05105 0 Controlled by BH02 (See Figure 10) NONE
Dry Screen 219000.0 tons/month 2628000 tons/year 0 lb/ton 100 0.0000 0.00SCR06119 0 Controlled by BH02 (See Figure 10) NONE
Dry Screen 219000.0 tons/month 2628000 tons/year 0 lb/ton 100 0.0000 0.00SCR07128 0 Controlled by BH02 (See Figure 10) NONE
Feed Hopper 292000.0 tons/month 3504000 tons/year 0.0006 lb/ton 100 0.0876 1.05FH0593 0 Covered & controlled by bin vent dust collector (See Figure 8)
30503813
Feed Hopper 219000.0 tons/month 2628000 tons/year 0.0006 lb/ton 100 0.0657 0.79FH06114 0 Covered & controlled by bin vent dust collector (See Figure 8)
30503813
Feed Hopper 219000.0 tons/month 2628000 tons/year 0.0006 lb/ton 100 0.0657 0.79FH07123 0 Covered & controlled by bin vent dust collector (See Figure 8)
30503813
Screening Baghouse 1489.2 million dscf/month 17870.4 million dscf/year 1428.5 lb/million dscf 100 1.0637 12.76BGH02129 99.9 .005 gr/[email protected] microns or > BH02
Application Revision 5/14/2012, Page 95 of 131

ATTACHMENTS 1 THROUGH 4 TO APC260
Dry Sand Processes: Total PM2.5 Emissions (TPY): 15.59
A. PM2.5 Emissions by Equipment Unit ID (EID):
(1)Item
(3)Emission Unit Desription
(4)Max Short Term Throughput
(5)Max Annual Throughput
(6)Emission Factor
(7)* Capture
Efficiency(10)TPM
(11)TPY
(2)EID
(8)**Control
Efficiency(9)
Control Description(12)
Emission Factor Reference ID
B. Proposed Permit Limits for PM2.5 from Dry Sand Processes:
97090.0 tons/month 3504000 tons/year 15.591.2994
E. Notes:
As defined in I.A. (7), (8) and (9) for sources with capture and/or control efficiencies for pollution control equipment.
*The term “capture system” for the purpose of this application means the equipment (including hoods, ducts, etc.) used to contain, capture, or transport an air contaminant to a control device. In addition, the term “capture efficiency” means the weight per unit time of an air contaminant entering a capture system and delivered to a control device, divided by the weight per unit time of the air contaminant generated by the source, expressed as a percentage. Therefore, if the emission unit is not exhausted to a control device, the capture system and capture efficiency is not applicable (NA). If the emission unit is using an emission factor with an overall emission reduction efficiency included in the factor, “AP‐42” has been assigned to the capture efficiency.
**The term “control system” for the purpose of this application means any control device or technique which is designed and operated to reduce the quantity of air contaminants emitted to the atmosphere. The term “control efficiency” means the percentage by which a control device or technique reduces the emissions from a stationary source. If the emission unit is controlled by a control device, the capture and control efficiencies are identified. If the emission unit is using an emission factor with an overall emission reduction efficiency included in the factor, “AP‐42” has been assigned to the control efficiency.
C. Emission Factor Source by Reference ID:
30502006 (controlled) AP‐42, Table 11.19.2‐2 Crushed Stone Processing and Pulverized Mineral Processing, SCC 30502006, Conveyor Transfer Point (controlled)
30503813 AP‐42, Table 11.19.2‐4 Crushed Stone Processing and Pulverized Mineral Processing, SCC 30503813, Product Storage with Fabric Filter Control
BH02 Proposed limit of 0.01 grains per dry standard cubic foot of exhaust
NONE Controlled by Baghouse (see Emission Unit ID BGH02 for emissions)
RadialStacker AP‐42 ‐ Section 13.2.4 Aggregate Handling & Storage Piles; Batch/Continuous Drop Equation (1)
D. Example Calculation for Item 129:
2.04 million dscf
hour
1428.5 lb
million dscf* ((1 ‐ 100 % capture/100) + (1 ‐ 99.9 % control/100))
ton
2000 lb=
year
12.76 ton PM2.5
year
8760 Hours
Application Revision 5/14/2012, Page 96 of 131

Attachment 5 to APC260: Stack Information
Item 64. Flow Diagram Designation of Exhaust Point Dry Sand Processes
Item 65. Description of Exhaust Point This stack ID has an actual exhaust points on Dwg. No. 050111‐01:131.
Item 67. Exit Diameter (feet) 3
Item 71. Average Flow Rate (acfm) 30000
Item 73. Maximum Flow Rate (acfm) 34000
Item 70. Average Exhaust Gas Temperature (F) 140
Item 66. Exit Height above Grade (feet) 20
Item 72. Maximum Exhaust Gas Temperature (F) 175
Item 68. Greatest Height of Nearby Building (feet) To be determined
Item 69. Distance to Nearest Property Line (feet) 300
Application Revision 5/14/2012, Page 97 of 131

STATE OF ILLINOIS
ENVIRONMENTAL PROTECTION AGENCY
DIVISION OF AIR POLLUTION CONTROL
1021 NORTH GRAND AVENUE, EAST
SPRINGFIELD, ILLINOIS 62702
IL 532-0250
APC 220 Rev. 1/27/77
* DATA AND INFORMATION
PROCESS EMISSION SOURCE
* THIS INFORMATION FORM IS TO BE COMPLETED FOR AN EMISSION SOURCE OTHER THAN A FUEL COMBUSTION EMISSION SOURCE OR AN
INCINERATOR. A FUEL COMBUSTION EMISSION SOURCE IS A FURNACE, BOILER, OR SIMILAR EQUIPMENT USED PRIMARILY FOR
PRODUCING HEAT OR POWER BY INDIRECT HEAT TRANSFER. AN INCINERATOR IS AN APPARATUS IN WHICH REFUSE IS BURNED.
1. NAME OF PLANT OWNER:
2. NAME OF CORPORATE DIVISION OR PLANT (IF DIFFERENT FROM
OWNER):
3. STREET ADDRESS OF EMISSION SOURCE:
4. CITY OF EMISSION SOURCE:
GENERAL INFORMATION
5. NAME OF PROCESS:
6. NAME OF EMISSION SOURCE EQUIPMENT:
7. EMISSION SOURCE EQUIPMENT MANUFACTURER:
8. MODEL NUMBER:
9. SERIAL NUMBER:
10. FLOW DIAGRAM DESIGNATION(S) OF EMISSION SOURCE:
11. IDENTITY(S) OF ANY SIMILAR SOURCE(S) AT THE PLANT OR PREMISES NOT COVERED BY THE FORM (IF THE SOURCE IS COVERED BY
ANOTHER APPLICATION, IDENTIFY THE APPLICATION):
12. AVERAGE OPERATING TIME OF EMISSION SOURCE:
_________ HRS/DAY _________ DAYS/WK _________ WKS/YR
13. MAXIMUM OPERATING TIME OF EMISSION SOURCE:
_________ HRS/DAY _________ DAYS/WK _________ WKS/YR
14. PERCENT OF ANNUAL THROUGHPUT:
DEC-FEB ____________ % MAR-MAY ____________ % JUN-AUG ____________ % SEPT-NOV ____________ %
INSTRUCTIONS
1. COMPLETE THE ABOVE IDENTIFICATION AND GENERAL INFORMATION SECTION.
2. COMPLETE THE RAW MATERIAL, PRODUCT, WASTE MATERIAL, AND FUEL USAGE SECTIONS FOR THE PARTICULAR SOURCE EQUIPMENT.
COMPOSITIONS OF MATERIALS MUST BE SUFFICIENTLY DETAILED TO ALLOW DETERMINATION OF THE NATURE AND QUANTITY OF
POTENTIAL EMISSIONS. IN PARTICULAR, THE COMPOSITION OF PAINTS, INKS, ETC., AND ANY SOLVENTS MUST BE FULLY DETAILED.
3. EMISSION AND EXHAUST POINT INFORMATION MUST BE COMPLETED, UNLESS EMISSIONS ARE EXHAUSTED THROUGH AIR POLLUTION
CONTROL EQUIPMENT.
4. OPERATION TIME AND CERTAIN OTHER ITEMS REQUIRE BOTH AVERAGE AND MAXIMUM VALUES
5. FOR GENERAL INFORMATION REFER TO “GENERAL INSTRUCTIONS FOR PERMIT APPLICATIONS,” APC-201.
DEFINITIONS
AVERAGE - THE VALUE THAT SUMMARIZES OR REPRESENTS THE GENERAL CONDITION OF THE EMISSION SOURCE, OR THE GENERAL STATE
OF PRODUCTION OF THE EMISSION SOURCE. SPECIFICALLY:
AVERAGE OPERATING TIME - ACTUAL TOTAL HOURS OF OPERATION FOR THE PRECEDING TWELVE MONTH PERIOD.
AVERAGE RATE - ACTUAL TOTAL QUANTITY OF “MATERIAL” FOR THE PRECEDING TWELVE MONTH PERIOD, DIVIDED BY THE AVERAGE
OPERATING TIME.
AVERAGE OPERATION - OPERATION TYPICAL OF THE PRECEDING TWELVE MONTH PERIOD, AS REPRESENTED BY AVERAGE OPERATING
TIME AND AVERAGE RATES.
MAXIMUM - THE GREATEST VALUE ATTAINABLE OR ATTAINED FOR THE EMISSION SOURCE, OR THE PERIOD OF GREATEST OR UTMOST
PRODUCTION OF THE EMISSION SOURCE. SPECIFICALLY:
MAXIMUM OPERATING TIME - GREATEST EXPECTED TOTAL HOURS OF OPERATIONS FOR ANY TWELVE MONTH PERIOD.
MAXIMUM RATE - GREATEST QUANTITY OF “MATERIAL” EXPECTED PER ANY ONE HOUR OF OPERATION.
MAXIMUM OPERATION - GREATEST EXPECTED OPERATION, AS REPRESENTED BY MAXIMUM OPERATING TIME AND MAXIMUM RATES.
This Agency is authorized to require this information under Illinois Revised Statutes, 1979, Chapter 111 1/2, Section 1039. Disclosure of this information is required
under that Section. Failure to do so may prevent this form from being processed and could result in your application being denied. This form has been approved by the
Forms Management Center.
Mississippi Sand, LLC. Same as Owner
2320 Creve Coeur Mill Rd LaSalle County, Ottawa Township
Storage Silos See Attachment 1 to APC 220
-- -- --
--
--
-- -- -- -- -- --
-- -- -- --
Application Revision 5/14/2012, Page 98 of 131

APC 220
RAW MATERIAL INFORMATION
NAME OF RAW MATERIAL
AVERAGE RATE
PER IDENTICAL SOURCE
MAXIMUM RATE
PER IDENTICAL SOURCE
20a. b.
LB/HR
c.
LB/HR
21a. b.
LB/HR
c.
LB/HR
22a. b.
LB/HR
c.
LB/HR
23a. b.
LB/HR
c.
LB/HR
24a. b.
LB/HR
c.
LB/HR
PRODUCT INFORMATION
NAME OF PRODUCT
AVERAGE RATE
PER IDENTICAL SOURCE
MAXIMUM RATE
PER IDENTICAL SOURCE
30a. b.
LB/HR
c.
LB/HR
31a. b.
LB/HR
c.
LB/HR
32a. b.
LB/HR
c.
LB/HR
33a. b.
LB/HR
c.
LB/HR
34a. b.
LB/HR
c.
LB/HR
WASTE MATERIAL INFORMATION
NAME OF WASTE MATERIAL
AVERAGE RATE
PER IDENTICAL SOURCE
MAXIMUM RATE
PER IDENTICAL SOURCE
40a. b.
LB/HR
c.
LB/HR
41a. b.
LB/HR
c.
LB/HR
42a. b.
LB/HR
c.
LB/HR
43a. b.
LB/HR
c.
LB/HR
44a. b.
LB/HR
c.
LB/HR
*FUEL USAGE INFORMATION
FUEL USED TYPE HEAT CONTENT
50a. NATURAL GAS b. ----------------------------- c. 1000 BTU/SCF
OTHER GAS BTU/SCF
OIL BTU/GAL
COAL BTU/LB
OTHER BTU/LB
d. AVERAGE FIRING RATE PER IDENTICAL SOURCE:
BTU/HR
e. MAXIMUM FIRING RATE PER IDENTICAL SOURCE:
BTU/HR
*THIS SECTION IS TO BE COMPLETED FOR ANY FUEL USED DIRECTLY IN THE PROCESS EMISSION SOURCE, E. G. GAS IN A DRYER, OR COAL IN
A MELT FURNACE.
See Attachment 2 to APC 220 -- --
See Attachment 3 to APC 220 -- --
NA -- --
NA NA
Application Revision 5/14/2012, Page 99 of 131

Page ______ of ______
APC 220
*EMISSION INFORMATION
51. NUMBER OF IDENTICAL SOURCES (DESCRIBE AS REQUIRED):
AVERAGE OPERATION
CONTAMINANT
CONCENTRATION OR EMISSION RATE PER IDENTICAL
SOURCE
METHOD USED TO DETERMINE CONCENTRATION OR
EMISSION RATE
PARTICULATE
MATTER
52a.
GR/SCF
b.
LB/HR
c.
CARBON
MONOXIDE
53a. PPM
(VOL)
b.
LB/HR
c.
NITROGEN
OXIDES
54a. PPM
(VOL)
b.
LB/HR
c.
ORGANIC
MATERIAL
55a. PPM
(VOL)
b.
LB/HR
c.
SULFUR
DIOXIDE
56a. PPM
(VOL)
b.
LB/HR
c.
**OTHER
(SPECIFY)
57a. PPM
(VOL)
b.
LB/HR
c.
MAXIMUM OPERATION
CONTAMINANT
CONCENTRATION OR EMISSION RATE PER IDENTICAL
SOURCE
METHOD USED TO DETERMINE CONCENTRATION OR
EMISSION RATE
PARTICULATE
MATTER
58a.
GR/SCF
b.
LB/HR
c.
CARBON
MONOXIDE
59a. PPM
(VOL)
b.
LB/HR
c.
NITROGEN
OXIDES
60a. PPM
(VOL)
b.
LB/HR
c.
ORGANIC
MATERIAL
61a. PPM
(VOL)
b.
LB/HR
c.
SULFUR
DIOXIDE
62a. PPM
(VOL)
b.
LB/HR
c.
**OTHER
(SPECIFY)
63a. PPM
(VOL)
b.
LB/HR
c.
*ITEMS 52 THROUGH 63 NEED NOT BE COMPLETED IF EMISSIONS ARE EXHAUSTED THROUGH AIR POLLUTION CONTROL EQUIPMENT.
**“OTHER” CONTAMINANT SHOULD BE USED FOR AN AIR CONTAMINANT NOT SPECIFICALLY NAMED ABOVE. POSSIBLE OTHER
CONTAMINANTS ARE ASBESTOS, BERYLLIUM, MERCURY, VINYL CHLORIDE, LEAD, ETC.
***EXHAUST POINT INFORMATION
64. FLOW DIAGRAM DESIGNATION(S) OF EXHAUST POINT:
65. DESCRIPTION OF EXHAUST POINT (LOCATION IN RELATION TO BUILDINGS, DIRECTION, HOODING, ETC.):
66. EXIT HEIGHT ABOVE GRADE: 67. EXIT DIAMETER:
68. GREATEST HEIGHT OF NEARBY BUILDINGS: 69. EXIT DISTANCE FROM NEAREST PLANT BOUNDARY:
AVERAGE OPERATION MAXIMUM OPERATION
70. EXIT GAS TEMPERATURE:
�F
72. EXIT GAS TEMPERATURE:
�F
71. GAS FLOW RATE THROUGH EACH EXIT:
ACFM
73. GAS FLOW RATE THROUGH EACH EXIT:
ACFM
***THIS SECTION SHOULD NOT BE COMPLETED IF EMISSIONS ARE EXHAUSTED THROUGH AIR POLLUTION CONTROL EQUIPMENT.
See Attachment 4 to APC 220
-- -- --
-- -- --
See Attachment 5 to APC 220
--
-- --
-- --
--
--
--
--
Application Revision 5/14/2012, Page 100 of 131

ATTACHMENTS 1 THROUGH 4 TO APC220
Storage Silos: Total PM Emissions (TPY): 60.71
A. PM Emissions by Equipment Unit ID (EID):
(1)Item
(3)Emission Unit Desription
(4)Max Short Term Throughput
(5)Max Annual Throughput
(6)Emission Factor
(7)* Capture
Efficiency(10)TPM
(11)TPY
(2)EID
(8)**Control
Efficiency(9)
Control Description(12)
Emission Factor Reference ID
Drive through Oversize Tank
146000.0 tons/month 1752000 tons/year 0.0099 lb/ton 100 0.7227 8.67WTK01108 0 Covered & controlled by bin vent dust collector (See Figure 11)
30503813
Storage Tank 219000.0 tons/month 2628000 tons/year 0.0099 lb/ton 100 1.0841 13.01STK01137 0 Covered & controlled by bin vent dust collector (See Figure 11)
30503813
Storage Tank 219000.0 tons/month 2628000 tons/year 0.0099 lb/ton 100 1.0841 13.01STK02147 0 Covered & controlled by bin vent dust collector (See Figure 11)
30503813
Storage Tank 219000.0 tons/month 2628000 tons/year 0.0099 lb/ton 100 1.0841 13.01STK03154 0 Covered & controlled by bin vent dust collector (See Figure 11)
30503813
Storage Tank 219000.0 tons/month 2628000 tons/year 0.0099 lb/ton 100 1.0841 13.01STK04162 0 Covered & controlled by bin vent dust collector (See Figure 11)
30503813
B. Proposed Permit Limits for PM from Storage Silos:
219000.0 tons/month 2628000 tons/year 60.715.0589
E. Notes:
As defined in I.A. (7), (8) and (9) for sources with capture and/or control efficiencies for pollution control equipment.
*The term “capture system” for the purpose of this application means the equipment (including hoods, ducts, etc.) used to contain, capture, or transport an air contaminant to a control device. In addition, the term “capture efficiency” means the weight per unit time of an air contaminant entering a capture system and delivered to a control device, divided by the weight per unit time of the air contaminant generated by the source, expressed as a percentage. Therefore, if the emission unit is not exhausted to a control device, the capture system and capture efficiency is not applicable (NA). If the emission unit is using an emission factor with an overall emission reduction efficiency included in the factor, “AP‐42” has been assigned to the capture efficiency.
**The term “control system” for the purpose of this application means any control device or technique which is designed and operated to reduce the quantity of air contaminants emitted to the atmosphere. The term “control efficiency” means the percentage by which a control device or technique reduces the emissions from a stationary source. If the emission unit is controlled by a control device, the capture and control efficiencies are identified. If the emission unit is using an emission factor with an overall emission reduction efficiency included in the factor, “AP‐42” has been assigned to the control efficiency.
C. Emission Factor Source by Reference ID:
30503813 AP‐42, Table 11.19.2‐4 Crushed Stone Processing and Pulverized Mineral Processing, SCC 30503813, Product Storage with Fabric Filter Control
D. Example Calculation for Item 162:
300 tons
hour
0.0099 lb
ton * ((1 ‐ 100 % capture/100) + (1 ‐ 0 % control/100))
ton
2000 lb=
year
13.01 ton PM
year
8760 Hours
Application Revision 5/14/2012, Page 101 of 131

ATTACHMENTS 1 THROUGH 4 TO APC220
Storage Silos: Total PM‐10 Emissions (TPY): 9.81
A. PM‐10 Emissions by Equipment Unit ID (EID):
(1)Item
(3)Emission Unit Desription
(4)Max Short Term Throughput
(5)Max Annual Throughput
(6)Emission Factor
(7)* Capture
Efficiency(10)TPM
(11)TPY
(2)EID
(8)**Control
Efficiency(9)
Control Description(12)
Emission Factor Reference ID
Drive through Oversize Tank
146000.0 tons/month 1752000 tons/year 0.0016 lb/ton 100 0.1168 1.40WTK01108 0 Covered & controlled by bin vent dust collector (See Figure 11)
30503813
Storage Tank 219000.0 tons/month 2628000 tons/year 0.0016 lb/ton 100 0.1752 2.10STK01137 0 Covered & controlled by bin vent dust collector (See Figure 11)
30503813
Storage Tank 219000.0 tons/month 2628000 tons/year 0.0016 lb/ton 100 0.1752 2.10STK02147 0 Covered & controlled by bin vent dust collector (See Figure 11)
30503813
Storage Tank 219000.0 tons/month 2628000 tons/year 0.0016 lb/ton 100 0.1752 2.10STK03154 0 Covered & controlled by bin vent dust collector (See Figure 11)
30503813
Storage Tank 219000.0 tons/month 2628000 tons/year 0.0016 lb/ton 100 0.1752 2.10STK04162 0 Covered & controlled by bin vent dust collector (See Figure 11)
30503813
B. Proposed Permit Limits for PM‐10 from Storage Silos:
219000.0 tons/month 2628000 tons/year 9.810.8176
E. Notes:
As defined in I.A. (7), (8) and (9) for sources with capture and/or control efficiencies for pollution control equipment.
*The term “capture system” for the purpose of this application means the equipment (including hoods, ducts, etc.) used to contain, capture, or transport an air contaminant to a control device. In addition, the term “capture efficiency” means the weight per unit time of an air contaminant entering a capture system and delivered to a control device, divided by the weight per unit time of the air contaminant generated by the source, expressed as a percentage. Therefore, if the emission unit is not exhausted to a control device, the capture system and capture efficiency is not applicable (NA). If the emission unit is using an emission factor with an overall emission reduction efficiency included in the factor, “AP‐42” has been assigned to the capture efficiency.
**The term “control system” for the purpose of this application means any control device or technique which is designed and operated to reduce the quantity of air contaminants emitted to the atmosphere. The term “control efficiency” means the percentage by which a control device or technique reduces the emissions from a stationary source. If the emission unit is controlled by a control device, the capture and control efficiencies are identified. If the emission unit is using an emission factor with an overall emission reduction efficiency included in the factor, “AP‐42” has been assigned to the control efficiency.
C. Emission Factor Source by Reference ID:
30503813 AP‐42, Table 11.19.2‐4 Crushed Stone Processing and Pulverized Mineral Processing, SCC 30503813, Product Storage with Fabric Filter Control
D. Example Calculation for Item 162:
300 tons
hour
0.0016 lb
ton * ((1 ‐ 100 % capture/100) + (1 ‐ 0 % control/100))
ton
2000 lb=
year
2.1 ton PM‐10
year
8760 Hours
Application Revision 5/14/2012, Page 102 of 131

ATTACHMENTS 1 THROUGH 4 TO APC220
Storage Silos: Total PM2.5 Emissions (TPY): 3.68
A. PM2.5 Emissions by Equipment Unit ID (EID):
(1)Item
(3)Emission Unit Desription
(4)Max Short Term Throughput
(5)Max Annual Throughput
(6)Emission Factor
(7)* Capture
Efficiency(10)TPM
(11)TPY
(2)EID
(8)**Control
Efficiency(9)
Control Description(12)
Emission Factor Reference ID
Drive through Oversize Tank
146000.0 tons/month 1752000 tons/year 0.0006 lb/ton 100 0.0438 0.53WTK01108 0 Covered & controlled by bin vent dust collector (See Figure 11)
30503813
Storage Tank 219000.0 tons/month 2628000 tons/year 0.0006 lb/ton 100 0.0657 0.79STK01137 0 Covered & controlled by bin vent dust collector (See Figure 11)
30503813
Storage Tank 219000.0 tons/month 2628000 tons/year 0.0006 lb/ton 100 0.0657 0.79STK02147 0 Covered & controlled by bin vent dust collector (See Figure 11)
30503813
Storage Tank 219000.0 tons/month 2628000 tons/year 0.0006 lb/ton 100 0.0657 0.79STK03154 0 Covered & controlled by bin vent dust collector (See Figure 11)
30503813
Storage Tank 219000.0 tons/month 2628000 tons/year 0.0006 lb/ton 100 0.0657 0.79STK04162 0 Covered & controlled by bin vent dust collector (See Figure 11)
30503813
B. Proposed Permit Limits for PM2.5 from Storage Silos:
219000.0 tons/month 2628000 tons/year 3.680.3066
E. Notes:
As defined in I.A. (7), (8) and (9) for sources with capture and/or control efficiencies for pollution control equipment.
*The term “capture system” for the purpose of this application means the equipment (including hoods, ducts, etc.) used to contain, capture, or transport an air contaminant to a control device. In addition, the term “capture efficiency” means the weight per unit time of an air contaminant entering a capture system and delivered to a control device, divided by the weight per unit time of the air contaminant generated by the source, expressed as a percentage. Therefore, if the emission unit is not exhausted to a control device, the capture system and capture efficiency is not applicable (NA). If the emission unit is using an emission factor with an overall emission reduction efficiency included in the factor, “AP‐42” has been assigned to the capture efficiency.
**The term “control system” for the purpose of this application means any control device or technique which is designed and operated to reduce the quantity of air contaminants emitted to the atmosphere. The term “control efficiency” means the percentage by which a control device or technique reduces the emissions from a stationary source. If the emission unit is controlled by a control device, the capture and control efficiencies are identified. If the emission unit is using an emission factor with an overall emission reduction efficiency included in the factor, “AP‐42” has been assigned to the control efficiency.
C. Emission Factor Source by Reference ID:
30503813 AP‐42, Table 11.19.2‐4 Crushed Stone Processing and Pulverized Mineral Processing, SCC 30503813, Product Storage with Fabric Filter Control
D. Example Calculation for Item 162:
300 tons
hour
0.0006 lb
ton * ((1 ‐ 100 % capture/100) + (1 ‐ 0 % control/100))
ton
2000 lb=
year
0.79 ton PM2.5
year
8760 Hours
Application Revision 5/14/2012, Page 103 of 131

Attachment 5 to APC220: Stack Information
Item 64. Flow Diagram Designation of Exhaust Point Storage Silos
Item 65. Description of Exhaust Point This stack ID has an actual exhaust points on Dwg. No. 050111‐01: 137, 147, 154, 162 and 108.
Item 67. Exit Diameter (feet) 0.75
Item 71. Average Flow Rate (acfm) 900
Item 73. Maximum Flow Rate (acfm) 1200
Item 70. Average Exhaust Gas Temperature (F) NA
Item 66. Exit Height above Grade (feet) 94
Item 72. Maximum Exhaust Gas Temperature (F) NA
Item 68. Greatest Height of Nearby Building (feet) To be determined
Item 69. Distance to Nearest Property Line (feet) 350
Application Revision 5/14/2012, Page 104 of 131

STATE OF ILLINOIS
ENVIRONMENTAL PROTECTION AGENCY
DIVISION OF AIR POLLUTION CONTROL
1021 NORTH GRAND AVENUE, EAST
SPRINGFIELD, ILLINOIS 62702
IL 532-0250
APC 220 Rev. 1/27/77
* DATA AND INFORMATION
PROCESS EMISSION SOURCE
* THIS INFORMATION FORM IS TO BE COMPLETED FOR AN EMISSION SOURCE OTHER THAN A FUEL COMBUSTION EMISSION SOURCE OR AN
INCINERATOR. A FUEL COMBUSTION EMISSION SOURCE IS A FURNACE, BOILER, OR SIMILAR EQUIPMENT USED PRIMARILY FOR
PRODUCING HEAT OR POWER BY INDIRECT HEAT TRANSFER. AN INCINERATOR IS AN APPARATUS IN WHICH REFUSE IS BURNED.
1. NAME OF PLANT OWNER:
2. NAME OF CORPORATE DIVISION OR PLANT (IF DIFFERENT FROM
OWNER):
3. STREET ADDRESS OF EMISSION SOURCE:
4. CITY OF EMISSION SOURCE:
GENERAL INFORMATION
5. NAME OF PROCESS:
6. NAME OF EMISSION SOURCE EQUIPMENT:
7. EMISSION SOURCE EQUIPMENT MANUFACTURER:
8. MODEL NUMBER:
9. SERIAL NUMBER:
10. FLOW DIAGRAM DESIGNATION(S) OF EMISSION SOURCE:
11. IDENTITY(S) OF ANY SIMILAR SOURCE(S) AT THE PLANT OR PREMISES NOT COVERED BY THE FORM (IF THE SOURCE IS COVERED BY
ANOTHER APPLICATION, IDENTIFY THE APPLICATION):
12. AVERAGE OPERATING TIME OF EMISSION SOURCE:
_________ HRS/DAY _________ DAYS/WK _________ WKS/YR
13. MAXIMUM OPERATING TIME OF EMISSION SOURCE:
_________ HRS/DAY _________ DAYS/WK _________ WKS/YR
14. PERCENT OF ANNUAL THROUGHPUT:
DEC-FEB ____________ % MAR-MAY ____________ % JUN-AUG ____________ % SEPT-NOV ____________ %
INSTRUCTIONS
1. COMPLETE THE ABOVE IDENTIFICATION AND GENERAL INFORMATION SECTION.
2. COMPLETE THE RAW MATERIAL, PRODUCT, WASTE MATERIAL, AND FUEL USAGE SECTIONS FOR THE PARTICULAR SOURCE EQUIPMENT.
COMPOSITIONS OF MATERIALS MUST BE SUFFICIENTLY DETAILED TO ALLOW DETERMINATION OF THE NATURE AND QUANTITY OF
POTENTIAL EMISSIONS. IN PARTICULAR, THE COMPOSITION OF PAINTS, INKS, ETC., AND ANY SOLVENTS MUST BE FULLY DETAILED.
3. EMISSION AND EXHAUST POINT INFORMATION MUST BE COMPLETED, UNLESS EMISSIONS ARE EXHAUSTED THROUGH AIR POLLUTION
CONTROL EQUIPMENT.
4. OPERATION TIME AND CERTAIN OTHER ITEMS REQUIRE BOTH AVERAGE AND MAXIMUM VALUES
5. FOR GENERAL INFORMATION REFER TO “GENERAL INSTRUCTIONS FOR PERMIT APPLICATIONS,” APC-201.
DEFINITIONS
AVERAGE - THE VALUE THAT SUMMARIZES OR REPRESENTS THE GENERAL CONDITION OF THE EMISSION SOURCE, OR THE GENERAL STATE
OF PRODUCTION OF THE EMISSION SOURCE. SPECIFICALLY:
AVERAGE OPERATING TIME - ACTUAL TOTAL HOURS OF OPERATION FOR THE PRECEDING TWELVE MONTH PERIOD.
AVERAGE RATE - ACTUAL TOTAL QUANTITY OF “MATERIAL” FOR THE PRECEDING TWELVE MONTH PERIOD, DIVIDED BY THE AVERAGE
OPERATING TIME.
AVERAGE OPERATION - OPERATION TYPICAL OF THE PRECEDING TWELVE MONTH PERIOD, AS REPRESENTED BY AVERAGE OPERATING
TIME AND AVERAGE RATES.
MAXIMUM - THE GREATEST VALUE ATTAINABLE OR ATTAINED FOR THE EMISSION SOURCE, OR THE PERIOD OF GREATEST OR UTMOST
PRODUCTION OF THE EMISSION SOURCE. SPECIFICALLY:
MAXIMUM OPERATING TIME - GREATEST EXPECTED TOTAL HOURS OF OPERATIONS FOR ANY TWELVE MONTH PERIOD.
MAXIMUM RATE - GREATEST QUANTITY OF “MATERIAL” EXPECTED PER ANY ONE HOUR OF OPERATION.
MAXIMUM OPERATION - GREATEST EXPECTED OPERATION, AS REPRESENTED BY MAXIMUM OPERATING TIME AND MAXIMUM RATES.
This Agency is authorized to require this information under Illinois Revised Statutes, 1979, Chapter 111 1/2, Section 1039. Disclosure of this information is required
under that Section. Failure to do so may prevent this form from being processed and could result in your application being denied. This form has been approved by the
Forms Management Center.
Mississippi Sand, LLC. Same as Owner
2320 Creve Coeur Mill Rd LaSalle County, Ottawa Township
Truck Loadout See Attachment 1 to APC 220
-- -- --
--
--
-- -- -- -- -- --
-- -- -- --
Application Revision 5/14/2012, Page 105 of 131

APC 220
RAW MATERIAL INFORMATION
NAME OF RAW MATERIAL
AVERAGE RATE
PER IDENTICAL SOURCE
MAXIMUM RATE
PER IDENTICAL SOURCE
20a. b.
LB/HR
c.
LB/HR
21a. b.
LB/HR
c.
LB/HR
22a. b.
LB/HR
c.
LB/HR
23a. b.
LB/HR
c.
LB/HR
24a. b.
LB/HR
c.
LB/HR
PRODUCT INFORMATION
NAME OF PRODUCT
AVERAGE RATE
PER IDENTICAL SOURCE
MAXIMUM RATE
PER IDENTICAL SOURCE
30a. b.
LB/HR
c.
LB/HR
31a. b.
LB/HR
c.
LB/HR
32a. b.
LB/HR
c.
LB/HR
33a. b.
LB/HR
c.
LB/HR
34a. b.
LB/HR
c.
LB/HR
WASTE MATERIAL INFORMATION
NAME OF WASTE MATERIAL
AVERAGE RATE
PER IDENTICAL SOURCE
MAXIMUM RATE
PER IDENTICAL SOURCE
40a. b.
LB/HR
c.
LB/HR
41a. b.
LB/HR
c.
LB/HR
42a. b.
LB/HR
c.
LB/HR
43a. b.
LB/HR
c.
LB/HR
44a. b.
LB/HR
c.
LB/HR
*FUEL USAGE INFORMATION
FUEL USED TYPE HEAT CONTENT
50a. NATURAL GAS b. ----------------------------- c. 1000 BTU/SCF
OTHER GAS BTU/SCF
OIL BTU/GAL
COAL BTU/LB
OTHER BTU/LB
d. AVERAGE FIRING RATE PER IDENTICAL SOURCE:
BTU/HR
e. MAXIMUM FIRING RATE PER IDENTICAL SOURCE:
BTU/HR
*THIS SECTION IS TO BE COMPLETED FOR ANY FUEL USED DIRECTLY IN THE PROCESS EMISSION SOURCE, E. G. GAS IN A DRYER, OR COAL IN
A MELT FURNACE.
See Attachment 2 to APC 220 -- --
See Attachment 3 to APC 220 -- --
NA -- --
NA NA
Application Revision 5/14/2012, Page 106 of 131

Page ______ of ______
APC 220
*EMISSION INFORMATION
51. NUMBER OF IDENTICAL SOURCES (DESCRIBE AS REQUIRED):
AVERAGE OPERATION
CONTAMINANT
CONCENTRATION OR EMISSION RATE PER IDENTICAL
SOURCE
METHOD USED TO DETERMINE CONCENTRATION OR
EMISSION RATE
PARTICULATE
MATTER
52a.
GR/SCF
b.
LB/HR
c.
CARBON
MONOXIDE
53a. PPM
(VOL)
b.
LB/HR
c.
NITROGEN
OXIDES
54a. PPM
(VOL)
b.
LB/HR
c.
ORGANIC
MATERIAL
55a. PPM
(VOL)
b.
LB/HR
c.
SULFUR
DIOXIDE
56a. PPM
(VOL)
b.
LB/HR
c.
**OTHER
(SPECIFY)
57a. PPM
(VOL)
b.
LB/HR
c.
MAXIMUM OPERATION
CONTAMINANT
CONCENTRATION OR EMISSION RATE PER IDENTICAL
SOURCE
METHOD USED TO DETERMINE CONCENTRATION OR
EMISSION RATE
PARTICULATE
MATTER
58a.
GR/SCF
b.
LB/HR
c.
CARBON
MONOXIDE
59a. PPM
(VOL)
b.
LB/HR
c.
NITROGEN
OXIDES
60a. PPM
(VOL)
b.
LB/HR
c.
ORGANIC
MATERIAL
61a. PPM
(VOL)
b.
LB/HR
c.
SULFUR
DIOXIDE
62a. PPM
(VOL)
b.
LB/HR
c.
**OTHER
(SPECIFY)
63a. PPM
(VOL)
b.
LB/HR
c.
*ITEMS 52 THROUGH 63 NEED NOT BE COMPLETED IF EMISSIONS ARE EXHAUSTED THROUGH AIR POLLUTION CONTROL EQUIPMENT.
**“OTHER” CONTAMINANT SHOULD BE USED FOR AN AIR CONTAMINANT NOT SPECIFICALLY NAMED ABOVE. POSSIBLE OTHER
CONTAMINANTS ARE ASBESTOS, BERYLLIUM, MERCURY, VINYL CHLORIDE, LEAD, ETC.
***EXHAUST POINT INFORMATION
64. FLOW DIAGRAM DESIGNATION(S) OF EXHAUST POINT:
65. DESCRIPTION OF EXHAUST POINT (LOCATION IN RELATION TO BUILDINGS, DIRECTION, HOODING, ETC.):
66. EXIT HEIGHT ABOVE GRADE: 67. EXIT DIAMETER:
68. GREATEST HEIGHT OF NEARBY BUILDINGS: 69. EXIT DISTANCE FROM NEAREST PLANT BOUNDARY:
AVERAGE OPERATION MAXIMUM OPERATION
70. EXIT GAS TEMPERATURE:
�F
72. EXIT GAS TEMPERATURE:
�F
71. GAS FLOW RATE THROUGH EACH EXIT:
ACFM
73. GAS FLOW RATE THROUGH EACH EXIT:
ACFM
***THIS SECTION SHOULD NOT BE COMPLETED IF EMISSIONS ARE EXHAUSTED THROUGH AIR POLLUTION CONTROL EQUIPMENT.
See Attachment 4 to APC 220
-- -- --
-- -- --
See Attachment 5 to APC 220
--
-- --
-- --
--
--
--
--
Application Revision 5/14/2012, Page 107 of 131
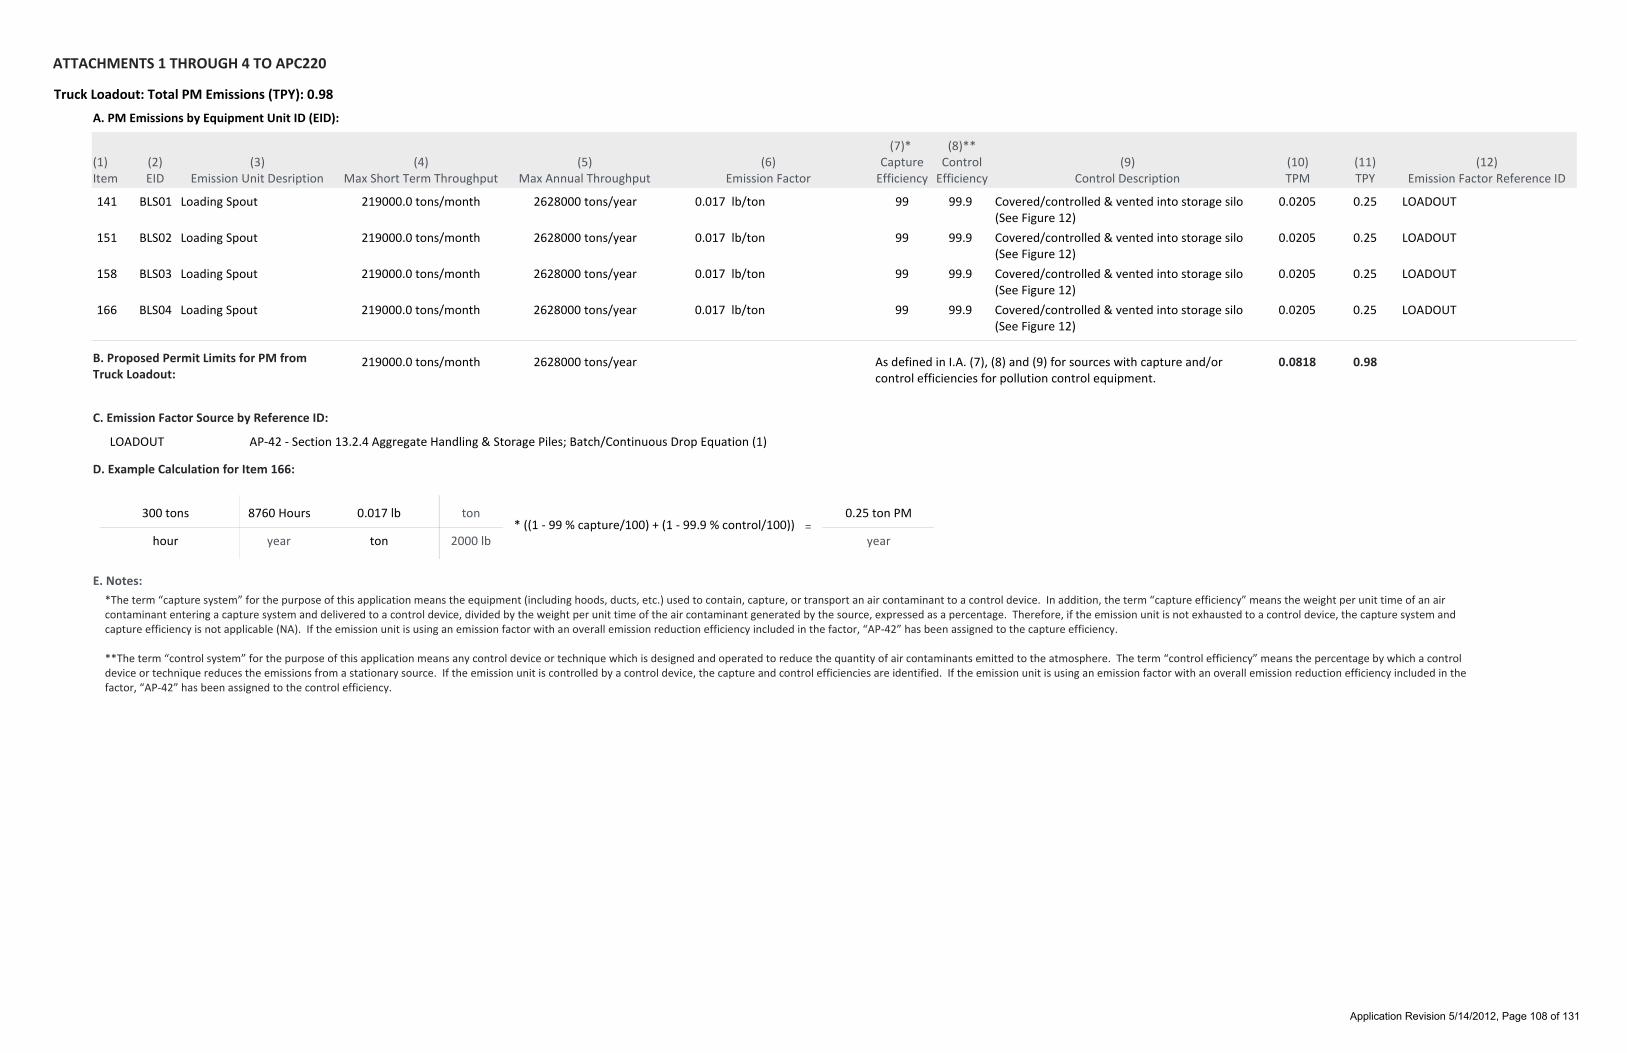
ATTACHMENTS 1 THROUGH 4 TO APC220
Truck Loadout: Total PM Emissions (TPY): 0.98
A. PM Emissions by Equipment Unit ID (EID):
(1)Item
(3)Emission Unit Desription
(4)Max Short Term Throughput
(5)Max Annual Throughput
(6)Emission Factor
(7)* Capture
Efficiency(10)TPM
(11)TPY
(2)EID
(8)**Control
Efficiency(9)
Control Description(12)
Emission Factor Reference ID
Loading Spout 219000.0 tons/month 2628000 tons/year 0.017 lb/ton 99 0.0205 0.25BLS01141 99.9 Covered/controlled & vented into storage silo (See Figure 12)
LOADOUT
Loading Spout 219000.0 tons/month 2628000 tons/year 0.017 lb/ton 99 0.0205 0.25BLS02151 99.9 Covered/controlled & vented into storage silo (See Figure 12)
LOADOUT
Loading Spout 219000.0 tons/month 2628000 tons/year 0.017 lb/ton 99 0.0205 0.25BLS03158 99.9 Covered/controlled & vented into storage silo (See Figure 12)
LOADOUT
Loading Spout 219000.0 tons/month 2628000 tons/year 0.017 lb/ton 99 0.0205 0.25BLS04166 99.9 Covered/controlled & vented into storage silo (See Figure 12)
LOADOUT
B. Proposed Permit Limits for PM from Truck Loadout:
219000.0 tons/month 2628000 tons/year 0.980.0818
E. Notes:
As defined in I.A. (7), (8) and (9) for sources with capture and/or control efficiencies for pollution control equipment.
*The term “capture system” for the purpose of this application means the equipment (including hoods, ducts, etc.) used to contain, capture, or transport an air contaminant to a control device. In addition, the term “capture efficiency” means the weight per unit time of an air contaminant entering a capture system and delivered to a control device, divided by the weight per unit time of the air contaminant generated by the source, expressed as a percentage. Therefore, if the emission unit is not exhausted to a control device, the capture system and capture efficiency is not applicable (NA). If the emission unit is using an emission factor with an overall emission reduction efficiency included in the factor, “AP‐42” has been assigned to the capture efficiency.
**The term “control system” for the purpose of this application means any control device or technique which is designed and operated to reduce the quantity of air contaminants emitted to the atmosphere. The term “control efficiency” means the percentage by which a control device or technique reduces the emissions from a stationary source. If the emission unit is controlled by a control device, the capture and control efficiencies are identified. If the emission unit is using an emission factor with an overall emission reduction efficiency included in the factor, “AP‐42” has been assigned to the control efficiency.
C. Emission Factor Source by Reference ID:
LOADOUT AP‐42 ‐ Section 13.2.4 Aggregate Handling & Storage Piles; Batch/Continuous Drop Equation (1)
D. Example Calculation for Item 166:
300 tons
hour
0.017 lb
ton * ((1 ‐ 99 % capture/100) + (1 ‐ 99.9 % control/100))
ton
2000 lb=
year
0.25 ton PM
year
8760 Hours
Application Revision 5/14/2012, Page 108 of 131

ATTACHMENTS 1 THROUGH 4 TO APC220
Truck Loadout: Total PM‐10 Emissions (TPY): 0.46
A. PM‐10 Emissions by Equipment Unit ID (EID):
(1)Item
(3)Emission Unit Desription
(4)Max Short Term Throughput
(5)Max Annual Throughput
(6)Emission Factor
(7)* Capture
Efficiency(10)TPM
(11)TPY
(2)EID
(8)**Control
Efficiency(9)
Control Description(12)
Emission Factor Reference ID
Loading Spout 219000.0 tons/month 2628000 tons/year 0.008 lb/ton 99 0.0096 0.12BLS01141 99.9 Covered/controlled & vented into storage silo (See Figure 12)
LOADOUT
Loading Spout 219000.0 tons/month 2628000 tons/year 0.008 lb/ton 99 0.0096 0.12BLS02151 99.9 Covered/controlled & vented into storage silo (See Figure 12)
LOADOUT
Loading Spout 219000.0 tons/month 2628000 tons/year 0.008 lb/ton 99 0.0096 0.12BLS03158 99.9 Covered/controlled & vented into storage silo (See Figure 12)
LOADOUT
Loading Spout 219000.0 tons/month 2628000 tons/year 0.008 lb/ton 99 0.0096 0.12BLS04166 99.9 Covered/controlled & vented into storage silo (See Figure 12)
LOADOUT
B. Proposed Permit Limits for PM‐10 from Truck Loadout:
219000.0 tons/month 2628000 tons/year 0.460.0385
E. Notes:
As defined in I.A. (7), (8) and (9) for sources with capture and/or control efficiencies for pollution control equipment.
*The term “capture system” for the purpose of this application means the equipment (including hoods, ducts, etc.) used to contain, capture, or transport an air contaminant to a control device. In addition, the term “capture efficiency” means the weight per unit time of an air contaminant entering a capture system and delivered to a control device, divided by the weight per unit time of the air contaminant generated by the source, expressed as a percentage. Therefore, if the emission unit is not exhausted to a control device, the capture system and capture efficiency is not applicable (NA). If the emission unit is using an emission factor with an overall emission reduction efficiency included in the factor, “AP‐42” has been assigned to the capture efficiency.
**The term “control system” for the purpose of this application means any control device or technique which is designed and operated to reduce the quantity of air contaminants emitted to the atmosphere. The term “control efficiency” means the percentage by which a control device or technique reduces the emissions from a stationary source. If the emission unit is controlled by a control device, the capture and control efficiencies are identified. If the emission unit is using an emission factor with an overall emission reduction efficiency included in the factor, “AP‐42” has been assigned to the control efficiency.
C. Emission Factor Source by Reference ID:
LOADOUT AP‐42 ‐ Section 13.2.4 Aggregate Handling & Storage Piles; Batch/Continuous Drop Equation (1)
D. Example Calculation for Item 166:
300 tons
hour
0.008 lb
ton * ((1 ‐ 99 % capture/100) + (1 ‐ 99.9 % control/100))
ton
2000 lb=
year
0.12 ton PM‐10
year
8760 Hours
Application Revision 5/14/2012, Page 109 of 131

ATTACHMENTS 1 THROUGH 4 TO APC220
Truck Loadout: Total PM2.5 Emissions (TPY): 0.14
A. PM2.5 Emissions by Equipment Unit ID (EID):
(1)Item
(3)Emission Unit Desription
(4)Max Short Term Throughput
(5)Max Annual Throughput
(6)Emission Factor
(7)* Capture
Efficiency(10)TPM
(11)TPY
(2)EID
(8)**Control
Efficiency(9)
Control Description(12)
Emission Factor Reference ID
Loading Spout 219000.0 tons/month 2628000 tons/year 0.0025 lb/ton 99 0.0030 0.04BLS01141 99.9 Covered/controlled & vented into storage silo (See Figure 12)
LOADOUT
Loading Spout 219000.0 tons/month 2628000 tons/year 0.0025 lb/ton 99 0.0030 0.04BLS02151 99.9 Covered/controlled & vented into storage silo (See Figure 12)
LOADOUT
Loading Spout 219000.0 tons/month 2628000 tons/year 0.0025 lb/ton 99 0.0030 0.04BLS03158 99.9 Covered/controlled & vented into storage silo (See Figure 12)
LOADOUT
Loading Spout 219000.0 tons/month 2628000 tons/year 0.0025 lb/ton 99 0.0030 0.04BLS04166 99.9 Covered/controlled & vented into storage silo (See Figure 12)
LOADOUT
B. Proposed Permit Limits for PM2.5 from Truck Loadout:
219000.0 tons/month 2628000 tons/year 0.140.0120
E. Notes:
As defined in I.A. (7), (8) and (9) for sources with capture and/or control efficiencies for pollution control equipment.
*The term “capture system” for the purpose of this application means the equipment (including hoods, ducts, etc.) used to contain, capture, or transport an air contaminant to a control device. In addition, the term “capture efficiency” means the weight per unit time of an air contaminant entering a capture system and delivered to a control device, divided by the weight per unit time of the air contaminant generated by the source, expressed as a percentage. Therefore, if the emission unit is not exhausted to a control device, the capture system and capture efficiency is not applicable (NA). If the emission unit is using an emission factor with an overall emission reduction efficiency included in the factor, “AP‐42” has been assigned to the capture efficiency.
**The term “control system” for the purpose of this application means any control device or technique which is designed and operated to reduce the quantity of air contaminants emitted to the atmosphere. The term “control efficiency” means the percentage by which a control device or technique reduces the emissions from a stationary source. If the emission unit is controlled by a control device, the capture and control efficiencies are identified. If the emission unit is using an emission factor with an overall emission reduction efficiency included in the factor, “AP‐42” has been assigned to the control efficiency.
C. Emission Factor Source by Reference ID:
LOADOUT AP‐42 ‐ Section 13.2.4 Aggregate Handling & Storage Piles; Batch/Continuous Drop Equation (1)
D. Example Calculation for Item 166:
300 tons
hour
0.0025 lb
ton * ((1 ‐ 99 % capture/100) + (1 ‐ 99.9 % control/100))
ton
2000 lb=
year
0.04 ton PM2.5
year
8760 Hours
Application Revision 5/14/2012, Page 110 of 131

Attachment 5 to APC220: Stack Information
Item 64. Flow Diagram Designation of Exhaust Point Truck Loadout
Item 65. Description of Exhaust Point This stack ID represents items on Dwg. No. 050111‐01: 141, 151,158, 166,140,150,157 and 165, which are vented back into the storage silos and exhausted through points 137, 147, 154 and 162.
Item 67. Exit Diameter (feet) NA
Item 71. Average Flow Rate (acfm) NA
Item 73. Maximum Flow Rate (acfm) NA
Item 70. Average Exhaust Gas Temperature (F) NA
Item 66. Exit Height above Grade (feet) NA
Item 72. Maximum Exhaust Gas Temperature (F) NA
Item 68. Greatest Height of Nearby Building (feet) To be determined
Item 69. Distance to Nearest Property Line (feet) 350
Application Revision 5/14/2012, Page 111 of 131

STATE OF ILLINOIS
ENVIRONMENTAL PROTECTION AGENCY
DIVISION OF AIR POLLUTION CONTROL
1021 NORTH GRAND AVENUE, EAST
SPRINGFIELD, ILLINOIS 62702
Page ______ of ______
IL 532-0256
APC 240 (Rev. 1/27/77)
* DATA AND INFORMATION
FUEL COMBUSTION EMISSION SOURCE
* THIS INFORMATION FORM IS TO BE COMPLETED FOR A FURNACE, BOILER, OR SIMILAR EQUIPMENT USED FOR THE PRIMARY PURPOSE OF
PRODUCING HEAT OR POWER BY INDIRECT HEAT TRANSFER. AN EMISSION SOURCE THAT DOES NOT FIT THIS DESCRIPTION, INCLUDING
AND EMISSION SOURCE USING DIRECT HEATING, IS EITHER A PROCESS EMISSION SOURCE OR AN INCINERATOR.
1. NAME OF PLANT OWNER:
2. NAME OF CORPORATE DIVISION OR PLANT (IF DIFFERENT FROM
OWNER):
3. STREET ADDRESS OF EMISSION SOURCE:
4. CITY OF EMISSION SOURCE:
GENERAL INFORMATION
5. FLOW DIAGRAM DESIGNATION(S) OF EMISSION SOURCE:
6. MANUFACTURER:
7. MODEL NUMBER:
8. SERIAL NUMBER:
9. AVERAGE OPERATING TIME OF EMISSION SOURCE:
_________ HRS/DAY _________ DAYS/WK _________ WKS/YR
10. MAXIMUM OPERATING TIME OF EMISSION SOURCE:
_________ HRS/DAY _________ DAYS/WK _________ WKS/YR
11. PERCENT OF ANNUAL HEAT INPUT:
DEC-FEB ____________ % MAR-MAY ____________ % JUN-AUG ____________ % SEPT-NOV ____________ %
INSTRUCTIONS
1. COMPLETE THE ABOVE IDENTIFICATION AND GENERAL INFORMATION SECTION.
2. COMPLETE THE APPROPRIATE FUEL SECTION OR SECTIONS. IF MORE THAN ONE FUEL IS FIRED OR IF THE CAPABILITY EXISTS TO FIRE
MORE THAN ONE FUEL, THE ACTUAL USAGE OF FUELS AND THE RELATIONSHIP BETWEEN FUELS, SIMULTANEOUS FIRING, ALTERNATE
FIRING, RESERVE FUEL, ETC., MUST BE MADE CLEAR.
3. EMISSION AND EXHAUST POINT INFORMATION MUST BE COMPLETED, UNLESS EMISSIONS ARE EXHAUSTED THROUGH AIR POLLUTION
CONTROL EQUIPMENT.
4. FIRING RATES AND CERTAIN OTHER ITEMS REQUIRE BOTH AVERAGE AND MAXIMUM VALUES
5. FOR GENERAL INFORMATION REFER TO “GENERAL INSTRUCTIONS FOR PERMIT APPLICATIONS,” APC-201.
DEFINITIONS
AVERAGE - THE VALUE THAT SUMMARIZES OR REPRESENTS THE GENERAL CONDITION OF THE EMISSION SOURCE, OR THE GENERAL STATE
OF HEAT PRODUCTION OF THE EMISSION SOURCE. SPECIFICALLY:
AVERAGE OPERATING TIME - ACTUAL TOTAL HOURS OF OPERATION FOR THE PRECEDING TWELVE MONTH PERIOD.
AVERAGE RATE - ACTUAL TOTAL QUANTITY OF “MATERIAL” FOR THE PRECEDING TWELVE MONTH PERIOD, DIVIDED BY THE AVERAGE
OPERATING TIME.
AVERAGE OPERATION - OPERATION TYPICAL OF THE PRECEDING TWELVE MONTH PERIOD, AS REPRESENTED BY AVERAGE OPERATING
TIME AND AVERAGE RATES.
MAXIMUM - THE GREATEST VALUE ATTAINABLE OR ATTAINED FOR THE EMISSION SOURCE, OR THE PERIOD OF GREATEST OR UTMOST
HEAT PRODUCTION OF THE EMISSION SOURCE. SPECIFICALLY:
MAXIMUM OPERATING TIME - GREATEST EXPECTED TOTAL HOURS OF OPERATIONS FOR ANY TWELVE MONTH PERIOD.
MAXIMUM RATE - GREATEST QUANTITY OF “MATERIAL” EXPECTED PER ANY ONE HOUR OF OPERATION.
MAXIMUM OPERATION - GREATEST EXPECTED OPERATION, AS REPRESENTED BY MAXIMUM OPERATING TIME AND MAXIMUM RATES.
This Agency is authorized to require this information under Illinois Revised Statutes, 1979, Chapter 111 1/2, Section 1039. Disclosure of this information is required
under that Section. Failure to do so may prevent this form from being processed and could result in your application being denied. This form has been approved by the
Forms Management Center.
Mississippi Sand, LLC.
2320 Creve Coeur Mill Rd
Same as Owner
LaSalle County, Ottawa Township
See Attachment 1 to APC 240
-- -- --
-- -- -- -- -- --
-- -- -- --
Application Revision 5/14/2012, Page 112 of 131

Page ______ of ______
APC 240
GAS FIRING
*11. ORIGIN OF GAS: DISTILLATE FUEL OTHER LIQUID FUEL SOLID FUEL BYPRODUCT
PIPELINE OIL GASIFICATION GASIFICATION GASIFICATION SPECIFY SOURCE
12. ARE YOU ON AN INTERRUPTABLE GAS SUPPLY: YES NO
IF “YES”, SPECIFY ALTERNATE FUEL:�������
13. ANNUAL CONSUMPTION:
SCF
*14. HEAT CONTENT:
BTU/SCF
*15. SULFUR CONTENT:
% BY WT.
16. AVERAGE FIRING RATE:
BTU/HR
17. MAXIMUM FIRING RATE:
BTU/HR
* IF THE GAS FIRED IS NATURAL GAS, THESE ITEMS NEED NOT BE COMPLETED.
OIL FIRING���
18. TYPE OF OIL:
GRADE NUMBER: 1 2 3 4 5 6 OTHER: SPECIFY
19. ANNUAL CONSUMPTION:
GALLONS
20. HEAT CONTENT: BTU/LB
BTU/GAL
21. SULFUR CONTENT:
% BY WT
22. ASH CONTENT:
% BY WT
23. DIRECTION OF FIRING:
HORIZONTAL TANGENTIAL OTHER: SPECIFY
24. AVERAGE FIRING RATE:
BTU/HR
25. MAXIMUM FIRING RATE:
BTU/HR
SOLID FUEL FIRING���
26. TYPE OF SOLID FUEL
SUB-BITUMINOUS COAL BITUMINOUS COAL ANTHRACITE COAL OTHER: SPECIFY
27. ANNUAL CONSUMPTION:
TONS
28. HEAT CONTENT AS FIRED:
BTU/LB
29. MOISTURE CONTENT AS FIRED:
% BY WT.
30. ASH CONTENT AS FIRED:
% BY WT.
31. SULFUR CONTENT AS FIRED:
% BY WT.
32. TYPE OF FIRING:
CYCLONE PULVERIZED WET BOTTOM OR DRY BOTTOM,
HORIZONTALLY OPPOSED OR OTHER: SPECIFY _______________
SPREADER STOKER: % REINJECTION __________ OTHER: SPECIFY _______________
33. AVERAGE FIRING RATE:
BTU/HR
34. MAXIMUM FIRING RATE:
BTU/HR
SUBMIT COPIES OF THOSE PORTIONS OF COAL OR OTHER SOLID FUEL CONTRACTS WHICH SET FORTH THE SPECIFICATIONS OF THE FUEL
AND THE DURATION OF THE CONTRACT. IF THE ACTUAL FUEL FIRED IS A BLEND OF SOLID FUELS, SUBMIT APPROPRIATE PORTIONS OF ALL
FUEL CONTRACTS AND SET FORTH THE MANNER IN WHICH THE FUELS ARE BLENDED AND ACTUALLY FRIED. REFERENCE THIS
INFORMATION TO THIS FORM.
�
�
�
Application Revision 5/14/2012, Page 113 of 131

Page ______ of ______
APC 240
*EMISSION INFORMATION
35. NUMBER OF IDENTICAL SOURCES (DESCRIBE AS REQUIRED):
AVERAGE OPERATION
CONTAMINANT
CONCENTRATION OR EMISSION RATE PER IDENTICAL
SOURCE
METHOD USED TO DETERMINE CONCENTRATION OR
EMISSION RATE
PARTICULATE
MATTER
36a.
GR/SCF
b. LB/106 BTU
LB/HR
c.
CARBON
MONOXIDE
37a. PPM
(VOL)
b. LB/106 BTU
LB/HR
c.
NITROGEN
OXIDES
38a. PPM
(VOL)
b. LB/106 BTU
LB/HR
c.
ORGANIC
MATERIAL
39a. PPM
(VOL)
b. LB/106 BTU
LB/HR
c.
SULFUR
DIOXIDE
40a. PPM
(VOL)
b. LB/106 BTU
LB/HR
c.
MAXIMUM OPERATION
CONTAMINANT
CONCENTRATION OR EMISSION RATE PER IDENTICAL
SOURCE
METHOD USED TO DETERMINE CONCENTRATION OR
EMISSION RATE
PARTICULATE
MATTER
41a.
GR/SCF
b. LB/106 BTU
LB/HR
c.
CARBON
MONOXIDE
42a. PPM
(VOL)
b. LB/106 BTU
LB/HR
c.
NITROGEN
OXIDES
43a. PPM
(VOL)
b. LB/106 BTU
LB/HR
c.
ORGANIC
MATERIAL
44a. PPM
(VOL)
b. LB/106 BTU
LB/HR
c.
SULFUR
DIOXIDE
45a. PPM
(VOL)
b. LB/106 BTU
LB/HR
c.
* IF EMISSIONS ARE EXHAUSTED THROUGH AIR POLLUTION CONTROL EQUIPMENT, OR IF NATURAL GAS IS THE FUEL FIRED, ITEMS 36
THROUGH 47 NEED NOT BE COMPLETED.
**EXHAUST POINT INFORMATION
46. FLOW DIAGRAM DESIGNATION(S) OF EXHAUST POINT:
47. DESCRIPTION OF EXHAUST POINT (LOCATION IN RELATION TO BUILDINGS, DIRECTION, HOODING, ETC.):
48. EXIT HEIGHT ABOVE GRADE: 50. EXIT DIAMETER:
49. GREATEST HEIGHT OF NEARBY BUILDINGS: 51. EXIT DISTANCE FROM NEAREST PLANT BOUNDARY:
FT
AVERAGE OPERATION MAXIMUM OPERATION
52. EXIT GAS TEMPERATURE:
�F
54. EXIT GAS TEMPERATURE:
�F
53. GAS FLOW RATE THROUGH EACH EXIT:
ACFM
55. GAS FLOW RATE THROUGH EACH EXIT:
ACFM
** IF EMISSIONS ARE EXHAUSTED THROUGH AIR POLLUTION CONTROL EQUIPMENT THIS SECTION SHOULD NOT BE COMPLETED.
See Attachment 4 to APC 240
See Attachment 5 to APC 240
Application Revision 5/14/2012, Page 114 of 131

STATE OF ILLINOIS
ENVIRONMENTAL PROTECTION AGENCY
DIVISION OF AIR POLLUTION CONTROL
1021 NORTH GRAND AVENUE, EAST
SPRINGFIELD, ILLINOIS 62702
Page ______ of ______
IL 532-0260
APC 260 Rev. 12/15/78
* DATA AND INFORMATION
AIR POLLUTION CONTROL EQUIPMENT
* THIS INFORMATION FORM IS TO BE COMPLETED FOR AN EMISSION SOURCE OTHER THAN A FUEL COMBUSTION EMISSION SOURCE OR AN
INCINERATOR. A FUEL COMBUSTION EMISSION SOURCE IS A FURNACE, BOILER, OR SIMILAR EQUIPMENT USED PRIMARILY FOR
PRODUCING HEAT OR POWER BY INDIRECT HEAT TRANSFER. AN INCINERATOR IS AN APPARATUS IN WHICH REFUSE IS BURNED.
1. NAME OF OWNER:
2. NAME OF CORPORATE DIVISION OR PLANT (IF DIFFERENT FROM
OWNER):
3. STREET ADDRESS OF CONTROL EQUIPMENT:
4. CITY OF CONTROL EQUIPMENT
5. NAME OF CONTROL EQUIPMENT OR CONTROL SYSTEM:
INSTRUCTIONS
1. COMPLETE THE ABOVE IDENTIFICATION SECTION.
2. COMPLETE THE APPROPRIATE SECTION FOR THE UNIT OF CONTROL EQUIPMENT, OR THE APPROPRIATE SECTIONS FOR THE CONTROL
SYSTEM. BE CERTAIN THAT THE ARRANGEMENT OF VARIOUS UNITS IN A CONTROL SYSTEM IS MADE CLEAR IN THE PROCESS FLOW
DIAGRAM.
3. COMPLETE PAGE 6 OF THIS FORM, EMISSION INFORMATION AND EXHAUST POINT INFORMATION.
4. EFFICIENCY VALUES SHOULD BE SUPPORTED WITH A DETAILED EXPLANATION OF THE METHOD OF CALCULATION, THE MANNER OF
ESTIMATION, OR THE SOURCE OF INFORMATION. REFERENCE TO THIS FORM ANY RELEVANT INFORMATION OR EXPLANATION
INCLUDED IN THIS PERMIT APPLICATION.
5. EFFICIENCY VALUES AND CERTAIN OTHER ITEMS OF INFORMATION ARE TO BE GIVEN FOR AVERAGE AND MAXIMUM OPERATION OR
THE SOURCE EQUIPMENT. FOR EXAMPLE, “MAXIMUM EFFICIENCY” IS THE EFFICIENCY OF THE CONTROL EQUIPMENT WHEN THE
SOURCE IS AT MAXIMUM OPERATION, AND “AVERAGE FLOW RATE” IS THE FLOW RATE INTO HE CONTROL EQUIPMENT WHEN THE
SOURCE IS AT AVERAGE OPERATION.
6. FOR GENERAL INFORMATION REFER TO “GENERAL INSTRUCTIONS FOR PERMIT APPLICATIONS,” APC-201.
DEFINITIONS
AVERAGE - THE VALUE THAT SUMMARIZES OR REPRESENTS THE GENERAL CONDITION OF THE EMISSION SOURCE, OR THE GENERAL
STATE OF PRODUCTION OF THE EMISSION SOURCE. SPECIFICALLY:
AVERAGE OPERATION - OPERATION TYPICAL OF THE PRECEDING TWELVE MONTH PERIOD, AS REPRESENTED BY AVERAGE OPERATING
TIME AND AVERAGE RATES.
MAXIMUM - THE GREATEST VALUE ATTAINABLE OR ATTAINED FOR THE EMISSION SOURCE, OR THE PERIOD OF GREATEST OR UTMOST
PRODUCTION OF THE EMISSION SOURCE. SPECIFICALLY:
MAXIMUM OPERATION - GREATEST EXPECTED OPERATION, AS REPRESENTED BY MAXIMUM OPERATING TIME AND MAXIMUM RATES.
This Agency is authorized to require this information under Illinois Revised Statutes, 1979, Chapter 111 1/2, Section 1039. Disclosure of this information is required
under that Section. Failure to do so may prevent this form from being processed and could result in your application being denied. This form has been approved by the
Forms Management Center.
Mississippi Sand, LLC. Same as Owner
2320 Creve Coeur Mill Rd LaSalle County, Ottawa Township
Baghouse (Fabric Filter) Dust Collector
Application Revision 5/14/2012, Page 115 of 131

IL 532-0260
APC 260
FILTER UNIT
1. FLOW DIAGRAM DESIGNATION(S) OF FILTER UNIT:
2. MANUFACTURER: 3. MODEL NAME AND NUMBER:
4. FILTERING MATERIAL: 5. FILTERING AREA:
FT2
6. CLEANING METHOD:
SHAKER REVERSE AIR PULSE AIR PULSE JET OTHER: SPECIFY ____________________
7. GAS COOLING METHOD: DUCT WORK: LENGTH _____________ FT., DIAM _____________ IN.
BLEED-IN AIR WATER SPRAY OTHER: SPECIFY ____________________
AVERAGE OPERATION OF SOURCE MAXIMUM OPERATION OF SOURCE
8. GAS FLOW RATE (FROM SOURCE):
SCFM
12. GAS FLOW RATE (FROM SOURCE):
SCFM
9. GAS COOLING FLOW RATE:
BLEED-IN AIR _________ SCFM, WATER SPRAY _________ GPM
13. GAS COOLING FLOW RATE:
BLEED-IN AIR _________ SCFM, WATER SPRAY _________ GPM
10. INLET GAS CONDITION:
TEMPERATURE _________ �F DEWPOINT _________ �F
14. INLET GAS CONDITION:
TEMPERATURE _________ �F DEWPOINT _________ �F
11. EFFICIENCY OF FILTER UNIT (SEE INSTRUCTION 4):
%
15. EFFICIENCY OF FILTER UNIT (SEE INSTRUCTION 4):
%
BGH01
To be determined (TBD) TBD
TBD TBD
NA
20800 20800
-- -- -- -
250 -- 250 --
99.9 99.9
Application Revision 5/14/2012, Page 116 of 131

IL 532-0260
APC 260
EMISSION INFORMATION
1. NUMBER OF IDENTICAL CONTROL UNITS OR CONTROL SYSTEMS (DESCRIBE AS REQUIRED):
AVERAGE OPERATION
CONTAMINANT
CONCENTRATION OR EMISSION RATE PER IDENTICAL
CONTROL UNITS OR CONTROL SYSTEM
METHOD USED TO DETERMINE CONCENTRATION OR
EMISSION RATE
PARTICULATE
MATTER
2a.
GR/SCF
b.
LB/HR
c.
CARBON
MONOXIDE
3a. PPM
(VOL)
b.
LB/HR
c.
NITROGEN
OXIDES
4a. PPM
(VOL)
b.
LB/HR
c.
ORGANIC
MATERIAL
5a. PPM
(VOL)
b.
LB/HR
c.
SULFUR
DIOXIDE
6a. PPM
(VOL)
b.
LB/HR
c.
**OTHER
(SPECIFY)
7a. PPM
(VOL)
b.
LB/HR
c.
MAXIMUM OPERATION
CONTAMINANT
CONCENTRATION OR EMISSION RATE PER IDENTICAL
CONTROL UNITS OR CONTROL SYSTEM
METHOD USED TO DETERMINE CONCENTRATION OR
EMISSION RATE
PARTICULATE
MATTER
8a.
GR/SCF
b.
LB/HR
c.
CARBON
MONOXIDE
9a. PPM
(VOL)
b.
LB/HR
c.
NITROGEN
OXIDES
10a. PPM
(VOL)
b.
LB/HR
c.
ORGANIC
MATERIAL
11a. PPM
(VOL)
b.
LB/HR
c.
SULFUR
DIOXIDE
12a. PPM
(VOL)
b.
LB/HR
c.
**OTHER
(SPECIFY)
13a. PPM
(VOL)
b.
LB/HR
c.
**“OTHER” CONTAMINANT SHOULD BE USED FOR AN AIR CONTAMINANT NOT SPECIFICALLY NAMED ABOVE. POSSIBLE OTHER
CONTAMINANTS ARE ASBESTOS, BERYLLIUM, MERCURY, VINYL CHLORIDE, LEAD, ETC.
EXHAUST POINT INFORMATION
1. FLOW DIAGRAM DESIGNATION(S) OF EXHAUST POINT:
2. DESCRIPTION OF EXHAUST POINT (LOCATION IN RELATION TO BUILDINGS, DIRECTION, HOODING, ETC.):
3. EXIT HEIGHT ABOVE GRADE: 4. EXIT DIAMETER:
5. GREATEST HEIGHT OF NEARBY BUILDINGS: 6. EXIT DISTANCE FROM NEAREST PLANT BOUNDARY:
AVERAGE OPERATION MAXIMUM OPERATION
7. EXIT GAS TEMPERATURE:
�F
9. EXIT GAS TEMPERATURE:
�F
8. GAS FLOW RATE THROUGH EACH EXIT:
ACFM
10. GAS FLOW RATE THROUGH EACH EXIT:
ACFM
See Attachment 4 to APC 220
See Attachment 5 to APC 260
Application Revision 5/14/2012, Page 117 of 131

ATTACHMENTS 1 THROUGH 4 TO APC220
N.G. Combustion: Total Carbon Dioxide Emissions (TPY): 28908
A. Carbon Dioxide Emissions by Equipment Unit ID (EID):
(1)Item
(3)Emission Unit Desription
(4)Max Short Term Throughput
(5)Max Annual Throughput
(6)Emission Factor
(7)* Capture
Efficiency(10)TPM
(11)TPY
(2)EID
(8)**Control
Efficiency(9)
Control Description(12)
Emission Factor Reference ID
56 mmBtu/hr (HHV) Dryer 40.2 million scf N.G./month 481.8 million scf N.G./year 120000 lb/million scf N.G. NA 2409.0000 28908.00BR0181 NA Uncontrolled DRY01 Combustion
B. Proposed Permit Limits for Carbon Dioxide from N.G. Combustion:
40.2 million scf N.G./month 481.8 million scf N.G./year 28908.002409.0000
E. Notes:
As defined in I.A. (7), (8) and (9) for sources with capture and/or control efficiencies for pollution control equipment.
*The term “capture system” for the purpose of this application means the equipment (including hoods, ducts, etc.) used to contain, capture, or transport an air contaminant to a control device. In addition, the term “capture efficiency” means the weight per unit time of an air contaminant entering a capture system and delivered to a control device, divided by the weight per unit time of the air contaminant generated by the source, expressed as a percentage. Therefore, if the emission unit is not exhausted to a control device, the capture system and capture efficiency is not applicable (NA). If the emission unit is using an emission factor with an overall emission reduction efficiency included in the factor, “AP‐42” has been assigned to the capture efficiency.
**The term “control system” for the purpose of this application means any control device or technique which is designed and operated to reduce the quantity of air contaminants emitted to the atmosphere. The term “control efficiency” means the percentage by which a control device or technique reduces the emissions from a stationary source. If the emission unit is controlled by a control device, the capture and control efficiencies are identified. If the emission unit is using an emission factor with an overall emission reduction efficiency included in the factor, “AP‐42” has been assigned to the control efficiency.
C. Emission Factor Source by Reference ID:
DRY01 Combustion AP‐42, TABLE 1.4‐2. Emission Factors for Criteria Pollutants and Greenhouse Gases from Natural Gas Combustion Gas Combustion
D. Example Calculation for Item 81:
0.055 million scf N.G.
hour
120000 lb
million scf N.G. * ((1 ‐ 100 % capture/100) + (1 ‐ 0 % control/100))
ton
2000 lb=
year
28908 ton CO2
year
8760 Hours
Application Revision 5/14/2012, Page 118 of 131

ATTACHMENTS 1 THROUGH 4 TO APC220
N.G. Combustion: Total Carbon Monoxide Emissions (TPY): 58.97
A. Carbon Monoxide Emissions by Equipment Unit ID (EID):
(1)Item
(3)Emission Unit Desription
(4)Max Short Term Throughput
(5)Max Annual Throughput
(6)Emission Factor
(7)* Capture
Efficiency(10)TPM
(11)TPY
(2)EID
(8)**Control
Efficiency(9)
Control Description(12)
Emission Factor Reference ID
56 mmBtu/hr (HHV) Dryer 40.2 million scf N.G./month 481.8 million scf N.G./year 244.8 lb/million scf N.G. NA 4.9144 58.97BR0181 NA Uncontrolled DRY01 Combustion
B. Proposed Permit Limits for Carbon Monoxide from N.G. Combustion:
40.2 million scf N.G./month 481.8 million scf N.G./year 58.974.9144
E. Notes:
As defined in I.A. (7), (8) and (9) for sources with capture and/or control efficiencies for pollution control equipment.
*The term “capture system” for the purpose of this application means the equipment (including hoods, ducts, etc.) used to contain, capture, or transport an air contaminant to a control device. In addition, the term “capture efficiency” means the weight per unit time of an air contaminant entering a capture system and delivered to a control device, divided by the weight per unit time of the air contaminant generated by the source, expressed as a percentage. Therefore, if the emission unit is not exhausted to a control device, the capture system and capture efficiency is not applicable (NA). If the emission unit is using an emission factor with an overall emission reduction efficiency included in the factor, “AP‐42” has been assigned to the capture efficiency.
**The term “control system” for the purpose of this application means any control device or technique which is designed and operated to reduce the quantity of air contaminants emitted to the atmosphere. The term “control efficiency” means the percentage by which a control device or technique reduces the emissions from a stationary source. If the emission unit is controlled by a control device, the capture and control efficiencies are identified. If the emission unit is using an emission factor with an overall emission reduction efficiency included in the factor, “AP‐42” has been assigned to the control efficiency.
C. Emission Factor Source by Reference ID:
DRY01 Combustion Manufacturer's guarantee
D. Example Calculation for Item 81:
0.055 million scf N.G.
hour
244.8 lb
million scf N.G. * ((1 ‐ 100 % capture/100) + (1 ‐ 0 % control/100))
ton
2000 lb=
year
58.97 ton CO
year
8760 Hours
Application Revision 5/14/2012, Page 119 of 131

ATTACHMENTS 1 THROUGH 4 TO APC220
N.G. Combustion: Total Nitrogen Oxides Emissions (TPY): 41.77
A. Nitrogen Oxides Emissions by Equipment Unit ID (EID):
(1)Item
(3)Emission Unit Desription
(4)Max Short Term Throughput
(5)Max Annual Throughput
(6)Emission Factor
(7)* Capture
Efficiency(10)TPM
(11)TPY
(2)EID
(8)**Control
Efficiency(9)
Control Description(12)
Emission Factor Reference ID
56 mmBtu/hr (HHV) Dryer 40.2 million scf N.G./month 481.8 million scf N.G./year 173.4 lb/million scf N.G. NA 3.4810 41.77BR0181 NA Uncontrolled DRY01 Combustion
B. Proposed Permit Limits for Nitrogen Oxides from N.G. Combustion:
40.2 million scf N.G./month 481.8 million scf N.G./year 41.773.4810
E. Notes:
As defined in I.A. (7), (8) and (9) for sources with capture and/or control efficiencies for pollution control equipment.
*The term “capture system” for the purpose of this application means the equipment (including hoods, ducts, etc.) used to contain, capture, or transport an air contaminant to a control device. In addition, the term “capture efficiency” means the weight per unit time of an air contaminant entering a capture system and delivered to a control device, divided by the weight per unit time of the air contaminant generated by the source, expressed as a percentage. Therefore, if the emission unit is not exhausted to a control device, the capture system and capture efficiency is not applicable (NA). If the emission unit is using an emission factor with an overall emission reduction efficiency included in the factor, “AP‐42” has been assigned to the capture efficiency.
**The term “control system” for the purpose of this application means any control device or technique which is designed and operated to reduce the quantity of air contaminants emitted to the atmosphere. The term “control efficiency” means the percentage by which a control device or technique reduces the emissions from a stationary source. If the emission unit is controlled by a control device, the capture and control efficiencies are identified. If the emission unit is using an emission factor with an overall emission reduction efficiency included in the factor, “AP‐42” has been assigned to the control efficiency.
C. Emission Factor Source by Reference ID:
DRY01 Combustion Manufacturer's guarantee
D. Example Calculation for Item 81:
0.055 million scf N.G.
hour
173.4 lb
million scf N.G. * ((1 ‐ 100 % capture/100) + (1 ‐ 0 % control/100))
ton
2000 lb=
year
41.77 ton NOx
year
8760 Hours
Application Revision 5/14/2012, Page 120 of 131

ATTACHMENTS 1 THROUGH 4 TO APC220
N.G. Combustion: Total PM Emissions (TPY): 0
A. PM Emissions by Equipment Unit ID (EID):
(1)Item
(3)Emission Unit Desription
(4)Max Short Term Throughput
(5)Max Annual Throughput
(6)Emission Factor
(7)* Capture
Efficiency(10)TPM
(11)TPY
(2)EID
(8)**Control
Efficiency(9)
Control Description(12)
Emission Factor Reference ID
56 mmBtu/hr (HHV) Dryer 40.2 million scf N.G./month 481.8 million scf N.G./year 7.6 lb/million scf N.G. NA 0.0002 0.00BR0181 NA Uncontrolled DRY01 Combustion
B. Proposed Permit Limits for PM from N.G. Combustion:
40.2 million scf N.G./month 481.8 million scf N.G./year 0.000.0002
E. Notes:
As defined in I.A. (7), (8) and (9) for sources with capture and/or control efficiencies for pollution control equipment.
*The term “capture system” for the purpose of this application means the equipment (including hoods, ducts, etc.) used to contain, capture, or transport an air contaminant to a control device. In addition, the term “capture efficiency” means the weight per unit time of an air contaminant entering a capture system and delivered to a control device, divided by the weight per unit time of the air contaminant generated by the source, expressed as a percentage. Therefore, if the emission unit is not exhausted to a control device, the capture system and capture efficiency is not applicable (NA). If the emission unit is using an emission factor with an overall emission reduction efficiency included in the factor, “AP‐42” has been assigned to the capture efficiency.
**The term “control system” for the purpose of this application means any control device or technique which is designed and operated to reduce the quantity of air contaminants emitted to the atmosphere. The term “control efficiency” means the percentage by which a control device or technique reduces the emissions from a stationary source. If the emission unit is controlled by a control device, the capture and control efficiencies are identified. If the emission unit is using an emission factor with an overall emission reduction efficiency included in the factor, “AP‐42” has been assigned to the control efficiency.
C. Emission Factor Source by Reference ID:
DRY01 Combustion AP‐42, TABLE 1.4‐2. Emission Factors for Criteria Pollutants and Greenhouse Gases from Natural Gas Combustion Gas Combustion
D. Example Calculation for Item 81:
0.055 million scf N.G.
hour
7.6 lb
million scf N.G.* ((1 ‐ 100 % capture/100) + (1 ‐ 99.9 % control/100))
ton
2000 lb=
year
0 ton PM
year
8760 Hours
Application Revision 5/14/2012, Page 121 of 131

ATTACHMENTS 1 THROUGH 4 TO APC220
N.G. Combustion: Total PM‐10 Emissions (TPY): 0
A. PM‐10 Emissions by Equipment Unit ID (EID):
(1)Item
(3)Emission Unit Desription
(4)Max Short Term Throughput
(5)Max Annual Throughput
(6)Emission Factor
(7)* Capture
Efficiency(10)TPM
(11)TPY
(2)EID
(8)**Control
Efficiency(9)
Control Description(12)
Emission Factor Reference ID
56 mmBtu/hr (HHV) Dryer 40.2 million scf N.G./month 481.8 million scf N.G./year 7.6 lb/million scf N.G. NA 0.0002 0.00BR0181 NA Uncontrolled DRY01 Combustion
B. Proposed Permit Limits for PM‐10 from N.G. Combustion:
40.2 million scf N.G./month 481.8 million scf N.G./year 0.000.0002
E. Notes:
As defined in I.A. (7), (8) and (9) for sources with capture and/or control efficiencies for pollution control equipment.
*The term “capture system” for the purpose of this application means the equipment (including hoods, ducts, etc.) used to contain, capture, or transport an air contaminant to a control device. In addition, the term “capture efficiency” means the weight per unit time of an air contaminant entering a capture system and delivered to a control device, divided by the weight per unit time of the air contaminant generated by the source, expressed as a percentage. Therefore, if the emission unit is not exhausted to a control device, the capture system and capture efficiency is not applicable (NA). If the emission unit is using an emission factor with an overall emission reduction efficiency included in the factor, “AP‐42” has been assigned to the capture efficiency.
**The term “control system” for the purpose of this application means any control device or technique which is designed and operated to reduce the quantity of air contaminants emitted to the atmosphere. The term “control efficiency” means the percentage by which a control device or technique reduces the emissions from a stationary source. If the emission unit is controlled by a control device, the capture and control efficiencies are identified. If the emission unit is using an emission factor with an overall emission reduction efficiency included in the factor, “AP‐42” has been assigned to the control efficiency.
C. Emission Factor Source by Reference ID:
DRY01 Combustion AP‐42, TABLE 1.4‐2. Emission Factors for Criteria Pollutants and Greenhouse Gases from Natural Gas Combustion Gas Combustion
D. Example Calculation for Item 81:
0.055 million scf N.G.
hour
7.6 lb
million scf N.G.* ((1 ‐ 100 % capture/100) + (1 ‐ 99.9 % control/100))
ton
2000 lb=
year
0 ton PM‐10
year
8760 Hours
Application Revision 5/14/2012, Page 122 of 131

ATTACHMENTS 1 THROUGH 4 TO APC220
N.G. Combustion: Total PM2.5 Emissions (TPY): 0.18
A. PM2.5 Emissions by Equipment Unit ID (EID):
(1)Item
(3)Emission Unit Desription
(4)Max Short Term Throughput
(5)Max Annual Throughput
(6)Emission Factor
(7)* Capture
Efficiency(10)TPM
(11)TPY
(2)EID
(8)**Control
Efficiency(9)
Control Description(12)
Emission Factor Reference ID
56 mmBtu/hr (HHV) Dryer 40.2 million scf N.G./month 481.8 million scf N.G./year 7.6 lb/million scf N.G. NA 0.0153 0.18BR0181 NA Uncontrolled DRY01 Combustion
B. Proposed Permit Limits for PM2.5 from N.G. Combustion:
40.2 million scf N.G./month 481.8 million scf N.G./year 0.180.0153
E. Notes:
As defined in I.A. (7), (8) and (9) for sources with capture and/or control efficiencies for pollution control equipment.
*The term “capture system” for the purpose of this application means the equipment (including hoods, ducts, etc.) used to contain, capture, or transport an air contaminant to a control device. In addition, the term “capture efficiency” means the weight per unit time of an air contaminant entering a capture system and delivered to a control device, divided by the weight per unit time of the air contaminant generated by the source, expressed as a percentage. Therefore, if the emission unit is not exhausted to a control device, the capture system and capture efficiency is not applicable (NA). If the emission unit is using an emission factor with an overall emission reduction efficiency included in the factor, “AP‐42” has been assigned to the capture efficiency.
**The term “control system” for the purpose of this application means any control device or technique which is designed and operated to reduce the quantity of air contaminants emitted to the atmosphere. The term “control efficiency” means the percentage by which a control device or technique reduces the emissions from a stationary source. If the emission unit is controlled by a control device, the capture and control efficiencies are identified. If the emission unit is using an emission factor with an overall emission reduction efficiency included in the factor, “AP‐42” has been assigned to the control efficiency.
C. Emission Factor Source by Reference ID:
DRY01 Combustion AP‐42, TABLE 1.4‐2. Emission Factors for Criteria Pollutants and Greenhouse Gases from Natural Gas Combustion Gas Combustion
D. Example Calculation for Item 81:
0.055 million scf N.G.
hour
7.6 lb
million scf N.G. * ((1 ‐ 100 % capture/100) + (1 ‐ 90 % control/100))
ton
2000 lb=
year
0.18 ton PM2.5
year
8760 Hours
Application Revision 5/14/2012, Page 123 of 131

ATTACHMENTS 1 THROUGH 4 TO APC220
N.G. Combustion: Total Sulfur Dioxide Emissions (TPY): 0.14
A. Sulfur Dioxide Emissions by Equipment Unit ID (EID):
(1)Item
(3)Emission Unit Desription
(4)Max Short Term Throughput
(5)Max Annual Throughput
(6)Emission Factor
(7)* Capture
Efficiency(10)TPM
(11)TPY
(2)EID
(8)**Control
Efficiency(9)
Control Description(12)
Emission Factor Reference ID
56 mmBtu/hr (HHV) Dryer 40.2 million scf N.G./month 481.8 million scf N.G./year 0.6 lb/million scf N.G. NA 0.0120 0.14BR0181 NA Uncontrolled DRY01 Combustion
B. Proposed Permit Limits for Sulfur Dioxide from N.G. Combustion:
40.2 million scf N.G./month 481.8 million scf N.G./year 0.140.0120
E. Notes:
As defined in I.A. (7), (8) and (9) for sources with capture and/or control efficiencies for pollution control equipment.
*The term “capture system” for the purpose of this application means the equipment (including hoods, ducts, etc.) used to contain, capture, or transport an air contaminant to a control device. In addition, the term “capture efficiency” means the weight per unit time of an air contaminant entering a capture system and delivered to a control device, divided by the weight per unit time of the air contaminant generated by the source, expressed as a percentage. Therefore, if the emission unit is not exhausted to a control device, the capture system and capture efficiency is not applicable (NA). If the emission unit is using an emission factor with an overall emission reduction efficiency included in the factor, “AP‐42” has been assigned to the capture efficiency.
**The term “control system” for the purpose of this application means any control device or technique which is designed and operated to reduce the quantity of air contaminants emitted to the atmosphere. The term “control efficiency” means the percentage by which a control device or technique reduces the emissions from a stationary source. If the emission unit is controlled by a control device, the capture and control efficiencies are identified. If the emission unit is using an emission factor with an overall emission reduction efficiency included in the factor, “AP‐42” has been assigned to the control efficiency.
C. Emission Factor Source by Reference ID:
DRY01 Combustion AP‐42, TABLE 1.4‐2. Emission Factors for Criteria Pollutants and Greenhouse Gases from Natural Gas Combustion Gas Combustion
D. Example Calculation for Item 81:
0.055 million scf N.G.
hour
0.6 lb
million scf N.G. * ((1 ‐ 100 % capture/100) + (1 ‐ 0 % control/100))
ton
2000 lb=
year
0.14 ton SO2
year
8760 Hours
Application Revision 5/14/2012, Page 124 of 131

ATTACHMENTS 1 THROUGH 4 TO APC220
N.G. Combustion: Total Volatile Organic Compounds Emissions (TPY): 1.32
A. Volatile Organic Compounds Emissions by Equipment Unit ID (EID):
(1)Item
(3)Emission Unit Desription
(4)Max Short Term Throughput
(5)Max Annual Throughput
(6)Emission Factor
(7)* Capture
Efficiency(10)TPM
(11)TPY
(2)EID
(8)**Control
Efficiency(9)
Control Description(12)
Emission Factor Reference ID
56 mmBtu/hr (HHV) Dryer 40.2 million scf N.G./month 481.8 million scf N.G./year 5.5 lb/million scf N.G. NA 0.1104 1.32BR0181 NA Uncontrolled DRY01 Combustion
B. Proposed Permit Limits for Volatile Organic Compounds from N.G. Combustion:
40.2 million scf N.G./month 481.8 million scf N.G./year 1.320.1104
E. Notes:
As defined in I.A. (7), (8) and (9) for sources with capture and/or control efficiencies for pollution control equipment.
*The term “capture system” for the purpose of this application means the equipment (including hoods, ducts, etc.) used to contain, capture, or transport an air contaminant to a control device. In addition, the term “capture efficiency” means the weight per unit time of an air contaminant entering a capture system and delivered to a control device, divided by the weight per unit time of the air contaminant generated by the source, expressed as a percentage. Therefore, if the emission unit is not exhausted to a control device, the capture system and capture efficiency is not applicable (NA). If the emission unit is using an emission factor with an overall emission reduction efficiency included in the factor, “AP‐42” has been assigned to the capture efficiency.
**The term “control system” for the purpose of this application means any control device or technique which is designed and operated to reduce the quantity of air contaminants emitted to the atmosphere. The term “control efficiency” means the percentage by which a control device or technique reduces the emissions from a stationary source. If the emission unit is controlled by a control device, the capture and control efficiencies are identified. If the emission unit is using an emission factor with an overall emission reduction efficiency included in the factor, “AP‐42” has been assigned to the control efficiency.
C. Emission Factor Source by Reference ID:
DRY01 Combustion AP‐42, TABLE 1.4‐2. Emission Factors for Criteria Pollutants and Greenhouse Gases from Natural Gas Combustion Gas Combustion
D. Example Calculation for Item 81:
0.055 million scf N.G.
hour
5.5 lb
million scf N.G. * ((1 ‐ 100 % capture/100) + (1 ‐ 0 % control/100))
ton
2000 lb=
year
1.32 ton VOM
year
8760 Hours
Application Revision 5/14/2012, Page 125 of 131
STATE OF ILLINOIS
ENVIRONMENTAL PROTECTION AGENCY
DIVISION OF AIR POLLUTION CONTROL
1021 NORTH GRAND AVENUE, EAST
SPRINGFIELD, ILLINOIS 62702
Page ______ of ______
IL 532-0260
APC 260 Rev. 12/15/78
* DATA AND INFORMATION
AIR POLLUTION CONTROL EQUIPMENT
* THIS INFORMATION FORM IS TO BE COMPLETED FOR AN EMISSION SOURCE OTHER THAN A FUEL COMBUSTION EMISSION SOURCE OR AN
INCINERATOR. A FUEL COMBUSTION EMISSION SOURCE IS A FURNACE, BOILER, OR SIMILAR EQUIPMENT USED PRIMARILY FOR
PRODUCING HEAT OR POWER BY INDIRECT HEAT TRANSFER. AN INCINERATOR IS AN APPARATUS IN WHICH REFUSE IS BURNED.
1. NAME OF OWNER:
2. NAME OF CORPORATE DIVISION OR PLANT (IF DIFFERENT FROM
OWNER):
3. STREET ADDRESS OF CONTROL EQUIPMENT:
4. CITY OF CONTROL EQUIPMENT
5. NAME OF CONTROL EQUIPMENT OR CONTROL SYSTEM:
INSTRUCTIONS
1. COMPLETE THE ABOVE IDENTIFICATION SECTION.
2. COMPLETE THE APPROPRIATE SECTION FOR THE UNIT OF CONTROL EQUIPMENT, OR THE APPROPRIATE SECTIONS FOR THE CONTROL
SYSTEM. BE CERTAIN THAT THE ARRANGEMENT OF VARIOUS UNITS IN A CONTROL SYSTEM IS MADE CLEAR IN THE PROCESS FLOW
DIAGRAM.
3. COMPLETE PAGE 6 OF THIS FORM, EMISSION INFORMATION AND EXHAUST POINT INFORMATION.
4. EFFICIENCY VALUES SHOULD BE SUPPORTED WITH A DETAILED EXPLANATION OF THE METHOD OF CALCULATION, THE MANNER OF
ESTIMATION, OR THE SOURCE OF INFORMATION. REFERENCE TO THIS FORM ANY RELEVANT INFORMATION OR EXPLANATION
INCLUDED IN THIS PERMIT APPLICATION.
5. EFFICIENCY VALUES AND CERTAIN OTHER ITEMS OF INFORMATION ARE TO BE GIVEN FOR AVERAGE AND MAXIMUM OPERATION OR
THE SOURCE EQUIPMENT. FOR EXAMPLE, “MAXIMUM EFFICIENCY” IS THE EFFICIENCY OF THE CONTROL EQUIPMENT WHEN THE
SOURCE IS AT MAXIMUM OPERATION, AND “AVERAGE FLOW RATE” IS THE FLOW RATE INTO HE CONTROL EQUIPMENT WHEN THE
SOURCE IS AT AVERAGE OPERATION.
6. FOR GENERAL INFORMATION REFER TO “GENERAL INSTRUCTIONS FOR PERMIT APPLICATIONS,” APC-201.
DEFINITIONS
AVERAGE - THE VALUE THAT SUMMARIZES OR REPRESENTS THE GENERAL CONDITION OF THE EMISSION SOURCE, OR THE GENERAL
STATE OF PRODUCTION OF THE EMISSION SOURCE. SPECIFICALLY:
AVERAGE OPERATION - OPERATION TYPICAL OF THE PRECEDING TWELVE MONTH PERIOD, AS REPRESENTED BY AVERAGE OPERATING
TIME AND AVERAGE RATES.
MAXIMUM - THE GREATEST VALUE ATTAINABLE OR ATTAINED FOR THE EMISSION SOURCE, OR THE PERIOD OF GREATEST OR UTMOST
PRODUCTION OF THE EMISSION SOURCE. SPECIFICALLY:
MAXIMUM OPERATION - GREATEST EXPECTED OPERATION, AS REPRESENTED BY MAXIMUM OPERATING TIME AND MAXIMUM RATES.
This Agency is authorized to require this information under Illinois Revised Statutes, 1979, Chapter 111 1/2, Section 1039. Disclosure of this information is required
under that Section. Failure to do so may prevent this form from being processed and could result in your application being denied. This form has been approved by the
Forms Management Center.
Mississippi Sand, LLC. Same as Owner
2320 Creve Coeur Mill Rd LaSalle County, Ottawa Township
Baghouse (Fabric Filter) Dust Collector
Application Revision 5/14/2012, Page 126 of 131

IL 532-0260
APC 260
FILTER UNIT
1. FLOW DIAGRAM DESIGNATION(S) OF FILTER UNIT:
2. MANUFACTURER: 3. MODEL NAME AND NUMBER:
4. FILTERING MATERIAL: 5. FILTERING AREA:
FT2
6. CLEANING METHOD:
SHAKER REVERSE AIR PULSE AIR PULSE JET OTHER: SPECIFY ____________________
7. GAS COOLING METHOD: DUCT WORK: LENGTH _____________ FT., DIAM _____________ IN.
BLEED-IN AIR WATER SPRAY OTHER: SPECIFY ____________________
AVERAGE OPERATION OF SOURCE MAXIMUM OPERATION OF SOURCE
8. GAS FLOW RATE (FROM SOURCE):
SCFM
12. GAS FLOW RATE (FROM SOURCE):
SCFM
9. GAS COOLING FLOW RATE:
BLEED-IN AIR _________ SCFM, WATER SPRAY _________ GPM
13. GAS COOLING FLOW RATE:
BLEED-IN AIR _________ SCFM, WATER SPRAY _________ GPM
10. INLET GAS CONDITION:
TEMPERATURE _________ �F DEWPOINT _________ �F
14. INLET GAS CONDITION:
TEMPERATURE _________ �F DEWPOINT _________ �F
11. EFFICIENCY OF FILTER UNIT (SEE INSTRUCTION 4):
%
15. EFFICIENCY OF FILTER UNIT (SEE INSTRUCTION 4):
%
BGH01
To be determined (TBD) TBD
TBD TBD
NA
20800 20800
-- -- -- -
250 -- 250 --
99.9 99.9
Application Revision 5/14/2012, Page 127 of 131

IL 532-0260
APC 260
EMISSION INFORMATION
1. NUMBER OF IDENTICAL CONTROL UNITS OR CONTROL SYSTEMS (DESCRIBE AS REQUIRED):
AVERAGE OPERATION
CONTAMINANT
CONCENTRATION OR EMISSION RATE PER IDENTICAL
CONTROL UNITS OR CONTROL SYSTEM
METHOD USED TO DETERMINE CONCENTRATION OR
EMISSION RATE
PARTICULATE
MATTER
2a.
GR/SCF
b.
LB/HR
c.
CARBON
MONOXIDE
3a. PPM
(VOL)
b.
LB/HR
c.
NITROGEN
OXIDES
4a. PPM
(VOL)
b.
LB/HR
c.
ORGANIC
MATERIAL
5a. PPM
(VOL)
b.
LB/HR
c.
SULFUR
DIOXIDE
6a. PPM
(VOL)
b.
LB/HR
c.
**OTHER
(SPECIFY)
7a. PPM
(VOL)
b.
LB/HR
c.
MAXIMUM OPERATION
CONTAMINANT
CONCENTRATION OR EMISSION RATE PER IDENTICAL
CONTROL UNITS OR CONTROL SYSTEM
METHOD USED TO DETERMINE CONCENTRATION OR
EMISSION RATE
PARTICULATE
MATTER
8a.
GR/SCF
b.
LB/HR
c.
CARBON
MONOXIDE
9a. PPM
(VOL)
b.
LB/HR
c.
NITROGEN
OXIDES
10a. PPM
(VOL)
b.
LB/HR
c.
ORGANIC
MATERIAL
11a. PPM
(VOL)
b.
LB/HR
c.
SULFUR
DIOXIDE
12a. PPM
(VOL)
b.
LB/HR
c.
**OTHER
(SPECIFY)
13a. PPM
(VOL)
b.
LB/HR
c.
**“OTHER” CONTAMINANT SHOULD BE USED FOR AN AIR CONTAMINANT NOT SPECIFICALLY NAMED ABOVE. POSSIBLE OTHER
CONTAMINANTS ARE ASBESTOS, BERYLLIUM, MERCURY, VINYL CHLORIDE, LEAD, ETC.
EXHAUST POINT INFORMATION
1. FLOW DIAGRAM DESIGNATION(S) OF EXHAUST POINT:
2. DESCRIPTION OF EXHAUST POINT (LOCATION IN RELATION TO BUILDINGS, DIRECTION, HOODING, ETC.):
3. EXIT HEIGHT ABOVE GRADE: 4. EXIT DIAMETER:
5. GREATEST HEIGHT OF NEARBY BUILDINGS: 6. EXIT DISTANCE FROM NEAREST PLANT BOUNDARY:
AVERAGE OPERATION MAXIMUM OPERATION
7. EXIT GAS TEMPERATURE:
�F
9. EXIT GAS TEMPERATURE:
�F
8. GAS FLOW RATE THROUGH EACH EXIT:
ACFM
10. GAS FLOW RATE THROUGH EACH EXIT:
ACFM
See Attachment 4 to APC 260
See Attachment 5 to APC 260
Application Revision 5/14/2012, Page 128 of 131

ATTACHMENTS 1 THROUGH 4 TO APC260
Sand Drying: Total PM Emissions (TPY): 17.94
A. PM Emissions by Equipment Unit ID (EID):
(1)Item
(3)Emission Unit Desription
(4)Max Short Term Throughput
(5)Max Annual Throughput
(6)Emission Factor
(7)* Capture
Efficiency(10)TPM
(11)TPY
(2)EID
(8)**Control
Efficiency(9)
Control Description(12)
Emission Factor Reference ID
Dryer Baghouse 2093.6 million dscf/month 25123.68 million dscf/year 1428.5 lb/million dscf 100 1.4954 17.94BGH0183 99.9 .005 gr/[email protected] microns or > BH01
B. Proposed Permit Limits for PM from Sand Drying:
2093.6 million dscf/month 25123.68 million dscf/year 17.941.4954
E. Notes:
As defined in I.A. (7), (8) and (9) for sources with capture and/or control efficiencies for pollution control equipment.
*The term “capture system” for the purpose of this application means the equipment (including hoods, ducts, etc.) used to contain, capture, or transport an air contaminant to a control device. In addition, the term “capture efficiency” means the weight per unit time of an air contaminant entering a capture system and delivered to a control device, divided by the weight per unit time of the air contaminant generated by the source, expressed as a percentage. Therefore, if the emission unit is not exhausted to a control device, the capture system and capture efficiency is not applicable (NA). If the emission unit is using an emission factor with an overall emission reduction efficiency included in the factor, “AP‐42” has been assigned to the capture efficiency.
**The term “control system” for the purpose of this application means any control device or technique which is designed and operated to reduce the quantity of air contaminants emitted to the atmosphere. The term “control efficiency” means the percentage by which a control device or technique reduces the emissions from a stationary source. If the emission unit is controlled by a control device, the capture and control efficiencies are identified. If the emission unit is using an emission factor with an overall emission reduction efficiency included in the factor, “AP‐42” has been assigned to the control efficiency.
C. Emission Factor Source by Reference ID:
BH01 Proposed limit of 0.01 grains per dry standard cubic foot of exhaust
D. Example Calculation for Item 83:
2.868 million dscf
hour
1428.5 lb
million dscf* ((1 ‐ 100 % capture/100) + (1 ‐ 99.9 % control/100))
ton
2000 lb=
year
17.94 ton PM
year
8760 Hours
Application Revision 5/14/2012, Page 129 of 131

ATTACHMENTS 1 THROUGH 4 TO APC260
Sand Drying: Total PM‐10 Emissions (TPY): 17.94
A. PM‐10 Emissions by Equipment Unit ID (EID):
(1)Item
(3)Emission Unit Desription
(4)Max Short Term Throughput
(5)Max Annual Throughput
(6)Emission Factor
(7)* Capture
Efficiency(10)TPM
(11)TPY
(2)EID
(8)**Control
Efficiency(9)
Control Description(12)
Emission Factor Reference ID
Dryer Baghouse 2093.6 million dscf/month 25123.68 million dscf/year 1428.5 lb/million dscf 100 1.4954 17.94BGH0183 99.9 .005 gr/[email protected] microns or > BH01
B. Proposed Permit Limits for PM‐10 from Sand Drying:
2093.6 million dscf/month 25123.68 million dscf/year 17.941.4954
E. Notes:
As defined in I.A. (7), (8) and (9) for sources with capture and/or control efficiencies for pollution control equipment.
*The term “capture system” for the purpose of this application means the equipment (including hoods, ducts, etc.) used to contain, capture, or transport an air contaminant to a control device. In addition, the term “capture efficiency” means the weight per unit time of an air contaminant entering a capture system and delivered to a control device, divided by the weight per unit time of the air contaminant generated by the source, expressed as a percentage. Therefore, if the emission unit is not exhausted to a control device, the capture system and capture efficiency is not applicable (NA). If the emission unit is using an emission factor with an overall emission reduction efficiency included in the factor, “AP‐42” has been assigned to the capture efficiency.
**The term “control system” for the purpose of this application means any control device or technique which is designed and operated to reduce the quantity of air contaminants emitted to the atmosphere. The term “control efficiency” means the percentage by which a control device or technique reduces the emissions from a stationary source. If the emission unit is controlled by a control device, the capture and control efficiencies are identified. If the emission unit is using an emission factor with an overall emission reduction efficiency included in the factor, “AP‐42” has been assigned to the control efficiency.
C. Emission Factor Source by Reference ID:
BH01 Proposed limit of 0.01 grains per dry standard cubic foot of exhaust
D. Example Calculation for Item 83:
2.868 million dscf
hour
1428.5 lb
million dscf* ((1 ‐ 100 % capture/100) + (1 ‐ 99.9 % control/100))
ton
2000 lb=
year
17.94 ton PM‐10
year
8760 Hours
Application Revision 5/14/2012, Page 130 of 131

ATTACHMENTS 1 THROUGH 4 TO APC260
Sand Drying: Total PM2.5 Emissions (TPY): 17.94
A. PM2.5 Emissions by Equipment Unit ID (EID):
(1)Item
(3)Emission Unit Desription
(4)Max Short Term Throughput
(5)Max Annual Throughput
(6)Emission Factor
(7)* Capture
Efficiency(10)TPM
(11)TPY
(2)EID
(8)**Control
Efficiency(9)
Control Description(12)
Emission Factor Reference ID
Dryer Baghouse 2093.6 million dscf/month 25123.68 million dscf/year 1428.5 lb/million dscf 100 1.4954 17.94BGH0183 99.9 .005 gr/[email protected] microns or > BH01
B. Proposed Permit Limits for PM2.5 from Sand Drying:
2093.6 million dscf/month 25123.68 million dscf/year 17.941.4954
E. Notes:
As defined in I.A. (7), (8) and (9) for sources with capture and/or control efficiencies for pollution control equipment.
*The term “capture system” for the purpose of this application means the equipment (including hoods, ducts, etc.) used to contain, capture, or transport an air contaminant to a control device. In addition, the term “capture efficiency” means the weight per unit time of an air contaminant entering a capture system and delivered to a control device, divided by the weight per unit time of the air contaminant generated by the source, expressed as a percentage. Therefore, if the emission unit is not exhausted to a control device, the capture system and capture efficiency is not applicable (NA). If the emission unit is using an emission factor with an overall emission reduction efficiency included in the factor, “AP‐42” has been assigned to the capture efficiency.
**The term “control system” for the purpose of this application means any control device or technique which is designed and operated to reduce the quantity of air contaminants emitted to the atmosphere. The term “control efficiency” means the percentage by which a control device or technique reduces the emissions from a stationary source. If the emission unit is controlled by a control device, the capture and control efficiencies are identified. If the emission unit is using an emission factor with an overall emission reduction efficiency included in the factor, “AP‐42” has been assigned to the control efficiency.
C. Emission Factor Source by Reference ID:
BH01 Proposed limit of 0.01 grains per dry standard cubic foot of exhaust
D. Example Calculation for Item 83:
2.868 million dscf
hour
1428.5 lb
million dscf* ((1 ‐ 100 % capture/100) + (1 ‐ 99.9 % control/100))
ton
2000 lb=
year
17.94 ton PM2.5
year
8760 Hours
Application Revision 5/14/2012, Page 131 of 131