Mississippi QL2 and Tupelo QL3 Lidar - maris.state.ms.us · Mississippi QL2 and Tupelo QL3 Lidar...
37
Mississippi QL2 and Tupelo QL3 Lidar USGS/ Rolla, MO December 2015
Transcript of Mississippi QL2 and Tupelo QL3 Lidar - maris.state.ms.us · Mississippi QL2 and Tupelo QL3 Lidar...
Mississippi QL2 and Tupelo QL3 Lidar
USGS/ Rolla, MO
December 2015
United States Geological Survey December 2015 iii
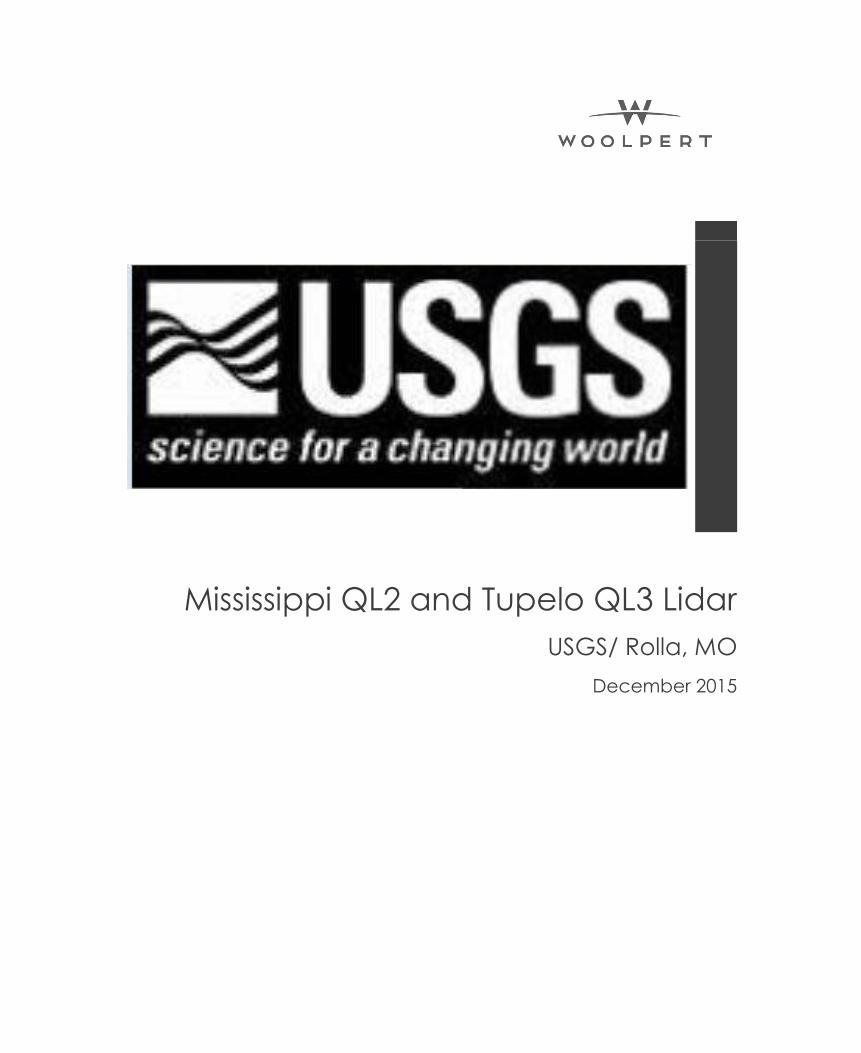
Table of Contents Section 1: Overview ................................................................................................................................................................................ 1-1
Section 2: Acquisition.............................................................................................................................................................................. 2-1
Section 3: Lidar Data Processing ............................................................................................................................................................. 3-1
Section 4: Hydrologic Flattening ............................................................................................................................................................. 4-1
Section 5: Accuracy Assessment ............................................................................................................................................................. 5-1
Section 6: Flight Logs .............................................................................................................................................................................. 6-1
Section 7: Final Deliverables ................................................................................................................................................................... 7-1
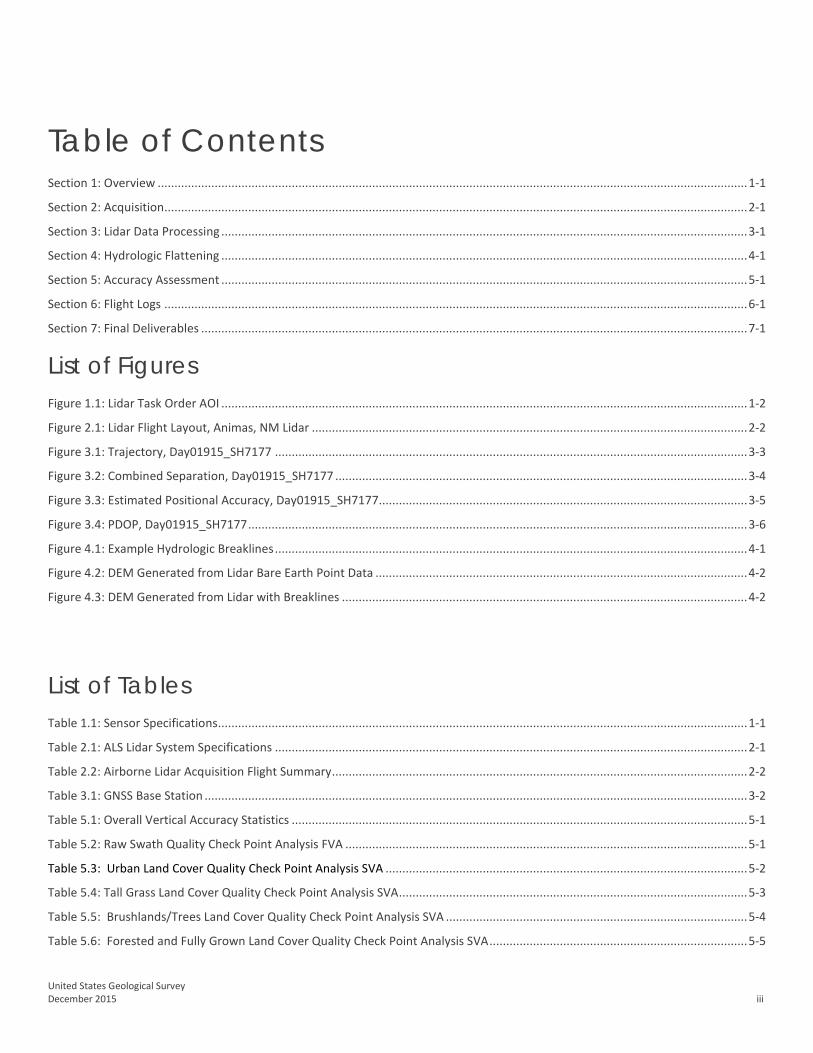
List of Figures Figure 1.1: Lidar Task Order AOI ............................................................................................................................................................. 1-2
Figure 2.1: Lidar Flight Layout, Animas, NM Lidar .................................................................................................................................. 2-2
Figure 3.1: Trajectory, Day01915_SH7177 ............................................................................................................................................. 3-3
Figure 3.2: Combined Separation, Day01915_SH7177 ........................................................................................................................... 3-4
Figure 3.3: Estimated Positional Accuracy, Day01915_SH7177 .............................................................................................................. 3-5
Figure 3.4: PDOP, Day01915_SH7177 ..................................................................................................................................................... 3-6
Figure 4.1: Example Hydrologic Breaklines ............................................................................................................................................. 4-1
Figure 4.2: DEM Generated from Lidar Bare Earth Point Data ............................................................................................................... 4-2
Figure 4.3: DEM Generated from Lidar with Breaklines ......................................................................................................................... 4-2
List of Tables Table 1.1: Sensor Specifications .............................................................................................................................................................. 1-1
Table 2.1: ALS Lidar System Specifications ............................................................................................................................................. 2-1
Table 2.2: Airborne Lidar Acquisition Flight Summary ............................................................................................................................ 2-2
Table 3.1: GNSS Base Station .................................................................................................................................................................. 3-2
Table 5.1: Overall Vertical Accuracy Statistics ........................................................................................................................................ 5-1
Table 5.2: Raw Swath Quality Check Point Analysis FVA ........................................................................................................................ 5-1
Table 5.3: Urban Land Cover Quality Check Point Analysis SVA ............................................................................................................ 5-2
Table 5.4: Tall Grass Land Cover Quality Check Point Analysis SVA ........................................................................................................ 5-3
Table 5.5: Brushlands/Trees Land Cover Quality Check Point Analysis SVA .......................................................................................... 5-4
Table 5.6: Forested and Fully Grown Land Cover Quality Check Point Analysis SVA ............................................................................. 5-5

Table 5.7: Swamp Land Cover Quality Check Point Analysis SVA .......................................................................................................... 5-6
Mississippi QL2 and Tupelo QL3 Lidar
United States Geological Survey December 2015 1-1
Section 1: Overview Project Name: Mississippi QL2 and Tupelo QL3 Lidar Processing
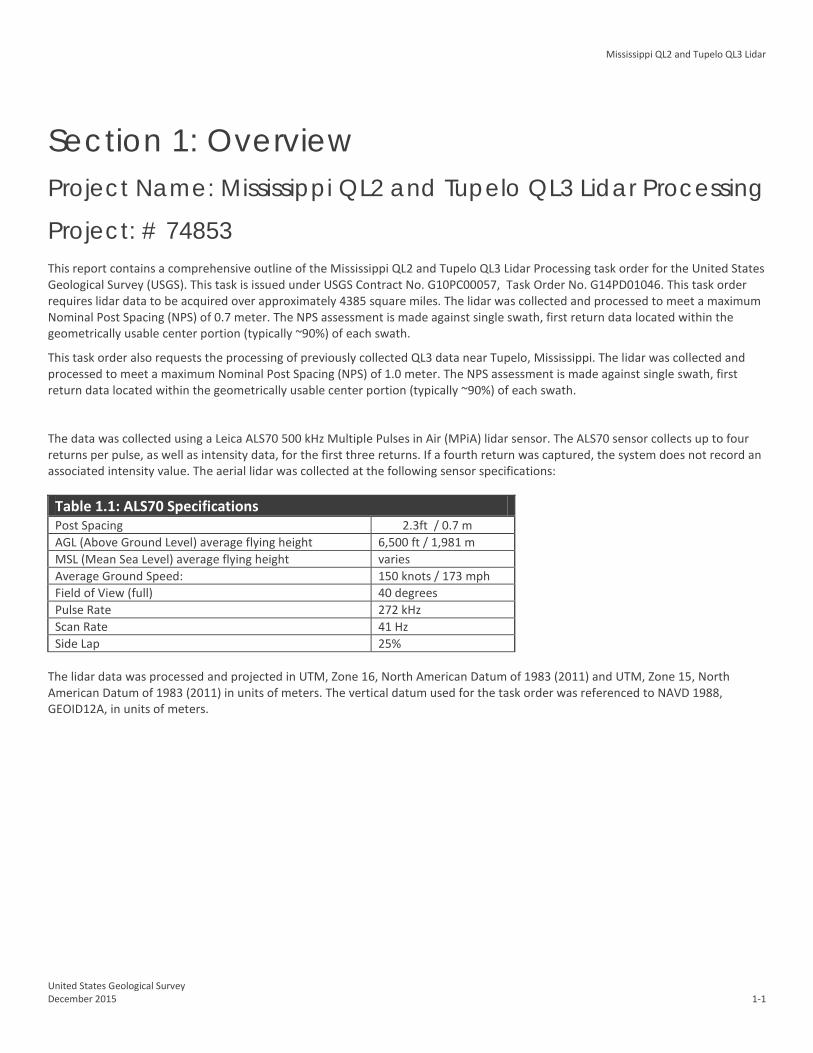
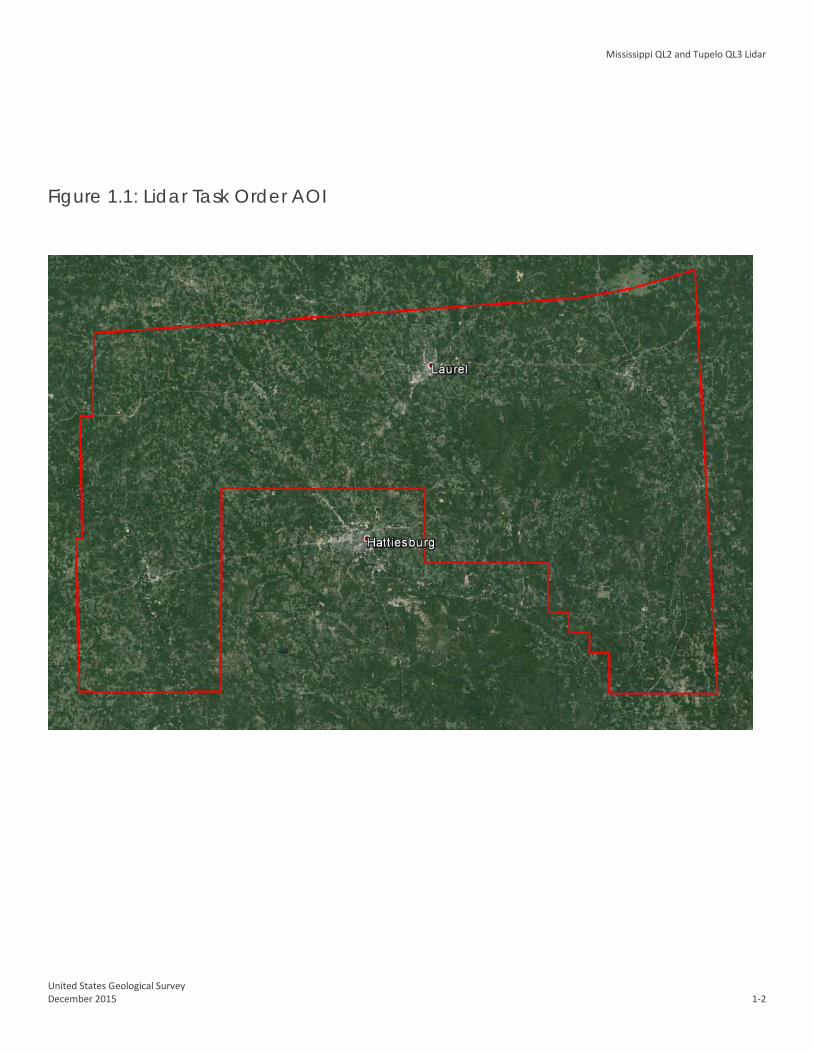
Project: # 74853 This report contains a comprehensive outline of the Mississippi QL2 and Tupelo QL3 Lidar Processing task order for the United States Geological Survey (USGS). This task is issued under USGS Contract No. G10PC00057, Task Order No. G14PD01046. This task order requires lidar data to be acquired over approximately 4385 square miles. The lidar was collected and processed to meet a maximum Nominal Post Spacing (NPS) of 0.7 meter. The NPS assessment is made against single swath, first return data located within the geometrically usable center portion (typically ~90%) of each swath.
This task order also requests the processing of previously collected QL3 data near Tupelo, Mississippi. The lidar was collected and processed to meet a maximum Nominal Post Spacing (NPS) of 1.0 meter. The NPS assessment is made against single swath, first return data located within the geometrically usable center portion (typically ~90%) of each swath.
The data was collected using a Leica ALS70 500 kHz Multiple Pulses in Air (MPiA) lidar sensor. The ALS70 sensor collects up to four returns per pulse, as well as intensity data, for the first three returns. If a fourth return was captured, the system does not record an associated intensity value. The aerial lidar was collected at the following sensor specifications:
Table 1.1: ALS70 Specifications Post Spacing 2.3ft / 0.7 m AGL (Above Ground Level) average flying height 6,500 ft / 1,981 m MSL (Mean Sea Level) average flying height varies Average Ground Speed: 150 knots / 173 mph Field of View (full) 40 degrees Pulse Rate 272 kHz Scan Rate 41 Hz Side Lap 25%
The lidar data was processed and projected in UTM, Zone 16, North American Datum of 1983 (2011) and UTM, Zone 15, North American Datum of 1983 (2011) in units of meters. The vertical datum used for the task order was referenced to NAVD 1988, GEOID12A, in units of meters.
Mississippi QL2 and Tupelo QL3 Lidar
United States Geological Survey December 2015 1-2
Figure 1.1: Lidar Task Order AOI
Mississippi QL2 and Tupelo QL3 Lidar
United States Geological Survey December 2015 2-1
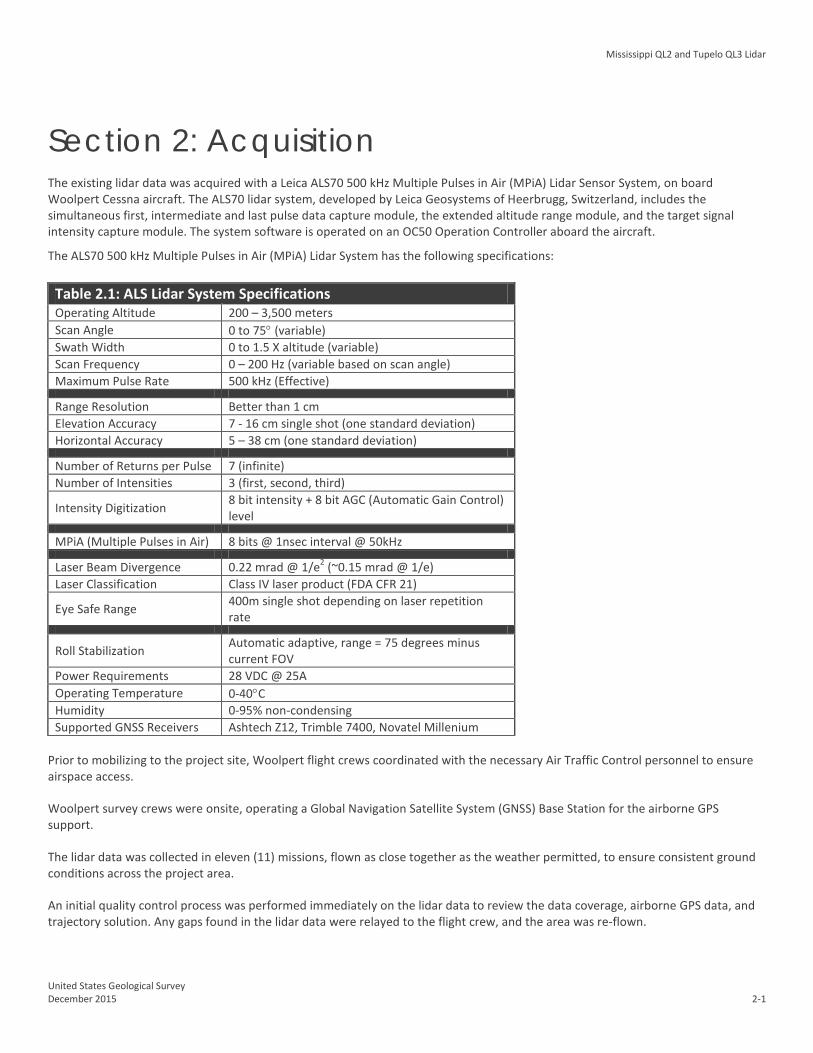
Section 2: Acquisition The existing lidar data was acquired with a Leica ALS70 500 kHz Multiple Pulses in Air (MPiA) Lidar Sensor System, on board Woolpert Cessna aircraft. The ALS70 lidar system, developed by Leica Geosystems of Heerbrugg, Switzerland, includes the simultaneous first, intermediate and last pulse data capture module, the extended altitude range module, and the target signal intensity capture module. The system software is operated on an OC50 Operation Controller aboard the aircraft.
The ALS70 500 kHz Multiple Pulses in Air (MPiA) Lidar System has the following specifications:
Table 2.1: ALS Lidar System Specifications Operating Altitude 200 – 3,500 meters Scan Angle 0 to 75° (variable) Swath Width 0 to 1.5 X altitude (variable) Scan Frequency 0 – 200 Hz (variable based on scan angle) Maximum Pulse Rate 500 kHz (Effective) Range Resolution Better than 1 cm Elevation Accuracy 7 - 16 cm single shot (one standard deviation) Horizontal Accuracy 5 – 38 cm (one standard deviation) Number of Returns per Pulse 7 (infinite) Number of Intensities 3 (first, second, third)
Intensity Digitization 8 bit intensity + 8 bit AGC (Automatic Gain Control) level
MPiA (Multiple Pulses in Air) 8 bits @ 1nsec interval @ 50kHz Laser Beam Divergence 0.22 mrad @ 1/e2 (~0.15 mrad @ 1/e) Laser Classification Class IV laser product (FDA CFR 21)
Eye Safe Range 400m single shot depending on laser repetition rate
Roll Stabilization Automatic adaptive, range = 75 degrees minus current FOV
Power Requirements 28 VDC @ 25A Operating Temperature 0-40°C Humidity 0-95% non-condensing Supported GNSS Receivers Ashtech Z12, Trimble 7400, Novatel Millenium
Prior to mobilizing to the project site, Woolpert flight crews coordinated with the necessary Air Traffic Control personnel to ensure airspace access.
Woolpert survey crews were onsite, operating a Global Navigation Satellite System (GNSS) Base Station for the airborne GPS support.
The lidar data was collected in eleven (11) missions, flown as close together as the weather permitted, to ensure consistent ground conditions across the project area.
An initial quality control process was performed immediately on the lidar data to review the data coverage, airborne GPS data, and trajectory solution. Any gaps found in the lidar data were relayed to the flight crew, and the area was re-flown.
Mississippi QL2 and Tupelo QL3 Lidar
United States Geological Survey December 2015 2-2
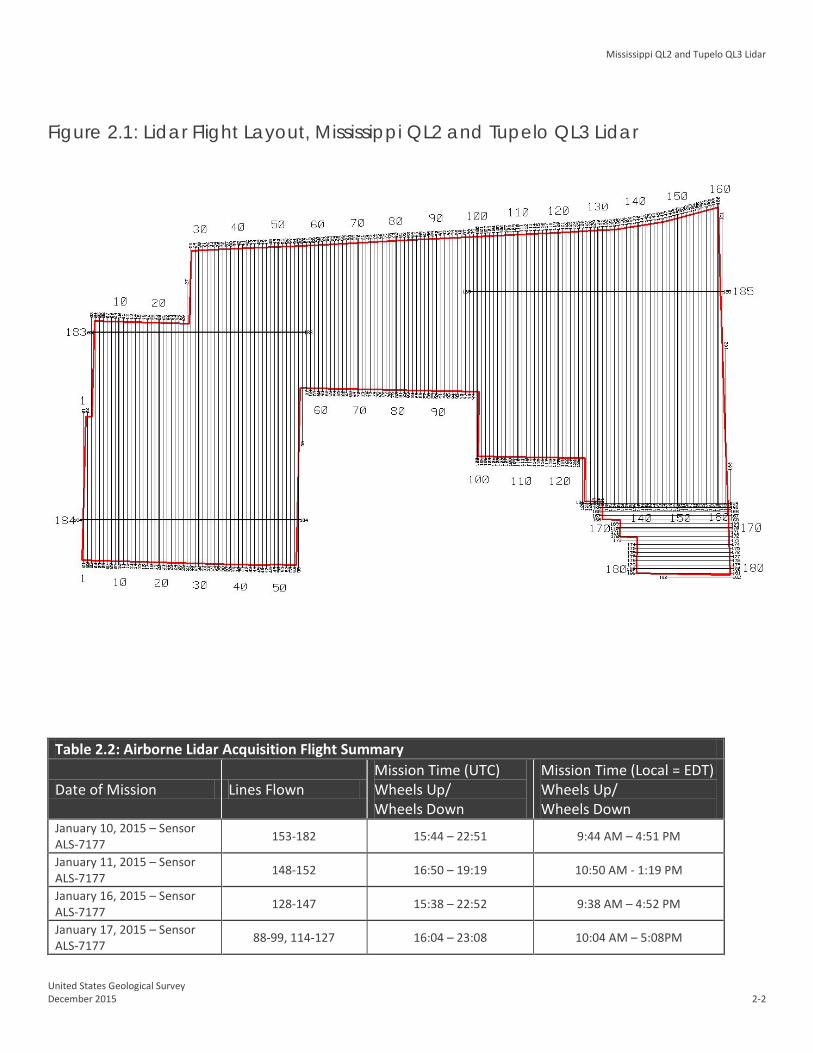
Figure 2.1: Lidar Flight Layout, Mississippi QL2 and Tupelo QL3 Lidar
Table 2.2: Airborne Lidar Acquisition Flight Summary
Date of Mission Lines Flown Mission Time (UTC) Wheels Up/ Wheels Down
Mission Time (Local = EDT) Wheels Up/ Wheels Down
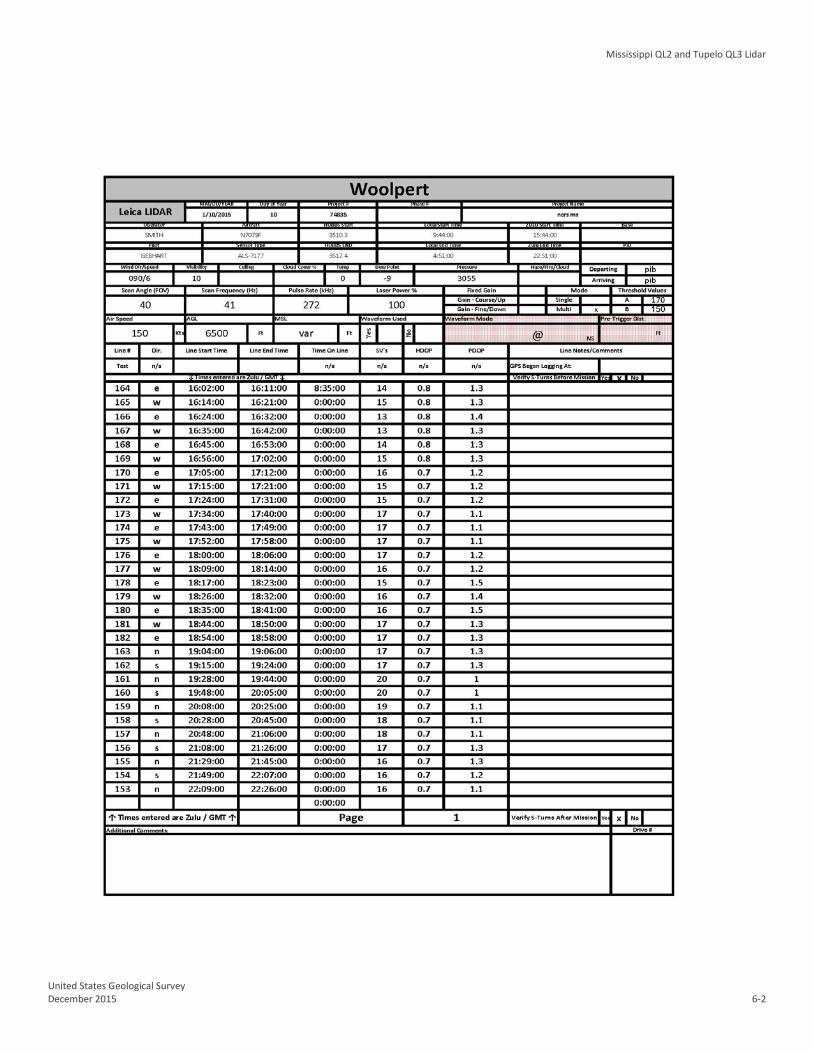
January 10, 2015 – Sensor ALS-7177 153-182 15:44 – 22:51 9:44 AM – 4:51 PM
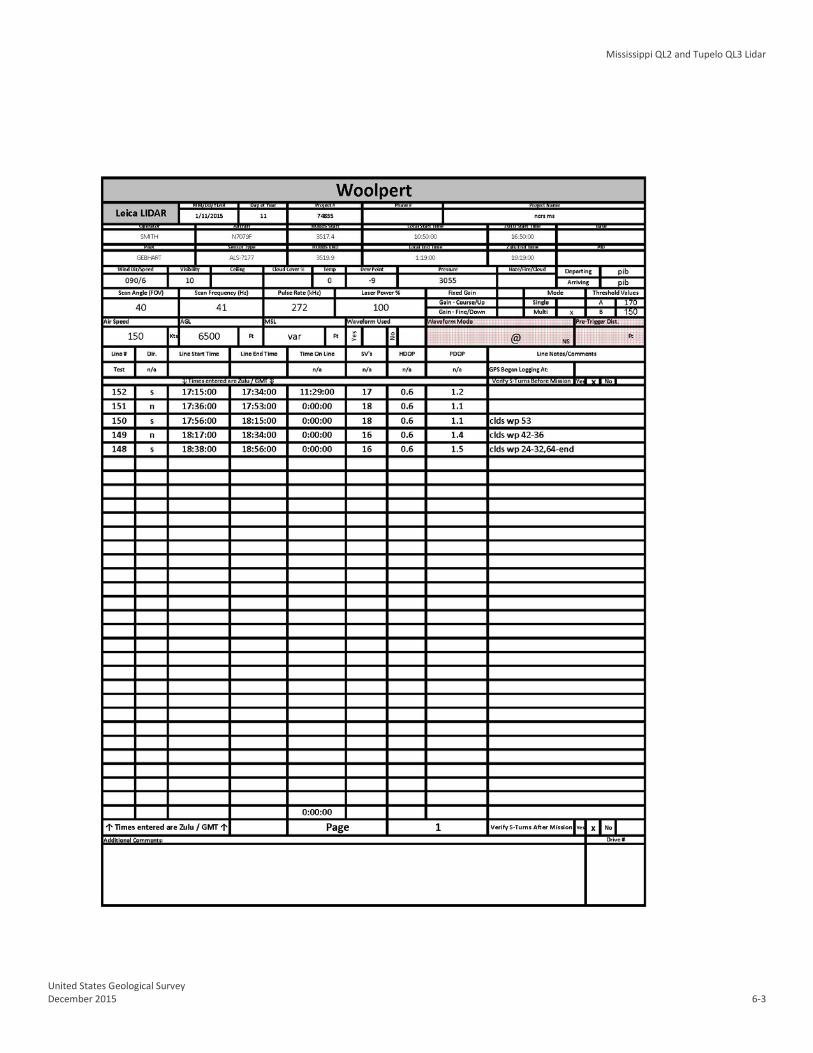
January 11, 2015 – Sensor ALS-7177 148-152 16:50 – 19:19 10:50 AM - 1:19 PM
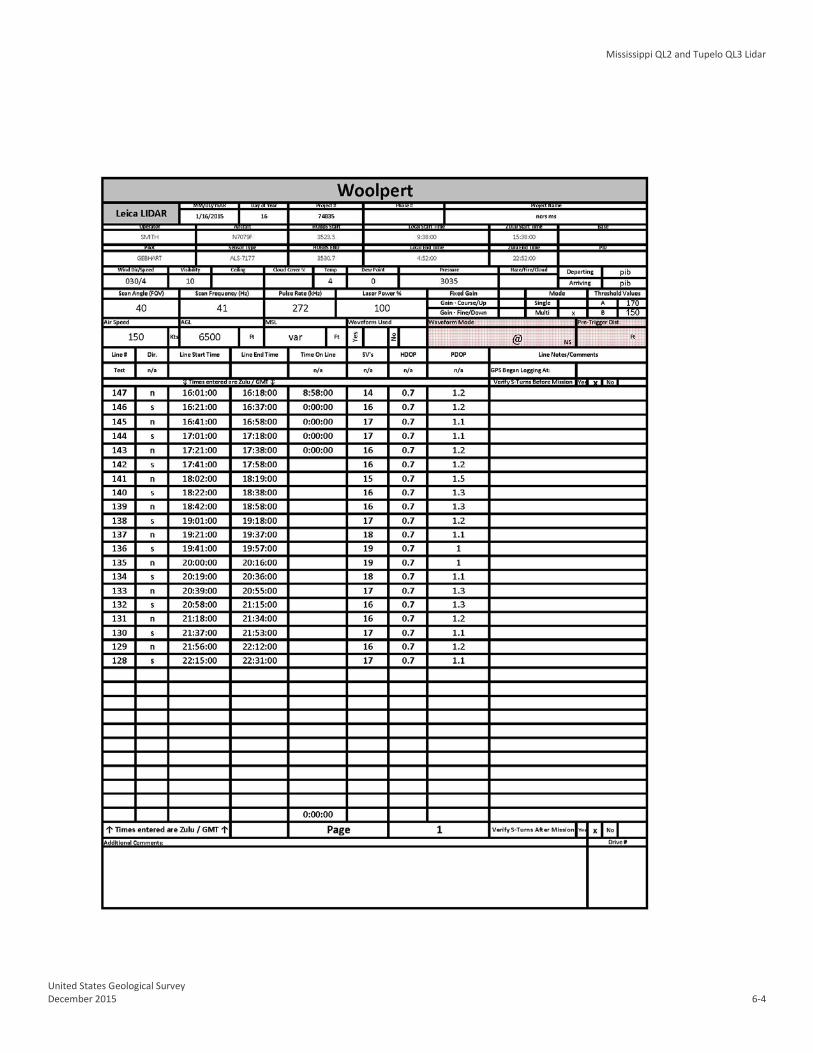
January 16, 2015 – Sensor ALS-7177 128-147 15:38 – 22:52 9:38 AM – 4:52 PM
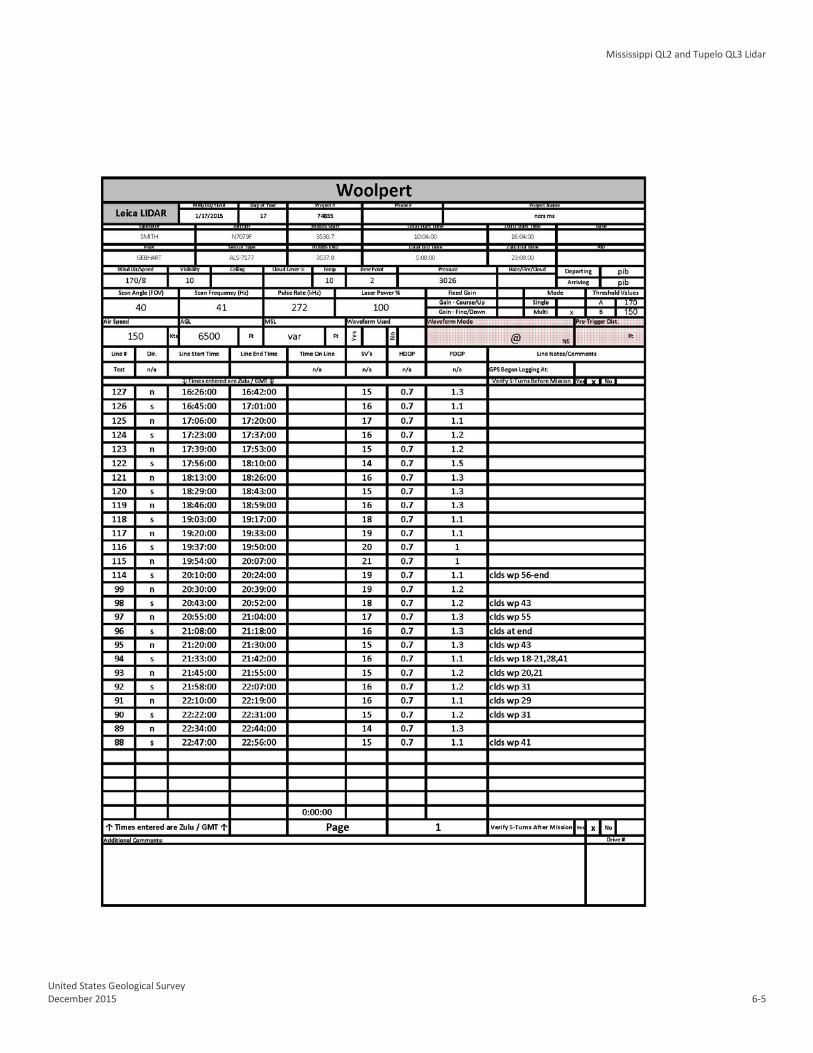
January 17, 2015 – Sensor ALS-7177 88-99, 114-127 16:04 – 23:08 10:04 AM – 5:08PM

Mississippi QL2 and Tupelo QL3 Lidar
United States Geological Survey December 2015 2-3
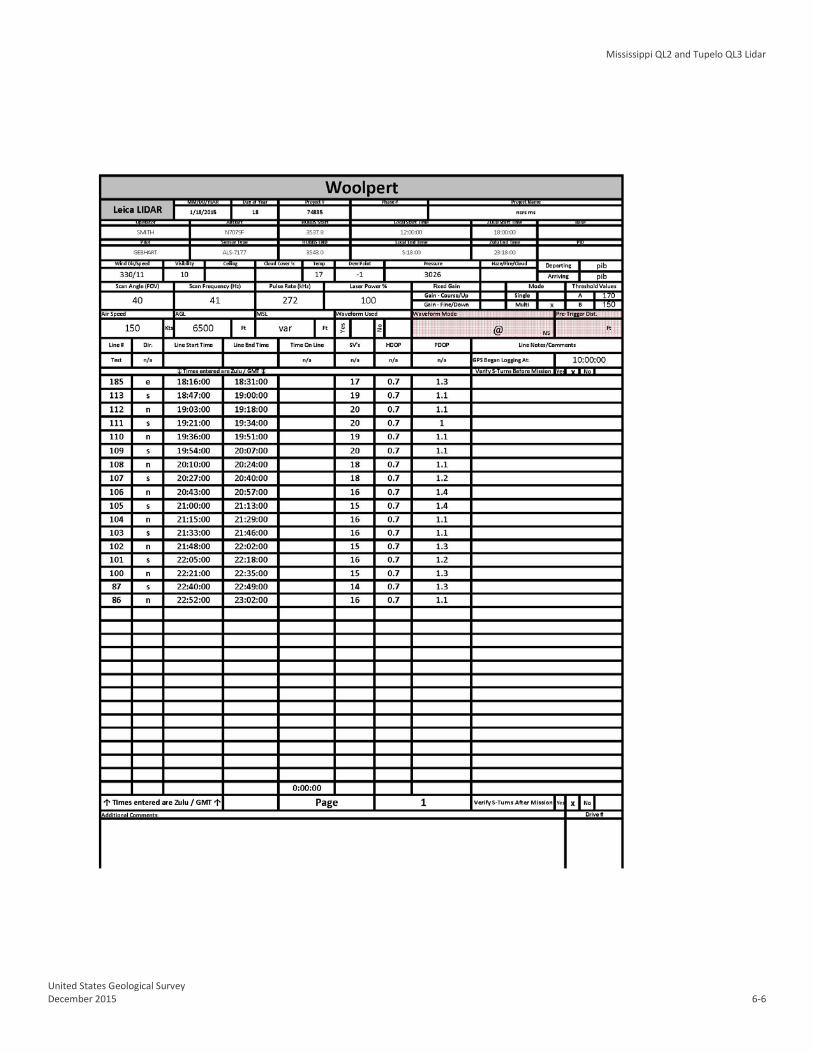
January 18, 2015 – Sensor ALS-7177 86-87, 100-113, 185 18:00– 23:18 12:02 AM – 5:18PM
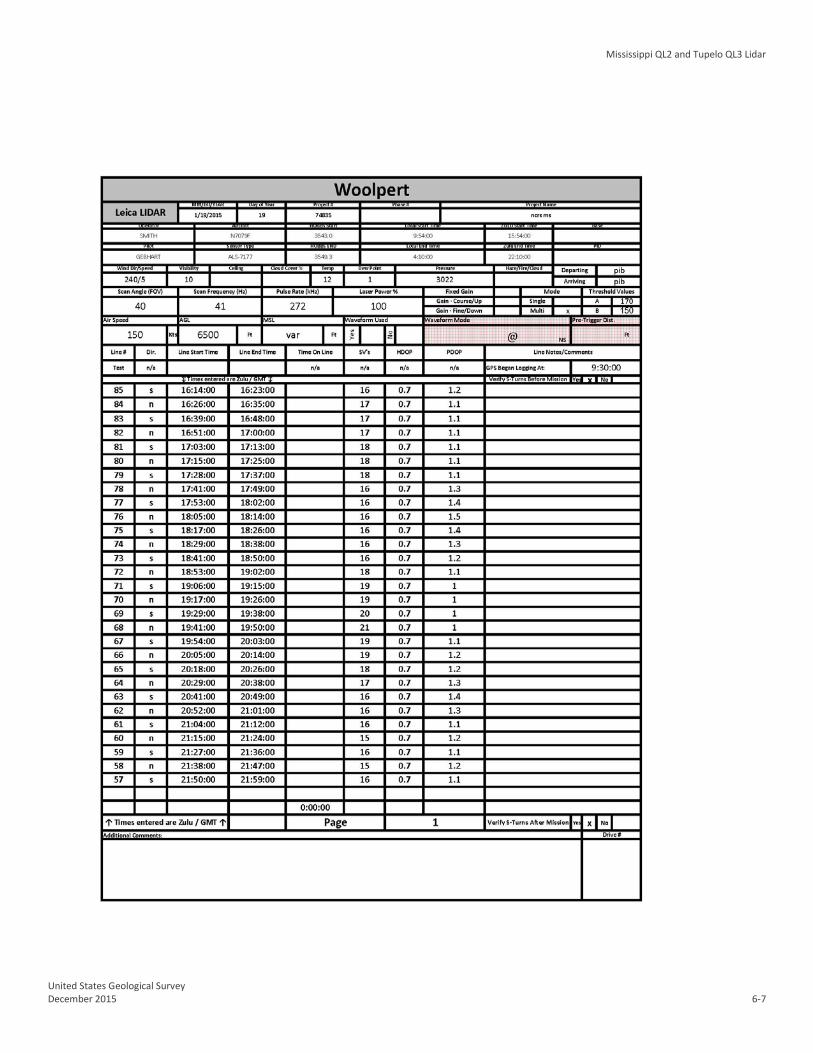
January 19, 2015 – Sensor ALS-7177 57-85 15:54 – 22:10 9:54AM – 4:10PM
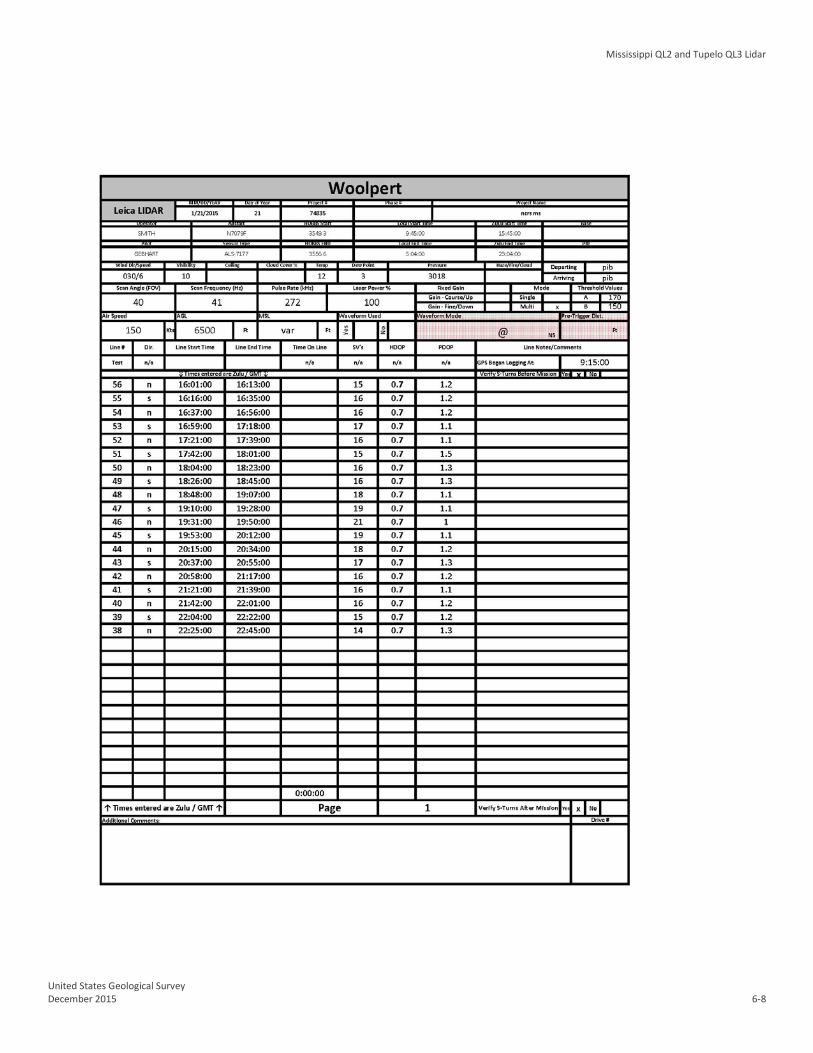
January 21, 2015 – Sensor ALS-7177 38 - 56 15:45 – 23:04 9:45 AM – 5:04 PM
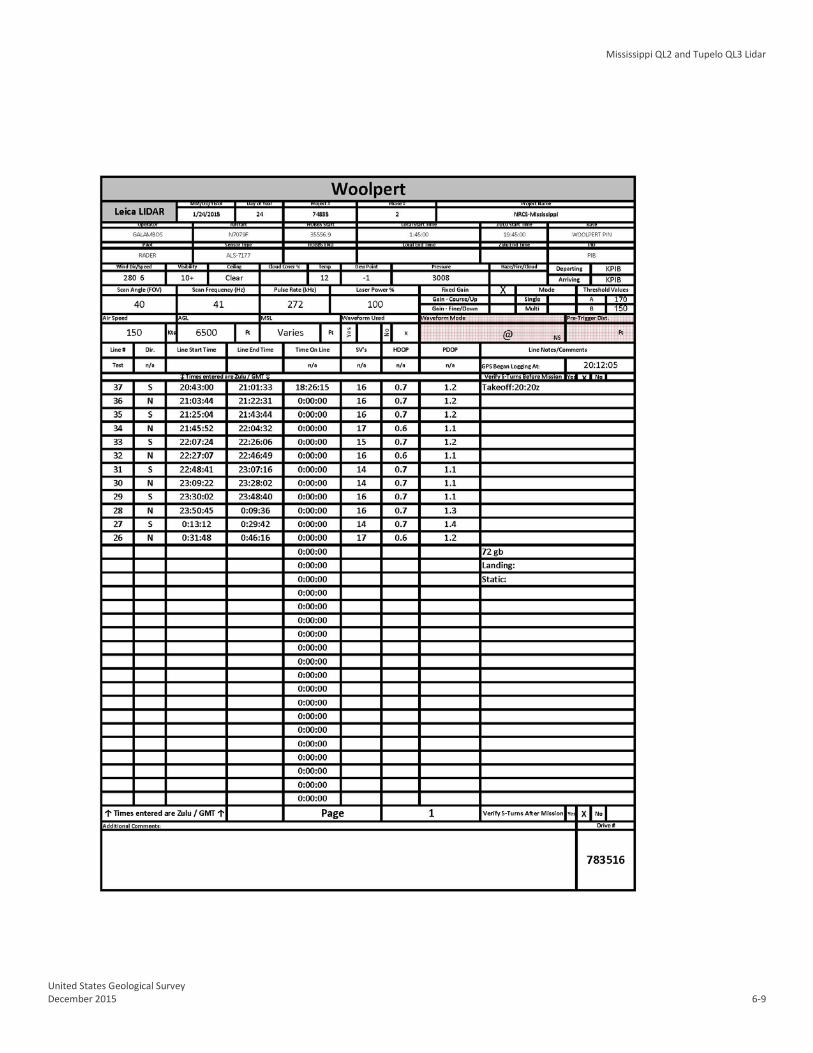
January 24, 2015 – Sensor ALS-7177 26-37 19:45– 1:01 1:45 PM – 7:01 PM
January 25, 2015 – Sensor ALS-7177_A
9-25, 92, 94, 114, 148-150 14:00 – 18:55 8:00 AM – 12:55PM
January 25, 2015 – Sensor ALS-7177_B 9-17,183-184 21:00– 1:00 3:00 PM – 7:00 PM
January 26, 2015 – Sensor ALS-7177 1-10, 18-19 18:30 – 23:20 12:30 AM – 5:20 PM
Mississippi QL2 and Tupelo QL3 Lidar
United States Geological Survey December 2015 3-1
Section 3: Lidar Data Processing Applications and Work Flow Overview
1. Resolved kinematic corrections for three subsystems: inertial measurement unit (IMU), sensor orientation information and airborne GPS data. Developed a blending post-processed aircraft position with attitude data using Kalman filtering technology or the smoothed best estimate trajectory (SBET). Software: POSPac Software v. 5.3, IPAS Pro v.1.35.
2. Calculated laser point position by associating the SBET position to each laser point return time, scan angle, intensity, etc. Created raw laser point cloud data for the entire survey in LAS format. Automated line-to-line calibrations were then performed for system attitude parameters (pitch, roll, heading), mirror flex (scale) and GPS/IMU drift. Software: ALS Post Processing Software v.2.75 build #25, Proprietary Software, TerraMatch v. 15.01.
3. Imported processed LAS point cloud data into the task order tiles. Resulting data were classified as ground and non-ground points with additional filters created to meet the task order classification specifications. Statistical absolute accuracy was assessed via direct comparisons of ground classified points to ground RTK survey data. Based on the statistical analysis, the lidar data was then adjusted to reduce the vertical bias when compared to the survey ground control. Software: TerraScan v.15.01.
4. The LAS files were evaluated through a series of manual QA/QC steps to eliminate remaining artifacts from the ground class. Software: TerraScan v.15.01.
Global Navigation Satellite System (GNSS) – Inertial Measurement Unit (IMU) Trajectory Processing Equipment
Flight navigation during the lidar data acquisition mission is performed using IGI CCNS (Computer Controlled Navigation System). The pilots are skilled at maintaining their planned trajectory, while holding the aircraft steady and level. If atmospheric conditions are such that the trajectory, ground speed, roll, pitch and/or heading cannot be properly maintained, the mission is aborted until suitable conditions occur.
The aircraft are all configured with a NovAtel Millennium 12-channel, L1/L2 dual frequency Global Navigation Satellite System (GNSS) receivers collecting at 2 Hz.
All Woolpert aerial sensors are equipped with a Litton LN200 series Inertial Measurement Unit (IMU) operating at 200 Hz.
A base-station unit was mobilized for each acquisition mission where a CORS station was not utilized, and was operated by a member of the Woolpert acquisition team. Each base-station setup consisted of one Trimble 4000 – 5000 series dual frequency receiver, one Trimble Compact L1/L2 dual frequency antenna, one 2-meter fixed-height tripod, and essential battery power and cabling. Ground planes were used on the base-station antennas. Data was collected at 1 or 2 Hz.
Mississippi QL2 and Tupelo QL3 Lidar
United States Geological Survey December 2015 3-2
The GNSS base station operated during the Lidar acquisition missions is listed below:
Table 3.1: GNSS Base Station Station (Name)
Latitude (DMS)
Longitude (DMS)
Ellipsoid Height (L1 Phase center) (Meters)
KPIB Airport Base 31°28'08.22371" 89°20'06.73607" 61.794 MSEV CORS 31°35'42.08167" 89°12'13.27473" 53.831
Data Processing All airborne GNSS and IMU data was post-processed and quality controlled using Applanix MMS software. GNSS data was processed at a 1 and 2 Hz data capture rate and the IMU data was processed at 200 Hz.
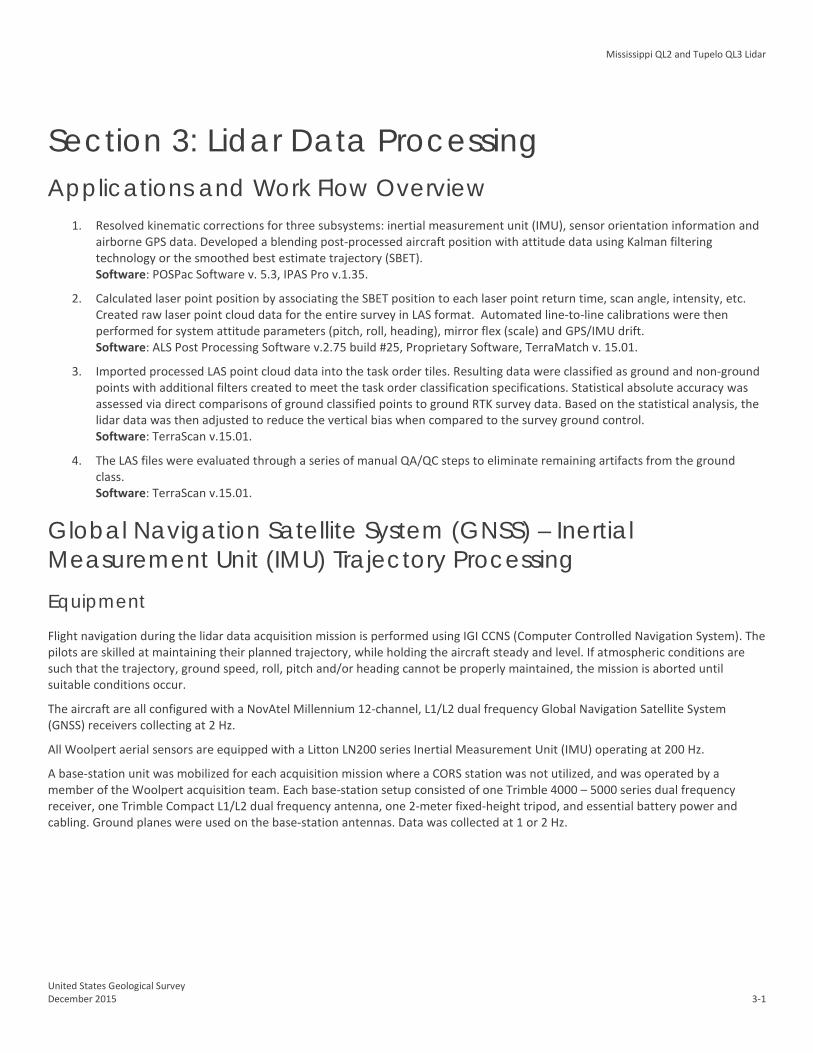
Trajectory Quality The GNSS Trajectory, along with high quality IMU data are key factors in determining the overall positional accuracy of the final sensor data. Within the trajectory processing, there are many factors that affect the overall quality, but the most indicative are the Combined Separation, the Estimated Positional Accuracy, and the Positional Dilution of Precision (PDOP). Figure 3.1: Trajectory, Day01915_SH7177
Mississippi QL2 and Tupelo QL3 Lidar
United States Geological Survey December 2015 3-3
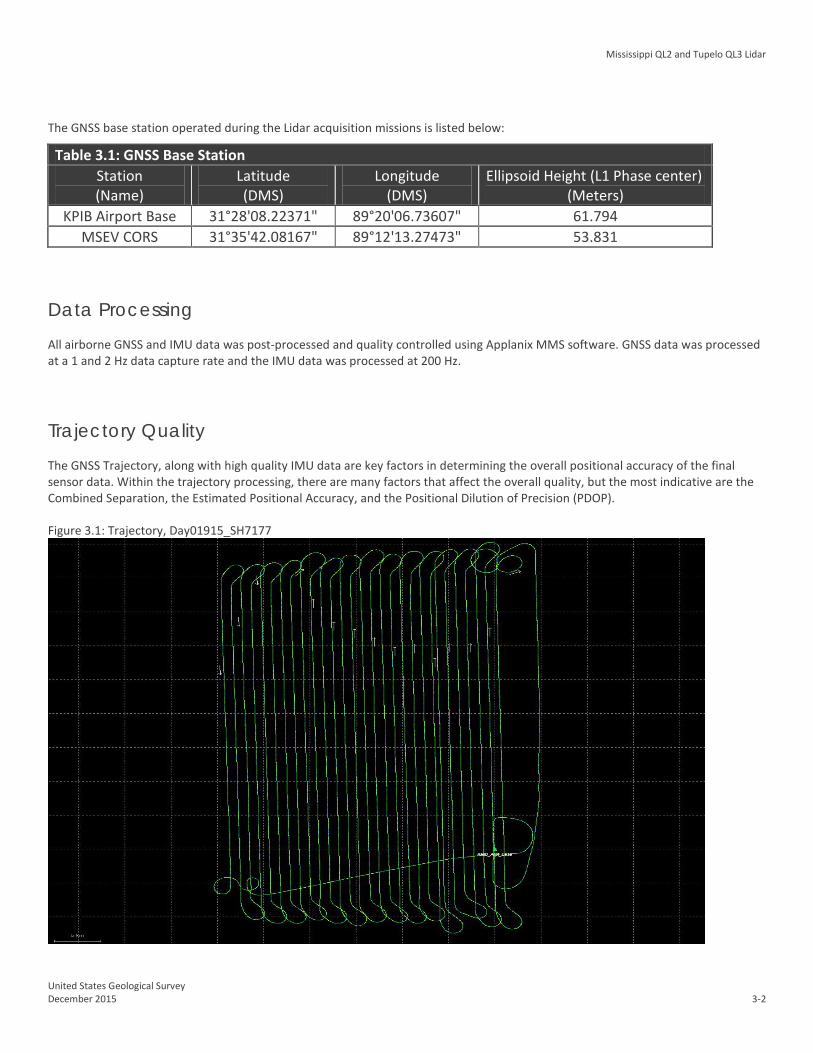
Combination Separation The Combined Separation is a measure of the difference between the forward run and the backward run solution of the trajectory. The Kalman filter is processed in both directions to remove the combined directional anomalies. In general, when these two solutions match closely, an optimally accurate reliable solution is achieved.
Woolpert’s goal is to maintain a Combined Separation Difference of less than ten (10) centimeters. In most cases we achieve results below this threshold.
Figure 3.2: Combined Separation, Day01915_SH7177
Mississippi QL2 and Tupelo QL3 Lidar
United States Geological Survey December 2015 3-4
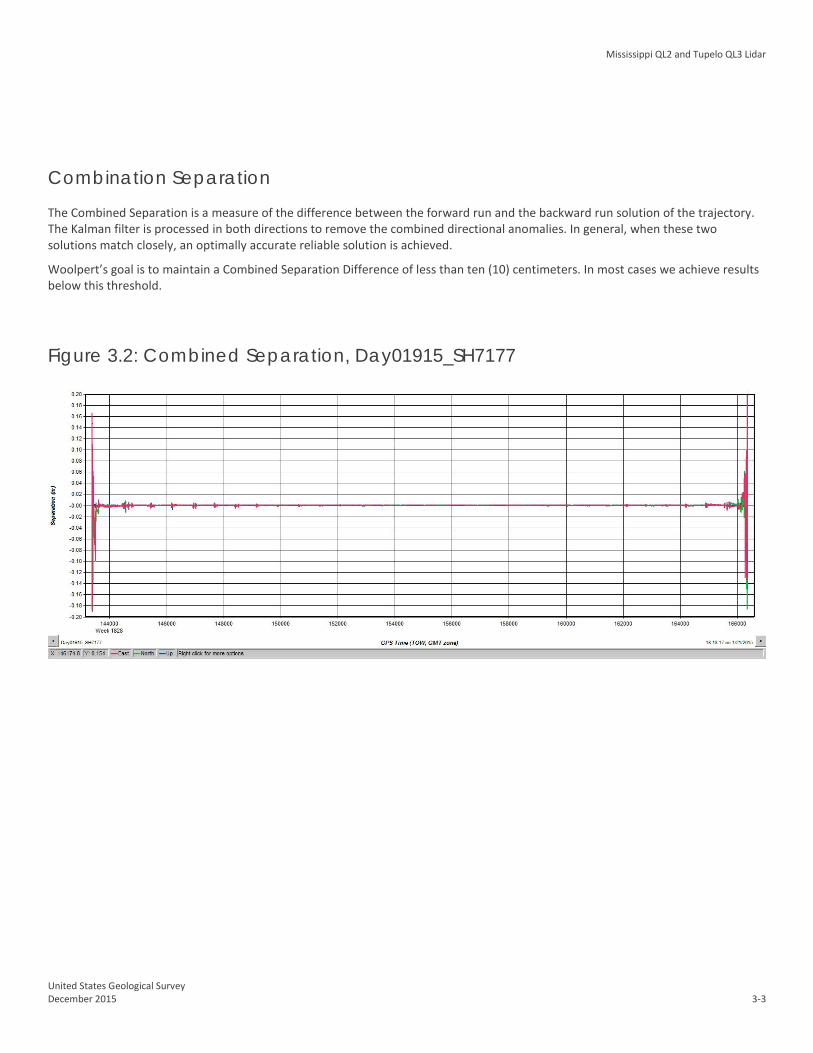
Estimated Positional Accuracy
The Estimated Positional Accuracy plots the standard deviations of the east, north, and vertical directions along a time scale of the trajectory. It illustrates loss of satellite lock issues, as well as issues arising from long baselines, noise, and/or other atmospheric interference.
Woolpert’s goal is to maintain an Estimated Positional Accuracy of less than ten (10) centimeters, often achieving results well below this threshold.
Figure 3.3: Estimated Positional Accuracy, Day01915_SH7177
Mississippi QL2 and Tupelo QL3 Lidar
United States Geological Survey December 2015 3-5
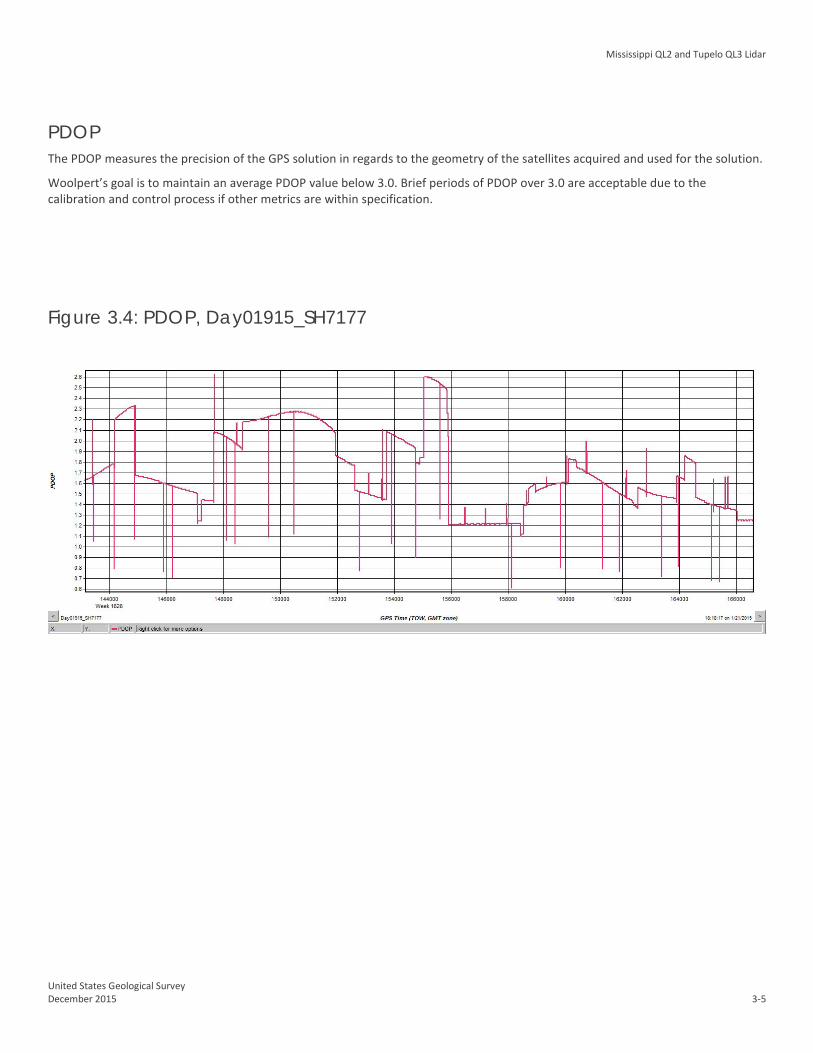
PDOP The PDOP measures the precision of the GPS solution in regards to the geometry of the satellites acquired and used for the solution.
Woolpert’s goal is to maintain an average PDOP value below 3.0. Brief periods of PDOP over 3.0 are acceptable due to the calibration and control process if other metrics are within specification.
Figure 3.4: PDOP, Day01915_SH7177
Mississippi QL2 and Tupelo QL3 Lidar
United States Geological Survey December 2015 3-6
Lidar Data Processing When the sensor calibration, data acquisition, and GPS processing phases were complete, the formal data reduction processes by Woolpert lidar specialists included:
• Processed individual flight lines to derive a raw “Point Cloud” LAS file. Matched overlapping flight lines, generated statistics for evaluation comparisons, and made the necessary adjustments to remove any residual systematic error.
• Calibrated LAS files were imported into the task order tiles and initially filtered to create a ground and non-ground class. Then additional classes were filtered as necessary to meet client specified classes.
• Once all project data was imported and classified, survey ground control data was imported and calculated for an accuracy assessment. As a QC measure, Woolpert has developed a routine to generate accuracy statistical reports by comparisons against the TIN and the DEM using surveyed ground control of higher accuracy. The lidar is adjusted accordingly to meet or exceed the vertical accuracy requirements.
• The lidar tiles were reviewed using a series of proprietary QA/QC procedures to ensure it fulfills the task order requirements. A portion of this requires a manual step to ensure anomalies have been removed from the ground class.
• The lidar LAS files are classified into the Default (Class 1), Ground (Class 2), Low Noise (Class 7), Water (Class 9), Ignored Ground (Class 10), Overlap Default (Class 17) and Overlap Ground (Class 18) classifications.
• FGDC Compliant metadata was developed for the task order in .xml format for the final data products. • The horizontal datum used for the task order was referenced to UTM16N North American Datum of 1983 (2011) and
UTM15N North American Datum of 1983 (2011). The vertical datum used for the task order was referenced to NAVD 1988, meters, GEOID12A. Coordinate positions were specified in units of meters.
Mississippi QL2 and Tupelo QL3 Lidar
United States Geological Survey December 2015 4-1
Section 4: Hydrologic Flattening HYDROLOGIC FLATTENING OF LIDAR DEM DATA Mississippi QL2 and Tupelo QL3 Lidar processing task order required the compilation of breaklines defining water bodies and rivers. The breaklines were used to perform the hydrologic flattening of water bodies, and gradient hydrologic flattening of double line streams and rivers. Lakes, reservoirs and ponds, at a minimum size of 2-acre or greater, were compiled as closed polygons. The closed water bodies were collected at a constant elevation. Rivers and streams, at a nominal minimum width of 30 meters (100 feet), were compiled in the direction of flow with both sides of the stream maintaining an equal gradient elevation.
LIDAR DATA REVIEW AND PROCESSING Woolpert utilized the following steps to hydrologically flatten the water bodies and for gradient hydrologic flattening of the double line streams within the existing lidar data.
1. Woolpert used the newly acquired lidar data to manually draw the hydrologic features in a 2D environment using the lidar intensity and bare earth surface. Open Source imagery was used as reference when necessary.
2. Woolpert utilizes an integrated software approach to combine the lidar data and 2D breaklines. This process “drapes” the 2D breaklines onto the 3D lidar surface model to assign an elevation. A monotonic process is performed to ensure the streams are consistently flowing in a gradient manner. A secondary step within the program verifies an equally matching elevation of both stream edges. The breaklines that characterize the closed water bodies are draped onto the 3D lidar surface and assigned a constant elevation at or just below ground elevation.
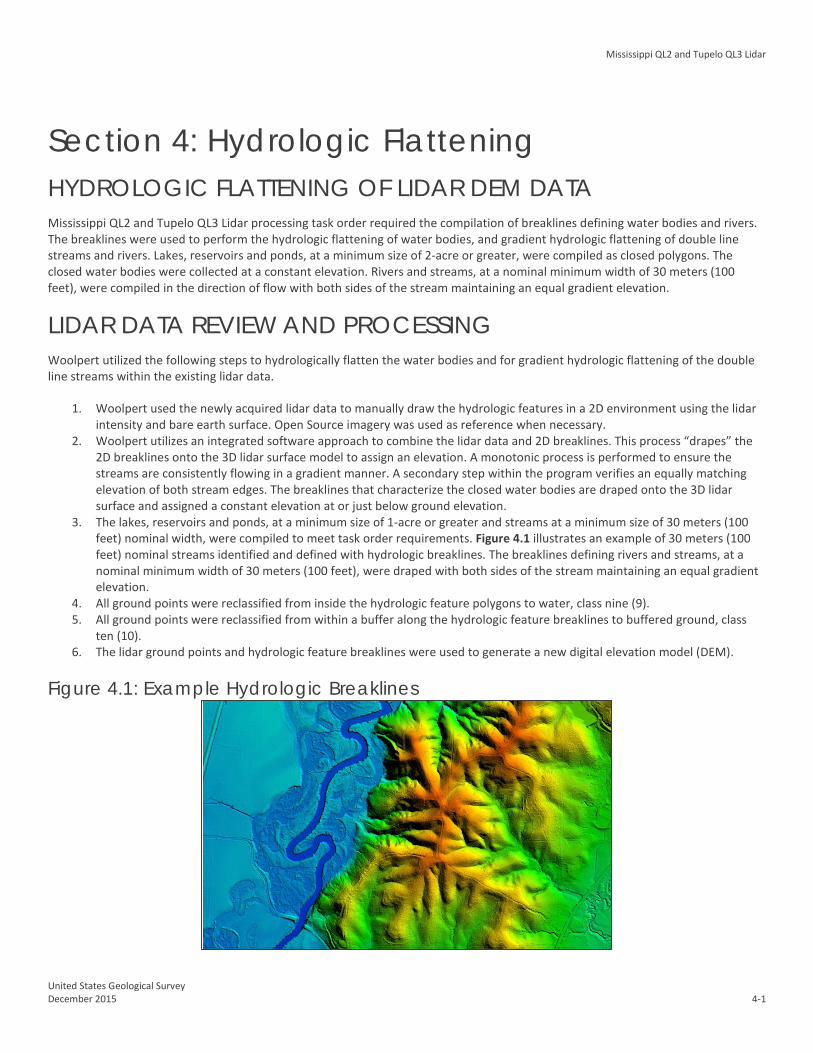
3. The lakes, reservoirs and ponds, at a minimum size of 1-acre or greater and streams at a minimum size of 30 meters (100 feet) nominal width, were compiled to meet task order requirements. Figure 4.1 illustrates an example of 30 meters (100 feet) nominal streams identified and defined with hydrologic breaklines. The breaklines defining rivers and streams, at a nominal minimum width of 30 meters (100 feet), were draped with both sides of the stream maintaining an equal gradient elevation.
4. All ground points were reclassified from inside the hydrologic feature polygons to water, class nine (9). 5. All ground points were reclassified from within a buffer along the hydrologic feature breaklines to buffered ground, class
ten (10). 6. The lidar ground points and hydrologic feature breaklines were used to generate a new digital elevation model (DEM).
Figure 4.1: Example Hydrologic Breaklines
Mississippi QL2 and Tupelo QL3 Lidar
United States Geological Survey December 2015 4-2
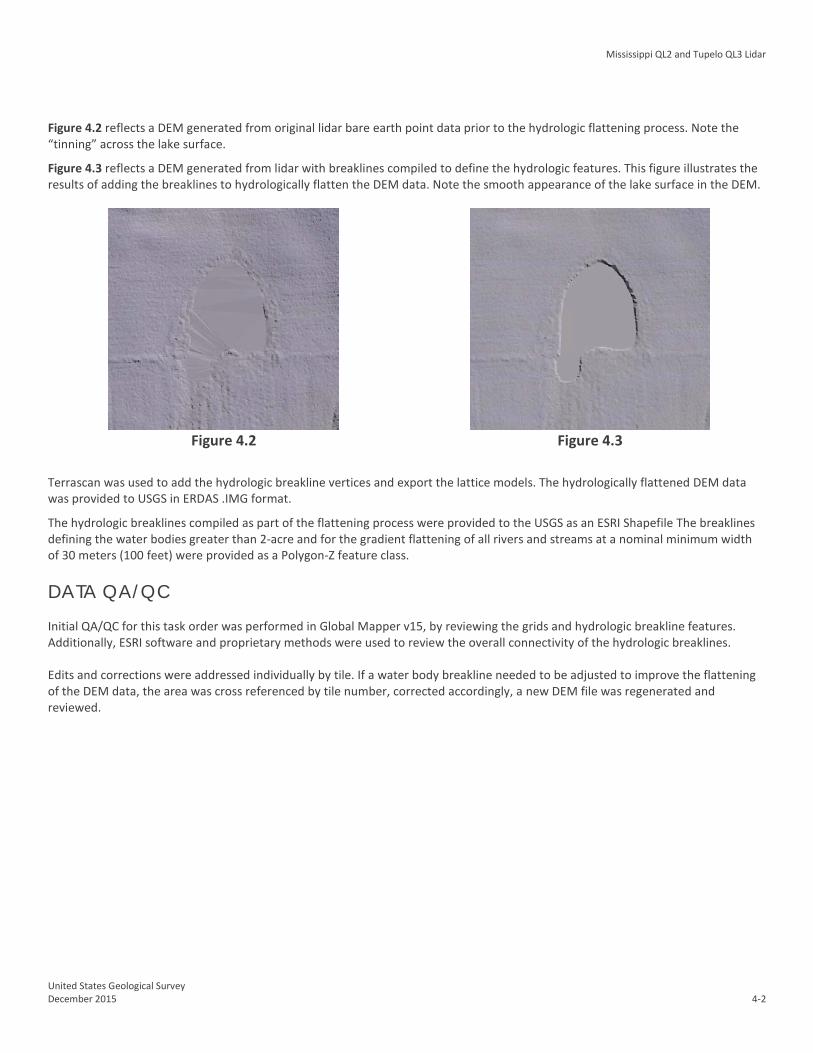
Figure 4.2 reflects a DEM generated from original lidar bare earth point data prior to the hydrologic flattening process. Note the “tinning” across the lake surface.
Figure 4.3 reflects a DEM generated from lidar with breaklines compiled to define the hydrologic features. This figure illustrates the results of adding the breaklines to hydrologically flatten the DEM data. Note the smooth appearance of the lake surface in the DEM.
Figure 4.2 Figure 4.3
Terrascan was used to add the hydrologic breakline vertices and export the lattice models. The hydrologically flattened DEM data was provided to USGS in ERDAS .IMG format.
The hydrologic breaklines compiled as part of the flattening process were provided to the USGS as an ESRI Shapefile The breaklines defining the water bodies greater than 2-acre and for the gradient flattening of all rivers and streams at a nominal minimum width of 30 meters (100 feet) were provided as a Polygon-Z feature class.
DATA QA/QC
Initial QA/QC for this task order was performed in Global Mapper v15, by reviewing the grids and hydrologic breakline features. Additionally, ESRI software and proprietary methods were used to review the overall connectivity of the hydrologic breaklines. Edits and corrections were addressed individually by tile. If a water body breakline needed to be adjusted to improve the flattening of the DEM data, the area was cross referenced by tile number, corrected accordingly, a new DEM file was regenerated and reviewed.
Mississippi QL2 and Tupelo QL3 Lidar
United States Geological Survey December 2015 5-1
Section 5: ACCURACY ASSESSMENT Accuracy Assessment
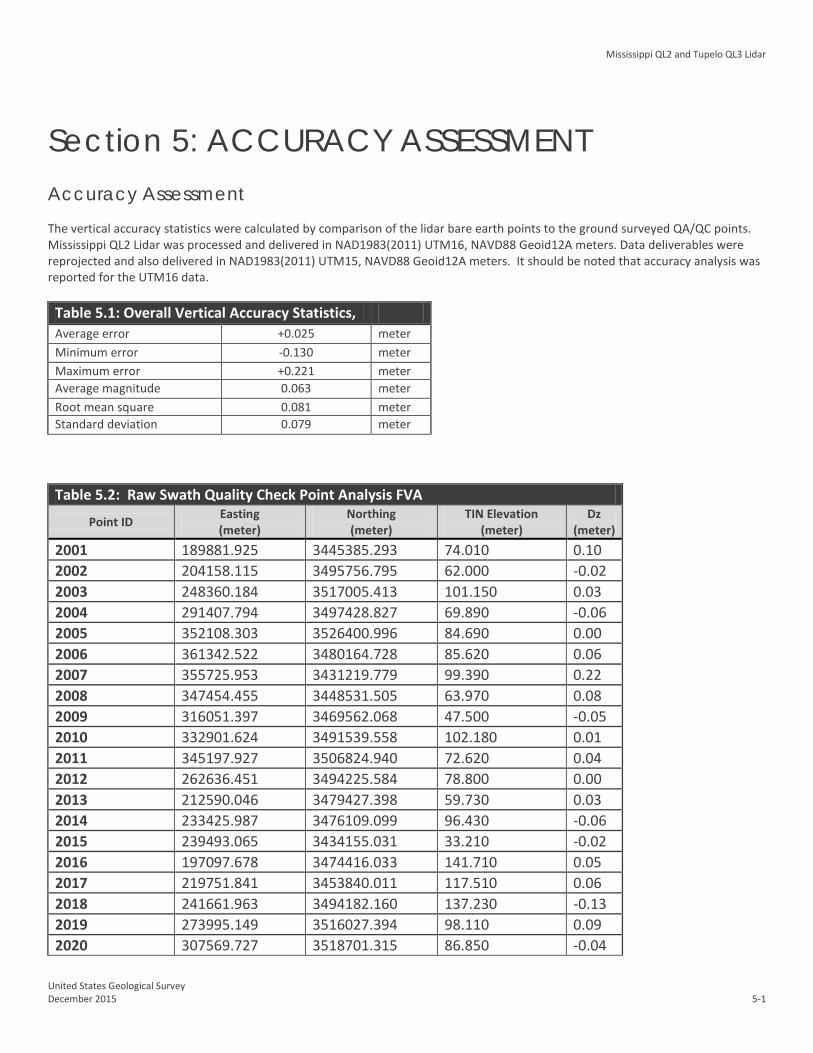
The vertical accuracy statistics were calculated by comparison of the lidar bare earth points to the ground surveyed QA/QC points. Mississippi QL2 Lidar was processed and delivered in NAD1983(2011) UTM16, NAVD88 Geoid12A meters. Data deliverables were reprojected and also delivered in NAD1983(2011) UTM15, NAVD88 Geoid12A meters. It should be noted that accuracy analysis was reported for the UTM16 data. Table 5.1: Overall Vertical Accuracy Statistics, Average error +0.025 meter Minimum error -0.130 meter Maximum error +0.221 meter Average magnitude 0.063 meter Root mean square 0.081 meter Standard deviation 0.079 meter
Table 5.2: Raw Swath Quality Check Point Analysis FVA
Point ID Easting (meter)
Northing (meter)
TIN Elevation (meter)
Dz (meter)
2001 189881.925 3445385.293 74.010 0.10 2002 204158.115 3495756.795 62.000 -0.02 2003 248360.184 3517005.413 101.150 0.03 2004 291407.794 3497428.827 69.890 -0.06 2005 352108.303 3526400.996 84.690 0.00 2006 361342.522 3480164.728 85.620 0.06 2007 355725.953 3431219.779 99.390 0.22 2008 347454.455 3448531.505 63.970 0.08 2009 316051.397 3469562.068 47.500 -0.05 2010 332901.624 3491539.558 102.180 0.01 2011 345197.927 3506824.940 72.620 0.04 2012 262636.451 3494225.584 78.800 0.00 2013 212590.046 3479427.398 59.730 0.03 2014 233425.987 3476109.099 96.430 -0.06 2015 239493.065 3434155.031 33.210 -0.02 2016 197097.678 3474416.033 141.710 0.05 2017 219751.841 3453840.011 117.510 0.06 2018 241661.963 3494182.160 137.230 -0.13 2019 273995.149 3516027.394 98.110 0.09 2020 307569.727 3518701.315 86.850 -0.04
Mississippi QL2 and Tupelo QL3 Lidar
United States Geological Survey December 2015 5-2
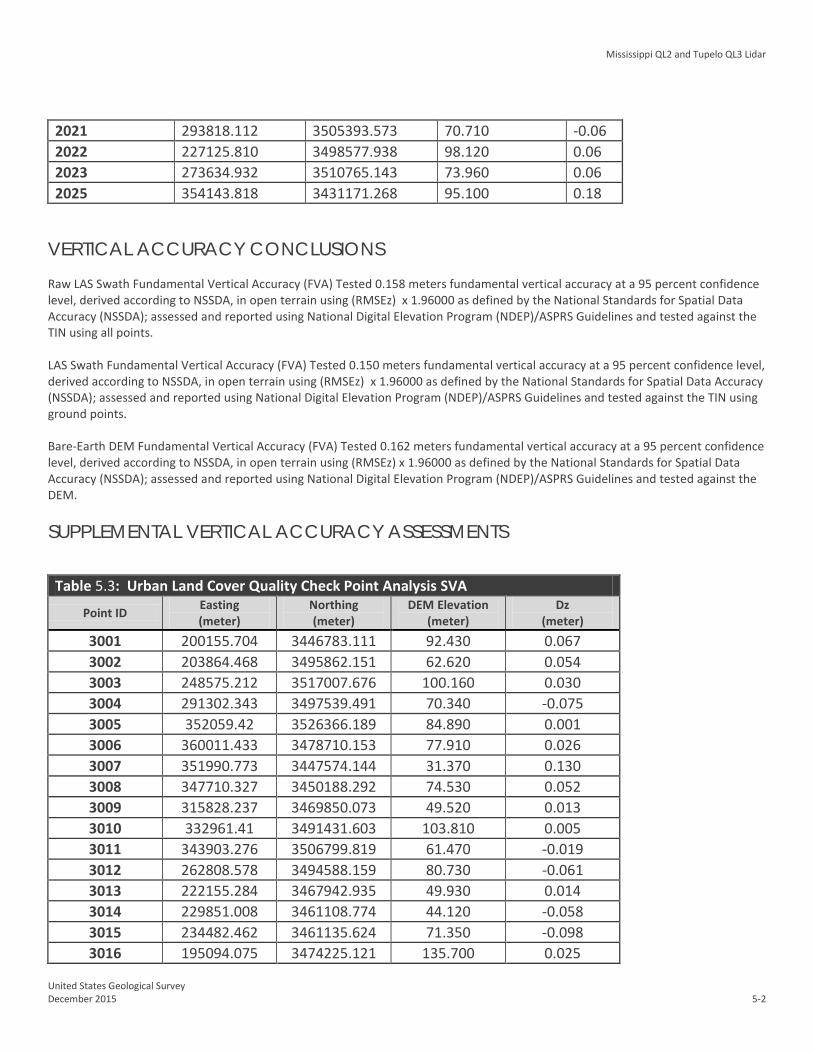
2021 293818.112 3505393.573 70.710 -0.06 2022 227125.810 3498577.938 98.120 0.06 2023 273634.932 3510765.143 73.960 0.06 2025 354143.818 3431171.268 95.100 0.18
VERTICAL ACCURACY CONCLUSIONS Raw LAS Swath Fundamental Vertical Accuracy (FVA) Tested 0.158 meters fundamental vertical accuracy at a 95 percent confidence level, derived according to NSSDA, in open terrain using (RMSEz) x 1.96000 as defined by the National Standards for Spatial Data Accuracy (NSSDA); assessed and reported using National Digital Elevation Program (NDEP)/ASPRS Guidelines and tested against the TIN using all points. LAS Swath Fundamental Vertical Accuracy (FVA) Tested 0.150 meters fundamental vertical accuracy at a 95 percent confidence level, derived according to NSSDA, in open terrain using (RMSEz) x 1.96000 as defined by the National Standards for Spatial Data Accuracy (NSSDA); assessed and reported using National Digital Elevation Program (NDEP)/ASPRS Guidelines and tested against the TIN using ground points. Bare-Earth DEM Fundamental Vertical Accuracy (FVA) Tested 0.162 meters fundamental vertical accuracy at a 95 percent confidence level, derived according to NSSDA, in open terrain using (RMSEz) x 1.96000 as defined by the National Standards for Spatial Data Accuracy (NSSDA); assessed and reported using National Digital Elevation Program (NDEP)/ASPRS Guidelines and tested against the DEM.
SUPPLEMENTAL VERTICAL ACCURACY ASSESSMENTS Table 5.3: Urban Land Cover Quality Check Point Analysis SVA
Point ID Easting (meter)
Northing (meter)
DEM Elevation (meter)
Dz (meter)
3001 200155.704 3446783.111 92.430 0.067 3002 203864.468 3495862.151 62.620 0.054 3003 248575.212 3517007.676 100.160 0.030 3004 291302.343 3497539.491 70.340 -0.075 3005 352059.42 3526366.189 84.890 0.001 3006 360011.433 3478710.153 77.910 0.026 3007 351990.773 3447574.144 31.370 0.130 3008 347710.327 3450188.292 74.530 0.052 3009 315828.237 3469850.073 49.520 0.013 3010 332961.41 3491431.603 103.810 0.005 3011 343903.276 3506799.819 61.470 -0.019 3012 262808.578 3494588.159 80.730 -0.061 3013 222155.284 3467942.935 49.930 0.014 3014 229851.008 3461108.774 44.120 -0.058 3015 234482.462 3461135.624 71.350 -0.098 3016 195094.075 3474225.121 135.700 0.025
Mississippi QL2 and Tupelo QL3 Lidar
United States Geological Survey December 2015 5-3
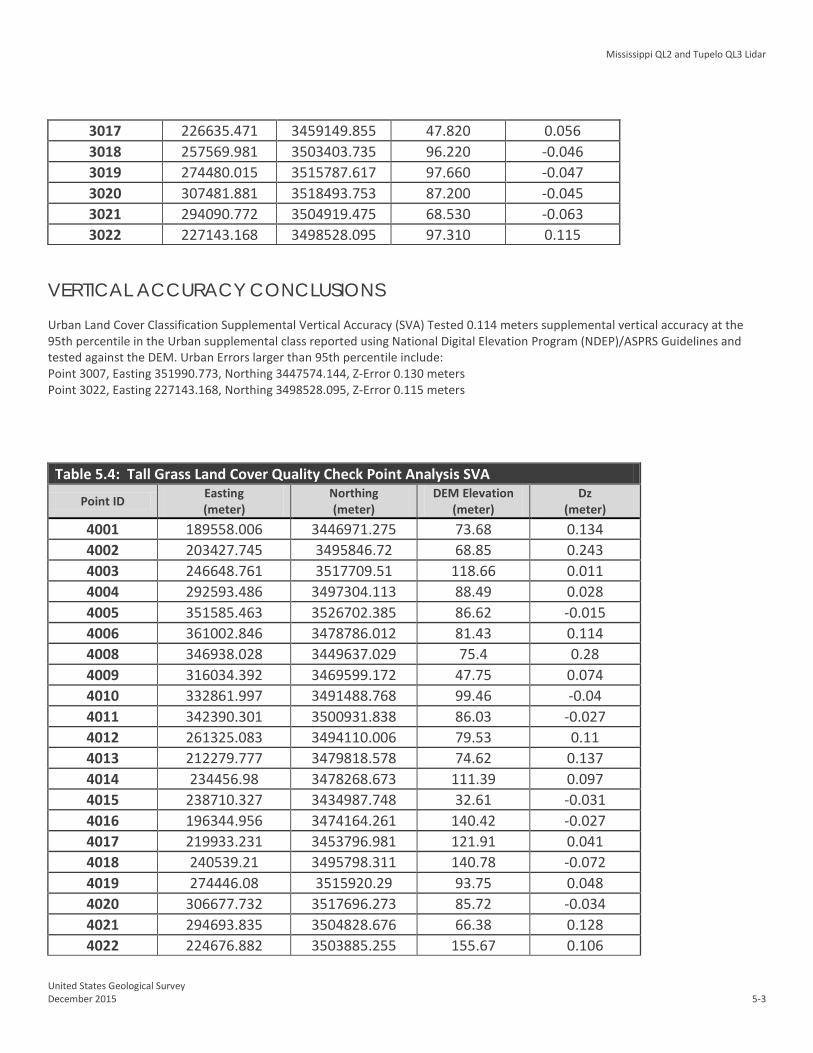
3017 226635.471 3459149.855 47.820 0.056 3018 257569.981 3503403.735 96.220 -0.046 3019 274480.015 3515787.617 97.660 -0.047 3020 307481.881 3518493.753 87.200 -0.045 3021 294090.772 3504919.475 68.530 -0.063 3022 227143.168 3498528.095 97.310 0.115
VERTICAL ACCURACY CONCLUSIONS Urban Land Cover Classification Supplemental Vertical Accuracy (SVA) Tested 0.114 meters supplemental vertical accuracy at the 95th percentile in the Urban supplemental class reported using National Digital Elevation Program (NDEP)/ASPRS Guidelines and tested against the DEM. Urban Errors larger than 95th percentile include: Point 3007, Easting 351990.773, Northing 3447574.144, Z-Error 0.130 meters Point 3022, Easting 227143.168, Northing 3498528.095, Z-Error 0.115 meters Table 5.4: Tall Grass Land Cover Quality Check Point Analysis SVA
Point ID Easting (meter)
Northing (meter)
DEM Elevation (meter)
Dz (meter)
4001 189558.006 3446971.275 73.68 0.134 4002 203427.745 3495846.72 68.85 0.243 4003 246648.761 3517709.51 118.66 0.011 4004 292593.486 3497304.113 88.49 0.028 4005 351585.463 3526702.385 86.62 -0.015 4006 361002.846 3478786.012 81.43 0.114 4008 346938.028 3449637.029 75.4 0.28 4009 316034.392 3469599.172 47.75 0.074 4010 332861.997 3491488.768 99.46 -0.04 4011 342390.301 3500931.838 86.03 -0.027 4012 261325.083 3494110.006 79.53 0.11 4013 212279.777 3479818.578 74.62 0.137 4014 234456.98 3478268.673 111.39 0.097 4015 238710.327 3434987.748 32.61 -0.031 4016 196344.956 3474164.261 140.42 -0.027 4017 219933.231 3453796.981 121.91 0.041 4018 240539.21 3495798.311 140.78 -0.072 4019 274446.08 3515920.29 93.75 0.048 4020 306677.732 3517696.273 85.72 -0.034 4021 294693.835 3504828.676 66.38 0.128 4022 224676.882 3503885.255 155.67 0.106
Mississippi QL2 and Tupelo QL3 Lidar
United States Geological Survey December 2015 5-4
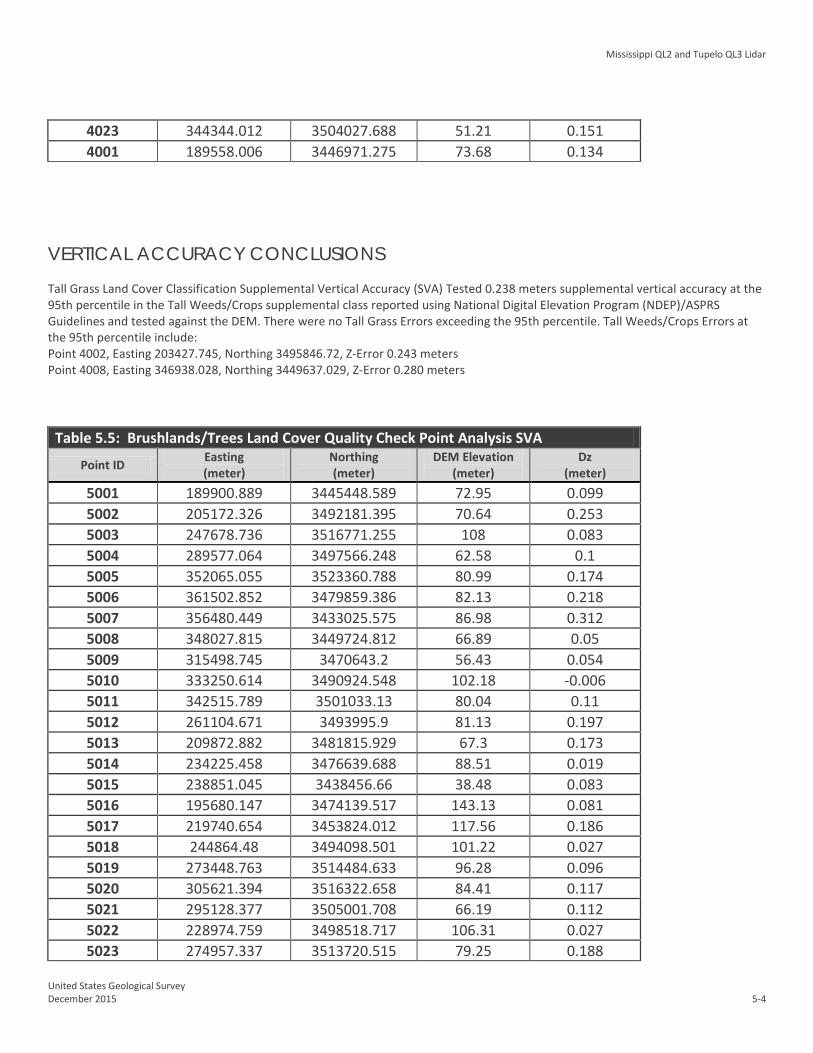
4023 344344.012 3504027.688 51.21 0.151 4001 189558.006 3446971.275 73.68 0.134
VERTICAL ACCURACY CONCLUSIONS Tall Grass Land Cover Classification Supplemental Vertical Accuracy (SVA) Tested 0.238 meters supplemental vertical accuracy at the 95th percentile in the Tall Weeds/Crops supplemental class reported using National Digital Elevation Program (NDEP)/ASPRS Guidelines and tested against the DEM. There were no Tall Grass Errors exceeding the 95th percentile. Tall Weeds/Crops Errors at the 95th percentile include: Point 4002, Easting 203427.745, Northing 3495846.72, Z-Error 0.243 meters Point 4008, Easting 346938.028, Northing 3449637.029, Z-Error 0.280 meters Table 5.5: Brushlands/Trees Land Cover Quality Check Point Analysis SVA
Point ID Easting (meter)
Northing (meter)
DEM Elevation (meter)
Dz (meter)
5001 189900.889 3445448.589 72.95 0.099 5002 205172.326 3492181.395 70.64 0.253 5003 247678.736 3516771.255 108 0.083 5004 289577.064 3497566.248 62.58 0.1 5005 352065.055 3523360.788 80.99 0.174 5006 361502.852 3479859.386 82.13 0.218 5007 356480.449 3433025.575 86.98 0.312 5008 348027.815 3449724.812 66.89 0.05 5009 315498.745 3470643.2 56.43 0.054 5010 333250.614 3490924.548 102.18 -0.006 5011 342515.789 3501033.13 80.04 0.11 5012 261104.671 3493995.9 81.13 0.197 5013 209872.882 3481815.929 67.3 0.173 5014 234225.458 3476639.688 88.51 0.019 5015 238851.045 3438456.66 38.48 0.083 5016 195680.147 3474139.517 143.13 0.081 5017 219740.654 3453824.012 117.56 0.186 5018 244864.48 3494098.501 101.22 0.027 5019 273448.763 3514484.633 96.28 0.096 5020 305621.394 3516322.658 84.41 0.117 5021 295128.377 3505001.708 66.19 0.112 5022 228974.759 3498518.717 106.31 0.027 5023 274957.337 3513720.515 79.25 0.188
Mississippi QL2 and Tupelo QL3 Lidar
United States Geological Survey December 2015 5-5
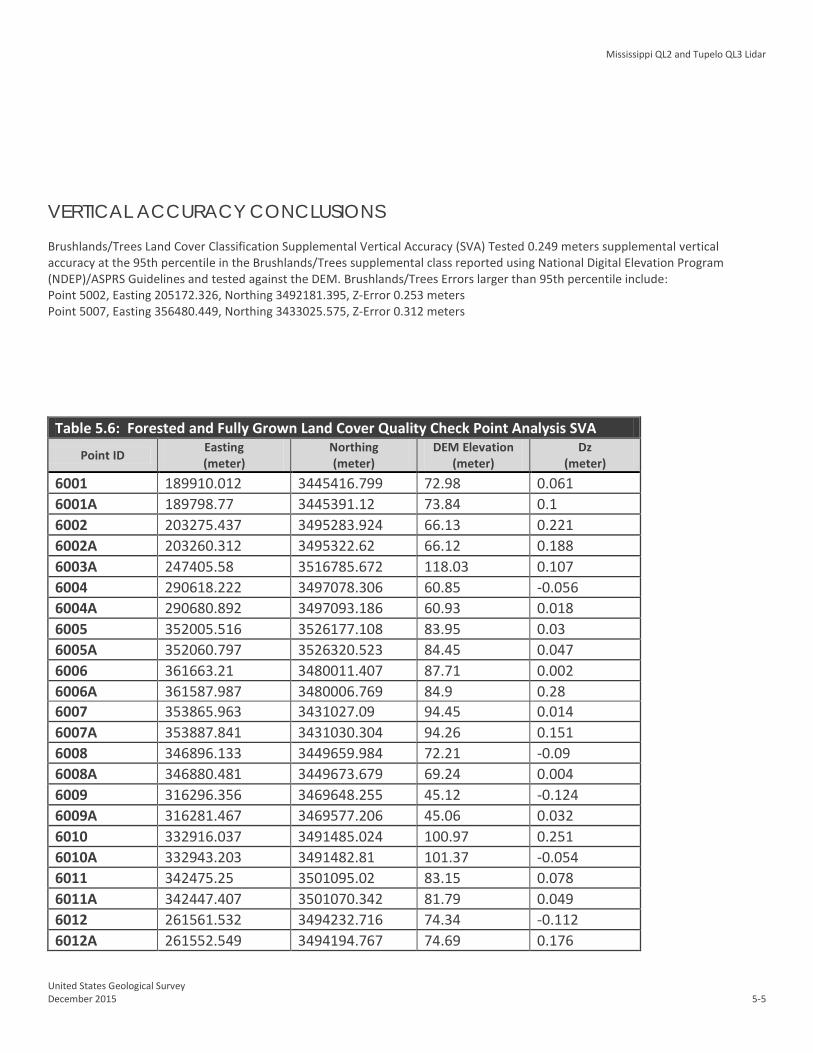
VERTICAL ACCURACY CONCLUSIONS Brushlands/Trees Land Cover Classification Supplemental Vertical Accuracy (SVA) Tested 0.249 meters supplemental vertical accuracy at the 95th percentile in the Brushlands/Trees supplemental class reported using National Digital Elevation Program (NDEP)/ASPRS Guidelines and tested against the DEM. Brushlands/Trees Errors larger than 95th percentile include: Point 5002, Easting 205172.326, Northing 3492181.395, Z-Error 0.253 meters Point 5007, Easting 356480.449, Northing 3433025.575, Z-Error 0.312 meters Table 5.6: Forested and Fully Grown Land Cover Quality Check Point Analysis SVA
Point ID Easting (meter)
Northing (meter)
DEM Elevation (meter)
Dz (meter)
6001 189910.012 3445416.799 72.98 0.061 6001A 189798.77 3445391.12 73.84 0.1 6002 203275.437 3495283.924 66.13 0.221 6002A 203260.312 3495322.62 66.12 0.188 6003A 247405.58 3516785.672 118.03 0.107 6004 290618.222 3497078.306 60.85 -0.056 6004A 290680.892 3497093.186 60.93 0.018 6005 352005.516 3526177.108 83.95 0.03 6005A 352060.797 3526320.523 84.45 0.047 6006 361663.21 3480011.407 87.71 0.002 6006A 361587.987 3480006.769 84.9 0.28 6007 353865.963 3431027.09 94.45 0.014 6007A 353887.841 3431030.304 94.26 0.151 6008 346896.133 3449659.984 72.21 -0.09 6008A 346880.481 3449673.679 69.24 0.004 6009 316296.356 3469648.255 45.12 -0.124 6009A 316281.467 3469577.206 45.06 0.032 6010 332916.037 3491485.024 100.97 0.251 6010A 332943.203 3491482.81 101.37 -0.054 6011 342475.25 3501095.02 83.15 0.078 6011A 342447.407 3501070.342 81.79 0.049 6012 261561.532 3494232.716 74.34 -0.112 6012A 261552.549 3494194.767 74.69 0.176
Mississippi QL2 and Tupelo QL3 Lidar
United States Geological Survey December 2015 5-6
6013 212257.432 3479815.872 73.56 0.071 6013A 212270.286 3479796.159 72.93 0.238 6014 234248.065 3477132.448 86.31 -0.158 6014A 234223.927 3476928.84 91.18 -0.132 6015 239525.934 3434061.158 33.28 -0.107 6016 197187.285 3474464.654 142.24 -0.139 6016A 197313.114 3474510.634 141.28 -0.029 6017 218405.371 3453368.365 121.11 0.053 6017A 218375.464 3453400.244 119.94 0.179 6018 245020.693 3494078.804 103.21 -0.02 6018A 244955.256 3494075.836 101.88 -0.004 6019 274257.221 3515936 97.19 0 6019A 274282.398 3515931.768 96.79 0.053 6020 305648.187 3516500.765 80.87 -0.119 6020A 305637.943 3516527.913 81.86 -0.179 6021 294785.532 3504036.42 63.44 -0.074 6021A 294820.778 3504045.407 63.62 -0.138 6022 227642.677 3498481.39 92.88 0.065 6022A 227616.918 3498481.17 92.11 -0.016
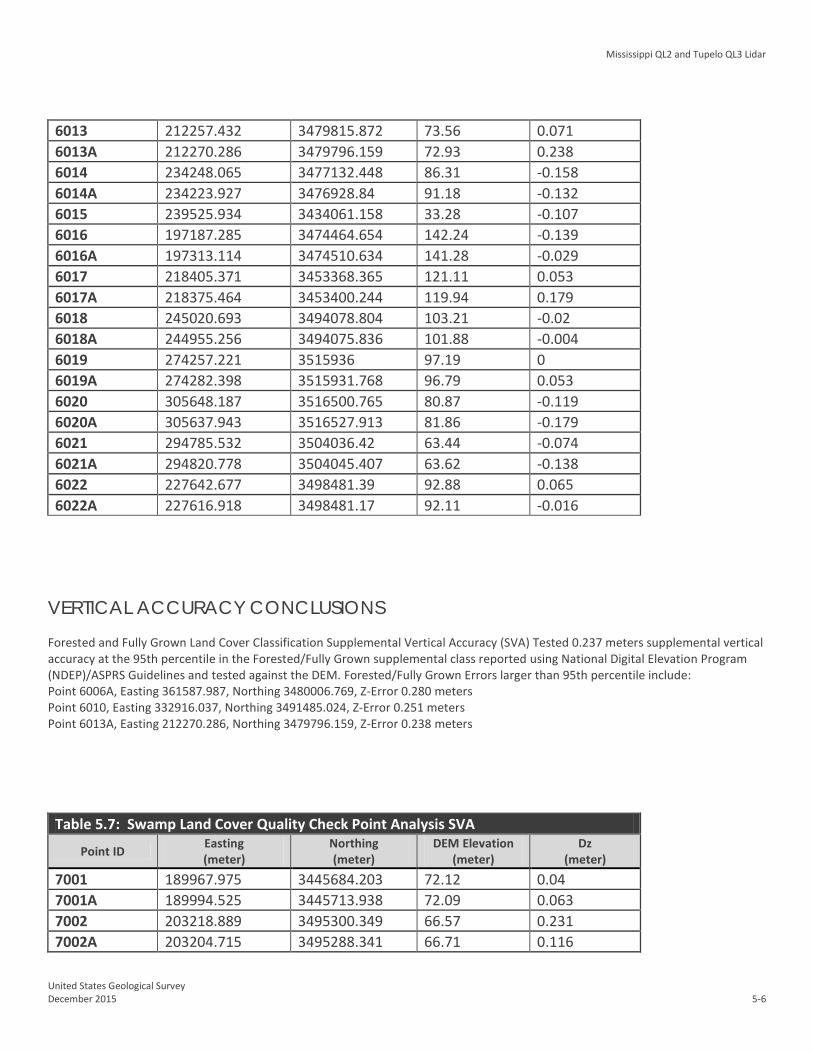
VERTICAL ACCURACY CONCLUSIONS Forested and Fully Grown Land Cover Classification Supplemental Vertical Accuracy (SVA) Tested 0.237 meters supplemental vertical accuracy at the 95th percentile in the Forested/Fully Grown supplemental class reported using National Digital Elevation Program (NDEP)/ASPRS Guidelines and tested against the DEM. Forested/Fully Grown Errors larger than 95th percentile include: Point 6006A, Easting 361587.987, Northing 3480006.769, Z-Error 0.280 meters Point 6010, Easting 332916.037, Northing 3491485.024, Z-Error 0.251 meters Point 6013A, Easting 212270.286, Northing 3479796.159, Z-Error 0.238 meters Table 5.7: Swamp Land Cover Quality Check Point Analysis SVA
Point ID Easting (meter)
Northing (meter)
DEM Elevation (meter)
Dz (meter)
7001 189967.975 3445684.203 72.12 0.04 7001A 189994.525 3445713.938 72.09 0.063 7002 203218.889 3495300.349 66.57 0.231 7002A 203204.715 3495288.341 66.71 0.116
Mississippi QL2 and Tupelo QL3 Lidar
United States Geological Survey December 2015 5-7
7003 249315.33 3516219.718 98.74 0.024 7003A 249333.298 3516253.622 97.23 0.054 7004 290708.138 3497080.302 60.39 -0.029 7004A 290613.091 3497053.695 60.53 0.019 7005 352001.991 3523344.876 79.8 -0.101 7005A 352315.504 3523303.044 82.74 0.083 7006 358653.676 3478879.785 57.91 -0.031 7006A 358675.685 3478871.177 58.46 -0.009 7007 355629.926 3431213.509 100.67 0.082 7007A 355593.108 3431217.697 99.85 0.001 7008 343936.591 3449541.666 33.37 0.018 7008A 343882.342 3449604.894 32.61 0.14 7009 316283.41 3470181.826 44.49 -0.052 7009A 316268.093 3470175.615 44.7 -0.101 7010 338867.921 3494782.531 58.15 -0.051 7010A 338844.044 3494766.75 57.91 -0.016 7011 343582.788 3501921.053 47.71 0.072 7011A 343451.076 3501873.936 43.75 -0.06 7012 261543.888 3494182.209 74.59 0.017 7012A 261522.079 3494147.036 74.96 0.015 7013 212607.98 3479414.213 59.31 0.024 7013A 212639.688 3479434.572 58.52 0.02 7014 233975.931 3475119.922 69.4 -0.028 7014A 233938.106 3475108.138 69.37 -0.045 7015 239497.136 3434072.285 33.47 -0.085 7015A 239520.423 3434094.796 33.51 -0.097 7016 191701.772 3475813.5 112.37 0.025 7016A 191686.747 3475782.062 111.87 0.062 7017 221077.274 3454769.615 98.76 0.253 7017A 221074.869 3454739.389 97.27 0.023 7018 244115.957 3494284.028 100.42 -0.045 7018A 244138.355 3494307.551 100.91 -0.065 7019 269958.91 3510675.253 76 0.054 7019A 269940.864 3510696.06 76.16 0.08 7020 307094.306 3516023.911 75.71 0.087 7020A 307082.697 3515985.821 76.26 0.041 7021 294788.265 3504070.676 63.76 -0.038 7021A 294741.516 3504075.568 63.66 -0.061 7022 227547.96 3498469.273 92.48 0.043 7022A 227517.295 3498465.671 92.5 0.073
Mississippi QL2 and Tupelo QL3 Lidar
United States Geological Survey December 2015 5-8
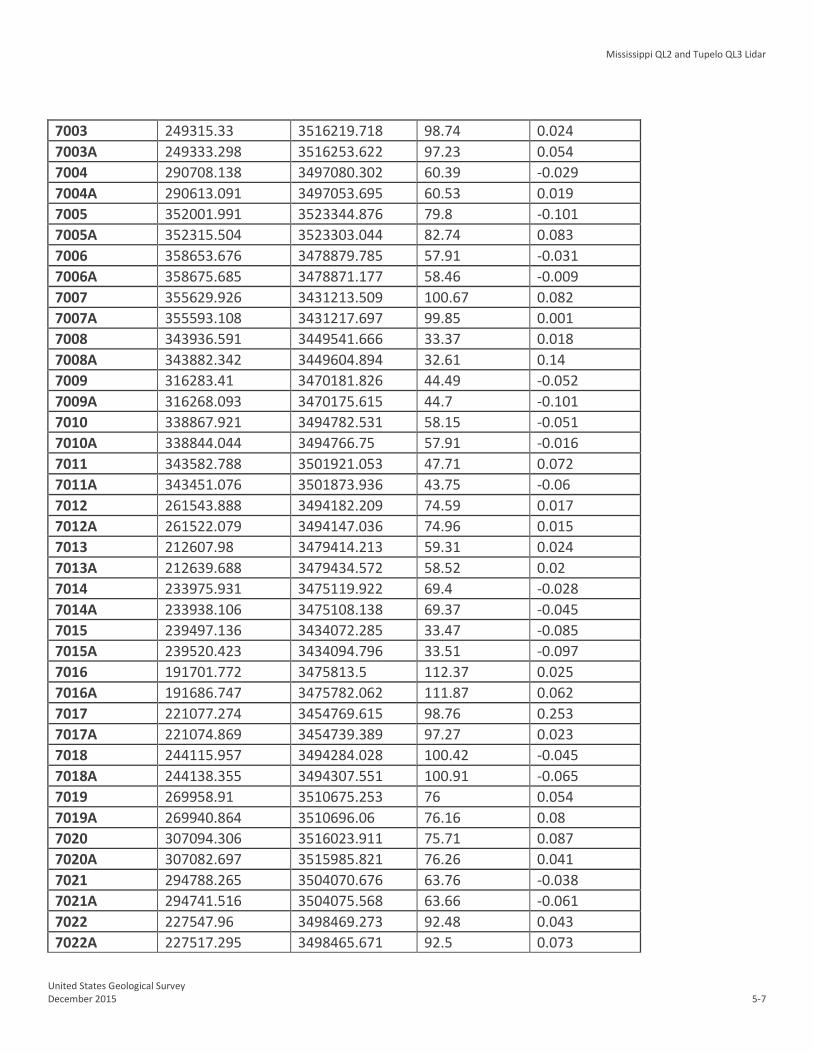
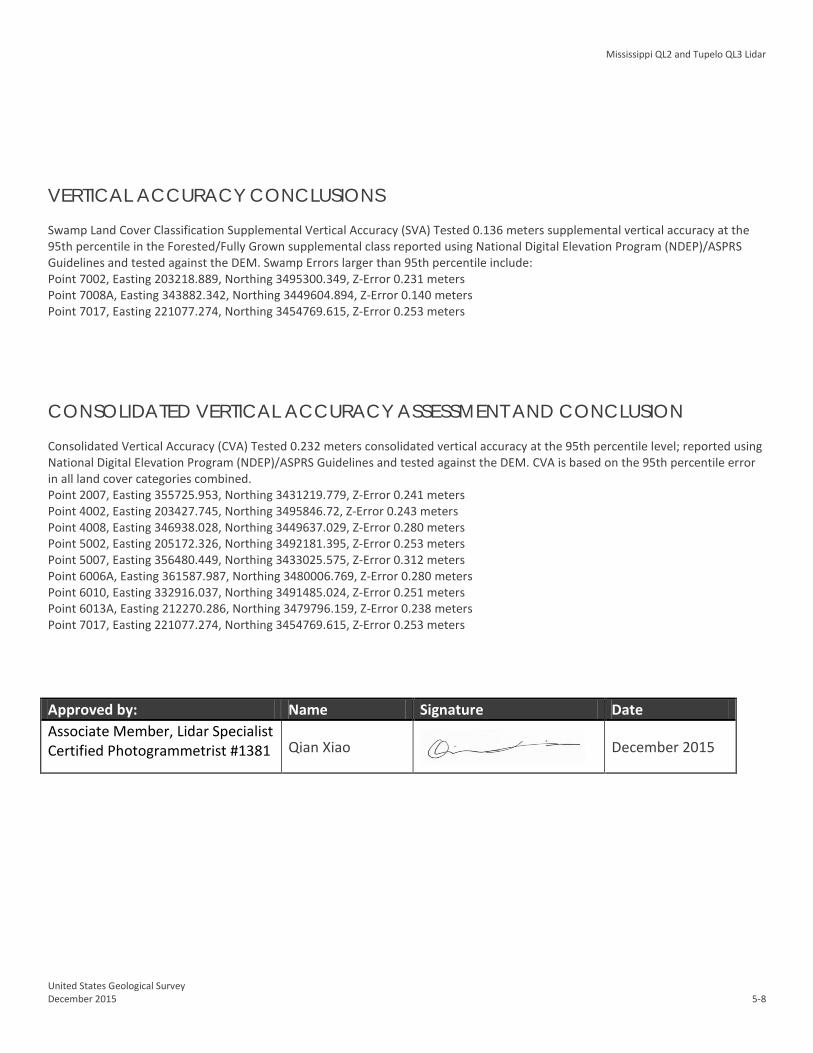
VERTICAL ACCURACY CONCLUSIONS Swamp Land Cover Classification Supplemental Vertical Accuracy (SVA) Tested 0.136 meters supplemental vertical accuracy at the 95th percentile in the Forested/Fully Grown supplemental class reported using National Digital Elevation Program (NDEP)/ASPRS Guidelines and tested against the DEM. Swamp Errors larger than 95th percentile include: Point 7002, Easting 203218.889, Northing 3495300.349, Z-Error 0.231 meters Point 7008A, Easting 343882.342, Northing 3449604.894, Z-Error 0.140 meters Point 7017, Easting 221077.274, Northing 3454769.615, Z-Error 0.253 meters
CONSOLIDATED VERTICAL ACCURACY ASSESSMENT AND CONCLUSION Consolidated Vertical Accuracy (CVA) Tested 0.232 meters consolidated vertical accuracy at the 95th percentile level; reported using National Digital Elevation Program (NDEP)/ASPRS Guidelines and tested against the DEM. CVA is based on the 95th percentile error in all land cover categories combined. Point 2007, Easting 355725.953, Northing 3431219.779, Z-Error 0.241 meters Point 4002, Easting 203427.745, Northing 3495846.72, Z-Error 0.243 meters Point 4008, Easting 346938.028, Northing 3449637.029, Z-Error 0.280 meters Point 5002, Easting 205172.326, Northing 3492181.395, Z-Error 0.253 meters Point 5007, Easting 356480.449, Northing 3433025.575, Z-Error 0.312 meters Point 6006A, Easting 361587.987, Northing 3480006.769, Z-Error 0.280 meters Point 6010, Easting 332916.037, Northing 3491485.024, Z-Error 0.251 meters Point 6013A, Easting 212270.286, Northing 3479796.159, Z-Error 0.238 meters Point 7017, Easting 221077.274, Northing 3454769.615, Z-Error 0.253 meters Approved by: Name Signature Date Associate Member, Lidar Specialist Certified Photogrammetrist #1381 Qian Xiao
December 2015

Mississippi QL2 and Tupelo QL3 Lidar
United States Geological Survey December 2015 6-1
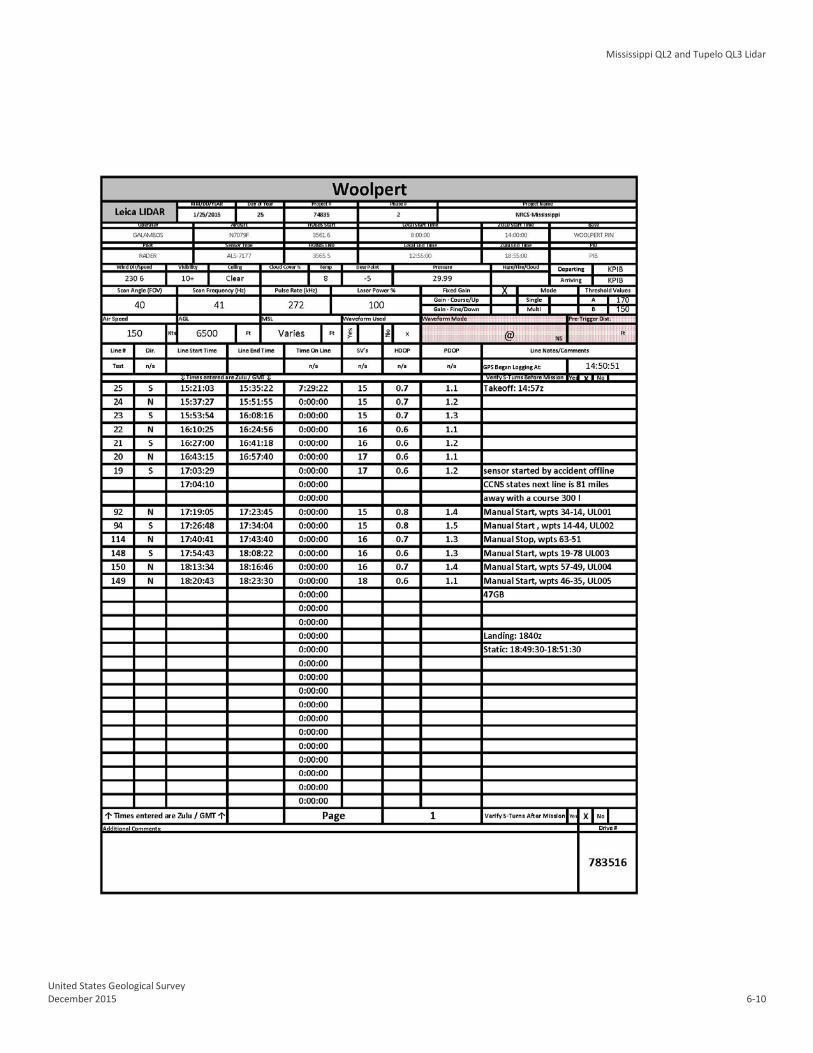
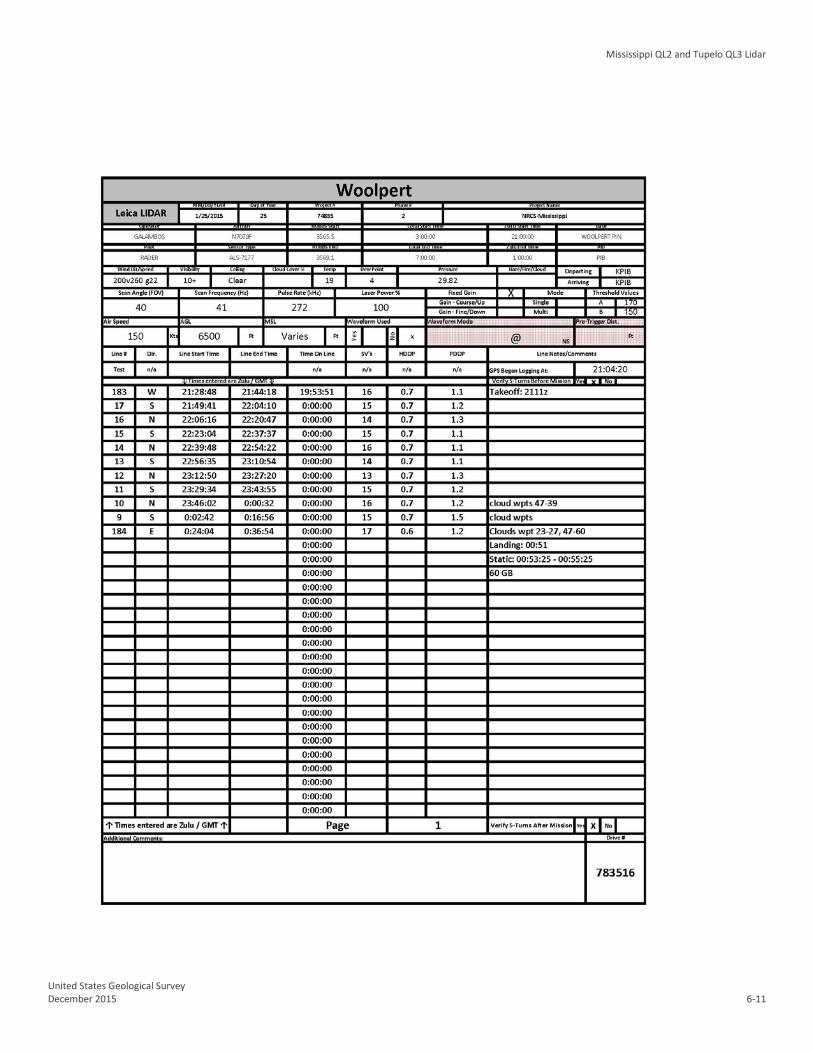
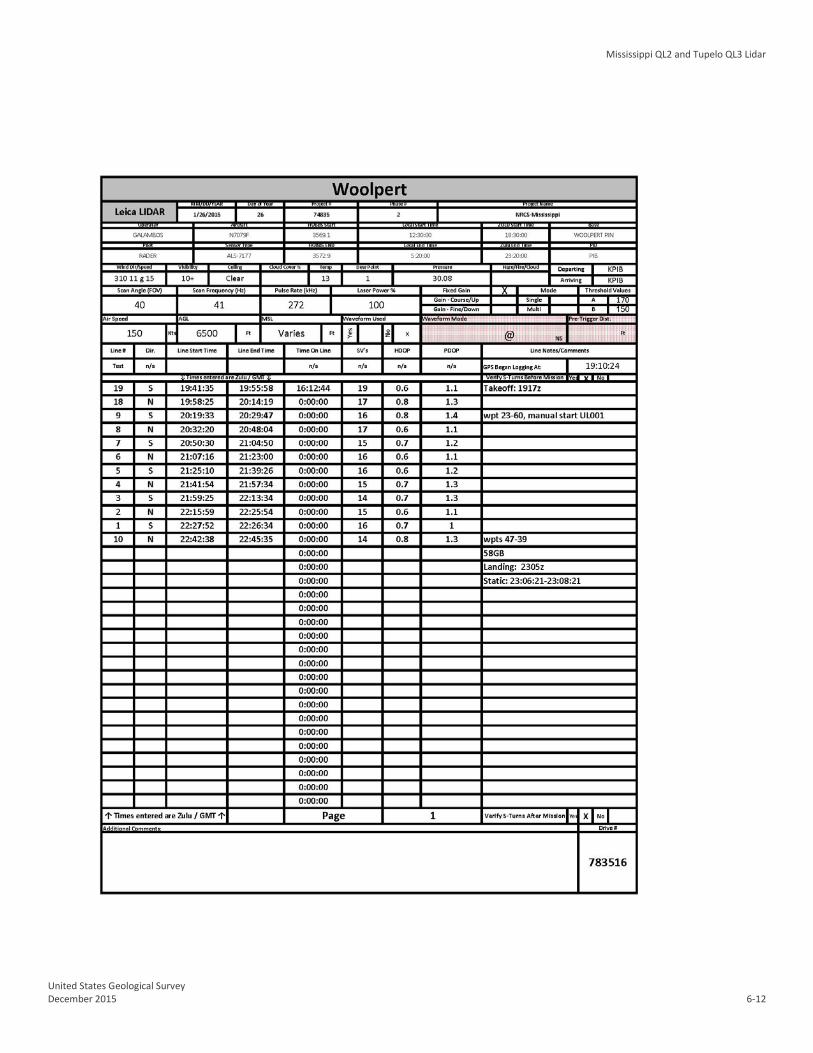
Section 6: Flight Logs Flight logs for the project are shown on the following pages:
Mississippi QL2 and Tupelo QL3 Lidar
United States Geological Survey December 2015 6-2
Mississippi QL2 and Tupelo QL3 Lidar
United States Geological Survey December 2015 6-3
Mississippi QL2 and Tupelo QL3 Lidar
United States Geological Survey December 2015 6-4
Mississippi QL2 and Tupelo QL3 Lidar
United States Geological Survey December 2015 6-5
Mississippi QL2 and Tupelo QL3 Lidar
United States Geological Survey December 2015 6-6
Mississippi QL2 and Tupelo QL3 Lidar
United States Geological Survey December 2015 6-7
Mississippi QL2 and Tupelo QL3 Lidar
United States Geological Survey December 2015 6-8
Mississippi QL2 and Tupelo QL3 Lidar
United States Geological Survey December 2015 6-9
Mississippi QL2 and Tupelo QL3 Lidar
United States Geological Survey December 2015 6-10
Mississippi QL2 and Tupelo QL3 Lidar
United States Geological Survey December 2015 6-11
Mississippi QL2 and Tupelo QL3 Lidar
United States Geological Survey December 2015 6-12
Mississippi QL2 and Tupelo QL3 Lidar
United States Geological Survey December 2015 7-1
Section 7: Final Deliverables The final lidar deliverables are listed below.
• LAS v1.2 classified point cloud • LAS v1.2 raw unclassified point cloud flight line strips. • Hydro Breaklines as ESRI shapefile • Digital Elevation Model in ERDAS .IMG format • 8-bit intensity images in .GEOTIF format • Tile layout and data extent provided as ESRI shapefile • Control Points provided as ESRI shapefile • FGDC compliant metadata per product in XML format • Lidar processing report in PDF format • Survey report in PDF format