MISSION STATEMENT OF THE LOUISIANA GAMING CONTROL BOARD
56
State of Louisiana KATHLEEN BABINEAUX BLANCO Gaming Control Board H. CHARLES GUADIN GOVERNOR CHARIMAN 9100 Bluebonnet Centre, Suite 500, Baton Rouge, LA 70809 Phone: (225) 295-8450 Fax: (225) 295-8479 i MISSION STATEMENT OF THE LOUISIANA GAMING CONTROL BOARD To regulate all gaming activities under its jurisdiction in a manner which instills public confidence and trust that gaming activities are conducted honestly and free from criminal and corruptive elements; to insure the integrity of individual gaming activities by the regulation of persons, practices, associations and activities within the gaming industry.
Transcript of MISSION STATEMENT OF THE LOUISIANA GAMING CONTROL BOARD

State of Louisiana KATHLEEN BABINEAUX BLANCO Gaming Control Board H. CHARLES GUADIN GOVERNOR CHARIMAN
9100 Bluebonnet Centre, Suite 500, Baton Rouge, LA 70809 Phone: (225) 295-8450 Fax: (225) 295-8479
i
MISSION STATEMENT OF THE
LOUISIANA GAMING CONTROL BOARD
To regulate all gaming activities under its jurisdiction in a manner which instills public confidence and trust that gaming activities are conducted honestly and free from criminal and corruptive elements; to insure the integrity of individual gaming activities by the regulation of persons, practices, associations and activities within the gaming industry.

ii
TABLE OF CONTENTS Louisiana Gaming Control Board Mission Statement.................................................................................i Table of Contents....................................................................................................................................... ii Chairman’s Letter .......................................................................................................................................1 Attorney General’s Gaming Division and Louisiana State Police Personnel.............................................3 Acknowledgments ......................................................................................................................................4 RIVERBOAT ............................................................................................................................................5 Riverboat Activity Summary ...............................................................................................................7 Riverboat Economic Impact Figures....................................................................................................8 DEMOGRAPHIC INFORMATION ....................................................................................................11 Riverboat Gaming Compliance Information......................................................................................12
RIVERBOAT CASINO GAMING -OTHER STATES ......................................................................15 Select Data-Other States - Riverboat Casinos, Budgetary Information.............................................17
Illinois ..........................................................................................................................................18 Indiana .........................................................................................................................................19 Iowa ............................................................................................................................................20 Mississippi ...................................................................................................................................21 Missouri .......................................................................................................................................22
VIDEO POKER ......................................................................................................................................23 Video Poker Franchise Fees by Type.................................................................................................25 Video Poker Gaming Data by Parish ................................................................................................26 Video Poker Gaming Data by Classification ....................................................................................28 Distribution of Video Poker Revenue ................................................................................................29 Cumulative Report of Video Poker Activities ...................................................................................30
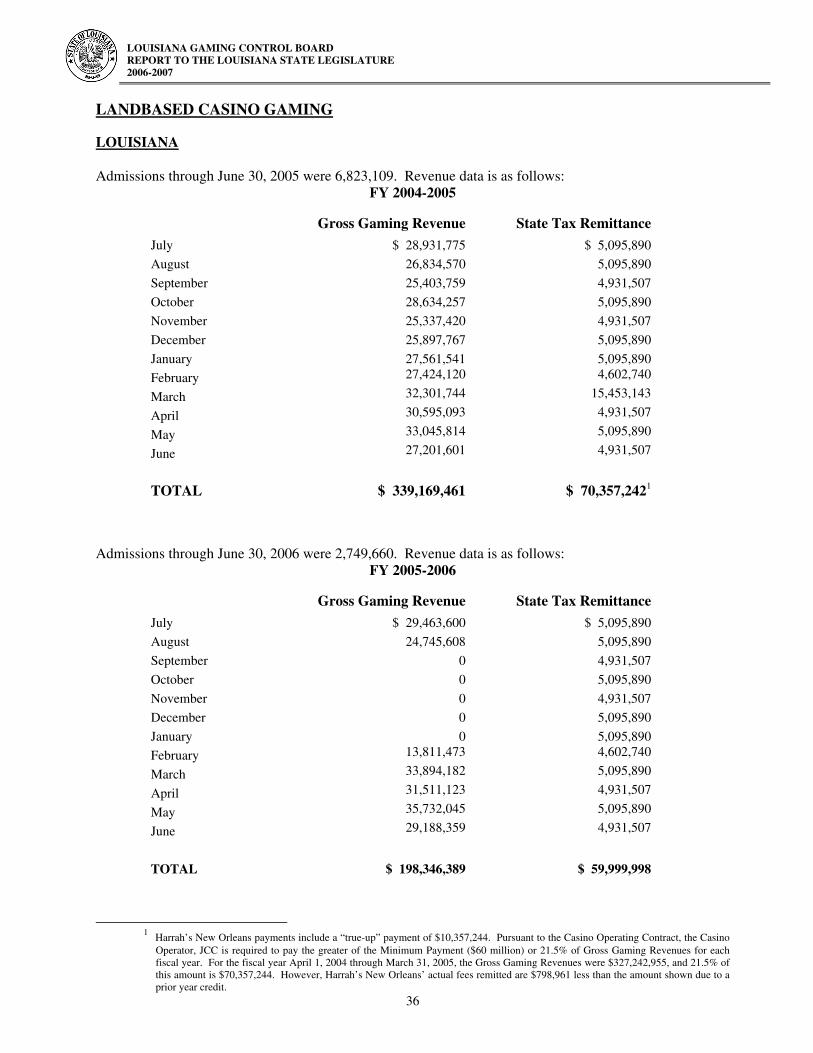
Other States- Montana ................................................................................................................................32 Oregon...................................................................................................................................32 West Virginia ........................................................................................................................33 LANDBASED CASINO GAMING.......................................................................................................35 Louisiana ............................................................................................................................................36 Other States- Colorado................................................................................................................................37 Michigan ...............................................................................................................................38 Nevada ..................................................................................................................................39 New Jersey ............................................................................................................................41 South Dakota.........................................................................................................................42 LIVE RACING FACILITY PARI-MUTUEL SLOT MACHINE GAMING ..................................43 Louisiana ............................................................................................................................................44 Other States- Delaware ...............................................................................................................................46 Iowa ……………………………………………………………………………………… 47 Maine……………………………………………………………………………………… 47 New Mexico ……………………………………………………………………………… 48 New York ………………………………………………………………………………… 48 Rhode Island .........................................................................................................................49 West Virginia ........................................................................................................................50 INDIAN GAMING .................................................................................................................................51
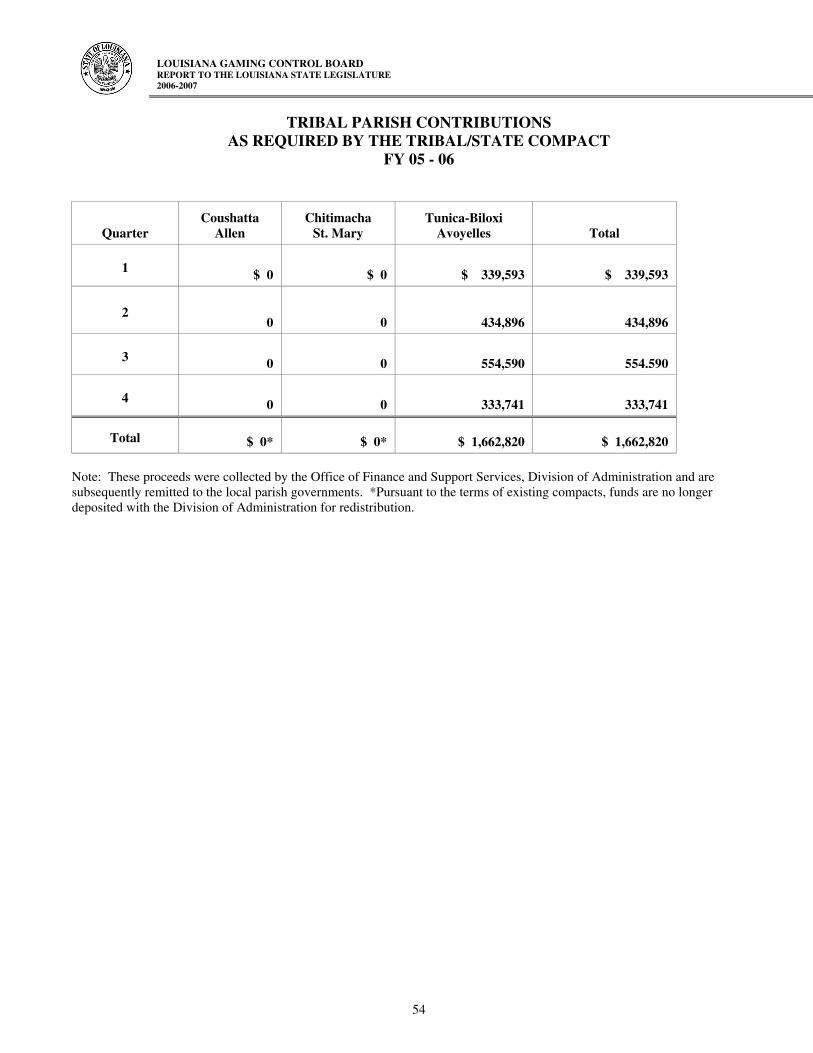
Cypress Bayou-Chitimacha................................................................................................................52 Grand Casino-Coushatta ....................................................................................................................52 Paragon-Tunica Biloxi .......................................................................................................................53 Revenue from Tribal Compacts FY 2005-2006.................................................................................54

9100 Bluebonnet Centre, Suite 500, Baton Rouge, LA 70809 Phone: (225) 295-8450 Fax: (225) 295-8479
1
State of Louisiana KATHLEEN BABINEAUX BLANCO Gaming Control Board H. CHARLES GAUDIN GOVERNOR CHARIMAN Mr. President, Mr. Speaker and Members of the Louisiana Legislature
In accordance with La. R.S. 27:15(B)(9)(b), the Louisiana Gaming Control Board submits its tenth annual report. These statistics reflect the status of gaming as it existed on June 30, 2006. The revenue from all sources is detailed with comparison to other states with similar forms of gaming. The report also details economic data in terms of employment, purchasing and local assistance.
Riverboat gaming was the dominant area of gaming activity. Total adjusted gross revenue
for fiscal year 2005-06 was $1,835,928,931, with $394,478,764 in fees to the state. This was an increase from 2004-05 of $59,283,847 in fees to the state.
The Shreveport – Bossier area continued to be the strongest market in the state. Adjusted
gross revenue for fiscal year 2005-06 was $727,260,569, an increase of slightly over $10 million dollars from fiscal year 2005-06. This is largely due to the increase in population immediately following Hurricane Katrina. Prior to the hurricane, there had been a steady decline in this area, which is largely dependent on the Dallas - Forth Worth market, due to Indian Casinos in Oklahoma. This region provides nearly half of all riverboat revenue to the state. Isle of Capri-Bossier City sold its ownership interest to Legend’s Gaming and is doing business as DiamondJacks Casino & Resort.
The Lake Charles riverboat market reflected an increase in adjusted gross revenue for fiscal year 2005-2006 of $116,034,517. L’auberge du Lac, the number one revenue producing riverboat casino in the state, has significantly impacted the Lake Charles casino market. Harrah’s Entertainment sold its ownership interests in its Lake Charles casinos to Pinnacle Entertainment, Inc. Sugarcane Bay, formerly, Harrah’s Pride, is in development and will be relocated next to L’auberge du Lac. Pinnacle has requested to relocate the berth site of PNK (Baton Rouge) formerly Harrah’s Star, from Lake Charles to Baton Rouge.
Adjusted gross revenue in 2005-06 rose by $74,001,664 in the Baton Rouge market due to the population increase following Hurricane Katrina.
The New Orleans market also had an increase in adjusted gross revenue of $59,495,862 for
fiscal year 2005-06. This is due in large part to the influx of workers rebuilding in the area. Amelia Belle Casino, formerly the Belle of Orleans (Bally’s), was granted a change of berth to St. Mary

2
Parish and is anticipated to open in late spring.
The landbased casino in New Orleans reopened on February 16, 2006, after being closed
nearly six months due to Hurricane Katrina. Gross gaming revenue for FY 2005-06 decreased $140,823,072 from fiscal year 2004-05, with a decrease in fees paid to the state of $10,357,244. In addition, construction was completed and Harrah’s opened its hotel in September, 2006.
Slot machines are in operation at three of the four licensed racing facilities. Delta Downs,
Harrah’s Louisiana Downs and Evangeline Downs combined contributed $53,030,967 in state fees during fiscal year 2005-06. Churchill Downs Louisiana Horseracing Company in New Orleans will be petitioning the Gaming Control Board to open a temporary facility while construction begins on the permanent site.
Video poker produced an 18 percent increase in franchise fees paid to the state in fiscal year
2005-06 compared to fiscal year 2004-05. The number of locations of bars, restaurants and hotels decreased as a result of the hurricanes, but off-track betting stations and truckstops remained nearly the same. There were a total of 13,571 video gaming devices in play at 2,276 establishments.
This report contains limited statistical information on one of the three Indian-owned casinos. The tribes are neither required to pay any fee directly to the State nor are they required to provide the Gaming Control Board with any financial figures. All of the tribes make contributions to local governments in their respective locations. The Board does wish to acknowledge the Chitimacha Tribe for its continued cooperation in voluntarily providing the information shown in this and previous reports.
In summary, the landbased casino closed for nearly six months, three riverboat casinos
remain closed, and there were 475 fewer video poker establishments during fiscal year 2005-06 than in 2004-05. Despite all of this, the gaming industry not only recovered from Hurricanes Katrina and Rita, but produced increases in franchise fees and taxes to the state during fiscal year 2005-06 totaling $85,107,696.
Respectfully submitted:
H. Charles Gaudin, Chairman Robert M. Fleming, Vice-Chairman James G. Boyer, Secretary/Treasurer William D. Lastrapes Claude Mercer Marcia D. Morgan Rupert R. Richardson M.J. “Kelly” Simoneaux Colonel Henry Whitehorn Secretary Cynthia Bridges
LOUISIANA GAMING CONTROL BOARD REPORT TO THE LOUISIANA STATE LEGISLATURE 2006-2007
3
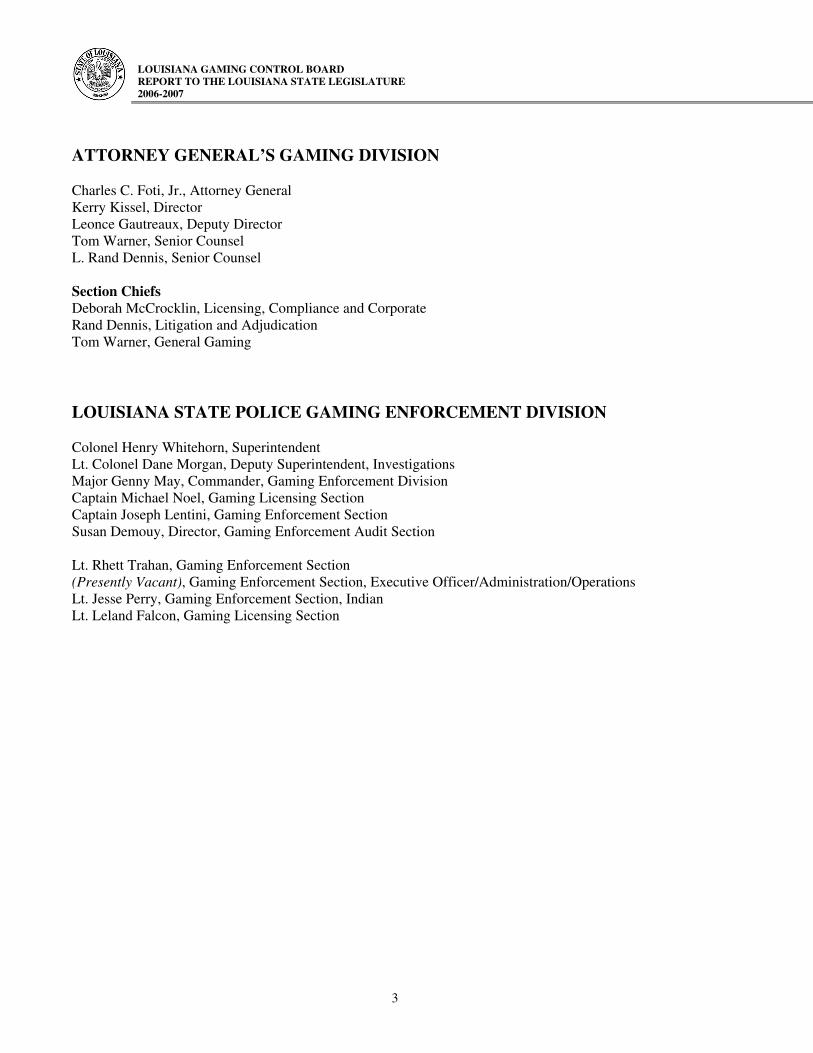
ATTORNEY GENERAL’S GAMING DIVISION Charles C. Foti, Jr., Attorney General Kerry Kissel, Director Leonce Gautreaux, Deputy Director Tom Warner, Senior Counsel L. Rand Dennis, Senior Counsel Section Chiefs Deborah McCrocklin, Licensing, Compliance and Corporate Rand Dennis, Litigation and Adjudication Tom Warner, General Gaming
LOUISIANA STATE POLICE GAMING ENFORCEMENT DIVISION Colonel Henry Whitehorn, Superintendent Lt. Colonel Dane Morgan, Deputy Superintendent, Investigations Major Genny May, Commander, Gaming Enforcement Division Captain Michael Noel, Gaming Licensing Section Captain Joseph Lentini, Gaming Enforcement Section Susan Demouy, Director, Gaming Enforcement Audit Section Lt. Rhett Trahan, Gaming Enforcement Section (Presently Vacant), Gaming Enforcement Section, Executive Officer/Administration/Operations Lt. Jesse Perry, Gaming Enforcement Section, Indian Lt. Leland Falcon, Gaming Licensing Section
LOUISIANA GAMING CONTROL BOARD REPORT TO THE LOUISIANA STATE LEGISLATURE 2006-2007
4
ACKNOWLEDGMENTS The Board wishes to acknowledge those who made special contributions to the preparation of this report: Department of Justice, Office of the Attorney General, Gaming Division Ann B. Dugas, Paralegal Tom Warner, Senior Counsel James A. Smith, Assistant Attorney General, Indian Gaming Louisiana State Police Susan Demouy, Audit Director Charlotte McGarr, Audit Manager Jeff Traylor, Audit Manager Janice Adolph, Audit Supervisor Donna Jackson, Corporate Securities Audit Supervisor Robert Tucker, Jr., Accounting Specialist Supervisor Donna Stevens, Accountant III Louisiana Casino Association Vickie Duty, Executive Assistant Wade Duty, Executive Director


LO
UIS
IAN
A G
AM
ING
CO
NT
RO
L B
OA
RD
R
EP
OR
T T
O T
HE
LO
UIS
IAN
A S
TA
TE
LE
GIS
LA
TU
RE
20
06-2
007
7
LO
UIS
IAN
A S
TA
TE
PO
LIC
E
RIV
ER
BO
AT
GA
MIN
G A
CT
IVIT
Y S
UM
MA
RY
F
ISC
AL
YE
AR
200
5 -
2006
Dat
e of
Lic
ense
e L
ocat
ion
Com
men
cem
ent
Adm
issi
ons
Tot
al A
GR
F
ee R
emit
tanc
e
Bel
le o
f O
rlea
ns, L
.L.C
. B
ally
’s C
asin
o-N
ew O
rlea
ns
07/0
7/95
19
4,61
2 $
8,1
98,5
42
$
1,5
16,7
30
Cat
fish
Que
en P
artn
ersh
ip in
Com
men
dam
B
elle
of
B.R
.- B
aton
Rou
ge
09/3
0/94
1,
358,
489
117,
320,
237
25,
223,
851
Gra
nd P
alai
s R
iver
boat
, Inc
. Is
le o
f C
apri
-Wes
tlake
07
/12/
96
1,96
9,25
7 13
4,26
4,76
1 28
,866
,924
Har
rah’
s L
ake
Cha
rles
, L.L
.C.
Har
rah’
s-L
ake
Cha
rles
12
/08/
93
364,
487
18,8
30,0
78
4,04
8,46
7
Har
rah’
s St
ar P
artn
ersh
ip
Har
rah’
s-L
ake
Cha
rles
10
/24/
93
224,
203
11,2
23,3
48
2,41
3,02
0
Eld
orad
o C
asin
o
Eld
orad
o R
esor
t - S
hrev
epor
t 12
/20/
00
3,08
9,45
2 12
5,17
8,45
4 26
,913
,368
Hor
sesh
oe E
nter
tain
men
t, L
.L.P
. H
orse
shoe
-Bos
sier
City
07
/09/
94
2,85
8,54
7 26
6,52
1,93
8 57
,302
,217
Lou
isia
na C
asin
o C
ruis
es, I
nc
Cas
ino
Rou
ge-B
aton
Rou
ge
12/2
8/94
1,
656,
803
155,
606,
691
33,4
55,4
39
Lou
isia
na R
iver
boat
Gam
ing
Part
ners
hip
Isle
of
Cap
ri-B
ossi
er C
ity
05/2
0/94
1,
896,
343
103,
275,
509
22,2
04,2
34
PNK
(B
ossi
er C
ity),
Inc
. B
oom
tow
n-B
ossi
er C
ity
10/0
4/96
1,
189,
424
100,
421,
080
21,5
90,5
32
PNK
(H
arve
y), L
.P.
Boo
mto
wn
Cas
ino-
Har
vey
08/0
6/94
2,
625,
198
209,
468,
103
45,0
35,6
42
PNK
(L
ake
Cha
rles
), L
.L.C
. L
’Aub
erge
Du
Lac
05
/23/
05
4,72
4,74
6 27
9,73
0,56
6 60
,142
,072
Red
Riv
er E
nter
tain
men
t of
Shre
vepo
rt
Part
ners
hip
in C
omm
enda
m
Sam
’s T
own-
Shre
vepo
rt
05/2
0/04
2,
091,
132
131,
863,
589
28,3
50,6
72
St. C
harl
es G
amin
g C
ompa
ny, I
nc.
Isle
of
Cap
ri-W
estla
ke
07/2
9/95
72
5,76
7 31
,375
,623
6,
745,
759
Tre
asur
e C
hest
Cas
ino,
L.L
.C.
Tre
asur
e C
hest
-Ken
ner
09/0
5/94
1,
257,
010
142,
650,
412
30,6
69,8
39
TO
TA
LS
26,9
05,4
70
$ 1
,835
,928
,931
$
394
,478
,764
So
urce
: LO
UIS
IAN
A S
TA
TE
PO
LIC
E (
Gam
ing
Aud
it Se
ctio
n)
LO
UIS
IAN
A G
AM
ING
CO
NT
RO
L B
OA
RD
R
EP
OR
T T
O T
HE
LO
UIS
IAN
A S
TA
TE
LE
GIS
LA
TU
RE
20
06-2
007
8
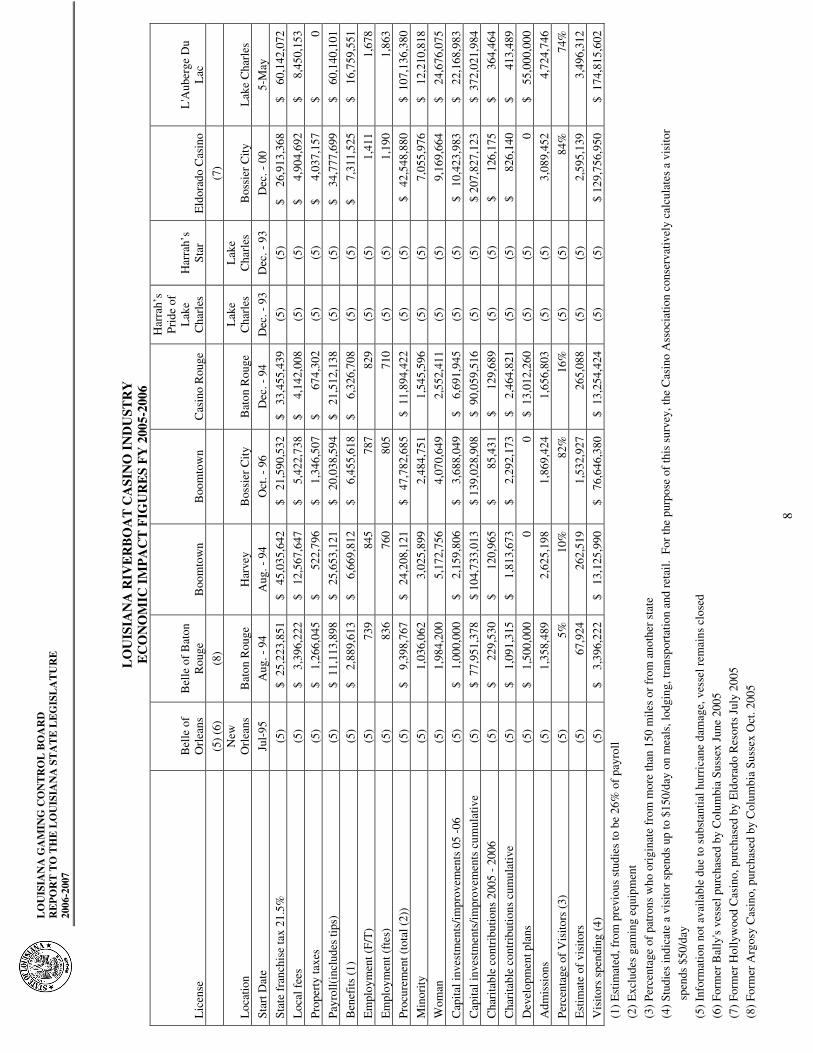
LO
UIS
IAN
A R
IVE
RB
OA
T C
ASI
NO
IN
DU
STR
Y
EC
ON
OM
IC I
MP
AC
T F
IGU
RE
S F
Y 2
005-
2006
Lic
ense
B
elle
of
Orl
eans
B
elle
of
Bat
on
Rou
ge
Boo
mto
wn
Boo
mto
wn
Cas
ino
Rou
ge
Har
rah’
s Pr
ide
of
Lak
e C
harl
es
Har
rah’
s St
ar
Eld
orad
o C
asin
o L
'Aub
erge
Du
Lac
(5
) (6
) (8
)
(7)
Loc
atio
n N
ew
Orl
eans
B
aton
Rou
ge
Har
vey
Bos
sier
City
B
aton
Rou
ge
Lak
e C
harl
es
Lak
e C
harl
es
Bos
sier
City
L
ake
Cha
rles
Star
t Dat
e Ju
l-95
A
ug. -
94
Aug
. - 9
4 O
ct. -
96
Dec
. - 9
4 D
ec. -
93
Dec
. - 9
3 D
ec. -
00
5-M
ay
Stat
e fr
anch
ise
tax
21.5
%
(5)
$ 2
5,22
3,85
1 $
45,
035,
642
$ 2
1,59
0,53
2 $
33,
455,
439
(5)
(5)
$
26,9
13,3
68
$
60,1
42,0
72
Loc
al f
ees
(5)
$
3,39
6,22
2 $
12,
567,
647
$
5,4
22,7
38
$
4,1
42,0
08
(5)
(5)
$
4,9
04,6
92
$
8,4
50,1
53
Prop
erty
taxe
s (5
) $
1,
266,
045
$
5
22,7
96
$
1,3
46,5
07
$
6
74,3
02
(5)
(5)
$
4,0
37,1
57
$
0
Payr
oll(
incl
udes
tips
) (5
) $
11,
113,
898
$ 2
5,65
3,12
1 $
20,
038,
594
$ 2
1,51
2,13
8 (5
) (5
) $
34
,777
,699
$
60
,140
,101
Ben
efits
(1)
(5
) $
2,
889,
613
$
6,6
69,8
12
$
6,4
55,6
18
$
6,3
26,7
08
(5)
(5)
$
7,3
11,5
25
$
16,7
59,5
51
Em
ploy
men
t (F/
T)
(5)
739
845
787
829
(5)
(5)
1,41
1 1,
678
Em
ploy
men
t (ft
es)
(5)
836
760
805
710
(5)
(5)
1,19
0 1,
863
Proc
urem
ent (
tota
l (2)
) (5
) $
9,
398,
767
$ 2
4,20
8,12
1 $
47,
782,
685
$ 1
1,89
4,42
2 (5
) (5
) $
42,
548,
880
$ 1
07,1
36,3
80
Min
ority
(5
) 1,
036,
062
3,02
5,89
9 2,
484,
751
1,54
5,59
6 (5
) (5
) 7,
055,
976
$
12,2
10,8
18
Wom
an
(5)
1,98
4,20
0 5,
172,
756
4,07
0,64
9 2,
552,
411
(5)
(5)
9,16
9,66
4 $
24
,676
,075
Cap
ital i
nves
tmen
ts/im
prov
emen
ts 0
5 -0
6 (5
) $
1,
000,
000
$
2,1
59,8
06
$
3,6
88,0
49
$
6,69
1,94
5 (5
) (5
) $
10,
423,
983
$
22,1
68,9
83
Cap
ital i
nves
tmen
ts/im
prov
emen
ts c
umul
ativ
e (5
) $
77,
951,
378
$ 10
4,73
3,01
3 $
139,
028,
908
$ 9
0,05
9,51
6 (5
) (5
) $
207,
827,
123
$ 3
72,0
21,9
84
Cha
rita
ble
cont
ribu
tions
200
5 -
2006
(5
) $
229,
530
$
1
20,9
65
$
85,4
31
$
12
9,68
9 (5
) (5
) $
126
,175
$
364
,464
Cha
rita
ble
cont
ribu
tions
cum
ulat
ive
(5)
$
1,09
1,31
5 $
1
,813
,673
$
2
,292
,173
$
2,
464,
821
(5)
(5)
$
8
26,1
40
$
4
13,4
89
Dev
elop
men
t pla
ns
(5)
$
1,50
0,00
0 0
0 $
13,
012,
260
(5)
(5)
0 $
55
,000
,000
Adm
issi
ons
(5)
1,35
8,48
9 2,
625,
198
1,86
9,42
4 1,
656,
803
(5)
(5)
3,08
9,45
2 4,
724,
746
Perc
enta
ge o
f V
isito
rs (
3)
(5)
5%
10%
82
%
16%
(5
) (5
) 84
%
74%
Est
imat
e of
vis
itors
(5
) 67
,924
26
2,51
9 1,
532,
927
265,
088
(5)
(5)
2,59
5,13
9 3,
496,
312
Vis
itors
spe
ndin
g (4
) (5
) $
3,
396,
222
$ 1
3,12
5,99
0 $
76,
646,
380
$ 1
3,25
4,42
4 (5
) (5
) $
129,
756,
950
$ 1
74,8
15,6
02
(1)
Est
imat
ed, f
rom
pre
viou
s st
udie
s to
be
26%
of
payr
oll
(2)
Exc
lude
s ga
min
g eq
uipm
ent
(3)
Perc
enta
ge o
f pa
tron
s w
ho o
rigi
nate
fro
m m
ore
than
150
mile
s or
fro
m a
noth
er s
tate
(4)
Stud
ies
indi
cate
a v
isito
r sp
ends
up
to $
150/
day
on m
eals
, lod
ging
, tra
nspo
rtat
ion
and
reta
il. F
or th
e pu
rpos
e of
this
sur
vey,
the
Cas
ino
Ass
ocia
tion
cons
erva
tivel
y ca
lcul
ates
a v
isito
r
spen
ds $
50/d
ay
(5)
Info
rmat
ion
not a
vaila
ble
due
to s
ubst
antia
l hur
rica
ne d
amag
e, v
esse
l rem
ains
clo
sed
(6)
Form
er B
ally
's v
esse
l pur
chas
ed b
y C
olum
bia
Suss
ex J
une
2005
(7)
Form
er H
olly
woo
d C
asin
o, p
urch
ased
by
Eld
orad
o R
esor
ts J
uly
2005
(8)
Form
er A
rgos
y C
asin
o, p
urch
ased
by
Col
umbi
a Su
ssex
Oct
. 200
5
LO
UIS
IAN
A G
AM
ING
CO
NT
RO
L B
OA
RD
R
EP
OR
T T
O T
HE
LO
UIS
IAN
A S
TA
TE
LE
GIS
LA
TU
RE
20
06-2
007
9
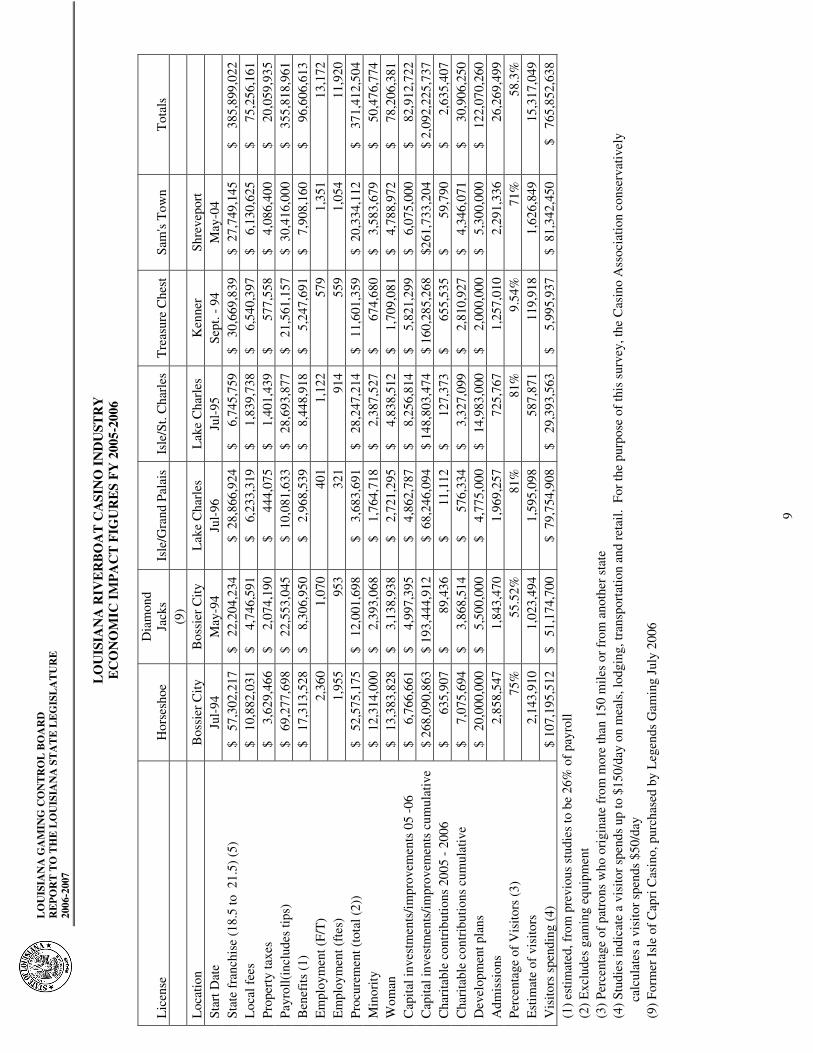
LO
UIS
IAN
A R
IVE
RB
OA
T C
ASI
NO
IN
DU
STR
Y
EC
ON
OM
IC I
MP
AC
T F
IGU
RE
S F
Y 2
005-
2006
Lic
ense
H
orse
shoe
D
iam
ond
Jack
s Is
le/G
rand
Pal
ais
Isle
/St.
Cha
rles
T
reas
ure
Che
st
Sam
's T
own
T
otal
s
(9
)
Loc
atio
n B
ossi
er C
ity
Bos
sier
City
L
ake
Cha
rles
L
ake
Cha
rles
K
enne
r Sh
reve
port
Star
t Dat
e Ju
l-94
M
ay-9
4 Ju
l-96
Ju
l-95
Se
pt. -
94
May
-04
St
ate
fran
chis
e (1
8.5
to 2
1.5)
(5)
$
57,
302,
217
$ 2
2,20
4,23
4 $
28,
866,
924
$
6,7
45,7
59
$ 3
0,66
9,83
9 $
27,
749,
145
$
385,
899,
022
Loc
al f
ees
$ 1
0,88
2,03
1 $
4
,746
,591
$
6,
233,
319
$
1,8
39,7
38
$
6,5
40,3
97
$
6,13
0,62
5 $
7
5,25
6,16
1 Pr
oper
ty ta
xes
$
3,6
29,4
66
$
2,0
74,1
90
$
44
4,07
5 $
1
,401
,439
$
577
,558
$
4,
086,
400
$
20,
059,
935
Payr
oll(
incl
udes
tips
) $
69,
277,
698
$ 2
2,55
3,04
5 $
10,
081,
633
$ 2
8,69
3,87
7 $
21,
561,
157
$ 3
0,41
6,00
0 $
35
5,81
8,96
1 B
enef
its (
1)
$ 1
7,31
3,52
8 $
8
,306
,950
$
2,
968,
539
$
8,4
48,9
18
$
5,2
47,6
91
$
7,90
8,16
0 $
9
6,60
6,61
3 E
mpl
oym
ent (
F/T
) 2,
360
1,07
0 40
1 1,
122
579
1,35
1 13
,172
E
mpl
oym
ent (
ftes
) 1,
955
953
321
914
559
1,05
4 11
,920
Pr
ocur
emen
t (to
tal (
2))
$ 5
2,57
5,17
5 $
12,
001,
698
$
3,68
3,69
1 $
28,
247,
214
$ 1
1,60
1,35
9 $
20,
334,
112
$
371,
412,
504
Min
ority
$
12,
314,
000
$
2,3
93,0
68
$
1,76
4,71
8 $
2
,387
,527
$
674
,680
$
3,
583,
679
$
50,
476,
774
Wom
an
$ 1
3,38
3,82
8 $
3
,138
,938
$
2,
721,
295
$
4,8
38,5
12
$
1,7
09,0
81
$
4,78
8,97
2 $
7
8,20
6,38
1 C
apita
l inv
estm
ents
/impr
ovem
ents
05
-06
$
6,7
66,6
61
$
4,9
97,3
95
$
4,86
2,78
7 $
8
,256
,814
$
5
,821
,299
$
6,
075,
000
$
82,
912,
722
Cap
ital i
nves
tmen
ts/im
prov
emen
ts c
umul
ativ
e $
268,
090,
863
$ 19
3,44
4,91
2 $
68,
246,
094
$ 14
8,80
3,47
4 $
160,
285,
268
$261
,733
,204
$
2,09
2,22
5,73
7 C
hari
tabl
e co
ntri
butio
ns 2
005
- 20
06
$
6
35,9
07
$
89,4
36
$
1
1,11
2 $
127
,373
$
655
,535
$
59,
790
$
2
,635
,407
C
hari
tabl
e co
ntri
butio
ns c
umul
ativ
e $
7
,075
,694
$
3
,868
,514
$
576,
334
$
3,3
27,0
99
$
2,8
10,9
27
$
4,34
6,07
1 $
3
0,90
6,25
0 D
evel
opm
ent p
lans
$
20,
000,
000
$
5,5
00,0
00
$
4,77
5,00
0 $
14,
983,
000
$
2,0
00,0
00
$
5,30
0,00
0 $
12
2,07
0,26
0 A
dmis
sion
s 2,
858,
547
1,84
3,47
0 1,
969,
257
725,
767
1,25
7,01
0 2,
291,
336
26,2
69,4
99
Perc
enta
ge o
f V
isito
rs (
3)
75%
55
.52%
81
%
81%
9.
54%
71
%
58.3
%
Est
imat
e of
vis
itors
2,
143,
910
1,02
3,49
4 1,
595,
098
587,
871
119,
918
1,62
6,84
9 15
,317
,049
V
isito
rs s
pend
ing
(4)
$ 10
7,19
5,51
2 $
51,
174,
700
$ 7
9,75
4,90
8 $
29,
393,
563
$
5,9
95,9
37
$ 8
1,34
2,45
0 $
765
,852
,638
(1
) es
timat
ed, f
rom
pre
viou
s st
udie
s to
be
26%
of
payr
oll
(2)
Exc
lude
s ga
min
g eq
uipm
ent
(3
) Pe
rcen
tage
of
patr
ons
who
ori
gina
te f
rom
mor
e th
an 1
50 m
iles
or f
rom
ano
ther
sta
te
(4)
Stud
ies
indi
cate
a v
isito
r sp
ends
up
to $
150/
day
on m
eals
, lod
ging
, tra
nspo
rtat
ion
and
reta
il. F
or th
e pu
rpos
e of
this
sur
vey,
the
Cas
ino
Ass
ocia
tion
cons
erva
tivel
y
c
alcu
late
s a
visi
tor
spen
ds $
50/d
ay
(9
) Fo
rmer
Isl
e of
Cap
ri C
asin
o, p
urch
ased
by
Leg
ends
Gam
ing
July
200
6

Demographic Information


LO
UIS
IAN
A G
AM
ING
CO
NT
RO
L B
OA
RD
R
EP
OR
T T
O T
HE
LO
UIS
IAN
A S
TA
TE
LE
GIS
LA
TU
RE
20
06-2
007
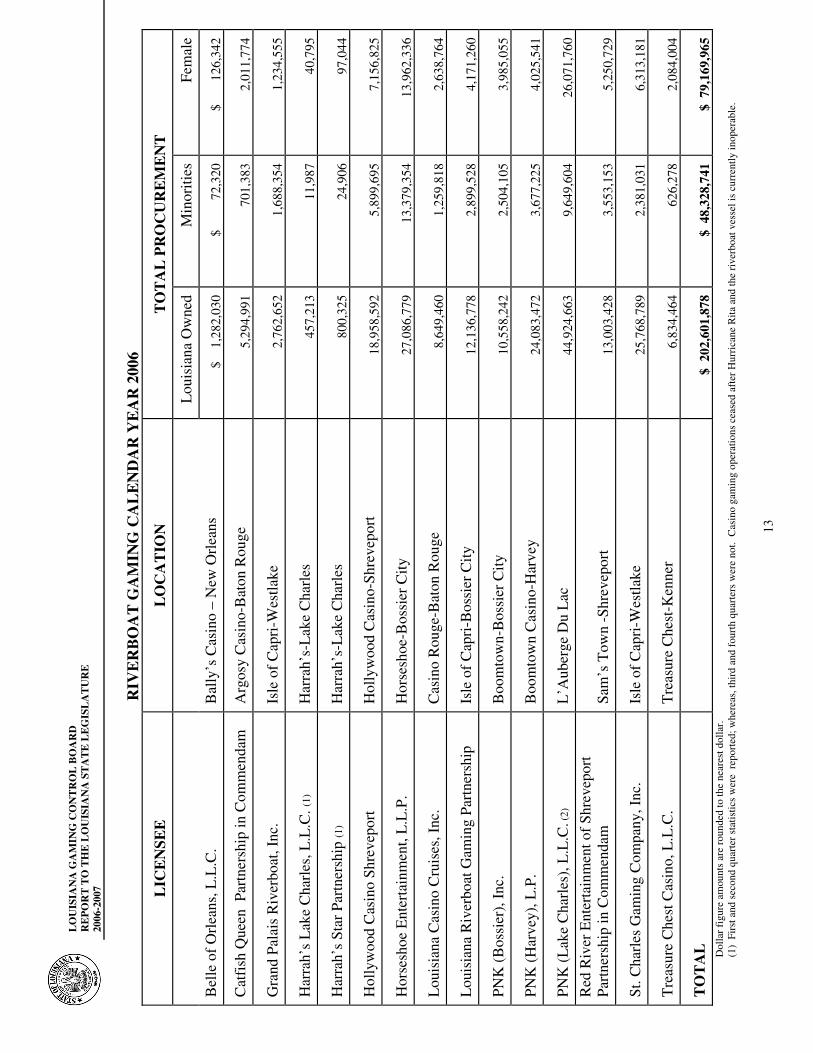
12
RIV
ER
BO
AT
GA
MIN
G C
AL
EN
DA
R Y
EA
R 2
006
L
ICE
NSE
E
L
OC
AT
ION
TO
TA
L P
AY
RO
LL
Tot
al P
ayro
ll T
otal
E
mpl
oyed
* L
ouis
iana
R
esid
ents
*
M
inor
ities
*
Fe
mal
e*
Bel
le o
f O
rlea
ns, L
.L.C
. B
ally
’s C
asin
o –
New
Orl
eans
$
569
,426
12
11
5
6 C
atfi
sh Q
ueen
Par
tner
ship
in
Com
men
dam
A
rgos
y C
asin
o-B
aton
Rou
ge
17,2
98,0
95
926
935
633
511
Gra
nd P
alai
s R
iver
boat
, Inc
. Is
le o
f C
apri
-Wes
tlake
8,
231,
976
395
380
203
224
Har
rah’
s L
ake
Cha
rles
, L.L
.C. (
1)
Har
rah’
s-L
ake
Cha
rles
(1
) 22
21
9
0
Har
rah’
s St
ar P
artn
ersh
ip (1
) H
arra
h’s-
Lak
e C
harl
es
(1)
200
19
2 11
9 11
5
Hol
lyw
ood
Cas
ino
Shre
vepo
rt
Hol
lyw
ood
Cas
ino-
Shre
vepo
rt
27,9
26,0
77
1481
14
60
1011
91
2 H
orse
shoe
Ent
erta
inm
ent,
L.L
.P.
Hor
sesh
oe-B
ossi
er C
ity
42,7
93,3
47
2268
22
41
1,43
4 1,
263
Lou
isia
na C
asin
o C
ruis
es, I
nc.
Cas
ino
Rou
ge-B
aton
Rou
ge
10,6
02,2
62
797
790
500
414
Lou
isia
na R
iver
boat
Gam
ing
Part
ners
hip
Isle
of
Cap
ri-B
ossi
er C
ity
22,5
20,7
51
1143
1,
127
833
678
PNK
(B
ossi
er C
ity),
Inc
. B
oom
tow
n-B
ossi
er C
ity
29,9
05,3
53
854
842
566
517
PNK
(H
arve
y), L
.P.
Boo
mto
wn
Cas
ino-
Har
vey
18,8
04,6
87
860
850
454
495
PNK
(L
ake
Cha
rles
), L
.L.C
. L
’Aub
erge
Du
Lac
66
,220
,819
24
90
2374
11
10
1,39
0 R
ed R
iver
Ent
erta
inm
ent o
f Sh
reve
port
Pa
rtne
rshi
p in
Com
men
dam
Sa
m’s
Tow
n-Sh
reve
port
26
,382
,945
13
11
1283
92
1 72
7
St. C
harl
es G
amin
g C
ompa
ny, I
nc.
Isle
of
Cap
ri-W
estla
ke
22,9
19,0
76
1122
1,
078
581
627
Tre
asur
e C
hest
Cas
ino,
L.L
.C.
Tre
asur
e C
hest
-Ken
ner
16,7
55,5
65
692
692
325
357
TO
TA
L
$
310
,930
,379
14
,573
14
,276
8,
704
8,23
6 D
olla
r fi
gure
am
ount
s ar
e ro
unde
d to
the
near
est d
olla
r.
*
Ave
rage
s ov
er c
alen
dar
year
(1
) S
tatis
tics
wer
e no
t rep
orte
d b
ecau
se o
f pr
oper
ty c
losu
re d
ue to
Hur
rica
ne R
ita.
LO
UIS
IAN
A G
AM
ING
CO
NT
RO
L B
OA
RD
R
EP
OR
T T
O T
HE
LO
UIS
IAN
A S
TA
TE
LE
GIS
LA
TU
RE
20
06-2
007
13
RIV
ER
BO
AT
GA
MIN
G C
AL
EN
DA
R Y
EA
R 2
006
L
ICE
NSE
E
L
OC
AT
ION
TO
TA
L P
RO
CU
RE
ME
NT
Lou
isia
na O
wne
d M
inor
ities
Fe
mal
e
Bel
le o
f O
rlea
ns, L
.L.C
. B
ally
’s C
asin
o –
New
Orl
eans
$
1,
282,
030
$
7
2,32
0 $
126,
342
Cat
fish
Que
en P
artn
ersh
ip in
Com
men
dam
A
rgos
y C
asin
o-B
aton
Rou
ge
5,29
4,99
1 70
1,38
3 2,
011,
774
Gra
nd P
alai
s R
iver
boat
, Inc
. Is
le o
f C
apri
-Wes
tlake
2,
762,
652
1,68
8,35
4 1,
234,
555
Har
rah’
s L
ake
Cha
rles
, L.L
.C. (
1)
Har
rah’
s-L
ake
Cha
rles
45
7,21
3 11
,987
40
,795
Har
rah’
s St
ar P
artn
ersh
ip (1
) H
arra
h’s-
Lak
e C
harl
es
800,
325
24,9
06
97,0
44
Hol
lyw
ood
Cas
ino
Shre
vepo
rt
Hol
lyw
ood
Cas
ino-
Shre
vepo
rt
18,9
58,5
92
5,89
9,69
5 7,
156,
825
Hor
sesh
oe E
nter
tain
men
t, L
.L.P
. H
orse
shoe
-Bos
sier
City
27
,086
,779
13
,379
,354
13
,962
,336
Lou
isia
na C
asin
o C
ruis
es, I
nc.
Cas
ino
Rou
ge-B
aton
Rou
ge
8,64
9,46
0 1,
259,
818
2,63
8,76
4
Lou
isia
na R
iver
boat
Gam
ing
Part
ners
hip
Isle
of
Cap
ri-B
ossi
er C
ity
12,1
36,7
78
2,89
9,52
8 4,
171,
260
PNK
(B
ossi
er),
Inc
. B
oom
tow
n-B
ossi
er C
ity
10,5
58,2
42
2,50
4,10
5 3,
985,
055
PNK
(H
arve
y), L
.P.
Boo
mto
wn
Cas
ino-
Har
vey
24,0
83,4
72
3,67
7,22
5 4,
025,
541
PNK
(L
ake
Cha
rles
), L
.L.C
. (2)
L
’Aub
erge
Du
Lac
44
,924
,663
9,
649,
604
26,0
71,7
60
Red
Riv
er E
nter
tain
men
t of
Shre
vepo
rt
Part
ners
hip
in C
omm
enda
m
Sam
’s T
own
-Shr
evep
ort
13,0
03,4
28
3,55
3,15
3 5,
250,
729
St. C
harl
es G
amin
g C
ompa
ny, I
nc.
Isle
of
Cap
ri-W
estla
ke
25,7
68,7
89
2,38
1,03
1 6,
313,
181
Tre
asur
e C
hest
Cas
ino,
L.L
.C.
Tre
asur
e C
hest
-Ken
ner
6,83
4,46
4 62
6,27
8 2,
084,
004
TO
TA
L
$
202
,601
,878
$
48,
328,
741
$ 7
9,16
9,96
5 D
olla
r fi
gure
am
ount
s ar
e ro
unde
d to
the
near
est d
olla
r.
(1)
Fir
st a
nd s
econ
d qu
arte
r st
atis
tics
wer
e r
epor
ted;
whe
reas
, thi
rd a
nd f
ourt
h qu
arte
rs w
ere
not.
Cas
ino
gam
ing
oper
atio
ns c
ease
d af
ter
Hur
rica
ne R
ita a
nd th
e ri
verb
oat v
esse
l is
curr
ently
inop
erab
le.


Other States Riverboats


LO
UIS
IAN
A G
AM
ING
CO
NT
RO
L B
OA
RD
R
EP
OR
T T
O T
HE
LO
UIS
IAN
A S
TA
TE
LE
GIS
LA
TU
RE
20
06-2
007
17
RIV
ER
BO
AT
SE
LE
CT
DA
TA
CO
MP
AR
ISO
N -
OT
HE
R S
TA
TE
S
Il
linoi
s F
Y 2
006
Indi
ana
F
Y 2
006
Iow
a
FY
200
6 M
isso
uri
FY
200
6 M
issi
ssip
pi
FY
200
6 L
ouis
iana
F
Y 2
006
Num
ber
of V
esse
ls
10 (
only
9 in
ope
rati
on)
10
12
11
27
15 (
only
12
in o
pera
tion)
Cas
ino
Typ
e D
ocks
ide
Doc
ksid
e D
ocks
ide/
Cru
ise
Doc
ksid
e D
ocks
ide
Doc
ksid
e A
GR
$
1,87
0,39
0,79
8 $
2,4
83,5
27,4
57
$ 7
59,2
02,9
89
$ 1
,570
,296
,346
$
2,57
0,02
7,61
0 $
1,83
5,92
8,93
1
Stat
e G
amin
g T
axes
$
59
6,41
9,13
9 $
8
03,2
16,9
92∗
$ 1
46,4
39,6
74
$
336
,541
,024
$
20
0,65
3,90
1 $
39
4,47
8,76
4
Loc
al T
axes
or
Fee
s $
10
9,33
2,84
7
$
7
,592
,028
$
85,2
93,6
09
$
100,
972,
579
$
75,
256,
161
Tot
al E
mpl
oyee
s 8,
486
14,4
25
35.2
2 FT
E
10,8
78
29,5
23
13,1
72
Tot
al S
quar
e F
oota
ge
283,
810
531,
492
297,
215
699,
800
1,20
2,12
8 33
4,58
6
Tot
al A
dmis
sion
s
15,8
13,3
07
27,0
60,1
13
13,4
27,4
49
53,8
87,6
82
35,6
52,9
39
26,9
05,4
70
Tax
Rat
e an
d/or
A
dmis
sion
Cha
rges
:
Gra
duat
ed %
of
AG
R
15.%
0 t
o $
25 M
22
.5%
$
25. t
o $
50 M
27
.5%
$
50. t
o $7
5 M
32
.5%
7
5 to
$ 1
00 M
37
.5%
$10
0. to
$15
0 M
45
% $
150.
to $
200
M
50%
ove
r $
200
M
Adm
issi
on T
ax R
ates
$3
or
$4 p
er a
dmis
sion
ba
sed
on p
revi
ous
cale
ndar
yea
r ad
mis
sion
tot
al;
less
than
1M
= $
3 ov
er 1
M =
$4
Gra
duat
ed %
of
AG
R
15%
$
0 -
$25
M
20%
$2
5 -
$50
M
25%
$5
0 -
$75
M
30%
$7
5-$1
50 M
35
% o
ver
$150
M
$ 3.
00 p
er a
dmis
sion
*T
hese
fig
ures
rep
rese
nt
reve
nues
rec
eive
d by
sta
te
& lo
cal a
genc
ies
calc
ulat
ed
from
info
rmat
ion
prov
ided
.
Stat
e G
amin
g T
ax R
ate:
5
%
$
0 -
$1
M
10%
$ 1
M -
$3
M
22%
over
$3
M
20%
of
AG
R &
$
2.00
per
adm
issi
on
($1.
00 to
sta
te a
nd $
1.00
to
loca
l gov
ernm
ent.)
8% o
f A
GR
& 4
% to
lo
cal g
over
nmen
ts
Mis
siss
ippi
doe
s no
t tr
ack,
tax
or c
harg
e ad
mis
sion
fee
s. P
atro
n da
ta is
gat
here
d th
roug
h a
quar
terl
y su
rvey
.
Bal
l y’s
:G
radu
ated
% o
f A
GR
18.5
%
0
- $6
M/m
onth
20.5
%
$6
- $8
M/m
onth
21.5
%
over
$8
M/m
onth
All
othe
r lic
ense
es:
21.5
%
AG
R =
AD
JUST
ED
GR
OSS
RE
VE
NU
E
LOUISIANA GAMING CONTROL BOARD REPORT TO THE LOUISIANA STATE LEGISLATURE 2006-2007
18
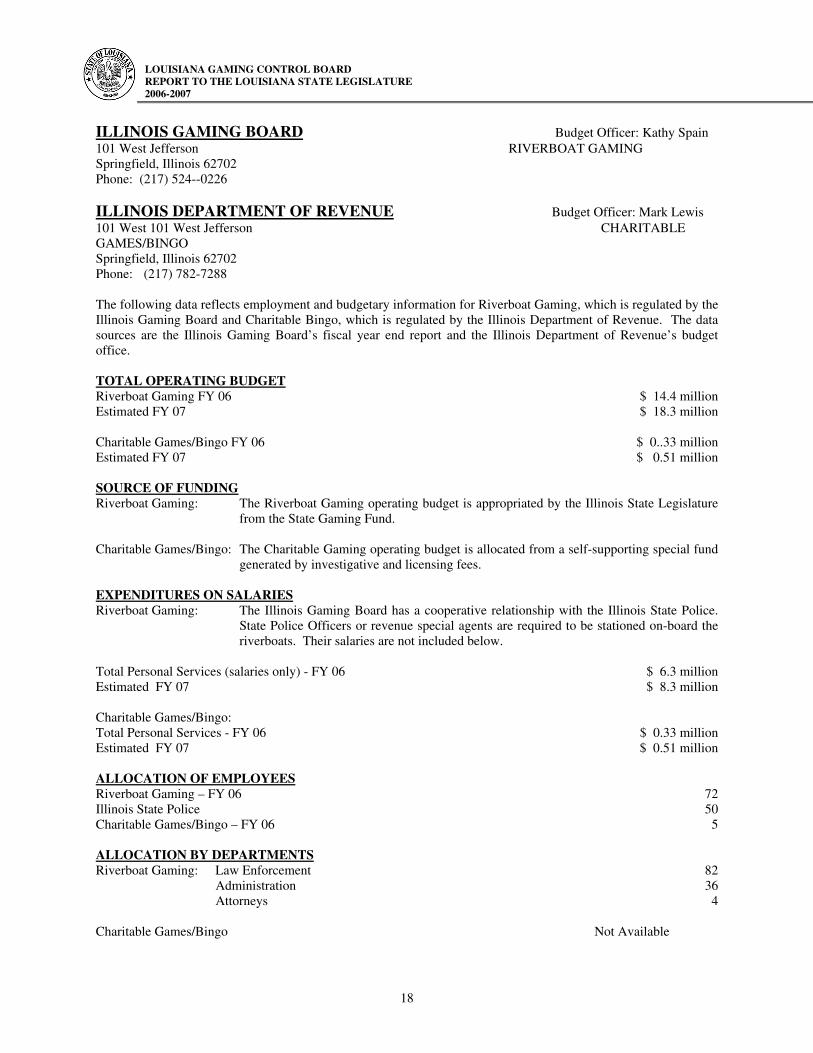
ILLINOIS GAMING BOARD Budget Officer: Kathy Spain 101 West Jefferson RIVERBOAT GAMING Springfield, Illinois 62702 Phone: (217) 524--0226 ILLINOIS DEPARTMENT OF REVENUE Budget Officer: Mark Lewis 101 West 101 West Jefferson CHARITABLE GAMES/BINGO Springfield, Illinois 62702 Phone: (217) 782-7288 The following data reflects employment and budgetary information for Riverboat Gaming, which is regulated by the Illinois Gaming Board and Charitable Bingo, which is regulated by the Illinois Department of Revenue. The data sources are the Illinois Gaming Board’s fiscal year end report and the Illinois Department of Revenue’s budget office. TOTAL OPERATING BUDGET Riverboat Gaming FY 06 $ 14.4 million Estimated FY 07 $ 18.3 million Charitable Games/Bingo FY 06 $ 0..33 million Estimated FY 07 $ 0.51 million SOURCE OF FUNDING Riverboat Gaming: The Riverboat Gaming operating budget is appropriated by the Illinois State Legislature
from the State Gaming Fund. Charitable Games/Bingo: The Charitable Gaming operating budget is allocated from a self-supporting special fund
generated by investigative and licensing fees. EXPENDITURES ON SALARIES Riverboat Gaming: The Illinois Gaming Board has a cooperative relationship with the Illinois State Police.
State Police Officers or revenue special agents are required to be stationed on-board the riverboats. Their salaries are not included below.
Total Personal Services (salaries only) - FY 06 $ 6.3 million Estimated FY 07 $ 8.3 million Charitable Games/Bingo: Total Personal Services - FY 06 $ 0.33 million Estimated FY 07 $ 0.51 million ALLOCATION OF EMPLOYEES Riverboat Gaming – FY 06 72 Illinois State Police 50 Charitable Games/Bingo – FY 06 5 ALLOCATION BY DEPARTMENTS Riverboat Gaming: Law Enforcement 82 Administration 36 Attorneys 4 Charitable Games/Bingo Not Available

LOUISIANA GAMING CONTROL BOARD REPORT TO THE LOUISIANA STATE LEGISLATURE 2006-2007
19
INDIANA GAMING COMMISSION Executive Director: Ernest E. Yelton South Tower, Suite 950 Controller: Kendra Nigg 115 W. Washington Street Indianapolis, Indiana 46204-3408 Phone: (317) 233-0046 The following data reflects employment, budgetary and regulatory information for the Indiana Gaming Commission. The data source is the 2006 Indiana Gaming Commission Summary of Appropriations. COMMISSION OPERATING BUDGET FY 2005 $ 2,827,009 FY 2006 $ 2 ,823,659 IGC Investigations * OPERATING BUDGET FY 2005 $ 1,313,878 FY 2006 $ 1,329,450 SOURCES OF FUNDING The Indiana Gaming Commission’s funding is appropriated from Wagering Taxes. EXPENDITURES ON SALARIES SALARIES EXPENDITURE (BUDGETED) - INDIANA GAMING COMMISSION∗ FY 2005 $ 2,111,179 FY 2006 $ 2,134,159 SALARIES EXPENDITURE (BUDGETED) – IGC Investigations* FY 2005 $ 878,750 FY 2006 $ 875,000 ALLOCATION OF EMPLOYEES Indiana Gaming Commission 31 IGC Investigations * 10 * Effective October 2005 , IGC created a new investigation section of gaming agents. This section replaced the background investigation unit operated by the Indiana State Police.
∗ Effective October 2005, IGC created a new investigation section of gaming agents. This section replaced the background investigation unit operated by the Indiana State Police.
LOUISIANA GAMING CONTROL BOARD REPORT TO THE LOUISIANA STATE LEGISLATURE 2006-2007
20
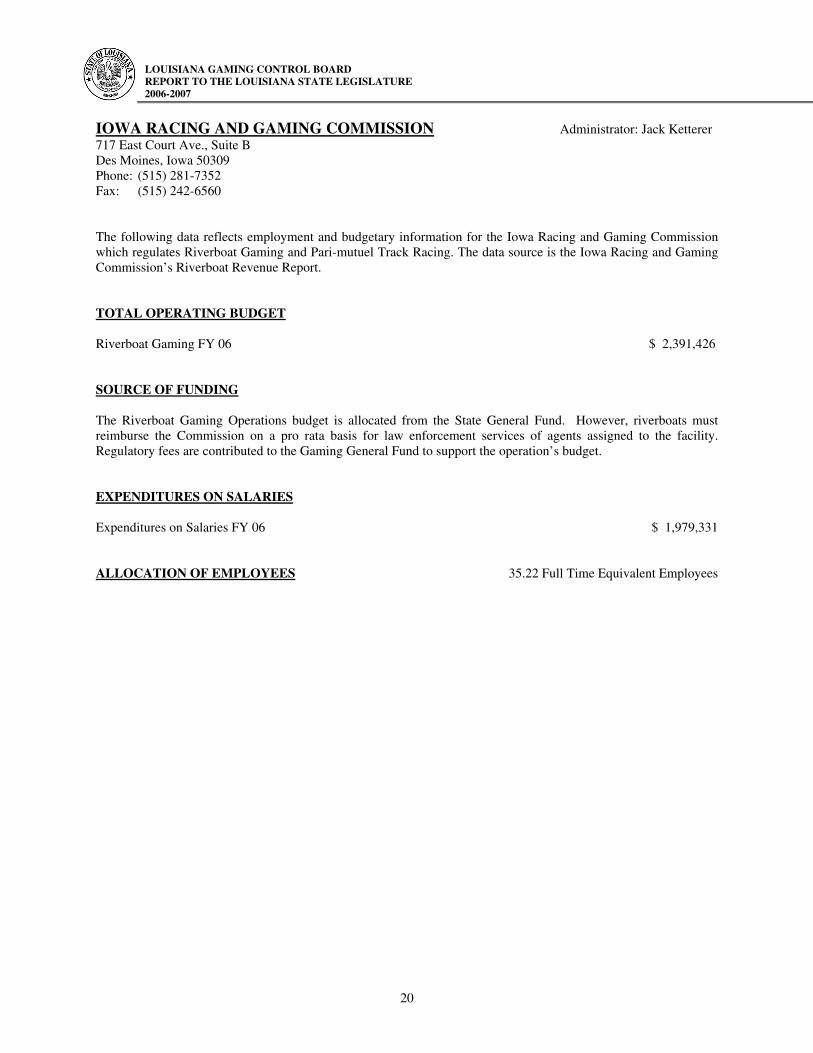
IOWA RACING AND GAMING COMMISSION Administrator: Jack Ketterer 717 East Court Ave., Suite B Des Moines, Iowa 50309 Phone: (515) 281-7352 Fax: (515) 242-6560 The following data reflects employment and budgetary information for the Iowa Racing and Gaming Commission which regulates Riverboat Gaming and Pari-mutuel Track Racing. The data source is the Iowa Racing and Gaming Commission’s Riverboat Revenue Report. TOTAL OPERATING BUDGET Riverboat Gaming FY 06 $ 2,391,426 SOURCE OF FUNDING The Riverboat Gaming Operations budget is allocated from the State General Fund. However, riverboats must reimburse the Commission on a pro rata basis for law enforcement services of agents assigned to the facility. Regulatory fees are contributed to the Gaming General Fund to support the operation’s budget. EXPENDITURES ON SALARIES Expenditures on Salaries FY 06 $ 1,979,331 ALLOCATION OF EMPLOYEES 35.22 Full Time Equivalent Employees

LOUISIANA GAMING CONTROL BOARD REPORT TO THE LOUISIANA STATE LEGISLATURE 2006-2007
21
MISSISSIPPI GAMING COMMISSION Budget Officer: Shelly LeGrand P.O. Box 23577 Jackson, Mississippi 39225 Staff Officer: Patsy Knowles Phone: (601) 576-3800 Executive Division Fax: (601) 576-3810 The following data reflects employment and budgetary information for the Mississippi Gaming Commission. The data source is the Mississippi Gaming Commission’s Budget Request for FY 2006. TOTAL OPERATING BUDGET FY 06 $ 8,472,699 (Appropriated) FY 07 $ 9,967,985 SOURCES OF FUNDING Mississippi gaming operations are supported by general fund appropriations and specially dedicated funds generated through enforcement, investigations and other fees. Amounts contributed to the budget from special and general funds are shown below. FY 06 State Appropriations $ 3,541,449 Charitable Gaming $ 1,212,399 Investigation/Other Fees $ 4,034,550 FY 07 (Estimated) State Appropriations $ 3,787,091 Charitable Gaming $ 1,200,000 Investigation/Other Fees $ 4,060,375 EXPENDITURES ON SALARIES The Mississippi Gaming Commission has a cooperative relationship with the Mississippi Highway Patrol. However, the Mississippi Gaming Commission performs all regulatory and law enforcement functions for casinos and bingo halls. The State Tax Commission also has authority over casinos for tax collection purposes. Total Salary Expenditure FY 06 $ 5,672,010 (Recommended) Expenditure FY 07 $ 6,973,840 ALLOCATION OF EMPLOYEES Total Number FY 06 135 ALLOCATION BY DEPARTMENT Charitable Gaming 14 Enforcement 40 Investigations 10 Others 71
LOUISIANA GAMING CONTROL BOARD REPORT TO THE LOUISIANA STATE LEGISLATURE 2006-2007
22
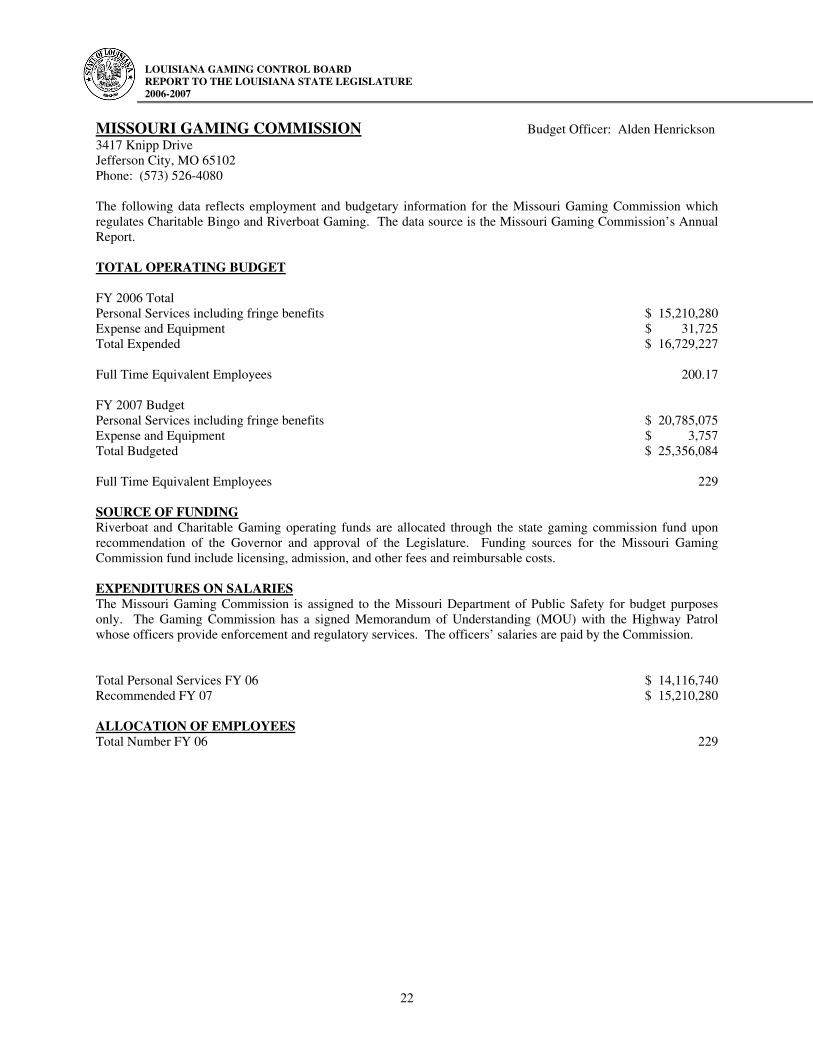
MISSOURI GAMING COMMISSION Budget Officer: Alden Henrickson 3417 Knipp Drive Jefferson City, MO 65102 Phone: (573) 526-4080 The following data reflects employment and budgetary information for the Missouri Gaming Commission which regulates Charitable Bingo and Riverboat Gaming. The data source is the Missouri Gaming Commission’s Annual Report. TOTAL OPERATING BUDGET FY 2006 Total Personal Services including fringe benefits $ 15,210,280 Expense and Equipment $ 31,725 Total Expended $ 16,729,227 Full Time Equivalent Employees 200.17 FY 2007 Budget Personal Services including fringe benefits $ 20,785,075 Expense and Equipment $ 3,757 Total Budgeted $ 25,356,084 Full Time Equivalent Employees 229 SOURCE OF FUNDING Riverboat and Charitable Gaming operating funds are allocated through the state gaming commission fund upon recommendation of the Governor and approval of the Legislature. Funding sources for the Missouri Gaming Commission fund include licensing, admission, and other fees and reimbursable costs. EXPENDITURES ON SALARIES The Missouri Gaming Commission is assigned to the Missouri Department of Public Safety for budget purposes only. The Gaming Commission has a signed Memorandum of Understanding (MOU) with the Highway Patrol whose officers provide enforcement and regulatory services. The officers’ salaries are paid by the Commission. Total Personal Services FY 06 $ 14,116,740 Recommended FY 07 $ 15,210,280 ALLOCATION OF EMPLOYEES Total Number FY 06 229

Video Poker


LO
UIS
IAN
A G
AM
ING
CO
NT
RO
L B
OA
RD
R
EP
OR
T T
O T
HE
LO
UIS
IAN
A S
TA
TE
LE
GIS
LA
TU
RE
20
06-2
007
25
FR
AN
CH
ISE
FE
ES
BY
TY
PE
F
Y 2
005
- 20
06
TY
PE
OF
LO
CA
TIO
N
NO
. OF
VG
D’S
N
O. O
F L
OC
AT
ION
S D
OL
LA
RS
IN
DO
LL
AR
S O
UT
N
ET
DE
VIC
E
RE
VE
NU
E
FRA
NC
HIS
E
FEE
S
BA
RS
& L
OU
NG
ES
3,84
4 1,
232
$ 3
80,8
19,3
98
$ 2
29,8
57,8
69
$ 1
50,9
61,5
29
$
39,2
50,1
69
RE
STA
UR
AN
TS
2,64
7 86
3 22
8,20
9,29
4 13
8,00
8,02
1 9
0,20
1,27
3 2
3,45
2,44
6
HO
TE
LS
102
17
8,96
4,42
5 5,
911,
191
3,0
53,2
34
793,
845
RA
CE
TR
AC
KS
&
OT
Bs
750
9 72
,815
,750
46
,905
,272
2
5,91
0,47
8 5,
829,
865
TR
UC
K S
TO
PS
6,22
8 15
5 1,
167,
533,
566
756,
001,
631
411
,531
,935
1
33,7
36,0
96
TO
TA
LS
13,5
71
2,27
6 $
1,85
8,34
2,43
3 $1
,176
,683
,984
$
681,
658,
449
$ 2
03,0
62,4
21
A
PP
LIC
AT
ION
FE
ES
$
5
3,00
0
RE
NE
WA
L F
EE
S 82
9,60
0
DE
VIC
E O
PE
RA
TIO
N F
EE
S 9,
207,
168
CIV
IL P
EN
AL
TIE
S &
IN
TE
RE
ST
182,
859
PR
OC
ESS
ING
FE
ES
749,
801
TO
TA
L
$ 1
1,02
2,42
8
TO
TA
L F
EE
S C
OL
LE
CT
ED
$
214,
084,
849
Num
bers
are
rou
nded
to th
e ne
ares
t who
le d
olla
r am
ount
.

LO
UIS
IAN
A G
AM
ING
CO
NT
RO
L B
OA
RD
R
EP
OR
T T
O T
HE
LO
UIS
IAN
A S
TA
TE
LE
GIS
LA
TU
RE
20
06-2
007
26
VID
EO
GA
MIN
G D
AT
A B
Y P
AR
ISH
F
Y 2
005
– 20
06
Par
ish
Loc
atio
ns
Dev
ices
D
olla
rs I
n D
olla
rs O
ut
Net
Dev
ice
Rev
enue
F
ranc
hise
F
ees
Loc
al S
hare
St
ate
Shar
e
Aca
dia
57
572
$ 69
,817
,271
$
46,7
66,6
25
$ 23
,050
,646
$
7,26
8,61
1 $
1,63
0,09
8 $
5,63
8,51
3
Ass
umpt
ion
32
166
15,4
27,8
72
9,72
0,85
0 5,
707,
022
1,71
8,04
1 38
8,37
4 1,
329,
667
Avo
yell
es
30
154
16,7
70,8
54
10,2
35,7
55
6,53
5,09
9 1,
999,
173
443,
975
1,55
5,19
8
Bos
sier
65
30
8 30
,254
,167
18
,181
,205
12
,072
,962
3,
501,
300
764,
434
2,73
6,86
6
Cad
do
158
815
90,1
02,1
65
54,4
78,0
77
35,6
24,0
89
10,5
47,3
02
2,30
9,65
7 8,
237,
645
Cal
casi
eu
130
950
139,
716,
872
89
,926
,064
49
,790
,808
15
,560
,488
3,
469,
755
12,0
90,7
33
Cam
eron
4
12
1,01
4,47
8 60
7,51
2 40
6,96
7 10
5,81
2 18
,181
87
,631
Des
oto
9 22
1 20
,903
,542
13
,790
,288
7,
113,
254
2,28
3,23
7 50
2,09
5 1,
781,
142
Eas
t Car
roll
7
21
2,46
0,01
3 1,
519,
017
940,
996
244,
660
55,4
09
189,
251
Iber
vill
e 42
28
9 44
,020
,865
27
,741
,273
16
,279
,592
5,
095,
607
1,14
5,88
6 3,
949,
721
Jeff
erso
n 52
3 2,
143
291,
128,
393
175,
170,
881
115,
957,
512
30,3
51,2
26
6,78
6,31
3 23
,564
,913
Jeff
erso
n D
avis
24
16
2 20
,261
,408
13
,387
,271
6,
874,
138
2,11
4,74
6 47
9,43
6 1,
635,
310
Laf
ourc
he
121
722
109,
644,
284
71,8
38,9
16
37,8
05,3
67
11,5
40,9
41
2,60
7,65
6 8,
933,
285
Mad
ison
25
27
3 37
,784
,552
23
,156
,872
14
,627
,680
4,
669,
733
1,03
2,35
1 3,
637,
382
Orl
eans
28
0 1,
014
95,7
20,8
07
57,1
91,7
38
38,5
29,0
69
10,4
83,3
72
1,97
9,06
0 8,
504,
312
Plaq
uem
ines
17
95
18
,864
,148
11
,492
,411
7,
371,
737
2,20
7,60
9 47
0,92
8 1,
736,
681
LO
UIS
IAN
A G
AM
ING
CO
NT
RO
L B
OA
RD
R
EP
OR
T T
O T
HE
LO
UIS
IAN
A S
TA
TE
LE
GIS
LA
TU
RE
20
06-2
007
27
Par
ish
Loc
atio
ns
Dev
ices
D
olla
rs I
n D
olla
rs O
ut
Net
Dev
ice
Rev
enue
F
ranc
hise
F
ees
Loc
al S
hare
St
ate
Shar
e
Poin
te C
oupe
e 38
19
4 18
,497
,155
11
,601
,721
6,
895,
434
2,10
7,04
4 47
0,93
7 1,
636,
107
Red
Riv
er
12
105
14,5
47,5
49
9,63
5,96
6 4,
911,
583
1,51
3,08
5 33
1,62
4 1,
181,
461
St. B
erna
rd
19
111
15,4
67,9
40
9,62
6,29
4 5,
841,
646
1,61
8,05
1 19
5,77
1 1,
422,
280
St.
Cha
rles
45
22
6 42
,851
,181
27
,037
,367
15
,813
,814
4,
775,
180
1,11
1,01
0 3,
664,
170
St. H
elen
a 21
38
5 87
,196
,485
55
,368
,984
31
,827
,501
10
,280
,196
2,
361,
381
7,91
8,81
6
St. J
ames
25
32
4 55
,085
,435
36
,209
,538
18
,875
,898
6,
048,
992
1,38
6,72
4 4,
662,
268
St. J
ohn
47
344
59,6
49,3
16
38,0
81,2
29
21,5
68,0
87
6,42
7,79
2 1,
480,
362
4,94
7,43
0
St. L
andr
y 98
65
0 60
,306
,191
38
,986
,412
21
,319
,779
6,
466,
539
1,44
5,35
0 5,
021,
189
St. M
artin
97
84
0 13
0,98
2,32
5 87
,953
,720
43
,028
,604
13
,424
,315
3,
005,
838
10,4
18,4
77
St. M
ary
75
441
57,8
35,8
06
37,2
32,9
19
20,6
02,8
87
6,26
3,94
7 1,
406,
176
4,85
7,77
2
Ten
sas
14
42
4,55
5,01
3 2,
769,
638
1,78
5,37
5 46
4,20
0 10
0,27
0 36
3,92
9
Ter
rebo
nne
168
943
158,
994,
609
102,
749,
186
56,2
45,4
23
16,9
87,7
93
3,82
5,85
0 13
,161
,943
Web
ster
25
30
2 39
,382
,929
24
,891
,046
14
,491
,884
4,
607,
301
1,01
5,02
6 3,
592,
276
Wes
t Bat
on R
ouge
49
62
4 98
,019
,677
62
,586
,708
35
,432
,969
11
,062
,245
2,
480,
280
8,58
1,96
5
Wes
t Fel
icia
na
19
123
11,0
79,1
32
6,74
8,50
4 4,
330,
629
1,32
3,88
1 29
8,17
1 1,
025,
710
TO
TA
LS
2,27
6 13
,571
$1
,858
,342
,432
$1
,176
,683
,984
$6
81,6
58,4
48
$203
,062
,421
$4
4,99
8,37
6 $1
58,0
64,0
45
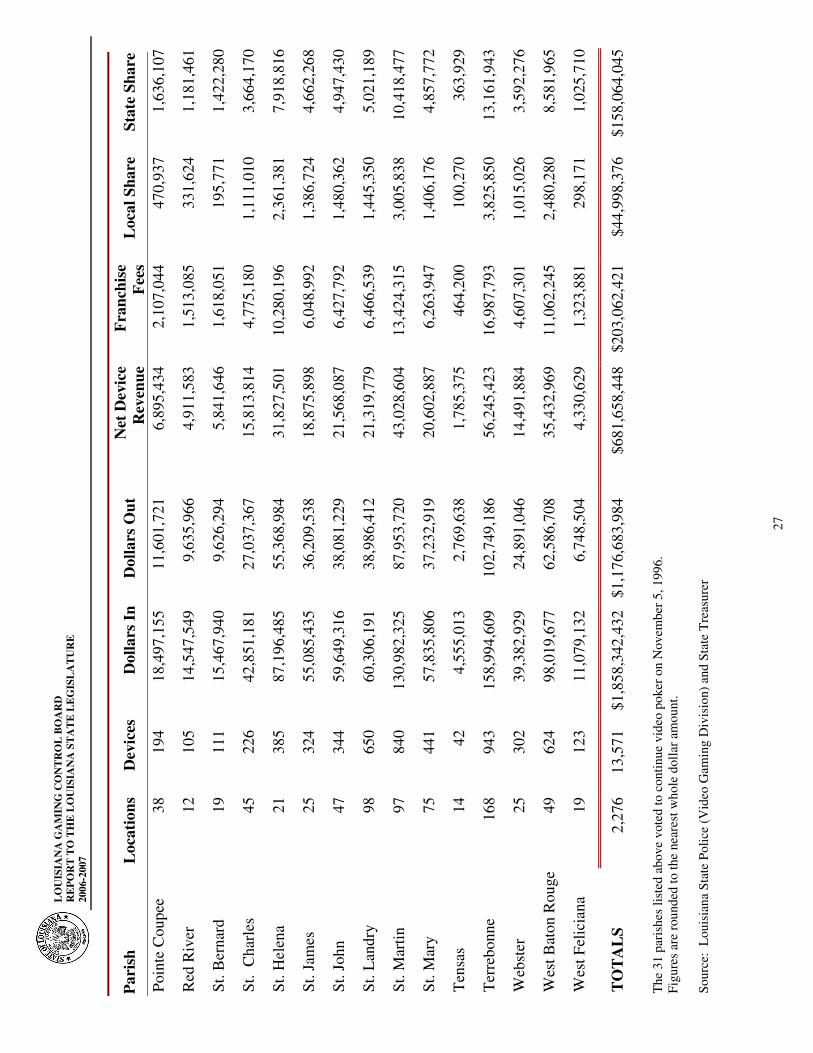
T
he 3
1 pa
rish
es li
sted
abo
ve v
oted
to c
ontin
ue v
ideo
pok
er o
n N
ovem
ber
5, 1
996.
Fi
gure
s ar
e ro
unde
d to
the
near
est w
hole
dol
lar
amou
nt.
Sour
ce:
Lou
isia
na S
tate
Pol
ice
(Vid
eo G
amin
g D
ivis
ion)
and
Sta
te T
reas
urer

LOUISIANA GAMING CONTROL BOARD REPORT TO THE LOUISIANA STATE LEGISLATURE 2006-2007
28
VIDEO GAMING DATA BY CLASSIFICATION FY 2005 - 2006
Video gaming devices are classified into five (5) different types according to the establishment in which the devices are located. The amount of the franchise fee is based on a percentage of net gaming proceeds according to the following table:
Franchise
Type Description Fee % 1 Bars and Lounges 26.0% 2 Restaurants 26.0% 3 Hotels/Motels 26.0% 4 Racetracks & OTB’s 22.5% 5 Truck Stops 32.5%
Dollar amounts below represent the entire fiscal year and the number of devices and establishments as of June 30, 2006.
TYPE
NET GAMING PROCEEDS
FRANCHISE FEES
DEVICES
ESTABLISHMENTS
1 $ 150,961,529 $ 39,250,169 3,844 1,232
2 90,201,273 23,452,446 2,647 863
3 3,053,234 793,845 102 17
4 25,910,478 5,829,865 750 9
5 411,531,934 133,736,096 6,228 155
TOTAL $ 681,658,448 $ 203,062,421 13,571 2,276 Figures are rounded to the nearest whole dollar amount. Source: LOUISIANA STATE POLICE (Video Gaming Division)

LOUISIANA GAMING CONTROL BOARD REPORT TO THE LOUISIANA STATE LEGISLATURE 2006-2007
29
DISTRIBUTION OF VIDEO POKER REVENUE
FY 2005 - 2006
RECEIPTS
Franchise Fees
$ 203,062,421
Other Fees and Penalties TOTAL COLLECTED
11 ,022,428
$ 214,084,849
EXPENDITURES District Attorneys & Asst. District Attorneys $ 5,400,000
Local Governments 44,994,326
Horsemen’s Purse Supplemental Fund
3,407,143
Louisiana State Police Budget 5,794,893
Attorney General Budget 1,443,423
Management and Finance Budget 1,779,471
Compulsive and Problem Gaming Fund 500,000
TOTAL EXPENDITURES $ 63,319,256
Amount Transferred to General Fund Per Act 67/XO KBB 2005-82
2,150,000
Fees Less Expenditures 148,615,593 Amount Transferred to Current Year Per Act 16 of 2005 Regular Session 2,862,500 TRANSFERRED TO GENERAL FUND Figures are rounded to the nearest whole dollar amount.
$ 151,478,093

LO
UIS
IAN
A G
AM
ING
CO
NT
RO
L B
OA
RD
R
EP
OR
T T
O T
HE
LO
UIS
IAN
A S
TA
TE
LE
GIS
LA
TU
RE
20
06-2
007
30
Figu
res
are
roun
ded
to th
e ne
ares
t who
le d
olla
r am
ount
. So
urce
: L
ouis
iana
Sta
te P
olic
e, V
ideo
Gam
ing
Div
isio
n an
d D
epar
tmen
t of
the
Tre
asur
y
1991
-93
1993
/94
1994
/95
1995
/96
1996
/97
1997
/98
1998
/99
1999
/00
No.
of
Dev
ices
10
,074
13,4
90
15,4
14
15,7
19
14,8
51
14,9
96
15,6
38
12,9
37
RE
CE
IPT
S:
Fr
anch
ise
Fees
$
42,6
69,0
00
$ 9
2,91
0,00
0 $
141,
489,
000
$ 16
3,85
6,00
0 $
173,
327,
000
$ 1
83,5
79,0
00
$ 18
8,71
4,00
0 $
135,
242,
000
Stat
utor
y Fa
irgr
ound
s
E
xem
ptio
n
$
(-2,
500,
000)
$
(-2,
500,
000)
$
(
-566
,000
)
O
ther
Fee
s, I
nter
est a
nd
Pena
lties
$
13,1
00,0
00$
14,
875,
000
$ 1
0,77
0,00
0 $
11,
165,
000
$ 1
0,26
2,00
0 $
10
,585
,000
$
10,
370,
000
$
9,7
17,0
00
Tot
al F
ees
Col
lect
ed
$ 55
,769
,000
$ 10
7,78
5,00
0 $
152,
259,
000
$ 17
2,52
1,00
0 $
181,
089,
000
$ 1
93,5
98,0
00
$ 19
9,08
4,00
0 $
144,
959,
000
EX
PE
ND
ITU
RE
S:
Dis
tric
t Atto
rney
s &
Ass
t. D
ist.
Atty
s.
$ 4
,744
,000
$
4,8
45,0
00
$
5,40
0,00
0 $
5
,348
,000
$
5
,400
,000
$
5
,205
,000
$
5
,400
,000
$
5
,400
,000
Loc
al G
over
nmen
t $
9,0
84,0
00$
20,
142,
000
$ 3
2,02
9,00
0 $
37,
636,
000
$ 3
7,52
5,00
0 $
40,
848,
000
$ 4
3,42
4,00
0 $
30,
107,
000
Hor
sem
en’s
Pur
se S
uppl
emen
t Fu
nd
00
$
2,54
1,00
0 $
2
,880
,000
$
3
,037
,000
$
3
,250
,000
$
3
,360
,000
$
2
,417
,000
Bud
get –
LSP
/AG
/OM
V
$ 5
,468
,000
$
2,8
16,0
00
$
4,51
6,00
0 $
4
,515
,000
$
4
,347
,000
$
4
,400
,000
$
4
,400
,000
$
4
,400
,000
Com
puls
ive
and
Prob
lem
G
amin
g Fu
nd
00
0 $
150
,000
$
150
,000
$
150
,000
$
500
,000
$
500
,000
Tot
al E
xpen
ditu
res
$ 19
,296
,000
$ 2
7,80
3,00
0 $
44,
486,
000
$ 5
0,52
9,00
0 $
50,
459,
000
$ 5
3,85
3,00
0 $
57,
084,
000
$ 4
2,82
4,00
0 Se
ed A
dv/C
arry
0
0 -1
37,0
00
137,
000
0 0
0 0
Am
ount
Tra
nsfe
rred
to
Gen
Fun
d (A
ct 6
7/X
O K
BB
200
5-82
)
Am
ount
Tra
nsfe
rred
to C
urre
nt
Yea
r (A
ct 1
6)
00
0 0
0 0
0 0
Tra
nsfe
rred
to
Gen
eral
Fun
d $
36,4
73,0
00$
79,
982,
000
$ 10
7,63
6,00
0 $
122,
129,
000
$ 13
0,63
0,00
0 $
139,
745,
000
$ 14
2,00
0,00
0 $
102,
135,
000
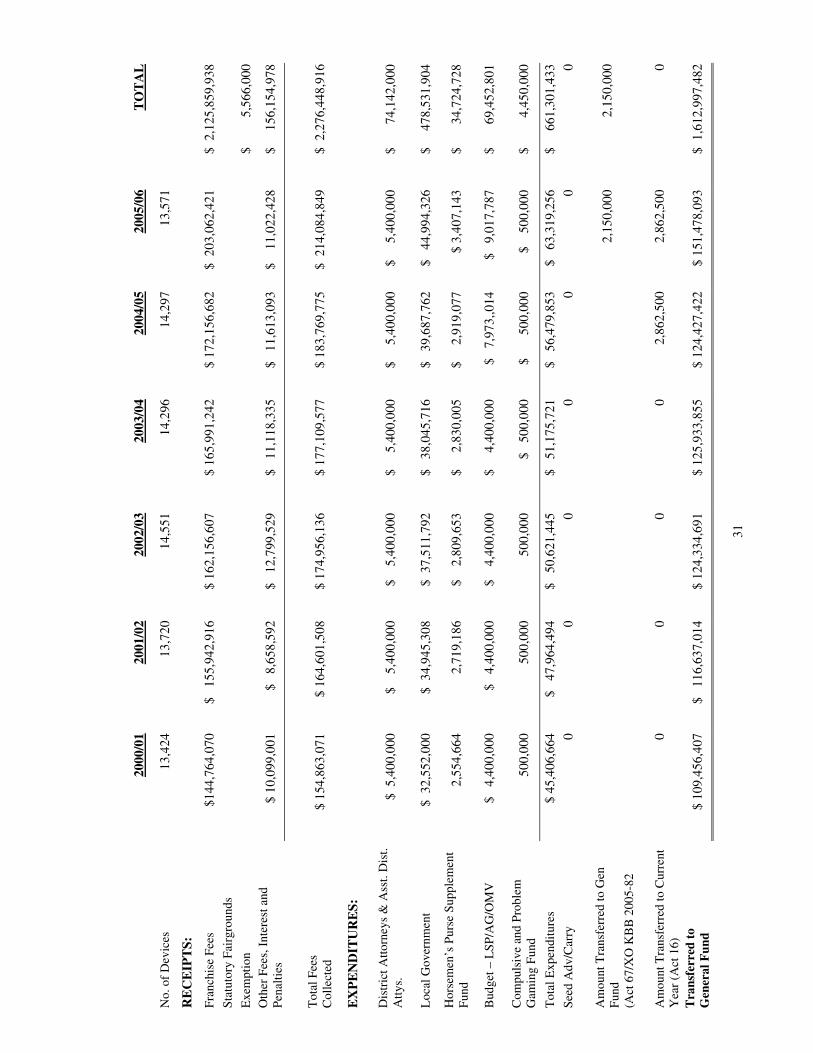
31
20
00/0
1 20
01/0
2 20
02/0
3 20
03/0
4 20
04/0
5 20
05/0
6 T
OT
AL
No.
of
Dev
ices
13
,424
13
,720
14
,551
14
,296
14
,297
13
,571
RE
CE
IPT
S:
Fran
chis
e Fe
es
$144
,764
,070
$
155
,942
,916
$
162,
156,
607
$ 16
5,99
1,24
2 $
172,
156,
682
$ 2
03,0
62,4
21
$ 2
,125
,859
,938
St
atut
ory
Fair
grou
nds
E
xem
ptio
n
$
5,5
66,0
00
Oth
er F
ees,
Int
eres
t and
Pe
nalti
es
$ 10
,099
,001
$
8,6
58,5
92
$ 1
2,79
9,52
9 $
11,
118,
335
$ 1
1,61
3,09
3 $
11
,022
,428
$
1
56,1
54,9
78
Tot
al F
ees
Col
lect
ed
$ 15
4,86
3,07
1 $
164,
601,
508
$ 17
4,95
6,13
6 $
177,
109,
577
$ 18
3,76
9,77
5 $
214
,084
,849
$
2,2
76,4
48,9
16
EX
PE
ND
ITU
RE
S:
Dis
tric
t Atto
rney
s &
Ass
t. D
ist.
Atty
s.
$ 5
,400
,000
$
5,
400,
000
$
5,40
0,00
0 $
5
,400
,000
$
5
,400
,000
$
5
,400
,000
$
74,1
42,0
00
Loc
al G
over
nmen
t $
32,
552,
000
$ 3
4,94
5,30
8 $
37,
511,
792
$ 3
8,04
5,71
6 $
39,
687,
762
$ 4
4,99
4,32
6 $
4
78,5
31,9
04
Hor
sem
en’s
Pur
se S
uppl
emen
t Fu
nd
2,55
4,66
4 2,
719,
186
$
2,80
9,65
3 $
2
,830
,005
$
2
,919
,077
$
3,40
7,14
3 $
34,7
24,7
28
Bud
get –
LSP
/AG
/OM
V
$ 4
,400
,000
$
4,4
00,0
00
$
4,40
0,00
0 $
4
,400
,000
$
7,9
73,,0
14
$ 9
,017
,787
$
69,4
52,8
01
Com
puls
ive
and
Prob
lem
G
amin
g Fu
nd
500,
000
500,
000
500,
000
$ 5
00,0
00
$
50
0,00
0 $
50
0,00
0 $
4,4
50,0
00
Tot
al E
xpen
ditu
res
$ 45
,406
,664
$
47,
964,
494
$ 5
0,62
1,44
5 $
51,
175,
721
$ 5
6,47
9,85
3 $
63,
319,
256
$
661
,301
,433
Se
ed A
dv/C
arry
0
0 0
0 0
0 0
Am
ount
Tra
nsfe
rred
to G
en
Fund
(A
ct 6
7/X
O K
BB
200
5-82
2,
150,
000
2,15
0,00
0
Am
ount
Tra
nsfe
rred
to C
urre
nt
Yea
r (A
ct 1
6)
0 0
0 0
2,86
2,50
0 2,
862,
500
0
Tra
nsfe
rred
to
Gen
eral
Fun
d $
109,
456,
407
$ 1
16,6
37,0
14
$ 12
4,33
4,69
1 $
125,
933,
855
$ 12
4,42
7,42
2 $
151,
478,
093
$ 1
,612
,997
,482

LOUISIANA GAMING CONTROL BOARD REPORT TO THE LOUISIANA STATE LEGISLATURE 2006-2007
32
OTHER STATES MONTANA Montana Department of Justice Gambling Control Division 2550 Prospect Avenue P. O. Box 201424 Helena, Montana 59620 Phone: (406) 444-1971 Fax: (406) 444-9157 Montana has had video poker since 1985. In 1987 the legislature imposed a 15% tax on video gambling machines.
FY 2006 Montana Video Lottery Revenue Total Annual Gross Income $ 378,827,999 Video Gambling Tax Collected $ 56,912,391 Average Annual Gross Income Per Machine $ 20,566 Total Establishments at end of FY 2006 908 Average Number of Machines Reporting 18,420
OREGON Oregon State Lottery Commission 500 Airport Road SE Salem, Oregon 97301 Phone: (503) 540-1000 Fax: (503) 541-1068 Oregon began operating video lottery terminals in 1992, now capable of line games (including slot machines) as well as video poker. Oregon law permits bars and taverns to have up to six video lottery terminals. Racetracks are allowed to have no more than ten machines. According to figures from the Oregon Lottery, during fiscal year 2006, the VLTs had an approximate return of 93.30%. At the end of calendar year 2006, 2173 retailers (alcohol permitted entities) operated a total of 11,376 VLTs.
FY 2006 Oregon Video Lottery Revenue Sales $ 10,928,760,793 Other Distributable Income 7,324,994 Total Distributable Revenue $ 10,936,085,787
Distribution of Revenue
Revenue Returned to the Public Prizes
$ 10,195,900,424
Transfers Paid/Due to Economic Development Department 462,084,611 Total Revenue Returned to the Public $ 10,657,985,035 Administrative Expenses 235,786,192 Retained for Contingency Reserve 42,314,560 Total Revenue Distribution $ 10,936,085,787