Mission - R: The R Project for Statistical Computing · high performance computing clusters and...
23
Automating Biostatistics Workflows for Bench Scientists Using R‐based Web tools Web‐tools Jeff Skinner, Vivek Gopalan, Jason Barnett and Yentram Huyen useR! 2010 Conference July 21‐23, 2010 Gaithersburg, MD
-
Upload
truongtuyen -
Category
Documents
-
view
214 -
download
0
Transcript of Mission - R: The R Project for Statistical Computing · high performance computing clusters and...

Automating Biostatistics Workflows gfor Bench Scientists Using R‐based Web toolsWeb‐tools
Jeff Skinner, Vivek Gopalan, Jason Barnett and Yentram Huyen
useR! 2010 ConferenceJuly 21‐23, 2010Gaithersburg, MD

NIAID MissionNIAID Mission
• “The National Institute of Allergy and Infectious Diseases (NIAID) is one of the 27 Institutes of the NIH and conducts and supports basic and applied research to better understand, treat, and ultimately prevent infectious, immunologic, and allergic diseases.”

OCICB Organizationg
Office of the Chief Information Officer Global
Biomedical Research Support Program (GBRSP)Christopher Whalen,
Cyber Security Program (CSP)
Ken Grossman, Information System
S i Offi
Information Officer (OCIO)
Mike Tartakovsky, NIAID CIO &
OCICB DirectorInternational Team
Lead
Kristi Schmidt,RML Team Lead
Security Officer (ISSO)
OCICB Director
Alex Rosenthal, M.S., M.B.A.NIAID Deputy CIO &
OCICB Deputy Director
Operations and Engineering
Software Engineering
Customer Services Branch
Bioinformatics and
Program Management
Branch (OEB)
Kim Kassing,Chief
Branch (SEB)
Joe Croghan,Chief
(CSB)
Joel Minto, D.B.S. Acting Chief
Computational Biosciences
Branch (BCBB)Tram Huyen, Ph.D.
Chief
Branch (PMB)
Brian Conelley,Chief

Commonly Encountered ProblemsCommonly Encountered Problems
• Large complicated data files from biological instruments– Microarrays, Next‐Generation Sequencing, 96‐well plate readers, NMR
and Mass Spectrometry
– Arcane file extensions, ugly headers and footers, multiple tables per file
• Tedious data manipulation in MS Excel or Notepad– Simple formulas or cut‐and‐paste can add up to hours at the computer– Simple formulas or cut‐and‐paste can add up to hours at the computer
• Critical analyses performed by legacy software– Many relevant software tools are no longer maintained, because they
were created with outdated technology or the original developers have moved on to new careers

Why Create a Webtool Using R?Why Create a Webtool Using R?
• Advantages of using RAdvantages of using R– R scripting language is easy to use and will be long lived
– Includes all necessary tools for data import, data manipulation, statistical analyses, graphing, generation of custom reports, etc.
• Advantages of building a webtool• Advantages of building a webtool– Provides users an accessible graphical user interface (GUI)
– Simplifies the distribution and maintenance of softwarep
– Agencies can link software to infrastructure resources like high performance computing clusters and databases, which may not otherwise be available to many end usersmay not otherwise be available to many end users

HDX NAME
• Compute estimates of flexibility (i.e. protection factors) for multiple protein regions from hydrogen‐deuterium exchangemultiple protein regions from hydrogen‐deuterium exchange (HDX) data using the Maximum Entropy Method (MEM)
• Compare protection factors among two different groups • Map protection factors on the protein surface

Hydrogen‐Deuterium Exchangey g g
• Use changes in pH to force a protein toUse changes in pH to force a protein to exchange hydrogen for deuterium
• Use nuclear magnetic resonance (NMR) spectrometry or mass spectrometry to detect the H/D exchange rates
• H/D exchange rates among different protein fragments reveal information about tertiary structure folding etcabout tertiary structure, folding, etc.
Source: www.dac.neu.edu/barnett/Mem/engen.htm
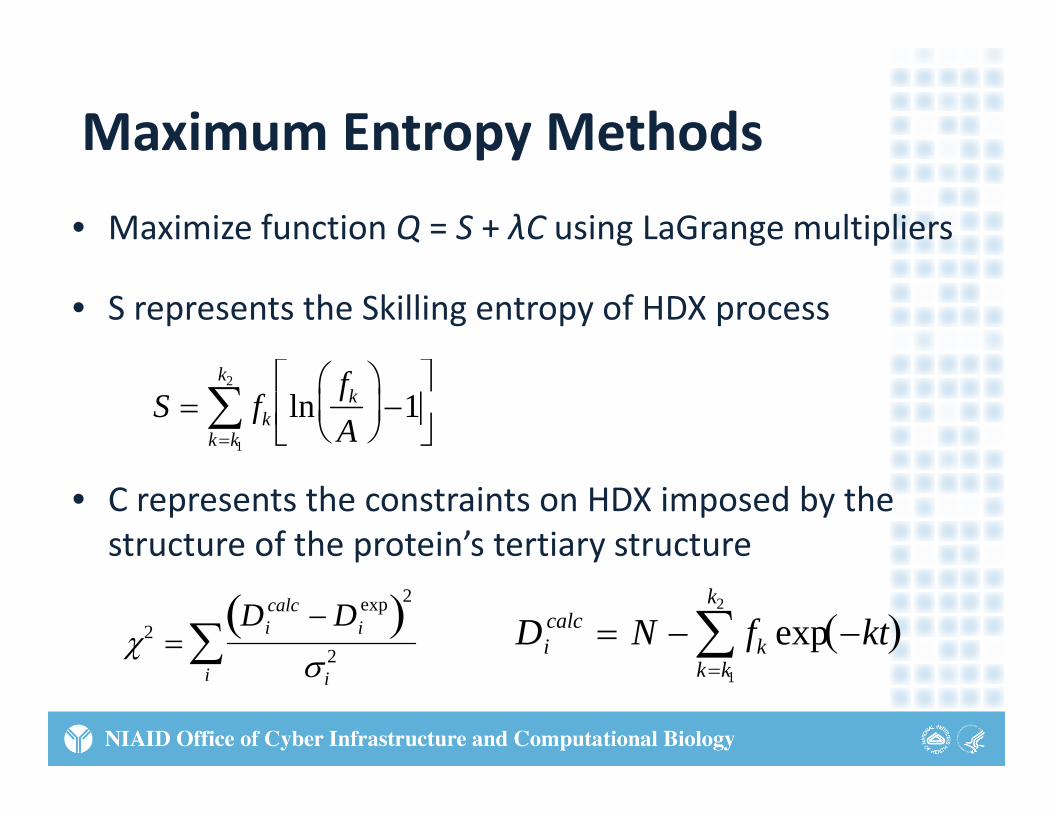
Maximum Entropy Methodsa u t opy et ods
• Maximize function Q = S + λC using LaGrange multipliers
• S represents the Skilling entropy of HDX process
S fk lnfk
A
1
kk1
k2
• C represents the constraints on HDX imposed by the structure of the protein’s tertiary structurep y
2 Di
calc Diexp 2
2 Dicalc N fk exp kt
k k
k2
ii
kk1

HDX NAME Workflow
• Workflow inputs:Protein structures ( pdb file): GP120 or CD4– Protein structures (.pdb file): GP120 or CD4
– Hydrogen exchange data (.txt file): fragment IDs and exchange rates
– Additional data (.txt file): Temperature, pH, time series, replicates numbers,protein state (liganded or unliganded)protein state (liganded or unliganded)
• Processing steps:– Compute number of deuterium exchanged per amide from the exchange rates,
using differential equations for any liganded protein complexes
– Normalize deuterium exchanged data for constant temperate and pH
– Estimate average exchange rates using MEM (Laplace software)
– Compute protection factors by normalization of average rates with intrinsic rates
– Compute free energy from protection factors
– Compare fragments from liganded and unliganded states with Student’s T‐tests
– Map results to protein surface to explore conformational changes
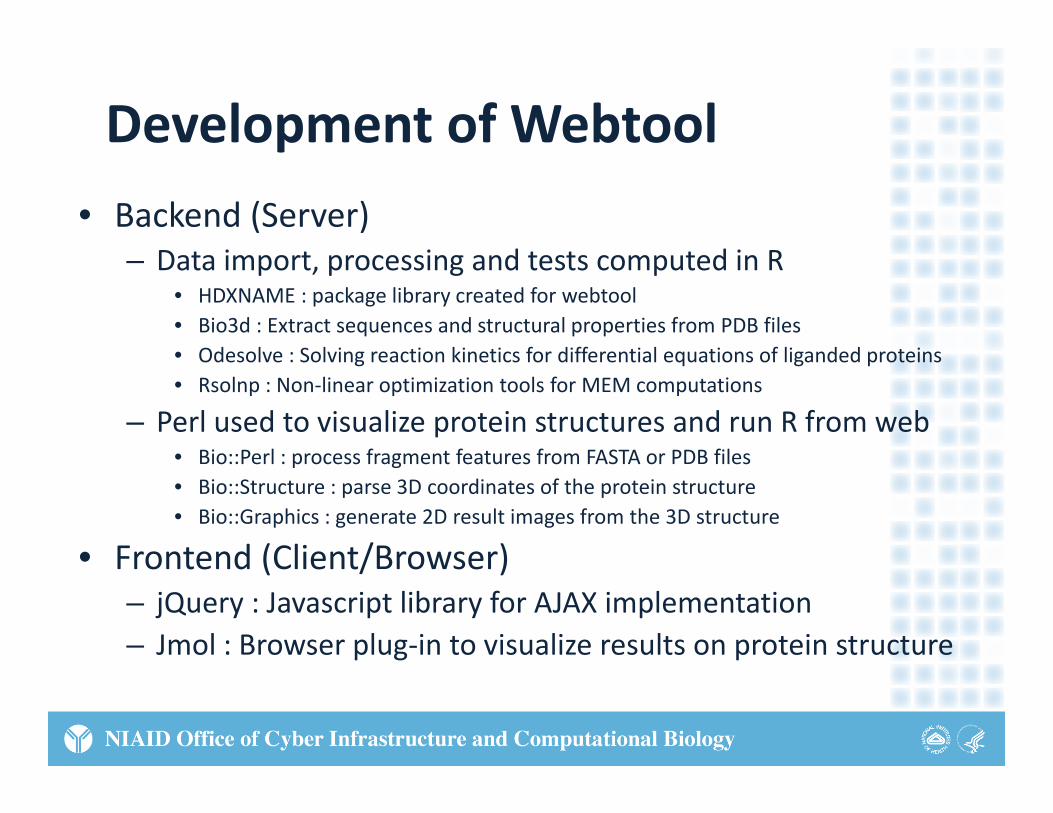
Development of Webtoolp
• Backend (Server)D t i t i d t t t d i R– Data import, processing and tests computed in R
• HDXNAME : package library created for webtool• Bio3d : Extract sequences and structural properties from PDB files• Odesolve : Solving reaction kinetics for differential equations of liganded proteins• Odesolve : Solving reaction kinetics for differential equations of liganded proteins• Rsolnp : Non‐linear optimization tools for MEM computations
– Perl used to visualize protein structures and run R from web• Bio::Perl : process fragment features from FASTA or PDB files• Bio::Perl : process fragment features from FASTA or PDB files• Bio::Structure : parse 3D coordinates of the protein structure• Bio::Graphics : generate 2D result images from the 3D structure
• Frontend (Client/Browser)• Frontend (Client/Browser)– jQuery : Javascript library for AJAX implementation– Jmol : Browser plug‐in to visualize results on protein structure

HDX NAME Webtool
• Input OptionsStructure data (FASTA or PDB)– Structure data (FASTA or PDB)
– HDX data (.txt from instrument)
– Configuration file (.txt) stores user l d kflanalysis and workflow settings
• Uploaded Files– List of all uploaded files– List of all uploaded files
– Buttons to run analyses
• Results– Displays jMol structure image
– Displays protein sequence
Links to statistical result tables– Links to statistical result tables
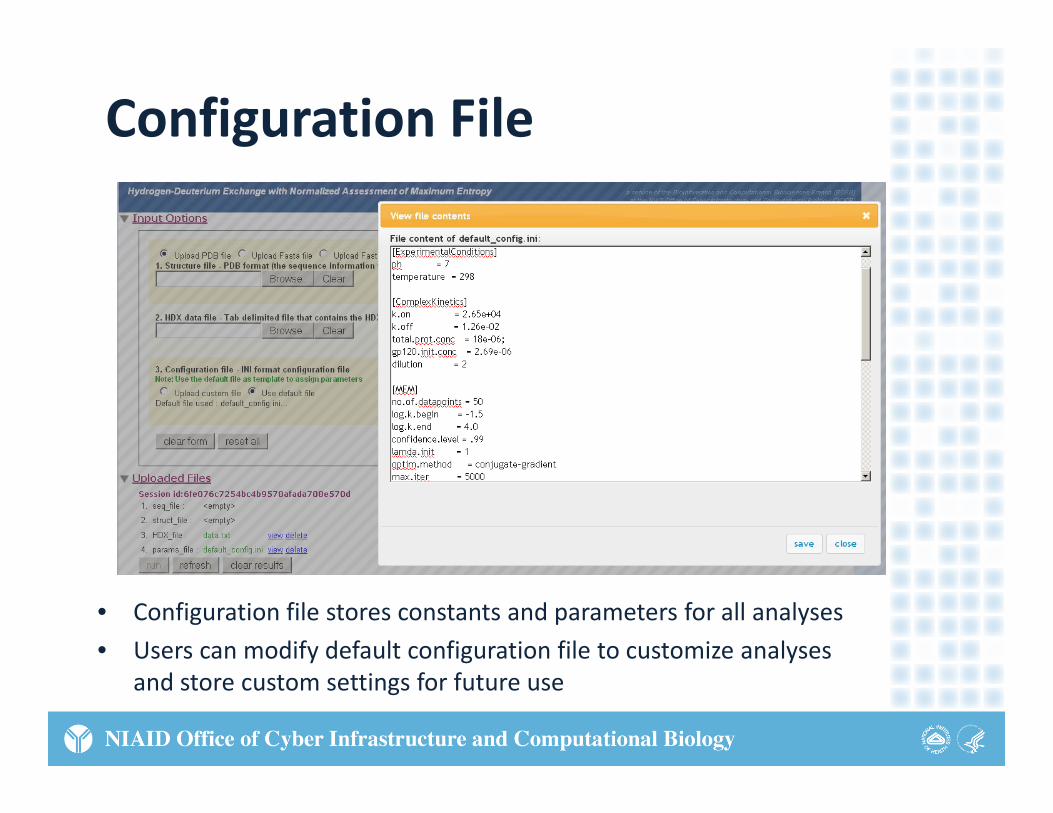
Configuration File
• Configuration file stores constants and parameters for all analyses
• Users can modify default configuration file to customize analyses y g yand store custom settings for future use

Results tables are accessible using web links in table
jMol plug‐in provides interactive 3D image of protein structure
Image can be rotatedImage can be rotated by point‐and‐click
Links allow users to h lzoom, change colors
or animate figure
Fragment lengths, sec structure and errors mapped on protein sequenceprotein sequence

Dose‐Response Analysis Pipeline (DRAP)
• Need to fit logistic dose‐response curves to data from dozens orcurves to data from dozens or hundreds of 96‐well plates– Plates can be organized in countless waysg y
– One factor per plate or multiple factors
– Dilutions on columns or rows
• Want to view the curve‐fits and export summary statisticsexport summary statistics– Want to compare EC50s with statistical tests
– Want to export EC90s for use in QTL analyses

Logistic Dose‐Response Curvesg p• Captures the “S” shape of many
types of biological assaystypes of biological assays– Drug dose‐response experiments
– ELISA experiments
• Unknown model parameters are pestimated using iterative Levenberg‐Marquart methods
– Top and Bottom parameters estimate maximum and minimum response
– LogEC50 parameter estimates the location of the curve on X‐axis
– Hillslope parameter estimates rate ofHillslope parameter estimates rate of increase or decrease per unit X
• Slopes or EC50 estimates can be used to compare effectiveness of
Image created using GraphPad Prism v. 5.03
different vaccines, drugs, etc.

DRAP Workflow• Data from 96‐well plates (.dat files) processed in MS Excel
– Remove headers and footers record positive and negative controlsRemove headers and footers, record positive and negative controls
– Identify data from multiple groups, noting that some groups may occur within a single plate while other groups occur between plates
• Logistic curve‐fits computed in commercial Prism software– Data from each plate must be imported into Prism separately
– Data need to be reorganized in Prism to create appropriate graphs and statistical tests, which may require data from multiple plates
• Summary statistics from Prism pasted into MS Excel or PowerPoint to summarize, reorganize and present results f lti l t t i i l tfrom multiple tests in a single report
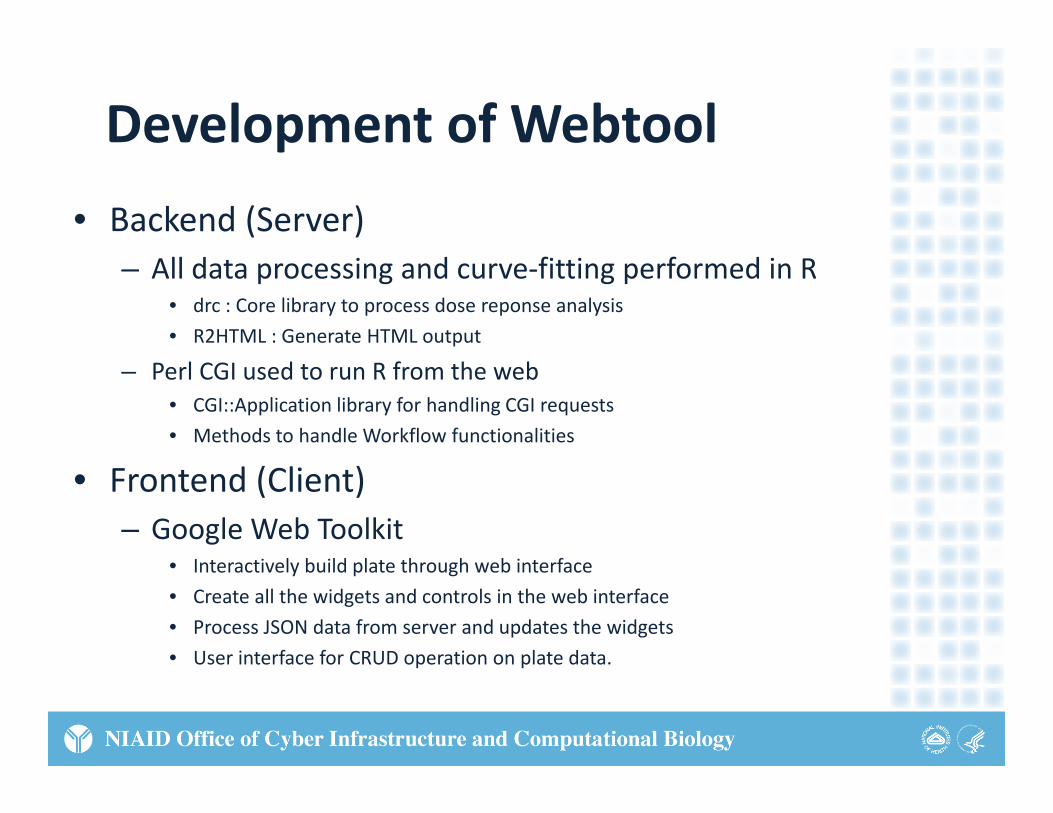
Development of Webtoolp
• Backend (Server)– All data processing and curve‐fitting performed in R
• drc : Core library to process dose reponse analysis
• R2HTML : Generate HTML output
– Perl CGI used to run R from the web• CGI::Application library for handling CGI requests
• Methods to handle Workflow functionalities
• Frontend (Client)– Google Web Toolkit
I t ti l b ild l t th h b i t f• Interactively build plate through web interface
• Create all the widgets and controls in the web interface
• Process JSON data from server and updates the widgets
• User interface for CRUD operation on plate data.User interface for CRUD operation on plate data.

Select zip file with input data
User manual and sample datawith input data sample data
Browse and edit input data filesButtons to start
or stop analysisRainbow icon for
Symbols display status of the
workflow steps
Rainbow icon for “dosage designer”
Long lists of assay response files are loaded interactively
Log info links provide R info and diagnostics
loaded interactively like Google Maps
Files can be edited in browser, then
Info panel shows diagnostics and provides link to
saved to computer
final results

Editing Files
• Users can click on “notepad” icons to edit and save dosage or response data in an interactive text file environment
• Dosage data can also be edited in the interactive Dosage Designerg g g

Interactive Results Report
• Interactive report includes tables to organize results according to groups within plates (e.g. drugs) or between plates (e.g. condition)
• Click on logistic curve graphs for higher resolution images• Click on logistic curve graphs for higher resolution images


Acknowledgements
• Vivek Gopalan: R programming and web development• Jason Barnett: Interface design on DRAP tool• Jason Barnett: Interface design on DRAP tool• Tram Huyen and Mike Tartakovsky: Funding and oversight• Leo Kong and Peter Kwong: HDX NAME experiments• Juliana Sa, Olivia Twu, Hongying Jiang, Thomas Wellems
and Xin‐zhuan Su: DRAP experiments
Websites:http://exon.niaid.nih.govhttp://exon.niaid.nih.gov/drap/http://exon.niaid.nih.gov/HDX_NAME/

Literature Citedte atu e C ted• Kong et al. 2010. Hydrogen‐deuterium exchange mass
spectrometry of HIV 1 gp120 in unliganded and CD4 boundspectrometry of HIV‐1 gp120 in unliganded and CD4‐bound states. J. Virology. in press.
• Sa et al. 2009. Geographical patterns of P. falciparum drug resistance distinguished by differential responses toresistance distinguished by differential responses to amodiaquine and chloroquine. PNAS. 106(45): 18883‐18889
• Yuan et al. 2009. Genetic mapping of targets mediating differential chemical phenotypes in P falciparum Naturedifferential chemical phenotypes in P. falciparum. Nature Chemical Biology. 5:765‐771