Misleading Uses of Data. WOULD YOU BUY THIS PRODUCT? WHY MIGHT SOMEONE BUY IT?
21
Misleading Uses of Data 0 10 20 30 40 50 60 70 80 90 1stQ tr 2nd Q tr 3rd Q tr 4th Q tr East W est N orth 1stQ tr 2nd Q tr 3rd Q tr 4th Q tr 0 10 20 30 40 50 60 70 80 90 100 0 2 4 6 E ast W est N orth 0 10 20 30 40 50 60 70 80 90 100 1stQ tr 2nd Q tr 3rd Q tr 4th Q tr East W est N orth
-
Upload
regina-fox -
Category
Documents
-
view
224 -
download
0
Transcript of Misleading Uses of Data. WOULD YOU BUY THIS PRODUCT? WHY MIGHT SOMEONE BUY IT?
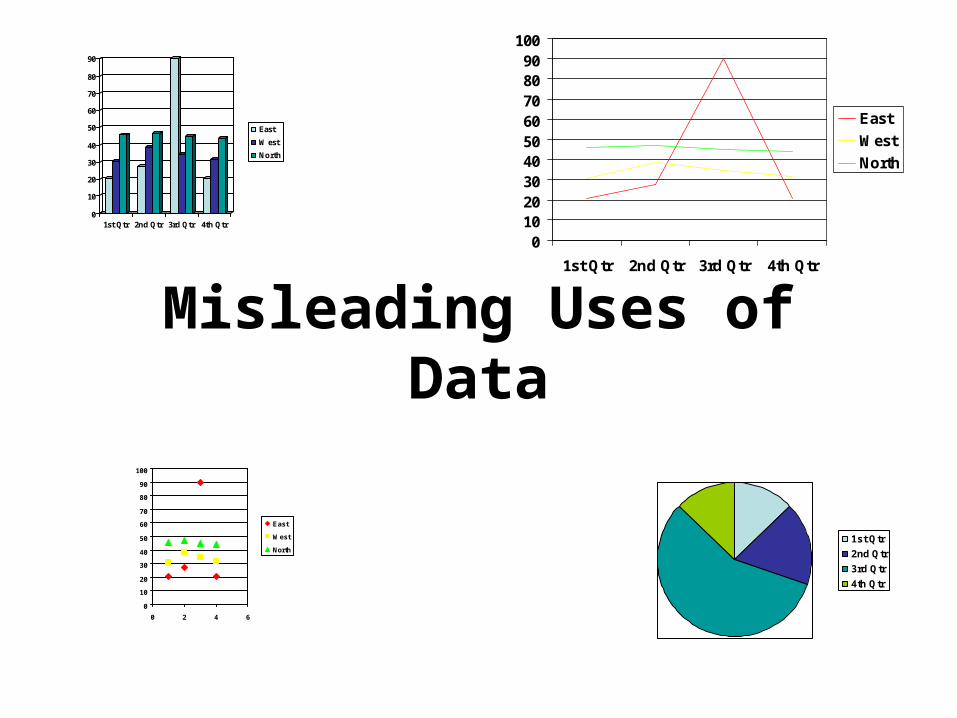
Misleading Uses of Data
0
10
20
30
40
50
60
70
80
90
1st Qtr 2nd Qtr 3rd Qtr 4th Qtr
East
W est
North
1st Qtr
2nd Qtr
3rd Qtr
4th Qtr
0
10
20
30
40
50
60
70
80
90
100
0 2 4 6
East
West
North
0102030405060708090
100
1st Qtr 2nd Qtr 3rd Qtr 4th Qtr
East
West
North
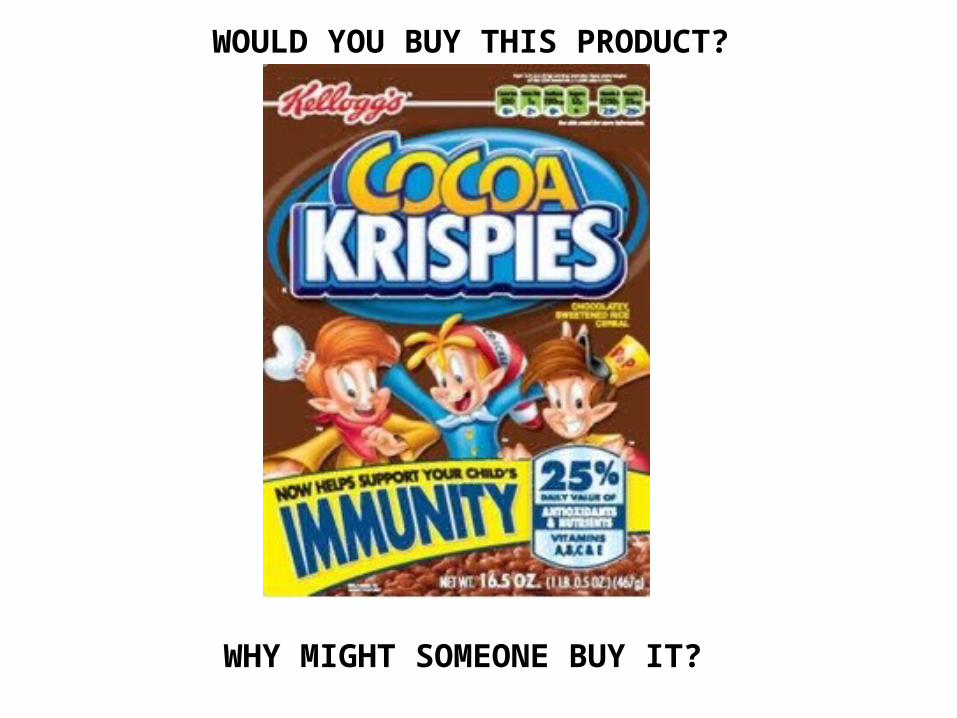
WOULD YOU BUY THIS PRODUCT?
WHY MIGHT SOMEONE BUY IT?
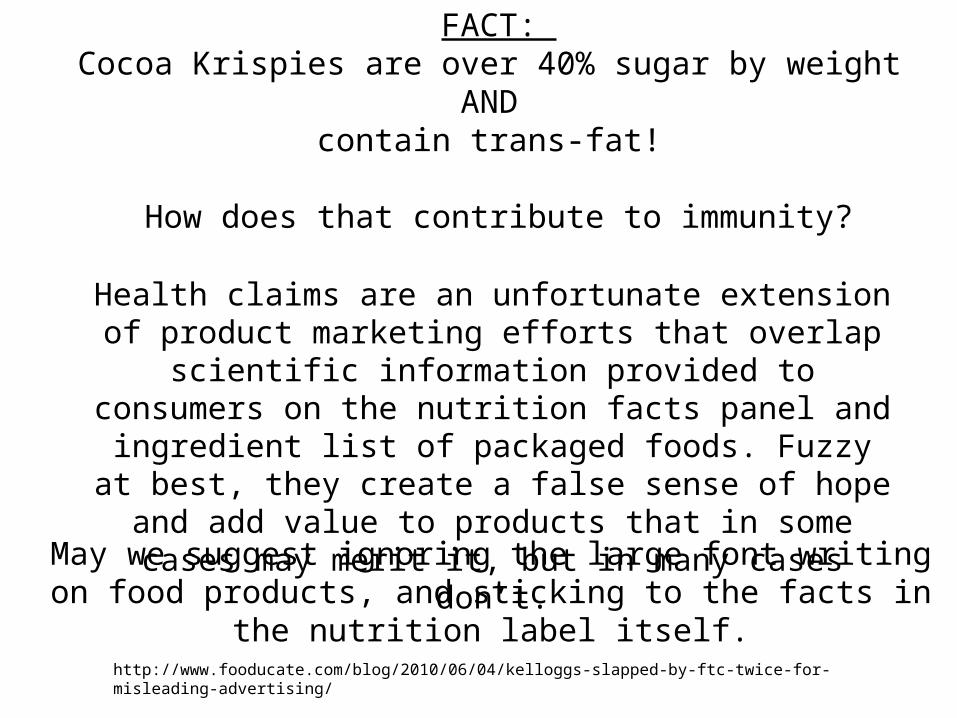
Health claims are an unfortunate extension of product marketing efforts that overlap scientific information
provided to consumers on the nutrition facts panel and ingredient list of packaged foods. Fuzzy at best, they
create a false sense of hope and add value to products that in some cases may merit it, but in many cases don’t.
May we suggest ignoring the large font writing on food products, and sticking to the facts in the nutrition label itself.
FACT: Cocoa Krispies are over 40% sugar by weight
AND contain trans-fat!
How does that contribute to immunity?
http://www.fooducate.com/blog/2010/06/04/kelloggs-slapped-by-ftc-twice-for-misleading-advertising/
We Are Learning To…• Identify whether graphs are
misleading.
• Identify the factors that can make bar graphs, line graphs, and scatter plots misleading.
• Interpret whose interests are favored by misleading graphs.
Think About It:
• What is misleading about the graph?
• How could the graph be changed to reflect the data more accurately?
• Why would someone make a graph that is misleading in this way?
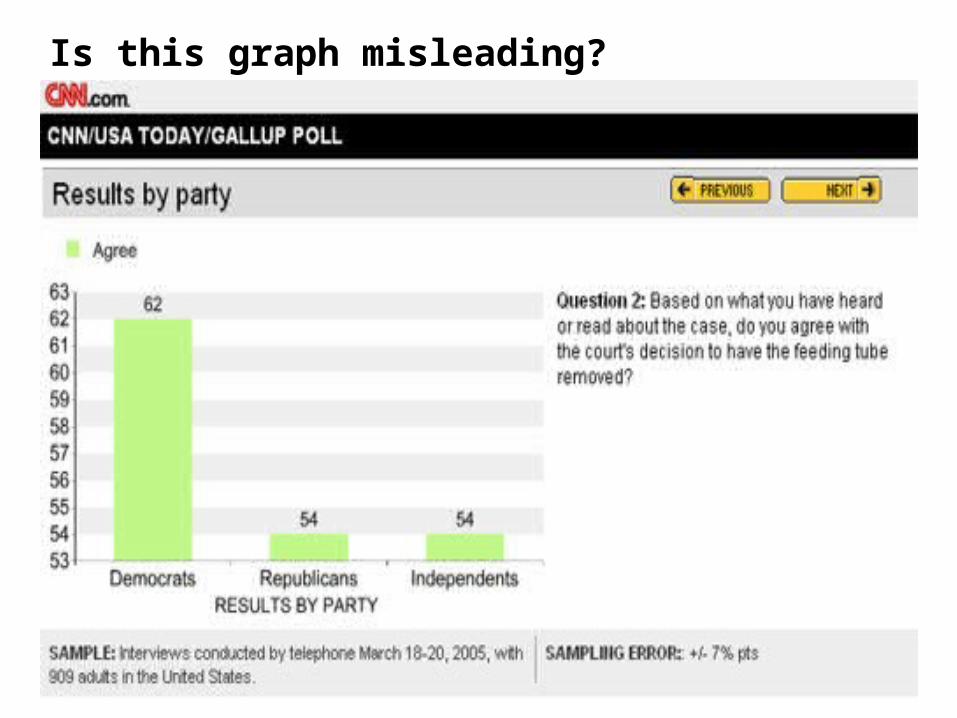
Is this graph misleading?
www.mediamatters.org/items/200503220005
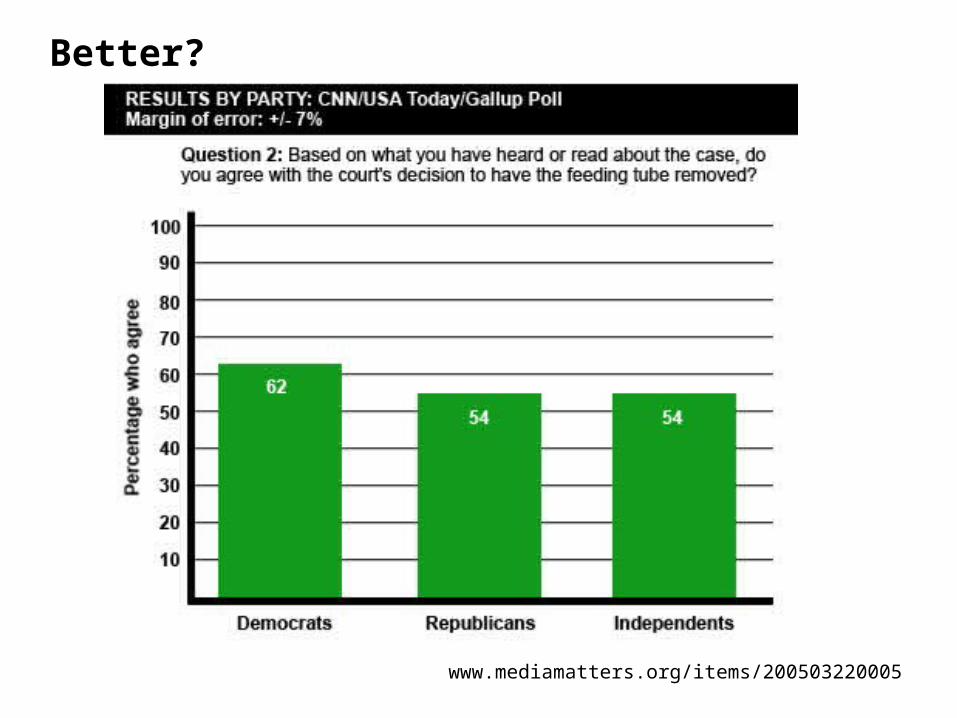
Better?
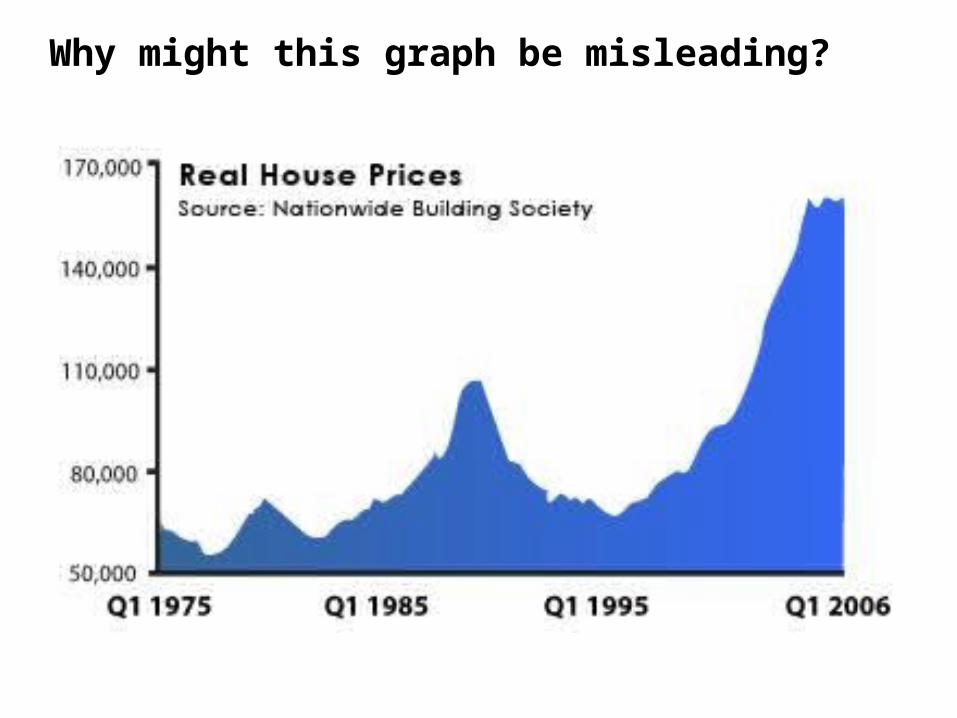
Why might this graph be misleading?
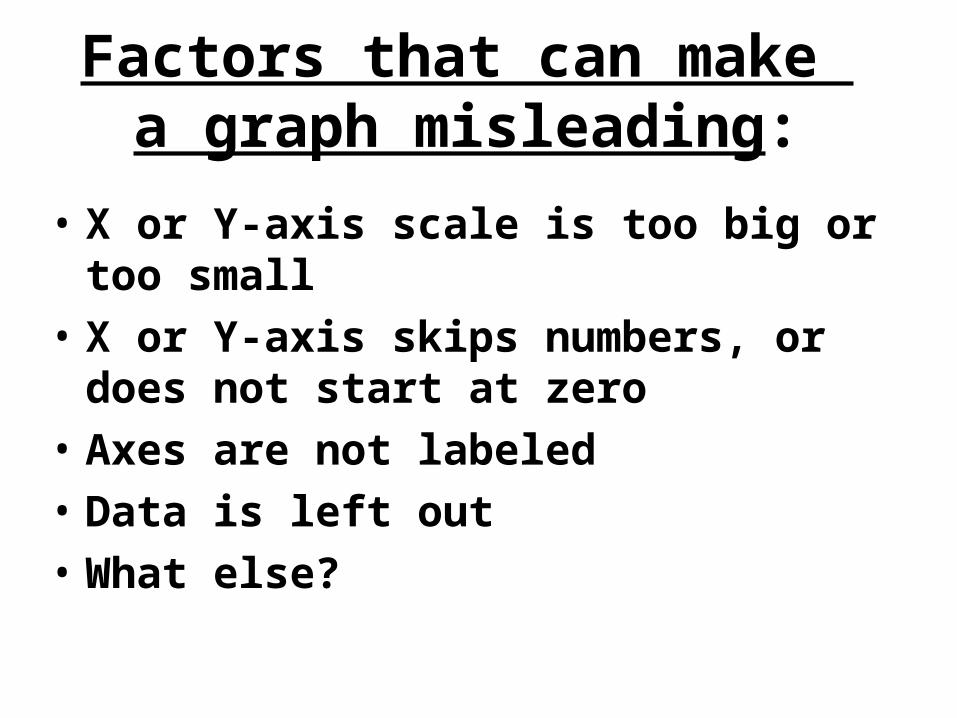
Factors that can make a graph misleading:
• X or Y-axis scale is too big or too small
• X or Y-axis skips numbers, or does not start at zero
• Axes are not labeled• Data is left out• What else?
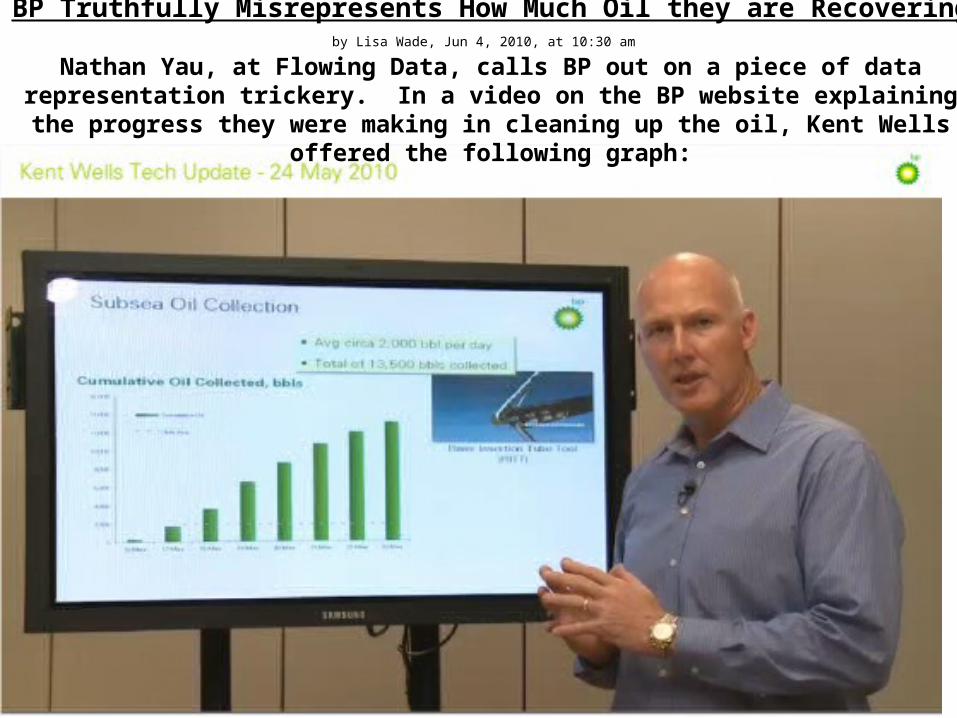
BP Truthfully Misrepresents How Much Oil they are Recoveringby Lisa Wade, Jun 4, 2010, at 10:30 am
Nathan Yau, at Flowing Data, calls BP out on a piece of data representation trickery. In a video on the BP website explaining the progress they were making in cleaning up the oil, Kent Wells offered
the following graph:
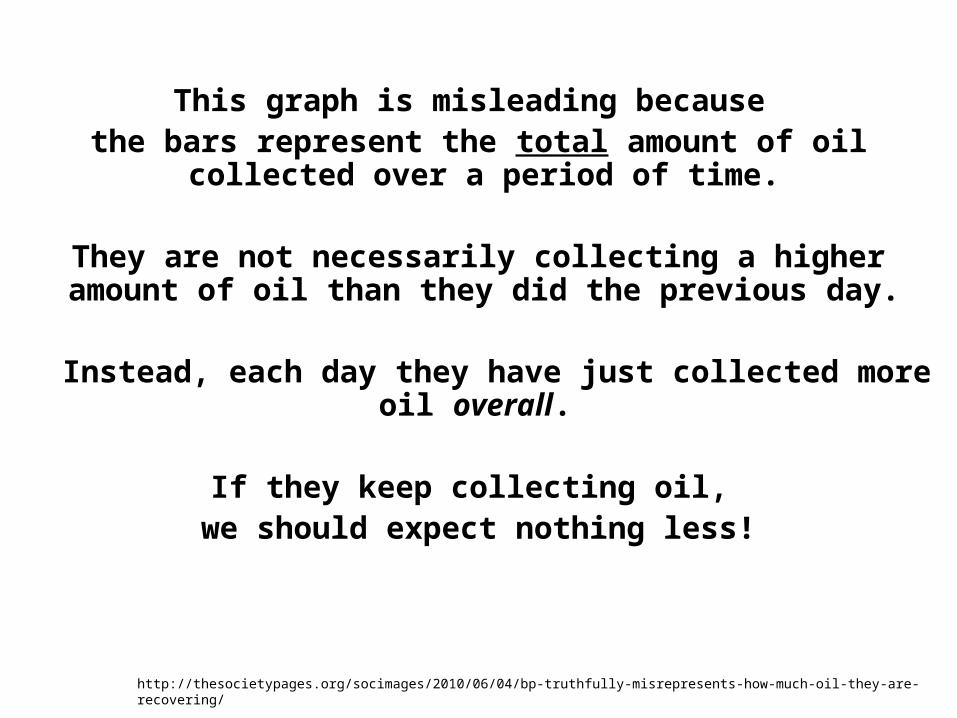
This graph is misleading because the bars represent the total amount of oil collected
over a period of time.
They are not necessarily collecting a higher amount of oil than they did the previous day.
Instead, each day they have just collected more oil overall.
If they keep collecting oil, we should expect nothing less!
http://thesocietypages.org/socimages/2010/06/04/bp-truthfully-misrepresents-how-much-oil-they-are-recovering/
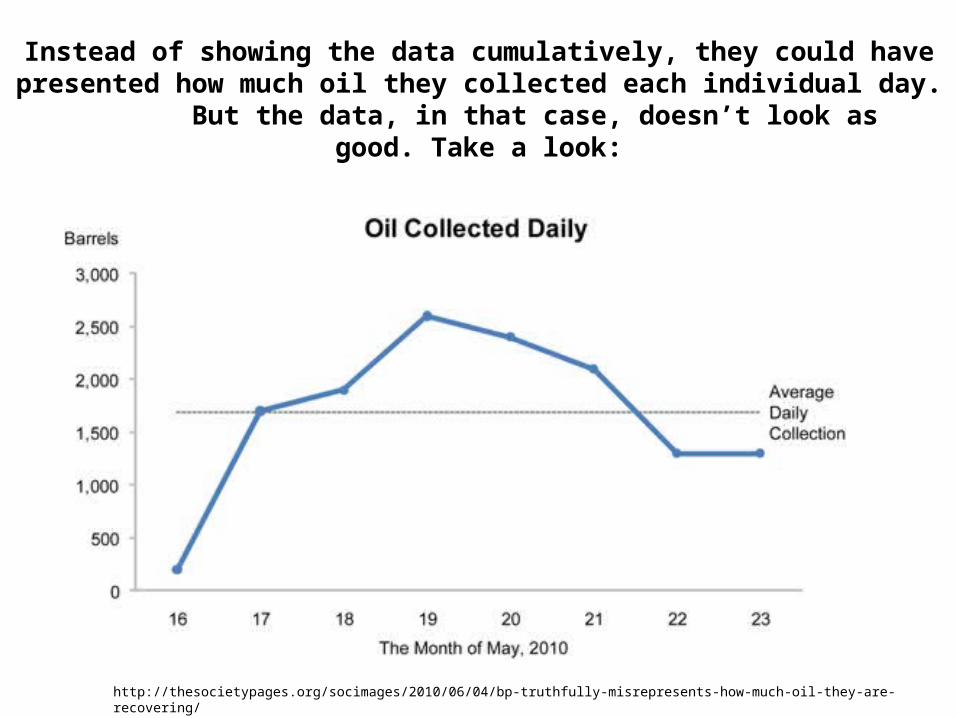
Instead of showing the data cumulatively, they could have presented how much oil they collected each individual day.
But the data, in that case, doesn’t look as good. Take a look:
http://thesocietypages.org/socimages/2010/06/04/bp-truthfully-misrepresents-how-much-oil-they-are-recovering/
Think About It:
• What is misleading about the graph?
• How could the graph be changed to reflect the data more accurately?
• Why would someone make a graph that is misleading in this way?
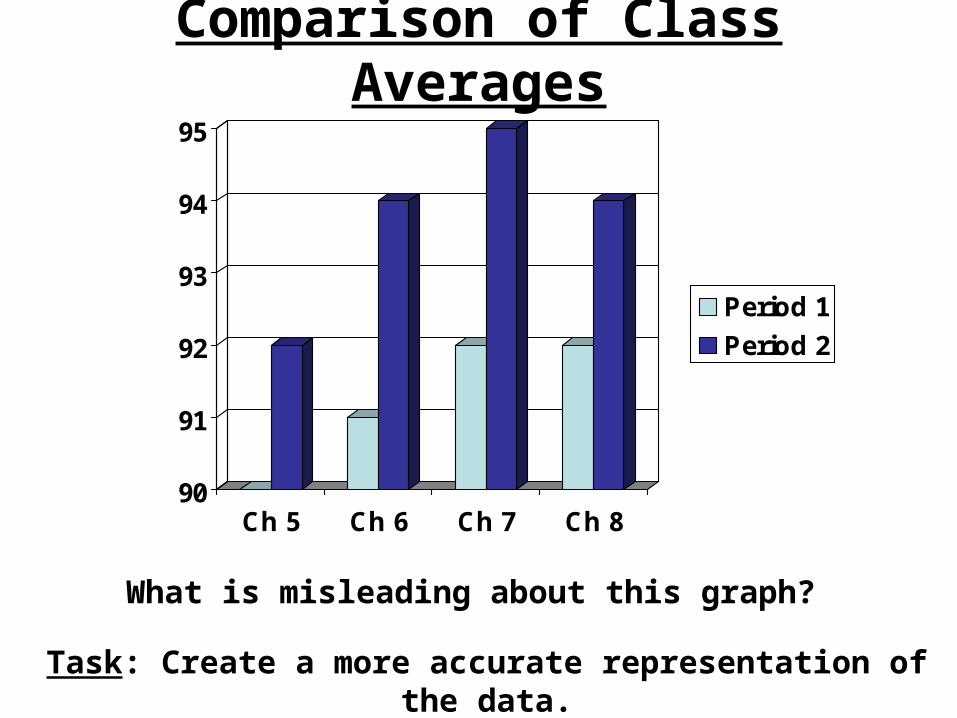
Comparison of Class Averages
90
91
92
93
94
95
Ch 5 Ch 6 Ch 7 Ch 8
Period 1
Period 2
What is misleading about this graph?
Task: Create a more accurate representation of the data.
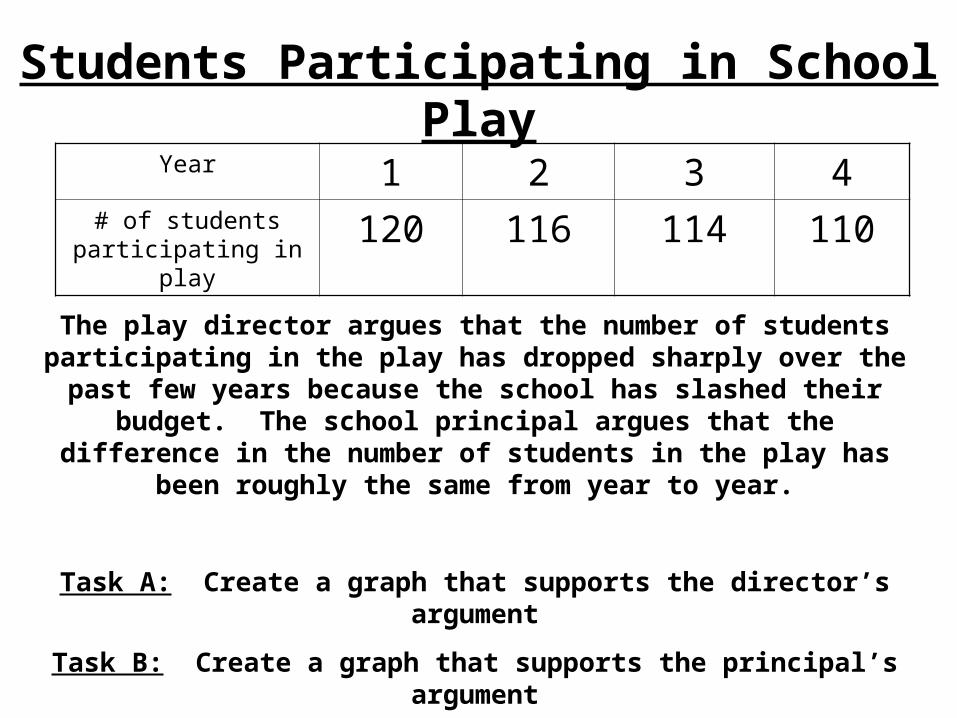
Students Participating in School Play
Year 1 2 3 4# of students
participating in play120 116 114 110
The play director argues that the number of students participating in the play has dropped sharply over the past few years because the school has slashed their
budget. The school principal argues that the difference in the number of students in the play has been roughly the
same from year to year.
Task A: Create a graph that supports the director’s argument
Task B: Create a graph that supports the principal’s argument
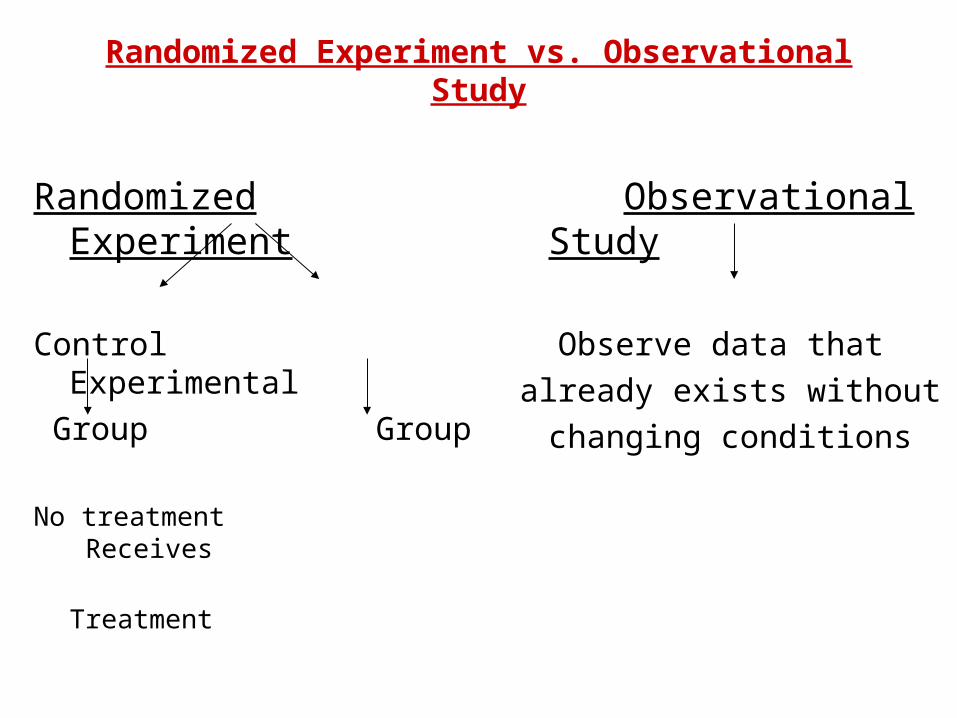
Randomized Experiment vs. Observational Study
Randomized Experiment
Control Experimental
Group Group
No treatment Receives
Treatment
Observational Study
Observe data that
already exists without
changing conditions
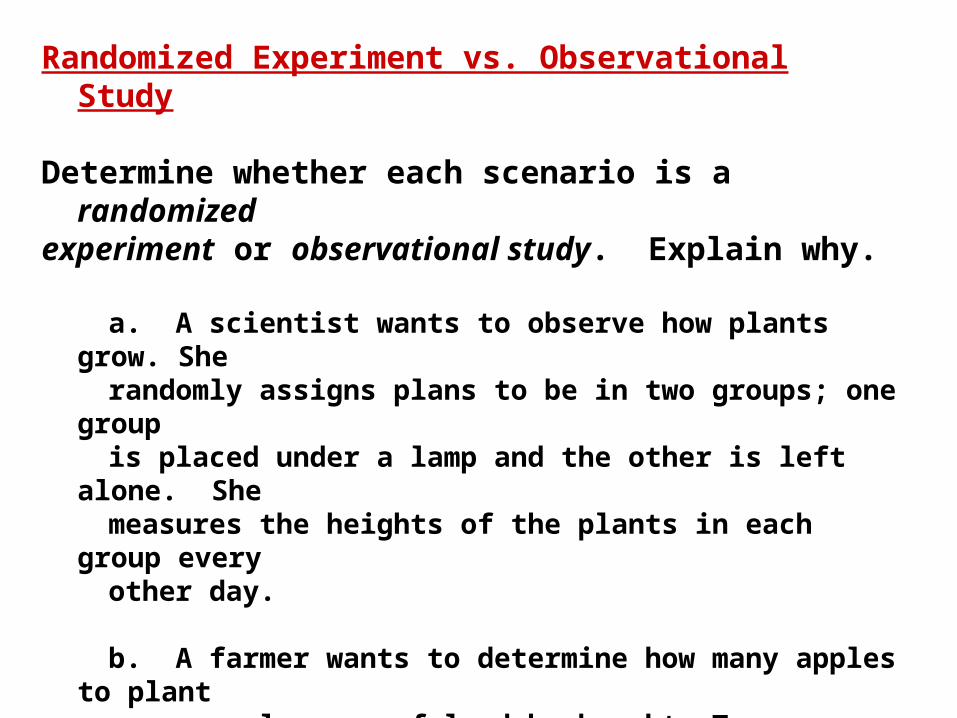
Randomized Experiment vs. Observational Study
Determine whether each scenario is a randomized
experiment or observational study. Explain why.
a. A scientist wants to observe how plants grow. She randomly assigns plans to be in two groups; one group is placed under a lamp and the other is left alone. She measures the heights of the plants in each group every other day.
b. A farmer wants to determine how many apples to plant on several acres of land he bought. To determine this, he counts the number of apple trees on the north side and the south side of the property and records the number of apples each tree yields. He then uses the data to decide how many apples to plant in each region.
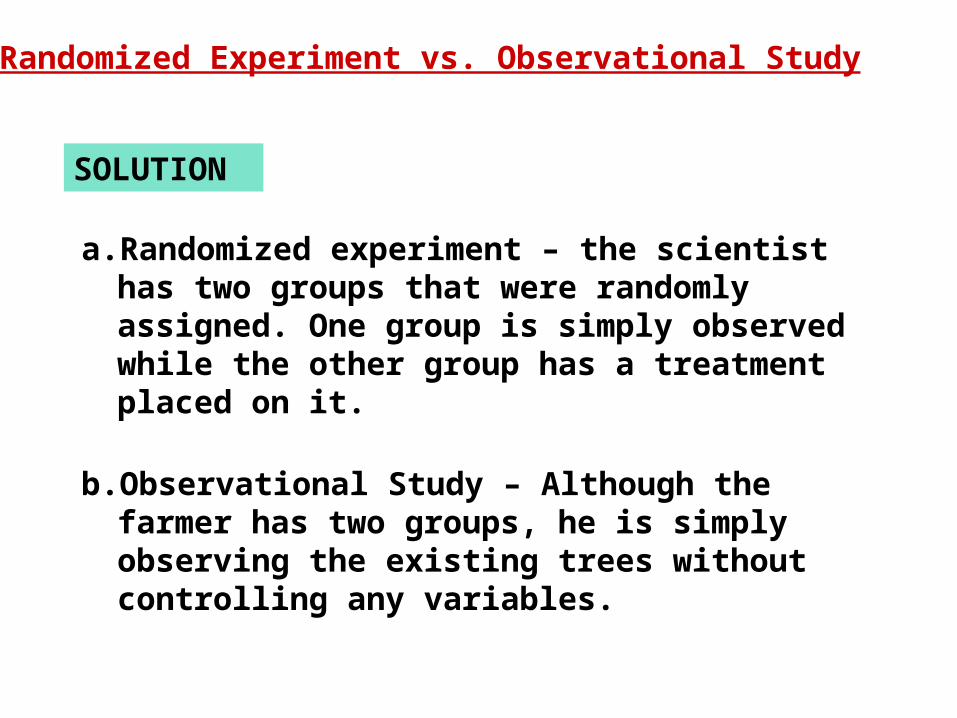
SOLUTION
Randomized Experiment vs. Observational Study
a. Randomized experiment – the scientist has two groups that were randomly assigned. One group is simply observed while the other group has a treatment placed on it.
b. Observational Study – Although the farmer has two groups, he is simply observing the existing trees without controlling any variables.
A survey is a study of one or more characteristics of a group.
It is often difficult to survey an entire population. Instead, you can survey a part of the population or a sample.
A randomly-selected sample gives the best chance of representative data.
In a sample, some parts of the population may be over or under-represented. We call this a biased sample.
A survey question that encourages a particular response is a biased question.
Surveys & Biases
Identify potentially biased questions
Tell whether the question is potentially biased. Explain your answer. If the question is potentially biased, rewrite it so that it is not.
Don’t you agree that the voting age should be lowered to 16 because many 16-year-olds are responsible and informed?
a.
Do you think the city should risk an increase in pollution by allowing expansion of the Northern Industrial Park?
b.

Identify potentially biased questions
SOLUTION
This question is biased because it suggests that lowering the voting age is a good thing to do. An unbiased question is “Do you think the voting age should be lowered to 16?”
a.
This question is biased because it suggests that the proposed expansion will be bad for the environment. An unbiased question is “Do you think the city should allow expansion of the Northern Industrial Park?”
b.