Misleading early blood volume changes obtained using ...
9
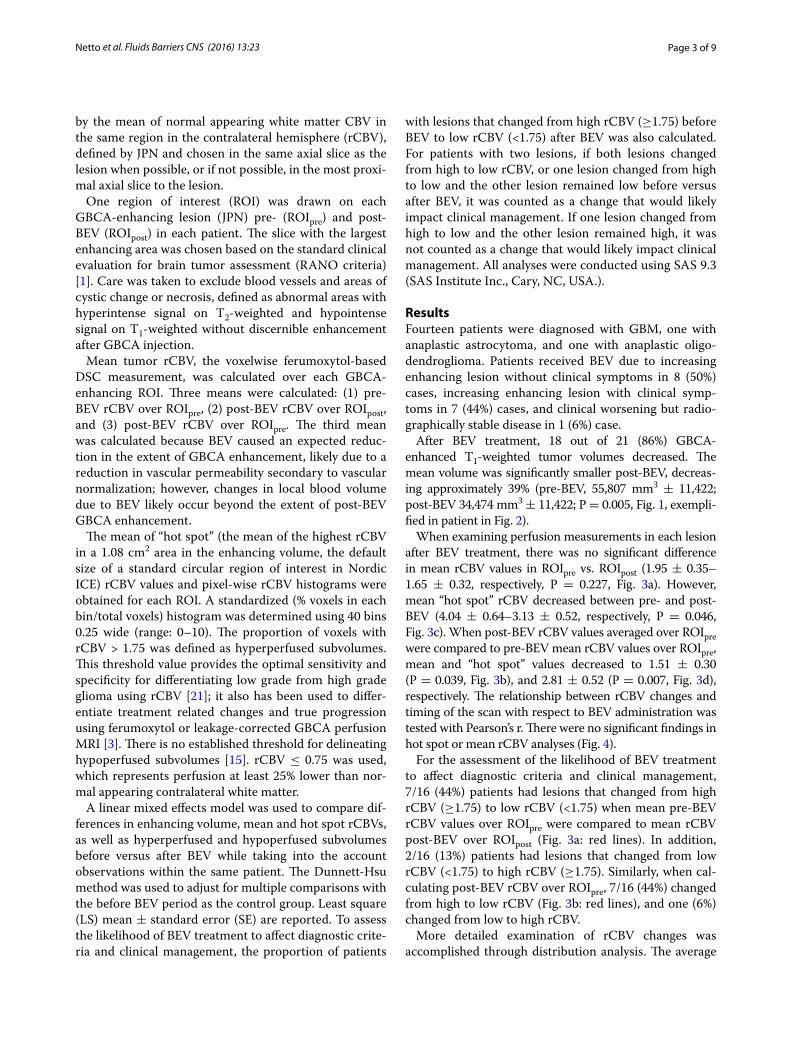
Netto et al. Fluids Barriers CNS (2016) 13:23 DOI 10.1186/s12987-016-0047-9 RESEARCH Misleading early blood volume changes obtained using ferumoxytol-based magnetic resonance imaging perfusion in high grade glial neoplasms treated with bevacizumab Joao Prola Netto 1,2† , Daniel Schwartz 1,3† , Csanad Varallyay 1 , Rongwei Fu 4,5 , Bronwyn Hamilton 2 and Edward A. Neuwelt 1,6,7* Abstract Background: Neovascularization, a distinguishing trait of high-grade glioma, is a target for anti-angiogenic treat- ment with bevacizumab (BEV). This study sought to use ferumoxytol-based dynamic susceptibility contrast magnetic resonance imaging (MRI) to clarify perfusion and relative blood volume (rCBV) changes in glioma treated with BEV and to determine potential impact on clinical management. Methods: 16 high grade glioma patients who received BEV following post-chemoradiation radiographic or clinical progression were included. Ferumoxytol-based MRI perfusion measurements were taken before and after BEV. Lesions were defined at each timepoint by gadolinium-based contrast agent (GBCA)-enhancing area. Lesion volume and rCBV were compared pre and post-BEV in the lesion and rCBV “hot spot” (mean of the highest rCBV in a 1.08 cm 2 area in the enhancing volume), as well as hypoperfused and hyperperfused subvolumes within the GBCA-enhancing lesion. Results: GBCA-enhancing lesion volumes decreased 39% (P = 0.01) after BEV. Mean rCBV in post-BEV GBCA-enhanc- ing area did not decrease significantly (P = 0.227) but significantly decreased in the hot spot (P = 0.046). Mean and hot spot rCBV decreased (P = 0.039 and 0.007) when post-BEV rCBV was calculated over the pre-BEV GBCA-enhanc- ing area. Hypoperfused pixel count increased from 24% to 38 (P = 0.007) and hyperperfused decreased from 39 to 28% (P = 0.017). Mean rCBV decreased in 7/16 (44%) patients from >1.75 to <1.75, the cutoff for pseudoprogression diagnosis. Conclusions: Decreased perfusion after BEV significantly alters rCBV measurements when using ferumoxytol. BEV treatment response hinders efforts to differentiate true progression from pseudoprogression using blood volume measurements in malignant glioma, potentially impacting patient diagnosis and management. Keywords: High grade glioma, Perfusion MRI, Ferumoxytol, Bevacizumab © The Author(s) 2016. This article is distributed under the terms of the Creative Commons Attribution 4.0 International License (http://creativecommons.org/licenses/by/4.0/), which permits unrestricted use, distribution, and reproduction in any medium, provided you give appropriate credit to the original author(s) and the source, provide a link to the Creative Commons license, and indicate if changes were made. The Creative Commons Public Domain Dedication waiver (http://creativecommons.org/ publicdomain/zero/1.0/) applies to the data made available in this article, unless otherwise stated. Background Treatment for newly diagnosed glioblastoma (GBM) consists of resection followed by radiotherapy with con- comitant temozolomide (TMZ). Increased enhancement volume on T 1 -weighted magnetic resonance imaging (MRI) using gadolinium-based contrast agent (GBCA) after chemoradiotherapy (CRT) in GBM patients can rep- resent tumor progression or pseudoprogression. Diag- nostic accuracy is critical in deciding appropriate therapy. Response assessment in neuro-oncology (RANO) sug- gests that differentiation of pseudoprogression from disease progression cannot be accomplished with a con- ventional MRI method in the first 12 weeks post-CRT [1]. Ferumoxytol, an iron oxide nanoparticle, is FDA- approved for iron replacement and used off-label for Open Access Fluids and Barriers of the CNS *Correspondence: [email protected] † Joao Prola Netto and Daniel Schwartz contributed equally to this work 6 Department of Veterans Affairs Medical Center, 3710 SW U.S. Veterans Hospital Road, Portland, OR 97239, USA Full list of author information is available at the end of the article
Transcript of Misleading early blood volume changes obtained using ...

Netto et al. Fluids Barriers CNS (2016) 13:23 DOI 10.1186/s12987-016-0047-9
RESEARCH
Misleading early blood volume changes obtained using ferumoxytol-based magnetic resonance imaging perfusion in high grade glial neoplasms treated with bevacizumabJoao Prola Netto1,2†, Daniel Schwartz1,3†, Csanad Varallyay1, Rongwei Fu4,5, Bronwyn Hamilton2 and Edward A. Neuwelt1,6,7*
Abstract
Background: Neovascularization, a distinguishing trait of high-grade glioma, is a target for anti-angiogenic treat-ment with bevacizumab (BEV). This study sought to use ferumoxytol-based dynamic susceptibility contrast magnetic resonance imaging (MRI) to clarify perfusion and relative blood volume (rCBV) changes in glioma treated with BEV and to determine potential impact on clinical management.
Methods: 16 high grade glioma patients who received BEV following post-chemoradiation radiographic or clinical progression were included. Ferumoxytol-based MRI perfusion measurements were taken before and after BEV. Lesions were defined at each timepoint by gadolinium-based contrast agent (GBCA)-enhancing area. Lesion volume and rCBV were compared pre and post-BEV in the lesion and rCBV “hot spot” (mean of the highest rCBV in a 1.08 cm2 area in the enhancing volume), as well as hypoperfused and hyperperfused subvolumes within the GBCA-enhancing lesion.
Results: GBCA-enhancing lesion volumes decreased 39% (P = 0.01) after BEV. Mean rCBV in post-BEV GBCA-enhanc-ing area did not decrease significantly (P = 0.227) but significantly decreased in the hot spot (P = 0.046). Mean and hot spot rCBV decreased (P = 0.039 and 0.007) when post-BEV rCBV was calculated over the pre-BEV GBCA-enhanc-ing area. Hypoperfused pixel count increased from 24% to 38 (P = 0.007) and hyperperfused decreased from 39 to 28% (P = 0.017). Mean rCBV decreased in 7/16 (44%) patients from >1.75 to <1.75, the cutoff for pseudoprogression diagnosis.
Conclusions: Decreased perfusion after BEV significantly alters rCBV measurements when using ferumoxytol. BEV treatment response hinders efforts to differentiate true progression from pseudoprogression using blood volume measurements in malignant glioma, potentially impacting patient diagnosis and management.
Keywords: High grade glioma, Perfusion MRI, Ferumoxytol, Bevacizumab
© The Author(s) 2016. This article is distributed under the terms of the Creative Commons Attribution 4.0 International License (http://creativecommons.org/licenses/by/4.0/), which permits unrestricted use, distribution, and reproduction in any medium, provided you give appropriate credit to the original author(s) and the source, provide a link to the Creative Commons license, and indicate if changes were made. The Creative Commons Public Domain Dedication waiver (http://creativecommons.org/publicdomain/zero/1.0/) applies to the data made available in this article, unless otherwise stated.
BackgroundTreatment for newly diagnosed glioblastoma (GBM) consists of resection followed by radiotherapy with con-comitant temozolomide (TMZ). Increased enhancement volume on T1-weighted magnetic resonance imaging
(MRI) using gadolinium-based contrast agent (GBCA) after chemoradiotherapy (CRT) in GBM patients can rep-resent tumor progression or pseudoprogression. Diag-nostic accuracy is critical in deciding appropriate therapy. Response assessment in neuro-oncology (RANO) sug-gests that differentiation of pseudoprogression from disease progression cannot be accomplished with a con-ventional MRI method in the first 12 weeks post-CRT [1].
Ferumoxytol, an iron oxide nanoparticle, is FDA-approved for iron replacement and used off-label for
Open Access
Fluids and Barriers of the CNS
*Correspondence: [email protected] †Joao Prola Netto and Daniel Schwartz contributed equally to this work
6 Department of Veterans Affairs Medical Center, 3710 SW U.S. Veterans Hospital Road, Portland, OR 97239, USAFull list of author information is available at the end of the article
Page 2 of 9Netto et al. Fluids Barriers CNS (2016) 13:23
brain imaging, especially in patients with compromised renal function for whom GBCA is contraindicated [2]. Ferumoxytol as an MRI contrast agent for perfusion benefits from its intravascular property. Compared to GBCA, it may not require leakage correction or preload dosing [3]. Perfusion MRI has been used clinically as a biomarker to prospectively differentiate pseudoprogres-sion from disease progression [4–7], and relative cerebral blood volume (rCBV) measurements using ferumoxy-tol as an MRI contrast agent can discriminate true pro-gression from pseudoprogression in GBM using a mean rCBV threshold of 1.75 [3, 8]. The use of small paramag-netic iron oxides (SPIOs), such as ferumoxytol, was first published as an MR-based imaging agent for cancer in 1989, and has increased exponentially in the last dec-ade. There were 728 publications on SPIOs and cancer between 1990 and 2010 and more than 864 in the last five years alone.
Bevacizumab (BEV) is an anti-vascular endothelial growth factor (VEGF) A antibody working as an angio-genesis inhibitor [9] that normalizes tumor vasculature [10], and decreases contrast-enhancing tumor volume and blood volume in lesions both in animal models [11, 12] and clinically [13–15]. No association has been found between tumor volume change after BEV and overall or progression-free survival [16]. After treatment with BEV, tumor perfusion decreases but tumor growth may only be temporarily inhibited [17, 18], leading to “pseudor-esponse” and mismanaged therapy. Due to the likelihood of pseudoresponse and normalization of the blood–brain barrier, traditional methods to assess post-CRT tumor progression can be misleading in patients treated with BEV [1], and there is a concern that evaluating CBV for differentiating real progression from pseudoprogression as a result of CRT after treatment with BEV may pro-duce false negative results. This study hypothesizes that perfusion decrease in high grade tumors after CRT and subsequent treatment with BEV can affect clinical man-agement, and aimed to determine rCBV changes post-BEV using ferumoxytol-based dynamic susceptibility contrast (DSC) MR perfusion in patients with high grade glioma in a clinical setting.
MethodsData collectionSixteen patients (mean age in years [range]: 54 [39–63]; 6 males, 53 [44–62]; 10 females, 52 [43–61]) presenting with a total of 21 lesions (5 patients had two distinct and isolated lesions) were included in this retrospective study and provided written informed consent on one of four prospective Oregon Health & Science University HIPAA-compliant and IRB-approved MRI protocols (2753, 2864, 1562, and 813) using two contrast agents, GBCA and
ferumoxytol, between 2009 and 2012. On average, pre-BEV MRI studies were performed 7 days (range: 0–21) before drug infusion, and post-treatment MRIs were per-formed 27 days after (range: 12–30).
Inclusion criteria were that patients have histological evidence of high grade glioma; evidence of increased or new enhancing tumor on clinical scan, which at time of scan could have represented tumor progression or treat-ment related changes; having received CRT and bevaci-zumab in the course of disease treatment; and an MRI study with gadoteridol and ferumoxytol DSC MRI less than 21 days before BEV and less than 30 days after. All patients received standard CRT with either 60 Gy in 30 fractions or 59.4 Gy in 33 fractions, with concomitant oral TMZ at a dose of 75 mg/m2/day. After completion of CRT all patients continued on monthly TMZ (150–200 mg/m2/day for 5 days in every 28 day cycle) for at least 6 months or until disease progression occurred [19].
ImagingPatients underwent 3T MRI (Siemens Trio or Philips Achieva) with a multichannel head coil. All imaging protocols included anatomical and dynamic sequences in the axial plane. T1-weighted scans (repetition time [TR]/echo time [TE] ≈ 900 ms/10 ms, field of view [FOV] = 240 mm2, matrix = 256 × 256, ~44 2 mm slices with no gap) were acquired with a standard dose of 0.1 mmol/kg intravenous (IV) gadoteridol to assess con-trast enhancing volume. DSC scans (90 measurements at 0.66 Hz, TR/TE/flip angle = 1500 ms/20 ms/45°, FOV = 192 mm2, matrix 64 × 64, 27 3 mm slices with a 0.9 mm gap) were acquired, with a short IV bolus of 1 or 2 mg/kg (~5–10 ml) ferumoxytol injected at a flow rate of 3 ml/s followed by 20 ml of saline flush at the same rate. Approximately 20 measurements were obtained before the contrast reached the brain allowing an accurate base-line signal. Patients did not receive ferumoxytol directly after gadoteridol; in some cases, the two agents and their associated imaging acquisitions were separated by at least 12 min, and in some cases the acquisitions took place during sessions on consecutive days. However, recent work has shown that dual contrast sessions are feasible and yield reliable measurements of rCBV [20].
Image analysisTumor volume measurements were taken as the prod-uct of the extent of the GBCA-enhancing areas in three orthogonal axes as measured by a neuroradiologist with 8 years of experience (JPN). All DSC data were processed by JPN using NordicICE. CBV maps were generated by applying a tracer kinetic model to the first pass of the contrast bolus. Voxelwise CBV maps were coregistered to T1-weighted images and then normalized by dividing
Page 3 of 9Netto et al. Fluids Barriers CNS (2016) 13:23
by the mean of normal appearing white matter CBV in the same region in the contralateral hemisphere (rCBV), defined by JPN and chosen in the same axial slice as the lesion when possible, or if not possible, in the most proxi-mal axial slice to the lesion.
One region of interest (ROI) was drawn on each GBCA-enhancing lesion (JPN) pre- (ROIpre) and post-BEV (ROIpost) in each patient. The slice with the largest enhancing area was chosen based on the standard clinical evaluation for brain tumor assessment (RANO criteria) [1]. Care was taken to exclude blood vessels and areas of cystic change or necrosis, defined as abnormal areas with hyperintense signal on T2-weighted and hypointense signal on T1-weighted without discernible enhancement after GBCA injection.
Mean tumor rCBV, the voxelwise ferumoxytol-based DSC measurement, was calculated over each GBCA-enhancing ROI. Three means were calculated: (1) pre-BEV rCBV over ROIpre, (2) post-BEV rCBV over ROIpost, and (3) post-BEV rCBV over ROIpre. The third mean was calculated because BEV caused an expected reduc-tion in the extent of GBCA enhancement, likely due to a reduction in vascular permeability secondary to vascular normalization; however, changes in local blood volume due to BEV likely occur beyond the extent of post-BEV GBCA enhancement.
The mean of “hot spot” (the mean of the highest rCBV in a 1.08 cm2 area in the enhancing volume, the default size of a standard circular region of interest in Nordic ICE) rCBV values and pixel-wise rCBV histograms were obtained for each ROI. A standardized (% voxels in each bin/total voxels) histogram was determined using 40 bins 0.25 wide (range: 0–10). The proportion of voxels with rCBV > 1.75 was defined as hyperperfused subvolumes. This threshold value provides the optimal sensitivity and specificity for differentiating low grade from high grade glioma using rCBV [21]; it also has been used to differ-entiate treatment related changes and true progression using ferumoxytol or leakage-corrected GBCA perfusion MRI [3]. There is no established threshold for delineating hypoperfused subvolumes [15]. rCBV ≤ 0.75 was used, which represents perfusion at least 25% lower than nor-mal appearing contralateral white matter.
A linear mixed effects model was used to compare dif-ferences in enhancing volume, mean and hot spot rCBVs, as well as hyperperfused and hypoperfused subvolumes before versus after BEV while taking into the account observations within the same patient. The Dunnett-Hsu method was used to adjust for multiple comparisons with the before BEV period as the control group. Least square (LS) mean ± standard error (SE) are reported. To assess the likelihood of BEV treatment to affect diagnostic crite-ria and clinical management, the proportion of patients
with lesions that changed from high rCBV (≥1.75) before BEV to low rCBV (<1.75) after BEV was also calculated. For patients with two lesions, if both lesions changed from high to low rCBV, or one lesion changed from high to low and the other lesion remained low before versus after BEV, it was counted as a change that would likely impact clinical management. If one lesion changed from high to low and the other lesion remained high, it was not counted as a change that would likely impact clinical management. All analyses were conducted using SAS 9.3 (SAS Institute Inc., Cary, NC, USA.).
ResultsFourteen patients were diagnosed with GBM, one with anaplastic astrocytoma, and one with anaplastic oligo-dendroglioma. Patients received BEV due to increasing enhancing lesion without clinical symptoms in 8 (50%) cases, increasing enhancing lesion with clinical symp-toms in 7 (44%) cases, and clinical worsening but radio-graphically stable disease in 1 (6%) case.
After BEV treatment, 18 out of 21 (86%) GBCA-enhanced T1-weighted tumor volumes decreased. The mean volume was significantly smaller post-BEV, decreas-ing approximately 39% (pre-BEV, 55,807 mm3 ± 11,422; post-BEV 34,474 mm3 ± 11,422; P = 0.005, Fig. 1, exempli-fied in patient in Fig. 2).
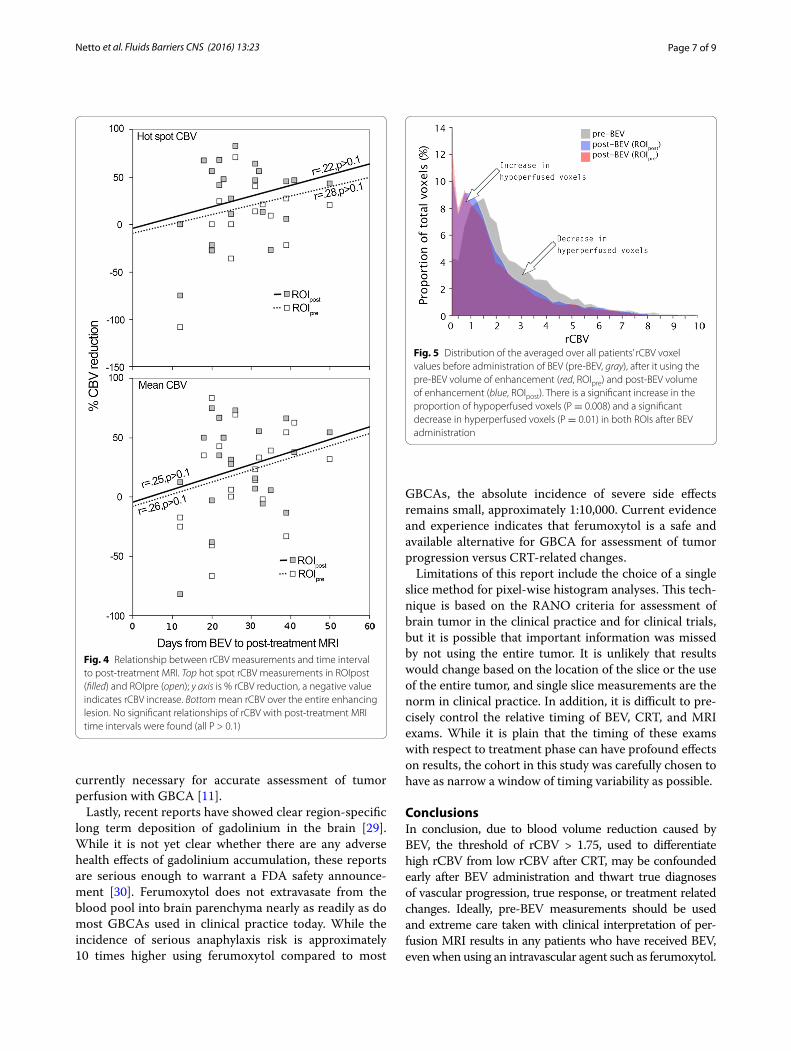
When examining perfusion measurements in each lesion after BEV treatment, there was no significant difference in mean rCBV values in ROIpre vs. ROIpost (1.95 ± 0.35–1.65 ± 0.32, respectively, P = 0.227, Fig. 3a). However, mean “hot spot” rCBV decreased between pre- and post-BEV (4.04 ± 0.64–3.13 ± 0.52, respectively, P = 0.046, Fig. 3c). When post-BEV rCBV values averaged over ROIpre were compared to pre-BEV mean rCBV values over ROIpre, mean and “hot spot” values decreased to 1.51 ± 0.30 (P = 0.039, Fig. 3b), and 2.81 ± 0.52 (P = 0.007, Fig. 3d), respectively. The relationship between rCBV changes and timing of the scan with respect to BEV administration was tested with Pearson’s r. There were no significant findings in hot spot or mean rCBV analyses (Fig. 4).
For the assessment of the likelihood of BEV treatment to affect diagnostic criteria and clinical management, 7/16 (44%) patients had lesions that changed from high rCBV (≥1.75) to low rCBV (<1.75) when mean pre-BEV rCBV values over ROIpre were compared to mean rCBV post-BEV over ROIpost (Fig. 3a: red lines). In addition, 2/16 (13%) patients had lesions that changed from low rCBV (<1.75) to high rCBV (≥1.75). Similarly, when cal-culating post-BEV rCBV over ROIpre, 7/16 (44%) changed from high to low rCBV (Fig. 3b: red lines), and one (6%) changed from low to high rCBV.
More detailed examination of rCBV changes was accomplished through distribution analysis. The average

Page 4 of 9Netto et al. Fluids Barriers CNS (2016) 13:23
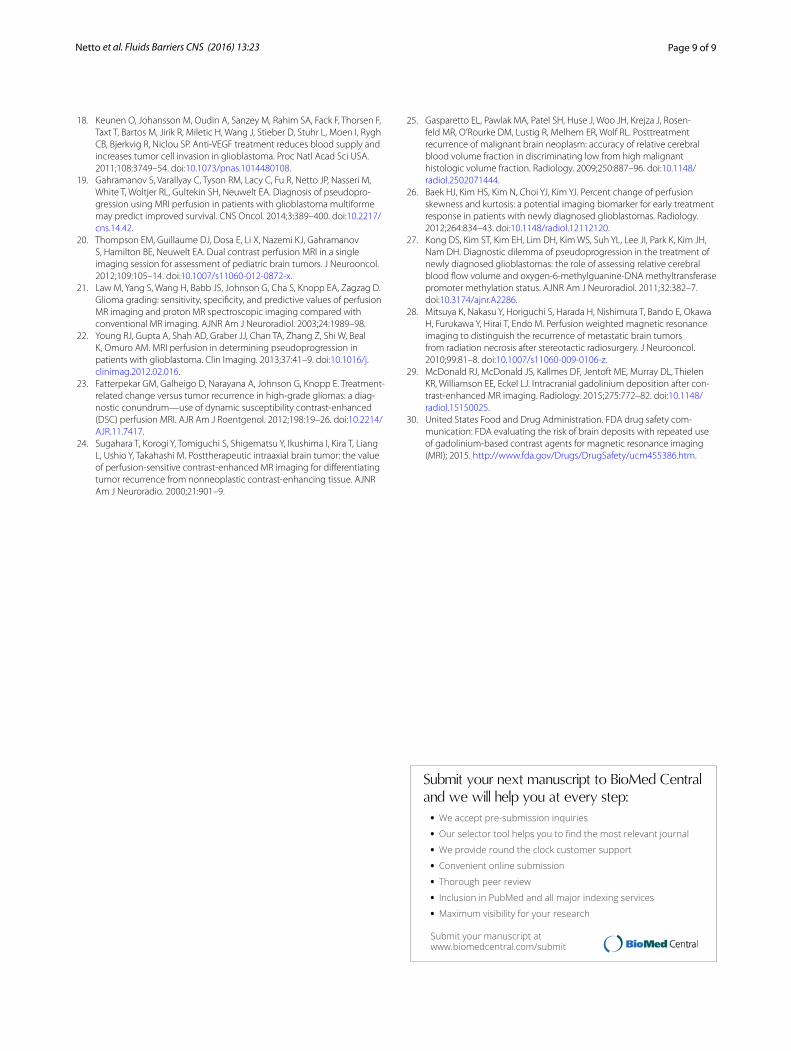
histogram in ROIpost vs. ROIpre demonstrated a signifi-cant increase in the mean proportion of hypoperfused voxels from 24% pre-BEV to 38% post-BEV (P = 0.0007), and a significant decrease in hyperperfused voxels from 39% pre-BEV to 28% post-BEV (P = 0.017, Fig. 5: gray vs. blue). Similarly, when the histogram of post-BEV rCBV was generated over ROIpre, the mean proportion of hypoperfused voxels increased to 41% from pre-BEV (P = 0.0001), and the mean proportion of hyperperfused voxels decreased to 26% (P = 0.006) (Fig. 5: gray vs. red).
DiscussionThis study used ferumoxytol to determine perfusion changes in patients with high grade glioma after treat-ment with bevacizumab. The results show that after treatment with anti-VEGF agent BEV there is a sig-nificant decrease in GBCA-enhancing volume, and a decrease in perfusion using ferumoxytol in the enhancing area of high grade gliomas after chemotherapy and radia-tion therapy but only when the pre-treatment enhancing regions of interest (ROIpre) were used. The use of pre-treatment enhancing regions of interest (ROIpre) over which to assess post-BEV perfusion maps increased sen-sitivity in all cases, suggesting that this method should be considered when quantifying blood volume changes after BEV. However, given the reduction in mass effect known to accompany BEV treatment it is possible that
tissue shift could account for the difference. In the his-togram analysis, it becomes clear that the decrease in the mean rCBV happens as expected due to BEV treatment, quantified by an increase in hypoperfused and a decrease in hyperperfused subvolumes. Nearly half of lesions changed from high rCBV before the BEV administration to low rCBV post-BEV. This is particularly important for cases in which perfusion MRI will be used to assess new or increasing enhanced areas for possible treatment.
Several publications describe the association between high CBV and tumor progression and low CBV and pseu-doprogression and treatment related changes [8, 22, 23]. The ideal cutoff value has been under intense debate [4, 6, 24, 25]. We use 1.75 as a threshold rCBV value at our institution given significant indications that using this threshold for planning subsequent treatment is cor-related well with overall survival [3]. Given that a sig-nificant percentage of lesions changed from high rCBV before the BEV administration to low rCBV after its infusion (44%), it is important to acquire perfusion MRI before the administration of BEV if rCBV will be used to determine whether a new or increased enhancing lesion represents true progression of disease or changes due to CRT. Other previously published threshold values range from 0.7 to 2.6; had they been utilized in this study, it is possible that the interpretation of the effects of bevaci-zumab on rCBV as it pertains to criteria for pseudopro-gression, may have been different [6, 24, 25]. Extreme threshold values, high or low, would have less impact as the majority of cases having values under or above the threshold before and after bevacizumab administration would increase, respectively.
The RANO treatment response evaluation criteria are based on clinical symptoms and conventional MRI (T1-weighted GBCA-based contrast volume enhancement) findings. Treatment related changes and the diagnos-tic challenge it represents are well known, including the impossibility of reliable evaluation with conventional MRI. A number of advanced imaging techniques have been studied including diffusion, spectroscopy, DCE and DSC perfusion MRI and nuclear medicine techniques, all with variable results. Our group has shown that cer-ebral blood volume measurements based on DSC perfu-sion, particularly in cases where a blood pool agent such as ferumoxytol is used, is a reliable method that can be used to differentiate between pseudoprogression and real tumor progression [3]. In 56% of the lesions, there was no significant change in the diagnosis and interpretation of the perfusion values. There are several possible alter-natives for this finding. If baseline rCBV was very high before bevacizumab administration and decreased after treatment, it is possible that rCBV values did not go below the threshold, maybe related to aggressive tumor
Fig. 1 GBCA-enhancing volume on T1-weighted MRI significantly decreased (P = 0.005) post-BEV

Page 5 of 9Netto et al. Fluids Barriers CNS (2016) 13:23
progression with some resistance to the effect of bevaci-zumab. A floor effect is also possible in areas of tumors that are poorly perfused; if rCBV values were already very low before bevacizumab administration, an eventual decrease in perfusion values will not change the diagno-sis of pseudoprogression.
Leakage correction is necessary for accurate quantifica-tion of perfusion MRI using GBCA; rCBV measurements using gadoteridol can adequately distinguish between
patients with treatment related changes versus true pro-gression only after leakage correction is applied [3]. The confounding effect of BEV and the infrequent use of leak-age correction may be two critical factors contributing to the inconsistency in the literature of using rCBV to determine disease progression status [4, 26–28]. Finally, relative perfusion values from ferumoxytol-based DSC in GBM clearly match those in recent reports, without the need for leakage correction or preload dosing as is
Fig. 2 GBM in 44 y/o male: GBCA enhancement on T1-weighted pre- (a, ROIpre) and post-BEV (d, ROIpost). rCBV maps derived from ferumoxytol DSC pre- (b) and post-BEV (e) overlaid on the enhancing volume. An overlay of the post-BEV rCBV map on ROIpre can be found in c. “Hot spot” regions are indicated by white arrows; note the marked decrease in rCBV between b and c

Page 6 of 9Netto et al. Fluids Barriers CNS (2016) 13:23
Fig. 3 Change in rCBV pre- and post-BEV for each of 21 lesions. A black line indicates a decrease in rCBV, red indicates a decrease in rCBV that passed the clinically relevant threshold of 1.75, and the remaining lesions are marked in gray. Values for the entire enhancing volume are shown in a and b. c and d depict hot spot changes. a and c depict the rCBV change between pre-BEV measured over ROIpre and post-BEV rCBV measured over ROIpost. b and d depict the rCBV change between pre-BEV measured in ROIpre and post-BEV rCBV in ROIpre
Page 7 of 9Netto et al. Fluids Barriers CNS (2016) 13:23
currently necessary for accurate assessment of tumor perfusion with GBCA [11].
Lastly, recent reports have showed clear region-specific long term deposition of gadolinium in the brain [29]. While it is not yet clear whether there are any adverse health effects of gadolinium accumulation, these reports are serious enough to warrant a FDA safety announce-ment [30]. Ferumoxytol does not extravasate from the blood pool into brain parenchyma nearly as readily as do most GBCAs used in clinical practice today. While the incidence of serious anaphylaxis risk is approximately 10 times higher using ferumoxytol compared to most
GBCAs, the absolute incidence of severe side effects remains small, approximately 1:10,000. Current evidence and experience indicates that ferumoxytol is a safe and available alternative for GBCA for assessment of tumor progression versus CRT-related changes.
Limitations of this report include the choice of a single slice method for pixel-wise histogram analyses. This tech-nique is based on the RANO criteria for assessment of brain tumor in the clinical practice and for clinical trials, but it is possible that important information was missed by not using the entire tumor. It is unlikely that results would change based on the location of the slice or the use of the entire tumor, and single slice measurements are the norm in clinical practice. In addition, it is difficult to pre-cisely control the relative timing of BEV, CRT, and MRI exams. While it is plain that the timing of these exams with respect to treatment phase can have profound effects on results, the cohort in this study was carefully chosen to have as narrow a window of timing variability as possible.
ConclusionsIn conclusion, due to blood volume reduction caused by BEV, the threshold of rCBV > 1.75, used to differentiate high rCBV from low rCBV after CRT, may be confounded early after BEV administration and thwart true diagnoses of vascular progression, true response, or treatment related changes. Ideally, pre-BEV measurements should be used and extreme care taken with clinical interpretation of per-fusion MRI results in any patients who have received BEV, even when using an intravascular agent such as ferumoxytol.
Fig. 4 Relationship between rCBV measurements and time interval to post-treatment MRI. Top hot spot rCBV measurements in ROIpost (filled) and ROIpre (open); y axis is % rCBV reduction, a negative value indicates rCBV increase. Bottom mean rCBV over the entire enhancing lesion. No significant relationships of rCBV with post-treatment MRI time intervals were found (all P > 0.1)
Fig. 5 Distribution of the averaged over all patients’ rCBV voxel values before administration of BEV (pre-BEV, gray), after it using the pre-BEV volume of enhancement (red, ROIpre) and post-BEV volume of enhancement (blue, ROIpost). There is a significant increase in the proportion of hypoperfused voxels (P = 0.008) and a significant decrease in hyperperfused voxels (P = 0.01) in both ROIs after BEV administration

Page 8 of 9Netto et al. Fluids Barriers CNS (2016) 13:23
AbbreviationsBEV: bevacizumab; CRT: chemoradiotherapy; DSC: dynamic susceptibility-weighted contrast; GBCA: gadolinium based contrast agent; GBM: glio-blastoma multiforme; FOV: field of view; IV: intravenous; JPN: author and experienced radiologist; MRI: magnetic resonance imaging; RANO: response assessment in neuro-oncology; rCBV: relative cerebral blood volume; ROI: region of interest; TE: echo time; TMZ: temozolomide; TR: repetition time; VEGF: vascular endothelial growth factor.
Authors’ contributionsJPN and DS equally contributed to the conception, design, and interpretation of the data, as well as drafting and revising the manuscript. CV assisted in the interpretation and drafting of the manuscript. RF assisted in analyzing the data and drafting the manuscript. BH assisted in the interpretation and drafting of the manuscript. EAN contributed to the conception and design of the study, as well as critically revising the manuscript. All authors read and approved the final manuscript.
Author details1 Department of Neurology, Oregon Health & Science University, 3181 SW Sam Jackson Park Road, Portland, OR 97239, USA. 2 Department of Neuroradiology, Oregon Health & Science University, 3181 SW Sam Jackson Park Road, Port-land, OR 97239, USA. 3 Advanced Imaging Research Center, Oregon Health & Science University, 3181 SW Sam Jackson Park Road, Portland, OR 97239, USA. 4 School of Public Health, Oregon Health & Science University, 3181 SW Sam Jackson Park Road, Portland, OR 97239, USA. 5 Emergency Medicine, Oregon Health & Science University, 3181 SW Sam Jackson Park Road, Portland, OR 97239, USA. 6 Department of Veterans Affairs Medical Center, 3710 SW U.S. Vet-erans Hospital Road, Portland, OR 97239, USA. 7 Department of Neurosurgery, Oregon Health & Science University, 3181 SW Sam Jackson Park Road, L603, Portland, OR 97239, USA.
AcknowledgementsThe authors thank Emily Youngers for editorial support. Material presented in this paper was previously presented as an abstract at the 2013 American Society for Neuroradiology Annual Meeting.
Competing interestsThe authors declare that they have no competing interests.
Availability of data and materialsThe datasets during and/or analyzed during the current study available from the corresponding author on reasonable request.
Ethics approval and consent to participateAll patients provided written informed consent on one of four prospective Oregon Health & Science University HIPAA-compliant and IRB-approved MRI protocols (2753, 2864, 1562, and 813) using two contrast agents, GBCA and ferumoxytol, between 2009 and 2012.
FundingThis work was supported in part by National Institute of Health Grants NS044687, and CA137488-15S1, in part with Federal funds from the National Cancer Institute, National Institutes of Health, under Contract No. HHSN261200800001E, and by the Walter S. and Lucienne Driskill Foundation, all to EAN.
Received: 7 November 2016 Accepted: 5 December 2016
References 1. Wen PY, Macdonald DR, Reardon DA, Cloughesy TF, Sorensen AG, Galanis
E, Degroot J, Wick W, Gilbert MR, Lassman AB, Tsien C, Mikkelsen T, Wong ET, Chamberlain MC, Stupp R, Lamborn KR, Vogelbaum MA, van den Bent MJ, Chang SM. Updated response assessment criteria for high-grade gliomas: response assessment in neuro-oncology working group. J Clin Oncol. 2010;28:1963–72. doi:10.1200/JCO.2009.26.3541.
2. Grobner T. Gadolinium—a specific trigger for the development of nephrogenic fibrosing dermopathy and nephrogenic systemic fibrosis? Nephrol Dial Transplant. 2006;21:1104–8. doi:10.1093/ndt/gfk062.
3. Gahramanov S, Muldoon LL, Varallyay CG, Li X, Kraemer DF, Fu R, Hamilton BE, Rooney WD, Neuwelt EA. Pseudoprogression of glioblas-toma after chemo- and radiation therapy: diagnosis by using dynamic susceptibility-weighted contrast-enhanced perfusion MR imaging with ferumoxytol versus gadoteridol and correlation with survival. Radiology. 2013;266:842–52. doi:10.1148/radiol.12111472.
4. Barajas RF Jr, Chang JS, Segal MR, Parsa AT, McDermott MW, Berger MS, Cha S. Differentiation of recurrent glioblastoma multiforme from radiation necrosis after external beam radiation therapy with dynamic susceptibility-weighted contrast-enhanced perfusion MR imaging. Radi-ology. 2009;253:486–96. doi:10.1148/radiol.2532090007.
5. Gerstner ER, Frosch MP, Batchelor TT. Diffusion magnetic resonance imag-ing detects pathologically confirmed, nonenhancing tumor progression in a patient with recurrent glioblastoma receiving bevacizumab. J Clin Oncol. 2010;28:e91–3. doi:10.1200/JCO.2009.25.0233.
6. Hu LS, Baxter LC, Smith KA, Feuerstein BG, Karis JP, Eschbacher JM, Coons SW, Nakaji P, Yeh RF, Debbins J, Heiserman JE. Relative cerebral blood volume values to differentiate high-grade glioma recurrence from post-treatment radiation effect: direct correlation between image-guided tissue histopathology and localized dynamic susceptibility-weighted contrast-enhanced perfusion MR imaging measurements. AJNR Am J Neuroradiol. 2009;30:552–8. doi:10.3174/ajnr.A1377.
7. Iv M, Telischak N, Feng D, Holdsworth SJ, Yeom KW, Daldrup-Link HE. Clinical applications of iron oxide nanoparticles for magnetic resonance imaging of brain tumors. Nanomedicine (Lond). 2015;10:993–1018. doi:10.2217/nnm.14.203.
8. Gahramanov S, Raslan AM, Muldoon LL, Hamilton BE, Rooney WD, Varallyay CG, Njus JM, Haluska M, Neuwelt EA. Potential for differentia-tion of pseudoprogression from true tumor progression with dynamic susceptibility-weighted contrast-enhanced magnetic resonance imaging using ferumoxytol vs. gadoteridol: a pilot study. Int J Radiat Oncol Biol Phys. 2011;79:514–23. doi:10.1016/j.ijrobp.2009.10.072.
9. Mukherji SK. Bevacizumab (Avastin). AJNR Am J Neuroradiol. 2010;31:235–6. doi:10.3174/ajnr.A1987.
10. Pope WB, Young JR, Ellingson BM. Advances in MRI assessment of gliomas and response to anti-VEGF therapy. Curr Neurol Neurosci Rep. 2011;11:336–44. doi:10.1007/s11910-011-0179-x.
11. Gahramanov S, Muldoon LL, Li X, Neuwelt EA. Improved perfusion MR imaging assessment of intracerebral tumor blood volume and antian-giogenic therapy efficacy in a rat model with ferumoxytol. Radiology. 2011;261:796–804. doi:10.1148/radiol.11103503.
12. Pishko GL, Muldoon LL, Pagel MA, Schwartz DL, Neuwelt EA. Vascular endothelial growth factor blockade alters magnetic resonance imaging biomarkers of vascular function and decreases barrier permeability in a rat model of lung cancer brain metastasis. Fluids Barriers CNS. 2015;12:5. doi:10.1186/2045-8118-12-5.
13. Stadlbauer A, Pichler P, Karl M, Brandner S, Lerch C, Renner B, Heinz G. Quantification of serial changes in cerebral blood volume and metabo-lism in patients with recurrent glioblastoma undergoing antiangiogenic therapy. Eur J Radiol. 2015;84:1128–36. doi:10.1016/j.ejrad.2015.02.025.
14. Sawlani RN, Raizer J, Horowitz SW, Shin W, Grimm SA, Chandler JP, Levy R, Getch C, Carroll TJ. Glioblastoma: a method for predicting response to antiangiogenic chemotherapy by using MR perfusion imaging—pilot study. Radiology. 2010;255:622–8. doi:10.1148/radiol.10091341.
15. Vidiri A, Pace A, Fabi A, Maschio M, Latagliata GM, Anelli V, Piludu F, Cara-pella CM, Giovinazzo G, Marzi S. Early perfusion changes in patients with recurrent high-grade brain tumor treated with Bevacizumab: preliminary results by a quantitative evaluation. J Exp Clin Cancer Res. 2012;31:33. doi:10.1186/1756-9966-31-33.
16. Ellingson BM, Cloughesy TF, Lai A, Nghiemphu PL, Mischel PS, Pope WB. Quantitative volumetric analysis of conventional MRI response in recur-rent glioblastoma treated with bevacizumab. Neuro Oncol. 2011;13:401–9. doi:10.1093/neuonc/noq206.
17. Mautner VF, Nguyen R, Knecht R, Bokemeyer C. Radiographic regression of vestibular schwannomas induced by bevacizumab treatment: sustain under continuous drug application and rebound after drug discontinua-tion. Ann Oncol. 2010;21:2294–5. doi:10.1093/annonc/mdq566.
Page 9 of 9Netto et al. Fluids Barriers CNS (2016) 13:23
• We accept pre-submission inquiries
• Our selector tool helps you to find the most relevant journal
• We provide round the clock customer support
• Convenient online submission
• Thorough peer review
• Inclusion in PubMed and all major indexing services
• Maximum visibility for your research
Submit your manuscript atwww.biomedcentral.com/submit
Submit your next manuscript to BioMed Central and we will help you at every step:
18. Keunen O, Johansson M, Oudin A, Sanzey M, Rahim SA, Fack F, Thorsen F, Taxt T, Bartos M, Jirik R, Miletic H, Wang J, Stieber D, Stuhr L, Moen I, Rygh CB, Bjerkvig R, Niclou SP. Anti-VEGF treatment reduces blood supply and increases tumor cell invasion in glioblastoma. Proc Natl Acad Sci USA. 2011;108:3749–54. doi:10.1073/pnas.1014480108.
19. Gahramanov S, Varallyay C, Tyson RM, Lacy C, Fu R, Netto JP, Nasseri M, White T, Woltjer RL, Gultekin SH, Neuwelt EA. Diagnosis of pseudopro-gression using MRI perfusion in patients with glioblastoma multiforme may predict improved survival. CNS Oncol. 2014;3:389–400. doi:10.2217/cns.14.42.
20. Thompson EM, Guillaume DJ, Dosa E, Li X, Nazemi KJ, Gahramanov S, Hamilton BE, Neuwelt EA. Dual contrast perfusion MRI in a single imaging session for assessment of pediatric brain tumors. J Neurooncol. 2012;109:105–14. doi:10.1007/s11060-012-0872-x.
21. Law M, Yang S, Wang H, Babb JS, Johnson G, Cha S, Knopp EA, Zagzag D. Glioma grading: sensitivity, specificity, and predictive values of perfusion MR imaging and proton MR spectroscopic imaging compared with conventional MR imaging. AJNR Am J Neuroradiol. 2003;24:1989–98.
22. Young RJ, Gupta A, Shah AD, Graber JJ, Chan TA, Zhang Z, Shi W, Beal K, Omuro AM. MRI perfusion in determining pseudoprogression in patients with glioblastoma. Clin Imaging. 2013;37:41–9. doi:10.1016/j.clinimag.2012.02.016.
23. Fatterpekar GM, Galheigo D, Narayana A, Johnson G, Knopp E. Treatment-related change versus tumor recurrence in high-grade gliomas: a diag-nostic conundrum—use of dynamic susceptibility contrast-enhanced (DSC) perfusion MRI. AJR Am J Roentgenol. 2012;198:19–26. doi:10.2214/AJR.11.7417.
24. Sugahara T, Korogi Y, Tomiguchi S, Shigematsu Y, Ikushima I, Kira T, Liang L, Ushio Y, Takahashi M. Posttherapeutic intraaxial brain tumor: the value of perfusion-sensitive contrast-enhanced MR imaging for differentiating tumor recurrence from nonneoplastic contrast-enhancing tissue. AJNR Am J Neuroradio. 2000;21:901–9.
25. Gasparetto EL, Pawlak MA, Patel SH, Huse J, Woo JH, Krejza J, Rosen-feld MR, O’Rourke DM, Lustig R, Melhem ER, Wolf RL. Posttreatment recurrence of malignant brain neoplasm: accuracy of relative cerebral blood volume fraction in discriminating low from high malignant histologic volume fraction. Radiology. 2009;250:887–96. doi:10.1148/radiol.2502071444.
26. Baek HJ, Kim HS, Kim N, Choi YJ, Kim YJ. Percent change of perfusion skewness and kurtosis: a potential imaging biomarker for early treatment response in patients with newly diagnosed glioblastomas. Radiology. 2012;264:834–43. doi:10.1148/radiol.12112120.
27. Kong DS, Kim ST, Kim EH, Lim DH, Kim WS, Suh YL, Lee JI, Park K, Kim JH, Nam DH. Diagnostic dilemma of pseudoprogression in the treatment of newly diagnosed glioblastomas: the role of assessing relative cerebral blood flow volume and oxygen-6-methylguanine-DNA methyltransferase promoter methylation status. AJNR Am J Neuroradiol. 2011;32:382–7. doi:10.3174/ajnr.A2286.
28. Mitsuya K, Nakasu Y, Horiguchi S, Harada H, Nishimura T, Bando E, Okawa H, Furukawa Y, Hirai T, Endo M. Perfusion weighted magnetic resonance imaging to distinguish the recurrence of metastatic brain tumors from radiation necrosis after stereotactic radiosurgery. J Neurooncol. 2010;99:81–8. doi:10.1007/s11060-009-0106-z.
29. McDonald RJ, McDonald JS, Kallmes DF, Jentoft ME, Murray DL, Thielen KR, Williamson EE, Eckel LJ. Intracranial gadolinium deposition after con-trast-enhanced MR imaging. Radiology. 2015;275:772–82. doi:10.1148/radiol.15150025.
30. United States Food and Drug Administration. FDA drug safety com-munication: FDA evaluating the risk of brain deposits with repeated use of gadolinium-based contrast agents for magnetic resonance imaging (MRI); 2015. http://www.fda.gov/Drugs/DrugSafety/ucm455386.htm.