Mise en page 1 - IPEMED · Methodology and growth scenario ... Emerging demographic patterns across...
151
B U I L D I N G T H E M E D I T E R R A N E A N B U I L D I N G T H E M E D I T E R R A N E A N growth ~ employment ~ migration ~ energy ~ agriculture Tomorrow, coordinated by cécile jolly and produced with the “mediterranean 2030” consortium Scenarios and projections for 2030 the Mediterranean
Transcript of Mise en page 1 - IPEMED · Methodology and growth scenario ... Emerging demographic patterns across...
B U I L D I N G T H E M E D I T E R R A N E A NB U I L D I N G T H E M E D I T E R R A N E A N
growth ~employment ~migration ~energy ~agriculture
Tomorrow,
coordinated by cécile jolly
and produced with the “mediterranean 2030” consortium
Scenarios and projections for 2030
the Mediterranean

3
in 2009, ipemed has undertaken, in partnership with specialisedEuro-Mediterranean organisations (carim, ciheam, femise, ome)an extensive foresight project whose aim is to rally, within the“Mediterranean 2030” consortium, institutional and private-sectorforesight bodies in the Mediterranean region (Commissariatfor planning from Morocco, Algeria and Turkey, Centre d’AnalyseStratégique, Institut Europeu de la Mediterrània, Mauritanian policyanalysis Centre, University observatory of socio-economic realityof Lebanon, Albanian Council on foreign relations, Ministryof foreign affairs of Croatia and Mauritania, etc.) to the taskof building a common vision of the Mediterranean in 2030.
This foresight project has two objectives:• Firstly, a scientific and economic objective: elaborate joint, region-wide diagnostics and projections in the fields of energy, agriculture,water and the environment, population and migration and foreigndirect investment. This would be done in collaboration withspecialised Euro-Mediterranean organisations and with the foresightbodies of the Mediterranean countries;• Secondly, and more importantly, a political and pedagogicalobjective: to foster and encourage long-term cooperation betweenofficials responsible for foresight, to disseminate foresightmethodology throughout the Mediterranean region and to be a toolfor decision making.
The works of the consortium are animated and coordinatedby Cécile Jolly, analyst at the Centre d’Analyse Stratégiqueand Macarena Nuño, project officer at ipemed.
mediterranean 2030
A foresight project for the Mediterranean region

4
TABLES AND GRAPHS .......................................................................... 6
summary
The Mediterranean in 2030: routes to a better future ..................................................................... 9
1. Synergies for a Mediterranean vision ......................................... 11
2. Taking up common challenges ................................................... 15
3. Mediterranean future threatened by marginalizationor divergence ................................................................................ 18
4. What can be done to encourage Mediterranean convergence?................................................................................. 32
Growth scenarios for the Mediterranean in 2030........................................................................................... 35
Cécile Jolly
1. Methodology and growth scenario.............................................. 35
2. Three pictures of a possible future ............................................. 40
Employment perspectives in the Mediterranean ............................................................ 49
Frédéric Blanc
1. A tense demographic context and a weak activity rate .............. 50
2. The employment content of growth and the dualityof labour markets ......................................................................... 54
3. The necessary matching of training and skills to the needs of the economy........................................................ 56
4. Employment trends and possible scenarios............................... 58
T A B L E O F C O N T E N T S

5
foresight
Migratory flows and demographic transition. Long term evolution and future scenarios .............. 69
Philippe Fargues, Giambattista Salinari
1. Emerging demographic patterns across the Mediterranean ....... 70
2. Forecasting Mediterranean migration ........................................ 84
Energy perspectives in the Mediterranean. Challenges and stakes for 2030 .....................................109
Dr. Houda Ben Jannet Allal
1. A global challenge at the heart of development issues ............ 110
2. Energy, the environment and cooperation: a recent field of reflection with a new global focusl .................. 110
3. Energy perspectives: rising energy demand and increased risks....................................................................... 113
Food security and agriculture in theMediterranean. Crisis scenario and prospects for 2030......................................................................................... 119
Vincent Dollé
1. Common features of the Mediterranean countries ................... 121
2. Possible scenarios for the future ................................................ 135
3. Towards a new common agricultural policy .............................. 144
4. The European Neighbourhood Policy: an enhanced cooperation for the convergence of health standards ...............146
5. The co-development scenario...................................................... 148
6. The Mediterranean spring and food safety: new opportunities?....................................................................... 153

6
1 Growth rate of labour productivityin Euromed countries (1980-2030)
2 Demographic indicators of labourmarkets in 2007
3 Activity in 2007 in South Mediterraneancountries, Europe and the Balkans
4 Population aged 15 years and over inEuromed countries and the Balkans(2000-2030)
5 Evolution of the population by age group(2007-2030)
6 Employment trends for SouthMediterranean countries (2007-2030)
7 Employment trends for EU27 (2007-2030)
8 Employment trends for the Balkans (2007-2030)
9 “Mediterranean divergences” scenario –employment
10 “Crisis in the Mediterranean region”scenario – employment
11 “Mediterranean convergence” scenario – employment
12 Migrants originating from selected MENAcountries by groups of countriesof residence
13 Regular and irregular immigrantsin Southern and Eastern Mediterraneancountries
14 Year of maximum numbers at 20-25
15 Demographic dynamics of MENAand EU labour markets (2005-2030)
16 Year when the ratio [old persons/youngadults] passes over 0.33
17 Wish to emigrate among Tunisian youth(1996-2005)
18 Geographical classification of the Euro-Mediterranean region
19 List of political shocks
20 Regression analysis: Net migration ratesin the Euro-Mediterranean Region (1965-2010)
21 Progress of energy consumptionper inhabitant in the Mediterraneanup to 2030
22 Progress in CO2 emissions per inhabitantin the Mediterranean region up to 2030
23 Energy intensity in the Mediterraneanin 2030
24 Carbon intensity in 2030
1 GDP Growth in the Mediterranean regionfor the three scenarios
2 GDP Growth in South and EastMediterranean countries for the threescenarios
3 GDP Growth in Balkan states and EasternEurope for the three scenarios
4 GDP growth in EU15 for the threescenarios
5 Reference scenario, continuation of pasttrends and IMF forecast for 2015.Per capita GDP (2009-2030)
6 “Mediterranean divergences” scenario.GDP per capita (2009-2030)
T A B L E S
G R A P H S
T A B L E S A N D G R A P H S

7
foresight
7 “Crisis in the Mediterranean region”scenario. GDP per capita (2009-2030)
8 “Mediterranean convergence” scenario.GDP per capita (2009-2030)
9 Working age population in the MENAand EU27 (2000-2030)
10 New entrants on the labour marketand total working age population
11 The demographic dividend in the MENAregion
12 Relationship between net migration rateand tertiary education, urban growth,GDP per capita and proportion of urbanpopulation (1950-2010)
13 Relationship between net migration rateand past migrant stock, density,rate of natural increase and median age(1950-2010)
14 Prediction of net migration ratesin Mediterranean Europe (1965-2030)
15 Prediction of net migration ratesin the Balkans (1965-2030)
16 Prediction of net migration ratesin the Machrek (1965-2030)
17 Prediction of the net migration ratesin the Maghreb (1965-2030)
18 Counterfactual analysis for Maghreb(1965-2030)
19 Counterfactual analysis for Egyptand Morocco (1965-2030)
20 Counterfactual analysis forMediterranean Europe (1965-2030)
21 Primary energy demand in theMediterra nean by source (2009)
22 Primary energy demand inthe Mediterra nean by source and region(2009)
23 Progress of primary energy demandin the Mediterranean up to 2030
24 Progress of primary energy demandin NMCs up to 2030
25 Progress of primary energy demandin SEMCs up to 2030
26 Progress in CO2 emissions in the regionfor the three scenarios
27 Progress in CO2 emissions forthe convergence scenario
28 Cities and agglomerations inthe Mediterranean region (2006)
29 Agricultural workers in theMediterranean region (2004)
30 Rural population in the Mediterraneanregion (2005)
31 Total and rural unemploymentin the Mediterranean
32 Part of the agriculture sector in GDPin Mediterranean countries
33 Arable land per inhabitant in theMediterranean (1961-2003) and net lossin arable land (between 1980-2005)
34 Index of exploitation of renewablenatural water resources in theMediterranean region (2005, 2025)
35 Evolution of agricultural trade balancesof the SEMC
36 The 3 diet types in the Mediterraneancompared with Cretan diet (2003)
37 Indicator of food quality (1960-2000)
38 Obesity and overweight inthe Mediterranean (2009)
39 Prices of wheat on the futures market
40 Crude oil price
41 FAO Index for food prices
42 Food commodity price index (2010)
43 The path of CAP reform and CAPexpenditure
44 PDO, PGI and TSG quality productsin the Northern countries (2009)
45 Organic agriculture and quality productsin the Mediterranean region

9
the mediterranean in 2030:routes to a better future
the mediterranean basin has developed a fabric of economic, poli-tical and human relations that lend it a definite regional dimension. Theraid of the Arabic revolts came to remind that this dynamics could alsotake the shape of a political convergence. Structurally nevertheless, theMediterranean integration is highly varied, depending on the country orsub-region concerned. The European Union plays a central role for allMediterranean countries, which might be members or future members,or have established agreements and privileged economic relationshipswith it. Although Latin Europe, the Adriatic countries (Western Bal-kans), the Middle East and the Maghreb display geographical continuity,from an economic, institutional and socio-cultural point of view, theirheterogeneity is obvious. The Mediterranean is in progress and is theobject of political and private investment. The motivation behind suchinvestment might be grounded in economics, politics, citizenship,society, ecology or culture, depending on countries and their inhabi-tants. But these initiatives all tend to weave closer what history has doneand undone, to accelerate the income dynamics of the region and tospeed up its global ranking as compared to world economic giants.
This region is subjected to strong uncertainties on its future, whetherit is national or collective: the deepest crisis that Europe has ever knownsince the 1930s reaches today not only the springs of its recovery butquestions its own construction (in particular the economic governanceof the Euro zone). This economic and institutional crisis also affects thecountries of the Adriatic promised to an integration that the communityuncertainties and the starts of the Greek crisis handicap. The Arabicrevolts engage a powerful reforming impulse but pull countries into aphase of inevitably long transition which does not exclude backlashes or

10
plunging certain States into a phase of reaction with impacts in termsof stability and economic growth to more or less short term.
Finally, naturally, the regional integration suffers itself from theseuncertainties : uncertainty regarding the growth of the leading econo-mic partner in the region – the European Union; uncertainty regardingthe extent of economic and political reforms in both North and South;uncertainty about whether States bordering the Mediterranean are wil-ling to have a common destiny, with Europe struggling to preserve itsformer solidarity and force of attraction, and Arab solidarity regaininga certain force thanks to its democratic aspirations and its position at thecentre of international, and not just Euro-Mediterranean, attention.Although the spotlight is currently on the turbulence upsetting the Euro-pean Union and the Arab Mediterranean, one way of reducing uncer-tainty is to get back to the structural trends and envisage the upshots ofEuro-Mediterranean growth and long-term regional integration.
At first sight, the diagnosis is not particularly favourable to Mediter-ranean integration. Income convergence between countries in the Medi-terranean basin is not significant. Exchanges of goods and capital havemade less progress within the region than with other global trade zones(e.g. emerging countries). The growth of investment flows coming fromthe Gulf States has strongly influenced the Mediterranean Arab coun-tries towards developing real estate, telecommunications and, to a les-ser extent, financial services. The diversification of exchanges of goodsand capital could represent an opportunity if it was accompanied by arise in both quality and technology, resulting in productivity gains thatencourage growth and employment. It is undeniable that the centrifu-gal dynamics of Europe have not led to a major investment flow (foreigndirect invertments stagnate at around 2%) sparking off significant tech-nological transfers, nor to industrial joint processing comparable to thatorganized with Eastern European countries or within emerging Asia.
Southern and Eastern Mediterranean economies have taken advan-tage of past dynamics of global growth drawn by emerging countries.Yet, the growth of Southern and Eastern Mediterranean countries (semc)remains low in comparison with that of the world’s most dynamic geo-graphical areas. Europe’s demographic slowdown and weak productivitygains mean that it has entered into a low-level zone. In 2030, India andChina’s combined population will be 3 billion, representing 25% of glo-bal gdp, compared with 12% today and only 3% in 1990. This shift inthe world economy brings with it brand-new market opportunities as

11
i – foresight – summary
well as the possibility of global income convergence and an exit frompoverty. But it also brings the risk of marginalizing the least dynamicregions. The Mediterranean region could thus be confronted with a wea-kening of its capacity to influence international regulations that will affectits future as economies continue to look outwards. China and America’shandling of an exit from the crisis indicates a move away from multipo-larity. This domination of States continents and emerging markets couldhave the effect of imposing a more unequal and less protective socialmodel on the Mediterranean region, in the race to be the most attractive.The consequence would be to maintain low work conditions in the Southand accentuate labour market duality and fears of outsourcing in theNorth. Although emerging countries’ economic power will equal that ofadvanced countries by 2030, income per inhabitant will not experiencethe same progression: they will be rich as a whole, but individually poor,thus increasing the global workforce competition.
1. Synergies for a Mediterranean vision
yet, there are clear regional complementary features. First ofall, the Mediterranean region is a place where individuals’ collective pre-ferences converge, due to the high level of migration, and where the cir-culation of ideas and people goes hand in hand with more homogenouslifestyles and aspirations. In the last twenty years, this convergence hasmanifested itself in different ways, most obviously in southern and eas-tern Mediterranean shores. The rise of individualism has modified therelationship to others leading to a less emphasis on the extended familyand a mistrust of institutions, which are victims of the same disaffilia-tion as in Europe. Fertility patterns are close to those in Europe and aspi-rations to freedom and well-being are translated by a desire to emigrate,most radically amongst the young. This convergence of aspirationsbecomes today famous in the demands stemming from Arabic revoltsof a bigger freedom of expression and participation but also from a moreequalitarian distribution of the benefits of growth. This way, the Arabicrevolts question the idea of a shock of civilizations (S. Huntington) aswell as the forms of votecatching and paternalism which have alwaysprevailed. In the future, one of the major stakes lies in the capacity of thereformed regimes, whether they are revolutionary or not, to increaseparticipation in the economic and political system and to organize the

12
circulation of elites by the establishment of political competition. It alsolies in the capacity of Europe to accompany this movement by basing iton real convergences and in the respect of differences. Because the Ara-bic revolutions also show a reconciliation of peoples with their aspira-tions, a request of dignity (this Arabic word of karama was on all thelips from Tunisia to Egypt or Libya) which does not go without a legiti-mate pride and the demand of a fairer treatment, including by the Euro-pean partners. In Europe, this major transformation imposes not onlyto strengthen the partnership dimension of the policy implemented inthe region but also to respect even more the cultural differences. Just asEurope has built a nation from nations, the Mediterranean should bebuilt on its cultures and be a “rendez-vous” of civilisations(1).
Correlatively, there is a demographic synergy between an ageingEurope, facing a probable drop in workforce numbers affecting poten-tial growth, and the South and East Mediterranean countries wherehigh numbers of more qualified young people are entering the jobmarket due to the investment done in education (by 2030, between20% and 60% of the population of many countries will have beeneducated to secondary level or above). In 2030, 40% of the potentialworkforce will be on the East and South shores of the Mediterraneanand 60% in Europe (including the Western Balkans), compared with30% and 70% today. In the future, the politically viable count unit willbe one billion inhabitants. The EU27 with its current boundary willstagnate around 500 million. The Euro-Mediterranean region wouldhelp approach this target.
Although in the future there will be a larger workforce in the South,work dynamics remain uncertain. Maintaining the current rate of jobcreation in Europe (1.3%) would result in a workforce deficit of 40 mil-lion by 2030, even if working lives are extended. Symmetrically, main-taining rates of job creation in semc (2%) will not be sufficient in 2030to substantially reduce unemployment rates and “formal” inactivity,which are both high in the region (including a significant economicshare of informal “subsistence” work). Although additions from oneside will not automatically make up for lacks on the other side, due toboth compartmentalized labour markets and restrictive migration poli-cies, two factors argue for greater mobility within the region: (i) it couldcompensate for the weaknesses of intra-European mobility and make upsectorial labour deficits (caring professions, hotels and catering,
(1) Le rendez-vous des civilisations, Y. Courtage, E. Todd (2007).

13
i – foresight – summary
construction work); (ii) it could strengthen qualification levels of workersfrom the South and the Balkans and their capacity to adapt to the needsof the economy, and encourage more circular migration to the detri-ment of “permanent” migration and brain drain.
The synergies of natural resources also make the case for greaterregional integration. Such synergy is obviously energy-related, not justbecause of fossil energy, but more especially due to the natural availa-bility of renewable resources in semc (e.g. solar potential is signifiant,wind speed in the South ranges from 6 to 11 m/s). It could also be agri-culture-based: Europe being more crop- and meat-centred, with relati-vely abundant arable land and water resources but with now marginalagricultural employment, and the South maintaining high rural workfigures but with Mediterranean production threatened by water stress,rampant urbanization and the impact of climate change. Paradoxically,although the Mediterranean diet is esteemed in Europe, cereal cropsare the mainstay of consumption in the South and East Mediterranean.Complementarities between consumption and natural resources willbe reinforced in 2030: in the South by a population and income growthincreasing its cereal consumption and in the North by a concern for diet(obesity), which will move food choices towards fruit and vegetables.Once again, the resources of some countries will not automatically ful-fil the requirements of others in a global market where emerging powersfuel the market and attempt to get hold of increasingly scarce naturalresources.
These synergies should not be limited to asymmetrical comple-mentary trade, the South being a supplier of natural resources and pri-mary goods with low added value and the North providing sophisticated,more expensive goods. “Natural” resources are themselves not onlysources of “malediction” but also tend to become scarcer, whichincreases their comparative short-term benefits and imposes a transitionthat shall already be largely underway by 2030. Whatever the availabi-lity of natural resources, which varies greatly from country to country,supply logic should be replaced by an efficient demand logic. This istrue for energy and the environment, where the solution to scarcerresources (water and energy) and environmental security depends justas much, if not more, on the “savings” that can be made (e.g. lowerenergy intensity, water supply management), than it does on technolo-gical progress and fossil fuel alternatives. Regarding agriculture, pur-suing a supply logic would lead to the disappearance of food-producing
14
farming and reveal difficult rural, social and environmental challenges.In the North, it would tend towards intensive farming, which is detri-mental to employment, rural development and ecological balance.
Moving from a supply logic to a demand logic involves encouragingthe creation of solvent markets rather than maintaining the economiescatching up with Europe in a demeaning sub-contracting role diffe-rentiated only by wage levels. Instead of transforming such countriesinto low-cost platforms intended for the common market (a role alreadyfulfilled by Turkey and Croatia and to a lesser extent the Maghreb), theemphasis should be on proximity, which guarantees quality (particu-larly for health and the environment), and responsiveness. The risingtrend of transportation costs in the mid-term (insufficient oil substi-tutes) and their environmental impact, the chronic resurgence ofhealth-related incidents linked to importing low-cost goods, the increa-sed variability of demand and the convergence of consumption pat-terns on both sides of the Mediterranean all confirm this hypothesis.The decision to tighten up location choices on a regional basis couldlead to the progressive reduction of differences in salary and workconditions. Greater mobility of labour would be an additional factor inthe tendency to curb wage inequality, reinforcing the social acceptabi-lity of Mediterranean offshoring and outsourcing.
In this context, renewal of the regional production organization shallalso involve services, which all countries can provide. This not onlymeans promoting each country’s comparative advantages – with Europespecializing in services with high added value, and South and East Medi-terranean countries specializing in service support (e.g. tourism, trans-port and telecommunications with a slight progression in medical andfinancial services) – it also involves increasingly synergies betweengoods and services, leading to more deep-rooted and harmonious regio-nal integration. There are no services without goods, as illustrated bythe boom in mobile phone industry (physical goods and related ser-vices). In the same way, transport and distribution services go hand inhand with food and energy industries. Services add the highest levels ofvalue to mass-produced goods, produced cheaply in different placesround the world. In addition, the exchange of services fosters the har-monisation of standards that, along with multilateral trade liberaliza-tion, are the first obstacles to trade. Services impose the circulation of

15
i – foresight – summary
people, through the provision of services or freedom of establishment,thus promoting the convergence of skills and wages. In the long term,they will allow a development less focus on possessing physical goodsand allowing a lower consumption of natural resources.
2. Taking up common challenges
the mediterranean economies are confronted with a political andsocial crisis of an unequalled scale, on the background of protest againstthe crisis of austerity imposed on European populations, and of a revo-lution in the Arab countries where the populations are opposed as muchto the political authoritarianism as to the unequal redistribution of thewealth. The European solidarity is worsened by the extent of the crisis ofthe debts of certain countries, questioning the community capacity toadopt a coordinated answer and cracking the community consensus. Thehypothesis of an explosion of the Euro zone, henceforth evoked, bring upthe spectre of the division and marginalization of certain nations. But, atthe same time, the very strong interdependence of the European econo-mies, could, on the contrary, push to a deepening of the European inte-gration that has been slowed down since the last enlargements. On theother shore of the Mediterranean, the Arabic world is in the grip of apowerful movement of revolt which reaches even the Israeli shore. If thecontagion effect is a fact, implying reforms even in the countries whichdid not overthrow their leaders, following the example of Morocco, thelong-term impact of these transitions is uncertain. They can lead to amiddle-term instability, either that the revolutions and the reforms comealong with starts, or that the repression plunges certain countries into apotential long-lasting internal confrontation, as in Syria. They may alsomodify only marginally the political and economic balances, maintainingthe acquired advantages without promoting a real traffic of elites. On thecontrary, they can encourage a tremendous movement of reform allo-wing the emergence of new economic and political elite, releasing theproductive energies and making participate a largest number of peoplein a new dynamics of growth, on the Turkish model.
The similarity of the slogans between the Tunisian, Madrid andIsraeli streets shows that a certain continuum exists between the peoplesof this region and that their fate is not impervious. The solutions to the

16
challenges faced by the countries of the region are partially commonand could be better solved if envisaged in a more partnership way.
First of all, and it is one of the major impulses of the Arab revolts,Mediterranean economies do not create enough jobs. South and EastMediterranean rentier economies’ low employment performances canbe explained by their tendency towards weak entrepreneurship andinnovation, the public sector’s predominance over the private one andthe importance of the informal sector (from 20 to 30% of non-agricul-tural gdp in Algeria, Morocco and Egypt, according to the oecd). InEurope, just as it is catching up the technological gap with the UnitedStates, the working population has dropped to an extent that cannot bemade up by investment alone. Overall, productivity gains will be cru-cial to future growth, both in the North and the South. These producti-vity gains will be achieved through three fundamental factors: a distinctimprovement in human capital (in the South) and a better easiness ofmovement for the workforce, a rationalized organization of productionand improved performances in technology and innovation. In thesethree domains, the bases of existing cooperation would be worth rein-forcing, thus accelerating the transfer of technology and know-how.
Mediterranean economies must also adapt to greater energy restraintand the preservation of natural resources. For hydrocarbon-producingeconomies, this will involve thinking beyond oil (apart from Libya, oiland gas production should peak in 2020-2025). Importing countriesshould reduce the constraints linked to the important weight of theenergy in their growth. All should rather decrease their energy intensityand favour an environment – friendlier economy. If nothing is done,even taking into account the progress made and current projects fordeveloping renewable energy sources, energy demand in the South andEast will be enough to cancel out efforts made in Europe to fight cli-mate change. Although the effects of climate change are set to be moresevere in the Mediterranean than in the world as a whole, countries inNorth Africa, the Middle East and the Adriatic will have less means toprotect themselves (income effect), even though they have contributedlittle to global warming (their greenhouse gas emissions, althoughrising, are well below European averages). These negative effects willadd to the already difficult agroclimatic conditions in South and EastMediterranean (pressure on water resources of over 100% according toPlan Bleu, use of farming land of over 80% by 2030 according to thefao, urbanization will have rise by 60% according to the United Nations

17
i – foresight – summary
at this horizon). In this context, a more sustainable development callsfor the transfer of mainly European technologies and skills to promoteeco-activities and the rationalized use of natural resources. Ecotechno-logies are today’s market opportunities and they could find a foothold inthe Mediterranean, particularly in countries that need to create new ins-tallations rather than upgrade old ones. Their cost, often still higherthan that of less sober technologies, will need public incentives, possi-bly involving a regional “sharing” of funding with the aim of establi-shing a kind of environmental equity.
In addition to the predicted worsening of agroclimatic conditions inthe Mediterranean, the 2008 food crisis put the focus on agricultureand rural life issues. The Arabic revolts, and in particular the Tunisianrevolution, came to remind the territorial disparities of developmentwhich affect essentially the rural areas. In this context, States have torethink agricultural policies and food security, to try to regulate tradeand secure supplies. The halt of rural densification South and East of theMediterranean in 2015 and the reform of the European cap by 2013should constitute ideal opportunities for reorganizing farming within aEuro-Mediterranean framework. This would include ensuring foodsafety for inhabitants, strengthening agricultural systems that producelocal jobs and revenues, and organizing intensive farming to respectthe environment. Quality management could prevail over quantitymanagement, with labelling for Mediterranean products, highlightingthe “services” they provide in terms of health, nutritional and environ-mental quality, proximity and culture. This kind of development wouldlead to more added value for Mediterranean production and accelerateNorth/South investment in agriculture, the professionalization of dif-ferent types of production and improve farmers’ qualifications. Thismore “Mediterranean” orientation for agricultural policy could be com-pensated by a contribution from cereal production to set up a form ofmarket price stability and a supply guarantee by constituting securitystocks and setting up a North-South agreement.
The last challenge is that “Mediterranean” migration is set to conti-nue in the short and medium term but they will ease in the longer term(at the end of our foresight in 2030). In the next twenty years, factorsencouraging migration from semc and the Balkans will remain (e.g.demographic and income differences between the two shores, economicemergence which encourages the migration of middle classes who risklosing status, political crises) but certain facts du to a premature demo-

18
graphic transition (Tunisia, Turkey) or an already finished one (Croatia,Serbia) will go to the sense of a “migratory transition” and a weakeningof emigration on behalf of mobility. In the North of the Mediterranean,the attractive factors of migration will also persist (demographic slow-down, labour shortage in Europe, income growth and the desire toattract highly qualified workers) and they will become more marked inthe South, that will become ground of immigration because of theincrease of its standard of living and a slowing down of growth of itsworking population. At the same time, the nature of migratory flowswill have evolved: Mediterranean migrants will become more educatedthan in the past, with migration perceived as only part of a process toincrease skills and qualifications (experience, acquisition of diplomas),involving return trips. This type of “qualification-based” migration willonly be easier if some preconditions are guaranteed regarding the trans-portability of rights and the recognition of qualifications. On this condi-tion, a policy of Mediterranean mobility could value a migratory poten-tial without degrading the situation of the countries of departure (braindrain). It would anticipate a long-term evolution where the countries ofSouth and East Mediterranean will progressively reduce their contribu-tion of low qualified workers to become receivers of migrants comingfrom their nearness, as showed by the Libyan exodus in Tunisia.
3. Mediterranean future threatened by marginalizationor divergence
nevertheless, these complementarities and long-term challengeslet remain many uncertainties, on the rhythm of the anticipated evolu-tions, on the role of the regional integration and on the political volun-tarism to face it. To limit these political, economic and social uncer-tainties, three scenarios have been elaborated, among which the impactson growth, employment, migrations, energy and agriculture have beenanalyzed and quantified. The first scenario continuous the past trendsof ill-assorted insertion of the countries of the region in a world eco-nomy pulled by emergent countries, stressed by strategies of competi-tive deflation (wage restraint and restrictive monetary policies) and by asuccessful political transition in countries already in a catching-up pro-cess with Europe. The second scenario envisages a deepening of theeconomic crisis of Latin Europe and a transition struck in the Arabic

19
i – foresight – summary
Mediterranean area, leading to a slowing down of Latin Europe andNorth Africa and a blocking of institutional answers. The third scenario,a proactive and soundly cooperative one, feigns the partial extension ofthe mechanisms of European solidarity to the whole Mediterraneanbasin, authorizing unprecedented dynamics of convergence in theregion.
These scenarios try to describe likely and differentiated evolutions,without drawing a scenario of a Mediterranean total unhooking or fullconvergence. The heterogeneousness of the countries of the region somuch in their productive specializations, their demographic context,their political evolution or their institutional anchoring seem to goagainst a totally coherent dynamic. The variations of growth in the dif-ferent scenarios have been maintained in a “reasonable” range (GRAPH I).
“Mediterranean divergences” scenario: disparate insertion in the world economy
A continuation of past trends (European growth rates under 2%per year, close to 3-4% in South and East of the Mediterranean and inthe Balkans) would not be conducive to Mediterranean convergence. Theupset in the world economy’s dynamics in benefit of Asia could producean accentuation of divergences, with winners and losers at national andregional level. In this scenario, growth, drawn by emerging countries,will reinforce competition to the detriment of purchasing power anddomestic demand. Because of international competition, countries areunder pressure to reduce their internal costs in order to restore economiccompetitiveness through a combination of tight monetary policy andwage restraint. The industrial specializations of the Western Balkans andthe South Mediterranean will approach those of Eastern European coun-tries, turning them into a new low-cost platform for the European Com-munity and providing emerging countries with a good position for pene-trating the EU market. World economy’s dynamics, more than
GRAPH I
GDP growth rate in the three scenarios (2010-2030)
EU-27 SEMC Balkans6 %
5 %
4 %
3 %
2 %
1 %
Crisis Divergence Convergence

20
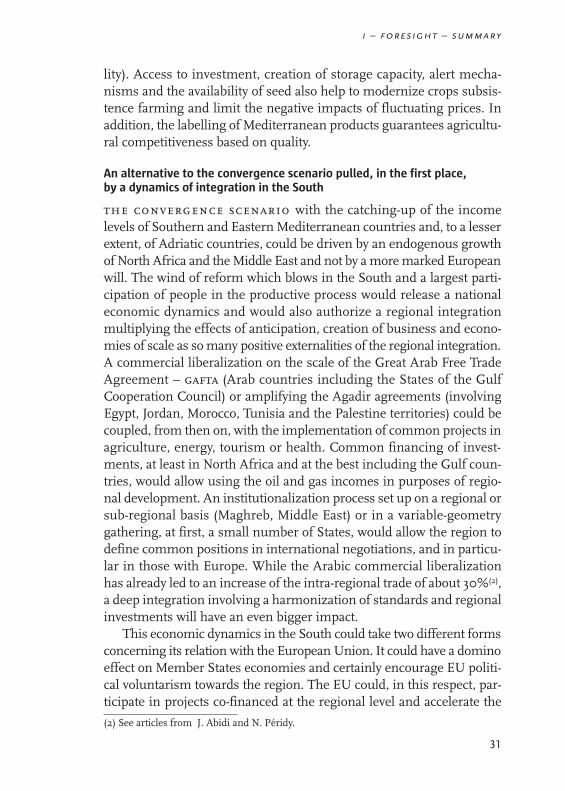
Mediterranean one, benefit the most competitive economies that havealready been catching up: Croatia, Serbia and Turkey, and to a less extendTunisia and the other Balkans countries, would get closer to the per capitaincome of Portugal; deepening the gap with other North African coun-tries (Algeria and Egypt) and the Middle East (Lebanon and Jordan)whose growth would be less dynamic (GRAPH I I). The Arabic revolt pulled,in this perspective, a positive dynamics only in the first country in revo-lution, Tunisia; the rentier dimension of the economies and the preser-vation of the vote-catching having prevailed in the other MediterraneanArabic countries. In Europe, potential growth of Greece and Portugal isalso weakened by the difficulties of their balance of payment and publicdebt, increasing both intra-Mediterranean and intra-European diver-gence. The Euro-Mediterranean process makes progress in terms of agri-cultural and commercial liberalization. The liberalization of services islimited to some service provisions, without going as far as freedom ofestablishment, lending weight to labour selection based on qualifications.The intra-regional exchanges progress with a slower rhythm than the
GRAPH I I
“Mediterraneandivergences” scenario.GDP per capita (2009-2030)
(thousands of dollars,purchasing power capacity)
Albania
Algeria
Bosnia
Croatia
Cyprus
Egypt
France
Greece
Israel
Italy
Jordan
Lebanon
Libya
Macedonia
Malta
Mauritania
Morocco
Portugal
Serbia
Slovenia
Spain
Syria
Tunisia
Turkey
10 20 30 40 50
20092030
Source : CAS – Ipemed, 2011.

21
i – foresight – summary
one of the rest of the world, whereas the sub-regional trade (Arabic orfrom the Maghreb) rest low, comparable to what it is today.
Labour productivity increase is higher in European countries stron-gly affected by the financial crisis (Spain, Greece, Italy and Portugal). Itstays at the same trend level in the rest of Europe, in the Adriatic coun-tries and those of the South and East of the Mediterranean. Employ-ment and activity rates would increase but remain low due to the raceto competitiveness. Productivity gains come from a substitution oflabour by capital. Above all, these rates will mostly be unequally distri-buted between the countries thus enhancing the Mediterranean diver-gence: unemployment would decrease but remain high in the Southand East of the Mediterranean and the Balkans (9% to 10%) ( TABLE I).Europe would manage to partially make up for its loss of activity by faci-litating migration mostly for qualified workers (EU Blue Card) and bymeans of a slight extension of working life (pension reform). Labourmarket duality would remain marked in North and South, emphasizinginequality between a globalized elite integrated in world trade, compa-red with low-qualified workers subject to increased flexibility in theNorth and a drop in working conditions and wages in the South. The
TABLE I “Mediterranean divergences” scenario – employment (2007-2030)(thousands)
MCs benefit from an improved labour market situation. They approach the EU’s 2007 levels.
Jobs Annual rate Active Jobs Unem- Non-active Activity Unemploy-created Annual No pop. ployed pop. rate ment rate*
47,098 2.15% 133,036 121,909 12,113 141,327 48.5% 9.1%2,050
Europe benefits from input of active workers that limits the decline on its active population.
Jobs Annual rate Active Jobs Unem- Non-active Activity Unemploy-created Annual No pop. ployed pop. rate ment rate*
48,250 0.87% 283,710 267,219 16,490 148,717 65.6% 5.8%2,100
The Balkans converge rapidly. Jobs Annual rate Active Jobs Unem- Non-active Activity Unemploy-
created Annual No pop. ployed pop. rate ment rate*
2,536 1.4% 11,466 9,360 1,105 9,243 53.1% 10.6%110
(*) It corresponds to the number of people who have worked in the formal sector and can no longer do so. This rate does not takeinto account disguised unemployment linked to under-employment, nor signing-up conditions for the unemployed. It is probablytherefore an under-estimate.Source : FEMISE, 2011

22
weight of the informal sector remains important in particular in theSouth and East of the Mediterranean region and in the Adriatic coun-tries, even if it slightly declines because of the decline of rural employ-ment, which represents a significant part of the informal employment,and the dynamics of the activities turned to the export. The same trendis observed for the non-agricultural informal employment in semc(except Mauritania) which will go from 43.5% of the total employmentin 2000, according to the oecd, to 40.5% in 2020, with considerable dif-ferences between countries; informality being reduced in a higher mea-sure in countries having known a strong growth of their informalemployment after the liberal reforms in the 1990s (Egypt, Algeria) andcontinuing to grow in those where it progressed in the years before thecrisis (Turkey, Morocco).
Migratory pressure is fed by the “losers” of the modernization-glo-balization process, and in particular young graduates. Qualified migra-tion is facilitated while non-qualified migration remains very restrictiveand temporary, under the cover of circular migration. Migration is alsogeographically selective: a migratory flow is essentially established bet-ween the EU and catching up countries, which attract themselves moreand more migrants from the nearby countries (sub-Saharan Africa, thecis, Asia). Migrants’ remittances continue to play an essential stabili-zing role in non-European Mediterranean economies. Communitymigratory policies strongly remain national preventing the circulationof migrant workers and the acquisition of "transferable" skills: quali-fying migration remains the exception.
In this context, the Mediterranean Sea’s position as a world-economytransit site would be accentuated, benefiting from new opportunities fordeveloping trade yet with deeper impacts in terms of pollution, loss of bio-diversity and paving the coastline. This scenario would further empha-size the duality of economies and territories (marginalization of inlandareas, coastline development) and lead to the development of export out-lets for industry and agriculture to the detriment of production for domes-tic markets. The increase of the energy and food demand and the urba-nization raise the environmental pressures in the South and East of theMediterranean. The pressure on water resources becomes unbearableand the contribution to the climate change worrisome. The stabilizationof co2 emissions in Europe is, indeed, more than balanced by increaseddemand in the South led by the augmentation of the population, its stan-dard of living and the sector-based composition of the growth. If, in 2030,

23
the difference of energy consumption per capita between both shoresremains (30% lower in the South), the dependence on fossil fuels of thesemc will imply a very strong growth of their co2 emissions (of about100%), even reported to the amount of inhabitants. This is mainly dueto a lower progress of renewable energies and energy efficiency in thesecountries than in Europe.
For agriculture, productivity gains and pressure on arable lands markthe disappearance of production of food crops. Rural zones only attractfew activities for the benefit of littoral zones, thus accentuating ruralexodus in the South and agricultural concentration in the North. Thepart of agriculture in gdp strongly decreases, except in Turkey, on behalfof big exploitations intended for the export. The Euro-Mediterraneanagricultural decline would be accompanied by a strong penetration ofsuppliers from the rest of the world (meat and cereal crops). Whilestrictly “Mediterranean” production (fruit and vegetables, olive oil andwine) that had not received labelling would be under stiff competitionfrom products from afar (Chile, Australia, Brazil and China).
Scenario of “crisis in the Mediterranean region”: marginalizationand convergence through the bottom
the 2008 crisis could contribute to making the picture evenmore negative. South European countries are the most weakened by thecrisis. They are caught up in an unfavourable debt spiral which increasesthe default risk – and thus the interest rate on government debt – andhampers the potential of growth. Their demand’s growth and recoveringcould be hold back by consolidating public finances (decrease in publictransfers and raising taxes) which would lead to a trend and level ofincome that is lower than in the past. From then on, the crisis of LatinEurope goes together with a retreat of its exchanges and investments inthe neighbouring countries (Balkans and South Mediterranean). NorthAfrica, strongly disadvantaged by this retreat (because of a strong com-mercial dependence with Mediterranean Europe), suffers from a long-lasting instability bound to an incomplete political transition. The Mach-rek, Turkey and the Balkans succeed in limiting the effects of the crisisthanks to the transfers of capital coming from Northern Europe and theemerging countries looking for low-cost investments in a high-yieldzone. A kind of Mediterranean convergence through the bottom wouldwork in this way, where all the countries catching up with Europe wouldget close to European Mediterranean income levels (gdp per capita for
i – foresight – summary

24
Turkey and Serbia reaching 80% of the one of Portugal), but with a mar-ked European divergence (GRAPH III). The hysteria effects of the crisis arefocused on South Europe, which experiences a durable slowdown of itsgrowth and a sustained weakness of its productivity gains, whereas therest of Europe would remain anchored to the growth of emerging mar-kets. In this scenario, Germany would overtake France in per capitaincome. Slovenia would reach a higher per capita income than Spain.
This context of crisis is unfavourable to the Euro-Mediterranean ins-titutional integration and threatens the European cohesion. The Euro-med process would remain limited (no further liberalisations) and plan-ned enlargement postponed indefinitely. The ufmwould lack of projectsand the liberalization of services would be hindered by fears of socialdumping. The sub-regional trade suffers from the instability of the Ara-bic Mediterranean Sea and its part in the exchanges, nevertheless weak,still diminishes.
GRAPH III
“Crisis in theMediterranean region”scenario. GDP per capita (2009-2030)
(thousands of dollars,purchasing power capacity)
Source : CAS – Ipemed, 2011.
Albania
Algeria
Bosnia
Croatia
Cyprus
Egypt
France
Greece
Israel
Italy
Jordan
Lebanon
Libya
Macedonia
Malta
Mauritania
Morocco
Portugal
Serbia
Slovenia
Spain
Syria
Tunisia
Turkey
10 20 30 40 50
20092030

25
Southern European countries are the victims of a hysteresis effectstemming from the economic crisis, which has deskilled labour with adefinitive loss of human capital, translated by stagnating or fallingemployment rates, which remain relatively stable in Northern and Eas-tern Europe. Latin European economies are creating fewer jobs thanthe Northern ones, with weaker activity rates (average of 53.5% compa-red to 62.5%), and higher unemployment (7.7% compared to 6.4%)(TABLE II). The Maghreb countries are feeling the effects of the EuropeanMediterranean crisis and are ensuing instability more than countriesin the Machrek and the Adriatic. Their employment rates are risingmore slowly than the general trend. In the South, activity rates are the-refore generally under 50%, with an average drop of several points. Offi-cial unemployment rates have stabilized at around 12%, but most jobsremain informal. Non-agricultural informal employment stays at the2000 level. Morocco reaches a rate close to the one of Latin America(more than 65%) and Algeria and Egypt stay at a level around 40%. Withan average annual job creation rate of 1.2 million, social indicators arestagnating at best. Existing divides are deepening and social tensionsare set to persist due to this dynamics poor in employment creation.
i – foresight – summary
TABLE II “Crisis in the Mediterranean region” scenario – employment (2007-2030)(thousands)
SEMCs struggle to maintain a labour market balance nevertheless socially unsatisfactory Jobs Annual rate Active Jobs Unem- Non-active Activity Unemploy-
created Annual No pop. ployed pop. rate ment rate*
28,600 1.42% 117,322 103,411 13,804 157,040 42.8% 11.8%1,240
EU27 struggles to retain its potential and becomes more “continental based”Jobs Annual rate Active Jobs Unem- Non-active Activity Unemploy-
created Annual No pop. ployed pop. rate ment rate*
34,292 0.63% 270,480 253,261 17,219 161,948 62.5% 6.4%1,490
Stabilisation of the Balkans Jobs Annual rate Active Jobs Unem- Non-active Activity Unemploy-
created Annual No pop. ployed pop. rate ment rate*
1,957 1.10% 9,947 8,781 1,166 9,762 50.5% 11.7%80
(*) It corresponds to the number of people who have worked in the formal sector and can no longer do so. This rate does not takeinto account disguised unemployment linked to under-employment, nor signing-up conditions for the unemployed. It is probablytherefore an under-estimate.
Source : FEMISE, 2011.

26
In this context, migration pressure remains high and is fed by theconflicts and political instability that accompany difficult transitionperiods. On the other hand, the crisis in the European Mediterraneanhas the effect of maintaining tight restrictions on migration (in termsof circulation and recognition of qualifications). European countries’migration balance continues its trend (United Nations medium scena-rio): the drop in the active population is mitigated by the retirement agereform and low growth makes these countries less attractive to migrants.
Although demand from emerging countries continues to raiseenergy prices and food goods, this imported inflation does not indicatean activity overload, but eats further into household incomes in a depres-sed economic context (i.e. stagflation). Sluggish growth is insufficient tolimit the negative environmental impacts of energy consumptionbecause of the low progress in energy efficiency (in the Arabic Medi-terranean and the Balkans), the lack of renewable energy developmentand the continued use of fossil energy. Although co2 emissions dropby 10% in 20 years due to the crisis in Europe, they rise sharply in coun-tries South and East of the Mediterranean.
Regarding agriculture, the dichotomy of intensive farming for exportalongside under-equipped subsistence crop farming continues in theabsence of productivity gains. Water conflict intensifies. Food depen-dency and rural poverty go hand in hand and accentuate social imba-lances, fuelling a vicious circle of instability.
Another future is possible: scenario of the “Mediterranean convergence”or the top-down convergence scenario
a different future could exist for the Mediterranean, involvingneither divergence nor marginalization, hinged on proactive politicalaction shared by all inhabitants in a multipolar context of internationalregulations. A stronger and richer economic growth in terms of employ-ment involves promoting the integration of production systems by deve-loping Mediterranean synergies and extending certain means of redis-tribution and social protection to the whole of the Mediterranean. In aregionally integrated system (establishment of the four EU freedoms,access to the European domestic market and standardized norms allo-wing the emergence of a regional preference system) internal levers forgrowth could result in increased regional productivity and employmentin all countries, if accompanied by a geographical redistribution of theproduction and a sharing of the added value allowed by the opening of

27
certain enhanced cooperation to South and East Mediterranean coun-tries. Such a scenario presumes that the political transition in the ArabMediterranean has not only liberated a positive dynamics in the South,but has led to closer convergence with Europe, and a rapprochementbased not just on economic interest but on a political and value-basedcommunity.
Due to this soundly cooperative scenario, all the Mediterraneanregion benefits from a total factors productivity increase and supportsits competitiveness with lower social costs than in the “Mediterraneandivergences” scenario. A regional convergence dynamics emerges then.Diffusion of technology through imitation and knowledge as well ascapital transfers leads to a productivity catch up. In promoting a moreequitable and redistributive growth, domestic demand increases in non-European countries bordering the Mediterranean which provides gro-wing market opportunities. South Europe benefits from this develop-ment and, to a less extent, the other European countries. This dynamicsstrongly increase the sub-regional trade, offering henceforth opportu-nities of emerging and deep markets. The countries of the Adriatic,taken by Croatia and Serbia, pull Bosnia, Macedonia and Albania. Theintra-regional trade in the Middle East and in the Maghreb develops allthe more strongly as exchanges crossed with the Gulf are to be added tothe more deepened relations established with the Mediterranean andEuropean neighbours. In this context, Turkey becomes an indispensa-ble interface and a moving plate of the Euro-Mediterranean trade.
All countries in the region (apart from Mauritania) would then attainper capita incomes of over usd 10,000 by 2030. Slovenia may equalSpain in per capita income and Croatia gets close to Portugal. Egypt andMorocco triple their per capita income and get in the convergence path.Turkey’s and Serbia’s per capita income reaches over usd 25,000 by2030 (GRAPH IV).
Activity rates in Southern and Eastern Mediterranean countries andin Adriatic States get close to those of Europe, where the migrant’s num-ber is able to compensate for domestic labour shortages and to supplyconsumer markets. In the South, the informal market strongly reducesits size (more than 10 points in average, the part of the informal employ-ment on the total employment of Turkey and Tunisia getting closer tothe level of Eastern Europe transition countries, i.e., 22%), unemploy-ment rates go under 9% and more than 2.6 million jobs are createdevery year, enhancing social stability (TABLE III). In Europe, labour mar-
i – foresight – summary

28
kets are close to full employment and recruitment tensions are lighte-ned by an easier migration. Immigration also supports a strong domes-tic consumption and contributions paid by active immigrant workershelp limit the enlargement of the duration of activity (moderate defer-ment of retirement ages).
Employment opportunities offered by Southern and Eastern Medi-terranean countries and the Balkans become sufficient to limit braindrain. For migrants, the question of returning to their country becomesrelevant, thus the migration become more circular and qualifying. Thesemc and Adriatic countries’ take benefits of these comes-backs, as theKorean example did in the 60’s, which involve a cumulative economi-cal dynamics. Croatia, Serbia, Turkey, Tunisia and Algeria end their“migratory transition” in 2030: they become migrant “net receivers”countries and stop being sending countries (GRAPH V). The migrationbalance of Latin Europe increases due to migrants coming from othercountries outside the Mediterranean region.
GRAPH IV
“Mediterraneanconvergence”scenario. GDP per capita(2009-2030)
(thousands of dollars,purchasing powercapacity)
Source : CAS – Ipemed, 2011.
Albania
Algeria
Bosnia
Croatia
Cyprus
Egypt
France
Greece
Israel
Italy
Jordan
Lebanon
Libya
Macedonia
Malta
Mauritania
Morocco
Portugal
Serbia
Slovenia
Spain
Syria
Tunisia
Turkey
10 20 30 40 50
20092030

29
i – foresight – summary
TABLE III “Mediterranean convergence” scenario – employment (2007-2030)(thousands)
SEMCs Jobs Annual rate Active Jobs Unem- Non-active Activity Unemploy-
created Annual No pop. ployed pop. rate ment rate*
59,846 2.6% 145,886 134,657 11,229 128,477 53.2% 7.7%2,600
EU27Jobs Annual rate Active Jobs Unem- Non-active Activity Unemploy-
created Annual No pop. ployed pop. rate ment rate*
67,088 1.2% 303,019 286,057 16,961 129,409 70.1% 5.6%2,920
BalkansJobs Annual rate Active Jobs Unem- Non-active Activity Unemploy-
created Annual No pop. ployed pop. rate ment rate*
2,895 1.5% 10,601 9,719 882 9,107 53.8% 8.3%130
(*) It corresponds to the number of people who have worked in the formal sector and can no longer do so. This rate does not takeinto account disguised unemployment linked to under-employment, nor signing-up conditions for the unemployed. It is probablytherefore an under-estimate.
Source : FEMISE, 2011.
GRAPH V Prediction of the net migration rates (in ordinates) in the Maghreb (1965-2030)
5
0
- 5
-101970 1990 2010 2030
Mauritania 5
0
- 5
-101970 1990 2010 2030
Morocco
5
0
- 5
-101970 1990 2010 2030
Algeria 5
0
- 5
-101970 1990 2010 2030
Tunisia
The blue line refers to the original UN’s time series of net migration rates. The red linedescribes the theoretical predicted values of net migration rates according to model 2. Thevertical dotted line in the graphics indicates the boundary between the UN’s estimated netmigration rates and the projected ones.
Source:GiambattistaSalinari –CARIM, 2010

30
For energy, the convergence scenario facilitates better progress inenergy efficiency and significant development of renewable energysources thanks to regional cooperation and technology transfers. 16% ofenergy demand is met by renewable energy sources in 2030 (24% inLatin Europe, including the Balkans, but only 8% in the semc), com-pared with 12% in the crisis scenario and 10% in the divergence scena-rio. Energy-saving measures have been put in place, not just in Euro-pean Union countries, but also in the South: prevention campaigns,creation of an “energy saving” label, energy-efficient buildings, etc. Theconvergence scenario represents 14% of supplementary wealth for theregion cumulated with 5% less energy in comparison with the diver-gence scenario, which is far from negligible. The same goes for co2
emissions. Although the crisis and divergence scenarios are very simi-lar in terms of carbon intensity, the convergence scenario makes it pos-sible to reduce this intensity by 20% with, let us not forget, an increa-sed level of wealth. Another positive effect is that energy dependence isreduced in this scenario and energy inflation is partially curbed. Despiteefforts made, the impact of growth on climate change neverthelessremains worrying: from 2020, co2 emissions from semc overtake thoseof Northern Mediterranean countries (nmc) even though energyconsumption per inhabitant remains lower (GRAPHS VI & VII).
In a context of accelerated industrialization and development in semcand the Balkans, agriculture’s share of gdp drops sharply. Rural exodusis contained, however, because of the development of non-farming ruralactivities (e.g. tourism, real estate) and a food-processing chain that sti-mulates jobs in industry and services (e.g. transport, distribution, qua-
Evolution of the demand of primary energy in 2030
200
400
600
800
1970 1980 1990 2000 2010 2020 2030 1970 1980 1990 2000 2010 2020 2030
CrisisDivergenceConvergence
GRAPH VI In NMCs (Mtep) GRAPH VII In SEMCs (Mtep)
Source : OME-Ipemed, 2011.
31
lity). Access to investment, creation of storage capacity, alert mecha-nisms and the availability of seed also help to modernize crops subsis-tence farming and limit the negative impacts of fluctuating prices. Inaddition, the labelling of Mediterranean products guarantees agricultu-ral competitiveness based on quality.
An alternative to the convergence scenario pulled, in the first place, by a dynamics of integration in the South
the convergence scenario with the catching-up of the incomelevels of Southern and Eastern Mediterranean countries and, to a lesserextent, of Adriatic countries, could be driven by an endogenous growthof North Africa and the Middle East and not by a more marked Europeanwill. The wind of reform which blows in the South and a largest parti-cipation of people in the productive process would release a nationaleconomic dynamics and would also authorize a regional integrationmultiplying the effects of anticipation, creation of business and econo-mies of scale as so many positive externalities of the regional integration.A commercial liberalization on the scale of the Great Arab Free TradeAgreement – gafta (Arab countries including the States of the GulfCooperation Council) or amplifying the Agadir agreements (involvingEgypt, Jordan, Morocco, Tunisia and the Palestine territories) could becoupled, from then on, with the implementation of common projects inagriculture, energy, tourism or health. Common financing of invest-ments, at least in North Africa and at the best including the Gulf coun-tries, would allow using the oil and gas incomes in purposes of regio-nal development. An institutionalization process set up on a regional orsub-regional basis (Maghreb, Middle East) or in a variable-geometrygathering, at first, a small number of States, would allow the region todefine common positions in international negotiations, and in particu-lar in those with Europe. While the Arabic commercial liberalizationhas already led to an increase of the intra-regional trade of about 30%(2),a deep integration involving a harmonization of standards and regionalinvestments will have an even bigger impact.
This economic dynamics in the South could take two different formsconcerning its relation with the European Union. It could have a dominoeffect on Member States economies and certainly encourage EU politi-cal voluntarism towards the region. The EU could, in this respect, par-ticipate in projects co-financed at the regional level and accelerate the
i – foresight – summary
(2) See articles from J. Abidi and N. Péridy.

32
rhythm of negotiations for an access to the internal market and evenfor accession, in the case of candidate countries. The intensification ofcertain North-South bilateral relations could go in the same directionrenewing doubtlessly the principles of the Euro-Mediterranean nego-tiations and centring them more on investments. But this economicdynamics of the South could also bring about a relative distance bet-ween an integrated southern shore on the one side and, on the other, theEuropean Union.
This scenario, not very plausible at the end of 2010, has won in pro-bability thanks to the Arab revolutions. It has not been analysed by the“Mediterranean 2030” consortium in the present document and couldbe subject to further analysis.
4. What can be done to encourage Mediterraneanconvergence?
to obtain converging regional performances that are more sociallyand territorially balanced an integration of the production systems isneeded. It is not enough to simply open up trade, since this has a limi-ted impact in a global economy. Liberalizing services could be a morevigorous growth factor as well as an alternative of migration, but tradeand work dynamics cannot be reinforced without a standardization ofnorms, without which liberalization shall remain limited, as shall itspotential to create income. In addition, encouraging internal levers forgrowth must involve rehabilitating social welfare systems, which areguarantees of sustained consumption and public support to allow peo-ple and goods to stand up to intensified global competition. Seen thisway, setting up a Mediterranean “ecosystem” is the condition for itsautonomy and growth. From then on, a number of recommendationscentring on the major challenges and Mediterranean convergence fac-tors are proposed:1. Invest in human capital by encouraging mobility (authorise tempo-rary migration for services under contract and projects co-funded by theufm) and qualifications (create a common base, a Euro-Mediterraneannetwork of vocational training courses and establish recognition-accre-ditation of skills and diplomas; ErasmusMed, etc.).2. Accelerate the transfer of knowledge, skills and technology by (i)encouraging the emergence of Euro-Mediterranean competitiveness

33
and research clusters in sectors with high growth or rich in employ-ment (information and communication technologies for services, far-ming and energy efficiency techniques, etc.); (ii) narrowing down loca-tion choices to the region: setting up a system of regional preferences,going beyond free trade, and based on social, health and environmen-tal quality criteria would contribute to accelerating the transfer of capi-tal and know-how. 3. Create a common institutional area accompanied by financial trans-fers, an advanced status including funds inspired by the philosophy ofaccession funds to the domestic market (with the progressive esta-blishment of the four freedoms of movement for goods, capital, servicesand people) and pursue discussions on accession for EU candidate coun-tries.4. Engage a Mediterranean certification process, initially covering ser-vices and agriculture, with a Mediterranean label guaranteeing healthquality (establishment of a health agency) and environmental qualityfor farming and skills level and service quality for the provision of ser-vices. 5. Select ufm projects (co-funding) based on job creation potentialand/or energy restraint.6. Create a Mediterranean environment fund aimed at strengtheningthe capacity to adapt to climate change in South and East Mediterra-nean countries and the Balkans. It will also finance renewable energytransport’s infrastructure and public transport as an alternative to roads,clean development projects that reduce greenhouse gas emissions, andprojects for rationalizing water demand and energy efficiency, particu-larly in the building sector.7. Set up a Mediterranean investment bank, based on the same prin-ciples as the eib, and designed to encourage funding for smes, which arekey to the creation of wealth and jobs. 8. Enlarge transport networks in the South Mediterranean to facilitateSouth-South commercial exchanges, with a particular focus on multi-modal transport to better optimize logistical costs.9. Draw up a common food security policy (mutualized insurance foragricultural risk; constitution of security stocks and emergency inter-vention systems) and a rural development policy (tangible and intangi-ble infrastructures for industries; managerial and technological trainingcourses).
i – foresight – summary

35
growth scenarios forthe mediterranean in 2030
Cécile Jolly*
1. Methodology and growth scenario
A growth accounting based on labour force and productivity
a simple growth accounting links production to the available resourcesin the economy and to the state of technology (Yt = f (Pt, Lt, Kt)). Theincome level of a country at a moment “t” relies on productivity (P), onthe potential employment (L) – which is based on the total potentialworking population and on the equilibrium rate of unemployment, anddepends on the capital stock (K). The capital stock can be considered asendogenous to macroeconomic developments (it evolves in line witheconomic activity), while the average annual return on capital is constantover a long period, unlike the labour force. Labour productivity is a proxyfor the speed of capital accumulation and for total factors productivity.The employment potential depends on the evolution of the age structureof the population, on competitiveness and on the functioning of thelabour market; it is viewed here through the employment rate (propor-tion of the employed population in the total population or in the popu-lation of working age). Forecasts are focused on the labour force and onproductivity, the combined progress of which induces the growth rate.This growth rate is applied to the per capita income of each country eva-luated in purchasing power parity according to imf databases (Septem-ber 2010). Forecasts thus carried out consequently make it possible toanswer the central question of incomes convergence in the Euro-Medi-terranean region and the employment/unemployment problems.
(*) Analyst at the Centre d’analyse stratégique (CAS).

36
Population projections are based on the median scenario of the Uni-ted Nations (2008 revision) and are constant in each scenario. Thelabour force results from the employment rates evolution (employedpopulation in the total population), which is casted by country on thebasis of past trends(1) and follow, up to 2015, the forecasts of the imf.The increase of the employment rate also takes into account, for Euro-pean countries, a threshold effect that relates to population ageing,which restricts opportunities for working population increase. The projections hinge upon a productivity growth rate which relies
on the accumulation of human capital and the speed of diffusion oftechnical progress. The evolution of labour productivity (gdp per personemployed) is forecasted in proportion with past trends(2) for each coun-try and, up to 2015, follows the forecasts of the imf. For countries havingexperienced a strong growth of their productivity rates since 1995, ittakes into account a threshold effect due to the slight slowdown of cat-ching-up path (especially the new EU Member States) (TABLE 1). This mea-sure of the productivity remains very imperfect as far as it does not takeinto account, for Southern and Eastern Mediterranean countries, theinformal employment which counts between 30% (Turkey) and morethan 65% (Morocco) of the non-agricultural employment with diffe-rences in productivity which can reach 30 to 40%. Nevertheless, formaland informal employment are complementary either that companieshave a part of formal and another of informal employment or that infor-mal structures are the subcontractors of formal structures. Therefore,productivity trends measured on formal employment affect the wholeeconomy.
Three scenarios from variance with the business-as-usual scenario
starting from a business-as-usual scenario which extends to2030 the past trends and the 2015 imf’s forecasts, three scenarios havebeen carried out from variance with the initial projections: a scenario of“Mediterranean divergences”, a scenario of “crisis in the Mediterraneanregion” and a “Mediterranean convergence” scenario. In the reference scenario, EU15 productivity remains low (less than
or equal to 1.5%) following past trends (productivity gains at around 1%on average between 1995 and 2009). The productivity of catching upcountries (new EU Member States, Western Balkan) and Mediterranean
(1) (2) Resulting from The Conference Board Total Economy Database: Output, Labourand Labour Productivity Country Details, 1950-2009, January 2010.

37
ii – foresight – growth
countries increases more rapidly (productivity gains of 2-3%) due to themodernization of production capacities and to human capital adapta-tion. A process of substitution of labour by capital takes place in cat-ching up economies and it is unfavourable to employment. The low pro-ductivity trend in “historic” European countries weakens long-termgrowth and employment. Employment rates increase therefore slightlyin all countries. In the “Mediterranean divergences” scenario, because of internatio-
nal competition, countries are under pressure to reduce their costs inorder to restore economic competitiveness through a combination oftight monetary policy and wage restraint. Productivity increase is higher
TABLE 1 Growth rate of labour productivity* in Euromed countries (1980-2030) (%)1980- 1990- 1995- 2000- 2005- 2010- 2020-1989 1994 1999 2004 2009 2019 2029
Albania -1.51 -5.75 7.48 8.84 5.42 2.64 3.04Algeria -1.55 -5.32 -1.12 0.61 -0.10 1.52 1.53Bosnia – – – 5.40 0.69 2.65 3.24Croatia – – 3.20 3.36 1.68 1.48 1.70Cyprus 5.03 2.88 3.58 0.76 0.86 1.86 2.01Egypte 2.75 -0.15 3.23 1.16 3.86 3.11 3.06Spain 1.88 1.60 0.68 0.09 0.91 1.01 1.01France 2.13 1.40 1.40 0.99 0.37 1.02 1.21Greece -0.35 0.10 2.32 3.29 1.58 0.47 1.50Israel 1.47 1.11 2.06 0.37 0.38 1.36 1.32Italy 1.84 1.45 1.18 0.03 0.95 0.45 1.00Jordan -2.81 -5.30 -0.54 2.79 2.30 2.04 2.04Macedonia – – 1.18 2.70 - 0.20 1.70 2.03Malta – – – – 0.74 1.05 1.51Morocco 0.86 0.41 -0.99 3.09 2.97 3.17 3.04Portugal 2.16 2.18 2.24 0.67 0.78 0.92 1.50Serbia – – – 6.04 3.97 3.70 3.53Slovenia – – 4.14 3.02 1.45 1.82 1.91Syria 1.94 4.06 1.69 0.26 0.41 2.34 2.04Tunisia 0.78 1.50 2.54 2.39 2.61 3.02 2.52Turkey 3.61 1.77 2.29 4.47 1.79 2.84 3.04* This rate is calculated as the ratio between the percentage of GDP variation with regard to the percentage of employmentvariation over the same period.Source: The Conference Board Total Economy Database (2010), Output, Labor and Labor Productivity Country Details, 1950-2009,January 2010(3).
(3) The Total Economy Database was developed by the Groningen Growth andDevelopment Centre (University of Groningen, The Netherlands).

38
in European countries which are more affected by the financial crisis(Greece, Spain, Portugal and Italy). It stays at the same trend level inthe rest of Europe, in the Adriatic States and in the Southern and Eas-tern Mediterranean countries. Employment rates increase in the Southbecause of economic development and in Europe because of extendingworking lives (pension reform). But they remain low due to the race tocompetitiveness and to the productivity gains which lead to a substitu-tion of labour by capital. Unemployment rates persist at a high level inthe non-European countries bordering the Mediterranean. For SouthEurope, the decline of the labour force (Italy, Spain) or its slow increase(France) is not enough to contain the unemployment rates, whichremain higher than in the rest of Europe. In the scenario of “crisis in the Mediterranean region”, the crisis
impact is long lasting in South Europe. For all Mediterranean countries,productivity gains and employment rates are lower than in the referencescenario. By contrast, they are relatively stable in Northern and EasternEurope. South European countries face a hysteria effect of the crisis, theunemployed becoming “de-skilled”, which leads to a permanent loss ofhuman capital and to a stagnation, or even a decrease, of employmentrates. North Africa is more affected by the European crisis and by a longlasting instability than Adriatic and Machreq countries. Their employ-ment rates increase more slightly than in the reference trend. In the “Mediterranean convergence” scenario, labour productivity
and employment rates increase in parallel. The productivity catch up ishigher in the Mediterranean countries having a low income per habitant.This unprecedented growth of productivity is associated with economicdevelopment that brings about an increase in employment, becausegrowth relies even more on internal demand. On the whole, in the “Mediterranean divergences” scenario, the
income in the Mediterranean countries increases more strongly that theone of Eastern and Northern European countries (GRAPHS 1 to 4) whileArab Mediterranean countries, Adriatic States and Turkey become alow-cost platform for Latin Europe; this last one benefiting from its geo-graphical proximity and from the density of the commercial and humanexchanges with these countries. The most distant countries from theMediterranean shores in East Europe suffer from this competition.Conversely, the “crisis in the Mediterranean region” scenario places allMediterranean countries at a disadvantage. In the “Mediterraneanconvergence” scenario, the income of non-European countries borde-

39
ii – foresight – growth
CyprusFranceGreece
ItalyMalta
PortugalSpain
TurkeyAlbaniaBosniaCroatia
MacedoniaSerbia
SloveniaIsrael
JordanSyria
AlgeriaEgypt
MoroccoTunisia
LebanonLibya
Mauritania
1 2 3 4 5 6
GRAPH 1 In the Mediterranean region
GRAPH 2 In South and EastMediterranean countries
GRAPH 3 In Balkan Statesand Eastern Europe
TurkeyIsrael
JordanSyria
AlgeriaEgypt
MoroccoTunisia
LebanonLibya
Mauritania
1 2 3 4 5 6
AlbaniaBosniaCroatia
MacedoniaSerbia
SloveniaBulgaria
Czech RepublicEstonia
HungaryLatvia
LithuaniaPoland
RomaniaSlovakia
1 2 3 4 5 6
GRAPH 4 In EU15
CyprusFranceGreece
ItalyMalta
PortugalSpain
GermanyAustria
BelgiumDanemark
FinlandIcelandIreland
LuxembourgSweden
NederlandUnited Kingd.
1 2 3 4 5 6
GDP Growth for the three scenarios (%) Source : CAS – Ipemed, 2011.
Crisis in the Mediterranean region Divergence Convergence

40
ring the Mediterranean rises sharply, South Europe having the possibi-lity to take advantage of this shifting of the European centre of gravityto its South. But this economic dynamics of the South could also bringabout a relative distance between a structurally more integrated sou-thern shore on the one side and, on the other, the European Union.
2. Three pictures of a possible future
The continuation of past trends
the continuation of past trends (European growth rates under2% per year, close to 3-4% in South and East of the Mediterranean andin the Balkans) would not be conducive to Mediterranean convergence.In 2030, income gaps between countries remain without catching-upeffect. The convergence of income is limited to the new EU MemberStates which reach levels comparable to those of the EU15. gdp percapita of Turkey and Serbia remain lower of half than that of France andamount to the two thirds of that of Portugal (GRAPH 5). Specialization inSouth and East Mediterranean countries would remain confined to low-quality, low-tech products. A slow-down in rural areas would not be com-pensated by the creation of new activities. The continuation of pasttrends would also increase environmental pressure (with co2 emissionsin South and East Mediterranean countries equalling Latin Europe’sstabilized levels by 2030). And it would not resolve the employmentissue in the North, where restrictions on migration flows combined witha drop in the number of people in work would limit growth potential;nor in the South, where weak work dynamics would mean that over halfof the population is inactive. Unemployment rates are close to 10%,with the informal market playing an adjustment variable role. The Bal-kan countries would be confronted with the same difficulties (inactivityrates slightly above 50% and unemployment rates slightly below 10%),with the simultaneous appearance of insufficient local and sectorial wor-kers. In this context, migratory pressure remains high, essentially fed bydifferences in income, while migration policy restrictions are increa-singly strict in the North and the South, affecting both low qualified andqualified workers.

41
ii – foresight – growth
The “Mediterranean divergences” scenario: a disparate insertion in the world economy
it is divergence that threatens the Mediterranean. The upset inthe world economy’s dynamics could take things this way, with winnersand losers at national and regional level. Growth, drawn by emergingcountries, could reinforce competition to the detriment of purchasingpower and domestic demand. The industrial specializations of the Wes-tern Balkans and the South Mediterranean could approach those of Eas-tern European countries, turning them into a new low-cost platform forthe European Community and providing emerging countries with a goodposition for penetrating the EU market. World growth’s dynamics, morethan Mediterranean one, would benefit the most competitive economiesthat have already been catching up: Croatia, Serbia and Turkey, – Tuni-sia and other Balkan States to a less extent – would get close to Portugalin per capita income, deepening the gap with other North African (Alge-ria and Egypt) and Middle East (Lebanon and Jordan) countries, whose
GRAPH 5Reference scenario,continuation of pasttrends and IMFforecast for 2015. Per capita GDP (2009-2030)
(thousands of dollars,purchasing power parity)
Albania
Algeria
Bosnia
Croatia
Cyprus
Egypt
France
Greece
Israel
Italy
Jordan
Lebanon
Libya
Macedonia
Malta
Mauritania
Morocco
Portugal
Serbia
Slovenia
Spain
Syria
Tunisia
Turkey
10 20 30 40 50
20092030
Source : CAS – Ipemed, 2011.
42
growth would be less dynamic (GRAPH 6). In Europe, potential growth ofGreece and Portugal would also be weakened by the difficulties in theirbalance of payment and public debt, increasing both intra-Mediterraneanand intra-European divergence. The Euro-Mediterranean process wouldmake progress in terms of commercial and agricultural liberalization,but this would not be compensated by transfers, thus accentuating ruralexodus in the South and agricultural concentration in the North. Theliberalization of services would be limited to some service provisions,without going as far as freedom of establishment, lending weight tolabour selection based on qualifications. In this context, in addition to environmental pressures linked to eco-
nomic growth and income, the Mediterranean Sea’s position as a world-economy transit site would be accentuated, yet with deeper impacts interms of pollution, loss of biodiversity and paving the coastline. Thisscenario would further emphasize the duality of economies and terri-tories (marginalization of inland areas, coastline development) and lead
GRAPH 6“Mediterraneandivergences” scenario. GDP per capita (2009-2030)
(thousands of dollars,purchasing power parity)
Albania
Algeria
Bosnia
Croatia
Cyprus
Egypt
France
Greece
Israel
Italy
Jordan
Lebanon
Libya
Macedonia
Malta
Mauritania
Morocco
Portugal
Serbia
Slovenia
Spain
Syria
Tunisia
Turkey
10 20 30 40 50
20092030
Source : CAS – Ipemed, 2011.

43
ii – foresight – growth
to the development of export outlets for industry and agriculture to thedetriment of production for domestic markets. Employment and activityrates would rise in the Mediterranean as a whole, but unequally: unem-ployment would decrease but remain high in the South and East of theMediterranean and the Balkans (9% to 10%). Europe would manage topartially make up for its loss of activity by facilitating migration mostlyfor qualified workers (EU Blue Card) and through a slight extension ofthe working life. Labour market duality would remain marked in theNorth and the South, emphasizing inequality between a globalized eliteintegrated in world trade, compared with low-qualified workers subjectto increased flexibility in the North and a drop in working conditionsand wages in the South. For energy, progress in the use of renewableresources would be balanced by increased demand resulting in a risein greenhouse gas emissions, which would be as pronounced aroundthe world as in the reference scenario, with more marked national dif-ferences. The Euro-Mediterranean agricultural decline would be accom-panied by a strong penetration of suppliers from the rest of the world(meat and cereal crops). While strictly “Mediterranean” production (fruitand vegetables, olive oil and wine) that had not received labelling wouldbe under stiff competition from products from afar (Chile, Australia,Brazil and China).
The scenario of “crisis in the Mediterranean region”: marginalization and convergence through the bottom
the 2008 crisis could contribute to making the picture evenmore negative. South European countries have been made fragile bythe crisis. They are caught up in a debt spiral which increases the defaultrisk - and thus the interest rate on government debt - and hampers thegrowth potential. Their demand growth and recovering could be ham-pered by consolidating public finances (decrease in public transfers andraising taxes) which would lead to a trend and level of income that islower than in the past. The dropout of South Europe may result in adivergence with the rest of Europe which would remain anchored to thegrowth of emerging markets. Germany would overtake France in percapita income. Slovenia’s per capita income would be higher than theSpanish one (GRAPH 7).South European countries are also the European countries that
make the most dynamic Euro-Mediterranean cross-exchanges, sincetrade remains strongly influenced by proximity, as do migratory move-

44
ments. A long lasting slow-down in these economies, impeded by theEuro zone’s fixed exchange rates and lack of solidarity, would lead themto a withdrawal from investments and trade with countries neighbou-ring the Balkans and the South Mediterranean. Euro-Mediterraneaninstitutional integration would remain limited and planned enlarge-ment postponed indefinitely. The ufm would have a lack of projectsand the liberalization of services could be hindered by fears of socialdumping. Agricultural markets would continue to be ruled by quotas.The economic weakening of South European countries goes togetherwith a decreasing political power which is unfavourable to a strongEuropean linkage to South and East Mediterranean shores. This slug-gish growth in Latin Europe could lead to global marginalization of theMediterranean region due to economies’ interdependence (the Bal-kans, Turkey and the Maghreb essentially trading with Europe). Morelikely still, in economies South of the Mediterranean and the Balkans,it could also lead to transfers of capital from Northern Europe, the Gulf
GRAPH 7“Crisis in theMediterranean region”scenario. GDP per capita (2009-2030)
(thousands of dollars,purchasing power parity)
Source : CAS – Ipemed, 2011.
Albania
Algeria
Bosnia
Croatia
Cyprus
Egypt
France
Greece
Israel
Italy
Jordan
Lebanon
Libya
Macedonia
Malta
Mauritania
Morocco
Portugal
Serbia
Slovenia
Spain
Syria
Tunisia
Turkey
10 20 30 40 50
20092030

45
ii – foresight – growth
and emerging countries making low-cost investments in a high-yieldzone (as well as a diversion of trade towards these countries). A kind of Mediterranean convergence through the bottom would
work in this way, where all the countries catching up with Europewould get close to European Mediterranean income levels (gdp percapita for Turkey and Serbia reaching 80% of the one of Portugal), butwith a marked European divergence. The hysteria effect of the crisis isfocused on Southern Europe which experiences a durable slowdown ofits growth and a sustained weakness of its productivity gains. Incontrast, the growth rate in Northern Mediterranean countries returnsto pre-crisis levels. Some Mediterranean countries benefit from invest-ment inflows and from a positive effect of globalisation-related reloca-tions. But the relocations rely essentially on cost differential of the wor-king force. Technical progress and feedback from different sectoractivities are weak. Economic activity stagnates and the majority ofemployment is informal.
The “Mediterranean convergence” scenario: a sound and sustainablegrowth hinged on proactive political action
a different future could exist for the Mediterranean, involvingneither divergence nor marginalization, hinged on proactive politicalaction shared by all inhabitants and applied with the help of multipolarinternational regulations. A stronger and richer economic growth interms of employment involves promoting the integration of productionsystems by developing regional synergies and extending certain meansof redistribution and social protection to the whole of the Mediterra-nean. Such a scenario would imply an enforced institutional frameworkin which the perspectives of access to the European Union or the Euro-pean internal market will foster the harmonization of norms as showedby examples of Croatia and Turkey as well as the new Member States.In a regionally integrated system (establishment of the four EU free-doms, access to the European domestic market and standardized normsallowing the emergence of a regional preference system) internal leversfor growth could result in increased regional productivity and employ-ment in all countries, if accompanied by a geographical redistributionof the production and a sharing of the added value allowed by the ope-ning of certain enhanced cooperation to South and East Mediterraneancountries.

46
Due to this soundly cooperative scenario, all the Mediterraneanregion benefit from the total factors productivity increase and supportits competitiveness with lower social costs than in the “Mediterraneandivergences” scenario. A regional convergence dynamics emerges then.The activity rates in Southern and Eastern Mediterranean countriesand in Adriatic States get close to those of Europe. In Europe, themigrant’s number is able to compensate for domestic labour shortagesand to supply consumer markets. Technology diffusion through imi-tation, knowledge and capital transfers lead to a productivity catch up.In promoting a more equitable and redistributive growth, domesticdemand increases in non-European countries bordering the Mediter-ranean which provides growing market opportunities. South Europebenefits from this development and, to a less extent, the other Euro-pean countries. This dynamics strongly increase the sub-regional trade,offering henceforth opportunities of emerging and deep markets. Thecountries of the Adriatic, taken by Croatia and Serbia, pull Bosnia,Macedonia and Albania. The intra-regional trade in the Middle Eastand in the Maghreb develops all the more strongly as exchanges cros-sed with the Gulf are to be added to the more deepened relations esta-blished with the Mediterranean and European neighbours. In thiscontext, Turkey becomes an indispensable interface and a moving plateof the Euro-Mediterranean trade.All countries in the region (apart from Mauritania) would then
attain per capita incomes of over usd 10,000 by 2030 (GRAPH 8). Activityrates in South and East Mediterranean and Adriatic countries would beclose to those of Europe, where migration would fill in the labour gapsand fuel consumer markets. In 2030, Slovenia may equal Spain in percapita income and Croatia gets close to Portugal. Egypt and Morocco tri-ple their per capita income and get in the convergence path. Turkey’sand Serbia’s per capita income reaches over usd 25,000 by 2030.

47
ii – foresight – growth
GRAPHIQUE 8“Mediterraneanconvergence”scenario. GDP per capita(2009-2030)
(thousands of dollars,purchasing powerparity)
Source : CAS – Ipemed, 2011.
Albania
Algeria
Bosnia
Croatia
Cyprus
Egypt
France
Greece
Israel
Italy
Jordan
Lebanon
Libya
Macedonia
Malta
Mauritania
Morocco
Portugal
Serbia
Slovenia
Spain
Syria
Tunisia
Turkey
10 20 30 40 50
20092030

49
employment perspectivesin the mediterranean
Frédéric Blanc*
employment is a major issue for the advancement of the Euro-Medi-terranean region. For South Mediterranean countries (hereafter mcs),the forthcoming years will entail creating an unprecedented number ofdecent jobs in order to absorb the growing number of new entrants inthe labour market, the current high proportion of unemployed youngpeople, and to slightly increase female participation in economic activity.The north side will face a very different and new challenge of maintai-ning their economic and job-creating dynamics in a context where thenumber of active workers is set to shrink. The Balkan countries liesomewhere in between, since their economies more resemble those inthe mcs, but their demographic perspectives are identical to those inEurope.
On the one side, the age pyramid in the South is characterized by amuch higher-than-average proportion of young people. It is true thatdemographic growth rates have slackened and that fertility rates are star-ting to approach those of the North. However, the impact of past highfertility rates is now being felt, with a young population due to arriveon the job market by 2030. In addition, mcs can no longer practise theirapproach of previous decades: figures for the non-working populationclearly indicate that this has not been effective. On the other side, the agepyramid will get thinner in the so-called active parts. Economically activepopulation reserves do exist, particularly through developing femalework or rising the retirement age. However, it is not possible to rely onthese two factors alone, since reserves are probably insufficient.
Delegate General, Femise.

50
How should these challenges be tackled and what regional situationare we heading towards? This section shall present the nature anddimension of employment progression in the region’s 43 countries by2030, the key factors that will determine possible changes and the out-lines of the foreseeable scenarios by 2030.
The section is organized into four parts:• The nature of the employment based on a presentation of the currentsituation and the major likely demographic tendencies.• The employment content of growth and the duality of work markets. • The need to better match training and skills to the needs of econo-mies in the region. • The major probable scenarios in terms of job creation by 2030 takinginto account key changes in Euro-Mediterranean relations.
1. A tense demographic context and a weak activity rate
we will start by presenting the demographics of the workingpopulation and the labour market situation in the region, comprising the10 Euromed Partnership countries (Algeria, Egypt, Israel, Jordan, Leba-non, Morocco, Palestine, Syria, Tunisia and Turkey), the 27 EuropeanUnion Member States and the 6 Balkan countries (Albania, Bosnia-Her-zegovina, Croatia, Macedonia, Montenegro and Serbia).
The Euromed-Balkans region taken as a whole comprised 790 mil-lion inhabitants in 2007, more than 160 million of whom were under15 years old. Over 620 million people were old enough to work (over15), but only 328 million of them were economically active, and 300million had a job (TABLE 2). However, the two sides are very unequallybalanced. Mediterranean countries represent around one third of thezone’s overall population (34%), but half of the young population(49.8% of the under 15s) and only a quarter of employees (25.5%).Conversely, Europe currently offers 7 jobs out of 10, but counts lessthan half of the under 15s. This current concentration of the activepopulation in the North, with the active population of tomorrow mainlybased in the South, is one of the first factors of tension for the wholeregion, since the areas are relatively compartmentalized. Symbolically,it is worth noting that the population of under 15s in mcs has now over-taken the one of the EU.

51
iii – foresight – employment
Looking at TABLE 3, which sums up the major aggregates of labourmarkets, we can identify other local tension factors. In the Mediterra-nean, three tension factors are identified:• The very high number of people under 15 who hope to have a job.They represent 81.5 million people for a total population of 269 mil-lion, or one-in-three people in the South Mediterranean. The number ofyoung people who will be seeking for a job in the near future will begreater than the number of formal jobs available. • The gap between the number of people that may want a job and thenumber of formal jobs available (187 million people aged over 15, ofwhich 173 million potential economically active people aged 15-65, com-pared with 74 million jobs currently available). As such, the activity rateof the over 15-year-olds is below 50%. Less than one Mediterranean intwo at working age in the South is actively employed. As a result, 96million people at working age are not on the labour market. A signifi-cant number undertake informal work as a matter of survival, but arerelegated to the margins of social protection measures.
TABLE 2 Demographic indicators of labour markets in 2007
Total*** Of whom Proportion Population Active po- Jobs**under 15s of under of working age pulation**
15s (15 yrs and +) [a] MCs (Med) 269,215,108 81,540,022 30.3% 187,675,086 83,463,607 74,810,990EU27 494,488,654 77,976,021 15.8% 416,512,633 235,777,564 218,968,727Balkans(1) 23,836,823 4,332,617 18.2% 19,504,206 8,475,566 6,824,185Total 785,267,185 163,280,900 20.8% 621,986,285 327,716,737 300,603,902Sources : * UN Pop. Div. quinquennial estimates and projections ; ** ILO, LABORSTA Labour Statistics Database ; *** World Bank,WDI online ; [a] active population is the sum of the employed and unemployed. (1) Serbia excluding Kosovo.
TABLE 3 Activity in 2007 in South Mediterranean countries, Europe and the Balkans
Pop. of Active Non active Rate of Unem- Rate of Non activesworking age pop. pop. activity ployed unem- and unem-(15 yrs & +)* 2007** ployed ployed
[1] [2] [3]=[1]-[2] [2]/[1] [4] [4]/[2] [3]+[4]
MCs 187,675,086 83,463,607 95,904,812 44.47% 8,652,617 11.57% 104,557,429
EU27 416,512,633 235,777,564 180,735,069 56.61% 16,808,837 7.68% 197,543,906
Balkans(1) 17,798,566 8,475,566 9,323,000 47.62% 1,651,381 24.20% 10,974,381
Total 621,986,285 327,716,737 285,962,881 52.69% 27,112,835 8.27% 313,075,716Sources : * UN Pop. Div. quinquennial estimates and projections, **ILO, LABORSTA Labour Statistics Database. (1) Serbia excludingKosovo.

52
• The number of unemployed exceeds 8.5 million people, correspon-ding to the number of people who have worked in the formal sector andcan no longer do so. This number, which represents an official unem-ployment rate of 11.6%, does not take into account disguised unem-ployment linked to under-employment, nor signing-up conditions forthe unemployed. It is probably therefore an under-estimate.
in europe, the situation is less contrasted, but still includes three ten-sion factors:• Unemployment rates are still high in many countries. Even whenthese rates are much lower than those experienced by numerous deve-loping countries, public opinion still considers unemployment to beone of the main political priorities. This naturally implies that importedlabour is relatively unacceptable for these same public opinions.• Situations are disparate, with unemployment rates ranging from3.5% to 11% and activity rates from 48.5% to 65% (except for Luxem-bourg). In view of such variations, it is clear that structural modifica-tions applied and accepted across Europe will be difficult to conceive.In addition, in a normally open labour market, such divergences aresymptomatic of hidden obstacles. • The active to non-active workers ratio puts huge pressure on retire-ment and social security systems. These systems are mostly based onworkers’ contributions. European countries now also need to increaseactivity rates, especially in countries where they are low.
a look at TABLES 4 and 5, based on the United Nations medium variantscenario, shows the extent of tensions that will continue to intensify.From 2007 to 2030, the working age population (over 15) will increasein the region by over 100 million people. Yet 84% of these potential sup-plementary workers will be located in the South. As a result, theEurope/Mediterranean relationship in terms of potential active workerswill shift from 70/30% to 60/40% over the next 20 years. For the South,these additional 87 million potential active workers largely outweigh theformal jobs currently on offer.
In contrast, Europe is set to lose potential active workers, possiblymore than 20 million by 2030, unless the legal retirement age is exten-ded to 80 years old. We can see that the EU27 will contain 20 millionless 15-65 year-olds, 13 million of whom will be aged 25-65. If the “wor-

53
iii – foresight – employment
king age” population is to remain stable, this section of the populationwill have to be extended to include 15-80.
For the Balkans, the general situation lays half way between theSouth Mediterranean and the EU. Although in Albania, the structureof its population and its labour market statistics follow a “southern”pattern, the other countries tend to match the European situation. Inaddition, demographic trends in the region show a clear populationdrop, with an identical EU dynamic. In all age groups that define a pos-sible economically active period, numbers of potential active workerswill go down.
Starting with broadly different situations, the EU and the Mediter-ranean countries share a common objective for the next twenty years:to increase activity rates and the number of active population. For somecountries, this means maintaining the dynamic of job creation and theeconomy in general; for others, it means allowing young people to finda job, maintaining a balanced social context and improving the dyna-mics of the economy and living standards. One zone possesses theresources that the other zone needs: the EU has work opportunitiesfor the more numerous active population in the South, and the Southhas the active population that the EU is going to need.
TABLE 5 Evolution of the population by age group (2007-2030) (thousands)
Age 15-65 25-65 15-80 2007 2030 2007 2030 2007 2030
MCs 173,895 242,661 119,893 185,123 185,908 269,731EU27 331,958 311,805 271,023 258,303 394,753 397,127Balkans(1) 16,201 15,094 12,676 12,490 18,902 18,719Total 522,054 569,560 403,592 455,916 599,563 685,577Source : UN Pop. Div. quinquennial estimates and projections (Medium Variant Scenario). (1) Serbie incl. Kosovo.
TABLE 4 Population aged 15 years and over in Euromed countriesand the Balkans (2000-2030)
2000 2007 2020 2030MCs 157,652,462 187,675,086 236,451,924 274,362,500
EU27 398,814,493 416,512,633 428,570,690 432,427,178
Balkans(1) 19,039,016 19,504,206 19,878,546 19,708,616Source : UN Pop. Div. quinquennial estimates and projections (Medium Variant Scenario). (1) Serbia including Kosovo.

54
2. The employment content of growth and the dualityof labour markets
economies’ capacity to create jobs is fundamentally based on thenature and the dynamic of their growth regime. Economic growth, andtherefore job creation, depends on the accumulated quantity of pro-duction factors (physical and human capital) and the means in whichthey are mobilised to obtain a given level of production. This combina-tion can also generate increased production through the total factor pro-ductivity (tfp). To achieve full potential, economies need to be well endo-wed and/or high performing. In the Mediterranean, employmentdynamics are characterised by the small contribution to aggregategrowth of tfp and an over-sized informal sector.
How to enhance the quality of the growth-employment relationshipand the importance of factor productivity
on the southern shore of the Mediterranean, a simple observationof labour market statistics implies that the growth-employment rela-tionship does not work satisfactorily in the given situation. However, ifwe calculate the elasticity of employment to growth (estimation ofemployment growth for each percentage rise in gdp growth), mcs per-form relatively well. Although mcs appear to have reached a signifi-cant level of job creation due to their economic growth – on average 4-5% during recent years – the image is misleading. Firstly, becauseestimations differ widely between countries. And secondly, becausethey remain unstable over time. Lastly, over the long term, the employ-ment content of growth is insufficient, since it is not enough to absorbnew arrivals while integrating more potential active workers into for-mal markets.
We may therefore ask why the quality of the employment-growthrelationship is insufficient and so instable? The answer is probably,mainly because a portion of new jobs created are not in the most dyna-mic sectors that could encourage the necessary structural changes. Crea-ting a job in the government administration, for example, will not havethe same potential knock-on effect as creating a marketing-engineerposition. This is because in the first case, less other positions and sec-tors will benefit from knock-on effects than in the second. Put simply,such jobs contribute little to the growth of gdp, and the high degree ofelasticity observed does not reflect efficient use of the workforce. This is

55
iii – foresight – employment
not to say that some positions do not create value in relation to others,but rather that they create less positive effects outside their sphere.
In fact, the problem of the employment-growth relationship in theMediterranean, certain Balkan countries and Europe, lies in the struc-ture of new jobs created driving less dynamics and changes comparedto “old” ones. In standard economic calculations, this is the “total fac-tor productivity” that involves any growth that is not due to the accu-mulation of factors (employment and physical capita). Broadly spea-king, if an economy sees its tfp rise substantially, it will benefit fromhigher than “normal” growth, and part of the surge in activity will thenbe converted into jobs. For mcs, an improvement in the employment-growth relationship, essentially through better quality and sustainabilityin the medium term, necessarily involves an improvement in producti-vity gains in the economy.
the tfp issue is also at the centre of European dynamics, althoughfor different reasons. As mentioned, tfp is at the root of growth that isnot due to an accumulation of factors. Demographic trends in Europeclearly suggest that labour is set to become the scarce factor in the yearsahead. In any case, with an ageing population, European countries willno longer be able to count on a baby boom to continue fuelling theireconomic growth. Economically active people and their skills willbecome rare, and the accumulation of physical capital through invest-ment will hardly be able to make up for shortages. This being so, sus-tainable growth will have two major sources: productivity gains andimports of active workers via migration.
The main role of the informal sector
the so-called “informal” sector is particularly developed in mcs(30% to 40% of total employment). If we take the very low rates of for-mal work in the Balkans, it is obvious that these countries also possesssignificant informal sectors. The development of the informal sectorpartly stems from a lack of opportunities to work in the formal sector,given the share of inactive people in the working age population. Forpeople living in poverty, who cannot afford to be jobless, informal jobsmake part of a “survival strategy”. However, in emerging countries likemcs, the presence of an informal sector can have positive outcomes. Byoffering potential alternatives to conditions of extreme poverty, it acts asa token of social stability. It is also likely to play the role of an incubator
56
by developing skills and companies before individuals and firms canjoin the formal sector and take advantage of their successful accumula-tion. However, this kind of “positive” role can only occur when there isa good degree of mobility between formal and informal sectors, andthere are unfortunately no indicators of this in mcs. Setting up thenecessary conditions for such mobility will doubtlessly be one of thekeys to transforming labour markets in the coming years.
At the same time, it will be necessary to find solutions to the threemost significant problems arising from the existence of a large informalsector:• few decent jobs are available. In addition, both in the Mediterraneanand Europe, social protection systems base their services on the existenceof formal jobs, thereby excluding a large part of the population. AlthoughEuropean countries have been able to create systems to reach these inha-bitants, the same cannot be said for the South and the Balkans; • companies in the informal sector have only limited access to moderntechnology, capital and a certain number of goods and services providedby state authorities. This prevents their capacity for growth and, for thebroader economy, significantly limits the emergence of the productivitypotential of these companies. However, they are in competition with cer-tain local companies evolving in the formal sector and this distortion ofcompetition stands in the way of an efficient allocation of resources;• for governments, state budgets are deprived of tax resources thatcould be used to optimize the overall functioning of the economy.Moreover, the impact of government policies and reforms is diminishedgiven that they do not affect activities lying outside the legal system.Thus, for the Balkans and countries in the South whose activity rates arebelow 50%, most of the working age population is not concerned bymeasures applied to labour markets.
3. The necessary matching of training and skills to the needs of the economy
it is fairly clear that one of the keys to developing employment inthe Euromed region lies in training human capital. Initial education isan issue, but it cannot alone bring about a rapid change in the currentsituation, characterised by a low return of investment in the sector.Changes must also concern those who have already left the basic edu-

57
iii – foresight – employment
cation system and those already working, particularly in the informalsector. Vocational training and continuous training lie at the heart ofthese potential changes.
In a few decades, mcs have made remarkable progress in education.But this progress has not been matched on the same scale in labourmarkets. In some countries, a high percentage of the labour force thathas reached secondary education is unable to find a job. The relativehigh unemployment rates among graduates, not only underlines theweakness of the return of investment in human capital but also, andabove all, how ill-matched this training is to demand in labour markets.The challenge in the period ahead will therefore be to bring about ahuge improvement in the way training is aligned with the needs of theeconomy – not just at the local level, but also in the whole Euro-Medi-terranean region, in view of the population numbers at stake.
Observing the situation from an employability angle, the first obser-vations relate to the choice made in education orientations. In mcs, wecan observe that social sciences and literary subjects are more popularthan scientific and technical ones. On average, nearly two-thirds of diplo-mas awarded in secondary education relate to literature and humansciences. This is in contrast with Eastern Asian countries. At the sametime, scientific subjects and engineering studies are less attractive (witha gap of over 10 percentage points). It is widely accepted today that eco-nomic development relies on technological innovation and adaptation,and on the driving role of factor productivity. This naturally leads toencourage scientific and technical education.
But why are scientific and technical courses underrepresented? Itcould be taken as a translation of the state administration’s policy ofrecruiting university graduates. This tends to disadvantage the privatesector to the detriment of the public sector and create a counter-pro-ductive bias with two significant effects:• the private sector, which is less attractive, has difficulty in gettinghold of the skills it needs;• the best qualified find it more worthwhile either to wait for a state job(and join the unemployed in the meanwhile), or to migrate to otherlabour markets that can offer them jobs compatible with their educa-tion level. In the general economy, it is clear that this leads to a lower tfplevel in the region, with weaker growth perspectives for this tfp, notbecause education systems are of lower quality in these countries, but

58
rather due to the inefficient allocation of human resources, which meansthat only a fraction of potential tfp is achieved.
General education is not the only mechanism for developing humancapital. Rapid improvement in matching education to work marketneeds today involves enhancing the value of vocational and continuedtraining. This also implies a modification of professional recognitionsystems, which should no longer be founded solely on diplomas, butalso on skills. The objective is to induce labour markets to allocatehuman capital more efficiently. Continuous vocational training is, fromthis point of view, a key tool for allowing people to progress and enhancetheir experience, thereby encouraging mobility. The notion of skills –seen as the capability of doing something in a satisfactory manner in agiven concrete situation – appears better tailored to a more mobile work-force, in economies possessing a large share of informal jobs and contai-ning a hotbed of unexploited experiences and know-how.
4. Employment trends and possible scenarios
in this last part, three scenarios concerning the evolution of theemployment in the three zones will be described. In the first place, mainguidelines will be established, according to the evolution of the employ-ment in Europe and in the mcs, during the last decade, before the2009/2010 crisis. Then, the main lines of the three possible scenarioswill be presented.
For Mediterranean countries
between 2005 and 2007, the number of jobs in mcs rose at anannual rate of +2%, which is around 1.2 million job creations per year.These figures take into account the highly negative trend observed inTurkey (-600,000 jobs between 2005 and 2007). For the nine othercountries, in the 2004-2007 period preceding the current severe crisis,the annual rate was above 3.5% per year, which is around 1.8 millionjobs created annually. However, this figure owes much to Egypt’s per-formance during the period.
mcs did not experience workforce shortage problems. The challengewas rather to absorb an influx of people looking for work (inherited fromthe demographic dynamics of the previous generation). The issue is nolonger demographic, but one of economic activity.

59
iii – foresight – employment
In this context, it is worth mentioning the two main objectives of jobcreation to be reached by 2030: • create the number of jobs necessary for maintaining the currentlabour market structure (keeping activity and employment rates stable); • maintaining the number of non-active people at the 2007 level so asto ensure social order (TABLE 6).
To maintain current ratios, mcs would have to create 34 million jobsover the next 20 years, which is around 1.5 million jobs annually. Thisis an objective they managed to attain over the last decade, but it wouldresult in the presence on the southern shores of the Mediterranean ofmore than 150 million non-active inhabitants in 2030. As we havealready pointed out, the pace of employment growth is currently higherand, if it lasts until 2030, it would allow the creation of 62 million jobs(around 2.7 million per year on average), pushing up the activity rate byalmost 10 points (i.e. 30 million more active workers than in the pre-vious scenario). This would however still not be enough to stop the abso-lute number of inactive people from rising. To reach this target, mcswould have to create 95 million jobs, or over 4 million per year.
TABLE 6 Employment trends for South Mediterranean countries (2007-2030)(thousands)
Maintain of the ratiosJobs Annual rate Active Jobs Unem- Non-active Activity Unemploy-
created Annual No pop. ployed pop. rate ment rate34,236 1.7% 121,707 109,047 12,660 152,656 44.4% 10.4%
1,490 Maintain 2005-2007 rate
Jobs Annual rate Active Jobs Unem- Non-active Activity Unemploy-created Annual No pop. ployed pop. rate ment rate62,616 2.7% 150,836 137,427 13,409 123,526 55.0% 8.9%
2,720Maintain No. of non-employed
Jobs Annual rate Active Jobs Unem- Non-active Activity Unemploy-created Annual No pop. ployed pop. rate ment rate94,994 3.7% 180,171 169,805 10,366 94,191 65.7% 5.8%
4,130Source : FEMISE, 2011.

60
For EU27
concerning the 27 countries of the European Union, the annualjob creation rate has varied from 1.5% (2000-2008) to 2% (2005-2007).This represents 3 to 4 million job creations per year. These rates do nottake into account the effects of the crisis, which Eurostat says led to theloss of 4 million jobs in 2009.
However, given the European demographic decline, assumptionsbased on maximum activity in Europe are needed. For Europe, we assu-med a maximum activity rate of 79.5%. It means that all persons, bothmen and women, aged from 25 to 80 will be economically active in2030. Similarly, we establish a hypothesis of minimum or “frictional”unemployment rate of 5%.
From these hypotheses, we can illustrate potential problems arisingfrom demographic decline: Europe would be unable of sustaining therate of job creation observed between 2005 and 2007, neither the oneobserved between 2000 and 2008 (TABLE 7).
In the first case, Europe would manage to create 78 million jobs(taking the number of jobs to 297 million) and would achieve a recordactivity rate of 72.7% (no European country except Luxembourg cur-rently tops 65%) and a very low unemployment rate of 5.4%. 17 of the27 countries of the EU would be concerned by the upper limits and thusexperience workforce shortage problems (which will imply inevitablyan extension of the retirement age).
But, without the country ceilings, the potential of job creation accor-ding to the rates of 2005-2007 could reach 42 million supplementaryjobs. Once the ceiling per country included, the annual rate is not of1.97% and 4 million jobs created per year anymore, but only of 1.3% et
TABLE 7 Employment trends for EU27 (2007-2030) (thousands)
Maintain 2000/2008 rateJobs Annual rate* Active Jobs Unem- Non-active Activity Unemploy-
created Annual No pop. ployed pop. rate ment rate
61,850 1.1% 297,617 280,819 16,797 134,810 68.8% 5.6%2,690
Maintain 2005/2007 rateJobs Annual rate* Active Jobs Unem- Non-active Activity Unemploy-
created Annual No pop. ployed pop. rate ment rate
78,305 1.3% 314,221 297,274 16,948 118,206 72.7% 5.4%3,400
* Upper limits included. Source : FEMISE, 2011

61
iii – foresight – employment
3,4 million jobs per year. Even the long trend observed during the 2000decade (2000-2008) will not be reproduced. In this second case, Europewould at least create 62 million jobs, with an activity rate of 69% andan unemployment rate of 5.6%. But even there, 11 of the 27 countriesof the EU are concerned by the ceilings and finally 14 million jobs wouldnot be filled. Those two rates constitute an initial approximation of thedemographic effect in terms of uncreated jobs.
For the Balkans
economic performance in the Balkans has been unstable duringthe last decade. Referring to the most recent period (2006-2008), we canestimate the annual rate of job creation at 2.7%, or around 180,000 jobsper year. As the TABLE 8 shows, if the average rate is maintained, the Bal-kans could significantly reduce their unemployment rate to below 10%,and at the same time increase their activity rate above 50%. This wouldcall for the creation of 2.3 million jobs in the next 20 years, or around100,000 per year. The current trend would even be compatible with thecreation of 3.4 million jobs needed for the Balkans to display in 2030 thesame activity and unemployment rates as the EU27 in 2007. However,the trend would need to be accelerated in order to exceed 220,000 jobsper year to further reduce the gap that will exist with the EU.
TABLE 8 Employment trends for the Balkans (2007-2030) (thousands)
Unemployment rate of 1 digit and activity rate > 50%Jobs Annual rate Active Jobs Unem- Non-active Activity Unemploy-
created Annual No pop. ployed pop. rate ment rate
2,326 1.3% 10,119 9,150 969 9,590 51.3% 9.6%100
Balkans 2030 = EU 2007Jobs Annual rate Active Jobs Unem- Non-active Activity Unemploy-
created Annual No pop. ployed pop. rate ment rate
3,476 1.8% 11,157 10,300 857 8,552 56.6% 7.7%150
Balkans 2030 = EU 2020Jobs Annual rate Active Jobs Unem- Non-active Activity Unemploy-
created Annual No pop. ployed pop. rate ment rate
5,154 2.5% 12,811 11,978 833 6,898 65.0% 6.5%220
Source : FEMISE, 2011.

62
On the basis of these broad guidelines, we can present three scena-rios showing how the region’s three zones can converge towards com-mon objectives, leading to different economic dynamics. Concerningthe labour market, the major inflexion point will be a certain opening-up of the North-South and South-South job markets, which would (ornot) lead to an increase of the competitiveness and of the total factorproductivity and would have a positive impact on the employment rate.These three major scenarios have already been described; therefore wewill hereafter only describe the possible evolutions that they wouldinvolve on the labour market.
“Mediterranean divergences” scenario. The Euromed process and theUnion for the Mediterranean make progress on certain sensitive issueslike services, agriculture and easier mobility conditions, although stilllimited. Part of the European gap is reduced by active workers from mcsand the Balkans, resulting in dynamic growth effects in these zones.But it is not enough to encourage a more integrated area, where coun-tries play a local competition to move forward in a global context hardlymarked by cooperation. Some mc and some European countries takebenefits of it, but other countries stagnate. • In the Mediterranean, activity rates grow more sharply and the num-ber of jobs created annually reaches the highest levels of the 2000s. Butfew countries are concerned. At the regional level, a few more than 2 mil-lion jobs would be created per year. But this improvement does notconcern all countries, leading to a very unstable social context in someareas. In consequence, the potential of the most dynamic countries isalso reduced. Globally, unemployment decrease at rates close to thosefrom Southern Europe today, and the activity rates increase, although theaverage rate remains below 50% (TABLE 9). The number of people withoutjobs (the non-active and unemployed) increases significantly to reachmore than 150 million. This number is unable to coexist with a stablesocial situation. In the most dynamic countries, a flow of migration withthe EU is established and the return of these migrants benefits the localeconomy. But, in front of a consequent number of the non-working popu-lation, the potential is restrained by a persisting security context concer-ning the freedom of movement of men and skills in the Euromed area.

63
iii – foresight – employment
• In Europe, circular and temporary migration with mcs helps to par-tially make up for demographic deficits. Europe has opened up to agri-cultural produce, in return for greater opening of mcs to services. Itcreates new markets opportunities. Nevertheless, the standard of livingin South Mediterranean does not improve fast enough to involve a realconvergence. Within the two European areas (continental and LatinEurope) a lot of countries benefit from this race to productivity. Becauseof the growth, global employment improves faster, despite of the capi-tal/work substitution. The annual average rate would reach around0.9% (2.1 millions employment per year), involving an activity rate over65% and an unemployment rate below 6%. These rates illustrate thestress on European labour markets and working force: 5 countries wouldhave activity rates over 75% (two of them are even put to an upper limit),8 others would have activity rates over 70%. In Latin Europe the annualrate reach 0.7%, which stand for +608 000 jobs per year. The activityrate grows up to 58.3% and the unemployment rate falls down to 6.3%.
TABLE 9 “Mediterranean divergences” scenario – employment (2007-2030)(thousands)
MCs benefit from an improved labour market situation. They approach the EU’s 2007 levels.
Jobs Annual rate Active Jobs Unem- Non-active Activity Unemploy-created Annual No pop. ployed pop. rate ment rate
47,098 2.15% 133,036 121,909 12,113 141,327 48.5% 9.1%2,050
Europe benefits from input of active workers that limits the decline on its active population.
Jobs Annual rate Active Jobs Unem- Non-active Activity Unemploy-created Annual No pop. ployed pop. rate ment rate
48,250 0.87% 283,710 267,219 16,490 148,717 65.6% 5.8%2,100
The Balkans converge rapidly. Jobs Annual rate Active Jobs Unem- Non-active Activity Unemploy-
created Annual No pop. ployed pop. rate ment rate
2,536 1.4% 11,466 9,360 1,105 9,243 53.1% 10.6%110
Source : FEMISE, 2011

64
• The Balkans also benefit from a process in which they take part.Thanks to a better economic dynamics, they fill their delay on the labourmarkets in relation to their European neighbours. In 2030, the activityrates reach the recent South EU situation, like Greece or Italy, despite oftheir quite high unemployment rate.
“Crisis in the Mediterranean region” scenario. The Euromed Partnershipis no longer progressing and remains restricted to a free trade zonemainly concerning industrial products, without moving into services oragriculture. No strategy has been adopted for using complementari-ties to solve structural difficulties. On the whole, there is a slight varia-tion of the global productivity rate and the activity rates would remainlow. • In the Mediterranean countries, little progression can be observed inSouth-South integration and there is a lack of significant progress interms of productivity. Countries continue to specialise in producing low-quality goods. The employment rate (percentage of employment on thetotal population) does not progress much, following the lowest ratesrecorded during the last decades. The activity rates remain also generallyunder 50% (TABLE 10) and fall of some points. The official unemploymentrate has stabilised at around 12%, but most activities remain informal.
TABLE 10 “Crisis in the Mediterranean region” scenario – employment (2007-2030) (thousands)
MCs struggle to maintain a labour market balance nevertheless socially unsatisfactory Jobs Annual rate Active Jobs Unem- Non-active Activity Unemploy-
created Annual No pop. ployed pop. rate ment rate
28,600 1.42% 117,322 103,411 13,804 157,040 42.8% 11.8%1,240
Europe struggles to retain its potential and becomes more “continental based”Jobs Annual rate Active Jobs Unem- Non-active Activity Unemploy-
created Annual No pop. ployed pop. rate ment rate
34,292 0.63% 270,480 253,261 17,219 161,948 62.5% 6.4%1,490
Stabilisation of the Balkans Jobs Annual rate Active Jobs Unem- Non-active Activity Unemploy-
created Annual No pop. ployed pop. rate ment rate
1,957 1.10% 9,947 8,781 1,166 9,762 50.5% 11.7%80
Source : FEMISE, 2011.

65
With only 1.2 millions created job in a medium annual rate, in the bestcase the social indicators stagnate. The preexistent divides in terms ofdynamics go deeper and deeper and regarding to this low job creationactivity dynamic, the social tensions persist. • In Europe, the economic dynamism comes up against the demo-graphic problems. Migration policies still focus on minimizing flows.Demographic decline is only managed through activity reserves, mainlyinvolving raising the retirement age: here, unless the retirement agecan be raised to 80, growth potential is restricted by labour force shor-tages. On European labour markets, an overall increase in activity ratescan be observed, and a reduction in unemployment rates, both of whichapproach physical ceiling rates. Labour shortages still are a problemin certain regions, limiting growth potential. Obviously a Euromeddecline scenario is more favourable to the continental Europe than tothe Southern Europe. In such a case, it is mainly the employment sha-ring which would fluctuate, in favor of Northern and Eastern Europeand to the detriment of Southern Europe. If the European growthemployment rates should remain at 0.63% or 1.49 million per year,Southern Europe would suffer more in this scenario with an annualrate of only 0.3% (+220 000 job/year). The activity rates would be alsolower than in Northern Europe (53.5% against 62.8% in average) andthe unemployment rate would be higher (7.7% against 6.4%). • In the Balkans, the situation is normalized. Countries catch up withEurope but start to experience the same structural difficulties, mostlyconcerning labour shortage in certain sectors. Nevertheless, activity isslightly above 50% and unemployment rates are cut by half.
“Mediterranean convergence” scenario. By establishing the four EU free-doms in the Euromed region (freedom of movement of goods, money,people and services), the three areas succeed in creating the zone ofpeace and prosperity that has been sought since 1995. Training initia-tives are set up at Euromed level (e.g. creation of a common core ofknowledge, Euromed network for vocational training and recognition ofskills, Erasmus Med, etc.). They lead to a convergence of labour marketindicators, with a driving effect resulting in job creation rates aligned onthe best performances of each partner. This deeply cooperative scenariogives the possibility to benefit from total factor productivity gains, thusthe three zones can support their competitiveness with a lower socialcost. This effect is reinforced by a faster convergence in the standards
iii – foresight – employment

66
of living. Southern Europe can benefit from emerging consummationmarkets. Thanks to South-South integration, the Mediterranean part-ners take advantage of this markets characterized by important scale’seconomy, which also involve gains of productivity without curbing jobs. • In mcs, activity and unemployment rates are close to those of manyEuropean southern countries today. In this moment, there are more for-mal workers than inactive and unemployment rates under 8% (TABLE 11)are the rule. With more than 2.6 million jobs created every year, sociallythe difference is relevant: local opportunities become sufficient tocontain the brain drain. For the migrants, the come-back possibilitybecomes pertinent, thus the migration become more circular. The mcstake benefits of those comes-backs, as the Korean example did in the60’s, which involve a cumulative economical dynamic. The standards ofliving grow and transform the local markets into interesting economicmarkets. Thanks to the South-South integration’s progress, the mcs takealso benefit of this growth. With a relevant standard of living’s conver-gence, that populations can perceive and benefit from, the social contextis more stable. • In Europe, thanks to economic dynamic and immigration, labourmarkets are close to full employment. Labour shortages can be sectorial,but not very important, as skills are available on the southern shore.Immigration also promotes strong domestic consumption, and contri-
TABLE 11 “Mediterranean convergence” scenario – employment (2007-2030)(thousands)
MCs Jobs Annual rate Active Jobs Unem- Non-active Activity Unemploy-
created Annual No pop. ployed pop. rate ment rate
59,846 2.6% 145,886 134,657 11,229 128,477 53.2% 7.7%2,600
EuropeJobs Annual rate Active Jobs Unem- Non-active Activity Unemploy-
created Annual No pop. ployed pop. rate ment rate
67,088 1.2% 303,019 286,057 16,961 129,409 70.1% 5.6%2,920
BalkansJobs Annual rate Active Jobs Unem- Non-active Activity Unemploy-
created Annual No pop. ployed pop. rate ment rate
2,895 1.5% 10,601 9,719 882 9,107 53.8% 8.3%130
Source : FEMISE, 2011.
67
butions paid by active immigrant workers help reduce the defermentof retirement ages. Growth potential remains at the highest levels asso-ciated with the 2000s. The potential growth remains at its highest levels,those of 2000. The market effect sums up with the productivity effect,which bets on the knowledge economy, reducing the substitution effect.For Europe, this period is auspicious and the job’s creation rate is closeto the one of the 2000’s decade : 1.2% per year, +2.9 million jobs peryear. The price is a relevant tension on the labour market: the averageactivity rate is over 70%. Indeed, 18 of 27 countries are over 70%. Theunemployment rate is close to a frictional threshold of 5.6%. It isobvious that without an immigration provision, the tension wouldreduce the competitiveness via the lack of skills and high salary pressure.Of course Southern Europe take benefits of this trend and the job’s crea-tion rate is equivalent to the European average (1.3%), which represents+1.2 million jobs created per year. Thus the activity rate is 66.1% and theunemployment is 6.0%. • The Balkans have further increased their convergence with Europe,and their indicators (activity and unemployment) and performance lieat the current South Europe’s level.
iii – foresight – employment

69
migratory flows anddemographic transition
Long term evolution and future scenarios
Philippe Fargues*, Giambattista Salinari**
forecasting migration is not like projecting population change.Unlike mortality and fertility, one cannot break up the factors explai-ning migration into determinants – close or remote – that would lendthemselves well to projection. Population trends and structures, parti-cularly at working ages, can be projected with some accuracy from nowuntil 2030; imbalances between age groups and the tensions that mayresult can even be inferred. But whether they will actually translate intomigration will depend upon economic, political and social circums-tances that no social science knows how to project. The terrorist attackof 11 September 2001 in the US, for instance, triggered the militaryintervention in Iraq in 2003; this military intervention triggered, inturn, the flight of refugees from Iraq towards Jordan, Syria, Egypt andLebanon among other countries. Who could have ever predicted thewar and this subsequent migration?
Nevertheless, while migratory movements are not entirely unpre-dictable, they do show some remarkable constants, and it is on theseconstants that we will focus in the next pages.
Migration comes normally in “waves”. In the Euro-Mediterraneanregion, it is possible to recognize several major waves of migrationduring the contemporary epoch. The first wave, which started in thesecond half of the nineteenth century and that ended with the Second
* Director of the Migration Policy Centre at the Robert Schuman Centre for AdvancedStudies, European University Institute, Florence (Italy).** Research assistant at the Robert Schuman Centre for Advanced Studies, EuropeanUniversity Institute, Florence (Italy).

70
World War, was a North-South movement originally from France thenfrom Spain, Italy and Malta to the Maghreb, following the colonialexpansion of Europe into Africa. At the same time, another wave ofmigration took place from Mediterranean Europe – in particular fromSpain, Portugal, Italy and Greece – to North-Western Europe. The thirdwave started around the 1970s and is still underway. Here, migrantscame from the Middle East and North Africa (mena) and in part fromparts of the Balkans and Eastern Europe and headed towards WesternEurope, including, since the 1990s, Mediterranean Europe.
Authors from various disciplines(1) have noticed an approximate coin-cidence between the general chronology of migration waves and thedemographic transition. This connection between the long-term trendof migration flows and the development of the demographic transitionwill be the keystone for the present attempt to predict future migratoryscenarios.
This article is divided into two main parts. Part 1 analyses the demo-graphic forces that will impact international migration in the MiddleEast and North Africa over the next two decades. Part 2 attempts, ins-tead, to forecast the evolution of net migration rates in the Mediterra-nean region in the next 20 years(2).
1. Emerging demographic patterns across the Mediterranean
Senders turned into receivers of migrants
for almost three decades, between 1960 and 1990, the mena wasdivided into two sorts of countries: migrants-receiving vs. migrants-sending, or capital-rich vs. labour-rich, depending on whether or notthey were oil producers. The Gulf and Libya fell into the first categoryand all other countries into the second(3). This distinction no longerholds. Not only have all mena countries become oil producers(4), butoil has failed to create sufficient employment for nationals. Large oil-producers are now faced with domestic unemployment to which theyrespond with restrictive immigration policies, whereas the rest of mena
(1) Gozzini 2005 ; Hatton et Williamson 1998 ; Chesnais 1993 ; Livi Bacci 1992 ; Easterlin 1961. (2) Part 1 draws extensively from Fargues 2009. (3) Algeria, Iraq and Iran were at the same time oil and labour exporters.(4) Except Morocco, Jordan, Lebanon and Palestine.
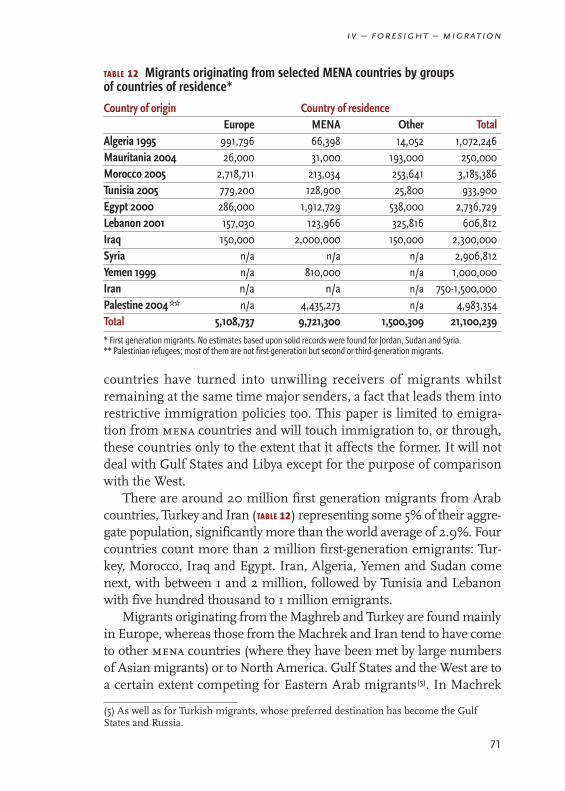
71
iv – foresight – migration
countries have turned into unwilling receivers of migrants whilstremaining at the same time major senders, a fact that leads them intorestrictive immigration policies too. This paper is limited to emigra-tion from mena countries and will touch immigration to, or through,these countries only to the extent that it affects the former. It will notdeal with Gulf States and Libya except for the purpose of comparisonwith the West.
There are around 20 million first generation migrants from Arabcountries, Turkey and Iran (TABLE 12) representing some 5% of their aggre-gate population, significantly more than the world average of 2.9%. Fourcountries count more than 2 million first-generation emigrants: Tur-key, Morocco, Iraq and Egypt. Iran, Algeria, Yemen and Sudan comenext, with between 1 and 2 million, followed by Tunisia and Lebanonwith five hundred thousand to 1 million emigrants.
Migrants originating from the Maghreb and Turkey are found mainlyin Europe, whereas those from the Machrek and Iran tend to have cometo other mena countries (where they have been met by large numbersof Asian migrants) or to North America. Gulf States and the West are toa certain extent competing for Eastern Arab migrants(5). In Machrek
TABLE 12 Migrants originating from selected MENA countries by groupsof countries of residence*
Country of origin Country of residence Europe MENA Other Total
Algeria 1995 991,796 66,398 14,052 1,072,246 Mauritania 2004 26,000 31,000 193,000 250,000 Morocco 2005 2,718,711 213,034 253,641 3,185,386 Tunisia 2005 779,200 128,900 25,800 933,900 Egypt 2000 286,000 1,912,729 538,000 2,736,729 Lebanon 2001 157,030 123,966 325,816 606,812 Iraq 150,000 2,000,000 150,000 2,300,000 Syria n/a n/a n/a 2,906,812 Yemen 1999 n/a 810,000 n/a 1,000,000 Iran n/a n/a n/a 750-1,500,000Palestine 2004** n/a 4,435,273 n/a 4,983,354Total 5,108,737 9,721,300 1,500,309 21,100,239
* First generation migrants. No estimates based upon solid records were found for Jordan, Sudan and Syria.** Palestinian refugees; most of them are not first-generation but second or third-generation migrants.
(5) As well as for Turkish migrants, whose preferred destination has become the GulfStates and Russia.

72
countries, migration to the Gulf and Libya is popularly thought of as“temporary” – administrative terminology also classifies it this way –whereas emigration to the West is “permanent”. But this does not cor-respond to a true divide and is not based on solid empirical evidence.The oil-producing states, exactly as the West, host both short-term andlong-term migrants, including second-generation migrants.
Emigration from Arab countries has gained momentum in the2000s after slowing down in the 1990s. During the period 1993-2005,the number of Moroccans registered with their consulates doubled,from 1.545 million to 3.185 million. Moroccan migrants have increasedat an annual rate of +6.0%, more than four times that of the residentpopulation of Morocco (+1.4% a year). The rise of Moroccan emigrationin recent years - at least until the world economic downturn started in2008 – is reflected in the numbers registering with their consulates:+92,195 a year in 1993-1997 (i.e. an annual growth rate of +5.4%),+132,804 a year in 1997-2002 (+5.9% a year), and +201,107 a year in2002-2005 (+7.0% a year). Other Arab countries such as Lebanon,Egypt, Tunisia and Algeria have also experienced an upsurge of emi-gration in the last decade. In Spain, the number of Arab nationals wasmultiplied by 4.6 between 1998 and 2006, representing an annualgrowth rate of + 21.9%. By contrast, emigration from Turkey and Iranhas continuously receded.
All mena countries have now become receivers of internationalmigrants. Some of these are labour migrants attracted by local labourmarkets, whether they are regularly or irregularly employed. Others arerefugees and transit migrants, largely unwanted by local governmentsand stranded in the region against their will. Each category has its ownlogics. Labour migrants respond to widening economic differentials bet-ween mena countries and their less developed neighbours in Sub-Saha-ran Africa and Asia; refugees have fled rising insecurity in several menacountries or in their African or Asian region; transit migrants are stuckon their way to their intended destination in the West or in the Gulf,which they cannot reach for lack of visa.
mena countries located in the European neighbourhood, i.e. Sou-thern and Eastern Mediterranean countries, host at least 5.6 millionimmigrants, including 4 million labour migrants (regular and irregularin roughly equal numbers), 1.5 million non-Palestinian refugees (mostof them without regular permits of stay) and 100,000 transit migrantsmostly trying to reach Europe (TABLE 13). These estimates, all conserva-

73
tive, show that immigration is now sizeable across the entire sem regionand that irregular migration is two times more common than regularmigration. One should not systematically view irregularity as a delibe-rate breach of the law, since in many cases it is the law that has chan-ged, transforming formerly regular migrants into irregular ones. TABLE 13
also shows that relatively few target Europe as a final destination. Thevast majority are workers attracted by local sem labour markets and refu-
iv – foresight – migration
TABLE 13 Regular and irregular immigrants in Southern and EasternMediterranean countries (early 2000s)
Irregular immigrants(7) RatioRegular irregulars
immigrants(6) Labour Refugees(8) Transit Minimum /regularstotal (minimum)
Algeria(9) 80,238 Tens of 95,121 Tens of �10,000 0.1thousands thousands
Egypt 115,589 Tens to hundreds 104,390 n.a. 100,000 0.9of thousands
Israel 189,000 100,000 1,700 n.a. 100,000 0.5Jordan 392,273 100,000 or more 519,477 n.a. 600,000 1.5Lebanon 302,315 400 - 500,000 22,743 n.a. 400,000 1.3 Libya 449,065 1.0 - 1.2 million 4,754 Tens of 1,000,000 2.2
thousands �Mauritania 48,000 Few thousands 861 Tens of � 10,000 0.2
thousandsMorocco 62,348 Thousands to 1,878 Tens of � 10,000 0.2
tens of thousands thousandsPalestine 422,000 0 n.a. 422,000 n.a.Syria 55,000 Thousands to 707,422 n.a. 700,000 12.7
tens of thousands Tunisia 35,192 Thousands to 161 n.a. 10,000 0.3
tens of thousands Turkey 272,943 Hundreds 8,852 Tens of � 300,000 1.1
of thousands thousandsTotal SEM 2,001,963 2-3 millions 1,467,359 �≥ 100 000� 3,662,000 1.8
Source: Fargues, Philippe, “Work, refuge, transit: An emerging pattern of irregular immigration South and Eastof the Mediterranean”. Article under review at the time of writing.
(6) Non-citizens or born-abroad residents according to most recent official records(census, survey or residency statistics). See Fargues, Ph. (ed.) Mediteranean Report2006-2007, Appendix Table 7, www.carim.org (7) Various sources for labour migrants and UNHCR for refugees.(8) UNRWA Palestinian refugees are not included because most are not migrants. (9) In Algeria, Sahrawi refugees are included in the residing population; most are notmigrants.

74
gees waiting for a peace settlement to return to their home country. Thesem region is not a waiting room for irregular passage to Europe somuch as a new importer of mostly informal labour.
While their moves have distinct motivations, irregular migrant wor-kers, refugees and transit migrants share a common fate in sem coun-tries where they have no legal access to labour welfare and protectionand subsist rather than prosper. They are not in semc because govern-ments opened their doors but rather because they did not close them.Now, faced with massive irregular migration, governments respond withpolicies and legislation that keep apart or exclude, but rarely integrate,immigrants. Nowhere do migrants enjoy rights and duties that wouldallow them to become fully-fledged actors in sem societies. As a result,they form an underemployed, under-protected but often over-skilledworkforce, whose availability contributes to keeping labour costs low.Irregular immigration has become a regulator of sem labour markets.As long as large segments of sem economies escape the control of thestate, irregular immigration is likely to keep growing in semc.
Will irregular migration into semc put ever more pressure on theEU? A number of facts have to be faced. At present, most irregularmigrants in semc do not contemplate crossing the Mediterranean. Mostirregular migrants to the EU have entered one of the Member States ina regular way, usually by air directly from their country of origin withouttransiting through a semc. Then, they have overstayed their visa whilein the EU. Migrants irregularly entering the EU after transiting throughthe semc are not growing in numbers so much as continuously inven-ting new routes to bypass patrols and military checkpoints as they crossthe Mediterranean.
The largest generations ever born now reaching working age
for decades Arab leaders and intellectuals have viewed population asa problem or, at least, a challenge. However, the nature of the problemhas changed, even though not everyone is aware of that change. Untilrecently, the problem was with rapid population growth due to highlevels of fertility, resulting births growing too rapidly. The solution wasseen in demography itself, namely in birth control. One after another,all Arab governments adopted programmes of family planning (exceptthe Gulf countries that saw their national population as too small fortheir labour needs).

75
iv – foresight – migration
Family planning eventually worked and annual numbers of birthsdid stabilize and even shrank. Maximum numbers of births were recor-ded in the 1980s or 1990s. The largest generations are no longer newly-born infants but young people reaching working age. Accordingly, thepopulation problem has shifted. It is now young adults aged 20-30 whorepresent the most sensitive age group with regard to demography. Ratesof population growth at 20-30 are higher than those of the total popu-lation and, in many cases, higher than the rates of growth of resourcesavailable to young adults. By “resources” is meant here everything thatmakes life possible, if not enjoyable, including agency and the capacityto decide for oneself. Earning and access to labour are key.
Falling birth rates are expected to translate into lessening pressureson mena labour markets after some 20 to 25 years. Indeed, populationaged 20-25 reach a maximum somewhere between 2005 and 2030according to when fertility started to decline (TABLE 14).
Despite the numbers of new entrants into labour markets stabili-sing or even decreasing in the near future, total working age popula-tions in the mena will continue to rise sharply during the next twodecades given that generations reaching working age will still be muchlarger than those reaching the age of retirement. Europe (EU27) will besubject to opposite trends, with a total working age population startingto shrink in 2010 and numbers of new entrants continuously decliningover the next two decades (TABLE 15, GRAPHS 9 & 10).
Could migration of working age population from the mena to theEU27 mitigate both trends, with surpluses in the former and shortagesin the latter? At first glance, the two phenomena do not have the samemagnitude: from 2005 to 2030 the total working age population isexpected to increase by 156.318 millions in the mena, but to decreaseonly by 23.666 millions in the EU. However, if one considers only new
TABLE 14 Year of maximum numbers at 20-25
Mostly sending countries Mostly receiving countries 2005 Morocco – 2010 Algeria, Iran, Tunisia – 2015 Lebanon Bahrain 2020 Jordan, Turkey – 2025 Egypt – 2030 + Iraq, Mauritania, Palestine, Sudan, Kuwait, Libya, Oan, Qatar,
Syria, Yemen Saudi Arabia, United Arab Emirates Source: UN Population database.

76
entrants on the labour market(10) – who are also the potential migrants– surpluses in the mena and shortages are much closer in size: from2005 to 2030 the number of individuals reaching their twenty-fifthbirthday will increase by 321 thousands per year in the mena anddecrease by 233 thousands in the EU27. From a quantitative point ofview, it seems that migration could help alleviate future imbalances.One should note that were Turkey to be admitted into the EU, its youn-ger and faster growing population would slacken the decrease of EU-aggregated young active population, but have no impact on the demo-graphy of individual Member States. Seen in this perspective,enlargement is not a substitute for migration.
New and larger generations are only one facet of the changes thatmena labour markets will go through in the next two decades. Not onlyhave high birth rates produced the largest generation ever born, nowsearching for employment, but recent declines in birth rates are lin-ked with other trends that sharpen the competition for employment.
TABLE 15 Demographic dynamics of MENA and EU labour markets (2005-2030) MENA EU27
Numbers Change (t, t+5) Numbers Change (t, t+5)Total Working Age Population POP15-64 in thousands
2005 286,836 + 35,587 330,137 + 2,2272010 322,423 + 32,029 332,364 - 3,9342015 354,452 + 30,196 328,430 - 5,5982020 384,648 + 30,048 322,832 - 7,0322025 414,696 + 28,458 315,800 - 9,3292030 443,154 – 306,471 – Total 2005-30 – + 156,318 – - 23,666
Annual Numbers of New Entrants POP25 in thousands 2005 8,744 + 818 6,533 - 1852010 9,562 + 293 6,348 - 3262015 9,855 - 85 6,022 - 4172020 9,770 + 51 5,605 - 2162025 9,821 + 530 5,389 - 252030 10,351 – 5,364 – Average 2005-30 9,684 + 321 5,877 - 234Source: United Nations, World Population Prospects, the 2006 Revision, Data Online http://esa.un.org/unpp/index.asp
(10) Schematically equated to population aged 25 years in table 15 and graph 9.

77
iv – foresight – migration
Indeed, birth control has at least two corollaries that tend to increase,rather than relieve, pressures on employment. One is the changingrole of women and the other the development of school education.
Women’s role in the family and society has started to change funda-mentally with the demographic transition. High fertility in the recentpast was linked with early marriage and low participation of women ineconomic activities, particularly in those taking place outside the house-hold, in the public space. Decreasing birth rates are correlated withdelayed marriage and increased participation of women in the workforce.As a result of a larger proportion of women seeking employment, thedemand for employment grows faster than the working age population.
Not only are the largest generations ever born now entering the Arablabour markets, not only do they now include both sexes, but they are
GRAPH 10 New entrants on the labour market and total working age populationRelative change 2000-2030
100
50
0
- 50- 25 0 25 50 75 100
MENAStates
UE27States
New entrants on labour market [POP25]
Totale working
age population [POP15-64]
Source:GiambattistaSalinari –CARIM, 2010
GRAPH 9 Working age population in the MENA* and EU27 (2000-2030) (millions)
2000 2010 2020 2030
400
350
300
250
200
MENA (sending) MENA (sending)
UE27
Population 15-64
2000 2010 2020 2030
UE27
100
90
80
70
60
50
Population 20-29
Source:UN population on-line database. * MENA(currently)predominantlysending countries:all MENAcountries exceptGCC and Libya.

78
increasingly educated. The spread of school education has been a keyfactor in the reduction of fertility and human capital is soaring. Thequantity of work needed as well as its quality have been disrupted inrelation to demographic change. Young persons entering the labourforce have received more education than old persons leaving it throughretirement or death, and therefore new jobs do not have the same pro-file as those left vacant. Even though in its 2008 mena DevelopmentReport, the World Bank stresses the insufficient achievements of menacountries with regard to the quantity and quality of education providedby their youth, labour markets seem to receive more people with a schooleducation than they can accommodate.
To summarise, mena labour markets are currently faced with unpre-cedented rates of growth, all much higher than the 1.7% annual rateapplied to the total population: current rates are as high as 3% for theworking age population; 4-5% for the actual demand for labour (inwhich a growing proportion of women must be included); 6-8% for thequantity of human capital (measured as the aggregate number of yearsspent at school among those entering the labour market minus thatnumber among those leaving the workforce).
The lifting of family constraints and the birth of the individual
is this massive demographic inflow on mena labour markets achance or a burden? There are two possible interpretations. The firstone is a rather optimistic view propagated by several international agen-cies in the last decade. According to that interpretation, demographicchange is a “gift” for it opens a window of opportunity to endogenouseconomic development(11). As a consequence of sharp but recent declinesin the birth rates, the dependency ratio(12) is at low ebb. This will not lastfor declining birth rates will soon end up in an ageing population andthe child dependency of the recent past will give way to old-age depen-dency (TABLE 16). In other words the proportion of potentially active toinactive population is exceptionally high.
For young people now beginning their working life, the future bene-fits of their work are no longer mortgaged to support numerous children(as was the case until recently), or the burden of the aged (as will soonbe the case). This is a situation favourable to savings and investment.
(11) Bloom 2003, World Bank 2007, Assaad and Roudi-Fahimi 2007. (12) Defined as the ratio of the sum of the population aged 0-14 and that aged 65+ to thepopulation aged 15-64.

79
iv – foresight – migration
Investment can now be economic rather than demographic: it may serveto improve the quality of life of future generations rather than to meetthe demand effect of the population explosion. mena countries would,according to this thesis, be at a privileged moment in which they enjoya population dividend. GRAPH 11 shows three series for the aggregatedmena population: • The green line (“intra-generational competition”) represents the sizeof the generation born 25 years earlier (approximately the annual num-ber of new potential entrants onto the labour market): it climbs steadilyuntil 2010 then stabilises for around 15 years before climbing again, butat a slower pace.• The blue line (“inter-generational burden in children”) shows thetotal fertility of the generation described above: it has continuously decli-ned until now(13) and is expected to continue to decrease over the wholeperiod (projected total fertility rates) ;• The red line (“inter-generational burden in old persons”) figures theaverage number of living parents per sibling in a family(14): it is stableuntil 2005 (generation born in 1975) then climbs sharply and conti-nuously until 2025.
Generations born between 1975 and 1995, i.e. the young adults oftoday, would benefit from a favourable but short-lived demographic giftthat can yield a dividend for the entire population.
TABLE 16 Year when the ratio [old persons / young adults] passes over 0.33
Mostly sending countries Mostly receiving countries 1950 or before Lebanon Israel 1965 Turkey – 1975 Egypt, Tunisia Bahrain, United Arab Emirates 1980 Morocco Kuwait, Qatar 1985 Algeria, Iran Libya 1990 Mauritania, Iraq, Jordan Saudi Arabia 1995 Sudan Oman 2000 Palestine, Yemen – Source: Giambattista Salinari based on UN Population database.
(13) 2005: last index based on actual data.(14) Computed as the product of the number of parents at birth (two) by their probabilityof surviving 25 years later (survival probability from 30 to 55 if the mean age atchildbearing is 30) and divided by the number of siblings surviving at 25: 2 [l(55,g-30)/l(30,g-30)] / ISF(g) l(25,g).

80
What impact will the demographic gift have on international migra-tion? The literature is silent on the topic, but one may assume that deve-lopment made possible by dependency rates at their lowest will soonreduce the root causes of emigration and international migration willslow down. The problem with this interpretation, however, is that foryoung people to be able to save, they need to work and earn a sufficientincome. This is not an easy task in countries confronted with highunemployment, underemployment, low wages and poor returns on edu-cation. On average, it takes a young educated person two to three yearsto find first employment, then again two to three years to accumulateenough savings for his or her marriage. Transition to adulthood occursat the price of a long period of expectation and exclusion(15).
In Algeria, a country where oil wealth could never translate into jobopportunities for everyone, unemployment is the lot of 31% young adultsat 20-24 and 26% at 25-29 (ons 2005). In Morocco unemployment ishighest among the young (33% at 15-24 years and 26% at 25-34 in urbanareas), and highly-skilled persons (24% of people with a diploma areunemployed, against 9% of those with no diploma). Between 1999 and2004, unemployment has declined for every category except those witha university degree and the higher the diploma the higher the probabi-lity of being unemployed. Unemployment starts as soon as educationends, and the higher the education received the longer the duration ofsubsequent unemployment. Two out of three first job seekers with auniversity diploma are unemployed for more than one and for up tothree years (cered 2005).
GRAPH 11 The demographic dividend in the MENA region. Demograhic competition and burden at 25 years
2
1
0
- 1
- 2
1975 1985 1995 2005 2015 2025
Generationborn in 1975
Generationborn in 2025
Standardized index
[x -
average(x)] / standard
deviation(x)
Intra- generational competition
Intra- generational burden – 1 : in old persons
Intra- generational burden – 2 : in children
Source:GiambattistaSalinari –CARIM, 2010.
(15) Dyer and Yousef, 2008.

81
iv – foresight – migration
From that point of view Morocco and Algeria are average menacountries, not exceptions. The mena 2004 Development Report of theWorld Bank, after stating that “when demographic burden becomes ademographic gift […] the growth of economically active population will exceedthat of the economically dependent population by a much greater magni-tude than in any other region”, observes that “the dynamics of demographyin mena have created some of the most intense pressures on labor marketsobserved anywhere in the post-wwi period. […] Unemployment is highest forgroups in the middle and upper end of the education distribution”. In rela-tion to educated people remaining unemployed, the 2008 mena Deve-lopment Report of the World Bank states that “the impact on developmentof the considerable education progress recorded in the region has been lessthan expected”. If young people are not offered work and rewards fortheir education, then the demographic gift may prove a demographicmirage.
An alternative interpretation of demographic change leads to a morerealistic view. It acknowledges another face of low birth rates, i.e. thatfamily constraints of earlier times are lifted for new generations. Due totheir own (expected) low fertility, they no longer bear the burden ofnumerous children. Due to their mothers’ high fertility, they still havenumerous siblings to share the burden of old persons. As a result, youngadults today bear fewer family burdens. From a demographic point ofview, the Middle East is now witnessing the birth of the individual. Forthe first time, there is personal freedom in movement. Demographysets the backdrop against which young and often educated adults nowarrive on Middle Eastern labour markets, freed from family charges.The freedom of movement which has been gained through demogra-phic change also entails a certain level of individual availability for risk(16).
More human capital flooding into the labour market engenders morecapabilities, but also more expectations. Human capital has a potentialfor progress but also for protest. If expectations are frustrated, then theresponse can be anything from voice to exit. The voice response, illus-trated by the Arab revolutions, occurs when the demand for politicaland social empowerment grows among young people that are more edu-cated than ever before. A statistical analysis of political violence in Egypt,in the early 1990s, showed striking correlations between the rise of edu-
(16) This interpretation goes against the ‘new economics of labour migration’ that viewsindividual migration as a choice made collectively by the family for one of its members,as an insurance against risk (Stark…).
82
cation, the speed of birth rates decline, urban growth and the rise of vio-lent extremism(17).
The exit response to frustrated expectations may take the form ofemigration. Surveys of Middle Eastern youth reveal that the proportionof young people who wish or intend to emigrate ranges from a quarterto an enormously high three quarters of an age group, according tocountries. In the second half of the 1990s, a eurostat-coordinated sur-vey already found high proportions: 14% in Egypt, 27% in Turkey and20% in Morocco. More recent surveys unveil far higher numbers. Tuni-sia (before the revolution), a country with a successful economy, but astalled democratisation process, is a case in point (TABLE 17): in 2006,76% (against 22% in 1996 and 45% in 2000) of the age group 15-29declare that they are contemplating emigration as an option. Many ofthem may simply dream without making concrete plans or taking actualsteps, but their dream tells much about the deep discomfort that is nowcommon among the young in the mena.
Future patterns of migration will not resemble those of the past andnot even those of the present day. Family profiles of young menamigrants are going through radical changes. Yesterday, migrants had afamily back home and their emigration was motivated by a drive to feedand educate their families. Remittances was the main reason for lea-ving the country and in many cases, return was part of the migrationproject. Tomorrow, young emigrants will typically have no children orwives and their goal will rather be self-accomplishment.
will conflicts and wars produce more migrants in the comingdecades? One has to acknowledge that they have continuously done soover the last sixty years as brought out by the (incomplete) list below(18).• The Palestine/Israel conflict (open wars of 1948-49 and 1967 andlow intensity wars in the early 2000s) caused a great deal of migration.Directly and locally, they produced the Palestinian exodus. Indirectly, ithad an impact on the whole Arab Middle East. The protracted conflictserved as a pretext for Arab authoritarian regimes to stay in power, clai-ming solidarity with the Palestinians while belligerence with Israel offe-red them a strategic resource for legitimizing state violence. This hadtwo contrasted outcomes for migration: states put administrative obs-tacles to the emigration of their citizens (during the Cold War), but
(17) Fargues, 1994.(18) Fargues, 2002.

83
iv – foresight – migration
political repression combined with poor economic performance alsofostered emigration.• The October 1973 War between Israel and Egypt indirectly triggereda massive wave of Egyptian migration to the Gulf through the strategicalliance between Egypt and Saudi Arabia: oil became a new weapon ofwar and its soaring price soon resulted in equally soaring demand forimported labour in the Gulf, while the supply of Egyptian labour wassuddenly made possible by President Sadat’s open-door policy.• The Gulf War of 1990-1991 resulted in three million legal immi-grants being driven out their host country. Most of them were Arab citi-zens who were suspected of disloyalty because they bore the wrong citi-zenship. In Iraq, Egyptian migrants originating from a country now atwar with Iraq; Yemenis in Saudi Arabia and Palestinians in Kuwait, bothcoming from countries supporting Iraq. But hundreds of thousandswere Asian migrant workers fleeing the battlefield.• The American invasion of Iraq in 2003, which soon resulted in thelargest flow of refugees in the Middle East since 1948.• Other conflicts also had an impact on migration: the Iran-Iraq warof 1979-1988 and a myriad of civil wars like those in Yemen in the1960s, in Lebanon in the 1970s-80s, in Algeria in the 1990s and inSudan in the 1990s and 2000s.
TABLE 17 Wish to emigrate among Tunisian youth (1996-2005) Percentage of young persons who declare that they wish to emigrateNational representative sample [sample size: 20,000 in 1996; 10,000 in 2000; 10,000 in 2005]
1996 2000 2005 Sex Male 29 54 84
Female 14 37 66 Age 15-19 21 44 76
20-24 24 47 7725-29 23 45 74
Instruction Illiterate 6 3 66Primary 19 45 77Secondary 26 49 77University 24 46 73
Activity Employed 25 48 77Unemployed 31 54 85Student 26 48 75
Total 22 45 76 Source: Fourati, Habib 2008. Consultations de la jeunesse et désir d'émigrer chez les jeunes en Tunisie 1996 – 2005. CARIM.

84
• More recently, the Arab revolt resulted in flows of refugees notonly from countries in transition (Tunisia, Egypt) but mainly fromLibya because of the nato intervention and from Syria because of therepression.
Without offering scenarios for future conflicts in the mena, one mustcite a number of dangerous situations that may trigger large movementsof peoples: the unresolved Israel-Palestine conflict; Iraq under foreignoccupation; ethnic conflicts in Sudan; religious tensions between Mus-lims and Christians in Sudan, Lebanon, Iraq and Egypt; religious ten-sions between Shia and Sunni Muslims in Iraq and Lebanon; exposureof migrant workers to changing legislation on entry, stay and labour inGulf Cooperation Council countries and Libya.
Freshwater scarcity may become a source of acute tensions in themena, even though no one can say with any certainty that nations wouldgo to war over water appropriation(19) or that water disputes might engen-der migration. The Nile may soon become the subject of intense rivalrybetween ten countries with fast growing populations including Sudan– since the late 1990s an oil-rich country with ambitious irrigation plans.Other potential or actual conflicts over water exist between Syria andTurkey (the Euphrates), Israel and Jordan (the River Jordan) and bet-ween Lebanon and Syria (the Oronte).
2. Forecasting Mediterranean migration
The theoretical framework
the link between demographic transition and mass migration frommena countries has been emphasized by several authors(20), and stres-sed in the previous section of this work. The first task of our forecastingexercise will therefore be that of clarifying, by using pooled time seriesanalysis, the exact role played by the demographic covariates in theupsurge of this wave of mass migration.
The possibility of linking the long-term development of migrationsto some demographic covariates will be the key in our subsequent pre-diction, because if this link exists, if the demographic transition is fol-
(19) Goldstone, 2001.(20) De Haas, 2007, 2005 ; Fargues 2002 et 2009, 2000, 1986 ; Rashad 2000 ;Courbage 1999.

85
lowed by mass migrations some years later, then this link can be reaso-nably employed to predict the development of future migrations.
The theoretical framework that we will follow in the next pagesdeviates in some respects from the “mainstream” conceptualization ofmigration processes. The most relevant difference is probably the pro-minence that we accord to demographic/political shocks as triggers formigration, rather than to income differentials. In our understanding,income differential has a fundamental role in deciding migration flows,but alone it cannot be considered a sufficient condition for emigration.According to our model, migration processes can be thought, instead,of being subdivided into four different phases:
The origin of migration flows. At the origin of most cases of massmigration (at least, in the Euro-Mediterranean region during the period1950-2010) there is a shock. This shock differs from country to coun-try: it may be an economic shock, as in the case of the migration fromAlbania, after the “Pyramid Crisis” (1997); it may be a shock producedby war, as in the Palestinian Diasporas (1948 and 1967), the Yugosla-vian Wars (1991-1995), the October 1973 War the political repercus-sions of which made mass emigration from Egypt possible, the Iran-Iraq War (1980-88), the Gulf War of 1990 and the Iraq War of 2003,etc.; it may be a political-institutional shock, such as the decoloniza-tion process (‘50s-‘70s), or the fall of Berlin Wall (1989). These shocksare easily detectable, and the causal relationship between them and theupsurge of migration flows seems straightforward.
In other cases, however, the shocks are less evident, and we suggestthat this is the case with the demographic transition process(21). A steepreduction in the mortality rate engenders a multiplicity of effects that arenot always easy to recognize, not least because of their delayed nature.In a rural economy, the demographic transition will initially change theratio between population size and available farmland. This change willbecome apparent a few years after the onset of the decline in mortality,when the increased number of survivors puts both the traditional sys-tem of devolution of wealth from one generation to the next (inheri-tance and dowry) and the process of family formation under stress. Atthis point two forms of migration generally take place: urbanization firstand international migration later(22).
iv – foresight – migration
(21) Zelinsky, 1971.(22) Cuberes 2009; Dyson 2001

86
For the study of such processes, much of the necessary informa-tion is simply not available. We can, nevertheless, try to use a small setof demographic indicators in order to initially test the long-term asso-ciation between migration and the demographic transition. The indi-cators that we selected for this analysis are: population density(23), pro-portion of urban population, rate of natural increase, urban growthand median age.
The orientation of migration flows. Once the general conditions formigration have been primed by an initial demographic/political shock,a different set of factors come into play, turning migration flows towardstheir destinations. Among these factors some economic variables, likeincome differentials, the unemployment rate and the level of education(as a proxy for human capital) play a fundamental role. The economicvariables, however, are not the only factors at play in this process: othervariables also matter, e.g. the geographical and the cultural proximity, thepresence of pre-existing colonial ties, or the presence of pre-existingmigrants’ communities in the receiving regions, etc.
Economic theory(24) predicts that the net migration rate is positivelyassociated with gdp per capita and higher level of education, and nega-tively associated with unemployment.
The self-reinforcement of migration flows. A fundamental aspect ofthe first migrants’ communities is that they are, to a certain extent, capa-ble of self-feeding themselves through the mechanism of chain migra-tion(25). This phenomenon appears to be generally subdivided into twodifferent stages. In the first stage, the existing stock of mainly youngmale migrants will attract a population characterized by the same demo-graphic characteristics from the sending regions. As time goes by, never-theless, the capacity of attraction starts weakening and a second stagebegins in which migration appear to be driven mainly by family reuni-fication. Due to family reunification, the demographic characteristics of
(23) Population density can be computed as the ratio of total population to the nationalterritory or only to the fraction of that territory which is inhabitable, or arable. The twoindexes diverge considerably on the Southern shore of the Mediterranean where desertland occupies a large proportion and, in cases, most of the national territory. While inpredominantly agricultural or pastoral economies, population pressure is expected to bereflected by the density of inhabitable land, in modern diversified economies of the menathe availability of national space is also expected to matter.(24) Massey & al. 1993; Jennissen 2003; Bijak 2006; Boeri 2001; Venturini 2004. (25) Massey 1993: 449.

87
migration flows show during this second stage a more even genderbalance. We can, therefore, theorize a negative association between theprevious migrants stock and the current net migration rate. The pro-blem is that we lack the information concerning past emigrant stocks.To integrate this process into our model we have, therefore, used asproxy variable, the ratio between female and male population in the ageclass 20-49.
End of emigration and migration transition. As time goes by and thepopulation finds a new equilibrium, migration outflows start to decrease.In those countries where the initial shock was given by the demographictransition, the population undergoes an aging process caused essentiallyby the reduction in fertility. The aging process has implications for migra-tion. One important determinant of the fertility reduction is the will togive children more chances of social promotion (for instance by allowingthem access to the higher levels of education). Social mobility of thiskind(26) causes a vacancy in the lower sectors of the labour market, whichis a precondition for the attraction of new immigrants. This is, in part,how countries turn from sending to receiving countries.
A first inspection of data
the bulk of our dataset is based on the 2008 Revision of theWorld Population Prospects published by the Population division of theUnited Nations(27). This data spans a century, from 1950 to 2050, andprimarily concerns national aggregates. For the sub-period spanningfrom 1950 to 2010 the un Population division provided estimates of themain demographic indicators concerning the stock and the flow ofpopulation with a periodicity of 5 years (12 time intervals).
The un Population division declares that, from a general point of view,three different procedures have been followed to produce the estimates: • in the case of developed countries the estimates are based comple-tely on official statistics produced by the national statistic offices; • for less developed regions, estimates are frequently based on indirectestimation and models; • in some rare cases, when no data are available, the estimates arebased on a consideration of the demographic evolution of countries with“similar socio-economic profile”.
iv – foresight – migration
(26) Billari and Dalla Zuanna 2008: 24. (27) www.un.org/esa/population

88
The first strategy applies to all the countries on the Northern Medi-terranean shore. The second strategy, conversely, applies to many coun-tries on the Southern Mediterranean shore.
In the Maghreb and in the Machreck the civil registers have existedfor a long time(28). Since the 1960s the quality of data collected hasgreatly improved, and the United Nations estimate that, in 2001, thecivil registries of Algeria, Egypt, Libya and Tunisia covers more than90% of mortality(29). The majority of the countries in the Maghreb andin the Machrek region have, moreover, carried out between 4 and 6 cen-suses from the 1960s with a periodicity of about 10-12 years. Only Mau-ritania has three censuses(30) while Lebanon’s only census goes back to1932 and since then the country has conducted only one national demo-graphic sample survey, in 1970. Besides this data many surveys existconcerning fertility and health: Morocco, Egypt, and Jordan are parti-cularly well covered with respectively 8, 8, and 6 surveys realized sincethe 1970s. In summary, it seems reasonable to state that, from the 60sonwards (with the exception of Syria, Lebanon and Mauritania), un esti-mates concerning the Euro-Mediterranean region have been based ona wide range of different and reliable data sources.
The un World Population Prospects only provide the rate of netmigration. This information has been generally estimated through thedifference between total population growth and natural populationincrease. The use of a net migration rate has been heavily criticized inpast years(31), but despite this fact it has continued to be used in empiri-cal research works(32). In our understanding the use of the net migrationrate as a dependent variable in a regression analysis presents threeadvantages over other possible indicators.
First, this index has been put together from the most basic demo-graphic information: the total population, the number of births and thenumber of deaths. These basic variables are much less affected by sys-tematic bias than those concerning emigration rates, especially in theperiod from 1970s onward. It is, indeed, true that every measurementerror committed in the estimation of these three basic variables affectsthe estimation of the net migration rate, but this is not a real problem
(28) Since 1840 in Egypt, since 1882 in Algeria, since 1908 in Tunisia, since 1923 in Syriaand since 1925 in Morocco (Tabutin and Schooumaker 2005: 618).(29) Tabutin and Schooumaker 2005: 618. (30) Tabutin and Schooumaker 2004: 588. (31) Rogers, 1990. (32) Jennissen, 2003.

89
insofar as the measurement errors are independent from each other.Second, as the net migration rate is estimated using very basic infor-mation, longer time series are available. The net migration rate has,finally, a third advantage in comparison with migrant stock as only theformer, not the latter, is sensitive to short-term changes in migration.Political shocks, as we will see, can, indeed, strongly bias the regressionanalysis and hide fundamental processes at stake. Cross-sectional regres-sion analyses of migrant stocks generally do not allow any control overthe effects arising from political crises (because the information aboutstocks and the occurrence of political crises are generally not contem-poraneous, and because at a given time migrants stocks may result fromthe cumulated effect of several previous political crises). Net migrationrate, conversely, means that political shocks can be checked for.
Besides the estimated demographic indicators, the Population divi-sion provides a set of eight different variables of projected indicatorscovering the period from 2010 to 2050, always with a periodicity of5 years. The different population projections have been obtained byapplying different sets of hypothesis on the future trends of mortality,fertility and migration. Among these eight different variants, we chosethe so-called “medium variant” which the Population division itselfdefines as the most likely.
To obtain information on economic variables covering the periodfrom 1950 to 2010 we used two different sources: the time series of gdpper capita comes from the Maddison Historical Statistics of the World Eco-nomy(33), while information concerning the diffusion of tertiary educa-tion has been taken from Barro and Lee (2010)(34). In the case of Bosnia,Croatia and Serbia the data concerning gdp per capita for the period1950-1985 are missing and, therefore, have been calculated, assumingthat the growth rate in these regions was the same as that recorded inYugoslavia during the period 1950-1985.
We selected for our analysis the most relevant countries belonging tothe Euro-Mediterranean area where data are available. The 16 majorcountries forming this area have been broken down into 4 major regionswith a similar general timing in the onset of the demographic transition.TABLE 18 shows the detailed list of macro-regions and countries. From ourset of countries we excluded the Occupied Palestinian Territories andSlovenia because data on gdp per capita and the educational attainment
iv – foresight – migration
(33) www.ggdc.net/maddison(34) www.cid.harvard.edu/ciddata/ciddata.html

90
were not available. We exclude also Lebanon because of the huge effectsproduced by political shocks on migration 1950-2010 and because of thelack of demographic information.
GRAPHS 12 and 13 show a simple bivariate analysis, for the period 1950-2010, using only simple indicators. In GRAPH 12, we look for a general sta-tistical association between net migration and tertiary education, urbangrowth, gdp per capita and proportion of urban population. The firstthing to be noted looking at it is the strong dispersion of points aroundthe trend: gdp per capita and tertiary education, as predicted by econo-mic theory, show a positive linear association with net migration rate,
TABLE 18 Geographical classification of the Euro-Mediterranean region
South Europe Italy, France, Portugal, SpainBalkans Greece, Albania, Croatia, SerbiaMaghreb Algeria, Mauritania, Morocco, TunisiaMachrek Egypt, Israel, Turkey, Syrian Arab RepublicSource: Giambattista Salinari - CARIM
GRAPHIQUE 12 Relationship between net migration rate (on the ordinate)and tertiary education, urban growth, GDP per capita and proportion of urban population (on the abscissa) (1950-2010)
Tertiary education
Urban growth
GDP per capita
Proportion of urban population
The solid lines represent the regression of net migration rates onthe independent variable. The dotted lines indicate the linearregression of net migration rates on the independent variableexcluding Mauritania. The circles point out Mauritania.
Source:UN Population Division (2008).

91
nevertheless the cloud of points is largely dispersed around the predic-ted values. The proportion of urban population and the level of urbangrowth show a complex path. The graphs indicate a clear linear rela-tionship in the expected direction (positive for the proportion of urbanpopulation and negative for urban growth), with only one country, Mau-ritania, clearly outside. Mauritania shows, at the same time, the lowestproportions of urban population and the higher urban growth rates, andboth these conditions are associated with low levels of emigration. Of allthe countries under scrutiny, Mauritania is, by far, the most delayed inthe demographic transition, and it is possible that, in the early phasesof such process, all the effects of the demographic transition on emi-gration are absorbed by urban growth. In this case, the relationship bet-ween urban population, and urban growth and emigration might benon-linear.
In the second panel of graphics (GRAPH 13), we look for a statisticalassociation between net migration and past migration stock, median
iv – foresight – migration
GRAPH 13 Relationship between net migration rate (on the ordinate) and pastmigrant stock, density, rate of natural increase and median age (on the abscissa) (1950-2010)
Source: UN Population Division (2008)
Past migrant stock (proxy)
Density
Median age
Rate of natural increase
The black line represents the regression of net migration rateson the independent variable. The orange circles point out a setof disruptive events that produces an abnormal value ofimmigration. The blue circles point out a set of events producingan abnormally low level of net migration rate.

92
age, rate of natural increase and population density. The relationshipbetween this second group of variables and net migration rates have theexpected sign. Nevertheless a set of different political events seems inpart to be masking the real strength of this relationship. On the onehand, we have, in fact, a set of disruptive events that produces an abnor-mal value of immigration (orange circles): the waves of migrants direc-ted towards Israel; the refugees of the Iraqi wars directed towards Syria;and the regularization of migrants in Portugal, Spain and Italy. On theother hand, we have a different set of events that produces an abnor-mally low level of net migration (i.e. high emigration rate: blue circles):the decolonization process in Algeria and Tunisia; the loss of coloniesby Portugal; the Yugoslavian Wars and the collapse of the communistregime in Albania. These political shocks make it more difficult to detectthe effects produced by the demographic transition process on interna-tional migration.
Three major facts seem, therefore, to emerge at the end of this firstinspection of the un’s historical data concerning migration in the Euro-Mediterranean region: • The importance of political crises as triggers for international migra-tion flows. • The opposite effect produced by crises on the countries directly affec-ted, and on their neighbours. • The importance of checking for political and economic shocks tofind out the long-term connection between the demographic transitionand mass migration flows.
Building the model
in the present section we will present a more detailed analysis ofthe role played by political shocks, the demographic transition, migra-tory chains and economic variables in the surge of mass migrationwaves during the period 1965-2010 in the Mediterranean region. Thispart of the work will make use of pooled time series analysis as analyti-cal tool for disentangling the effects produced by these different pro-cesses on migration. Once the different components of migratory pro-cesses have been disentangled, the estimated regression coefficients willbe applied to the projected series of our variables in order to estimate thenet migration rates for the Mediterranean region during the period2010-2030.

93
The most sensitive part of the analysis has been that of identifyingthe political events significantly affecting net migration rates. TABLE 19 pre-sents the list of political shocks that we have considered in our analysis,along with the area potentially concerned by their direct or indirecteffects.
To find out the countries that were significantly influenced by theeffects of such political events we have built, as a preliminary measure,two dummy sets: one for each of the 16 countries and the 4 macro-areaslisted in TABLE 18 and one for each of the 9 major political shocks presen-ted in TABLE 19. The interaction between these two dummy sets allows usto check for the impact exerted on a given country (or macro-area) by agiven political crisis. To verify the statistical significance of the politicalshocks on the net migration rate of a given country we have then per-formed a step-wise regression (not shown here). The step-wise regres-sion selected 17 historical configurations (country + shock) in which apolitical shock has exerted a statistically significant effect on migration.The list of these historical configurations can be found in the dummysection of TABLE 20.
After having identified the most important political shocks duringthe period 1965-2010, we performed four different pooled time seriesanalyses. As a preliminary analysis, we performed an ordinary regres-sion analysis without taking into account the effects produced by thepolitical shocks. The result was a poor model fit (Adj. R2 = 0.27). Theonly significant variables are gdp per capita, the proportion of populationwith tertiary education and population density.
iv – foresight – migration
TABLE 19 List of political shocks
Political\Economic Shock Period Involved Regions
Oil Shock 1970-1979 Machrek, Southern Europe Berlin Wall 1990-1999 Balkans, Southern Europe, Israel Yugoslavian War 1990-1994 Balkans; Southern EuropeAlbania Anarchy 1995-1999 Balkans; Southern Europe Gulf War 1 1990-1994 Machrek; Maghreb Gulf War 2 2000-2009 Machrek; Maghreb Decolonization 1965-1969 Southern Europe, Machrek; Maghreb Regularization 1 1995-1999 Southern EuropeRegularization 2 2000-2004 Southern EuropeSource: Giambattista Salinari - CARIM

94
We then ran a second regression, checking also for political crises.This time the fit of the model improved greatly (Adj. R2 = 0.85), and allour economic and demographic variables become statistically signifi-cant with the exception of tertiary education. The Durbin-Watson testnevertheless identifies in this model the presence of significant serialcorrelation. We then performed our third model controlling this time forthe effects produced by political shocks and for the presence of serial cor-relation. The results of this operation largely confirm the results obtai-ned through the second model.
Finally, because reverse causation may exist between net migrationrate and median age, we introduced an instrumental variable into ourbaseline model (model 2). We chose life expectancy at birth (e0) as aninstrument for our two stages least square estimation, supposing thatthe effect of this variable on net migration would be entirely “captured”by median age and that e0 is not influenced by net migration rate. Theestimated coefficient for median age in the two stage regression (model4) is smaller than that estimated through ordinary linear regression(model 2), but the difference between the two coefficients is not statis-tically significant. This means that reverse causation has a small andprobably non-significant effect on median age. The exclusion of tertiaryeducation from the set of the major determinants of migration is pro-bably one of the more striking results of our analysis. This fact, never-theless, can be, at least in part, justified. Economic theory states that thelevel of education is a proxy for human capital and predicts a positiveassociation of this variable with net migration rate(35). Higher levels ofeducation are nevertheless known to be negatively associated with netmigration rates in several countries (like in Morocco or Tunisia for ins-tance) where in recent years governments have greatly invested in secon-dary and tertiary education. These investments have added to the num-ber of young people with high level of education without transformingthe economic structure and political regime of these countries. There-fore, young people with high levels of education tend to be associatedwith high rates of unemployment and emigration(36). It is possible thatthese contrasting results for the connection between education and netmigration (the more general predicted by economic theory and the morelocal found in countries like Morocco and Tunisia) are both at play in our
(35) Jennissen 2004: 174. (36) Fargues 2009: 14.

95
iv – foresight – migration
TABLE 20 Regression analysis: Net migration rates in the Euro-Mediterraneanregion (1965-2010)
Model 1 Model 2 Model 3 Model 4No Shocks with Shocks Shocks and Instrumentale
AR(1)Correction Variable e0
Variables Value Pr(>|t|) Value Pr(>|t|) Value Pr(>|t|) Value Pr(>|t|)
(Intercept) 34.20 0.43 48.03 0.02 48.91 0.03 46.92 0.03
Urb. Growth -60.05 0.42 -63.43 0.07 -65.48 0.07 -61.32 0.09 (Urb. Growth)2 25.52 0.41 26.17 0.07 27.03 0.08 25.33 0.09 GDP per capita 0.00 0.00 0.00 0.02 0.00 0.04 0.00 0.05 Tertiary Education 0.21 0.01 -0.04 0.47 -0.03 0.56 -0.04 0.53 Emigrant Stock -1.29 0.88 -14.00 0.00 -13.72 0.00 -13.95 0.00 Density -0.02 0.06 -0.02 0.00 -0.02 0.00 -0.02 0.00 Median Age -0.04 0.53 0.15 0.00 0.15 0.00 0.14 0.06
Israel – – 6.04 0.00 6.08 0.00 5.81 0.00Albania: BerlinWall – – -14.75 0.00 -14.72 0.00 -14.91 0.00Balkans: BerlinWall – – -5.76 0.00 -5.63 0.00 -5.61 0.00Croatia: YugWar – – 10.76 0.00 11.12 0.00 10.73 0.00Egypt: OilShock – – -2.33 0.08 -2.30 0.10 -2.34 0.08Greece: YugWar – – 7.20 0.00 6.55 0.00 7.28 0.00Israel: BerlinWall – – 6.52 0.00 6.37 0.00 6.46 0.00Israel: PalDiasp2 – – 1.83 0.38 1.14 0.58 1.97 0.37Israel: GulfWar1 – – 9.17 0.00 9.35 0.00 9.22 0.00Italy: Reg1 – – 4.10 0.04 4.23 0.03 4.06 0.04Italy: Reg2 – – 3.23 0.10 3.32 0.09 3.20 0.10Portugal: OilShock – – 21.54 0.00 21.15 0.00 21.52 0.00Portugal: ColWar – – -16.53 0.00 -16.16 0.00 -16.47 0.00Serbia: YugWar – – 14.55 0.00 14.05 0.00 14.48 0.00Serbia: Reg1 – – -6.97 0.00 -7.26 0.00 -6.83 0.00Spain: Reg1 – – 9.14 0.00 8.86 0.00 9.16 0.00Spain: Reg2 – – 4.52 0.02 4.25 0.04 4.50 0.03Syria: GulfWar2 – – 6.65 0.00 6.79 0.00 6.54 0.00
AR(1) – – 0.12 –Adj. R2 0.27 0.85 – –Durbin Watson stat 1.44 1.82 2.01 2.00Source: Giambattista Salinari – CARIM, 2010

96
data. These two opposite trends might combine to produce this lack ofstatistical association between education and migration.
In order to describe the non-linear relation between urban growthand international migration we used a second-order polynomial equa-tion whose coefficients are both significant at a 10% threshold. Thisfact seems to confirm our former discussion concerning Mauritania. Inthe case of very high levels of urban growth, and in the context of thebeginning of the transition process, international migration seems notto be prevalent. Both the past emigrant stock and the median age pre-sent significant negative associations with net migration rate. As wediscussed in the theoretical part of this work the median age is one ofthe variables mostly influenced by the demographic transition becauseit results from the combined effect of the past evolution of fertility andmortality rate.
Population density, finally, shows a significant negative associationwith the net migration rate. It must be noted that population densityhas not, in general, a straightforward relation with demographic pres-sure on land – and therefore migratory pressure – that one would intui-tively think. Indeed, the proportion of inhabitable land varies greatlybetween countries and is exceptionally low in most countries of the Sou-thern shore of the Mediterranean where a large part of the territory isdesert. Egypt, for example, had a population density of 74 inhabitantsper square kilometre of national land in 2005, but 95% of its territoryis uninhabitable Sahara, and it has a population density of 1,478 inha-bitants per square kilometre of non-desert land, i.e. one of the highestpopulation pressures on inhabitable land recorded from anywhere inthe world. Population density used in the model below therefore reflectsthe availability of national space per capita, which may differ greatlyfrom the availability of economically useful space. The fact that popu-lation density shows a significant negative association with net migra-tion rates implies nevertheless that, other conditions being equal, thehigher the density the lower the net migration rate (and therefore thestronger the migration outflows). It is then worth noting that the connec-tion between density and net migration has now the opposite sign ifcompared with the type of association shown in the previous bivariateanalysis (GRAPH 13). This is likely a consequence of the fact that in the pre-sent analysis we are controlling for other covariates like median age,gdp per capita, urban growth rate, etc.

97
iv – foresight – migration
Thanks to this fact, we are able now to analyze the relationship bet-ween density and net migration “within” each of the two groups of tran-sitional and post-transitional populations (Northern/Southern shore).What we found in the framework of the regression analysis can thus besimplified by saying that a transitional population characterized byhigher density shows higher emigration rates than a transitional popu-lation characterized by lower density. In other words, the present regres-sion analysis allows controlling, at least in part, for the different pro-portions of inhabitable land characterizing the Northern and theSouthern shore of the Mediterranean. The bivariate analysis, on thecontrary, focused on the different characteristics existing between tran-sitional population of the Southern shore of the Mediterranean (withrising but still low population densities, wide areas of dry lands, andnegative net migration) and Northern post-transitional population (withstationary but high levels of population density and positive net migra-tion). The role played by population density in the present model is not,however, of primary importance: omitting this variable from the modelcauses in fact only a small fall in the overall explained variance (from 85to 84%). Substituting the population density with the ratio betweenpopulation and arable land will cause, instead, a loss of significance ofthe coefficient (these calculations are not shown here).
At the end of this part of our analysis we can affirm, therefore, thatthe connection between the net migration rate, on the one hand, andurban growth, median age and population density, on the other, seemsto confirm the major role played by demographic transition as trigger forinternational migration flows.
Three scenarios for net migration in 2030
our forecasting exercise suggests that there is a long term connec-tion between demographic transition and migration. Given our poorunderstanding of migration, without this long term connection no pre-diction with a time horizon of twenty years would be possible, becausethe other processes influencing migration are too volatile. Demogra-phic variables have two major advantages that can be exploited for ourforecast. First of all, demographic phenomena (and especially age struc-ture) evolve more slowly than other variables linked to cyclical dyna-mics. Second, many characteristics of the Mediterranean populationsin 2030 will be strictly dependent on the characteristics of current Medi-terranean populations.

98
For these reasons we decided to exploit the un’s population projec-tions as a starting point for our forecasting exercise. By doing so we arefounding our prediction on two strong hypotheses: • that the connection identified between demographic transition andmigration will hold during the next 20 years; • that the un’s population projections are able to capture the main fea-tures of the future demography of the Mediterranean region. It should,of course, be noted that projecting the population evolution of a coun-try where the demographic transition is in an early stage is much riskierthan projecting the future evolution of a population that is entering thelast stages of that process. For this reason, we can reasonably argue thatthe results concerning the Northern Mediterranean are probably morereliable than those concerning the Southern shore.
To take into account the effects arising from economic variables (gdpper capita and education levels) we have integrated the un’s projectionswith two different sets of information. In what concerns human capital,we used the projection up to 2030 done by KC & al. (2010)(37) of thefuture diffusion of tertiary education. To build the future series of gdpper capita we were forced, on the contrary, to build different scenariosusing a simple extrapolation from Maddison’s time series. We supposedinitially that the effect of the current economic crisis has reduced thegdp per capita in 2010 to the same level as that registered in 2005 in allMediterranean countries. From 2010 up to 2030 we have then suppo-sed three different growth paths: • a medium path in which growth follows exactly the same meangrowth rate registered along the period 1965-2010; • a low path in which the mean growth rate is reduced to half of thatregistered along the period 1965-2010; • a high path in which growth is supposed to be one and half timeshigher than that of the period 1965-2010.
the results of our forecast are shown in GRAPHS 14 to 17, in which theblue line refers to the un’s original time series of net migration rates.The red line, conversely, describes the theoretical predicted values ofnet migration rates according to our model 2 (see TABLE 20). The verticaldotted line in the graphics indicates the boundary between the un’s esti-mated net migration rates and the projected ones. In this manner it
(37) Data is available at www.iiasa.ac.at/Research/POP/edu07/index.html
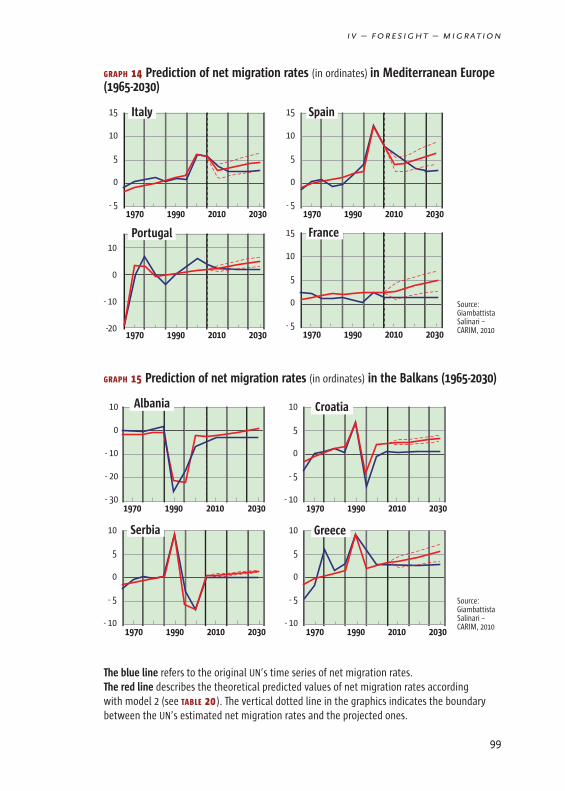
99
iv – foresight – migration
GRAPH 14 Prediction of net migration rates (in ordinates) in Mediterranean Europe(1965-2030)
GRAPH 15 Prediction of net migration rates (in ordinates) in the Balkans (1965-2030)
10
0
- 10
- 20
- 301970 1990 2010 2030
10
5
0
- 5
- 101970 1990 2010 2030
10
5
0
- 5
- 101970 1990 2010 2030
10
5
0
- 5
- 101970 1990 2010 2030
Albania Croatia
Serbia Greece
15
10
5
0
- 51970 1990 2010 2030
Italy
10
0
- 10
-201970 1990 2010 2030
Portugal
15
10
5
0
- 51970 1990 2010 2030
Spain
15
10
5
0
- 51970 1990 2010 2030
France
Source:GiambattistaSalinari –CARIM, 2010
Source:GiambattistaSalinari –CARIM, 2010
The blue line refers to the original UN’s time series of net migration rates. The red line describes the theoretical predicted values of net migration rates accordingwith model 2 (see TABLE 20 ). The vertical dotted line in the graphics indicates the boundarybetween the UN’s estimated net migration rates and the projected ones.

100
GRAPH 16 Prediction of net migration rates (in ordinates) in the Machrek (1965-2030)
GRAPH 17 Prediction of the net migration rates (in ordinates) in the Maghreb (1965-2030)
10
5
0
- 51970 1990 2010 2030
Egypt
20
10
0
- 101970 1990 2010 2030
Israel
10
5
0
- 51970 1990 2010 2030
Syria
10
5
0
- 51970 1990 2010 2030
Turkey
5
0
- 5
-101970 1990 2010 2030
Mauritania 5
0
- 5
-101970 1990 2010 2030
Morocco
5
0
- 5
-101970 1990 2010 2030
Algeria 5
0
- 5
-101970 1990 2010 2030
Tunisia
Source:GiambattistaSalinari –CARIM, 2010
Source:GiambattistaSalinari –CARIM, 2010
The blue line refers to the original UN’s time series of net migration rates. The red line describes the theoretical predicted values of net migration rates accordingto model 2 (see TABLE 20). The vertical dotted line in the graphics indicates the boundarybetween the UN’s estimated net migration rates and the projected ones.

101
iv – foresight – migration
becomes possible to compare what the un supposes to be the most likelyscenarios for future net migration rates with our prediction.
It seems to us that in many cases the un’s scenarios have been drawnby prolonging the last known value of the series into the future. Thisstrategy seems to have been adopted in 8 out of 16 countries. In theother 8 cases the impression is that the strategy has been that of pro-longing not the last value of the series but some previous values. Thissecond strategy seems at play when major political events disrupt the lastvalues of the series. There is consequently only one case in our sample,that of Syria, of a transition from positive to negative value of net migra-tion rate, while no case can be found of transition from negative to posi-tive values. The phenomenon of migration transition seems, therefore,not to have been taken into account by the un’s experts when drawingtheir scenarios for the Mediterranean region.
In contrast, according to our model, 5 countries (Croatia, Serbia, Tur-key, Tunisia and Algeria) will pass through the transition from sendingto receiving countries during the period 2010-2030. According to ourmodel, these countries will show a mean value of net migration ratearound +2.5 ‰ in 2030. The timing of the migration transition in suchcountries does not appear to be strongly affected by the different hypo-theses we introduced concerning the evolution of gdp per capita. Thisfact seems to confirm that the model is more sensitive (at least in theearly stage of the migratory transition) to the changes occurring in thegroup of demographic variables than the set of economic changes. Tuni-sia, the country for which our model predicts the most spectacularmigratory transition, is also the country in the most advanced stage ofdemographic transition among the countries of Northern Africa (in2005 the net reproduction rate was, according to un’s estimates of 0.87).In the Maghreb, the two other countries (Algeria and Tunisia) under-going the migratory transition (according to the model) are the twocountries that combine the highest proportion of urban population, thehighest median age and the lowest net reproduction rate. Egypt,Morocco and Algeria, moreover, have almost the same gdp per capita in2005 (respectively 3,200, 3,103, 3,374 1990gk$ in 2005(38), despite thisfact only Algeria undergoes the migration transition. Syria has a highergdp per capita (about 7,767 1990gk$) than Algeria and Tunisia, and
(38) The data come from Maddison (2010) and are expressed in 1990 International Geary-Khamis dollars.

102
despite this fact our model predict a slightly negative net migration alongall the period 2010-2030.
To identify the role played by the median age (and therefore by demo-graphic transition) in the migratory transition process we decided on acounterfactual analysis. In this context we supposed that the wholeMaghreb maintains, during 2010-2030, the same median age asMorocco in 2005 (24 years). The results of this simulation analysis areshown in GRAPH 18. The migratory transition of Algeria and Tunisia sim-ply disappear from our series. The model interprets, therefore, medianage as the fundamental determinant of migratory transition.
Two important North African countries, Morocco and Egypt, will not,according to the model, pass through the migratory transition during theperiod 2010-2030. The trends shown by the net migration series of thesetwo countries are nevertheless quite different. In the case of Morocco,the trend in net migration rates is positive showing a progressive ten-dency toward less negative values of net migration rates. In the case ofEgypt no such positive trend can be detected and net migration ratesare predicted as remaining negative for 2010-2030. To investigate the
GRAPH 18 Counterfactual analysis for Maghreb (1965-2030) Net migration rate
5
0
- 5
-101970 1990 2010 2030
Mauritania
5
0
- 5
-101970 1990 2010 2030
Algeria 5
0
- 5
-101970 1990 2010 2030
Tunisia
5
0
- 5
-101970 1990 2010 2030
Morocco
Source:GiambattistaSalinari –CARIM, 2010
The blue line refers to the original UN’s time series of net migration rates. The red line describes the theoretical predicted values of net migration rates accordingwith model 2 under the hypothesis that the whole Maghreb maintains the same medianage as Morocco in 2005 (24 years) 2010-2030.

103
iv – foresight – migration
causes underpinning the lack of migratory transition in these two coun-tries we performed a new counterfactual analysis. Through this formof analysis we found that the causes hampering the migration transitionin Morocco and Egypt are diverse.
In Egypt, the lack of migration transition can be justified almost enti-rely, according to the model, by the low levels of urbanization. In ourcounterfactual analysis we supposed, in fact, that Egypt undergoes thesame urban growth as in Tunisia (that according to our model does passthrough the migratory transition in the period 2010-2030). This singlechange (see GRAPH 19) produces in the predicted net migration rate seriesa spectacular positive hump.
In the case of Morocco, the reasons underpinning the lack of migra-tory transition seems to be more complex. In our counterfactual ana-lysis, in fact, none of the variables of the model can, taken alone, enti-rely justify the lack of migratory transition. To verify this fact weproceeded by systematically substituting the different series of Tuni-sia (gdp per capita, urban growth, density, etc.) into the Moroccan data-set. The two variables that produced the greatest effects on Moroccannet migration rates were our proxy for past emigrant stock and medianage, but none of these two variables taken alone could produce the tran-sition from negative to positive migration rates. By supposing, conver-sely, that the evolution of median age and total migrant stock were inMorocco both equal to that of Tunisia the migratory transition sud-denly appears (see GRAPH 19). The important past migratory experience
GRAPH 19 Counterfactual analysis for Egypt and Morocco (1965-2030)Net migration rate
5
0
- 51970 1990 2010 2030
0
- 5
- 101970 1990 2010 2030
Egypt Morocco
Source:GiambattistaSalinari –CARIM, 2010
The blue line refers to the original UN’s time series of net migration rates. In the case ofEgypt the red line describes the theoretical predicted values of net migration ratesaccording with model 2 under the hypothesis that Egypt has the same urban evolution ofTunisia. In the case of Morocco the red line describes the theoretical predicted values of netmigration under the hypothesis that Morocco has the same age structure and migrantsstock as Tunisia.

104
of Morocco seems to us to be the fundamental element hampering theprocess of migratory transition, even if a more gradual increase inmedian age and of gdp per capita with respect to that of Tunisia seemsto play a role in the process.
For the Northern shore of the Mediterranean region the model pre-dicts a quite different picture from that projected by un’s Populationdivision. In this scenario, net migration rates in Greece, Italy, Franceand Spain are expected to be about +2.5 ‰. Our forecast for 2030, ins-tead, predicts a value which is generally higher than 5 ‰. In the scenariodrawn by the Population division, moreover, the evolution of the netmigration rate shows a stationary trend, while our forecast shows a posi-tive trend with net migration rates becoming more and more impor-tant as time goes by. To explain why the model predicts, in the case ofMediterranean European countries, a continuous growth of net migra-tion rates we recurred again to a counterfactual analysis. We supposedthat all European Mediterranean countries had, in 2010-2030, the samegdp per capita and the same median age as Spain in 2005. We foundthat none of these two variables taken alone is able to fully account forthe growth of net migration rates. The growth of net migration ratespredicted by the model, conversely, disappear when both gdp per capitaand median age are simultaneously held to the levels of 2005 (see GRAPH 20). The dynamic of net migration rates in Mediterranean Euro-pean countries appear to be determined, according to the model, by acombination of economic and demographic factors. This fact can alsobe confirmed by observing the more important impact on future netmigration exerted by our different hypothesis concerning future eco-nomic growth rate.
Concluding remarks
in this work, we have tried to identify some of the long-term connec-tions between demographic transition and migratory waves, and to usethis connection in order to built scenarios concerning the future evolu-tion of migration in the Mediterranean region up to 2030. The varia-bles we used to test the link between population dynamic and migrationare inevitably too simple to capture the overall set of interactions bet-ween these processes. Nevertheless, all the variables that we thoughtconnected to this process (urbanization, median age and populationdensity) were, indeed, significantly associated with migration, even after

105
iv – foresight – migration
correcting our results for the bias introduced by serial correlation andendogeneity.
Because the existence of a long-term association between demogra-phic transition and migration was confirmed by our analysis we pro-ceeded to build up our forecast. The overall picture predicted by ourmodel has shown several countries of the Southern shore undergoingthe migratory transition, but, with the exception of Egypt and Morocco.On the Northern shore, our model predicts for 2010-2030 a positivetrend of net migration rates in response to population ageing and eco-nomic growth. The concluding impression we derived from our forecastexercise: namely that, with few, but important exceptions, the Mediter-ranean region will see, in the next twenty years, persistence, but also areduction in the migratory asymmetry between the Northern and theSouthern shores.
At the end of this projection, a major question remains unanswe-red. If immigration is fated to continue in the North (Europe), fromwhere will immigrants come? And if emigration is fated to continue inthe South (mena), where will emigrants head? Will there be a dominant
GRAPH 20 Counterfactual analysis for Mediterranean Europe (1965-2030)Net migration rate
15
10
5
0
- 51970 1990 2010 2030
Italy 15
10
5
0
- 51970 1990 2010 2030
Spain
15
10
5
0
- 51970 1990 2010 2030
France10
0
- 10
- 201970 1990 2010 2030
Portugal
Source:GiambattistaSalinari –CARIM, 2010
The blue line refers to the original UN’s time series of net migration rates. The red line describes the theoretical predicted values of net migration rates accordingwith model 2 under the hypothesis that Southern Europe maintains during the period2010-2030 the same GDP per capita and the same median age as Spain in 2005.

106
pattern of South-to-North migration across the Mediterranean or willEurope and mena be linked by migration with different parts of theworld? Projecting migration at country level cannot predict regionaldynamics and migration across the Mediterranean depends in part, andperhaps above all, on political developments at the Mediterranean levelthat are not factored into the projection.
R E F E R E N C E S C I T E D
Assaad, R. and Farazneh R.-F. (2007). Youth in the Middle East and North Africa:Demographic opportunity or challenge? Population Reference Bureau,www.prb.org/pdf07/YouthinMENA.pdf
Barro J. R. and Lee J.-W. (2010). A New data set of educational attainmentin the world, 1950-2010. National Bureau of Economic Research n. 15910.
Bijack, J. (2006). Forecasting international migration: selected theories, models,and methods. Working paper n°4. Central Europe Forum for Migration Research.
Billari F. C., Dalla Zuanna G. (2008). La rivoluzione nella culla. Milan. UniversitàBocconi Editore.
Black, R., Kniveton D., Skeldon R., Coppard D., Murata A. and Schmidt K.(June 2008). Demographics and climate change: future trends and their policyimplications for migration. Working paper T-27. Development Research Centreon Migration, Globalisation and Poverty, Université de Sussex.
Bloom, D. E., Canning D. and Sevilla J. (2003). The Demographic dividend:A new perspective on the economic consequences of population change.
Boeri, T., Hanson, G. and McCormick B. ed. (2002). Immigration policy andthe welfare system. Oxford, Oxford University Press.
Formes d’activités économiques, emploi et chômage des jeunes (Rabat, 2005).CERED - Centre d’Etudes et de Recherches Démographiques.
Chesnais, J. C. (1993). The demographic transition: stages, patterns andeconomic implications: A longitudinal study of sixty-seven countries covering theperiod 1720-1984. Oxford, Clarendon Press.
Clionadh R., Jordan L. and Salehyan I. (2005). Assessing the impact of climatechange on migration and conflict. La Banque mondiale.
Courbage, Y. (1999). Economic and political issues of fertility transitionin the Arab World: Answer and open questions. Population and environment20(4):353-380.
Cuberes, D. (2009). Early and late demographic transitions: the role ofurbanization. MPRA paper n. 11720.
de Haas, H. (2005). Morocco’s migration transition: trends, determinantsand future scenarios. Global migration perspectives 20:1-38.
de Haas, H. (2007). North African migration systems: evolution, transformationand development linkages. Working Paper n°6. International Migration Institute.
107
iv – foresight – migration
Dyer, Paul and Tarik Yousef (2008). The tyranny of demography: exploringthe fertility transition in the Middle East and North Africa. Working Paper 08-11.Dubai School of Government.
Dyson, T. (2001). A partial theory of World development: The neglected roleof the demographic transition in the shaping of modern society. InternationalJournal of Population Geography 7:67-90.
Easterlin, A. (1961). Influences in European overseas emigration before WorldWar I. Economic Development and Cultural Change 9(4):331-351.
EUROSTAT (2000). Push and pull factors of international migration,a comparative report. Luxembourg.
Fargues, P. (1986). Un siècle de transition démographique en AfriqueMediterranéenne 1885-1985. Population 41(2):205-232.
Fargues, P. (1994). Violence politique et démographie en Égypte, in BaudoinDupret (ed.) Le phénomène de la violence politique: Perspectives comparatistes etparadigme égyptien. CEDEJ, Le Caire, pp. 223-243.
Fargues, Ph. Les guerres, facteur décisif des migrations. ConfluencesMéditerranéennes n°42 : 23-35 (2002).
Fargues, P. (2000). Générations arabes: L’alchimie du nombre. Paris, Fayard.
Fargues P. (2005) Women in Arab countries: challenging the patriarchal system?Reproductive health matters. Vol. 13. Number 25:161-5
Fargues Ph. (2009) Emerging demographic patterns across the Mediterraneanand their implications for migration through 2030, in talent, competitiveness andmigration. The Transatlantic Council on Migration. Verlag Bertelsmann Stiftung& Migration Policy Institute. Washington 2009: pp. 129-162.
Fourati, H. (2008). Consultations de la jeunesse et désir d’émigrer chezles jeunes en Tunisie 1996-2005. Carim.
Goldstone, J. (2001), Demography, environment and security: an overview.Weiner & Russell, p. 38-61.
Gozzini, G. (2005). Le migrazioni di ieri e di oggi. Milan, Mondatori.
Hatton, T. J. and Williamson, J. G. (1998). The age of mass migration. New Yorkand Oxford. Oxford University Press.
IPCC (2007). Climate change 2007, fourth assessment report. Working group IIreport “Impacts, adaptation and vulnerability”, www.ipcc.ch/ipccreports/ar4-wg2.htm.
Jennissen, R. (2003). Economic determinants of Net international migration inWestern Europe. European Journal of Population 19:171-198.
KC, S., Barakat, B., Goujon, A., Skirbekk, V., Sanderson, E., Lutz, W. (2010).Projection of population by level of education attainment, age, and sex from120 countries for 2005-2050. Demographic Research 22(15):383-472.
Livi Bacci M. (1992). Concise history of the World population. Basil Blackwell.New York.
Massey D.S. and Al. (1993). Theories of International Migration: a Review andAppraisal. Population and Development Review 19(3):431-466.
Myers, N. (2005). Environmental Refugees: An emergent security issue.13th Economic Forum. Prague, pp. 23-27.
ONS – Office National des Statistiques (2007). Enquête sur l’emploide septembre 2004. Alger.

108
Rashad, H. (2000). Demographic transition in Arab countries. Journalof population research 17(1):83-97.
Reuveny, R. (2005). Environmental change, migration and conflict: Theoreticalanalysis and empirical explorations. Paper presented at a workshop on HumanSecurity and Climate Change. Oslo. 21–23 Juin 2005.
Rogers, A. (1990). Requiem for the net migrant. Geographical Analysis 22:283-300.
Roman, H. (2009). Iraqi refugees in Egypt: Socio-political aspects. CARIM.Research Report (http://hdl.handle.net/1814/11413).
Shiva, V. (2002). Water wars. Cambridge, MA: South End Press.
Tabutin, D. and Schoumaker B. (2004). La démographie de l’Afrique au Suddu Sahara des années 1950 aux années 2000. Synthèse des changements et bilanstatistique. Population 59(3/4):521-621.
Tabutin, D. and Schoumaker B. (2005). La démographie du monde arabe etdu Moyen-Orient des années 1950 aux années 2000. Synthèse des changementset bilan statistique. Population 60(5/6):611-724.
Teitelbaum, M. and Winter, J. (1998). A question of numbers. High migration,low fertility and the politics of national identity. Hill and Wang. New York.
Teitlebaum M. (2001). International migration: Predicting the unknowable.Weiner & Russell 2001, pp. 21-37.
UNDP (2003). Arab human development report. Building a knowledge society.
Venturini, A. (2004). Postwar migration in Southern Europe, 1950-2000:An economic analysis. Cambridge. Cambridge University Press.
Weiner, M. and S. S. Russell. (2001). Demography and national security.Berghahn Books. New York & Oxford.
World Bank (2004). mena Development report: Unlocking the employmentpotential in the Middle East and North Africa: Toward a new social contract.Washington DC.
World Bank (2008). mena Development Report : The Road not travelled -Education reform in the Middle East and North Africa. Washington DC.
World Bank, World Development Report 2007. Take advantage of mena’sdemographic “window of opportunity”,http://siteresources.worldbank.org/INTWDR2007/Resources/1489782-1158076403546/WDR2007RegionalHighlights_MENA_Aug29_draft6.pdf
Zelinsky, Z. (1971). The hypothesis of the mobility transition. GeographicalReview 61:219-249.

109
energy perspectives in the mediterraneanChallenges and stakes for 2030
Dr. Houda Ben Jannet Allal*
this chapter focuses on a major and sensitive subject for develop-ment in the region: the energy situation and its perspectives. The keystrategic role that energy plays in economic, social and sustainable deve-lopment is widely recognized. This is particularly the case in the Medi-terranean region, which is characterized by North-South energy inter-dependence and an unequal balance of resources at a time whenrequirements are increasing everywhere, especially in the South andEast of the Mediterranean.
The chapter is organized into three parts: • The nature of the energy issue: a global challenge at the heart ofMediterranean development issues.• The current situation in the sector. Energy, the environment andcooperation: a recent field of reflection with a new global focus.• Energy perspectives for 2030 based on key developments in Euro-Mediterranean relations defined in the three scenarios of the presentMed2030 report.
The following energy data were supplied by the ome based on preli-minary data from mep2011 and other in-house publications(1). 2030 dataresult from the application of Med2030 scenarios to the ome forecastingmodel.
(*) Strategy Director at the Observatoire Méditerranéen de l’Énergie (ome). (1) Mediterranean Energy Perspectives (mep). mep 2011 with the OME scenarios. For moreinformation on the model and the mep: www.ome.org.
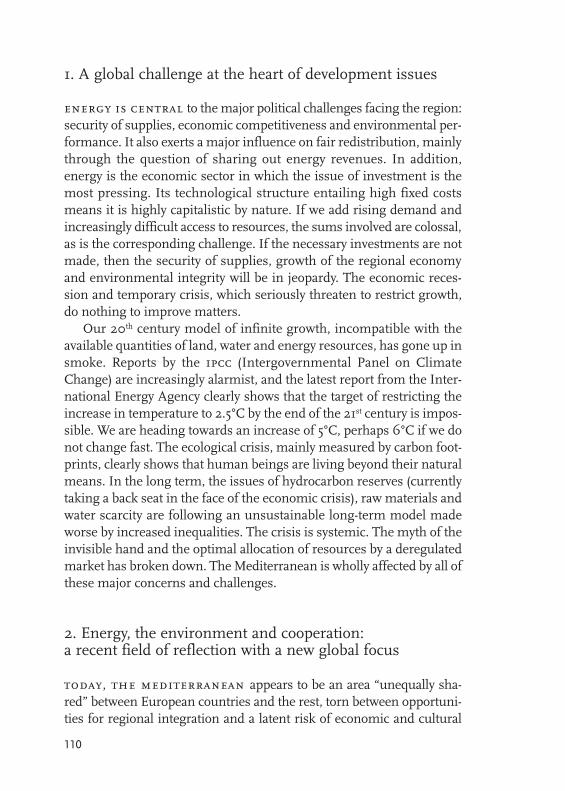
110
1. A global challenge at the heart of development issues
energy is central to the major political challenges facing the region:security of supplies, economic competitiveness and environmental per-formance. It also exerts a major influence on fair redistribution, mainlythrough the question of sharing out energy revenues. In addition,energy is the economic sector in which the issue of investment is themost pressing. Its technological structure entailing high fixed costsmeans it is highly capitalistic by nature. If we add rising demand andincreasingly difficult access to resources, the sums involved are colossal,as is the corresponding challenge. If the necessary investments are notmade, then the security of supplies, growth of the regional economyand environmental integrity will be in jeopardy. The economic reces-sion and temporary crisis, which seriously threaten to restrict growth,do nothing to improve matters.
Our 20th century model of infinite growth, incompatible with theavailable quantities of land, water and energy resources, has gone up insmoke. Reports by the ipcc (Intergovernmental Panel on ClimateChange) are increasingly alarmist, and the latest report from the Inter-national Energy Agency clearly shows that the target of restricting theincrease in temperature to 2.5°C by the end of the 21st century is impos-sible. We are heading towards an increase of 5°C, perhaps 6°C if we donot change fast. The ecological crisis, mainly measured by carbon foot-prints, clearly shows that human beings are living beyond their naturalmeans. In the long term, the issues of hydrocarbon reserves (currentlytaking a back seat in the face of the economic crisis), raw materials andwater scarcity are following an unsustainable long-term model madeworse by increased inequalities. The crisis is systemic. The myth of theinvisible hand and the optimal allocation of resources by a deregulatedmarket has broken down. The Mediterranean is wholly affected by all ofthese major concerns and challenges.
2. Energy, the environment and cooperation: a recent field of reflection with a new global focus
today, the mediterranean appears to be an area “unequally sha-red” between European countries and the rest, torn between opportuni-ties for regional integration and a latent risk of economic and cultural

111
v – foresight – energy
rifts that are detrimental to its inhabitants. It mirrors North-South ine-qualities, where managing natural resources, and in particular water,energy and the protection of the environment, has become a crucial chal-lenge and an underlying source of conflict. The Mediterranean is a topi-cal subject and energy has become an urgent issue. The Paris summit on13 July 2008, organized as part of the “Barcelona Process: Union for theMediterranean”, blew new political wind into the sails of Euro-Mediter-ranean relations. This first summit made significant progress for part-nership in the region at a time when global and regional economies arefinding themselves confronted with serious preoccupations.
In the field of energy, the Mediterranean area is characterized by twoobvious and major inequalities: imbalances between countries in theNorth, which are richer and consume more energy than countries inthe South; and imbalances in the possession of energy resources, whichare highly concentrated in three countries – Algeria, Libya and Egypt(4.6% of the world’s natural gas reserves and 4.7% of oil). The extent ofthese reserves is probably underestimated. Algeria, Egypt, Syria andLibya supply 22% of oil imports and 35% of gas imports of the Medi-terranean basin and the potential for trade in oil and especially gas isextremely promising.
The reinforcement of North-South and East-West electricity inter-connections is also a potentially beneficial objective for the region. TheMediterranean possesses exceptional renewable energy resources, in par-ticular solar and wind power, especially in the South and East. The win-ner of the Nobel Prize for physics, Carlo Rubbia, likes to point out thatin the Sahara, it “rains” the equivalent of one barrel of oil per squaredmetre each year in the form of solar energy.
On the demand side, fossil energy (oil, gas and coal) still dominatesthe energy mix and totals 80% of energy supplies in Mediterranean coun-tries (95% for semcs and 70% for nmcs) (GRAPHS 21 and 22). Nevertheless,as mentioned earlier, there is significant potential for renewable energysources along with unexploited energy efficiency. Several restrictions pre-vent the judicious exploitation of these resources, the advantages of whichare largely known and mostly include reducing the constraints of energydependence and moving towards sustainable development targets seekby all countries.
Inequalities persist between the North and the South in terms ofenergy consumption per inhabitant. In 2009, an nmc inhabitant consu-med an average 2.7 toe compared with 1.2 toe for someone living in an

semc, i.e. over double. Energy consumption per inhabitant in the Medi-terranean therefore averaged out at 1.8 toe.
In this context, the financial crisis (now economic and social), theenergy crisis, concerns for the security of supplies and the necessarytransition towards low-carbon economies in order to adapt to climatechange, only accentuate the need to change the scale of complementaryenergy efficiency policies in the region, both North and South. This com-plementary nature could take the shape of more deep-seated cooperationwhen it comes to energy saving, renewable energy, infrastructure andcommon energy policy questions.
Access to energy, energy security and environmental constraints the-refore constitute a significant challenge in terms of economic and socialdevelopment in the Mediterranean. Energy insecurity and the degrada-tion of local and global environments will have the effect of hamperingthis development, or making it impossible. This challenge can only bemet by Euro-Mediterranean cooperation based on a new model ofenergy systems compatible with sustainable development in order to“respond to the needs of the present without compromising the potential offuture generations to access their own needs”. The only option is thereforeto renew the energy system in the Mediterranean, and create a sustai-nable system founded on greater accessibility in the South and energysaving and renewable energy development in the North, as well as insemcs. Clearly, the current energy system is based on consumption pat-terns involving worrying levels of carbon demand and pollution, which
112
10%
41% 28%
13%
8%
By source (907 Mtep)
100
200
300
400
500
NMC SEMC
Renewable energies
Nuclear
Gas
Oil
Coal
600By source and region (Mtep)
Source: OME, 2011.
GRAPHS 21 and 22 Primary energy demand in the Mediterranean (2009)

113
v – foresight – energy
are incompatible with the kind of sustainable development sought by allcountries in the region.
The new energy paradigm therefore consists in designing an “energysystem” that covers not just the energy sector (supply) but also energyconsumption (demand), and in ensuring its development to obtain anenergy service involving the optimal use of resources, economic andsocial costs and protection of the local and global environment. Thesatisfaction of creating an “energy service” instead of an “energy sup-plier” would put the new stakeholders at the forefront: companies, localauthorities, households, those working in construction, transport, indus-trial and farming production and the service industry. Towns and localauthorities would become the essential drivers and promoters of thesenew policies. Regional cooperation would also play a crucial role.
3. Energy perspectives: rising energy demandand increased risks
in this last part, we present the energy perspectives for the regionin 2030 broken down into three scenarios, defined in this study, toreflect key developments in Euro-Mediterranean relations: a “crisis inthe Mediterranean region” scenario, a “Mediterranean divergences”scenario and a scenario of “Mediterranean convergence”. As we poin-ted out at the start of this chapter, the 2030 data that follow result fromapplying ome’s forecasting model to the three above-mentioned sce-narios.
According to these scenarios, regional energy demand is set to risefrom over 30% to more than 60% during the period 2009-2030(GRAPH 23). This increase will essentially be drawn by semcs, wheredemand will more than double during the same period.
In 2030, primary energy demand could be multiplied by 1.3 to 1.6in the Mediterranean, with countries to the South and East seeingenergy demand rise over five times more than countries in the North.They would then represent from 47% to 50% of the Mediterraneanarea’s total energy demand, compared to 36% in 2009. According tothe estimations of the Observatoire Méditerranéen de l’Énergie, Turkeycould become the area’s second consumer.
Thus, by 2030 in terms of volume, semcs catch up with nmcs’consumption levels, but inequalities exist in terms of consumption per
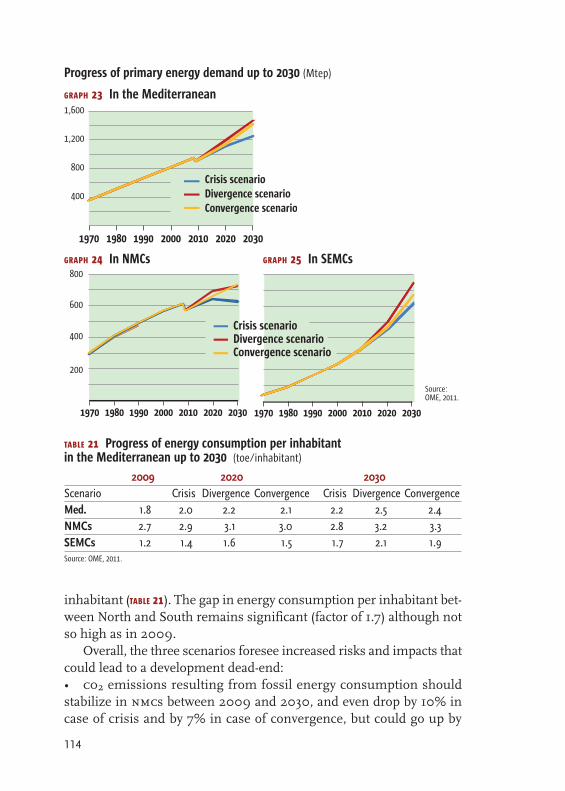
114
inhabitant (TABLE 21). The gap in energy consumption per inhabitant bet-ween North and South remains significant (factor of 1.7) although notso high as in 2009.
Overall, the three scenarios foresee increased risks and impacts thatcould lead to a development dead-end: • co2 emissions resulting from fossil energy consumption shouldstabilize in nmcs between 2009 and 2030, and even drop by 10% incase of crisis and by 7% in case of convergence, but could go up by
400
800
1,200
1,600
1970 1980 1990 2000 2010 2020 2030
Crisis scenario Divergence scenarioConvergence scenario
GRAPH 23 In the Mediterranean
200
400
600
800
1970 1980 1990 2000 2010 2020 2030 1970 1980 1990 2000 2010 2020 2030
Crisis scenarioDivergence scenarioConvergence scenario
GRAPH 24 In NMCs GRAPH 25 In SEMCs
Source:OME, 2011.
Progress of primary energy demand up to 2030 (Mtep)
TABLE 21 Progress of energy consumption per inhabitant in the Mediterranean up to 2030 (toe/inhabitant)
2009 2020 2030Scenario Crisis Divergence Convergence Crisis Divergence ConvergenceMed. 1.8 2.0 2.2 2.1 2.2 2.5 2.4NMCs 2.7 2.9 3.1 3.0 2.8 3.2 3.3SEMCs 1.2 1.4 1.6 1.5 1.7 2.1 1.9Source: OME, 2011.

115
v – foresight – energy
almost 100% in semcs (GRAPHS 26 & 27). Expressed per inhabitant, theseemissions start off higher in the North than in the South, are compa-rable by 2020, and significantly higher in the South than in the Northby 2030, whatever the scenario (TABLE 22).• Energy dependence could rise sharply, both for importing semcs(88% in 2030) and nmcs (73% over the same period). Due to risingdemand and the diminishing of conventional reserves, the Mediterra-nean could need to import over 40% of its oil, almost 30% of its gas andover 70% of its coal in the 2030s.
Aspirations for economic and social development are justified andenergy is indispensible to attain them. The crisis and divergence sce-narios clearly illustrate that continued development in line with indus-trialized countries’ current energy model (which is targeted by develo-ping countries) is difficult, costly and risky. Simply from an energypoint of view, economic and social development would be radicallycompromised and not just for the most “vulnerable” countries. In addi-tion, this path would inexorably increase the risks of climate change.
Crisis scenarioDivergence scenarioConvergence scenario
1970 1980 1990 2000 2010 2020 2030
1,000
2,000
3,000
GRAPH 26 For the three scenarios(MtCO2)
1970 1980 1990 2000 2010 2020 2030
1,000
2,000
NMCs
SMECs
GRAPH 27 For the convergencescenario (MtCO2)
Source: OME, 2011.
Progress in CO2 emissions in the region
TABLE 22 Progress in CO2 emissions per inhabitant in the Mediterranean up to 2030 (tCO2/inhabitant)
2009 2020 2030Scenario Crisis Divergence Convergence Crisis Divergence ConvergenceMed. 3.3 3.5 3.9 3.5 3.7 4.5 3.9NMCs 3.6 3.5 3.8 3.5 3.0 3.5 2.2SEMCs 3.0 3.5 3.9 3.5 4.1 5.0 4.3Source: OME, 2011.

116
Nevertheless, as we have mentioned above, the Mediterranean pos-sesses considerable energy saving and carbon potential. It all dependson the technologies promoted and the new behaviour encouraged.Several reliable estimations show that over the next twenty years, thereis a potential for reducing consumption by around 20% (and more ifenergy prices continue to rise).
The Mediterranean is highly vulnerable to climate change. Severalstudies, and in particular that of the ipcc, confirm this. A relativelyrecent study by the iddri (Institut du développement durable et desrelations internationals) on climate change and its impacts in the Medi-terranean also confirms the region’s vulnerability and calls for urgentlong-term action. One of the study’s conclusions is that “the multipleforeseeable impacts of climate change make it one of the most worrying issuesfor the future of the Mediterranean in the mid and long-term […] there is lessand less doubt that the changes already under way are irreversible”. Thechallenge is therefore not only to reduce greenhouse gas emissions,but to adapt to current and forthcoming changes in order to reduce thevulnerability of societies likely to be dramatically affected in the future.The three scenarios show that rising co2 emissions are likely to spiralout of control, in particular in countries in the South.
Overall, the three scenarios present significant challenges, both forthe energy sector and more generally for sustainable development inthe region. Seen from the dual perspective of energy/environment anddevelopment, the convergence scenario emerges as the preferableoption. The convergence scenario allows a better progression in energyefficiency and significant development of renewable energy sources inthe region thanks to Euro-Mediterranean cooperation and technologytransfers. In fact, 16% of energy demand would come from these ener-gies by 2030 (24% in nmcs, and only 8% in semcs) compared to 12%in the crisis scenario and 10% in the divergence scenario. Thanks to aheightened convergence and cooperation strategy, the Mediterraneanwould benefit from its high potential for renewable energy and energysavings, but better results could be achieved especially in the Southand East.
The convergence scenario shows the repercussions of energy savingmeasures put in place or being drawn up in EU Member States andSouthern Mediterranean countries : prevention campaigns, creation of“energy saving” labels, energy efficiency in buildings, etc. For example,the new energy regulations adopted in Tunisia in buildings under

117
v – foresight – energy
construction are among the most significant in the sector in terms ofenergy savings. This measure is likely to encourage energy consumptionreductions of 40% by 2020. Similar legislation exists or is under way inmost semcs (e.g. Algeria, Egypt, Jordan, Lebanon, Palestine, Syria andTurkey). The recent creation of “energy efficiency” labels and certificatesin Morocco, Tunisia and Egypt (for refrigerators, air conditioning andwashing machines) also represents an important step in changing themarket and consumer behaviour.
Although the crisis scenario foresees lower global demand for energyand so reduced co2 emissions by 2030, the situation is not optimalbecause renewable energy sources and potential energy savings are notexploited. This is illustrated by the energy and carbon levels in the threescenarios (see TABLES 23 & 24). The crisis scenario is therefore neither themost efficient nor the least energy consuming. The divergence scenariois the least energy efficient since it consumes more energy than theconvergence scenario for a much lower level of development. Theconvergence scenario represents more wealth for the region (+14%),which is produced using less energy (-5%) in comparison with the diver-gence scenario, a difference that is far from negligible. The same goesfor the impact on co2 emissions. Although the crisis and divergencescenarios are almost the same in terms of carbon intensity, the conver-gence scenario makes it possible to reduce this intensity by 20% with,let us not forget, a higher level of wealth.
We can also see an imbalance between the North and South interms of energy and carbon intensities. Energy intensity is 2.5 times
TABLE 23 Energy intensity in the Mediterranean in 2030 (toe/US$ 1000 constant prices)
Scenario Crisis Divergence ConvergenceMediterranean region 0.10 0.10 0.08NMCs 0.07 0.07 0.06SEMCs 0.18 0.17 0.13Source: OME, 2011.
TABLE 24 Carbon intensity in 2030 (tCO2/ US$ 1000 constant prices)
Scenario Crisis Divergence ConvergenceMediterranean region 0.17 0.17 0.14NMCs 0.08 0.08 0.06SEMCs 0.42 0.41 0.30Source: OME, 2011.

118
higher in the South than in the North in the crisis and divergence sce-narios, and twice as high in the convergence scenario. Carbon intensityis 5.4 times higher in the South than in the North in the crisis anddivergence scenarios, and five times higher in the convergence scena-rio. These differences are considerable and call for sustained coopera-tion towards achieving, all together, a less energy-consuming regionwith greater respect for the environment. Scope for cooperation is vastin this area.
To conclude, the challenge of governance, stakeholder mobilizationand capacity (public authorities, local authorities, the private sector andcivil society) and strengthening regional cooperation are key factors inthe framework of an energy system that respects a shared ethical conceptof sustainability. This shared ethical vision would not, however, be com-plete without joint social responsibility allowing everyone to benefit fromdevelopment. This would involve equal treatment for actions affectingdemand (lower energy consumption for the same service) and supply(production and delivery of energy products to satisfy consumptionrequirements). This entails massive public and European investment –and earmarking the corresponding budget – in the key transition sec-tors: transport, construction, energy efficiency and renewable energybut also education, research, training and culture.
In this new energetic paradigm, the question of the citizens’ impli-cation in energy issues is a very interesting and promising one. Thisdoes not mean that the solution is simple, only that sustainable deve-lopment in the Mediterranean is a thorny issue that will involve res-pecting tough but indispensable constraints. Yet we can see perspec-tives on the horizon that did not exist in the past and that justify theneed for changing the paradigm. Prigogine and Schrödinger have hel-ped us discover that Man has possibilities and responsibilities in mana-ging and making the history of his planet. That said, Mediterraneancountries have every reason to develop through converging with theirneighbours rather than sticking it out on their own, if only to ensure anoptimal impact on the energy sector and sustainable development.

119
food security and agriculturein the mediterranean
Crisis scenario and prospects for 2030
Vincent Dollé*
there will be 7.5 billion inhabitants in the planet in 2020, 8 bil-lion in 2030. Since 1990, population growth is due to be 45% of that ofIndia and China, nevertheless the Mediterranean countries also contri-bute to this growth. In 20 years, the Mediterranean region will have100million supplementary inhabitants, the vast majority of whom willlive in cities or suburban areas. The increase in living standards, on theone hand, and the changing dietary habits of the new urban citizens,on the other, will cause large changes in consumption. Overall, indivi-dual consumption of vegetables will continue to decline in favour of anincrease in meat and dairy products but also in products derived fromprocessed animal products. This transfer in the demand, from vegeta-ble to animal products, is accompanied by a growth in the demand forplant products for animal feed but also for the production of biofuels.This biomass competition, in a context of pronounced climate changeand a rise in energy and transport costs, leads to a sustained rise in agri-
(*) Director of the Mediterranean Agronomic Institute of Montpellier/InternationalCentre for Advanced Mediterranean Agronomic Studies (ciheam/iamm). This paperdraws on the work of iamm teachers and researchers and their network partners who havebeen conducting studies and research in the Mediterranean over many years. TheMediterra publication (ed. ciheam and Sciences Po Press) has published the results ofthis work since 2007 as thematic annual summaries.2007: Identité et qualité des produits alimentaires méditerranéens. 2008: Les futurs agricoleset alimentaires en Méditerranée. 2009: Repenser le développement rural en Méditerranée.2010: Atlas of Mediterranean agriculture, food, fisheries and rural areas). The illustrationshere are mainly taken from these documents. ciheam/iamm 3191, route de Mende,34093 Montpellier Cedex 5. France. www.iamm.fr

120
cultural prices, the effects of which are exacerbated by their instabilityand volatility.
The 2008 food crisis, and its aftermath in 2009 and 2010, clearlyreflects this instability manifested by a sudden and excessive increase inprices, followed by an increase of their volatility in the short term. Theprice of a bushel of wheat in Chicago over three months rose from 5 usdin May 2007 to 12.80 usd in February 2008(1) only to fall sharply to4.4 usd in October 2009... then to soar again in spring and late sum-mer 2010 due, in particular, to production losses in Russia and Ukrainetaht were undergoing a prolonged period of drought and harvest fires.More recently, the floods in Australia, in early 2011, and the continueddrought in Argentina do not appear to be offset by surpluses of stocka-ble and exportable crops from South Africa, the Sahara and Asia(2). Thatinstability, reflected in the consumer markets, has a strong impact onfood consumption especially for the poorest households. The instabi-lity in the price of wheat had a significant short-term impact on foodsecurity but also an impact in the mid and long-term due to the with-drawal of cereal crops, which price had become low or unpredictableand investment in which seemed unprofitable in the long term.
After a period of consumption which exceeded production, between2000 and 2008, stocks rose again in 2009 only to fall in 2010 causingnew tensions on the market and increasing the costs of livestock feed.In 2008, as a whole, developing countries faced an increase of at least25% in their food imports, making food security more difficult. Theconditions for the emergence of new crises are again present with apotentially more dangerous situation, in that agricultural products havebecome the financial assets most speculated on. New non-traditionalspeculators in the agricultural raw material sector have emerged. Thissituation of potential tension is a reality for many Mediterranean coun-tries that share common characteristics in the evolution of the dyna-mics of their agricultural and food products. We will summarise themain facts and major trends.
In this context several scenarios are possible. They take into accountthe strong development trends in the rural and agribusiness sectorobserved in the Mediterranean region for several years and the recentcrises, coupled with the predicted impacts of climate change on the
(1) Global Economic Prospects 2009. Commodities at the crossroads. World Bank. (2) Data from Famine Early Warning Systems Network. Sahel and West Africa.Food Security Perspectives. October 2010- March 2011. bulletin January 2011.

121
vi – foresight – agriculture
Mediterranean rural sector. These scenarios go from the worst case pos-sible, a scenario of a “crisis in the Mediterranean region”, marked byshortages and growing asymmetries (S1), to a desirable scenario of“Mediterranean convergence” (S3), passing by a “Mediterranean diver-gences” scenario (S2) characterized by divergences in the rates of inte-gration of Mediterranean countries into the global economy. We pro-pose several ideas for cooperative action for those active in the public andprivate sectors to move towards an offensive convergence scenario ensu-ring food security in the Mediterranean area.
i. Common features of the Mediterranean countries
A high population growth and an urbanisation of coastal areas whichpenalises production in the agricultural sector
the urbanisation concentrated along coastlines increasingly pro-nounces the split between the inlands and the coastlines of Mediterra-nean countries. The map showing the distribution of towns and citiesin the Mediterranean(3) region (GRAPH 28) illustrates the population concen-tration in coastal cities which will be increased with the arrival of 100million extra people in the next 30 years. This tendency for the countriesof the Northern shore is more recent for the countries in the South andthe East with two exceptions, those of the Balkan countries and Turkeywhich still retain a substantial rural population in their inlands
This growth in urbanisation in coastal areas, which often occurs infloodplains and the most fertile estuaries, will increase competition forwater and soil for urban and industrial needs at the expense of agri-cultural activity and production, which is often intensive in suburbanlocations.
Rural population remains important
southern and eastern Mediterranean countries have a significantshare of the agricultural labour force (GRAPH 29). 25 to 45% of the popula-tion of these countries get the majority of their revenues from activitieson farms, as farmers or farm employees. If the rural population stabilisesin the whole of the Mediterranean around 2020, according to differentpopulation projections (GRAPHS 30), this stabilisation will be due to two oppo-
(3) Méditerra 2010, 2006 data.

122
sing forces: the endurance of a continued decline in the North combi-ned with growth in the South and the East that will only stabilise in 2020and beyond.
In a Mediterranean region in transition, the issue of agriculture andfood remains central, given the persistence of the economic and socialimportance of the agriculture sector.
Agriculture is the second largest source of work in the world, as inthe Mediterranean, after the services sector. The income from these jobs,however, is often lower than for other economic activities in rural areas.Informal work is still of great importance in rural Mediterranean areas.
GRAPH 28 Cities and agglomerations in the Mediterranean region (2006)
Sources: United Nations, Demographic Yearbook 2006.CIHEAM, Atlas Mediterra.
GRAPH 29Agricultural workers in theMediterraneanregion (2004)
Sources: Faostat, 2006.CIHEAM, Atlas Mediterra.

123
vi – foresight – agriculture
In North Africa, agricultural employment accounts for 80% of the ruralactivity: 35% in Tunisia, Algeria and Egypt(4). In Turkey, agriculture stillaccounts for more than 65% of employment in rural areas and the Tur-kish agricultural workforce continues to grow. Diversification is stilllimited in Southern Mediterranean countries. Rural areas do not attractindustrial activities and services that could be developed there. The conti-nued flow of employees leaving the agriculture sector, related to moder-nisation attempts, are not easily absorbed into other sectors leading tounderemployment, unemployment and migration.
Rural employment in semc, including agricultural employment, ischaracterised by many features that often point out its fragility:• the strong presence of small family farms and small secondary ser-vice businesses associated with primary processing of agricultural pro-ducts has lead to a high proportion of self-employment and indepen-dent workers,• rural employment of women and generally unpaid caregivers israrely reflected in national statistics although it represents a significantvolume of employment,• rural activity in the Mediterranean area is still strongly influencedby seasonal agricultural production, leading to under-employment ofthe available workforce out of the season,• salaried employees are precarious and intermittent in nature, thisphenomenon being exacerbated by a lack of labour laws or non-com-pliance with those existing,• vocational training is underdeveloped and skill levels and humancapital are lower in rural areas than in urban areas,
GRAPH 30Rural population inthe Mediterraneanregion (2005)
(thousands)
Sources: Our calculations, basedon the United Nations Populationdivision. World PopulationProspects 2004 (averagehypothesis). CIHEAM, Atlas Mediterra.
South shore
Total Mediterranean
1990 2000 2010 2020
160140120100
80604020
1990 2000 2010 2020
(4) Rethinking Rural Development in the Mediterranean. What role for agriculture inrural areas? Mediterra 2009.

124
• the weakness of the economy is often linked to a deficit in the infra-structures that makes rural areas unattractive for a possible redeploy-ment of new activities,• under-employment related to seasonal activity, however, couldbecome an advantage for agricultural pluriactivity if freed from manyconstraints.
In the Southern and Eastern Mediterranean countries, many youngrural people seeking jobs migrate to urban areas where the unemploy-ment rate may already be high(5)(GRAPH 31). Maintaining employment andincomes in rural areas, creating alternatives outside the agricultural sec-tor in the rural non-agricultural economy becomes a key priority for allsemc if agriculture cannot provide jobs to cope with population growth.
The example of Algeria illustrates well this phenomenon. Ruralunemployment, which exceeds 40%, forces migration to urban areaswhere unemployment is already high, affecting housing demand. Thisis consistent across the countries of the Southern shore, with varyingamplitudes in each country. Creating jobs and income in rural areasbecomes a priority which should be dealt with as a matter of urgency inplans for the development of rural areas in the South.
North of the Mediterranean, especially in the EU27, rural areas repre-sent over 90% of the land surface and 50% of employment. There ishowever a sharp decline in agricultural employment in rural areas whereunemployment is higher than in urban areas. This unemployment par-ticularly affects young people.
In the last 20 years, initiatives driven by the EU in order to developthe rural and non-rural economy in the Northern countries have beenlargely supported by the Common Agricultural Policy (CAP). They have
GRAPH 31 Total and ruralunemploymentin the Mediterranean
(% of total and activerural population)
Algeria
Jordan
Tunisia
Egypt
Syria
Turkey
Morocco
10% 20% 30% 40%
Rural unemployment
Total unemployment
Source: Radwan (2007), from national surveys.
(5) Radwan. S. Rural youth unemployment and coping strategies in the North East andNorth Africa region, Rome. Ifad. 2007.

125
vi – foresight – agriculture
brought some solutions in the North but they are not transferable to thesituation of the semc.
In nmc the workforce in rural areas is increasingly older and under-trained. In these rural areas, agriculture is losing 2-3% of its active popu-lation per year, but this decline in the working population is sociallyacceptable because it is often accompanied by compensation policiesthat are still lacking in the South of the Mediterranean. The employ-ment policies implemented in the European Union, mainly throughCAP actions, are at the heart of structural initiatives. Priority is given torural revitalisation and regional cohesion to reduce the developmentgap in “disadvantaged” rural areas and the promotion of regional pro-jects. In Northern countries, policies combine different types ofschemes, the most important concern vocational training. Other com-plementary measures, in the form of support to rural areas and diver-sified financial instruments, enhance the effectiveness of these policies.The whole enables agriculture diversification and an entrepreneurshipfocused on non-agricultural activities: the sale of food and processedproducts in proximity circuits, tourism, leisure, activities relocated torural areas and the creation of goods and services associated with thesegoods. Different generations of leader projects in MediterraneanEurope have led to the creation of rural enterprises that are more inde-pendent and sustainable, well beyond the agricultural sectors, e.g., inenvironmental services or heritage. Which elements of these situationscan be reproduced in the South and East shores?
The economic and social importance of the agricultural sector is decreasing
in a socio-demographic context marked by a growth in urban fooddemand, Mediterranean societies in the semc are still under the influenceof the rural sector whose gross agricultural production is still importantfor the gross domestic product (GRAPH 32). However, its economic impor-tance declines more rapidly in the South than in the North. In 2005,Syrian or Albanian agriculture contributed to 1/4 of the total nationaladded value that is 10 times more than that of France or Italy. In 2007,with an annual growth rate of 2.1%, Albanian agriculture still contribu-ted to over 23% of the national gdp (32% in 2001). Looking at anotherarea, growth in agricultural production in Morocco, in terms of averageannual growth, decreased from 10.6% for the period 1985-1991(6) to
(6) World Development Report. Agriculture for development, Washington (D.C.), WorldBank 2008.

126
0.25% from 1991 to 2004. In Greece, agriculture gdp decreased from11% of the total gdp in 1995 to 4.5% in 2007. But it was in Turkey thatthe decline was fastest relatively, the annual gdp decreased by 18% bet-ween 2001 and 2005.
This share of the agricultural gdp, which is still a significant part ofthe total gdp, often increases in years of high rainfall and decreases inyears of drought. The substantial but fluctuating part of the agricultu-ral economy in the global economy of the semc is also due to a lack ofgrowth in other economic sectors. The asymmetry of the situation ofthe semc compared to European Mediterranean countries is not onlymarked by the relative importance of the agricultural economy. It is alsoaccentuated by the ability of the agriculture sector in the countries ofthe Northern shore to contribute to the development of food industrieswith high added value.
Demography and climate change exacerbate the pressures on availableresources
the aridity that characterises many Mediterranean countries natu-rally limits farming possibilities. The percentage of arable land variesfrom 30% and upwards for France and 5% for Egypt, Algeria, Jordanand Libya. The improved land and irrigation of new land areas enableSyria and Egypt to slightly increase the area of arable land. But overall,for both semc and nmc, population growth is leading to a decrease inarable land per capita (GRAPH 33) which requires an increase in producti-vity per available hectare to offset this increased pressure on existingagricultural land.
GRAPH 32Part of theagriculture sectorin Mediterraneancountries’ GDP
Source: World Bank(www.worldbank.org).CIHEAM, Atlas Mediterra.
Italy
France
Jordan
Portugal
Spain
Greece
Lebanon
Algeria
Turkey
Tunisia
Egypt
Morocco
Syria
2
2
3
3
3
4
6.3
8
10
10.7
14.3
15.3
18.7
SEMCNorth
Three-year average 2005-2007% Total GDP

127
vi – foresight – agriculture
Losses of arable land due to eviction from land and natural events,associated with aridity (winds, heavy rain...), are exacerbated by inade-quate cultivation and pastoral farming which are responsible for ero-sion. Soil salinity through irrigation, with ground water laden with mine-rals or reservoir water high concentrated in salt due to intenseevaporation, combined with pollution and the use of pesticides or ferti-lisers, leads to a loss of land due to it becoming unproductive.
Water resources become increasingly scarce and a supply-demand unsuitability
the pressure on water resources (in the Mediterranean, 80% of thewater demand is for agriculture) and land (from 0.55 ha per capita in1960 to 0.30 ha in 2005) in a context of negative effects of climatechange on agricultural production makes it more difficult to solve theissue of food security in the Mediterranean: feeding more people withless water and available land with a growing productivity gap between
20051975 1985 19951965
SEMC
NMC
0.5
0.4
0.3
0.2
0.1
Hectares
From 1992, data introduced from Bosnia-Herzegovina, Croatia, Serbia-Montenegro and Slovenia
EgyptMorocco
AlgeriaFrance
LibyaPalestinian terr.
Albania Israel Cyprus Turkey SyriaGreece Spain Tunisia Italy Bosnia-Her. Lebanon MaltaSerbia-Montene. Portugal Croatia Jordan Slovenia
0 10 20 30- 30 - 20 - 10- 40
In %GRAPH 33 Arable land per inhabitant inthe Mediterranean (1961-2003) (left)and net loss in arable land (between 1980-2005) (wright)
Source: Plan Bleu, from FAO. CIHEAM, Atlas Mediterra.

128
the North, the South and the East. The agriculture sector has difficultiesin maintaining good results, which are irregular and punctuated by erra-tic weather conditions.
Irrigated areas doubled between 1965 and 2005, reaching a total areaof 24 million hectares(7). Major agricultural hydraulic programs have beenlaunched in most Mediterranean countries with increases in the surfacearea: Turkey (+3 million ha), France (+2), Spain (+1.5) and North Africa(+1.5 with 0.6 in Morocco and 0.3 in Algeria). Gravity irrigation practicesremain dominant in the Mediterranean(8) region, localised irrigation sys-tems and sprinklers which consume less water are developing, but theoverall physical efficiency of irrigation water shows losses of water in irri-gation systems of 52% for the nmc countries and 44% for the semc(9).
The analysis of exploitation indicators for natural renewable waterresources (GRAPH 34), which measure the ratio between the volumes sam-pled and the volumes available and their change between 2005 and 2025by country, led to the finding of a predicted shortage(10) for the majorityof the semc. A more detailed regional analysis shows that this couldbecome a reality in many coastal regions of Northern countries.
Northern Mediterranean countries must also cope with situationsof hydric stress in economic systems based on tourism and urbanisationas well as intensive agriculture that is a major consumer of waterwithout paying the real price for it. Water supply in the Mediterranean,in the Northern countries just as those in the South, cannot indefinitelyaccommodate an unlimited demand in a context of irregular rainfallcompounded by the different climate change scenarios for the Medi-terranean region. The Catalan example(11) illustrates this tension whichcould deprive Barcelona (headquarters of the secretariat of the ufm) ofwater, and which could result in potential conflicts between autonomouscommunities. The progress in water demand for agriculture in theMediterranean area is not compatible with the change in availableresources. The growing shortage, linked to exploitation rates that aresteadily increasing and the negative effects of climate change, will
(7) 13 million in the semcs and 11 million in the nmcs. (8) 100% of Egypt's cultivated land is under irrigation. Unique situation in theMediterranean. (9) Total Physical Efficiency: transport efficiency x irrigation efficiency. For one country,Syria, irrigation efficiency rose from 50% with traditional gravity irrigation to 78% withspray, to 88% with localised drip irrigation. iamz Data 2007 – Abed Rabboh. (10) See PAM data and Plan Bleu in Mediterra 2008. (11) See “The squabble over water in Catalonia” J.P. Nicol. Le courrier de l’environnementfrom inra No. 57. July 2009.

129
vi – foresight – agriculture
require a heavy revision of water management policies by sector of use.Irrigated agriculture in the Mediterranean, the main consumer of water,will therefore become the sector where potential economisation of wateris most important. Revision of water strategies is needed, its success orfailure will lead to certain crisis or possible developments.
Fragile food and agro systems and increasingly dependent food security
the performances of food production systems and trade results havebeen following inverse dynamics in the North and the South of theMediterranean region since the early 1960s and mainly for the 1964-
GRAPH 34 Index of exploitation of renewable natural water resources in the Mediterranean region (2005, 2025)
Source: Plan Bleu, Les perspectives du Plan Bleu sur le développement durable en Méditerranée, Sophia Antipolis, Plan Bleu 2008. CIHEAM, Atlas Mediterra.

130
2004(12) period. The EU countries have stabilised their share of worldagricultural imports to around 25-40%, while doubling their share ofworld exports from 22 to 45%(13).
The countries in the South and East have experienced the oppositetrend over the same period, becoming, since the 1970s, gross structu-ral importers of agricultural commodities and food. The deficits in theiragricultural trade balances are long-term (more than 8 billion dollarsfor the semc in 2001) with contrasting responses associated withvarying abilities to import products from Europe but increasingly fromother regions too (60% of agricultural and food imports outside ofEurope in 2005). These countries have become chronically dependentfor their food security. In 2004, the negative trade balance of the semcin world agricultural trade reached 9 billion dollars. Turkey is an excep-tion, displaying a positive agricultural trade balance in 2004 of 1.3 bil-lion dollars, providing nearly half of agricultural exports of the semcand importing 22% of the total semc imports(14).
Euro-Mediterranean agricultural trade remains highly skewed.While only 2% of agricultural imports and exports in Europe are donewith the semc, the EU absorbs more than 50% of the agriculturalexports from the semc and 30% of their agricultural imports. If Turkeyhas gradually become an agricultural and food power, Morocco andTunisia have succeeded, in good crop years (i.e. years with high rain-fall), in balancing their trade balances with the EU, while Egypt andAlgeria are significant in the overall semc deficit ( GRAPH 35). Privilegedexchanges are also developed between countries. Euro-Mediterraneantrade is often targeted. Five EU countries alone cover 75% of agricul-tural exports from the EU to the semc(15). The four main semc exportersare Turkey (47%), Morocco (22%), Israel (14%) and Tunisia (12%). Themain semc importers from Europe are Algeria (25%), Turkey (14%)(16)
and Egypt (13%). Privileged bilateral exchanges have developed bet-ween certain countries like Germany/Turkey, France/Morocco andFrance/Algeria.
(12) fao data stat 2006. (13) France plays a major role in this evolution, remaining the second largest agriculturalexporter in the world.(14) Data from Mediterra 2008. Geo-economic context. S. Abis, P. White, J. Ould Aoudia.(15) Shares of the 5 countries: France 30%, Netherlands 15%, Germany 12%, Spain 9%,Italy 5%. (16) Part of Turkey’s cereal imports are processed in Turkey and exported to NorthernAfrica (biscuits, pasta).
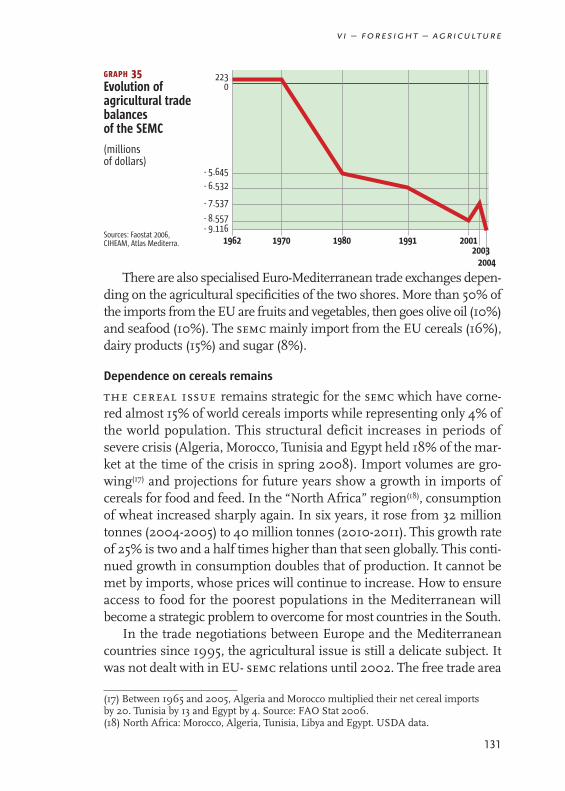
131
vi – foresight – agriculture
There are also specialised Euro-Mediterranean trade exchanges depen-ding on the agricultural specificities of the two shores. More than 50% ofthe imports from the EU are fruits and vegetables, then goes olive oil (10%)and seafood (10%). The semcmainly import from the EU cereals (16%),dairy products (15%) and sugar (8%).
Dependence on cereals remains
the cereal issue remains strategic for the semc which have corne-red almost 15% of world cereals imports while representing only 4% ofthe world population. This structural deficit increases in periods ofsevere crisis (Algeria, Morocco, Tunisia and Egypt held 18% of the mar-ket at the time of the crisis in spring 2008). Import volumes are gro-wing(17) and projections for future years show a growth in imports ofcereals for food and feed. In the “North Africa” region(18), consumptionof wheat increased sharply again. In six years, it rose from 32 milliontonnes (2004-2005) to 40 million tonnes (2010-2011). This growth rateof 25% is two and a half times higher than that seen globally. This conti-nued growth in consumption doubles that of production. It cannot bemet by imports, whose prices will continue to increase. How to ensureaccess to food for the poorest populations in the Mediterranean willbecome a strategic problem to overcome for most countries in the South.
In the trade negotiations between Europe and the Mediterraneancountries since 1995, the agricultural issue is still a delicate subject. Itwas not dealt with in EU- semc relations until 2002. The free trade area
GRAPH 35Evolution ofagricultural tradebalancesof the SEMC
(millions of dollars)
Sources: Faostat 2006,CIHEAM, Atlas Mediterra.
2230
- 5.645- 6.532
- 7.537
- 8.557- 9.116
1962 1970 1980 1991 20012003
2004
(17) Between 1965 and 2005, Algeria and Morocco multiplied their net cereal importsby 20. Tunisia by 13 and Egypt by 4. Source: FAO Stat 2006. (18) North Africa: Morocco, Algeria, Tunisia, Libya and Egypt. USDA data.

132
is organised for industry but it is not done for agriculture for reasons ofcompetitiveness for industries developed in the North and in the South(fruit and vegetables, olive oil). The first Euro-Mediterranean conferencein Venice, in 2003, opened the matter that was firmly on the agenda ofthe relaunched Euro-Mediterranean partnership in 2005. Since then,bilateral negotiations (EU-country) are under way with Tunisia andMorocco and other countries, but they often lead to the establishmentof non-tariff barriers for imported products coming from semc underthe guise of quality and safety reasons.
Scenarios concerning the future of Euro-Mediterranean tradedepend on the results of several ongoing negotiations(19). The agricul-tural opening of the semc envisaged in the context of the World TradeOrganisation (wto) negotiations should guarantee objectives that arecompatible with those of other ongoing negotiations. How to maintaintrade preferences for access to the European market while safeguar-ding trade in goods where the semc are not competitive? The ongoingnegotiations for a new CAP in Europe from 2013 could greatly impactthe development of agricultural production in the semc if, for example,the prospect of opening and liberalisation of trade go on accompaniedwith the implementation of reforms of the common market organisa-tions (for example for wine, fruit and vegetables).
These important elements of the Euro-Mediterranean regional situa-tion will strongly influence the sequence of different scenarios for thefuture of the semc.
Consumption habits moving away from Cretan diet
since a long-time, the Cretan food model provides many nutritio-nal benefits that have a strong impact on consumers’ health who com-bine the Cretan diet with regular physical activity. The variety of theMediterranean diet, coupled with many conservation and cooking tech-niques, characterises a Mediterranean lifestyle which originally com-bined frugal meals, conviviality and cultural tradition. The division ofthe basic diet components (cereals, sugar, fruit and vegetables, milk,meat, fish, etc.) make up three major types of diet in the Mediterra-nean region as compared to the Cretan diet (GRAPH 36).
From recommendations on the level of nutrient uptake, a compo-site index of food quality (ifq) is calculated from the consumption
(19) ciheam Analysis notes – May 2006. La question céréalière : un enjeu stratégique enMéditerranée. B. Hervieu, R. Capone, S. Abis, June 2006.

133
vi – foresight – agriculture
score(20). In 40 years, several countries have seen their food quality indi-cator deteriorate (GRAPH 37): Spain, Portugal, Italy, Greece, Turkey, etc.Others have improved: France and Tunisia, while the ifq of Moroccoand Algeria have stabilised. This global data on a country level obtainedthrough nutritional surveys can barely conceal the disparities related toconsumer purchasing power and access to certain foods for people whospend 60 to 80% of household budgets on food, as is the case in theMaghreb countries.
Sources: Our calculations based on Faostat data, CIHEAM, Atlas Mediterra.
(20) The score varies from 0 to 2 for each variable: eg. consumption of olive oil in g/day: fromthe least satisfactory: <5g = 0, 5 to 15 g = 1, to the most satisfactory > 15g/day = 2.
GRAPH 36 The 3 diet types in the Mediterranean compared with Cretan diet(2003)
FranceAlbania
MaltaAlgeria
MoroccoLebanon
SpainPortugal
TurkeyItaly
GreeceEgypt
Tunisia
4 8 12 16
1960
2000GRAPH 37Indicator of foodquality(1960-2000)
Sources: CIHEAM calculations,CIHEAM, Atlas Mediterra.
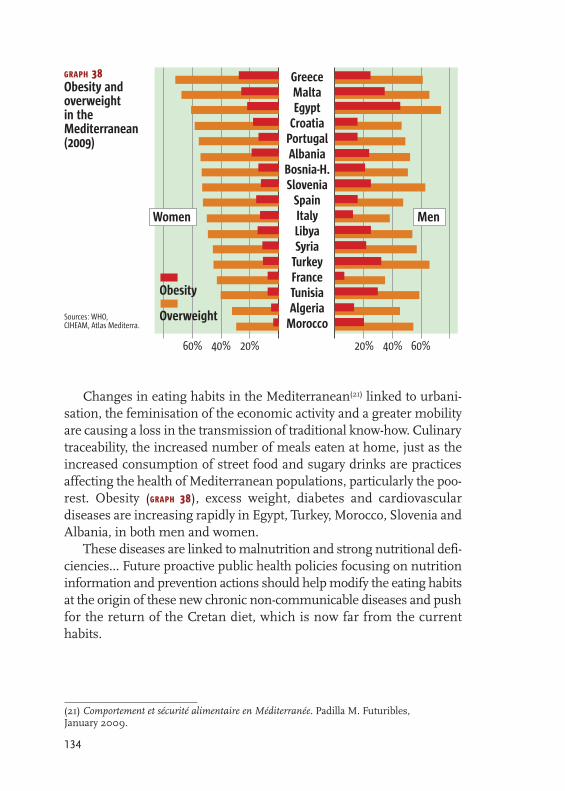
134
Changes in eating habits in the Mediterranean(21) linked to urbani-sation, the feminisation of the economic activity and a greater mobilityare causing a loss in the transmission of traditional know-how. Culinarytraceability, the increased number of meals eaten at home, just as theincreased consumption of street food and sugary drinks are practicesaffecting the health of Mediterranean populations, particularly the poo-rest. Obesity (GRAPH 38), excess weight, diabetes and cardiovasculardiseases are increasing rapidly in Egypt, Turkey, Morocco, Slovenia andAlbania, in both men and women.
These diseases are linked to malnutrition and strong nutritional defi-ciencies... Future proactive public health policies focusing on nutritioninformation and prevention actions should help modify the eating habitsat the origin of these new chronic non-communicable diseases and pushfor the return of the Cretan diet, which is now far from the currenthabits.
GreeceMaltaEgypt
CroatiaPortugalAlbania
Bosnia-H.Slovenia
SpainItalyLibyaSyria
TurkeyFranceTunisiaAlgeria
Morocco
20% 20%40% 40%60% 60%
Obesity
Overweight
Women Men
GRAPH 38Obesity andoverweightin theMediterranean (2009)
Sources: WHO, CIHEAM, Atlas Mediterra.
(21) Comportement et sécurité alimentaire en Méditerranée. Padilla M. Futuribles,January 2009.

135
2. Possible scenarios for the future
from this overall picture that highlights the fragility of the pro-ductive agricultural sector as well as the permanent food insecurity, seve-ral scenarios can be drawn. The first scenario (S1), “crisis in the Medi-terranean region”, confronts the North-South asymmetry and confirmsthe South shore's dependence on food with the emergence of crises cor-related with rising food prices and the continued marginalisation ofMediterranean rural areas. This scenario should be avoided but it willtake place(22) if the trends described continue or accelerate. Food criseslead to economic and social crises... the results of crises and democra-tic transitions can then open the door to other scenarios.
The second scenario (S2), “Mediterranean divergences”, is the emer-gence and differentiated integration of some Southern and Easterncountries in the global economy (Morocco, Tunisia and Turkey) catchingup with Northern Mediterranean countries falling behind in their Euro-pean goals (Greece, Portugal, Italy...). Mediterranean agriculture in theNorth and the South shut itself off as increasingly challenged by impor-ted products from Latin America and Asia. Poorly protected qualitychains are also faced with competition from labelled chains from NorthAmerica, South America and Australia. Food security is provided tem-porarily for some Southern countries if they manage to contain thegrowth in cereal demand and manage water demand for agriculture.
The third scenario (S3), “Mediterranean convergence”, is based onthe desire of Mediterranean players for strong change and the imple-mentation of concerted investment policies in rural areas to boost Medi-terranean agricultural production. This boost must be accompanied byagricultural policies intended to control fluctuations in agriculturalprices. Better coverage of food safety is thus ensured by the provision ondomestic markets of quality products and services supporting produc-tion and the economy in rural areas. This is the scenario of a Euro-Medi-terranean food security pact.
These different scenarios will be quickly raised in light of the essen-tial diagnosis of the state of Mediterranean agriculture and food sys-tems. The last scenario of convergence for a better control of food secu-rity involves many prerequisites that shall be presented in order to pointout implementation measures and necessary actions.
vi – foresight – agriculture
(22) Update: this occurred in Tunisia on 14 January 2011 and Egypt on 11 February 2011.

136
Major trends
some quantified approaches are needed to better outline the possi-ble evolutions in the major variables used for food security, distingui-shing for analysis: quantitative food security related to the energycontent of the daily diet and qualitative food security correlated withfood security and nutritional value aspects(23) and energy of the productson the market.
The changes in dietary energy supply (des) used by countries for thequantitative approach are not available for all Mediterranean countries.The analysis of the des, when available, for example for Tunisia, showsthe impact of food aid programs and the fight against poverty(24) making,from 1960 to 2000, increase the des from 2 000 to over 3 000 kcal/percapita per day(25).
Available data and updates concern the quantification of food resourcesfor the mena region(26). It is calculated from the amount of plant, animaland aquatic calories(27) available. The calculation of available plant calorieslinks per capita calorific efficiency hypotheses and cultivated land for foodproduction. The available animal calories are calculated, on the one hand,from proteins produced by fodder production and, thus, from the evolu-tion of fodder land and, on the other hand, from the production of proteinfrom animal feed (sensitive to changes in cereal prices in general impor-ted by the semc). For aquatic calories, the assumption is that resourcesfrom regional production cover regional needs.
The evolution of these different interacting variables (which makesit difficult to build up detailed scenarios from the quantification of foodresources) allows, however, drawing the evolution of major trends frompopulation data, available area, regional crop yields, etc.
Regarding the evolution of the population, specialised scenariosdetailed elsewhere are referred to. The overall figure is 500 millioninhabitants in the Mediterranean region in 2030. The average hypo-
(23) See point 8 of the food quality indicator. (24) To better take into account food security: Actualisation concertée de la politiqueagricole, Minister of agriculture-afd Tunisia-cirad-gret-iram, Nov 2010. (25) The intake was less than the quantities available. Individual energy needs varybetween 2000 and 3000 kcal/day according to gender, height, weight, physical intensityof activity carried out...(26) Millennium Ecosystem Assessment – mea – 2005 which proposes differentscenarios for the future based on the weight of the issues of globalisation andregionalisation and the capacity to tackle environmental aspects related to development. (27) Agrimonde – Agricultures et alimentation du monde en 2050. Scénarios et défispour un développement durable. inra-cirad, 2nd edition Sept 2009.

137
thesis used is that the level of food consumption reached would be3 000/3 300 Kcal/day/person according to the diet specificities of eachcountry (see point 8). Food consumption is derived from economicgrowth under different scenarios(28). This overall average availability doesnot take into account at this point large intra-regional disparities suchas the one related to animal and vegetable foods making up the diet.
To quantify changes in food demand, we will retain the changes inthe demand for cereals and more particularly the demand for wheat,whose significance has been underlined given the structural deficit ofthe semc (excluding Turkey). The need for further work on food demandfor cereals for human consumption and animal feed becomes pertinent.Between 2000 and 2030, cereal demand will increase from 85 milliontonnes to over 140 million tonnes(29).
The factors limiting the growth of cultivated areas due to the lowpotential of arable land, water stress, probably on the increase due toclimate change, and loss of areas already cultivated as a result of urba-nisation, reduces the capacity for the cultivation of new land. The maxi-mum increase of the cultivated area is estimated at +10% for areas undercultivation (food and non food areas) in the mena region.
The increase in agricultural production due to intensive farming willbe translated into increased food calories per cultivated area. This pro-duction has followed an annual growth rate of 2.5% between 1961 and2000, whereas it will grow between 0.25 and 1%(30) between 2000 and2050. Under these assumptions for population growth, changes in theconsumption of plants and animals, cultivated area and yield, thebalance sheets show a constant(31) food deficit.
If regional production rose in a steady trend from 40 to 70 MT, themena region would have to import, in 2030, over 50% of its consump-tion, i.e. more than 70 million tonnes of cereals to meet the growingneeds related to a sharp increase in meat (+104%) and milk (82%). Thesemc will, therefore, address this constant deficit importing so to feedits population.
Given the volume of renewable water production (in m3 per capitaper year) in Maghreb, Mashreq and North Africa and coupled with popu-lation growth projections for the period 2000-2030, the average assump-
vi – foresight – agriculture
(28) Quantity available (production +/- stocks + imports - exports). (29) Increasing Food Security in Arab Countries. FAO-World Bank Study, 2009. (30) Food yields and annual growth rates in an agricultural forecasting scenario. See note 28.(31) The calculation of this deficit is the difference between local production andconsumption (food + animal + human + other uses of seed food biomass).

138
tion adopted for the same period with a population increase of 70%,insufficiently compensated by increasing agricultural production by 20%,results in a food deficit of 1,150% (see note 25). This overall outcomeaggregates very different results as the trade deficits balance varies bycountry. In this scenario, Tunisia would occupy a more favourable posi-tion(32) with only 27% of additional demand for cereals in the next 10 yearsand 34% for oils. For the Maghreb region (Algeria, Morocco, Tunisia andLibya), there is an overall increase in imports of 50% for oils, whilst 75%for cereals.
For the evolution of food prices, the observed trend is that of prices ofwheat and oil on the futures markets(33), strategic raw materials for foodsecurity (food, energy). The rapid fluctuation in the price increase(GRAPHS 39 & 40) is a primary trigger for the food riots which take place inthe Mediterranean since the early 2005.
The trend chosen for the evolution of wheat prices is a steady increasein the long term with significant variations related to the permanent pricevolatility and in the absence of effective regulation stocks(34).
The implementation of these scenarios depends on the ability ofMediterranean agriculture to cope with the fundamental challenges ofagribusiness:
The improvement in food production will depend on:• agriculture and rural development due to intensive farming goingbeyond the constraints of growth of arable land and competition on landresources and water;• the ability to innovate, to develop more complex production systems,to manage the input demand, to ensure access to resources and to ser-vices that support production.
To accommodate the food demand to the available resources willdepend on:• changes in eating habits, in the implemented institutional policies,in the capacity to control the consumption of animal calories(35) and toreduce losses in production chains, processing and food distribution;
(32) Min. Agri. Ress. Hydrauliques et Pêche, Tunisie – Vers une nouvelle stratégie pour ledéveloppement du secteur agricole 2008 – cited in note 25. (33) Data cited by Nicolas Bricas, UMR Moisa-CIRAD. January 2011.(34) The price of a tonne of wheat stored in Ile-de-France passes for an identical product(same place and same storage capacity) from €130 in July 2010 to €270 in February 2011.(35) Significant decrease for the countries of the North shore.

139
• the establishment of new national and interregional governanceschemes in order to secure supplies and regulate markets and prices.
For the baseline scenario and the adequacy of resources and fooddemands, we will retain, on the horizon of 2030, the following keyfigures:• cultivated land: a maximum increase of + 10%• grasslands: maintained or with a decline of 5%• forested areas: a decrease of 30%• a rainfall deficit of + 10% to + 20%• increase rate in food yields per hectare: from +0.25 to + 1% per year• agricultural production increased up to 20%• human food consumption 3 000 K cal/inhab/day including 2,500plant and 500 animal• food yields kcal/ha/day: 14 500• increase in overall food deficit of more than 100% (doubling)
The scenario of “crisis in the Mediterranean region”: a convergencethrough the bottom and a break (S1)
in this scenario the previous trends are confirmed and accelerated.The crises will continue with a rise in the prices of agricultural com-modities and food products that will be sustainable. These higher priceswill be accompanied by strong variations related to active speculationand a lack of food stocks with a minimum price regulations and theabsence of food security stocks. The first part of this scenario is cur-
vi – foresight – agriculture
GRAPH 39Prices of wheaton the futuresmarket
GRAPH 40Crude oil price
Source:FT. 28/01/2011by N. Bricas

140
rently playing out, according to the fao index on the evolution of foodprices(36) (GRAPH 41). At the start of 2011, this index, which has risen everymonth for 7 months, it was up of 3.4 in January 2011 and reached231 points, its highest level since 1990, the inception date of the index.
The price of food soaring in one month (sugar: +5.4%, oils and fats:+5.6%, cereals: +3%) (GRAPH 42). If the price of meat at the world levelremains stable, this is due to lower prices in Europe(37). The food crisesbecome permanents and States respond individually to the crisis ofTunisia. Beginning of January 2011, Algeria bought 1 million tonnes onthe international market(38). On January 12th 2011, Morocco launched atender for 150,000 tonnes of wheat and 100,000 tons of barley; Libyafor 100,000 tonnes of wheat. Market tensions accelerate because ofuncoordinated national policies. Food insecurity may then be trans-formed into high vulnerability of the States. Food crises and relatedriots will spark other crises.
World prices of agricultural materials globally increase. However, inthe Mediterranean, the ripple effect of prices on agricultural income is
GRAPH 41 FAO Index for food prices GRAPH 42 Food commodity price index(2010)
(36) www.fao.org/worldfoodsituation/foodpricesindex. (37) A lowering of prices following the crisis of confidence in December 2010 and January2011, consumers associated with the consumption of livestock feed (Germany) offsetby higher export prices by the U.S. and Brazil.(38) Order of 6 January 2011 after five days of riots in the cost of living in Algeria, followedby purchases of 600,000 tonnes of milling wheat and 50,000 tonnes of durum wheat inmid-January 2011.
240
210
160
150
120
2011
2010
20072009
2008
J F M A M J J A S O N D
240
210
160
150
120J F M A M J J A S O N D J
2002-2004 = 100 2002-2004 = 100
Sugar
Oil and Fats
Cereals
Meat
Milk Products
2010 2011
141
lower for family farms, which are a majority, in terms of number offarms and in agricultural assets working in or for these farms. Besides,they mainly focus on the subsistence production of food crops combi-ned with farming and dry tree crops.
This scenario leads to the gradual withdrawal of cereal crops inareas where climatic conditions are too strong with, in the short term,the collapse of rainfed (non-irrigated) agriculture in the Southern shoreand the Middle East, in a context of accelerating trade between Northand South, in an open unregulated market. Agriculture in the semc,except for some export sectors to the North shore of the Maghreb, Israeland Turkey, lose their competitiveness on foreign markets as well as ondomestic markets.
In this scenario of convergence through the bottom and accelerationof the identified trends for the reference scenario, access to waterresources leads to conflicts. The increasing demand for agriculturalwater is only satisfied by a limited supply, without the possibility ofincreasing or improving irrigation efficiency (losses, surface irrigationremaining majority without significant developments of drip irrigation).
The lack of professional organisations, associations or unions of far-mers cannot allow the access to support services for agriculture and themarket. Small farms, technically framed, live of transfer incomes andmultiple jobs that ensure their survival. The agricultural business sec-tor, increasingly dominated by non-agricultural operators, concentratesland ownership primarily on communal lands and then State areas(39).It may continue its modernisation by improving yields and overall pro-duction. In the same period, smallholder agriculture sees its populationincrease but exodus and emigration no longer absorb the increasedpopulation. These small farms decapitalise their physical and financialland resources, pressure on natural resources increases, so... we wit-ness the spread of poverty and the raise of social and regional inequali-ties. The rupture scenario is thereby reinforced with forced migration,uncontrolled migration flows, asymmetry and imbalance. The Northshore, trying to get out of the economic and financial crisis (more mar-ked in the European Mediterranean countries than in the countries ofthe North), cannot invest in policies to mitigate these asymmetries...The fall of foreign direct invesments observed in the Mediterranean in2008 and 2009 is confirmed as well as the decline in remittances from
vi – foresight – agriculture
(39) Mediterra 2008: In the Maghreb area 1.5% of total holdings are larger than 50 haand account for 20% of the cultivated area. 2 of 3 operations are under 5 ha.
142
expatriate workers and the reduction in tourist flows. The decline inexports(40) is accompanied by a raise in unemployment and inflationrates. Budget deficits grow and annual gdp growth rate slows down, forthe Maghreb countries, from 5% to less than 3%... The construction ofa Euro-Mediterranean economic area disappears for a long period.
The “Mediterranean divergences” scenario: a disparate insertionin the world economy (S2)
in this scenario, the Euro-Mediterranean partnership subsists in afree market economy open to the world. The free trade agreements, nego-tiated by each country with the EU, grow asymmetrically but with morebenefits for the Northern shore than for the South. These agreementscontinue to exclude agriculture and ultimately prevent the expansion ofexports from the South and East to Europe. This asymmetry, in favour ofthe North, is increased as South-South or South-East regional integra-tion still cannot see the day in the absence of political will of governmentsin power who prefer isolated negotiation and the status quo to a regionalagreement. The negative impact of blocking boundaries(41) with highertransaction costs between the Maghreb countries than the ones withEurope, do not promote regional integration either. This lack of commonapproach is highly prejudicial to the Maghreb countries. In their nego-tiations to purchase cereals on the world market, for example, and giventhe weight of imports, cumulated total imports of wheat for Algeria,Morocco, Tunisia and Egypt count, at the height of the 2008 crisis, for20% to 25% of world imports of cereals. In this context, trade betweenthe semc and the EU continues to decline. Brazil reinforces itself as apartner of the Mediterranean countries. Mercosur strengthens itsalliances and negotiates agreements with Egypt, Morocco and Turkey.The agri-food exports from Brazil to Egypt and Algeria grow rapidly. Egyptimports nearly all of the meat and imported sugar from Brazil(42).
Only some Mediterranean countries, foremost among which standsTurkey, maintain growth rates of total gdp and agricultural gdp around5% per year benefiting the mechanised farming sector. For most semc,family farming continues to decline and is marginalised; intensive andmechanised agriculture is developing. The insolvent rural population
(40) Exports decline by 21% in Tunisia in 2008 and 18% in 2009. Source O. Bessaoud.ciheam/iamm. Seminar gtz /inra/ird Tunis. November 2010.(41) For lasting security in the Maghreb, a chance for the region, a commitment for theEuropean Union. Thomas More Institute. April 2010. (42) See Confluences méditerranéennes, la méditerranée sans l’Europe, N°74. Summer 2010.

143
has more and more difficult access to resources, goods and services,while part of the solvent urban population keep its access to the globa-lized market, the big retail stores, to services, education and health. Thisscenario sees continued urbanisation with a widening gap between coas-tal and inland rural areas. In order to ensure its food security, the Sou-thern shore of the Mediterranean turns gradually to other emergingpartners, Brazil, China and India, where agricultural production andfood eventually compete with those from the Northern shore.
The “Mediterranean convergence” scenario: top-down convergenceand a set of concerted agricultural and multisectorial policies (S3)
this is a scenario that changes things, with a progressive conver-gence towards a co-development pact that enhances regional food secu-rity. For this scenario to take place, Mediterranean countries need to, col-lectively, assume their food security by implementing concerted andcomplimentary regional agricultural policies. The evolution towards thisscenario implies some prerequisites in terms of sharing common goalsof food security, the creation of European and Mediterranean agricultu-ral policies converging on some key points such as control of agricultu-ral prices, market regulation and the constitution of security stocks forfood security.
Massive public and private investments are done in agriculture,which is essential to ensure a steady increase in agricultural gdp from3 to 5% per year. These investments should grow at the same pace asagricultural gdp growth and be concentrated in sectors like the mobi-lization of water resources, transportation and localized distribution ofirrigation water but also in strengthening devices on rainfed agricultureand on economy of water resources in farming systems, making attrac-tive grasslands and areas of supplementary irrigation(43). Agriculturalpublic investment must be accompanied by a reinforcing of humancapacities for monitoring the implemented policies. They will facili-tate market access for farms weakened by years of structural adjust-ment and market liberalisation policies.
Create jobs and income in rural Mediterranean areas – a prerequi-site to better ensure food safety – necessitate the development of an agri-cultural policy consistent with other sector and intersector public poli-cies (import controls, tariffs, quotas and tariff measures backup, etc.).
vi – foresight – agriculture
(43) These may include provisions for spreading, protection and restoration of soils, microstructures, catchment ponds for supplemental irrigation, etc.
144
Within each Mediterranean country(44), public and private invest-ment in the productive sector can be upgraded with an industrial policypromoting local products and bringing international norms and stan-dards for products and processing companies. The implementation ofthe convergence scenario, with a annual growth of agricultural gdpabove 3%, will also require, in the countries of the Southern shore, tocouple to a policy of incentives for production elements of general eco-nomic policy to support agricultural credit and the setting up of insu-rance and tax measures such as aid for the storage and production ofquality seeds. Access to investment and equipment also implies speci-fic allocations to agriculture at subsidised rates managed by professio-nal financial services. The development of public policies in the agri-culture and food sector requires the presence of an organisedprofessional sector, real partner of the government, contributing to therehabilitation of public action.
Policies for land records are deemed essential to stimulate investmentin the long-term and funding of agricultural activity. Complementaryenvironmental policies of rational management of water resources andland, infrastructure and transports policies and land planning must alsoaccompany the investment policies in the productive sector.
3. Towards a new common agricultural policy
these integration schemes require the mobilisation of significantfinancial resources over time. The Northern Mediterranean countries,in order to succeed their integration policy, have benefited from stableand long-term public policies and received massive financial support(45 billion Euros per year for the EU27 until 2012). It does not seempossible that these policies and supports can be gradually extended to thesemc given the low capacity of these countries to collect taxes to feed asystem of coaching and aid to rural development. Modes of governancein use, a lack of appropriate legislation as well as adjustment andupgrade schemes, make the establishment of such policies barely pos-sible in the short-term. This context is not the one of Southern and Eas-tern Mediterranean countries. The recent food crises have shown, howe-ver, that the established doctrine of risk management without affecting
(44) See a recent analysis of Tunisia cf. Note 25.
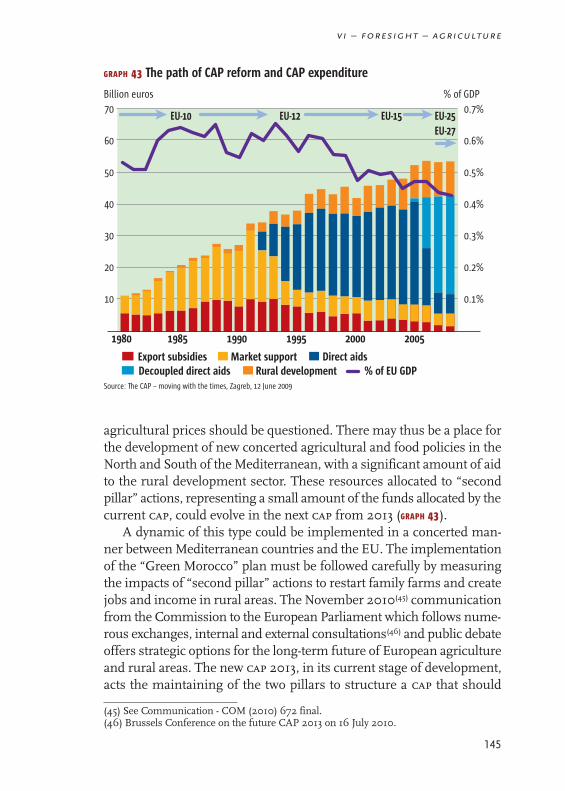
145
agricultural prices should be questioned. There may thus be a place forthe development of new concerted agricultural and food policies in theNorth and South of the Mediterranean, with a significant amount of aidto the rural development sector. These resources allocated to “secondpillar” actions, representing a small amount of the funds allocated by thecurrent cap, could evolve in the next cap from 2013 (GRAPH 43).
A dynamic of this type could be implemented in a concerted man-ner between Mediterranean countries and the EU. The implementationof the “Green Morocco” plan must be followed carefully by measuringthe impacts of “second pillar” actions to restart family farms and createjobs and income in rural areas. The November 2010(45) communicationfrom the Commission to the European Parliament which follows nume-rous exchanges, internal and external consultations(46) and public debateoffers strategic options for the long-term future of European agricultureand rural areas. The new cap 2013, in its current stage of development,acts the maintaining of the two pillars to structure a cap that should
vi – foresight – agriculture
(45) See Communication - COM (2010) 672 final.(46) Brussels Conference on the future CAP 2013 on 16 July 2010.
GRAPH 43 The path of CAP reform and CAP expenditure
EU-15EU-12EU-10
Export subsidies Market support Direct aidsDecoupled direct aids Rural development % of EU GDP
EU-25EU-27
1980 1985 1990 1995 2000 2005
70
60
50
40
30
20
10
0.7%
0.6%
0.5%
0.4%
0.3%
0.2%
0.1%
Billion euros % of GDP
Source: The CAP – moving with the times, Zagreb, 12 June 2009

146
remain a strong European common policy organised to meet three stra-tegic objectives: • Ensuring long-term food security of Europe while contributing toglobal food demand where there is continuous growth. Preservation offood production potential must be done in a context of climate changeand with increased pressure on land resources and water.• Support the production of food that must be varied, of quality andhaving an added value, produced with an approach respectful to terri-torial development. • Preserve the viability of rural communities that create local jobs.
These general elements stress the importance of agriculture to theEuropean economy and society with options for reorienting the cap 2013budget. The existence of two supplementary pillars is confirmed, thefirst pillar offering market measures and direct payments but more eco-logically based and more equitable than currently. The second pillar pro-poses multi-annual measures of rural development but they are moreoriented towards competitiveness, innovation and the environment ina climate change context. These guidelines are consistent with deve-lopment priorities of Mediterranean agriculture, although the draftingof the future cap does not include any measures of the impact of futurecap on trade in goods between the North, the South and the East of theMediterranean.
4. The European Neighbourhood Policy: an enhancedcooperation for the convergence of health standards
the european neighbourhood policy (enp ) aims to provide grea-ter economic integration between the EU and its neighbours, includingMediterranean Partner Countries (mpc ) members of the Barcelona Pro-cess. This policy, different from the enlargement policy, seeks to esta-blish closer cooperation with no prospect of accession. It therefore pro-vides a status less exigent than membership but more than that of theassociation to countries that commit to a series of politic and institu-tional reforms, primarily aimed to the promotion of Mediterranean agri-cultural products to export but also for domestic markets.
For mpc , the convergence of health standards with those of the EUbecomes a must for all products they export to the EU and especiallyfor fruits and vegetables, which represent 56% of exports from Medi-

147
terranean countries to EU(25) in 2005-2006. The low current capacityof mpc companies to control the quality of health products is often anargument used to oppose the liberalisation of trade in agricultural andfood products. Reforms that would create health agencies are requiredto address these new non-tariff barriers. They involve the compliance ofnational legislation with international commitments but also theaccountability of private actors themselves, the promotion of quality andtraceability, ensuring a better competitiveness of the products in domes-tic markets. In this context, it becomes essential to develop a concertedeffort between the North, the South and the East for a plan promotingthe quality of products based, for example, on a network of laboratoriesof analysis to characterise, validate and certify the sanitary quality ofMediterranean agricultural products and food for the domestic andexport markets. Health regulations are central features of food safety inEurope for public or private traders, mainly from the retail sector.
The European Food Safety Authority (efsa) was established in 2002to assess existing and emerging risks in food. Its scientific work, theresults and advices it publishes should help decision makers in the adop-tion of EU legislation on food safety of animal and plant products. Thecreation of a common trade area for agricultural products and food bet-ween Europe and the Mediterranean needs the introduction of closerlegislation where future circulation of products is less hindered thancurrently. This convergence of food standards between mpc and theEuropean Union can help accelerate the modernisation of mpc chan-nels and contribute to the progressive creation of a Euro-Mediterraneaneconomic area. This will involve the mobilisation of specific resourcesfor compliance layouts, for the consolidation of financial capacities andthe strengthening of technical skills. It will also go beyond institutionalconstraints relating to the health quality of traded products and the orga-nisation of mpc channels.
vi – foresight – agriculture

148
5. The co-development scenario
Building a rural co-development pact
a major factor of food security lies in the instability of agriculturalprices that is often the result of speculation and the incapacity of agri-cultural and rural actors to anticipate. The use of different schemes tomanage this instability becomes crucial(47), either by the stabilisation ofprices or by a better control of market risks, using policies combiningmarket regulation and public intervention. Public policies to stabilizefood prices must be conceived in the medium and long-terms. Thesepublic policies should combine arbitration, hedging against risk, trans-fer insurance schemes and support measures. Temporary controls onproduction, through imports and exports regulations, must be designedwith the establishment of quotas for imports and exports. Modernisingproduction systems and adapting them to climate change, investing inthe productive sector and mostly in the processing and marketinginvolves the control of the prices stability at different levels. The moder-nisation of production structures and intensive farming environmentallyfriendly is one form of stabilisation.
Complementary public interventions will strength the control onspeculation by calling up international markets or the management ofstocks. Export controls in times of crisis can also help improve the mana-gement of physical stocks. Associated mechanisms of varied taxes onimported goods can also help offset the excessive price fluctuation. It isa set of measures that must be implemented for a stabilizing interven-tion and in order to reduce risk and anticipate future interventions. Thisset of measures articulates: control of prices and markets, incentives toproduction for the domestic market, strengthening the professionali-zation of channels and farmers’ organisations. All these elements ofagricultural and food policies, implemented in a concerted manner bet-ween Northern, Southern and Eastern Mediterranean countries, couldform a genuine rural co-development pact with mutual benefits. Itwould then be possible to accept some forms of protectionism, on atransitional period, to help consolidate the income of farmers which willhave access to local markets at profitable prices. Control systems deve-
(47) See Volatilité des prix internationaux agricoles et alimentaires et libéralisation en Afriquedu nord. François Lerin, Sylvaine Lemeilleur, Michel Petit, in “Perspectives des politiquesagricoles en Afrique du Nord” ciheam-afd. Options méditerranéennes. N° 64. 2009.
149
loped in the North and in the South would allow market regulations andpromote quality food production that ensures jobs and incomes in therural inlands of Southern and Eastern Mediterranean countries.
In this context, the setting up of stocks of Euro-Mediterranean cerealscould be organised to make emergency responses more effective. Sto-rage policy, including in the Mediterranean ports, could be revived in aconcerted manner between countries bordering the Mediterranean. Thispartnership agreement on cereals would have as a main aim to gua-rantee farmers prices, as well as consumers, by limiting the impact ofspeculation. Northern cereals channels could establish an agreementwith Southern and Eastern countries on the basis of a global agreementguarantying, for the Northern countries, new markets. In compensa-tion, Northern countries would ensure food security in the frameworkof a common mechanism for management of stocks. This regionalagreement could be directly settled between actors of the cereal channelsand benefit from guarantees from the States. Southern countries, alsoexporters of agricultural inputs (natural phosphates and fertiliserscoming from the petrochemical industry), could introduce these ele-ments in the future agreement to be negotiated. These elements couldeventually include an indexation of the price of cereals on the price ofenergy. At a geostrategic level and in the long-term (5-10 years), such aproject would make sense as, over a period of 20 to 25 years, a hundredmillion people around the Mediterranean would have to be fed. Thisimplies, in particular for Europe, to be engaged in a partnership in orderto support the reform of agriculture in developing countries in the Sou-thern Mediterranean through transfers of resources as done for the Eas-tern European countries. It would, thus, be a question for the food, agri-business and rural development sectors to elaborate a regionaldevelopment policy, articulated around the European neighbourhoodpolicy, allowing the progressive construction of a real pact of rural co-development for the Mediterranean area and not just engage the enlar-gement of the cap in a new formula for the South and the East.
Organising priority channels
the fruits and vegetables sector remains the sector with the majorpotential trade between the North, the South and the East of the Medi-terranean to the extent that the cereal sector is structurally a sector ofimport of the “Souths” from diversified “Norths”. The launching of aEuro-Mediterranean co-development dynamic would allow the organi-
vi – foresight – agriculture

150
sation of the production and the Mediterranean trade of fruits and vege-tables in such a way that it could be, later on, extended to other channels.The objectives of this organisation could be formulated as follows:• create jobs and added value through domestic and internationaltrade, by promoting quality and the Mediterranean origin of goods andby consolidating Euro-Mediterranean partnerships between enterprises;• boost the consumption of Mediterranean fruits and vegetables byoffering quality products, resulting from certification process, at accep-table prices, and raising awareness on their nutritional benefits;• control the negative effects on the environment by developing inte-grated and biological food productions resulting from ecologically inten-sive farming and valuing the expertise and innovations available;• decrease greenhouse gas emissions as well as the emission of parti-cles at high environmental footprint by reducing South-North andNorth-South road transports and incorporating some elements of eco-conditionality in trade.
In a Euro-Mediterranean area, which would share a minimum ofcommon rules in order to guarantee the quality of traded products, chan-nels of quality products (with a growing economic impact in the North)represent a significant potential of development, employment andincome in rural areas (GRAPHS 44 & 45).
Better management of Mediterranean food security risks
this scenario of convergence and co-development needs to streng-then risk management in order to build food security. To do so four axesmust be developed:• ensure availability of basic food by combining domestic productionand import capacity;• ensure, throughout the year and in the long-term, the regularity ofavailable products;• maintain access to food while preserving the purchasing power,transport infrastructure and storage capacity as well as balanced nego-tiations between channel actors from production to consumption;• guarantee the nutritional quality of food.
To ensure long-term food security, the Euro-Mediterranean coope-ration, strengthened in the food security area, could focus efforts in agri-business markets and enterprises, in production and exploitation sys-tems and in farmers, on ten priorities:

151
1. Encourage the integration between local and export channels. Theexporting firms, which have the required expertise in implementingquality standards, could be encouraged to disseminate their know-howinto the domestic market. Develop the necessary economic process forthe construction of proximity food systems(48) promoting short distri-bution networks and under regional food-processing transformation,creator of jobs and incomes in rural areas.2. Encourage the transfer of know-how in reasoned production sys-tems and expertise on standardization by establishing joint venturesproducing in the North and the South to ensure continuous supply ofthe same distributors.
vi – foresight – agriculture
ItalyFrance
SpainPortugal
Greece
Turkey
TSG 1 0 3 0 0 0 20%PGI 61 84 51 56 23 19 82%PDO 112 76 66 58 63 34 91%
174 160 120 114 86 53
Share of European Mediterranean countries in the EU total
GRAPH 45Organicagricultureand qualityproducts in theMediterraneanregion (2006)
(thousandshectares)
(48) See Prospective du système alimentaire mondial : modèle agro-industriel ou modèlede proximité ?, in Le système alimentaire mondial. Concepts et méthodes, analyseset dynamiques. Jean-Louis Rastoin, Gérard Ghersi. Quæ 2010.
Sources: CIHEAM,Atlas Mediterra.
Sources: CIHEAM,Atlas Mediterra.
TSG: Traditional Specialty Guaranteed PGI: Protected geographical indicationPDO: Protected designation of origin
GRAPH 44PDO, PGI and TSG qualityproducts in Northerncountries (2009)(numbers)

152
3. Develop a program to support quality and health standards, targetedfor identified producers, adapted to production conditions and socio-cultural values of mpc that ensures them an active contribution to thedevelopment of these standards. 4. Develop research, training, higher education and technology trans-fers for climate change: irrigation systems to strengthen productionsystems, integrated fight against devastating pests, conservation of far-ming. Promote local products with low environmental impact andusing biodiversity. 5. Significantly invest in the production and support of innovationsand technical and managerial skills in export channels as well as in tra-ditional industries where products are meant for domestic markets.These plans, built on the diversity of Mediterranean agricultures, willenhance the quality of their products based on the great potential fordevelopment of domestic markets. 6. Better control price volatility through mechanisms of market control,tightened in speculation periods by using dedicated funds on basic foodproducts. 7. Consumers’ education for better nutrition. Develop nutrition pro-grams that improve economic and social development as well as povertyreduction. 8. Building systems to adapt to climate change impacts based onmutualised insurance schemes. Control risks related to aridity by deve-loping adapted production systems, low consumers of water resourcesand enhancing the local workforce and know-how. 9. Boost a preservation Mediterranean agriculture protecting grounds,biodiversity and less emitter of ghg(49), thanks to incentive agriculturalpolicy measures, being able to benefit from payments for environmen-tal services (pes)(50).10.Strengthening the development of knowledge and useful data forthe development for the emergence of Euro-Mediterranean networksof education, research and cooperation. Connecting universities andresearch systems on life sciences, creating centres of expertise with aregional distribution of their teams (Maghreb, Southern Europe,
(49) ghg: greenhouse gas, see L’agriculture peut-elle accéder aux marches de carbone ?farm study, December 2010.(50) See La rémunération des services environnementaux rendus par l’agriculture. Documentde travail prospective et évaluation. N° 2, March 2009. maap: Service de la statistiqueet de la prospective.

153
Mashreq, Balkans...), supporting targeted programs focused on com-mon priorities and assigned to qualified Euro-Mediterranean lecturer-researchers being able to move more freely between the Northern, Sou-thern and Eastern shores of the Mediterranean.
6. The Mediterranean spring and food safety:new opportunities?
climate uncertainty in the Mediterranean always leads to somecaution on the sustainability of positive developments. Wet and greensprings are sometimes followed by dry summers, not confirming thepromise of spring. Revolutions engaged in the Mediterranean regionare processes needing long periods in order to be stabilised. But fromthis situation and vis-à-vis food security, new opportunities could emergepromoting efficient South-South and South-East regional cooperation,which is an essential prerequisite for strengthening the Euro-Mediter-ranean area.
Almost nonexistent trade among the countries of the Southernshore could boost local productions, regional markets, jobs andincomes in rural areas. gdp gains from the actual reduction of cor-ruption, and thus of transaction costs, invested in dynamic reductionof food insecurity could accompany new regional dynamics of resourcemanagement(51) to develop food production. A regional financing sys-tem of local development could support rural development and non-farm economies settled in rural Mediterranean areas.
In this context of openness and possible strengthening of thecooperation, the Union for the Mediterranean, currently paused, couldbe relaunched by placing food safety and the right to food among itspriorities at the risk of observing the strengthening of the role of othernon-European players who have seen the issue of an active partnershipwith the Mediterranean again becoming an important element in theglobal arena.
vi – foresight – agriculture
(51) Like the international institutions for managing resources in fossil watersin the Eastern Maghreb or in the Middle East.

ipemed ~the Mediterranean world Economic Foresight Institute
IPEMED is a non-profit organisation whose aim is to integratethe countries to the North and South of the Mediterranean viaeconomic means. IPEMED raises awareness of the common future andinterests of the Northern and Southern countries of theMediterranean. Financed through private funds, IPEMED adheresto the principles of political independence and North-South parityin its governance and operations. IPEMED accords priority tothe economy, favours an operational approach to projects, and worksto a long-term perspective. Radhi Meddeb is its president and Jean –Louis Guigou its Delegate general.
~Building the Mediterranean
Building the Mediterranean collection was launched by IPEMEDin 2009. In these publications, IPEMED experts from both sidesof the Mediterranean bring together their ideas, contributing tothe debate on major Mediterranean issues, fostering a new approachto North-South relations, and devising useful propositionsfor inhabitants of Mediterranean countries. The publications are available on the IPEMED website. ‹ www.ipemed.coop
existing titles
Région méditerranéenne et changement climatique, Stéphane Hallegatte, Samuel Somot and Hypahie Nassopoulos, 2009
Eau et assainissement des villes et pays riverains de la Méditerranée, under the direction of Claude Martinand, 2009
Méditerranée 2030. Panorama et enjeux géostratégiques,humains et économiques, Guillaume Alméras and Cécile Jolly, 2010
Convergence en Méditerranée. Les entreprises de la Méditerranée s’engagent dans un plus forttransfert de valeur ajoutée entre ses rives, vecteur capitalpour une intégration économique régionale,Maurizio Cascioli and Guillaume Mortelier, 2010
Méditerranée : passer des migrations aux mobilitésPierre Beckouche and Hervé Le Bras, 2011
Régulations régionales de la mondialisation.Quelles recommandations pour la Méditerranée ?Coordonated by Pierre Beckouche

Realisation coordinated by Macarena Nuñowith Patricia Jezequel
and Alain de Pommereau.Impression done in November 2011
by France Quercyon certified paper fsc.

The Mediterranean is facing great uncertainty regarding itsfuture. However, a rich web of economic, institutional and humanrelations is constantly being woven, inviting us to ask ourselvesquestions about its future. In front of obvious synergies and chal-lenges to which countries cannot respond individually, severalscenarios can be drawn up. This is exactly what the “Mediterra-nean 2030” consortium has done in this publication. The pros-pect of countries disparately slotting into the world economy, ora scenario made even darker by the 2008 financial crisis, leadingto bottom-up convergence and the marginalization of Mediterra-nean countries, are both plausible and unfavourable for regionalintegration. Yet another future is possible. Hinged on pro-activepolitical action shared by all countries, Mediterranean conver-gence can be envisaged, based on promoting complementarities,greater redistribution of wealth and stronger competitiveness ina regionally integrated system that benefits from the four free-doms implemented by the EU. To achieve this, nine recommen-dations for a Mediterranean “ecosystem” have been set out.
cécile jollyAnalyst, Centre d’analyse stratégique (cas)
frédéric blancDelegate general, Femise
philippe farguesDirector, Migration Policy Centre at the Robert Schuman Centre
for Advanced Studies, European University Institute
giambattista salinari Research assistant, Migration Policy Centre at the Robert Schuman Centre
for Advanced Studies, European University Institute
dr. houda ben jannet allalStrategy Director, Observatoire Méditerranéen de l’Energie (ome)
vincent dolléDirector of the Mediterranean Agronomic Institute of Montpellier/International
Centre for Advanced Mediterranean Agronomic Studies (ciheam/iamm)
Mediterranean 20302030“ ”foresight