Misc Publications MP-01...England is largely a result of a decrease in expenditures for capital...
30
Transcript of Misc Publications MP-01...England is largely a result of a decrease in expenditures for capital...

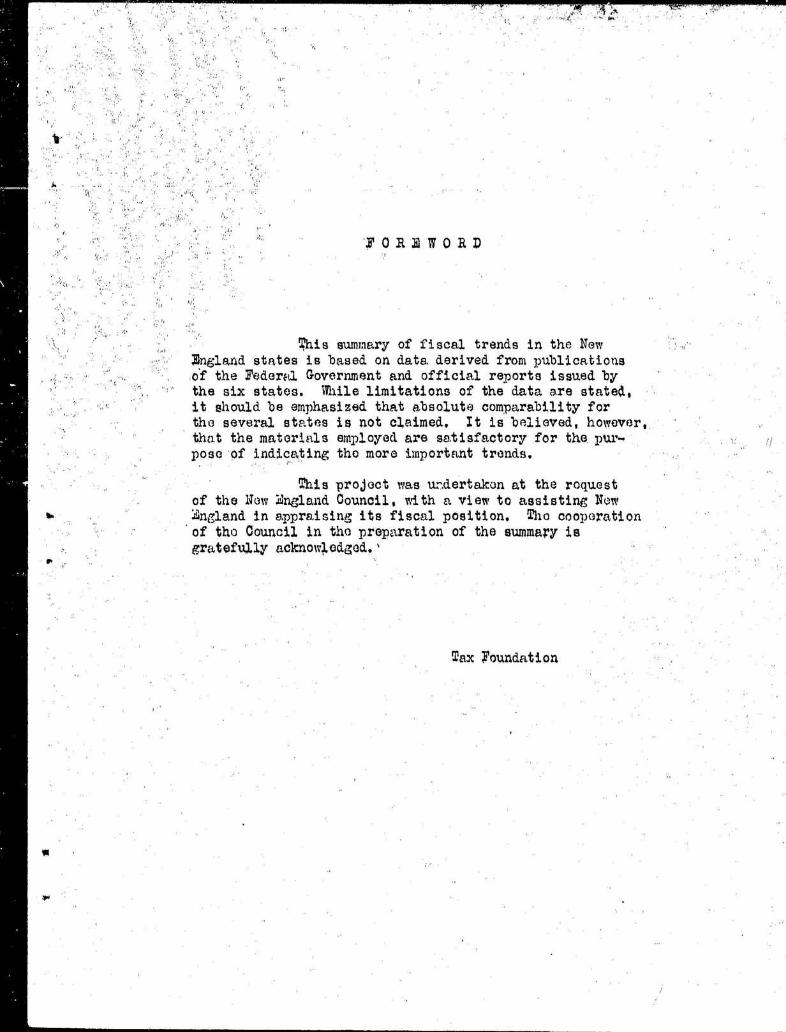
FOREWOR D
This summary of fiscal trends in the NewEngland states is bused on date. derived from publica.tioti sof the Federfa Government and official reports issued bythe six states . Mile limitations of the data are stated ,it should be emphasized that absolute comparability forthe several states is not claimed . It is believed, however ,that the materials employed are satisfactory for the, pur-poso'of indicetint; tho more important trends .
This project was undertaken at the roques tof the Now LIngland Council, vAth a view to assisting No n,4ngland in appraising its fiscal position . Tho cooperatio nof tho Council in the preparation of the summary i sgratefully acknowc edgad .
Tax Foundatio n
w
FISCAL SUlWRX MW ENGLAID SAT.10 AND LOCAL GOVM=NT S
j . EI pMITURl!IS OF THE . k'EI)MAL, STATE A= LOCAL GOMNiENT S
The expenditures of all units of government in the United States ex-
ceeded $18 billion in 1939, 1 Thiis ano-uit represented per capita expenditure s
of approximately $137.59, as compared with $95,54 in 1929 . The significanca o f
this increase is further suggested by a comparison of public expenditures wit hnational income . In recent years expenditures have equalled at least 26% of
the national income, nearly double the figure of a decade ago.
The major growth In public expenditures has been at the fedx al level .In 19,2 9 federal e.tpendituros were $24,33 per capita and represented only 25.5%of aggregate governmental expenditures, while 1' .1 1939 the Federal Governmentspent $65 per capita and approximately 47 .3% of the total, State and localgovernments combined expended ea estimated $72,55 per capita in 1939, as com-paed with $71 .21 in 1929. Together, these two levels of government spend on aper capita basis little more than a decade ago . YWhon they are conmidere dseparately . however, noticeable trends rtppoar . 'Expenditures at the state levelhave shown an upward trend increasing, from $16 per capita in 1929 to $22 in
1937, excluding expenditures covered from federal monies . State expenditure shave increased at approxima,tel !' the same rate as ageroga .te public e .-,q onditure sand for several years have represented about 17% of the total. On a basis tha t
excludes expenditures covered front grants-in-aid, local expenditures for recen tyears have been at a lower level than in the period 1927 to 1932. Local ex-penditures amounted to $55.42 per capita in 1929 and $46 in 1937. The proportionof total expenditures accounted for by local governments decreased from 57,9 %in'1929 to 35.2% in 1937 •
The pronounced increase in federal and state expenditures and th e
absence of a definite trend in local expenditures financod from local funds
are in part a reflection of the tendency toward centralization in the financingof the activities of government . tiethods of financing relief and other security
programs have contributed to this result . Another element is the spending
philosophy of the Federal Owernment, which has been reflected in increased
grants and subsidius to state and local governments . Mile expenditures for
national dofonse have boon a major budget item during the past decade, the
I t This estimate is exclusive of transfers by the Federal Government to theof il-,-age reserve account and the railroad retirement account and the expendt -tures by state and local governments for unemployment compensation . Grants-in-"ail are counted as an exixenditure of the first disbursing government .
.01"

U
YM
W
4-
"2* 4
relative importance of expenditures for this purpose declined. The growing im-,
port%ice of federal outlays for defense today, however, will have a significan t
influence not only on the aggreguto, but also on the relationship of expenditure
trends of the several levels of government in the years immediately ahead.
II• Sl'Al'+
I,OCAx,
"MIT= IN NEW ENG
State and local expenditures for 1937 exceeded those for 1932 in al l
New ngland states except Massachusetts, The percentage changes follow :
State
Percentage
Maine
4 . 6New Hampshire
12, 2Vermont
0 . 7Massachusetts
5.9a
Rhode Island
19 - 5Connecticut
2. 9
Aggregate state and local expenditures in the six New England states, however ,
decreased from $713 million in 1932 to an estimated $710 million in 1937 on abasis that excludes duplications resulting from state grants+,in-+ai .d, l Thi s
represented a decline of nearly one per cent, The indicated decline in Ne w
England is largely a result of a decrease in expenditures for capital outlay s
by Massachusetts cities and towns, State expenditures of $218 million for 1937
were 21 .9% above the 1932 level, while local expenditures of $492 million fo r
1937 were 7,9% below what they were in 1932 . State and local expenditures fo r
the United States as a whole increased 4,9% in this five,-year period, stat e
expenditures increasing 37 .1% and local oxpenditures declining 7,6%t
Combined state and local per capita expenditures of the New Englan d
states were $82,61 in 1937 or 3 .8% below the per capita figure for 1932 . 3'o r
the country as a whole there was an increase of 10% in per capita state andlocal expenditures from 1932 to 1937, The 1937 per capita was $72,61, .
The per capita figures for the six New England states rind the increase
.or decrease from 1932 to 1937 are shorn belort
Increase o rState
1 2
1937
Decreas e
Maine
$71 . 95
$71 . 98
$ 0,03New Hamp shire
74 .39
78-f-
8, 90
4.51'Vermont
61 .91
59,91
~ 2.00Massachusetts
95.01
86 .78
8 .23Rhode Island
75.00
89 .43
14,43Connecticut
8?,,28
800 65
1 .63
1 . Bee Table T.a. . bscrease,
-3-
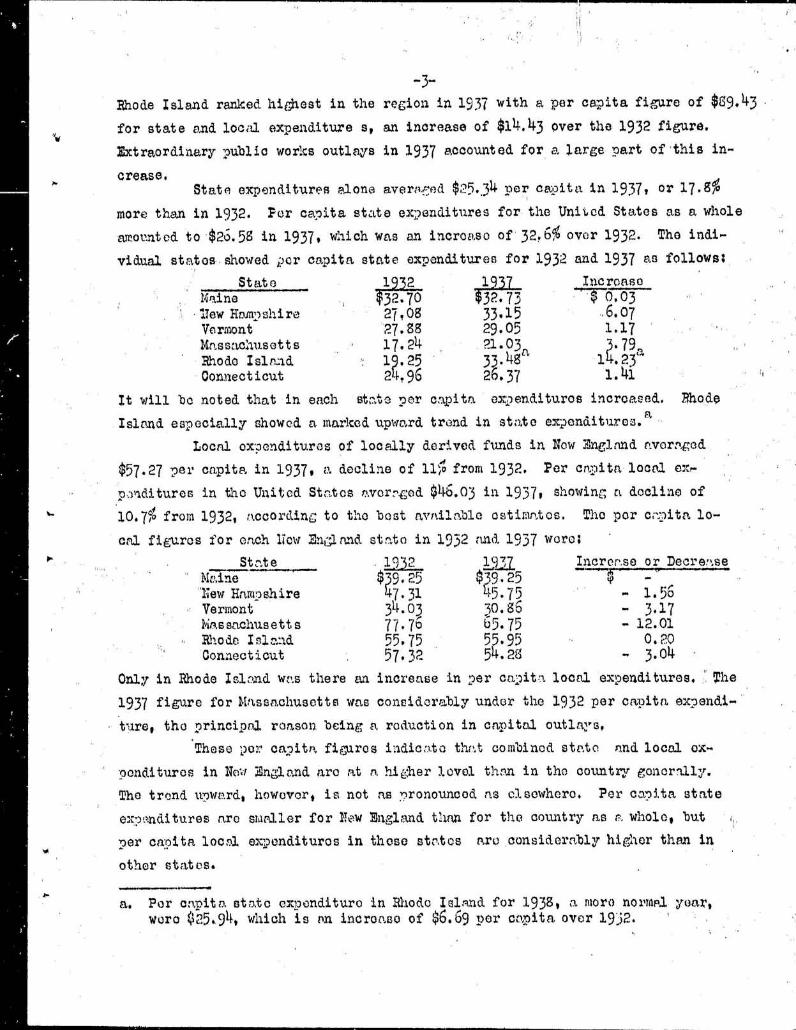
Rhode Island ranked highest in the region in 1937 with a, Per capita figure of $89.43
for state and locr.Ll exp enditure s, an increase of $14.43 over the 1932 figure .V
Extraordinary public works outlays in 1937 accounted for a large Part of this in -
crease .Sta.tn expenditures alone avers.-ved $25.34 per ca.0ita in 1937, or 1 7- 9%
more. than in 1932 . For capita state ex;?enditures for the Unii ed States as a, whole
arrottnted to $26.58 in 1937, which was an increase of 32, 690 over 193r . Tho indi-vidual stRtos showed ;?cr capita, state expenditures for 1932 and 1937 as follows ,
State
1932
1937
Incroas oma ne
$2 . 70
$3 P . 73
~ $ 0 .0 3'flew Hnmy) sh i re
27, 08
33 .15
6 .07Vormont
27.58
29 .05
1 .17Massaclusetts
17 .24
21 .03~t
3 .79.x,Rhode Island
1 ? .25
33 .48
1 .23Connecticut
2 .96
26.37
1 .41It will be noted that in each stato per capita expenditures increased . RhodeIsln.nd especially showed a marked upward trend in state expendituros . `''
Local ox;oendituros of locally derived funds in Now England nvort .re d
$57 .27 nor capita in 1937, a decline of 11% from 1932 . Per cripita local op :igditures in the United Stntes n.,vor^. :;od $46.03 in 1937, showing, n docline of
10 .7; from 1932, , %ccordinC; to the best avrtiilnele ostirintos . The per c y.Ata. lo-. .,t figures for each New EnE;land stn in 1932 glad. 1937 were ;
St^te
19 2
ly?
Increr.se or Decree-,seMaine
$~9 .25 "l~iew Hnmoshire
•1 .31
~~5 .75
w 1 .5+"Vermont
34.03
50 .56
- 3 .1 7Ea,ss,,chusett s
7 7 .76
b5 .75
- 12.01M ode Isla-id
55.75
55 .95
0 .20Connecticut
57 .32
54 .25
-- 3 .04
Only in Rhode Island w~ ,,s there an increase in per ca,)itn local expenditures . The
1937 figure for Massn.chusetts was convidor ably under the 1932 per capita exnendi-t;xre, the principal, ronsoa being; a, rod-action in capital outlays ,
Those por ca?itn, figuros iadico.to thr%t com'oinod state and local ox-
oonditures in No.'a 4nglnnd are at n. higher level than in the country eonorally.The trend u;?wnrd, howevor, is not no rronounced as elsewhere . Per cani.ta, stat eex-p :,nditures are snim.11er for r?ow 11nt,land than for the. country as -. whole, butp er capita local evDendituros in those str.tos n.ro considerably highor than inothor states .
a. Per onpito. sto.tc expenditure in Rhodo Icl gnd for 1938, ,a . moro normal year ,were $25 .94, which is nn incroaso of $6 .69 per ertpita over 19 :52 .

Local units accounted for the major part of the cost of government in
New England, State 'expenditures including grantsrin- *aid, however, have increased.
in relative importance in recent years . In 1932 local units accounted for 75%
L of combined state and local expenditures, while in 1937 these units represente d'69%of the aggregate, Local expenditures for the United States as a whole wer e
72% of aggregate state and local expenditures in 1932 and 63,4% in 1937, These
data indicate the relatively greater importance of local government in Ne w
England, as compared with other regions of the United States, There is reflecte d
in these states, however, the same tendency toward centralization in the financ-
ing of governmental activities that has been so apparent .in other states during
recent years .
A more timely and detailed analysis of governmental expenditures than
that offered by the 'Bureau of the Census is provided by the published report s
of state fiscal officers. The data presented in these state reports, however ,
are not usually directly comparable with those published by other states or by
,,the Bureau'of the Census . In studying these data it will be noted that i n
recent years a number of new exTenditture items are usually included . l
STATE EXPEI~AITU77E 5
The expenditures of the State of Maine, as reported by the State Derpartment of Finance, increased 55,9% from 1935 to 1938 t ` Total croonditures
amounted to $35 1,6 million for 1938, as compered with $22,8 million for 1935 •Highways, charities, unemployment compensation and development of resources ar e
mejor fun~otions accounting for increased expenditures in recent years . Since
1936 expenditures for general government have been at a considerably highe r
level because of the inclusion of the costs of operating the state liquor busi-
ness . For 1937 and 1938, this item constituted nearly four fifths of stateexpenditures classified as general government' This suggests that the costs o f
other general government activities are at about the same level, or at an eve n
lower figure than in 1935.
Expenditures of the State of New Hwnpshire remained at a fairly con,- ,
stant level from 1935 to 1939, according; to the reports of the State Comptrollo ;r.7
, .
The total of $19 .7 million for 1939, however, exceeded expenditures of $11, 9
million in, 1932 by a considerable margin, This large increase in•the early year s
1. For example, payments of unemployment compensation, state liquor gros sbueiness disbursements and the like ,
2. See Table 2 1,3, See Table 3 q

of the depression was attributable to nearly till functions of government, Ther e
was a marled increase in general govc rruaent expenditures in 1939, because of the
inclusion of public works outiayE i t Unemployment compensation pNrments include d
under protection to persons and property accounted for a mnJ or increase in that
function. Expenditures of the state,,controlled liquor business are entered i ngross amount as a miscelleneoze item ,
The State Treasurer in Vermont reported expenditures of $14 .9 million
for 1939 . 1 This total was approximately $1,5 million more than the comparable
amount for each of the years, 1930, 1935, and 1937, Expenditures in 1930, how -
ever, were unusually high because of floods, which required additional outlay s
on hidiways, Public welfare and unemployment compensation are chiefly responsi -
ble for the increase since 1930 1
State expenditures in I ,Iassachusetts amounted to $132 million for 1939 .,
including unemployment compensation payments of $25 million. This total was
] bpi greater than aggregate state e3penditures for 1930 , 2 The cost of practically
every major state function increased in this period ,
Expenditures of the State of Rhode Island were reported by the General ,
Treasurer as $24 million, including unemployment compensation payments of $6million, 3 This figure was 79.70 larger than that for 1931, Expenditures for
h
unemployment relief and unemployment compensation htLve been a significant factor
explaining the increase, Nearly every ria,jor function, however, showed an increas e
in recent years . Interest pvtvments on state debt required $1 of each $15 spent
in 1939, a considerably larger ratio than in any other New Englrwnd state ,
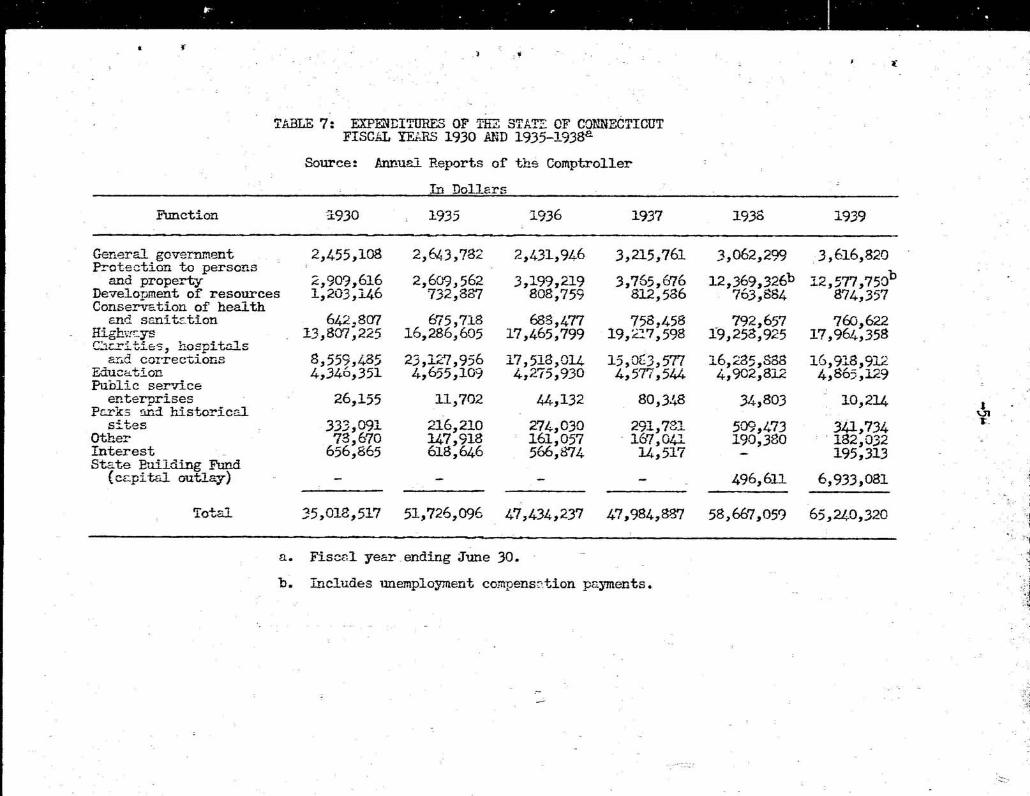
Expenditures of the Connecticut state government rose 960% .between
1930 and 1939, The major increase occurred in the early years of the depression ,
The State Comptroller reported expenditures as $65 million in 1939, 1 The larges t
increases were for protection to persons and property including unemploymen t
compensation payments t highways, charities, hospitals, and corrections and
state buildings,
LOCAL E~~~ITURE S
w The latest complete data on New England local ex~)enditures are those
compiled by the United States Bureau of the Census showing local expenditure s
t
1, See Table 4 ,2, See Table 5 .
t See Table 6 .+ Sec Table 7..
r

J
for 19'2,1 Several of the states in this region gather statistics on local ,
finance . These data together v+ith estimates for the other states comprise the
basks for the analysis in this section.
Expenditures of local governments in Naine are estimated at between
$33 million and $34 million for 1,937 exclusive of state aid, This amount rep -
resents an increase of nearly $2 million over expenditures for 1932, That loch)
expenditures in Wtine increased somewhat from 1932 to 1937 is indicated in a
survey of 46 typical Maine towns by the University of Maine, 2
Local governments in New lmpshire reported only a nominal increas e
during the past decade, local expenditures amounting ; to $23,5'killion in 1937 ,exclusive of state aid . The State Tax Commission reported a decrease in cit y
and. town expenditures from $14,2 million in 1930 to $13 .6 million in 1935 in-
cluding expenditures of state-aid monies .3 School expenditures, including those
from state aid, increased from $7 million in 1930 to $9 million in 1939, a riseof 13 .5%-~ New Hampshire couiaty eaq)enditures of $4,7 million in 1938 were
155 .4% larger than those for 1930 . 5 Expenditures covered from state.-aid monies ,
which were used largely for public welfare, were included in the total used incomputing this increase ,
h
Local expenditures in Vermont are estimated at slightly less than $12
million in 1937 on a ba,3i s that excludes state aid . This amount is somewhat
less than 1932 expenditures as reported by the United States Bureau of the Census .
Expenditures of all local units of government in Massachusetts wer e
reported at $394 million in 1937, not including expenditures of state-ad monies ,
Cities, towns and schools, which are responsible for approximately 95% of total ,
local expenditures, expended $314 million in 1930 and $309 million in 1937 in"
eluding e;cpeaditures of state aid . 6 County government is not an important uni t
of government in Massachusetts, expending $14 .4 million in 1939 including state
aid, 7
Rhode Island local expenditures were at approximately the same level
in 1937 as in 193a when $38 million were expended, excluding state aid,
1 . See Table 8.2, See Table 9.
See Table 10 .r, See Table 11 .
5 . See Table 12 t6, See Table 1
t
7, See Table 14t

-7--Local expenditures, including; all civil divisions, in Connecticu t
were estimated at $94 million in 1937, excluding expenditures of state aid.'v
Expenditures including state aid, for cities totaled $52 million in 1936 ascompared with $55 million in 1929. 1 The functions of highways, sanitation and
health, public buildings, and public service industries shoved substantial re-
ductions . Tox'm expenditures including schools increased from $26,6 million in
1928 to $33,3 million in 1936v a rise largely attributable to the increase d
burden of charities, 2 County expenditures increased from less than $2. 1
million in 1932 to $12,1 million in 1936.3 The increase was almost entirel y
the result of increased expenditures for highways . Other minorcivil divisions
expended $9 million in 1936,
Police and Fire Protection
Fire and police protection is a major function of local governmen t
and the resulting .costs to the citizens are significant . The combined exp endi—
. tures for fire protection of New England cities with a population over 50,00 0
were less in 1939 than in 1938 .4 The average per capita costs mere $4.87 in1938 and $4,72 in 1939, Data for earlier fears are not available . A per capita
analysis suggests that costs tend to"increase as the size of tho city increases.
The character and quality of the service provided, however, largely account for
this tendency. The per capita cost of fire protection is substantially highe r
in Nevi England cities thanin the United States as a whole where the average, ,
per capita expenditure in cities over 100,000 population was $3,91 in 1939 .Policy expenditures of larger Now England cities also declined i n
1939 as compared with 1939. Per capita police costs averaged $5,28 in 1938and $5.16 in 1939, 5 As in the case of fire protection, per capita costs ten d
to increase with the si ge of the city, Also police costs of cities in Ne w
England appear substantially higher than those for the country as a whole on a
per, capita basis .
III, RLASOM FOR INGREASE IN STATE E)'ENDITURES IN IOW ENGLAIM
The major functions of state government responsible for the increas e
of 21 .9% in expenditures from 1932 to 1937 mere ; (1) charities, hospital s
F
1, Soo Table 15 ,2 . See Table 16 .3 . See Table 17 ,
Soo Table 18 ,5. See Table l9.

and corrections, which accounted for state expenditures of $29 .2 million i n
1932 and $76 million in 1937 ; and (2) high-., ays, which increased from $17 . 7million in 1932 to $43 .6 million in 1937. 1 The costs of state general govern-
ment activities increased 21 .2% in the same period, a rather sharp rise which ,
r
however, follows closely the trend in other states .
Probably no function has groiwi more in fiscal importance since 1930than public welfarn, In the years 1933-1939 . $1,415 million of federal, state
and local funds were used for welfare activities in New England . 2 Of the
amount spent in these states for various security programs in this period, 63 .6;:,
was provided by the Federal Government, This proportion is smaller than t1 w
comparable .eigure of 70.9% for the United States as a who, .e .
Although expenditures for highways have been leveling off in recen t
years, they rank next to education and welfare as an item of state and loca l
expenditure . Dew England spent $54 million in 1939 for state administered
roads, a smaller total than the expenditures for this function in 1936 and
1937 . 3 Over one half of these expenditures were for capital outlays, a propor-
tion slightly less than that fo• ; the United States as a iholo .
The increase in stata and local expenditures for education in Ne w
England from $69 million in 1920 to $125 million in 1936 suggests a marked up-
ward trend in educational cost st4 It should be noted, however, that both current
expenditures and costs per pupil for this function declined during the 1930 1 s ,Increasing enrollment was a major factor accounting for the growth in tota l
'expenditures in the period studied. Although expenditures increased 90,9,Ebetween 1920 and 1936, the annual cost per pupil increased only 36.9%. The
annual per pupil cost of $92,75 for all New England states in 1936 - although
substantially less than the cost in New York and New Jersey, which spent $134 .13and $109.33 per pupil, respectively, r was well above the average of $74 .30 for
the United States as a whole, Vermont was tine only state in this group tha t
shooed a decline in annual per pupil costs in 1936 as compared with 1920, Al l
states, havever, were spending less pe .~ pupil in 1936 than in 1930 ,A substantial part of state expenditures took the form of grants-in -
aid to local units, Approximately 26,7% of state expenditures in New England in
1937 were represented by grants to local•,tanits for the functions of education ,
highways, development of resources, health and sanitation and charities . The
average for the 49 states was 31 .3%, In 1932 state grants in New England were
only 90% of state expenditures ,
1, See Table 20 ,2 . See Table 21 ,
.
See Table 22 ,See Table 231

IV. SCnCES OF +ST:iT,y AIM LOCAL RB TL:U1 IN NEW ENGWID
Increased demands for services together with the condition brough t
about by the dep reciated values of real estate have resulted in some pressur e
for broadening the tax base, Rates for old taxes have been increased in ord l
to meet the added costs of state government . Decreases in gasoline taxes a .nc
the addition of tobacco excise taxes have been among the recent changes in t l
revenue systems of these states . 1 In Rhode Island a tax on horsy: racing an d
in Connecticut a poll tax have increased the revenues of the respective stat e
Since 1937 unemployment taxis have become significant, as a source of special
marked funds ,
The New England states have shown remarkable ability to resist the
trend toward rls.,jor additions to the tax base, It is true that some'ne!r taxe s
have been added and to that extent the trend is similar to that of other aret
For the most part, however, th f, basic features of the several r ;Nvenue system f
have; not been materially changed , 2 The political limitations on the continue
use or more intensive use of traditional taxes have not been felt in New Fingl
to the extent they have in other parts of the country, 3
1. Gasoline tuxes ivere originally onF .etod by five of the Now 2r-g1rnd st :'tosin the early 1920 r s . In Unssachusotts this form of taxfitior .wa.s no tadopted until 1929 . With tho repeal of the 3ighteenth Amondmont to th eFederal Constitution thy, linuor business became a . major source; of revenue811 of thy. New :'+ngland stn.tas derive rovenue from this source either i nthe form of excise and licens , trLxos or through state control and . sale .The most recant additions are the tobacco taxes which aro imposed by al lthe states except Maine ,
2. Table 24 shows the dates of adoption of the major tnxos other than th eproperty tax. Tho neencios administering important state; t,-aces am show nin Table 25, The number of principal n .goncies vp,ry from on,:, in RhodeIslp.nd to four in 'lain, and Now Hampshire ,
3- For examplo, constitutional and statutory limitations on the use of th eproperty trtx, the chief sourco of combined state and local revenues, n .refound in only one Now England state, Connecticut limits th- : amount thatmay bo levied for ecrtain functions, such as city libra,rios, 1,5 mills ;town libr,-rics, ; 3 mills ; and tho lik(.,
Borrowed funds have not bairn used to any groat extent for curren t
expenditures by New .Znglsnd communities . Increased welf:Ire costs and increase d
costs of old age pensions hove been met for the most part from current taxes ,
rais is especially creditable sine: two major catastrophes occurod during th e
period covered by this survey. Both tho hurricrne and the flood required huge
outlays for rehr%.bilitr.tion and reconstruction, ?ands more borrowed to meri t
these emergencies, but thore wis only 'n, nomim; incresse of the total indebted
ness over that for 1932,
The property tsx in New 3nglaad constitutes the mF,Jor source of stat e
and local revenue . This tax is administered by the citios and towns . Although
property valuations declined 12 .5% in those states botTo-en 19152 and 1937, the
decline rvs not va masked as in many other areas and in the United State s
generally . which shored decline of 14,5% in the same period, 1 The property
tax has declined in rolPtivo importa .ncr; r,.s a sourco of sts^to revenuo in thekw k;nf*,l,Pnd states . The same trend has been in evidence in the United State s
as a whole .
In recent years the New :-ngland states have t ;ndod to enrrvr,rk P. 1arger
portion of state revenues for certrLin sp :cified purposes, For oxrnmple, severn.l
of the states in this region have li,mitod, father b ,r constitutional provision
or by statute, the use of gasoline tFx and motor vehicle liconso tvx receipt s
to highway purposes . ether functions for rYhieh revenues arcs e ,,.rma.rkod includedebt service, old+•a.ge nssist,~nee Pnd public schools . State and federrl grants –
In,-aid, of course, axe allocated for' specific purposes,
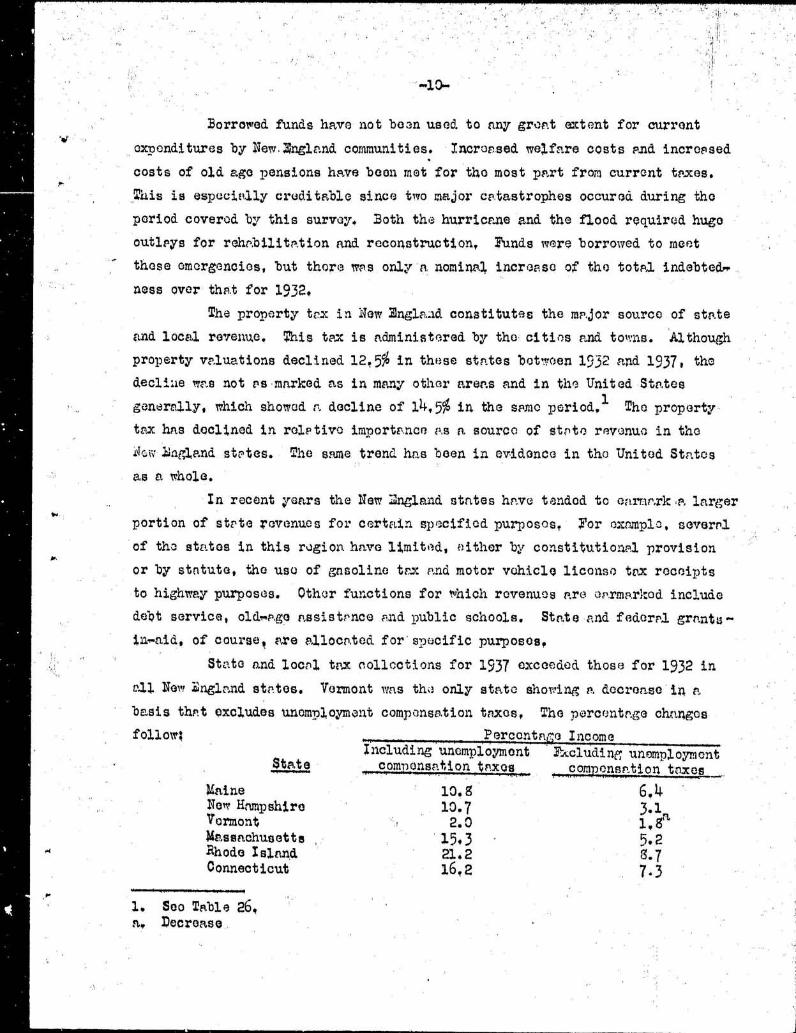
State and local tax nollcetions for 1537 exceeded those for 1932 in
vZl New Bagland states. Vermont r," tho only state shoving a . decrease in a
basis thrt excludes unomnl,oymont compensation taxes, The percr.,ntv.ge ch.,tnges
follor4
POreentnco Incom eIncluding unemployment IAcluding unemploymen t
state
com ensat,ion
nxos
com ensFtion taxes
Maine
10.9
6 . 4Now Hampshire
10 .7
3. lVormont
2.0
1, gnUa.ssa.chus et t a
15.3
5. 2Rhode Island
2142
9. 7Connecticut
16,2
7, 3
r
1. Soo Table 26 ,a,. Decrease .
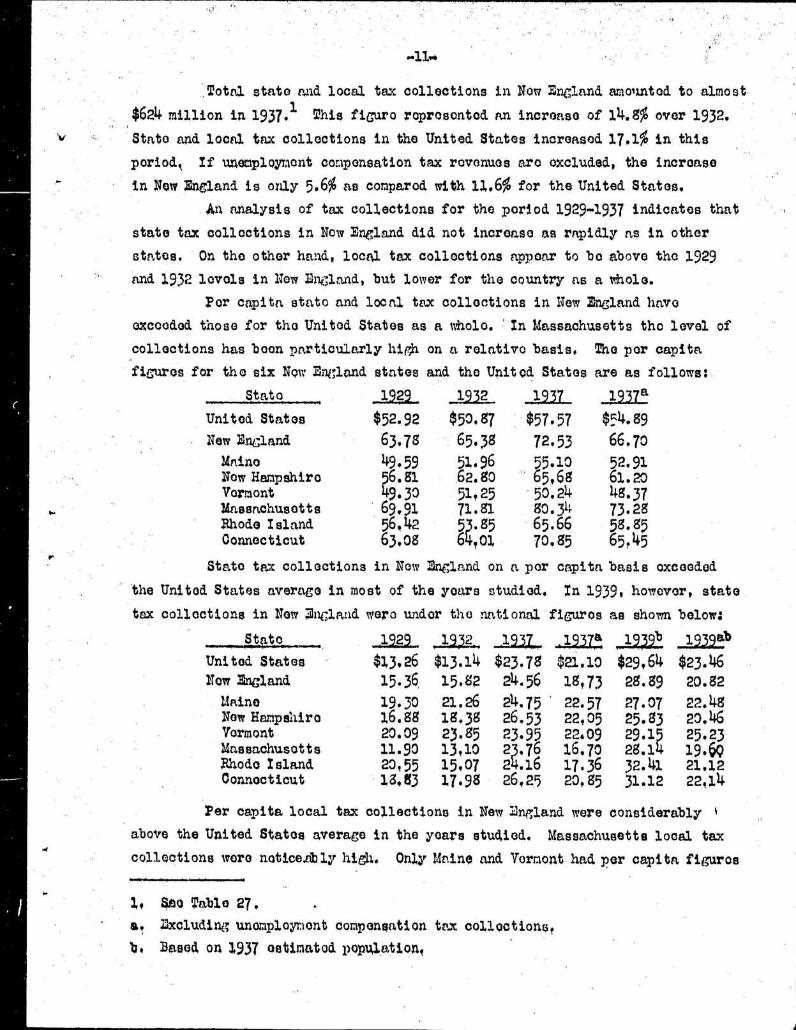
Total state and local tax collections in Now England amolmtod to almost
$624 million in 1937. 1 This figuro roprosonted an increase of 14 .9% over 1932.
State and local tax collections in the United States increased 17 .1% in thi speriod, If unemploymont compensation tax roveanues arc excluded, the increas e
in Now England is only 5.6% as conparod with 11.6% for the United States .
An analysis of tax collections for the period 19291937 indicates thatstate tax collections in Now England did not increase as rapidly as in othe r
states . On the other hand, local tax collections appear to be above the 1929and 1932 levels in New Dnelaad, but lower for the country as a whole .
Per capita stato and local tax collections in New bland haveexcoodod those for the United States as a wholo . ''In Massachusetts tho level o f
collections has boon particularly high on a relativo basis . The per capitafigures for the six Nor., IS,-q;land states and the United States are as follows :
Stato
1929
1932
1937
1937aUnited States
$52 .92
$50 .87
$57 .57
$54.99New Brugland
63 .78
65 .38
72 .53
66 .70Maine
49 .59
51 .96
5 .10
52 .91Now Hampshire
6 .91
62.80
5,68
61 .20Vermont
9 .30
51,25
50 .24
4g ,37Massachusetts
69,91
71 .81
80 .31-
73 .28Rhode Island
56,42
0-95
65 .66
58 .85Connecticut
63,08
64,01
70 .95
65 .45r
State tax collections in Now England on a per capita basis oxeooded
'the United States average in most of the years studied . In 1939, horovor, stat etax collections in New 3iiCland were under the national figures as shorn below ;
Stato
1 2
1 2 19U - • 1-123Z&
193gab
United States
$13,26 $13 .14 $23 .78 $21 .10 $29,64 $23.46Now England
15 .36, 15 .82 24 .56 1843 28.89 20.92Maine
19 .30
21 .26
24.75 ' 22.57
27 .07
22.48Now Htarapshiro
16 .98 19 .39
26.53
22.05
25.93
20, 1 16Vermont
20.09
23 .95
23.95
22.09
29 .15
25.23Massachusetts
11 .90 13,10 23.76 16 .70 29 .14 19 .69Rhode Island
20 155 15, 07 2 1 .16 17 .36 32 .41
21 .1 2Connecticut
13,93 17 .98 26, 2,5 20,95 31 .12 22,14
Per capita local tax collections in New ngland were considerably kabove the United States average in the years studied. Massachusetts local taxcollections were netice.ab ly high. Only Maine and Vornont had per capita figures
rIt 40n fable 27 .a, Excluding; unonployriont compenoation trot collections ,b . Based on 1937 estimated popi4ation,
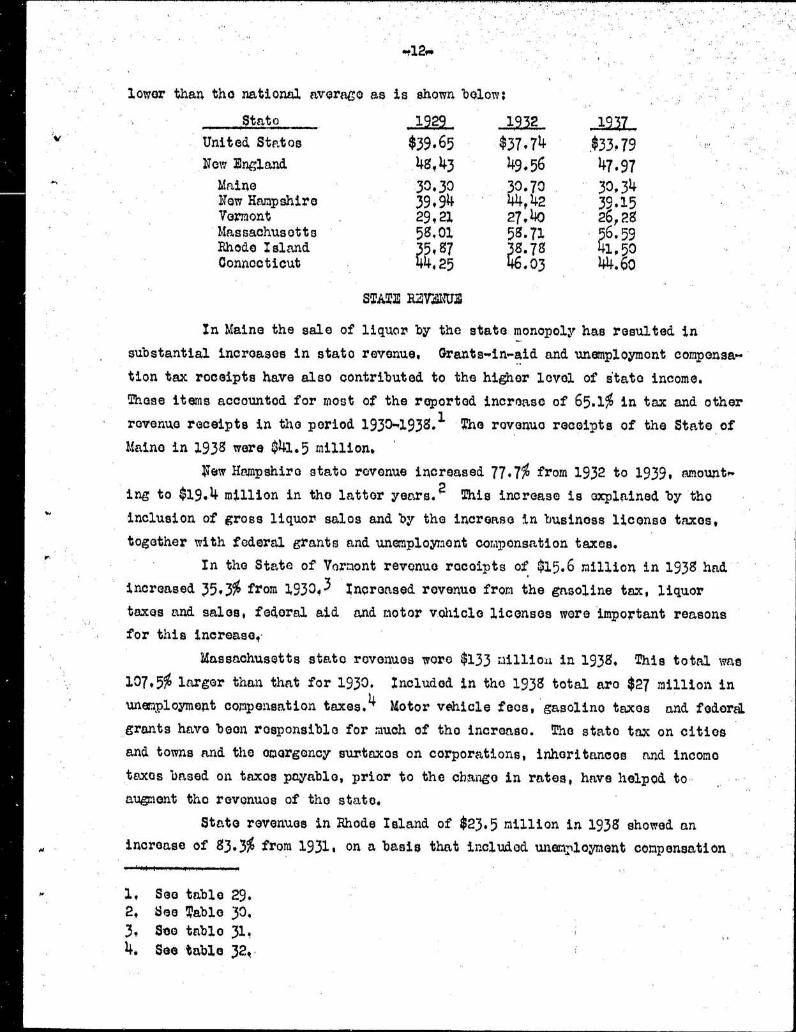
loner than the national averago as is shown below :
Stato
1929
232
1937 ,
United Statos
$39.65
$37 .7+
$33 .79Now England
4s,43
49-56
47 .97Maine
30,30
30 .70
30,3 +New Hampshire
39,94
1+~+, 42
39 . 1 5Vermont
29,21
27,40
26 29Massachusetts
59. 01
59 .71
6.59Rhode Island
~5, 97
5.791, 50Connecticut
4, 4,25
46 .03
44.60
STATZ RZ;T4NTz
In Maine the sale of liquor by the state monopoly has resulted in
substantial increases in state revenue . Grants-.in-aid and unemployment eomponsa--
tion tax receipts have also contributed to the higher level of state income .
These items accounted for most of the reported incraasee of 65 .1% in tax and other
revenue receipts in the period 1930-1939 . 1 The revenue receipts of the State of
Ifaine in 1939 were $41 .5 million.Now Hampshire state revenue increased 77 .7% from 1932 to 1939, Amount-
ing to $19 .4 million in the latter years . 2 This increase is explained by th e
inclusion of gross liquor sales and by the increase in business license tacos ,
together with federal grants and unemployment compensation taxes .
In the State of Vermont revenue receipts of $15.6 million in 1939 had
increased 35,3% from 1 030 4 3 Increased revenue from the gasoline tax, liquor
taxes and sales, federal aid and motor vohiclo licenses were 'important reason s
for this increase, .
Massachusetts state revenues were $133 nilliol, in 1939, This total was
107,5% larger than that for 1930, Included in the 1939 total are $27 million in
unemployment compensation taxes . 4 Motor vehicle fees, gasoline taxes and federal
grants have boon responsible for much of the increase . The stato tax on citie s
and towns and the omargency surtaxes on corporations, inheritances and incom e
texas based on taxes payable, prior to the cbai-ge in rates, have helped to
augment the revonuos of the state ,
State revenues in Rhode Island of $23.5 million in 1939 showed an
increase of 93 .3% from 1931„ on a basis that included unemployment compensatio n
1, See table 29 .2, See Fable 30 ,
3, See table 31 ,
4. See table 32, ,

N
P
-13-
tax rovonues . l The gasoline trot, liquor fees and taxes, federal grants an d
inheritance taxes were largoly responsible for this increase . Horse racing taxes
rind fees have produced substantial revenue in Rhode Island in recant years ,
amounting to over $1 .2 million in 1936 and 1937, Revenues from this source wer e
grentl,y curtailed in 1939 because of temporary administrative difficulties o
Connecticut t s state revenues of $70 million in 10,39 represented an
increase of 99% over the 1930 total? Business and gasoline tax revenuos double d
in the period 1930-1939 . The poll, tax has been a significant source of stat e
revenue since: 1936, Grants and donations also have become increasingly Important ,
as. have unemployment conpensation taxes .
LQOAL nV41M$
While local, tax collections declined 7 .4% in the country as a whol e
from 1932 to 1937, in Now England local tax collections increased 0 .,J~ in thi s
period. 3 The 1937 local tax collections in Now Brigland amounted to 93 .9% of loca
expenditures, excluding expenditures of statoraid monies . As local government s
derive substantial revenues from non-tax sources, it should not be assumed tha t
expenditures in excess of trot collections wero covered by borrowing .
State grants-in-aid have become a more important source of local
revenue, Local, government in New lwnglaad recoivod $59 million in grants in 1937 ,
as compared with $16 .6 million for 1932.' New England local governmonts receive d
one dollar in grants for every seven dollars in taxes . All local governments i n
the United States received a relatively larger mount from this sourc e i the ratio
being one dollar in grants to four dollars in taxes .
Three of the six New Er, land otates - Now Hampshiro, Massachusetts and
Connecticut -'compile data for local governments which are published by stat e
agencies,
County revenue receipts in Now Hmpshire of $4.4 million in 1939 wer e172.7% (treater than in 1930 .5 Tax collections more than doubled in this period
and grants-in-aid beeeie increasingly significant . Now Empshiro city and town
revenues increased from $23 .5 million in 1930 to $24,9 million in 1939 . 6 Prop-arty tax collections accounted for most of the increase. School distric t
1. See Table 33 -2. Soo Table 34-P3. See Table 35 .4. Soo Table 36,
5. Sae Table 37 .6. See Table 39 t

combined revenue in New Hampshiro, amounting to $8.2 million in 1939, was nearly
$1 zillion larger th= in 1930 . 1 Property taxes and state aid were tho major
sources of income,
County governments in Massachusetts receive revanu© from a variety o f
fees, charges and taxes . The property tax, however, is the chief source o f
income. Revenue receipts have boon increasing; during; the last several yorzrs ,amounting to $1,7 million in 1938, 2 ',Rovenues of Massachusetts cities and tocros }including schools, amounted to $311 million in 1937 and were 5 .5% groator than
in 1930,3 Tax collections decreased during this period, but grants»in"aid ,
licenses and permits and departmental earnings increased considerably .
Ae,,groga.to local revenues in Connecticut exceeded $101 million in 1936 ,after increasing by $10 million from 1928 to 1932 and by a like amount from
1932 to 1936 4 Wax collections have increased substantially, as have revenue s
classified as charities which; include certain grants-in*,aid .
M1
1 . Sec Table 39.2. Soo Table 40 ,
3• Soo Table 41 .
41 Soo Table 42 .
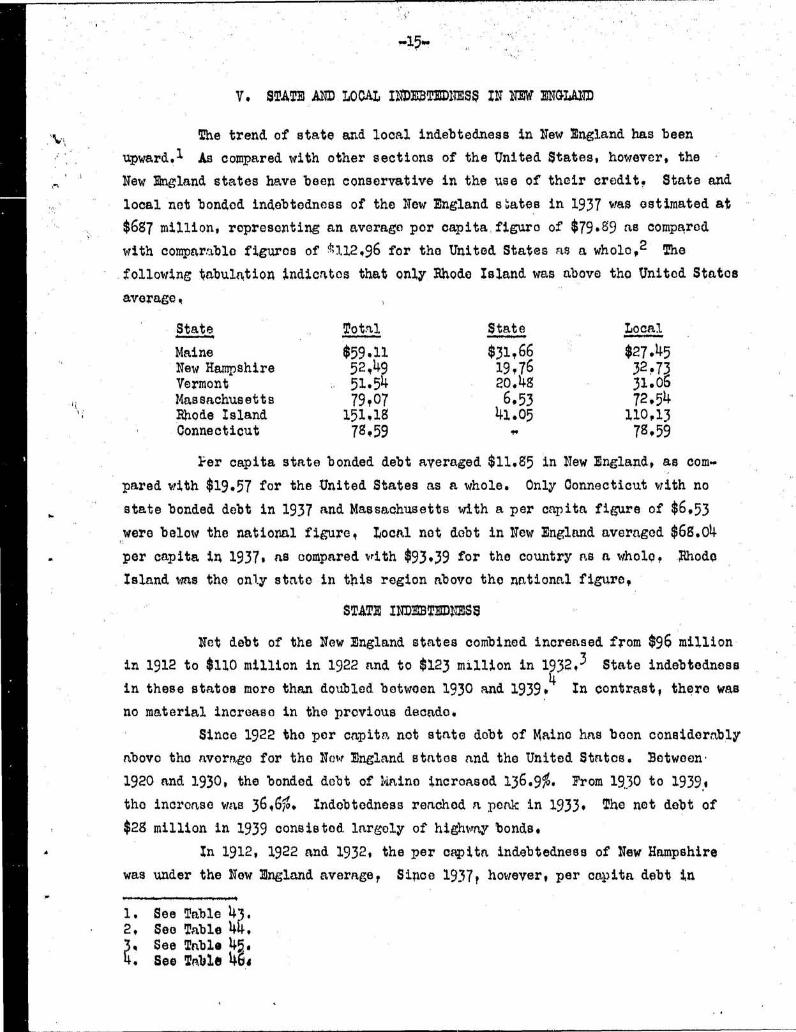
The trend of state and local indebtedness in New England has been
upward . l As compared with other sections of the United States, however, th e
New England states have been conservative in the use of their credit . State and
local net bonded indebtedness of the New England sates in 1937 was estimated a t
$687 million, representing an average per capita,figuro of $79 .99 as compt~rod
with comparable figures of 1112 .96 for the United States as a wholo, 2 The
.following tabulation indicztos that only Rhode Island was above tho United State s
average,
State Total State Local
Maine $59 .11 $31,66 $27 .45New Hampshire 5 2 ,49 19,76 32 .73Vermont 51.54 20 .48 31006Massachusetts 79x 07 6 .53 72 .54Rhode Island 151 .18 41 .05 110,13Connecticut 78,59 +78 .59
1;er capita state bonded debt averaged $11 .95 in New England, as com-
pared with $19 .57 for the United States as a whole . Only Connecticut with n o
state bonded debt in 1937 and Massachusetts with a per capita figure of $6,53
were below the national figure, Local not debt in New England averaged $69 .04
Per capita in 1937, as compared with $93 .39 for the country as a whole ? Rhoda
Island was the only state in this region above the national figure ,
STATE INDEBTEDNESS
Net debt of the New England states combined increased from $96 millio n
in 1912 to $110 million in 1922 and to $123 million in 1932, 3 State indebtednes s
in these states more than doubled between 1930 and 1939,4 In contrast, there was
no material increase in the provious decado .
Since 1922 the per capita net state dobt of Maine has boon considerably
nbovo the average for the New England states and the United States . Between ,
1920 and 1930, the bonded debt of Maine tncroa,sod 136 .9°. From 19,30 to 1939 1
the increase was 36,6%. Indebtedness reached a peak in 1933• The not debt o f
$28 million in 1939 consisted largely of highway bonds ,
In 1912, 1922 and 1932, the per capita indebtedness of New Hampshir e
was under the Now England average ? Since 1937? however, per capita debt in
M
1 . See Table 43 .2, See Table 44 .3. See Table 4 .4. Seo Tabs 4

New Hampshire has been above the Now England and United Statos average s ! In
1939, the state not indebtea4oss amountod to nearly $12 mi~lton, an increas e
of 242.7% since 1930.
The per capita net state indebtedness of Vermont was under $6 in 1922 .
BY 1932 the figure had reached $26.51, greatly exceeding the New England and .the
United States averages . In 1937 Vermont l e per capita bonded debt wa,s~calculate d
to be slightly above the average for the United Statos . The net ;debt of Vermont
incrpped 541,9% in 1930 as compared with 1820 . Fo17.owing 1930 there was a
slight increase until a peak of $9,8 million was reached in 1934, Since that
time there has been a decrease . The not debt amounting to $6,5 million in 1939
was largely attributable to reconstruction activities resulting from floo d
damage.
Massachusetts is the only state in Now Nri;land that had a larger ne t
debt in 1920 than in 1939 . Following 1920 the not debt of $35 million was re-
duced rapidly and by 1930 had decreased to $9 .8 million . Since 1930 the not -
debt increased 219 .70, amounting in 1939 to ovor $31 million . Of this total ,
one half was issued to 'repair hurricane and flood damages . The per capita bonde d
debt of $6,53 in 1937 was considerably under the Now England worago ,
One of the chief' characteristics of the debt picture in I4trusa.chusetts
is that the contingent debt has exceeded X50 million since 1920 totaling $63million in 1939 . This contingent debt, however, hRs no important bearing on th e
indebtedness of the state, since funds to service the outstandin; bonds are
collected from the cities and towns which comprise the metropolitan district . lIn 1512, 1922 and 1932 the per capita net debt of Rhode Island was
above the United States average . Net bonded debt in 1937 amounted to $41,05per capita, or more than double the United States evera,ger State net indebtedness
increased steadily from $9 .2 million in 1920 to $27 .6 million in x.939, Bonds
have been issued for a wide variety of purposes ,
Connecticut has been more conservative in resorting to the use of stat e
credit than any of the New England states, In 1922 the per capita not debt wa s
$4,24, BY 1932 this figure had decreased to $0 .07. From 1932 through 1937the only outstanding indebtodness consisted of temporary loans . These amounte d
to $4,5 million in 1937* 4 issue of $25 million of ;funding and building loans
was floatod in 1939 ,
1 . . The contingent debt was tneurrod for the benefit of 43 cities and towns inthe vicinity of and including Boston for the construction of wa,tor, poworagoand parr systems ns well as other tmprovamonts,

1.
. .17„
LOCAL INDEBTEDNESS
The net debt of local governments in Nov England amounted to $709
million in 1932, as compared with $440 million in 1922 and $295 million is 1912 . 1
The per capita debt of New England local governments exceeded that of the Unite d
Status in 1912. During the past 25 years, hotover, local governments in No n
England have been much more conservative in resortiik; to credit than have local
governments in the United States as a whole, The par capita not debt of th e
local governments of tho United States in 1922 was $71 .26, as compared with
$57 .92 for New England . The relative position of Nuw England was even mor e
favorable in 1932 when the per capita local dobt wa :, $95.96, or considerably
less than the average of $122 .10 for the United States . It appears from th e
available statistics that 1ocaa indebtedness has remained at approximately the
scone level in New Bngland since 1932 . Of the six Now England states, Maine ,
.Now Hampshire and Vermont have boon moro conservative in borrowing th,= th e
other three states . These states have maintained a per capita debt which is wel l
under the flow England avora€;e .
The amount of indebtedness of local governments in Maine at the end of
the fiscal year 1939-39 was reported by the Mai.no Dopartmant of Audit to b e
$23,2 million for the cities and towns and $2,3 million for the counties .
TI:e local net debt in New Hampshire has changed very little since 1930,
It anountod to $17 .5 million at the end of the fiscal year 1939-39 ., k - Th e
indobtedness of cities and towns and school districts has decreased slightly
while the debt of the counties has increased.
The local governments of Vermont in common with those of Maine and New
Hampshire have a, relatively low net debt, Estimated local bonded debt in Vermon t
for 1937 was $11,9 million . Y t appears probable that the not dobt has remaine d
approximately the sar.io since 1932. At that time, the per capita debt of $49 .99
was considerably under the Now England average .
The net general debt of Massachusetts municipalities decreased $1 5
million between 1930 and 1939, amounting to $202 million in the latter year, 3
The enterprise debt of $92 million in 1939 increased approXinntely $6,7 millionduring the 19301s . The funded debt of Massachusetts counties was 3 .1 million at
the beginning of 193, Counties had are additional contingent debt of$~ .4 million,
1 . See Table 47 ,
2 . See Table 49,
3 . see Table 49,

,i -18M
IiTho not debt of local units in Rhodo Island anounted to $94 million i n
1932, as compared with AO million in 1922 and $26 million in 1912, The not
local debt increased 134,4% between 1922 and 1932, 'While the per capita locrtl
debtrm,s only slightly above the New bland average in 1912 and 1922, it showed
P. marked increaco from 1922 to 1932 whon it reached W4.40, an amount well abov e
the Now England and United States averages, Net local bonded dobt was estimate d
at 0110 .13 por capita for 1937 . According to a report issuod by the Providenc e
Governmontal Research Bureau, the not debt of cities and towns in Rhode Islan d
totaled 094 million in 1 939-39 •ConnocV,cut has maintained a per capita local govornmont debt which ,
oxcopt for Rhode Island, has boon well above the othor New .P+ngla .nd states . The
per capita figure for 1932 eras $98 .52 and in 1937 the bonded debt was estimated
at $78 .59 per oapita. The not debt of all local, units in 1936 amounted t o
$163,3 nil.1A04, The comparable figuro for 1932 vras ;152 million and for 1928 ,
$125 million .
New England has established an onvitiblo position in the matter of
municipal debt defaults, Xn 1938, 1939 and 1940, Maine was the only Now Nngla,nd
state that had. defaults. There were 3,922 municipal defaults in the United State s
in the years prior to 1938, 1 Only oiCht states had no defaults and, of these, '
five wore in Now England, Maino had one dofault . Later data published in 1938and. 1939 showed that Maine had throe defaults in each of these years while the
other five Now England states continued their previous oxcollont record ,
ORZ)IT OF NZ' ENGLAITD GOVM,~ ABINTS
Now England state and local bonds have boon issued at lower rates o f
intorost than the securities of state and local governrionts in the United State s
generally, In 1939 the average rate of interest payable on now issues in Now
En t ,land was 2 .120, its compared with 2, 814% for tho country " a wholo. 2 Insofar
as interest rates refloat debt paying ability, it appears that the Now 3r1rland
states maintain a rola.tivoly high credit position . The lnrgo nizber of cities
of substantial size in Now England which borrow in nnounts large enough t o
justify offerings in the central securities markets and tho proximity of this
area to these markets are other important factors accounting; for the relatively '
low coupon rates on the issues of Now England state and local, govornment ,
1. Thotunnel Year Dook, 1938 1 1939 and 1940, 4a of February 1, 1940 .2. $oo Table 50 1

V
-19"
V1 . THE ABILITY of NN IRMA= TO SUPPORT STATZ AND LOCAL G0 VNRrn= T
The ability of the people of a stato or community to spend an increasing
proportion of their income collectively through government should be continuously
ov.aluatod. As an aid in evaluating the tax load in rolation to truca'olo ennacity ,
compra,risoas of tv;tcs paid and realized 1 ,worne taro widely used . In 1922 and in
',' .the yoars 1929-1935 per capita income in New Ea.-land wp,s substantirilly higher
th.-.i in the rest of the country,
This suggests relatively greater tmcpzvyin g
ability. There are difforences, however, in per capita income ronlized by the
six New England states . Mainc, Now Heinpshire and Vermont were eonsistentl,= lowe r
then the other Now Riel rind s tn .t o s . 2The ratio of sto.te a-,-.d loc-1 t .,=es to ro plized income for the New
E:1gla.nd states is slirhtly higher t1vui that for all states combined . The ratio s
for a number of yc:a,rS follow1 3
P a r
C
o a.i tState 1u
1,
-
l
l
o 19 ,7United States s .1
11 .4
ll .o
10.1 10 .7 10, 2
Now Englruld 0 .2
11-7
11 .2
10,7 11,4 10 . 5
Mai 110 a .4
12,4
11 .
10 .9 11 .5 11 . 0Now Hampshire
~9 .6
11 .5
12.
12.0 14 .0 13 . 1Vermont 8 .5
13,0
12.0
11x3 11,7 11 . 3Massachusetts 8 .6
12.5
12,0
11 .0 12 .4 11 . 3Rhode Island 7,3
10,4
9 .S
9,0 919 9 . 9Connecticut M
10,0
9,5
9,0 9,2 9 . 5
The rolative trucpnying ability of the Now England stntos combined, a scomputed by v, riouc individuals ; is fury f.a,vorablc.'
While Maine, How Hampshire
and Vermont are about average as compared with other states . Massachusetts ,
Rhode `;lsland and Connecticut rank high in ability to pony ,
For many years st pto and local governments in New England have supported
a high level of public services, The cost of government is high, especially at
the local levol .
The burden of supporting government incroAsod npnroeIably wit h
'the doclinin- incomes in the 19301s, but with few exceptions the state rind local.
governments in these states succeeded in avortin;
defaults . In general, publi c
finance in Now 4ng1nnd is on a reasonably sound bnsis .
1. Soo Table 51 .2. Soo Table 52 .'i . United States 4: Ruronu of the Consus, ostirnates bar the Xi p,tional Industrial
Conference Board ,raid computations by Tax Foundction .
4 . Soo Table 53 -n, Excluding unemploymmit coraponontion taxes ,


TABLE 1 : STATE AND LOCAL MWEIMITURES IN NEW MGL=lw
FISCAL YEARS 1932-1937
Source ; Vntted States Bureau of the Census and Estimates by the Tax Foundation .
United States 9,944,028 2,505,935 6 , 43 9 , 193 9,385,790 3, 435,790 5,950 , 000New England 713,491 179 ,747 534 ,744 710,220 217,957 492,363Maine 58,929 26,795 32,143 61,617 22,017 33,600New Hampshire 35,956 13,054 22,802 40,2111 16,909 23,332Vermont 22,781+ 10 0 260 12,524 22,947 11,127 11,820Massachusetts 408,052 74 ,058 333►994 394,' 100 93,081 291,01 6Rhode Island 51,375 13,189 38,186 60,902 22,802 38,100Connecticut 136,496 41,4ol 95,095 140,413 45,91 9 94,495
1 .
Federal grants aro included as state expenditures .
Loccra expendituresexclude stato aid .
TABLE 2 ; EXPENDITURES OF M- STATE OF ~UINZFISCAL TZJ RS 1930 AND 1935-1938a
Source ; Biennial Reports of tho Dopartment of Financ e
In Dollars
Function
1930b 1935 1936 1937 1939
General, govornmont 2 1649►321 5►057,197 5,775,114 5,535►971Protection to person s
and property 1,006,144 1,292,473 1,160,952 1,191,16 8Highmys 9,109,639 9,386,121 9,583,206 12,277,007Conservation of health
and sanitation 680,447 712,792 683,008 737,247Charities, hospital s
and corrections 3,872,809 5,468,631 70328,590 6,420,320
Dovolopmont of resources 686,559 954 ,339 963,469 1,105,287Education .3,063,691 3,254,16 3,391,419 3,641,202Yon.-governmental 559,347 450►794 512►749 500,965Intorost 1,215,823 1,193,989 1 ,143,739 1,117,080Unomploymont compensatioij - - 1,5j5,332 3 ► 096,220
Total
24,880,245 22,841,777 27,670,492 32, 437,577 35,612,46 5
`
a.
Fiscal year onding Juno 30,
b. Comparable broakdown of expenditures for 1930 not available . Totaldorivud from the State Audit Department Reports, 1930 ,

,
r.
AB 3: =-rPZTDI fit z S OF MM STATE OF IMW F~SIiTR.F,
FISCAL Yza- S 1932 AND 1935-1939°
Source: -Annual Reports of the Comptroller
In Dollar sFunction 1932 1935 1936 1937 193" 1939
General government 639,9"7 946,992 713 .465 927-.593 722 .459 1 .376 .099Protection to persons and proportyl 366,516 567 .590 6 +5.717 773 .743 1,195 .9"9 1 .435 .423Conservation of hem th and sanitation 23",797 253 .975 279 .797 38- .198 -
379 .165 364,541Development of resources 761,925 363,973 495 .7"9 539 .743 577 .527 642 .195Highways 6 .391 .943 7 .375,054 6,13" .536 5,952,295 6,990,647 5 .671.747Charities, hospitals and corrections 1,190,996 4,0-34,415 3.063,476 3 .356 ,353 3 .o1-4.052 1 .965 .633Education 1,93s,320 1,446,469 1,556.339 1,632,E 1 .729,229 1,735,316Recreation 7,210 349.301 27,697 123 .935 292,941 256 .313Miscella.neous2 133,537 1,959,224 2,990.,716 5,i49,324 3 ."32.726 4 .671 .945Public service enterprises - 763,11 120,924 31,139 29,"53 156 , 559Interest 357 .126 490,954 516 .233 492,589 451,545 395,359Supply accounts - - 2,991 2,15 2,120
Total 11,916 ,357 19 ,351,025 16,534 ,359 19, 333,153 19,108,230- 1",664,063
1 .
Includes unempioymo-t compensation payments .
2.
Includes expenditaros of state-controlled liquor business during recent years .
a.
.Fiscal year ending June 30 .

TA4 43 =E<iDITms OF THE STATE OF YEAMOIJI'FISCa YWS 1930 AND 1935»193ga
N
„ Source, Diennial_Reports of the Treasurer
In Dollar s
Function
1930
1935
1936
1937
193
Administration of justice
1+63, 231
395,344
451 .904
421,059
442'Educationl
712 , 055
574 , 436
93.2,362
9i6,760
931Public health
77,352
4 , 232
52 .590
117,292
181
Highways
2,624,760 5, 943 ,791 5,029 . 833 5,641,133 6,777Public welfare'
956,523
943,44o 1,494 . 995 1,722,767
2,16-A11 other
2,367,669
5,592, 223 3,905, 1+35 4,203,970b 4,331
Total
13,202,264 13,4o4 .072 11,913,119 13,022,971 14,22 7
1 . Increaso in 1936 and thereafter due principally to state aid to local i
a. Fiscal year ending June 30 ,
b. Includes unemployment compensation payments .
TABLZ 5, MW4NDITMS OF M; KAM] OF MJ%S4=SETTSI
FISCAL xaRS 1930 410 1 935,,1932a
Source, Annual Reports of the Commission on .Administra.tion and Financ e
Function 1930 1935 1936 1 937 193
Zzocutive andadministrative 1, 747 ,o43 2 .220,065 2,62o,708 2,293,121 2,829
Legislature 934,950 967,631 907►635 973,033 1,02!Judicial 1,406,046 1,4o9 .368 1, 432 ,537 1.,612,630Aducation 8,446,022 .g ,407 :26 g 8 .623,075 8 , 809, 981 9 . 43Public welfare an d
hospitals 22,86g,232 31,930,556 38,030►269 45 ,465,176 50,649Public works 1,8,103,416 25,040,698 26 .717,271 22,931, 948 27,97 1Agriculture and
conservation 1,735►393 1,620,205 1,696 0112 1,451,610 1,56;Labor and industry 1,949,045 201,7,283 2, 341 ,152 2,997,339 6 .25ECorporations, banking ,
taxation, insurance ,and public utilities 1,939,452 2,241,389 2,411,323 9,576 ± 351 2,63 (
Military affairs 7. .534,159 2,109►133 1,816,207 1.,709 .164 1,83 ;,x11 .1 other 517 ►199 380 .991 712, 979 435, 052 51 'Interest on debt 893 .39 8 817 :294 937,175 873, 102 73'
Total 62 .077,356 79,521,882 88 ► 242,344 92,128,507 107 .56 :
1.
Does not include unemployment compensation payments, Xn 1938 suchpayments amounted to $25,319,525 ,
a.
Fiscal year ending xovemoer 30,

.,
THE 6 :
k,V=IT=1 S OF TEE STA TS, OF RHODE1
lmFISM YEARS 1931 and 1935-19384
Source ;
Annual Reports of the General Treasurer
In Dollar s
Department 1931b
1936 1936 1937 1938
Executive 585,802 605,746 627,893 656,296State department 106,711 158 9 099 188,166 169,487Justice , attorney
general 60,856 74,756 69,490 69,367Treasury 31,341 717,467° 38,857 31 9848Public welfare 2,657,974 2,735,458 3 1 526,121 4,468,390Public Works 41039,365 3,043,032 4,230,867 4,021,359Taxation and regulation
900,239 706,956 1,473,370 1,638,485Education 1,320,134 1,642,252 1,993,142 2,032,35 5Labor department 48,711 113,742 116,466 159,741Agriculture and conser.»
vation "380,310 ..386,719 376,709 350,653Public health 182,462 197,073 307,219 331,132Legislature 126,34 115, 992 105,984 110,516Judiciary 715,861 783,461 833,994
j 823,419Special accounts - 61,844 49,177Contributions 43,788 46,100 «•Unemployment relief
load 5,852 1,933,897 1,800,314 1,653,630Interest 974,093 1,033,378 1,093,476 1,159,155Emergency publi c
works - 2,636,348 5,234,596All other 311,632 14.
4,421, 701 3 ~6U
! 89,538
Total 13,487,225
12,326,277 17,133,328 22062,326 17,665,55 1
1 . Excludes unenploywent compensation payments .
In 1938such payments amounted to $6,440,554,
a, Fiscal yeez endin g, June 30 .
Fiscal year changed in 1930 ;her;ce 1931 was emnloyod e
b . Comparable breakdown not available .c . Made up largely of pari-mutuel betting; tax receipts which
were redistributed by the Treasurerr.1
-
s
z
TABLE 7 :
EXPENDITURES OF TIC S LAT :: OF CC}I~NECTICB TFISCAL YEu',RS 1930 AED 1937-19382
Source :
Imuaual Reports of the Comptroller
In Dollars
Function 1930 19,15 1936 1937 1938 1939
General government 2,455,108 2,643,782: 2,431,946 3,215,761 3,062,290 3,616,820Protection to person s
and property 2,009,616 2,609,562 3,199,219 3,765,676 12,369,326b 12,577,750bDevelopment of resources
1,203,!46 732,887 808,759 812,586 763,884 874,357Conservation of healthand sanitation 642,807 675,718 688,477 758,458 792,657 760,622
High, ys 11 807 ;225 16,286,605 17,465,799 19,417,598 19,258,925 17,964,358Grid carrectians 8,555,4.85 23,127,956 17,518,014 15,03,577 16,235,888 16,918,912
Education 4,346,351 4,655,109 4,275,930 4,577,544 4,902,812 4,86;,129Public servic e
enterprises 26,155 11,702 44,132 80,348 34,803 30,214Pa--k= : !:,.n3 historical
sites 333,091 216,210 274,030 293,783 509,473 341,734Other 78,670 147,918 1613 057 167,041 190,380 182,032Interest 656,865 618,646 566,2374 14,517 - 195,313Sta te Ruilding Fund
(capital outlay) - - - - 496,611 6,933,081
Teml 35,018,517 51,726,096 47,434,237 47,984,887 58,667,050 65,24.0,320
a .
Fiscal year .ending June 30 .
b .
Includes unemployment compens^-tion payments .

w
r
TABLZ 8-, ZnWDITMS OF WCAL GOVZMMITS IN TIMNEW ENGLAND STATESi FISCAL YEAS 1932
Source:
United States Bureau of the Census, FP„U
' al§tAlistics
t 1
y r t
0
0~
Division Totalof New Maine New Vermont ,,. Massa- Rhode Connecticgt
England Hampshire chusetts Islandver
ent State
Counties 17,826, 2,066
2,265 112 11,655 » 1,728
Cities, towns ,villages andboroughs 452,980 13,041
10,280 4,938 526,830 38,418 59,473
Schooldistricts 31131 539 - 2,652
Townships 73,267 20,529
12,325 8,623 - 31,780
Other civildivisions ~2 .~ ..=- .53 w 299 - 1 .855
Total alllocal levels 551,376 36,944
24,870 14,265 339,095 38 1 717 97,485
Total localexp, endituresexcludinggrants-in.-aid 534,744 32,143
22,802 12,524 333,994 38,186 95,095

ZZ, LE 9s PBR CAPITA, iXPk..^1ACT'J► ',S IN 46 TYPICAL1441 111E TOV4718, FISCAL XEA.RS 1932.1937
Source ; Extension Service, University of Maine ,TEL% Trends
265
Roads
Charities .Year Total Schools and and
Bridges
Corrections
10 Towns, Population Less than 500
1932 59 .70 13.14 21 1 78 4.131933 50 .29 11 .61 16 .90 4-.071934 62 .93 11 .3'_ 25 .73 -1.031935 64,76 11 .97 21 .62 5 .541936 66 .02 12 .28 20.25 51501937 65 .53 12.77 21 .61 5133
15 Towns, Population 501.1,000
1932 54 .04 12.19 17 .47 2.5 61933 40 .31 10 .53 11 .34 2.9 31934 52,65 10 .69 18 .14 2.7 51935 49 .48 10 .77 15.21 3.701936 51 .04 '.1 .26 15 .10 3 .601937 52 .46 12 .00 13 .52 4104
8 Towns, Population 1,001-,.1,500
1932 50 .71 12 .77 12 ? 06 3.821933 44.49 11 .041 9196 4 .461934 51, ..1.2 11 . X10 14 .49 4 .251935 52.79 11 .62 11 .64 4.671936 52 .31 11 .41 13 .40 4.641937 53,92 12 .33 12 .19 4,85
13 Towns, Population Over 1 9 500
1932 50,22 12 .63 7 .22 6,241933 44.07 10 .90 5 .44 8 .261934 48 .48 11 .81 9 0 03 6 .611935 50 .77 12 .10 8 .02 6 .421936 55 .45 12 .46 9 .19 7 .9 61937 54.41 12 .98 8 .69 7 .39

TABLE 10; EXPENAITURES OF NE;7 HAMPSHIRE CITIES AND TOWNSMCAL YF4RS 1930 and 1935-1938 a
Source ,. Annual Reports of the Tax Comlsalo n
Do
General government 1,191,125 1,070,042 1,138,740 1,111,675 1,222,645Protection to persons
and property 1,616,068 1,547,245 1,547,934 1,604,577 1,679,79011(alth 146,863 510,748 476,868 601,182 633,974H ,3hviays 5,059,271 3,x29,e82 3,521,274 3,273,662 3,44.8,562Libraries 236,555 2126,518 228,943 237,851 245,274Charities 514,436 2,261,345 . 2,014,987 1,902,465 1,855,548Patriotic purposes 44,369 106,269 82,244 92,301 99,082Recreation 200,334 148,455 170,415 185,109 183,508
. Public service enter-prises 864,562 716,778 683,681 647,403 698,242
Unclassified 368,399 1 ;006,127 1 1 041,071 983, x,01 1,122,61 2Interest 814,800 506,476 536 1863 479,019 480,45 1Capital outlays 2 18271,813,188 1 49171_734 2 3 142 3 937 1,902.661 .
Total ex enditures 14,213,781 13,243,072 13,362,753 13,268,584 13,582,348r
a . Fiscal year ending; January 31 of succeedii-C year .
TABLE 11 ; =PMMTTMS OF M! H.AMPSHIi-~E SCHOOL DISTRICTSFISCAL YEARS
1930 and
1935-1939s'
Source ; Annual Reports of the Tax Com. ission
In 1h larsFunctign 1930 1935 1936 1937 1~~8 1939
Administration 243,264 220,317 224►636227,687 232,886 232,279Instruction ?•,145,282 3,859,499 3,907,150 3,919,749 4,008,087 4,018,827Operation andmaintenance 794,191 752,287 74-7,959 774,590 798,888 788,987
Auxiliary egencies 890,135 946,164 984,193 1,018,707 1,087,174 1,113,464Fixed charges 209,277 217,818 232,825 229,049 221,470 218,977Capital outlays 548,535 269,512 751,730 1,153,891 594,963 1,475,197Interest 225,455 234,065 205,678 195,605 177,377 166,234
Total expends- »tures 7,061,1':3 6,199,662 7,0511:,172 7,519,278 7,120,845 8,011,9 64.
a,
Pascal year ending June 30,