Mirella Dapretto, PhD: Sensory Over-Responsivity in ASD: Insights from Neuroimaging
29
Sensory Over-Responsivity in ASD: Insights form Neuroimaging Mirella Dapretto, Ph.D. Dept. of Psychiatry and Biobehavioral Sciences Semel Institute for Neuroscience and Human Behavior UCLA David Geffen School of Medicine CART Symposium April 22, 2016
-
Upload
semel-admin -
Category
Health & Medicine
-
view
461 -
download
2
Transcript of Mirella Dapretto, PhD: Sensory Over-Responsivity in ASD: Insights from Neuroimaging
Sensory Over-Responsivity in ASD: Insights form Neuroimaging
Mirella Dapretto, Ph.D.
Dept. of Psychiatry and Biobehavioral Sciences Semel Institute for Neuroscience and Human Behavior
UCLA David Geffen School of Medicine
CART Symposium April 22, 2016
Acknowledgments
Funding Agencies
NICHD P50 HD055784 NIH T32 GM008042 NIH T32 MH073526 SFARI 345389
Trainees
Leanna Hernandez
Kathy Lawrence
Janele Liu
Aarti Nair
Jeff Rudie
Ashley Scott-Van Zeeland
Deanna Greene
Amy Hubbard
Jennifer Pfeifer Ting Wang
Collaborators
Susan Bookheimer
Dan Geschwind
Pat Levitt
Marian Sigman
All Children Who Participated in Our Studies & Their Families!
CART Symposium April 22, 2016

Acknowledgments
Tawny Tsang
Shula Green
CART Symposium April 22, 2016
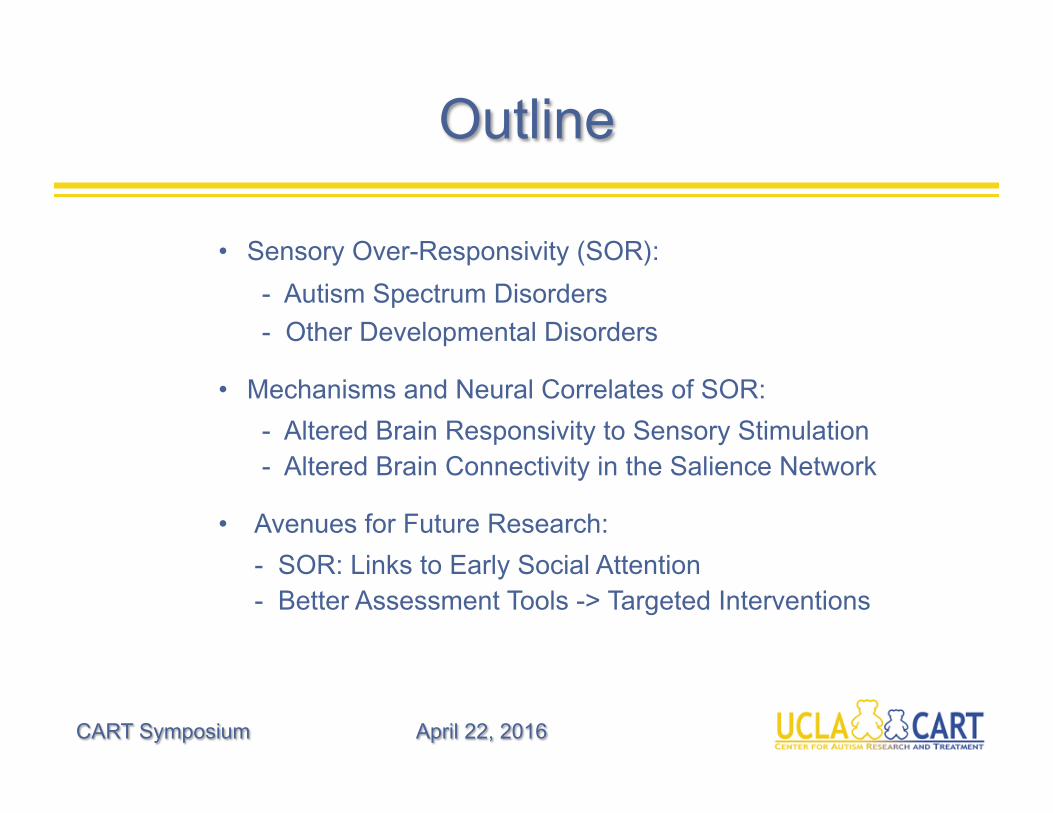
Outline
CART Symposium April 22, 2016
• Sensory Over-Responsivity (SOR):
- Autism Spectrum Disorders
- Other Developmental Disorders
• Mechanisms and Neural Correlates of SOR:
- Altered Brain Responsivity to Sensory Stimulation - Altered Brain Connectivity in the Salience Network
• Avenues for Future Research:
- SOR: Links to Early Social Attention - Better Assessment Tools -> Targeted Interventions
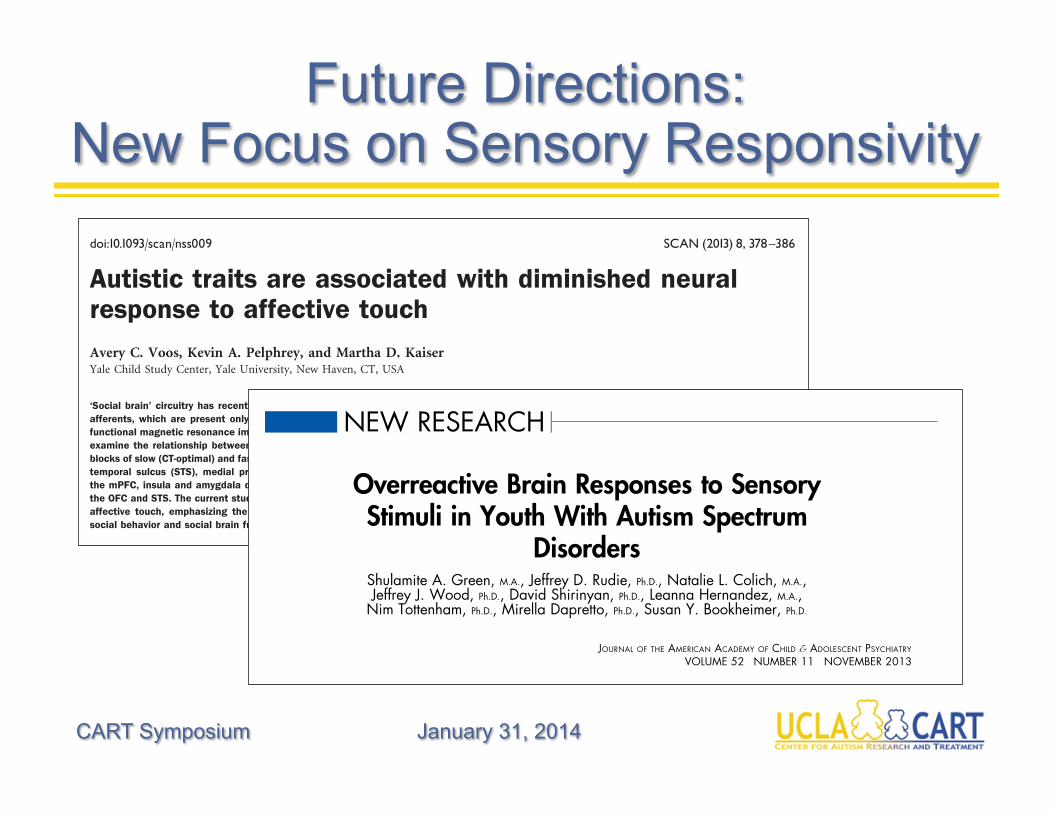
Future Directions: New Focus on Sensory Responsivity
CART Symposium January 31, 2014
Autistic traits are associated with diminished neuralresponse to affective touchAvery C. Voos, Kevin A. Pelphrey, and Martha D. KaiserYale Child Study Center, Yale University, New Haven, CT, USA
!Social brain" circuitry has recently been implicated in processing slow, gentle touch targeting a class of slow-conducting, unmyelinated nerves, CTafferents, which are present only in the hairy skin of mammals. Given the importance of such !affective touch" in social relationships, the currentfunctional magnetic resonance imaging (fMRI) study aimed to replicate the finding of !social brain" involvement in processing CT-targeted touch and toexamine the relationship between the neural response and individuals" social abilities. During an fMRI scan, 19 healthy adults received alternatingblocks of slow (CT-optimal) and fast (non-optimal) brushing to the forearm. Relative to fast touch, the slow touch activated contralateral insula, superiortemporal sulcus (STS), medial prefrontal cortex (mPFC), orbitofrontal cortex (OFC) and amygdala. Connectivity analyses revealed co-activation ofthe mPFC, insula and amygdala during slow touch. Additionally, participants" autistic traits negatively correlated with the response to slow touch inthe OFC and STS. The current study replicates and extends findings of the involvement of a network of !social brain" regions in processing CT-targetedaffective touch, emphasizing the multimodal nature of this system. Variability in the brain response to such touch illustrates a tight coupling ofsocial behavior and social brain function in typical adults.
Keywords: affective touch; autistic traits; CT-afferent; fMRI; social brain
Touch enables us to navigate not only the physical world but also thesocial world. This dual dimensionality of touch has been describedas being processed in the brain in a manner similar to pain, via twodissociable dimensions categorized as, sensory-discriminative andmotivational-affective (Morrison et al., 2010). Although the perceptionof discriminative touch, which allows us to perceive pressure, vibra-tion, slip and texture has historically dominated the touch literature(McGlone et al., 2007), neuroscientists have only recently begun tostudy ‘affective’ or social touch (Francis et al, 1999; Olausson et al.,2002, 2008; Rolls et al., 2003; McGlone et al., 2007; McCabe et al.,2008; Loken et al., 2009; Keysers et al., 2010; Morrison et al., 2010,2011;Gordon et al., 2011;). This type of pleasant, gentle touch has beenlinked to a class of slow-conducting, unmyelinated nerves, CT affer-ents, present only in the hairy skin of mammals, including humans(Loken et al., 2009). Microneurography studies have shown thatCT-optimal stroking speeds range from 1–10 cm/s with decreasedfiring rates for lower and higher speeds (Loken et al., 2009).Interestingly, pleasantness ratings for slow, light touch follow thesame pattern as the firing rates for CT-nerves. That is, participantsrate gentle touch at 1–10 cm/s as more pleasant than touch of sloweror faster velocities (Loken et al., 2009). Such slow, gentle touch isreminiscent of that seen in social interactions, such as those betweena parent and a child or intimate partners. Concordant with this ob-servation, and the preservation of this system in patient populationslacking A/B touch receptors (Olausson et al., 2002, 2008), the ‘skin asa social organ’ hypothesis (Morrison et al., 2010) posits that theCT-system represents an evolutionarily conserved mechanism with adirect role in processing social, or affective, touch.
CT afferents project to lamina I of the spinal and trigeminal dorsalhorn, which act as a processing station for signals from C-fibers
(Sugiura et al., 1986; Craig, 2003). Lamina I neurons continue throughthe lamina I spinothalamical pathway and project to the insular cortex(Olausson et al., 2002; Craig, 2003). For this reason, and because theinsular cortex has been considered a gateway from sensory systems tothe emotional system of the frontal lobe (Augustine, 1996; Craig,2008), initial neuroimaging studies of the brain mechanisms involvedin processing CT-targeted affective touch focused on the posteriorinsula (Olausson et al., 2002; McCabe et al., 2008). Recently, ourgroup (Gordon et al., 2011) used functional magnetic resonance ima-ging (fMRI) to demonstrate the involvement of several key nodes ofthe ‘social brain’ in processing such touch. The social brain describes acircumscribed set of brain regions that have evolved to support socialcognition. In her seminal writing on this idea, Leslie Brothers (1990)called this set of regions the social brain and included the amygdala,orbitofrontal cortex (OFC) and temporal cortex as its key components(Frith, 2007).
In our original study on affective touch (Gordon et al., 2011), awhole-brain comparison of the response to CT-optimal touch to theforearm relative to the glabrous skin of the palm revealed posteriorsuperior temporal sulcus (pSTS), medial prefrontal cortex (mPFC) andamygdala involvement in processing affective touch, processed by theCT-system. One alternative explanation for these results is that theymay not demonstrate something specific to CT-afferents, but insteadreflect distinct responses to touch on two discrete body parts. Forexample, typical adults perhaps code being touched on the arm asmore intimate or social than being touched on the palm. Therefore,one goal of the current study was to replicate the finding of ‘socialbrain’ involvement in processing CT-targeted touch in a slightly dif-ferent paradigm including two types of touch to the arm. The brushingwas performed on the right forearm, which has non-glabrous or hairyskin. The mechanoreceptive innervations of this type of skin includeboth myelinated (A) and unmyelinated (C) afferents (Vallbo et al.,1999). More specifically, A-beta low-threshold mechanoreceptorshave been found to be involved in discriminative touch, while C mech-anoreceptors have recently been implicated in subserving emotionaltouch (see McGlone et al., 2007, for a review). In addition, givenfindings of social brain dysfunction in autism and other disorderscharacterized by impairments in social perception and social cognition
Received 22 September 2011; Accepted 15 January 2012Advance Access publication 20 January 2012
We are grateful to India Morrison for helpful discussions of the results of this study and to Danielle Bolling forcomments on an earlier version of this article. We thank Randi Bennett and Jeffrey Eilbott for assistance withbrushing and data collection. Funding for this study came from two sources: a Harris Professorship to Kevin ArcherPelphrey and the Yale Autism Center for Excellence from the NIH (grant number: P50 MH081756; PI: K.A.P.).
Correspondence should be addressed to Martha D. Kaiser, 230 South Frontage Road, Yale University New Haven,CT 06520, USA. E-mail: [email protected]
doi:10.1093/scan/nss009 SCAN (2013) 8, 378^386
! The Author (2012). Published by Oxford University Press. For Permissions, please email: [email protected]
at University of C
alifornia, Los Angeles on January 25, 2014
http://scan.oxfordjournals.org/D
ownloaded from
NEW RESEARCH
Overreactive Brain Responses to SensoryStimuli in Youth With Autism Spectrum
DisordersShulamite A. Green, M.A., Jeffrey D. Rudie, Ph.D., Natalie L. Colich, M.A.,Jeffrey J. Wood, Ph.D., David Shirinyan, Ph.D., Leanna Hernandez, M.A.,Nim Tottenham, Ph.D., Mirella Dapretto, Ph.D., Susan Y. Bookheimer, Ph.D.
Objectives: Sensory over-responsivity (SOR), defined as a negative response to or avoidance ofsensory stimuli, is both highly prevalent and extremely impairing in youth with autism spectrumdisorders (ASD), yet little is known about the neurological bases of SOR. This study aimed toexamine the functional neural correlates of SOR by comparing brain responses to sensory stimuliin youth with and without ASD. Method: A total of 25 high-functioning youth with ASD and25 age- and IQ-equivalent typically developing (TD) youth were presented with mildly aversiveauditory and visual stimuli during a functional magnetic resonance imaging (fMRI) scan. Parentsprovided ratings of children’s SOR and anxiety symptom severity. Results: Compared to TDparticipants, ASD participants displayed greater activation in primary sensory cortical areas aswell as amygdala, hippocampus, and orbital-frontal cortex. In both groups, the level of activityin these areas was positively correlated with level of SOR severity as rated by parents, overand above behavioral ratings of anxiety. Conclusions: This study demonstrates that youthwith ASD show neural hyper-responsivity to sensory stimuli, and that behavioral symptoms ofSOR may be related to both heightened responsivity in primary sensory regions as well asareas related to emotion processing and regulation. J. Am. Acad. Child Adolesc. Psychiatry,2013;52(11):1158–1172. Key Words: amygdala, anxiety, autism spectrum disorders, functionalmagnetic resonance imaging (fMRI), sensory over-responsivity
C hildren with autism spectrum disorders(ASD) often display impairments inresponding to sensory stimuli, in addition
to the core symptoms of ASD, which includeimpairments in language and reciprocal socialbehavior. Sensory over-responsivity (SOR) ischaracterized by an extreme negative response to,or avoidance of, sensory stimuli such as noisy orvisually stimulating environments, sudden loudnoises, seams in clothing, or being touched un-expectedly.1 About 56% to 70% of children withASD meet criteria for SOR2,3 compared to 10% to17% of typically developing (TD) children.3,4 SORis associated with increased functional impair-ment in children with ASD, including lowerlevels of social and adaptive skills,1,5 negativeemotionality,6 and anxiety.5,6
Despite the prevalence of and considerableimpairment caused by SOR in children withASD, there is a paucity of research on the neuro-biological bases of SOR. Research in this area is
critical to help explain heterogeneity within ASD,and can inform intervention targeted at specificsubgroups of children with ASD. In one of the fewfunctional MRI (fMRI) studies of response tononsocial sensory stimuli in children with ASD,Gomot et al.7 found that early adolescents withASD responded faster to novel sounds than didTD controls, and had higher activation in pre-frontal and inferior parietal regions but no differ-ences in activation of auditory cortex. The authorstheorized that novel auditory stimuli are initiallyprocessed normally but receive differential atten-tion from the novelty detection circuit. Similarly,Hadjikani et al.8 presented expanding circles ofcolor to adults with and without ASD, and foundno between-group differences in visual cortexretinotopic maps. However, some electroenceph-alography (EEG) studies have found group dif-ferences in event-related potentials (ERPs) inresponse to tones, which may suggest an atypicalresponse to sound in the primary auditory cortex.9
JOURNAL OF THE AMERICAN ACADEMY OF CHILD & ADOLESCENT PSYCHIATRY
1158 www.jaacap.org VOLUME 52 NUMBER 11 NOVEMBER 2013
CART Symposium April 22, 2016
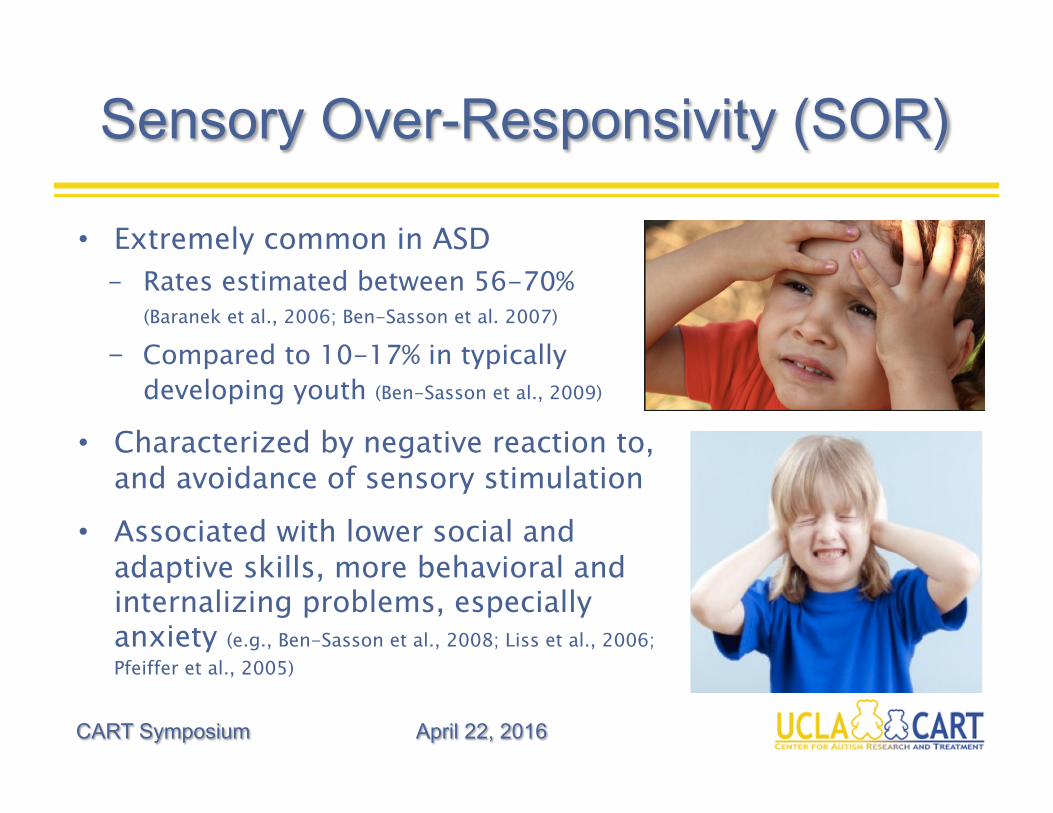
Sensory Over-Responsivity (SOR)
CART Symposium April 22, 2016
• Extremely common in ASD - Rates estimated between 56-70%
(Baranek et al., 2006; Ben-Sasson et al. 2007)
- Compared to 10-17% in typically developing youth (Ben-Sasson et al., 2009)
• Characterized by negative reaction to, and avoidance of sensory stimulation
• Associated with lower social and adaptive skills, more behavioral and internalizing problems, especially anxiety (e.g., Ben-Sasson et al., 2008; Liss et al., 2006; Pfeiffer et al., 2005)
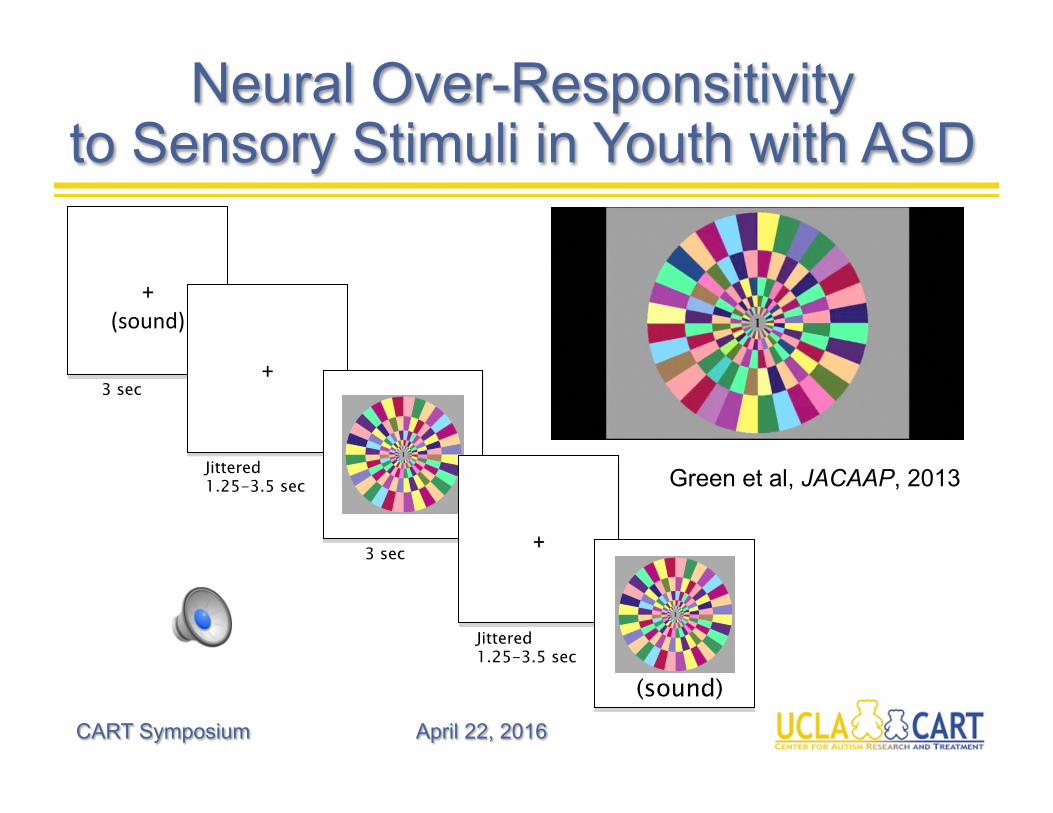
Neural Over-Responsitivity to Sensory Stimuli in Youth with ASD
CART Symposium April 22, 2016
+
(sound)
+
+
(sound)
3 sec
3 sec
Jittered 1.25-3.5 sec
Jittered 1.25-3.5 sec
Green et al, JACAAP, 2013
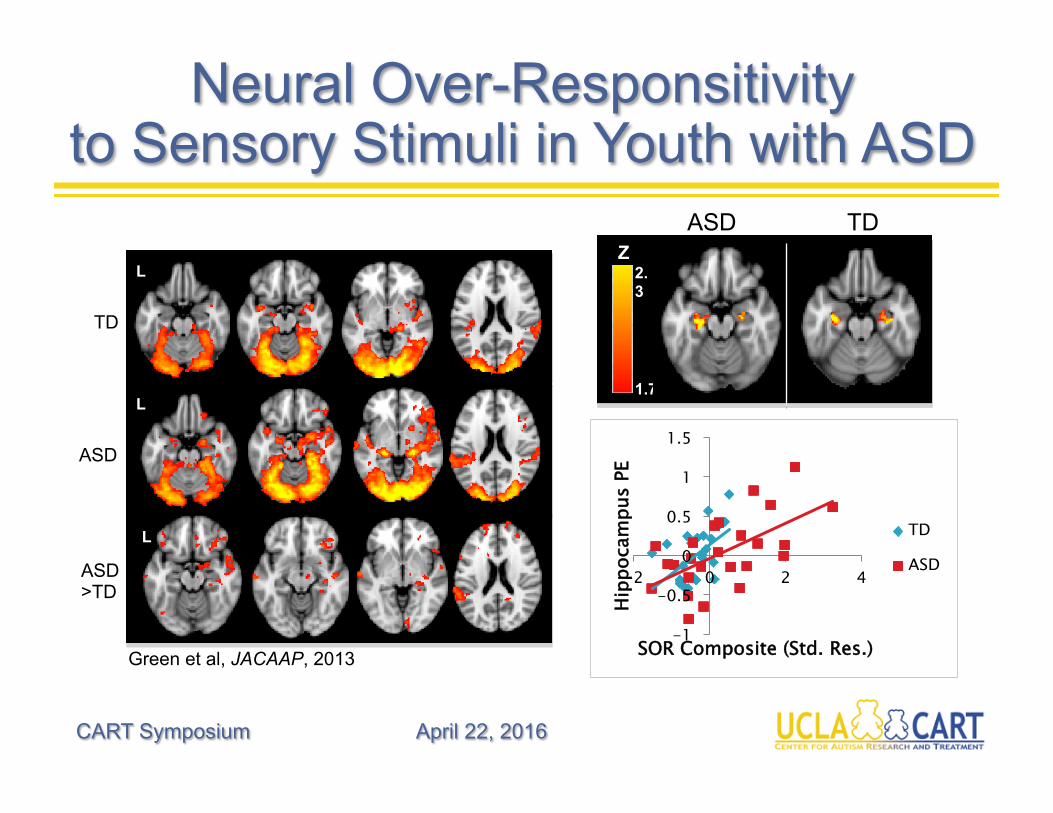
Neural Over-Responsitivity to Sensory Stimuli in Youth with ASD
CART Symposium April 22, 2016
-1
-0.5
0
0.5
1
1.5
-2 0 2 4
Hipp
ocam
pus
PE
SOR Composite (Std. Res.)
TD
ASD
Z
1.7
2.3
ASD TD
TD
L L
ASD
1.7
L
ASD >TD
L
Green et al, JACAAP, 2013
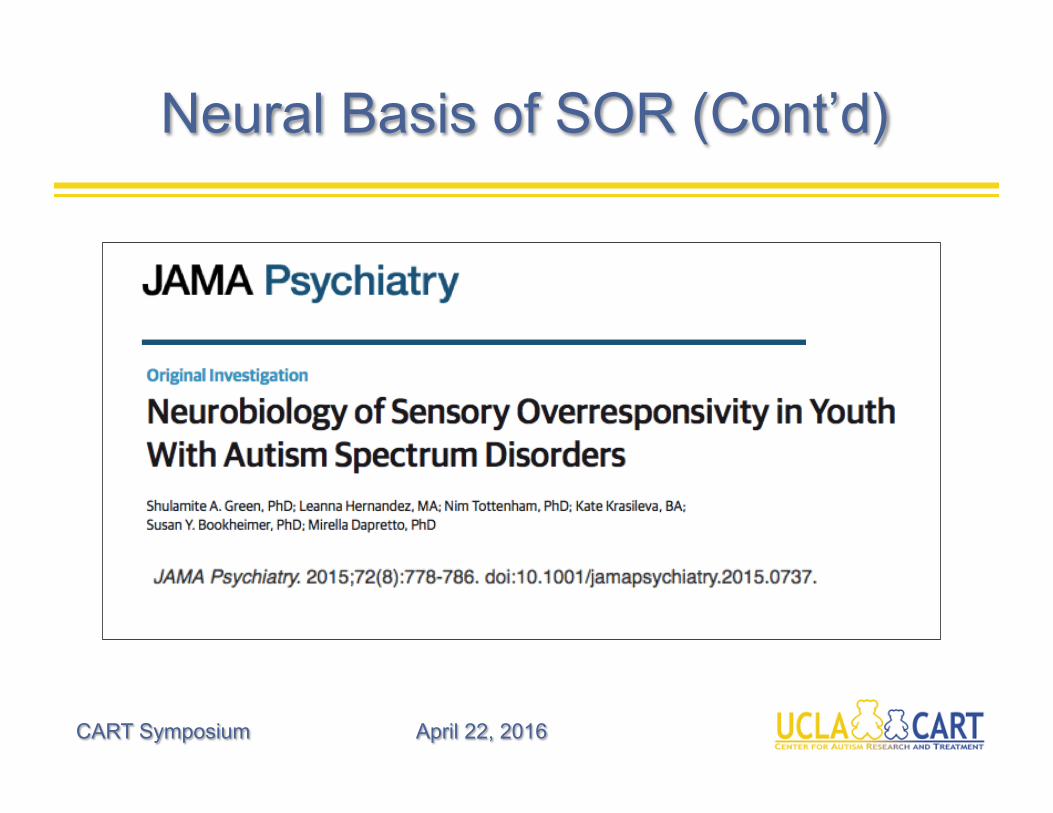
Neural Basis of SOR (Cont’d)
CART Symposium April 22, 2016
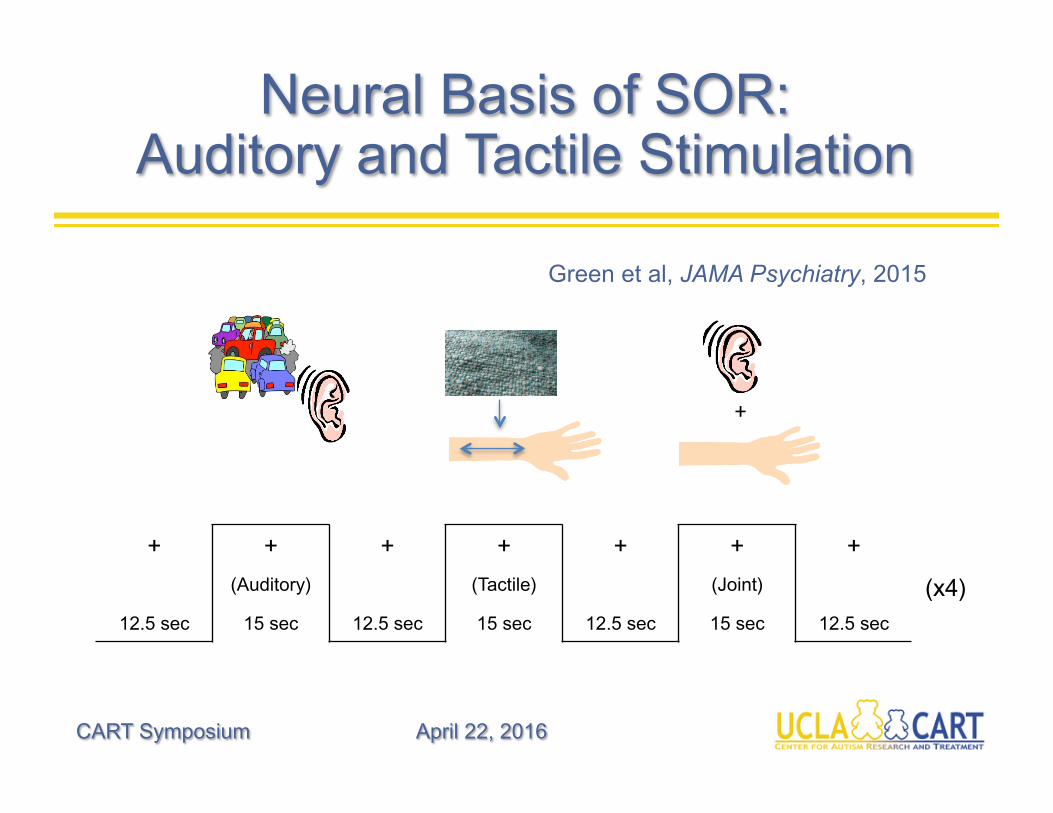
Neural Basis of SOR: Auditory and Tactile Stimulation
CART Symposium April 22, 2016
+
+ + + + + + +
(Auditory) (Tactile) (Joint)
12.5 sec 15 sec 12.5 sec 15 sec 12.5 sec 15 sec 12.5 sec
(x4)
Green et al, JAMA Psychiatry, 2015
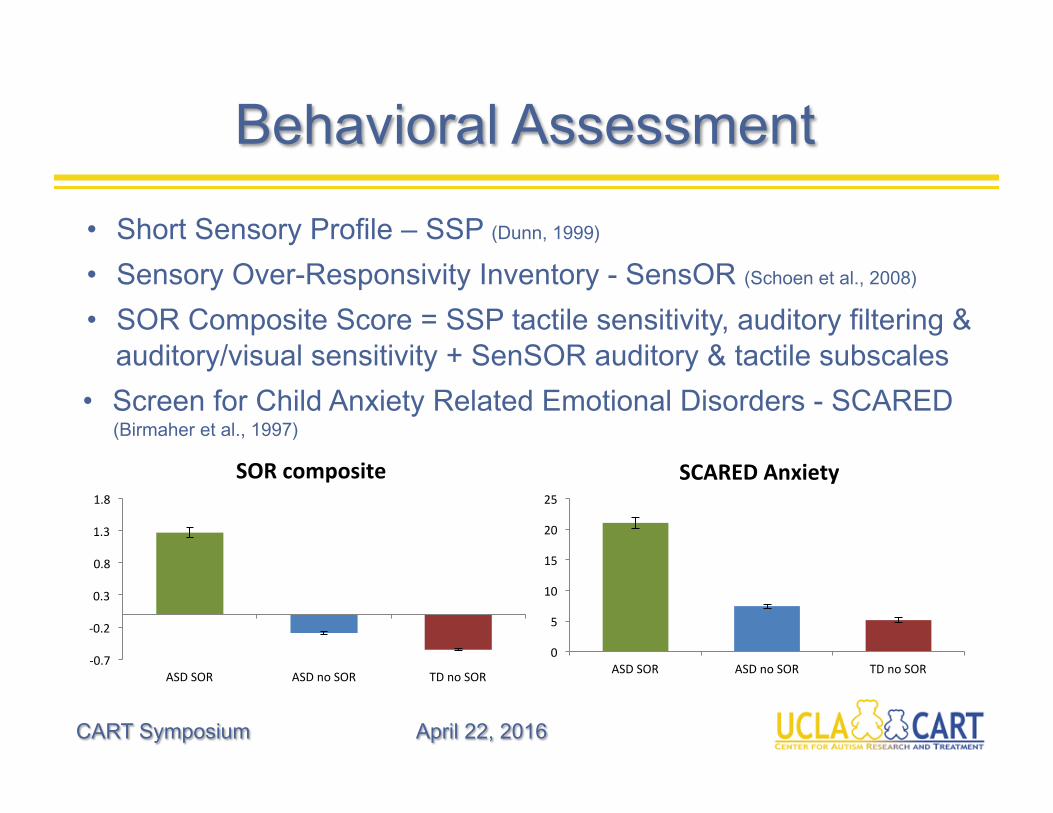
Behavioral Assessment
CART Symposium April 22, 2016
-0.7
-0.2
0.3
0.8
1.3
1.8
ASDSOR ASDnoSOR TDnoSOR
SORcomposite
0
5
10
15
20
25
ASDSOR ASDnoSOR TDnoSOR
SCAREDAnxiety
• Short Sensory Profile – SSP (Dunn, 1999)
• Sensory Over-Responsivity Inventory - SensOR (Schoen et al., 2008)
• SOR Composite Score = SSP tactile sensitivity, auditory filtering & auditory/visual sensitivity + SenSOR auditory & tactile subscales
• Screen for Child Anxiety Related Emotional Disorders - SCARED (Birmaher et al., 1997)
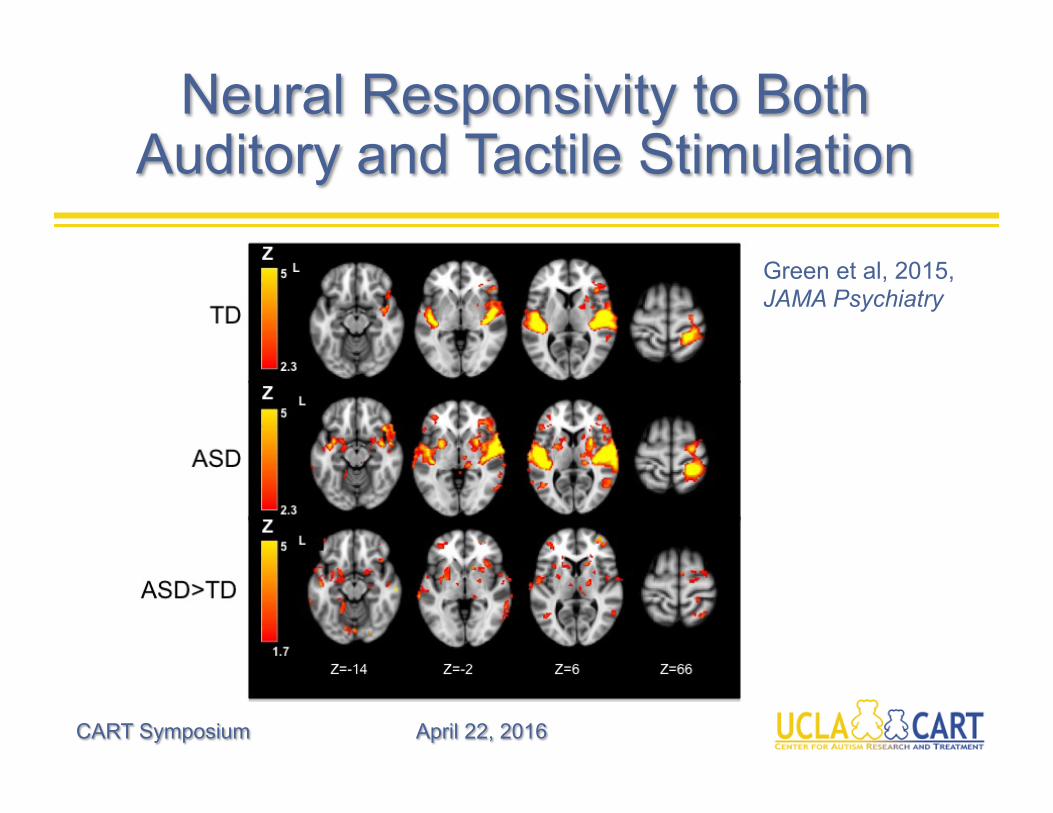
Neural Responsivity to Both Auditory and Tactile Stimulation
CART Symposium April 22, 2016
Green et al, 2015, JAMA Psychiatry
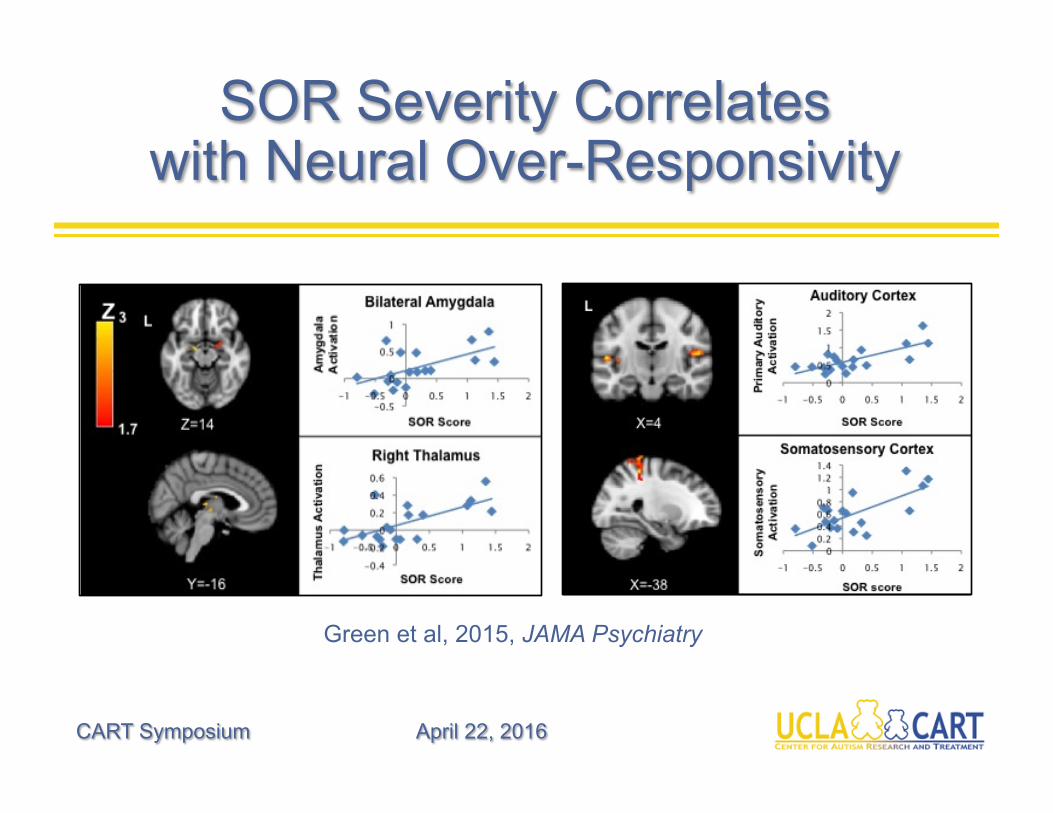
SOR Severity Correlates with Neural Over-Responsivity
CART Symposium April 22, 2016
Green et al, 2015, JAMA Psychiatry
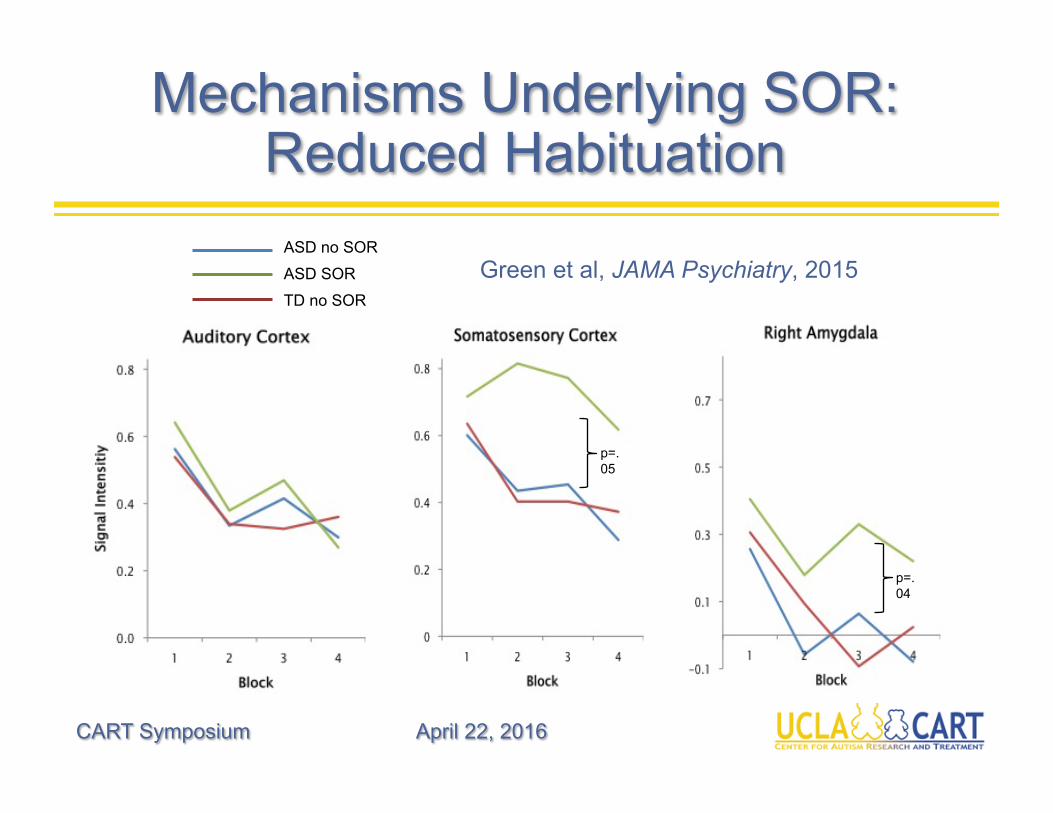
Mechanisms Underlying SOR: Reduced Habituation
CART Symposium April 22, 2016
Green et al, JAMA Psychiatry, 2015
p=.05
p=.04
ASD no SOR
ASD SOR
TD no SOR
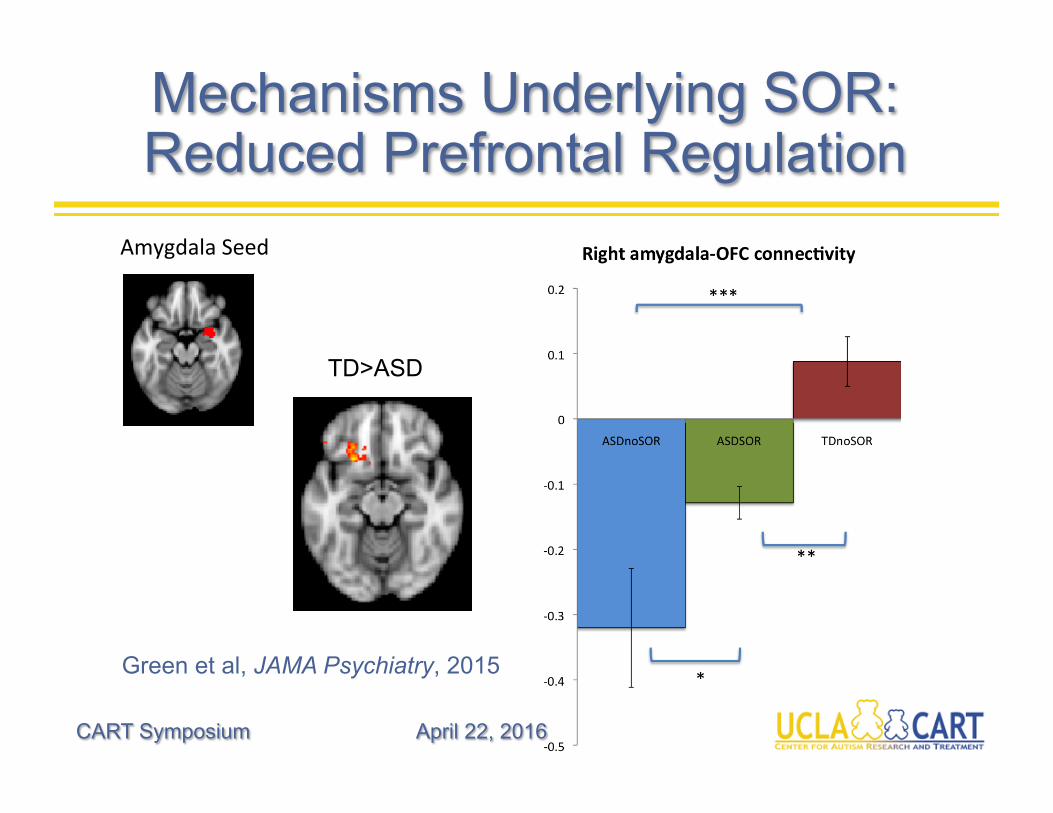
Mechanisms Underlying SOR: Reduced Prefrontal Regulation
CART Symposium April 22, 2016
Green et al, JAMA Psychiatry, 2015
TD>ASD
AmygdalaSeed
CART Symposium April 22, 2016
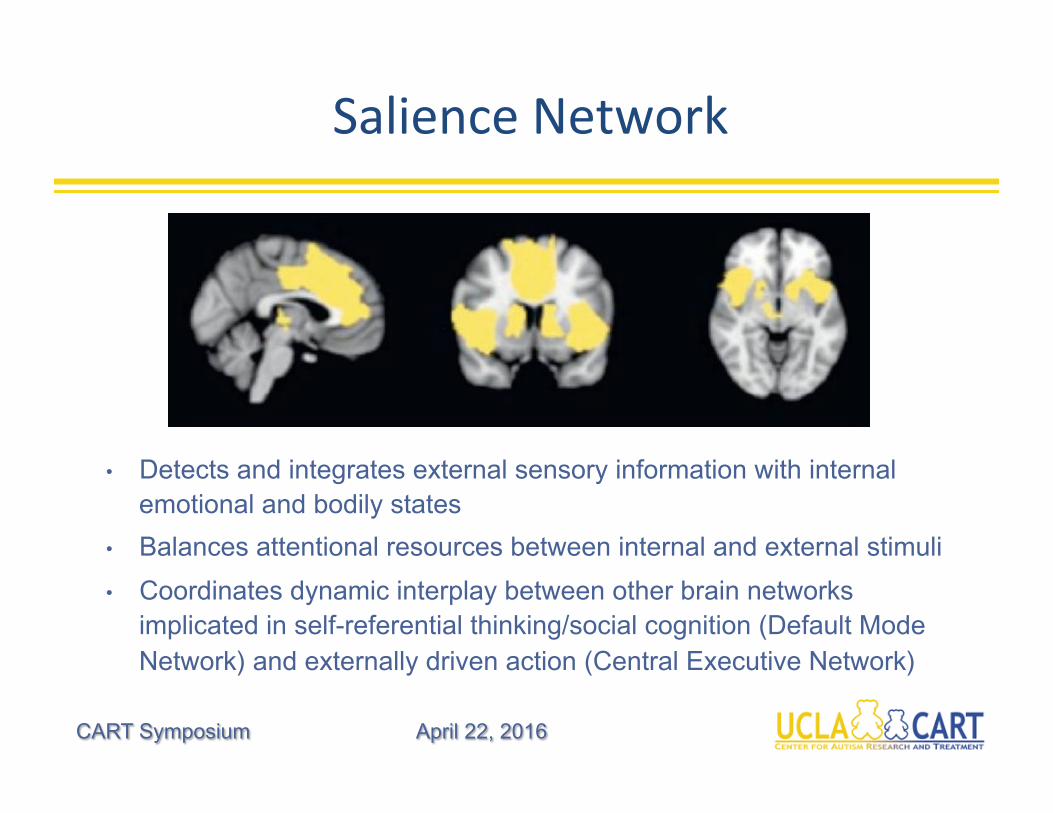
SalienceNetwork
• Detects and integrates external sensory information with internal emotional and bodily states
• Balances attentional resources between internal and external stimuli
• Coordinates dynamic interplay between other brain networks implicated in self-referential thinking/social cognition (Default Mode Network) and externally driven action (Central Executive Network)
CART Symposium April 22, 2016
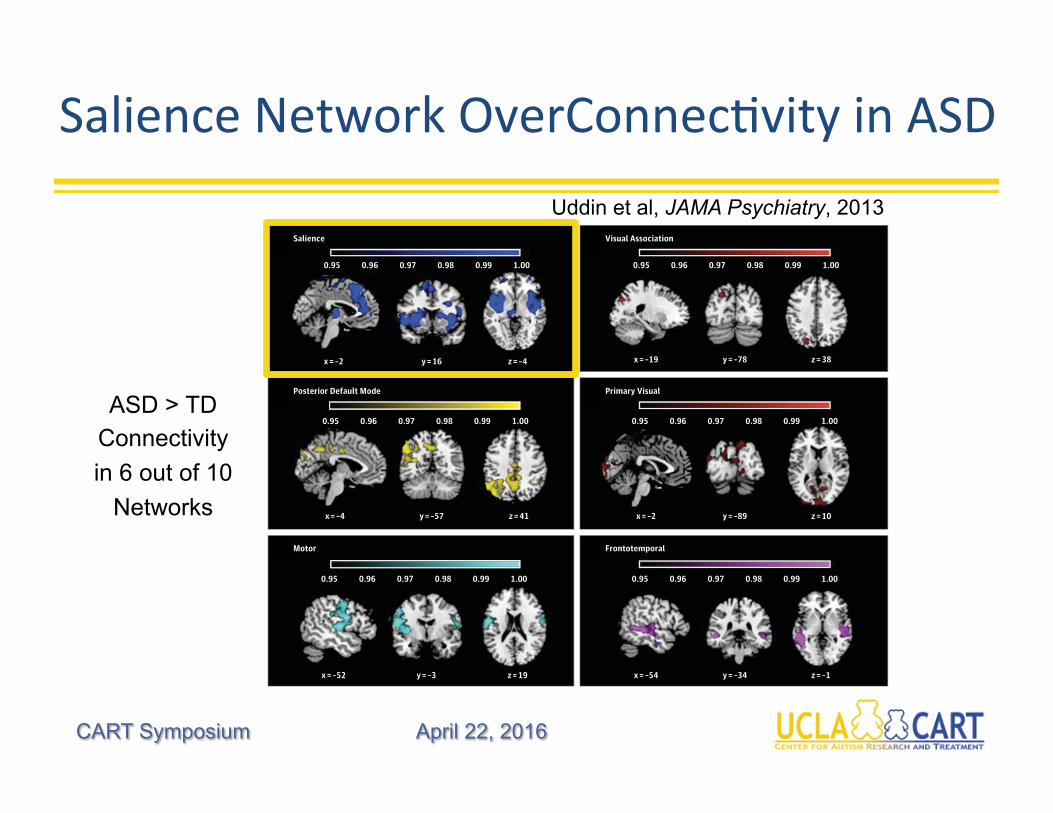
SalienceNetworkOverConnecHvityinASD
criminating ASD from TD, we focused on exploring relation-ships with this specific network. We found that the saliencenetwork was related to restricted and repetitive behaviors asmeasured by the ADI-R in that voxels within the network pre-dicted severity of symptoms (R2 = 0.36, P = .007, Bonferronicorrected). No significant relationships were observed be-tween the salience network and scores on the other subscalesof the ADOS or ADI.
DiscussionAutism is a complex neurodevelopmental disorder that af-fects multiple cognitive domains and brain systems. Ques-tions regarding the nature (hypoconnectivity or hyperconnec-tivity), extent (widespread or focal), and developmentaltimeframe (childhood or adulthood) of aberrant brain connec-tivity in autism are hotly debated. We address a critical gap inthe literature by examining whole-brain intrinsic functionalconnectivity in children with ASD and identifying the spe-cific brain network that most successfully discriminates chil-
dren with ASD from TD peers. We found that childhood au-tism is characterized by hyperconnectivity of major large-scale brain networks and that the salience network may be adistinguishing feature in children with ASD.
Brain Network Hyperconnectivity in ASDWe used ICA, a data-driven approach for assessing group dif-ferences in functional brain networks, to analyze fMRI datafrom children with ASD and TD children. Across 6 of the 10brain networks identified in the combined sample, childrenwith ASD exhibited greater functional connectivity than TDchildren. The salience network, DMN, frontotemporal net-work, motor network, and visual network all demonstratedgreater functional connectivity in children with ASD com-pared with TD children. The opposite pattern of results (TDgreater than ASD functional connectivity) was not observedin any brain region for any of the networks examined. This pat-tern of results was replicated in an independent cohort of chil-dren with ASD and TD children.
The underconnectivity theory of autism posits that the dis-order results from reduced functional connectivity between
Figure 2. Brain Network Hyperconnectivity in Children With Autism Spectrum Disorder (ASD) Compared With Typically Developing (TD) Children
0.95
x = –2 y = 16 z = –4
0.96 0.97 0.98 0.99 1.00 0.95 0.96 0.97 0.98 0.99 1.00
x = –19 y = –78 z = 38
0.95
x = –4 y = –57 z = 41
0.96 0.97 0.98 0.99 1.00 0.95 0.96 0.97 0.98 0.99 1.00
x = –2 y = –89 z = 10
0.95
x = –52 y = –3 z = 19
0.96 0.97 0.98 0.99 1.00 0.95 0.96 0.97 0.98 0.99 1.00
x = –54 y = –34 z = –1
Salience
Motor
Posterior Default Mode
Visual Association
Primary Visual
Frontotemporal
A
B
C
D
E
F
Autism spectrum disorder greater than TD functional connectivity wasobserved in 6 of the 10 networks examined: salience (A), posterior defaultmode (B), motor (C), visual association (D), primary visual (E), and
frontotemporal (F). Group difference maps were thresholded usingthreshold-free cluster enhancement (P < .05).
Research Original Investigation Salience Network–Based Classification
874 JAMA Psychiatry August 2013 Volume 70, Number 8 jamapsychiatry.com
Downloaded From: http://archpsyc.jamanetwork.com/ by a University of California - Los Angeles User on 01/25/2014
Uddin et al, JAMA Psychiatry, 2013
ASD > TD Connectivity
in 6 out of 10
Networks
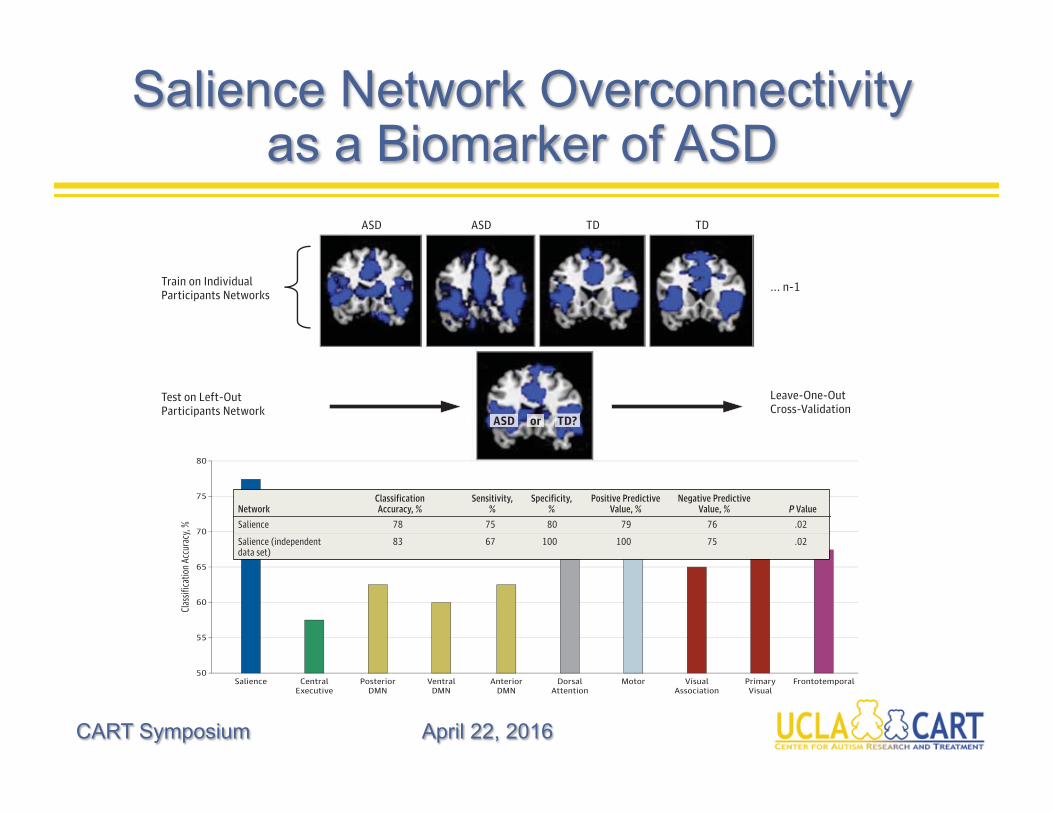
Salience Network Overconnectivity as a Biomarker of ASD
CART Symposium April 22, 2016
frontal and posterior cortical regions.6,65,66 It is not yet clearhow connectivity measures can be affected by methodologicchoices.5 In addition, few studies have addressed the ques-tion of how the brain is functionally organized in childhood
autism, at times more proximal to the onset of the disorder.37
We report hyperconnectivity of several major large-scale brainnetworks in children with autism. We found that in the sa-lience network, children with ASD showed hyperconnectiv-
Figure 3. Classification Analysis and Accuracy
50
80
75
Clas
sific
atio
n Ac
cura
cy, %
Component
Train on IndividualParticipants Networks
... n-1
ASD ASD TD TD
Leave-One-OutCross-Validation
Test on Left-OutParticipants Network
70
65
60
55
Salience CentralExecutive
PosteriorDMN
VentralDMN
AnteriorDMN
DorsalAttention
Motor VisualAssociation
PrimaryVisual
Frontotemporal
ASD or TD?
A
B
A, Classification analysis flowchart. The 10 components identified from each participant served as features to be input into classification analyses. A linear classifierbuilt using logistic regression was used to classify children with autism spectrum disorder (ASD) from typically developing (TD) children. B, Classification accuracyfor brain networks. The salience network produced the highest classification accuracy at 78% (P = .02). DMN indicates default mode network.
Table 2. Brain Network Connectivity Patterns for Children With Autism Spectrum Disorder From Typically Developing Children
NetworkClassificationAccuracy, %
Sensitivity,%
Specificity,%
Positive PredictiveValue, %
Negative PredictiveValue, % P Value
Salience 78 75 80 79 76 .02
Salience (independentdata set)
83 67 100 100 75 .02
Dorsal attention 73 75 70 71 74 .06
Primary visual 73 60 85 80 68 .06
Motor 68 60 75 71 65 .15
Frontotemporal 68 60 75 71 65 .16
Visual association 65 65 65 65 65 .21
Default mode
Anterior 63 50 75 67 60 .28
Posterior 63 65 60 62 63 .29
Ventral 60 55 65 61 59 .36
Central executive 58 55 60 58 57 .47
Salience Network–Based Classification Original Investigation Research
jamapsychiatry.com JAMA Psychiatry August 2013 Volume 70, Number 8 875
Downloaded From: http://archpsyc.jamanetwork.com/ by a University of California - Los Angeles User on 01/25/2014
frontal and posterior cortical regions.6,65,66 It is not yet clearhow connectivity measures can be affected by methodologicchoices.5 In addition, few studies have addressed the ques-tion of how the brain is functionally organized in childhood
autism, at times more proximal to the onset of the disorder.37
We report hyperconnectivity of several major large-scale brainnetworks in children with autism. We found that in the sa-lience network, children with ASD showed hyperconnectiv-
Figure 3. Classification Analysis and Accuracy
50
80
75
Clas
sifica
tion A
ccur
acy,
%
Component
Train on IndividualParticipants Networks
... n-1
ASD ASD TD TD
Leave-One-OutCross-Validation
Test on Left-OutParticipants Network
70
65
60
55
Salience CentralExecutive
PosteriorDMN
VentralDMN
AnteriorDMN
DorsalAttention
Motor VisualAssociation
PrimaryVisual
Frontotemporal
ASD or TD?
A
B
A, Classification analysis flowchart. The 10 components identified from each participant served as features to be input into classification analyses. A linear classifierbuilt using logistic regression was used to classify children with autism spectrum disorder (ASD) from typically developing (TD) children. B, Classification accuracyfor brain networks. The salience network produced the highest classification accuracy at 78% (P = .02). DMN indicates default mode network.
Table 2. Brain Network Connectivity Patterns for Children With Autism Spectrum Disorder From Typically Developing Children
NetworkClassificationAccuracy, %
Sensitivity,%
Specificity,%
Positive PredictiveValue, %
Negative PredictiveValue, % P Value
Salience 78 75 80 79 76 .02
Salience (independentdata set)
83 67 100 100 75 .02
Dorsal attention 73 75 70 71 74 .06
Primary visual 73 60 85 80 68 .06
Motor 68 60 75 71 65 .15
Frontotemporal 68 60 75 71 65 .16
Visual association 65 65 65 65 65 .21
Default mode
Anterior 63 50 75 67 60 .28
Posterior 63 65 60 62 63 .29
Ventral 60 55 65 61 59 .36
Central executive 58 55 60 58 57 .47
Salience Network–Based Classification Original Investigation Research
jamapsychiatry.com JAMA Psychiatry August 2013 Volume 70, Number 8 875
Downloaded From: http://archpsyc.jamanetwork.com/ by a University of California - Los Angeles User on 01/25/2014
frontal and posterior cortical regions.6,65,66 It is not yet clearhow connectivity measures can be affected by methodologicchoices.5 In addition, few studies have addressed the ques-tion of how the brain is functionally organized in childhood
autism, at times more proximal to the onset of the disorder.37
We report hyperconnectivity of several major large-scale brainnetworks in children with autism. We found that in the sa-lience network, children with ASD showed hyperconnectiv-
Figure 3. Classification Analysis and Accuracy
50
80
75
Clas
sific
atio
n Ac
cura
cy, %
Component
Train on IndividualParticipants Networks
... n-1
ASD ASD TD TD
Leave-One-OutCross-Validation
Test on Left-OutParticipants Network
70
65
60
55
Salience CentralExecutive
PosteriorDMN
VentralDMN
AnteriorDMN
DorsalAttention
Motor VisualAssociation
PrimaryVisual
Frontotemporal
ASD or TD?
A
B
A, Classification analysis flowchart. The 10 components identified from each participant served as features to be input into classification analyses. A linear classifierbuilt using logistic regression was used to classify children with autism spectrum disorder (ASD) from typically developing (TD) children. B, Classification accuracyfor brain networks. The salience network produced the highest classification accuracy at 78% (P = .02). DMN indicates default mode network.
Table 2. Brain Network Connectivity Patterns for Children With Autism Spectrum Disorder From Typically Developing Children
NetworkClassificationAccuracy, %
Sensitivity,%
Specificity,%
Positive PredictiveValue, %
Negative PredictiveValue, % P Value
Salience 78 75 80 79 76 .02
Salience (independentdata set)
83 67 100 100 75 .02
Dorsal attention 73 75 70 71 74 .06
Primary visual 73 60 85 80 68 .06
Motor 68 60 75 71 65 .15
Frontotemporal 68 60 75 71 65 .16
Visual association 65 65 65 65 65 .21
Default mode
Anterior 63 50 75 67 60 .28
Posterior 63 65 60 62 63 .29
Ventral 60 55 65 61 59 .36
Central executive 58 55 60 58 57 .47
Salience Network–Based Classification Original Investigation Research
jamapsychiatry.com JAMA Psychiatry August 2013 Volume 70, Number 8 875
Downloaded From: http://archpsyc.jamanetwork.com/ by a University of California - Los Angeles User on 01/25/2014
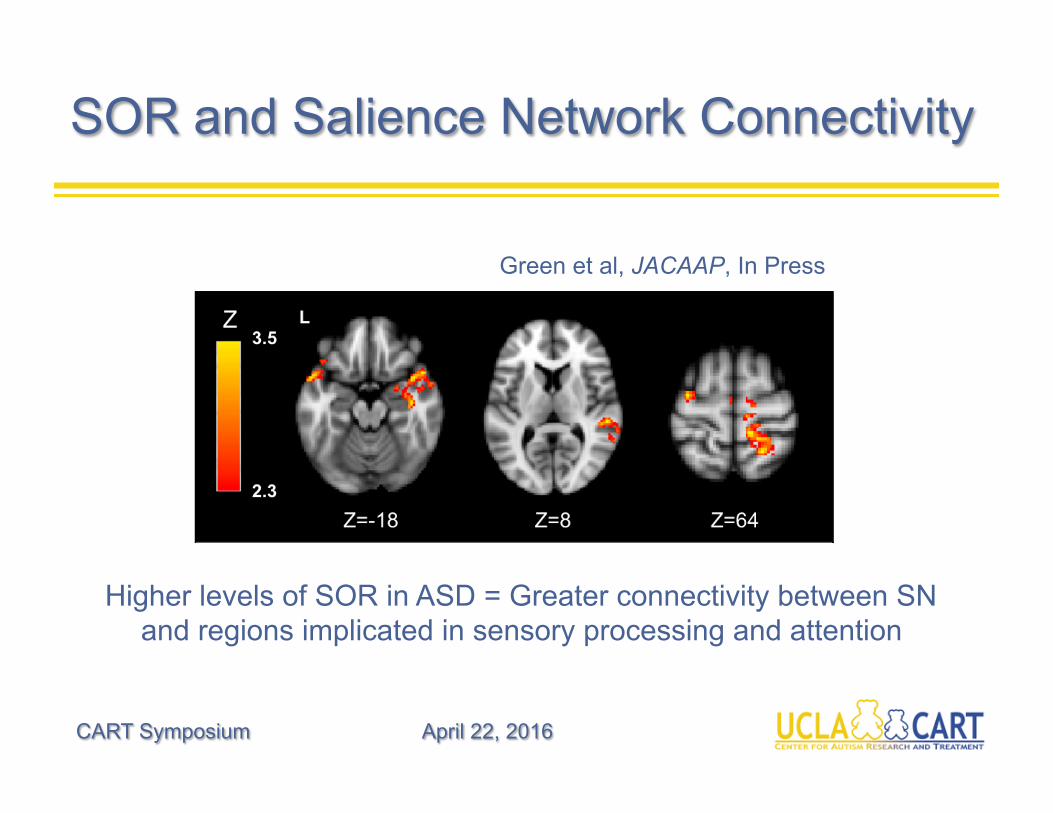
SOR and Salience Network Connectivity
CART Symposium April 22, 2016
Higher levels of SOR in ASD = Greater connectivity between SN and regions implicated in sensory processing and attention
Green et al, JACAAP, In Press
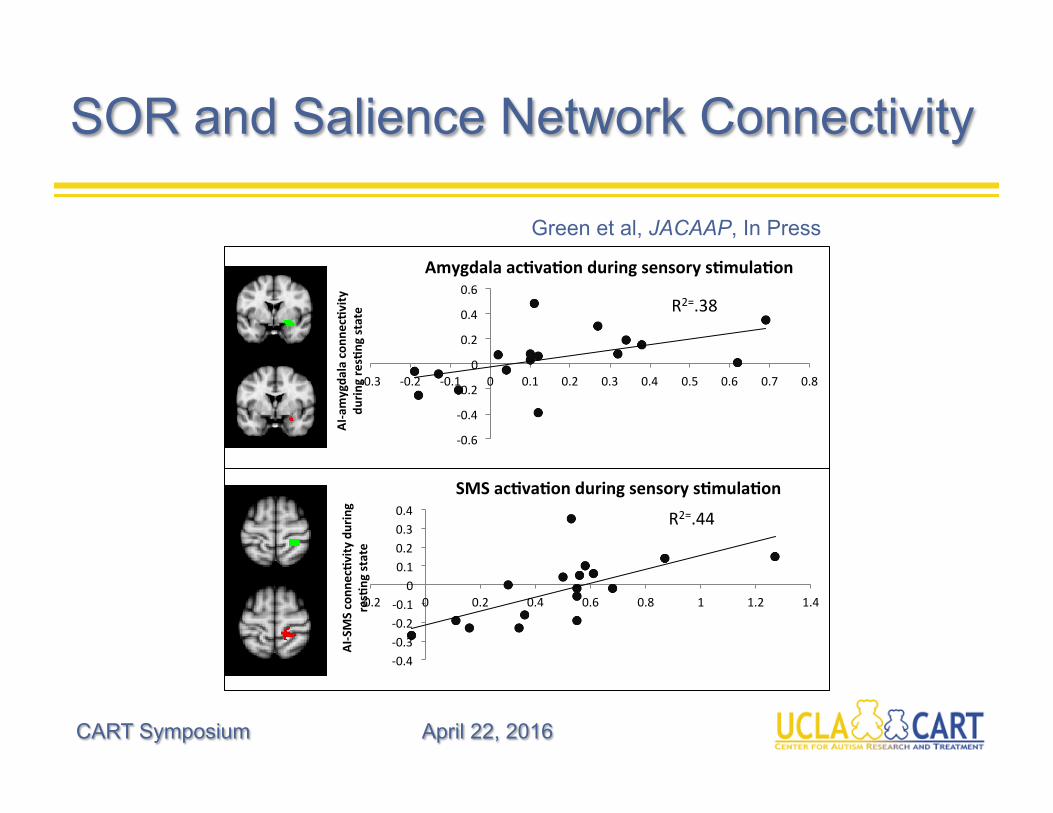
SOR and Salience Network Connectivity
CART Symposium April 22, 2016
Green et al, JACAAP, In Press
-0.6
-0.4
-0.2
0
0.2
0.4
0.6
-0.3 -0.2 -0.1 0 0.1 0.2 0.3 0.4 0.5 0.6 0.7 0.8
AI-amygda
lacon
nec:vity
durin
gres:ngstate
Amygdalaac:va:onduringsensorys:mula:on
R2=.38
-0.4-0.3-0.2-0.1
00.10.20.30.4
-0.2 0 0.2 0.4 0.6 0.8 1 1.2 1.4
AI-SMSconn
ec:v
ityduring
res:ngstate
SMSac:va:onduringsensorys:mula:on
R2=.44
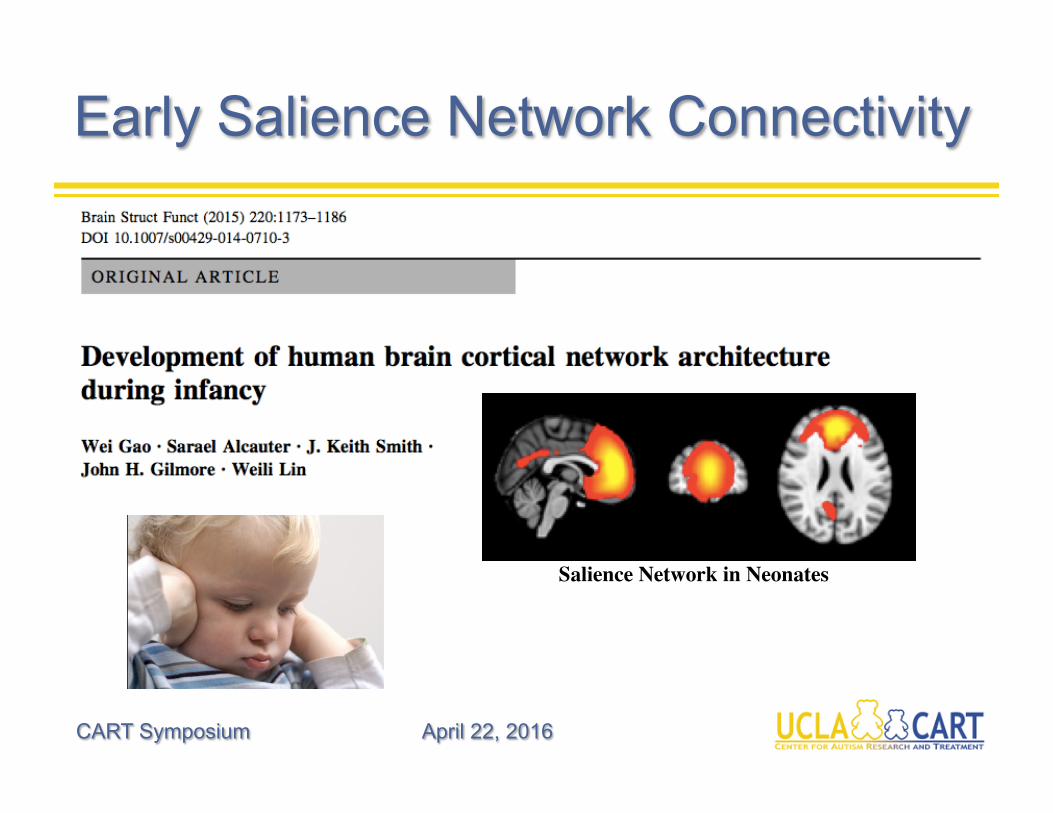
Early Salience Network Connectivity
CART Symposium April 22, 2016
Salience Network in Neonates
CART Symposium April 22, 2016
The “Infant Sibs” Approach
• Recurrenceratewithinfamiliesincommunitysamplesis~10%(vs.~1%inthegeneralpopulaHon)
• Rateinhigher,~20%,inprospecHvestudiesofinfantsathigh-risk(HR)forASD(Ozonoffetal,2011),parHcularlyinmulHplexfamilies(~45%forboys!)
• BycomparingprospecHvedatacollectedinHRinfantswholaterdoordonotmeetdiagnosHccriteriaforASD,wemayidenHfyearlymarkersoflaterdiagnosis
• EarlyidenHficaHon=earlyintervenHontoameliorate,orevenprevent,onsetoffullsymptomatology
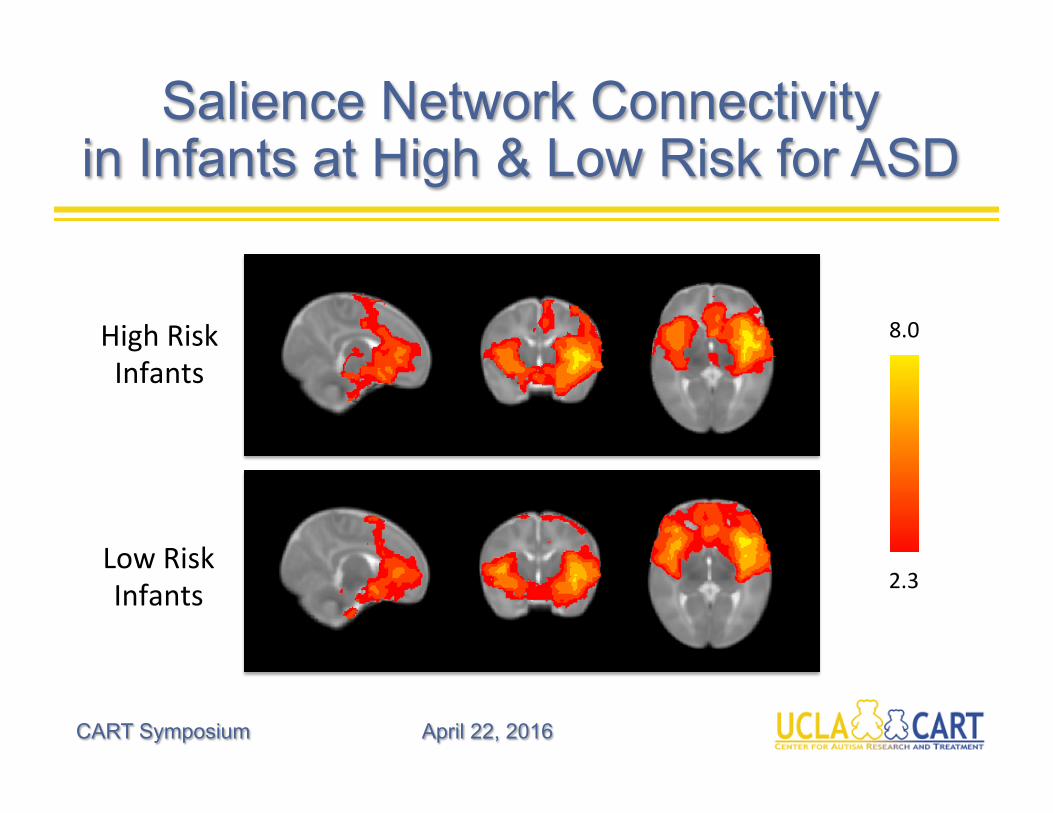
Salience Network Connectivity in Infants at High & Low Risk for ASD
CART Symposium April 22, 2016
2.3
8.0HighRiskInfants
LowRiskInfants
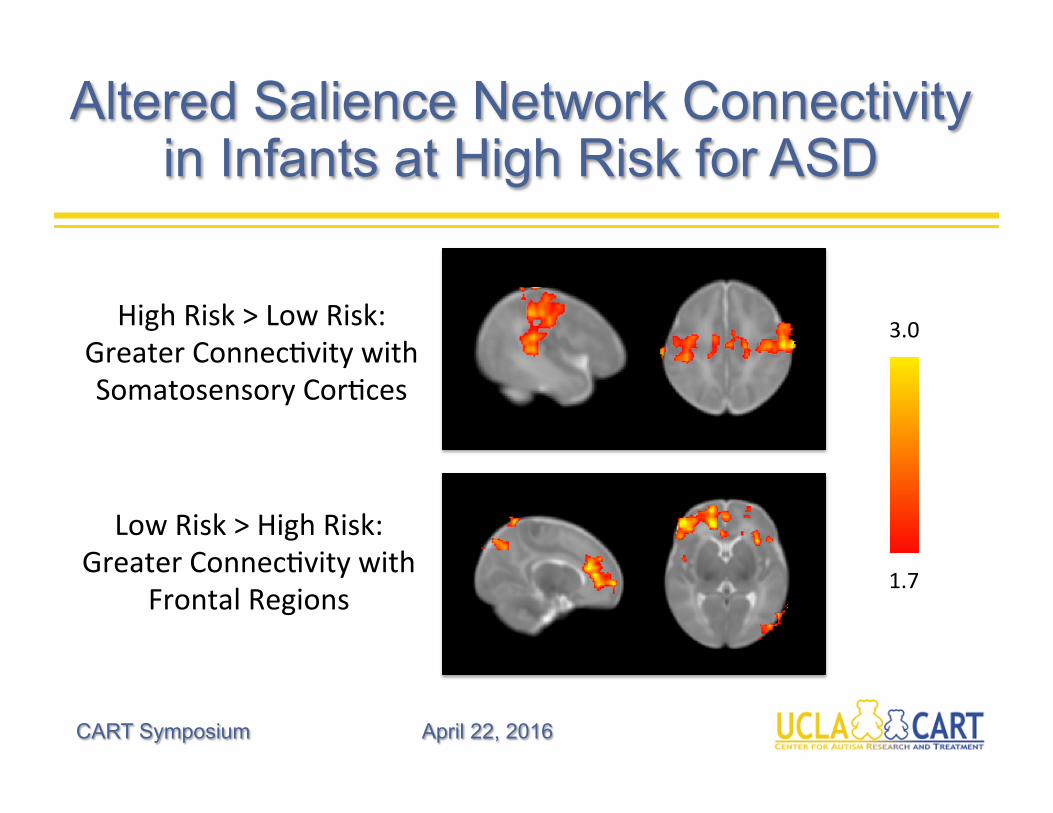
Altered Salience Network Connectivity in Infants at High Risk for ASD
CART Symposium April 22, 2016
1.7
3.0HighRisk>LowRisk:GreaterConnecHvitywithSomatosensoryCorHces
LowRisk>HighRisk:GreaterConnecHvitywith
FrontalRegions
Future Directions: SOR and Social Attention
CART Symposium April 22, 2016
• Frombirth,neonateshavebeenshowntorespondpreferenHallytothehumanvoice,parHcularlytheirmother�s(e.g.,DeCasper&Feifer1980)
• Avisualpreferenceforfacesisalsoseenfromthefirstdaysoflifeintypicallydevelopinginfants(e.g.,Valenzaetal1996,Conellanetal2001)
• ChildrenwithauHsmdonotseemtoshowapreferenceforlisteningtotheirmother�svoice(e.g.,Klin1992,Dawsonetal1998)andpreferanon-speechanalogtomotherese(Kuhletal2005)
• DecreasedafenHontofacesisoneofthefirstnoHceablesymptomsofASD(e.g.,Osterling&Dawson1994,Osterlingetal2002,Chawarskaetal2010)
• ThislackofafenHontosocialsHmulimayleadtoacascadeofnegaHveconsequencesforlatersocialdevelopmentthatcouldaccountforthecoredeficitsinASD(Dawsonetal,1998)
CanearlySORberelatedtodecreasedsociala3en4on?
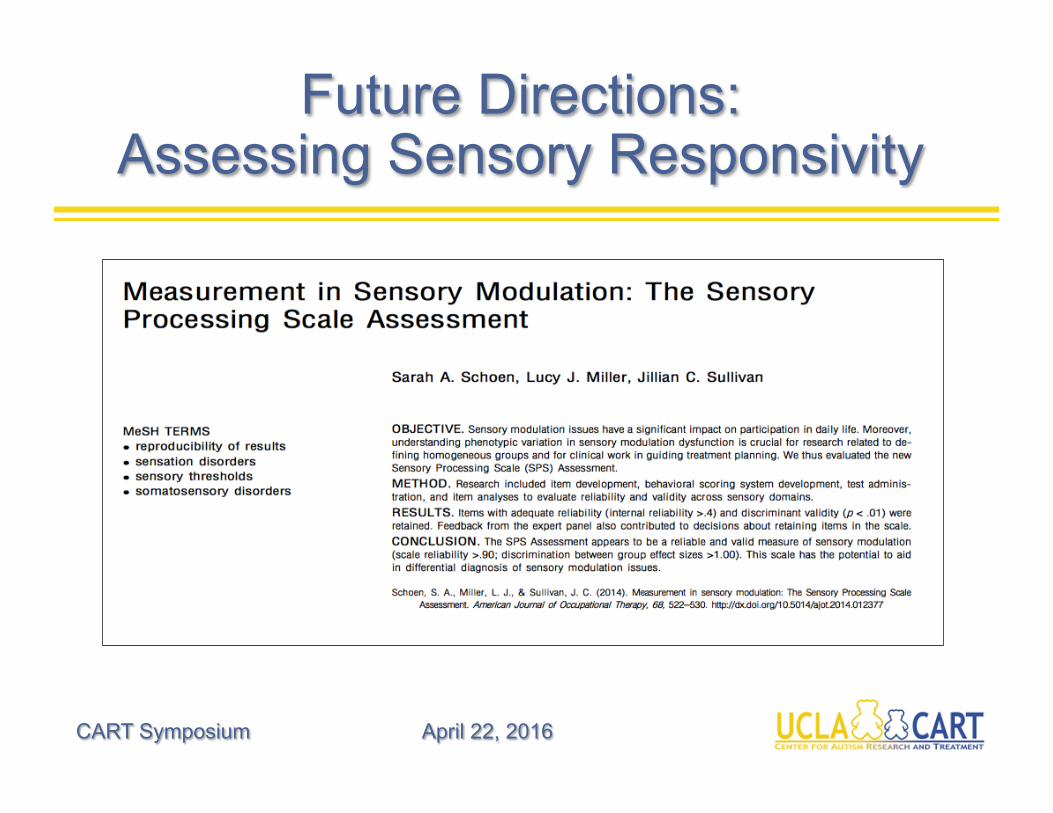
Future Directions: Assessing Sensory Responsivity
CART Symposium April 22, 2016
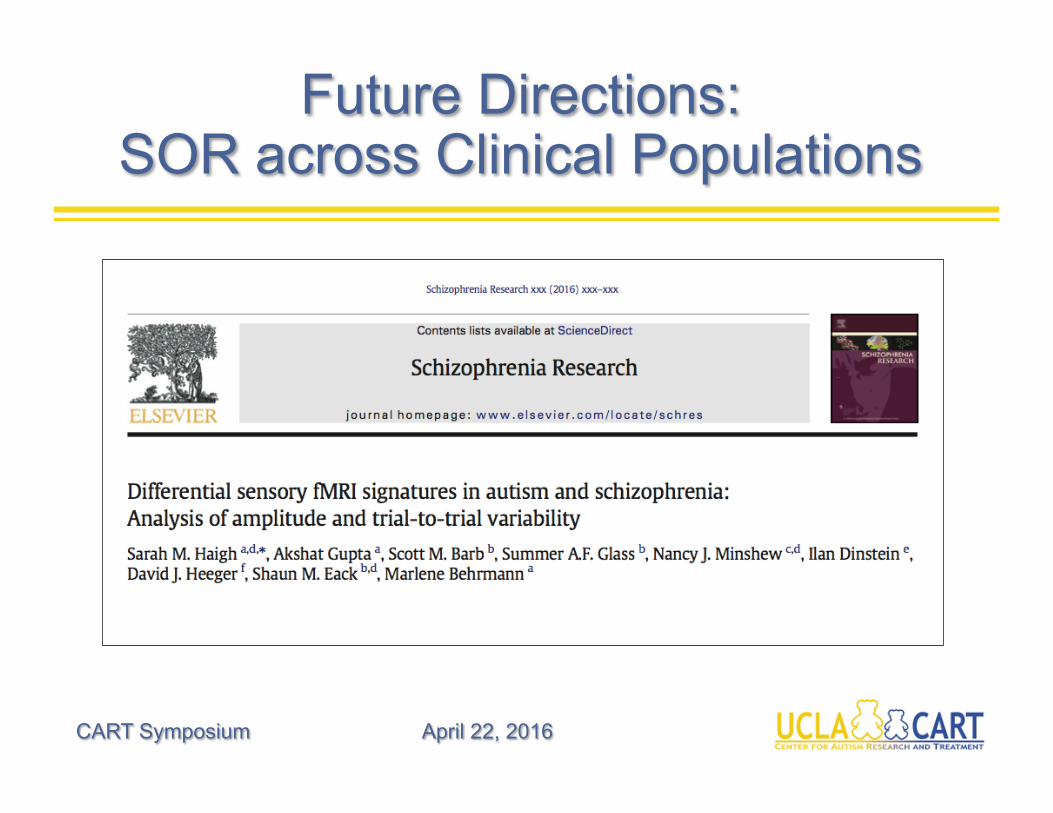
Future Directions: SOR across Clinical Populations
CART Symposium April 22, 2016

InterestedinOurStudies?
Justemailusat:
310-825-3478(ACEInfantSibsStudy)
310-825-5326(ACENetworkStudy,age:8-16)