Mircea Bădescu and Massimo Loi - Europapublications.jrc.ec.europa.eu/repository/bitstream... ·...
34
EUR 24563 EN - 2010 Participation in training of adult workers in European countries. Evidences from recent surveys Mircea Bădescu and Massimo Loi
Transcript of Mircea Bădescu and Massimo Loi - Europapublications.jrc.ec.europa.eu/repository/bitstream... ·...

EUR 24563 EN - 2010
Participation in training of adult workers in European countries.
Evidences from recent surveys
Mircea Bădescu and Massimo Loi


Participation in training of adult workers in European countries.
Evidences from recent surveys
The mission of the JRC-IPSC is to provide research results and to support EU policy-makers in their effort towards global security and towards protection of European citizens from accidents, deliberate attacks, fraud and illegal actions against EU policies. European Commission Joint Research Centre Institute for the Protection and Security of the Citizen Contact information Address: Via E. Fermi 2749, TP 361, Ispra (VA), I-21027, Italy E-mail: [email protected] Tel.: +39 0332 78 5732 Fax: +39 0332 78 5733 http://ipsc.jrc.ec.europa.eu/ http://www.jrc.ec.europa.eu/ http://crell.jrc.ec.europa.eu/ Legal Notice Neither the European Commission nor any person acting on behalf of the Commission is responsible for the use which might be made of this publication.
Europe Direct is a service to help you find answers to your questions about the European Union
Freephone number (*):
00 800 6 7 8 9 10 11
H(*)H Certain mobile telephone operators do not allow access to 00 800 numbers or these calls may be billed.
A great deal of additional information on the European Union is available on the Internet. It can be accessed through the Europa server http://europa.eu/ JRC 61100 EUR 24563 EN ISBN 978-92-79-17202-1 ISSN 1018-5593 doi:10.2788/3263 Luxembourg: Publications Office of the European Union © European Union, 2010 Reproduction is authorised provided the source is acknowledged Printed in Italy

Table of Contents
Summary of the main findings 7 List of Tables and Charts 9 Introduction 11 1. An overview on some findings from studies on continuing training of adults 13 2. Training across European countries 15 2.1 Data sources and issues 2.2 The level of training 2.2a Participation in training 2.2b The volume of training 3. Correlation analysis 22 4. Conclusions 23 Annex – Data used in this publication References


7
Summary of the main findings
• The level of adult training differs significantly across the European countries; surveys show that
adults’ participation in organised learning is constantly among the highest in the Scandinavian countries
and the United Kingdom. The evidence is quite robust that continuing training is relatively low in
southern European countries and relatively higher in the most Nordic countries. Drawing on data for 28
European countries, the rankings of countries give broadly similar results across different surveys.
Sweden, Denmark, Finland and the United Kingdom show systematically very high participation,
whereas Romania, Hungary, Greece, and Malta have comparatively lower rates.
• There also appears to be some trade-off between the extensive and intensive margins of training.
A country that provides a little training for many workers is emphasising the extensive margin and will
tend to score higher on the participation than on the volume measures. Data suggest that this pattern
may characterise Sweden, Denmark and Finland whereas Hungary, the Netherlands and Malta put
emphasis on the intensive margin and, consequently, score higher on measures of hours of training.
• There is considerable consistency across the four surveys used in this paper and the cross-
survey correlations for participation measures indicate a statistically significant high consistency in
ranking countries by this dimension of training; the consistency is present to a lesser extent among
measures of the training volume. This is encouraging and suggests that it is possible to make
qualitatively valid cross-country comparisons of training participation rates.
• Several European initiatives coordinated by Eurostat in the last decade have been implemented to
collect harmonised survey data on training. All these surveys provide various measures of the level of
continuing education and training among the population. Nonetheless, it is rather difficult to make
precise comparisons, because different surveys use different methodologies, time reference periods,
and range of relevant learning experiences. The heterogeneity in the training questions introduces
problems of comparability between surveys across the countries. Yet, little is known about the
extent to which these conceptual measurement problems lead to actual measurement errors.


List of Tables and Charts
Table 1: Overview of European surveys providing data on continuing training
Table 2: Adult participation in training for European countries
Table 3: Volume of adult training in European countries
Table 4: Rank correlations of statistics on training participation and volume in different
surveys
Chart 1: Cross-survey indices of training participation and volume
Chart 2: Patterns of adult training in European countries


11
Introduction
The importance of a highly skilled workforce has become increasingly relevant in the context of the European
Union new strategy for smart, sustainable and inclusive growth - ‘Europe 2020’. At the individual level, a good
education is increasingly decisive for employment prospects and earnings levels. Hence, education and training
systems must generate new skills, to respond to the nature of the new jobs which are expected to be created,
as well as to improve the adaptability and employability of adults already in the labour force. TPF
1FPT
The skills and competences of the workforce are the product of a large variety of learning activities that take
place in diverse institutional contexts. While good initial education provides an essential foundation, learning
continues through the working years. Policies encouraging wide participation in continuing training are therefore
an important component of lifelong learning strategies.
Very little is known concerning differences in continuing training or their causes and consequences. Such
information would be useful for assessing policy choices related to training, such as whether to encourage an
overall increase in training levels or to attempt to redirect training investments toward groups currently receiving
little training.
This publication deal with some of these issues. Chapter 1 surveys prior research on continuing training of
adults. In Chapter 2, some aggregate measures using harmonised data from the European surveys of training
are constructed and analysed; a set of stylised facts concerning differences in the level of training across
European countries are discussed based on these aggregate measures. Chapter 3 presents a more formal
analysis of the robustness of cross-country differences in the level of training; cross-country rank correlations
are calculated between the various measures of training. A concluding section considers some policy
implications for in this area.
Several limitations of the analysis require highlighting. In this publication only some types of continuing training
are analysed. Moreover, the analysis is limited to incumbent workers between the ages of 25 and 64 years,
since this restriction avoids complications related to differences in initial education and retirement patterns.
Because most continuing training of employees is sponsored - at least in part - by employers, employer-
provided training is emphasised. Furthermore, training is only measured in terms of the resources invested and
not in terms of the outcomes achieved.
TP
1PT New Skills for New Jobs, Communication from the Commission to the European Parliament, the Council, the European Economic and
Social Committee and the Committee of the Regions, Brussels, COM(2008) 868 final.

12
13
1. An overview on some findings from studies on continuing training of adults
The importance of education and training for labour market performance is likely to have increased in the past
years. It is now well established that training activities may enhance the potential benefits that individuals can
reap from participating in the labour market; the empirical analysis of the links between training and employment
lend support to these findings. There is a strong cross-country correlation between employment performance,
on the one hand, and both initial education and adult training, on the other. This finding is essentially due to the
robust correlation between human capital investments and labour force participation, which may reflect the fact
that such investments make work more attractive, because either expected wages are higher or employment
prospects better than in the absence of training (OECD, 2004).
According to the standard theoretical model of training as a human capital investment (Becker, 1964), firms train
workers to increase productivity and output while workers undertake training to realise future earnings gains
associated with these increases in productivity. In the past years the empirical literature has focused on testing
the predictions of Becker’s conventional model. Research was carried out in recent years to investigate mainly
the impact of training on the future earnings and on the productivity, as well as on the possibility to distinguish
between general and firm-specific skills and to further investigate the specificities of training provided by firms.TPF
2FPT
Generally, most empirical work has found a positive impact of training on earnings growth. In particular, some
studies have concluded that the earnings gains from training are significantly larger for groups of workers less
likely to be trained: less-skilled workers in the United States (Bartel, 1995) mid-educated workers in the United
Kingdom (Blundell et al., 1996) and women in the United Kingdom (Booth, 1991) and in Germany (Pischke,
1996). However, earnings growth after training and the event of training may not be independent variables.
Unobserved individual characteristics may determine both the probability that someone is trained and the fact
that they earn higher than average wages after the training.
Also, there is very scant evidence that earnings of trainees are lower than those of comparable workers, with
the exception of apprentices. Some research found that vocational certification predicted higher wages for youth
from different school tracks; for cohorts in which general education was more prevalent, formal vocational
certification was an important predictor of higher initial wages for both high and low quality school tracks. By
comparing the earnings five, ten and 13 years after labour market entry, it appears that vocational training
results in higher initial wages while apprenticeship leads to higher wages over time (Cooke, 2001).
Along this line, recent evidence from CRELL based on EU-SILC micro-data across the 24 European countries
suggests a potential association between earning differentials and the structure of educational systems. In many
countries where vocational programmes are widespread (over 60% of the upper secondary students follow a
vocational programme), the differences in earnings TPF
3FPT reported by workers aged 25-to-65 is also more pronounced.
One assumption could be that, in countries where vocational programmes are prevailing at the upper secondary and
TP
2PT Findings on other topics such as the relationship between training and job tenure or between training and turnover or whether the market
allocates training optimally, are also available. They are not discussed in this section. TP
3PT OLS estimates of the rate of return to education calculated based on Mincerian wage equation.

14
post-secondary level, people who fail to attend these levels - and to get a vocational qualification - may also be much
stronger penalised on the labour market by employers (CRELL, 2010).
The literature generally confirms a positive impact of training on productivity (Bartel, 1995; Black and Lynch,
1996; Boon, 1998). However, most studies suffer from the fact that it is hard to disentangle the pure effect of
training from other alternative explanations of any rise in productivity.
Several recent studies have investigated whether firms provide general or firm-specific training. Generally, since
it hard to measure the content of training, inferences are made using information on tenure, quits, turnover rates
and on earnings growth of job movers. Inferences based on such evidence favour the view that most firm
training is of a general nature and exportable to other firms (Blundell et al., 1996; Goux and Maurin, 1997;
Loewenstein and Spletzer, 1998). A possible explanation is that training that is firm-specific may often be
complementary to general training so that some elements of both have to be provided by the firm. It is also
unlikely that any training will be useful only to one specific firm or vice versa to all firms in the economy.
In sum, the predictions of a positive impact of training on workers’ earnings and productivity are generally
confirmed by the empirical literature.
15
2. Training across European countries
2.1 Data sources and issues
Several European initiatives coordinated by Eurostat in the last decade have been implemented to collect
harmonised data on the continuing training of the adult workforce. TPF
4FPT In all cases national statistical offices collect
survey data which are afterwards reported in a common format. With a goal to assemble comparable data, the
various initiatives differ however in terms of specific definitions of training activity, the population sampled or the
countries and years for which data are available.
Table 1 in the Annex describes some of the main characteristics of training statistics which are used in this
publication: the European Labour Force Survey (LFS), including a module conducted in 2003 on lifelong
learning (LLL), the Continuing Vocational Training Survey (CVTS) and the Adult Education Survey (AES).
Regarding the instruments for compiling the statistics on training activities, the AES uses the Classification of
Learning Activities (CLA). This instrument was designed to be applied to surveys to collect quantitative
information on different aspects of participation of individuals in learning, covering all intentional and organised
activities (either formal, non-formal or informal), all types of learning opportunities and education and learning
pathways. The definitions used in the CLA remain consistent with the classification of educational activities
covered in the LFS and based on ISCED where learning is understood to be “any improvement in behaviour,
information, knowledge, understanding, attitude, value or skills”. While ISCED describes learning by the
intended outcome, in the CLA the focus is on the process of learning.TPF
5FPT
All these surveys provide measures of the level of continuing education and training among the adult workforce.
However, there are important differences in how the training questions are phrased. One important difference is
that AES distinguish between different contexts of education and training, namely formal, non-formal and
informal. A second difference is that the CVTS poses the training questions to employers and not workers; there
are likely to be systematic differences in how these two groups report training activities. Moreover, respondents
in the CVTS are asked to distinguish between initial and continuing training, so that the former can be explicitly
omitted from the training estimates. Finally, another important difference is that the LFS asks about training over
the prior 4 weeks, whereas the others use a 12-month reference period.
The amount of training reported depends on the reference period covered by each survey. As a result, the
retrospective nature of the self-reported training measures can introduce some errors. These measurement
errors are expected to increase both with the span of time between the training spell and the interview, and with
the detail of the training questions. The questions measuring training flows (i.e. the amount of training reported
over a specific period of time) are probably more accurate than those attempting to measure stocks. Surveys
often ask about training incidence, but increasingly try to measure the length of training spells in an attempt to
more accurately measure training effort (Bassanini et. al, 2005).
TP
4PT For a more detailed description of data sources see CRELL (2007) and Cedefop (2010).
TP
5PT Eurostat, Classification of Learning Activities - Manual, Luxembourg (2005).

16
These surveys also differ with respect to how much employer involvement is required for a training event to be
reported. The comparison between all job-related training and only employer-supported, job-related training is
most critical for assessing the comparability of surveys, since the CVTS only records employer-supported
training while the others also record job-related training events not supported by the employer. The
heterogeneity in training questions introduces problems of comparability between surveys and even within
surveys, particularly across countries. As such, the interpretation of the term “training” varies across groups in
the population, in particular employers, employees, and training researchers. Yet, little is known about the
extent to which these conceptual measurement problems lead to actual measurement error. TPF
6FPT
The population sampled also differs between some of the surveys. The employees between the ages of 25 and
64 years, which are the target population of most of the following analysis, can be exactly identified only in the
LFS (incl. LLL) and AES. The CVTS data cover employees of all ages in the surveyed enterprises. It also
excludes workers in enterprises with fewer than ten employees and all workers in certain sectors. This could
bias upward the training participation rates calculated using CVTS data, since the rates rise with enterprise size
over the observed range (Eurostat, 2002).
The formulations of questions in each survey may result in different reporting of some forms of training and,
hence, provide dissimilar estimates.TPF
7FPT The informal training is perhaps the category most commonly present and
in fact it is reported separately in the AES and LLL. The LFS is probably intermediate in the amount of informal
training reported, since the survey question asks about any “education and training received in the last four
weeks”. The information relates to all education and training activities, whether or not relevant to respondent’s
current or possible future jobs. Employers in the CVTS, with its focus on CVT courses (structured training
programmes), probably report little or no informal training. There is some evidence, however, that formal and
informal training are positively correlated (Loewenstein and Spletzer, 1994), suggesting that relative levels of
training for different groups or countries might not be as notably affected by cross-survey differences in the
extent to which informal training is recorded, as are absolute levels.
2.2 The level of training
What is the share of the adult workforce receiving training in the European countries? Does a larger proportion
receive training in some countries than in others? Since the boundary between training and the learning that
accompanies work experience is so difficult to draw in practice, it could not be expected that some very precise
statements can be made about how much higher training is in one country than another. Nonetheless, it should
be possible to position the European countries in terms of training intensities based on the evidence from these
surveys and this section deal with this issue.
TP
6PT Barron et al. (1997) use data from a matched employer-employee survey to see to what extent their responses are consistent. They find
that correlations between the worker and the establishment measures are less than 0.5 and that establishments report 25 percent more hours of training on average than workers do. On average, incidence rates are similar between worker and establishment reports, although 30 percent disagree on whether on-site formal training occurred. This suggests that training is measured with substantial error. TP
7PT These effects could be quite large since data indicates that participation in informal training activities is at least as widespread as
participation in formal training.

17
2.2a Participation in training
Training participation rates are shown in Table 2. Looking first at the unweighted column means calculated over
all countries for which data are available, the average participation rates in the LFS are much lower than those
for the other three surveys. This is in line with expectations since the four-week reference period used by the
latter will miss many of the episodes of training occurring during the previous twelve months. The average
participation rate from the CVTS (32 per cent) is consistent with employers not reporting some vocational
training activities reported by workers (ex. training undertaken on their own initiative outside of work or less
formal activities at the work site).
Table 2: Adult participation in training for European countries
Participation rate (%) Rank Participation rate (%) Rank Participation rate (%) Rank Participation rate (%) Rank Mean RankBelgium BE 7.2 16 48.9 10 40 7 26.1 9 0.19 10Bulgaria BG 1.2 27 50.2 8 15 25 2 27 -0.89 24Czech Republic CZ 7.8 13 47.6 15 59 1 16.6 16 0.41 7Denmark DK 32.3 1 48.5 11 35 10 53 2 1.33 2Germany DE 7.8 13 53 6 30 16 16.3 17 -0.09 14Estonia EE 12.5 10 49.2 9 24 21 18.5 13 -0.09 16Ireland IE 6 18 : : 49 3 6.1 26 -0.85 23Greece GR 3.1 24 17.8 23 14 28 12 21 -1.25 26Spain ES 10.6 11 35.9 19 33 12 24.9 11 -0.09 15France FR 6.5 17 42.3 17 46 5 17 15 0.02 12Italy IT 5.9 19 27.7 22 29 18 7.4 24 -0.76 21Cyprus CY 8.1 12 48 13 30 16 25.4 10 -0.01 13Latvia LV 5.7 21 40.1 18 15 25 17.2 14 -0.67 19Lithuania LT 5.3 23 43.4 16 15 25 9.9 23 -0.75 20Luxembourg LU 15.2 8 : : 49 3 19.6 12 -0.33 17Hungary HU 2.5 26 12.1 24 16 24 6.3 25 -1.42 27Malta MT 7.3 15 : : 32 15 13.9 19 -1.02 25Netherlands NL 18.5 6 52.7 7 34 11 13.2 20 0.27 9Austria AT 14.9 9 48.3 12 33 12 30.2 7 0.35 8Poland PL 5.6 22 30.1 21 21 22 14.9 18 -0.76 22Portugal PT 5.8 20 31.5 20 28 20 10.9 22 -0.66 18Romania RO 1.1 28 : : 17 23 0.8 28 -1.75 28Slovenia SI 16.3 7 47.7 14 50 2 30.5 6 0.74 6Slovakia SK 2.9 25 54 5 38 9 28.5 8 0.14 11Finland FI 24.1 2 62 2 39 8 49.5 3 1.33 3Sweden SE 21.7 4 79.3 1 46 5 53.2 1 1.76 1United Kingdom UK 22.2 3 56.6 4 33 12 42.4 4 0.93 4Norway NO 19 5 60.3 3 29 18 38.4 5 0.75 5
Unweighted mean 10.6 45.3 32.1 21.6 0Standard deviation 7.9 14.4 12.3 14.7 0.9
Source: CRELL calculations based on Eurostat data(:) Missing or not availablea) Percentage of the employed population aged 25-64 participating in education and training over the four weeks prior to the surveyb) Participation rate in formal or non-formal education and training of employed adults (aged 25-64)c) Percentage of employees (all enterprises) participating in CVT coursesd) Participation in non-formal education/training of employed adults (aged 25-64)
European countries
Cross-survey index of participation rate
(average=0)
Lifelong learning module d
(reference year 2003)
Continuing Vocational Training Survey c
(reference year 2005)
Adult Education Survey b
(reference year 2007)Labour Force Survey a
(reference year 2009)
The values in Table 2 reveal that there is consistency across the surveys concerning differences in participation
rates. The Scandinavian countries and the United Kingdom show systematically very high participation, whereas
Romania, Hungary, Greece, and Malta, have comparatively lower rates. However, Czech Republic, France and
Ireland illustrate a more mixed pattern, with below-average participation in the LFS, but among the highest rates
in CVTS. Slovakia provides the most extreme example of cross-survey inconsistency, being rated very high in
three surveys (LLL, AES and CVTS) but having among the lowest rates in LFS. Nevertheless, it appears that

18
most of the countries can be characterised, with some confidence, as being low, near average or high in the
European hierarchy of training rates.
On the other hand, data in Table 2 also confirm that differences in survey design are likely to lead to
significantly different estimates of the absolute level of training.TPF
8FPT Each of the surveys indicates considerable
cross-country differences. This variation suggests that training patterns differ significantly between countries,
especially since it is quite pronounced for AES and LLL (standard deviations of 14.4, respectively 14.7, and a
highest-lowest difference of 61, respectively 52 percentage points in the participation rate).
In the last column of Table 2 the information from surveys is combined to calculate an aggregate measure of
the relative participation in training among the European countries. The cross-survey index of training (CSIT)
merges exclusively relative measures on participation in training from the four surveys. The index is constructed
as the unweighted mean of the standardised participation rates, where the average for each country is
calculated across only the surveys in which it participated (see the box below).TPF
9FPT
An aggregate measure of training: The cross-survey index on training (CSIT) In order to average a country’s ranking across all of the sources for which data are available, it is first necessary to convert the four sets of participation rates into comparable units. This is due to differences in questionnaire design (such as different reference periods), meaning that the absolute levels of training are not comparable across the four data sources. Thus, each registered value for participation was standardised into a mean deviation in standard deviation units. For example, the training participation rate for Belgium from the LFS (7.2 per cent) is approximately 0.45 standard deviations below the cross-country mean value (10.6 per cent). So, its standardised value is calculated as (7.2-10.6)/7.9 or -0.43. The cross-survey index is the unweighted mean of these standardised participation rates, where the average for each country is calculated across only the surveys in which it participated. By construction, the index has a mean value of zero; it is more reliable for the countries participating in a greater number of the surveys.
The index suggests that training participation tends to be very high in the Scandinavian countries and the United
Kingdom and much lower in Romania, Hungary, Greece and Malta. Overall, the Nordic countries show higher
levels of participation compared to countries in the southern Europe (Romania, Greece and Malta).
2.2b The volume of training
Participation rates provide an incomplete measure of the level of training. As training could be seen as a form of
economic investment, this suggests that a continuous measure of the resources invested in training would be
more informative than a simple, yes/no measure of whether any investment was made. Yet, in practice it is
difficult to gather accurate information of this type. Neither workers nor their employers routinely track the
magnitudes of training investments and their attempts to estimate them in a survey interview are likely to be
quite inaccurate (OECD, 1999). One option is to utilise both participation and volume measures to estimate the
level of training, rather that only relying on one or the other, since they both have strengths and weaknesses.
TP
8PT Similar findings were presented during a workshop organised in Berlin (December 2010) to discuss the survey differences in adult training
across the European countries. TP
9PT For more details on methods to construct aggregate measures, see OECD and JRC (2008).

19
The primary measure of training volume examined here is hours of training.TPF
10FPT The three sources of harmonised
training statistics for which data is available - AES, CVTS and LLL - yield quite different estimates of the
average hours of training (Table 3).
Table 3: Volume of adult training in European countries
Number of hours Rank Number of hours Rank Number of hours Rank Mean RankBelgium BE 140 7 31 9 69 11 0.51 7Bulgaria BG 70 21 30 11 68 12 -0.19 19Czech Republic CZ 75 20 23 26 47 21 -1.00 26Denmark DK 188 1 30 11 57 15 0.68 4Germany DE 108 10 30 11 74 10 0.23 9Estonia EE 93 15 27 17 56 16 -0.40 21Ireland IE : : 25 22 80 6 -0.08 17Greece GR 104 13 25 22 102 2 0.21 10Spain ES 146 6 26 19 85 4 0.41 8France FR 44 23 28 16 37 25 -1.03 27Italy IT 79 19 25 22 58 13 -0.65 24Cyprus CY 82 18 22 27 53 17 -0.93 25Latvia LV 159 3 26 19 58 13 0.13 14Lithuania LT 120 8 32 6 52 18 0.16 11Luxembourg LU : : 33 5 46 22 0.11 16Hungary HU 177 2 37 1 126 1 2.14 1Malta MT : : 35 3 80 6 1.09 3Netherlands NL : : 36 2 76 9 1.12 2Austria AT 105 12 27 17 85 4 0.13 13Poland PL 157 4 30 11 40 24 0.16 12Portugal PT 147 5 26 19 96 3 0.58 6Romania RO : : 31 9 80 6 0.62 5Slovenia SI 85 16 29 15 44 23 -0.49 22Slovakia SK 85 16 32 6 35 27 -0.39 20Finland FI 112 9 25 22 48 20 -0.51 23Sweden SE 99 14 34 4 50 19 0.11 15United Kingdom UK 60 22 20 28 35 27 -1.54 28Norway NO 106 11 32 6 36 26 -0.19 18
Unweighted mean Mean 110.5 28.8 63.3 0Standard deviation Std 38.1 4.3 22.7 0.8
Source: CRELL calculations based on Eurostat data(:) Missing or not availablea) Mean instruction hours spent by employed participant on formal/non-formal education and trainingb) Hours in CVT courses per participantc) Mean volume of hours per employed participant in non-formal learning
European countries
Cross-survey index of training volume
(average=0)
Lifelong learning module c
(reference year 2003)
Continuing Vocational Training Survey b
(reference year 2005)
Adult Education Survey a
(reference year 2007)
All surveys confirm that training volume differs between countries, but this variation ranges from quite modest in
the CVTS to quite high in the AES (standard deviations of 4.3 and 38.1 hours, respectively). The major
difference is the much lower level reported in the CVTS, which probably can be explained by the fact that the
CVTS only reports hours spent in employer-provided courses, which is narrower than the range of training
activities covered by the other surveys. TPF
11FPT
The comparison of volume seems to be less consistent across the surveys. Greece provides again the most
extreme example of cross-survey inconsistency, being rated very low in the CVTS (22nd out of 28 countries) but
TP
10PT The CVTS provides an alternative measure of training volume, namely, employers’ costs for training courses as a share of total labour
costs. Overall, this measure of volume accords quite closely with the earlier analysis of participation rates, but less closely with the hours measures of training volume. In particular, the southern European countries with relatively low participation rates (i.e. Greece, Italy, Portugal and Spain) also have the lowest cost shares among the European countries, while the two countries with the highest participation rates (the United Kingdom and France) also rate highest in employer spending (see European Commission, Progress towards the Lisbon objectives in education and training, 2008). TP
11PT Some of the cross-country differences in training hours measured could reflect either incompatible definitions or measurement errors.
20
having the second highest training volume in the LLL. On the other hand, Hungary, Germany, Czech Republic
and the United Kingdom are examples of high cross-survey consistency being rate similarly in all three surveys.
Table 3 presents a cross-survey index of training volume, analogous to that previously constructed for
participation. The index suggests that training volume tends to be very high in Hungary, the Netherlands or
Malta and much lower in the United Kingdom, France or the Czech Republic. Overall the geographical patterns
are more mixed for the volume of training compared to participation rates.
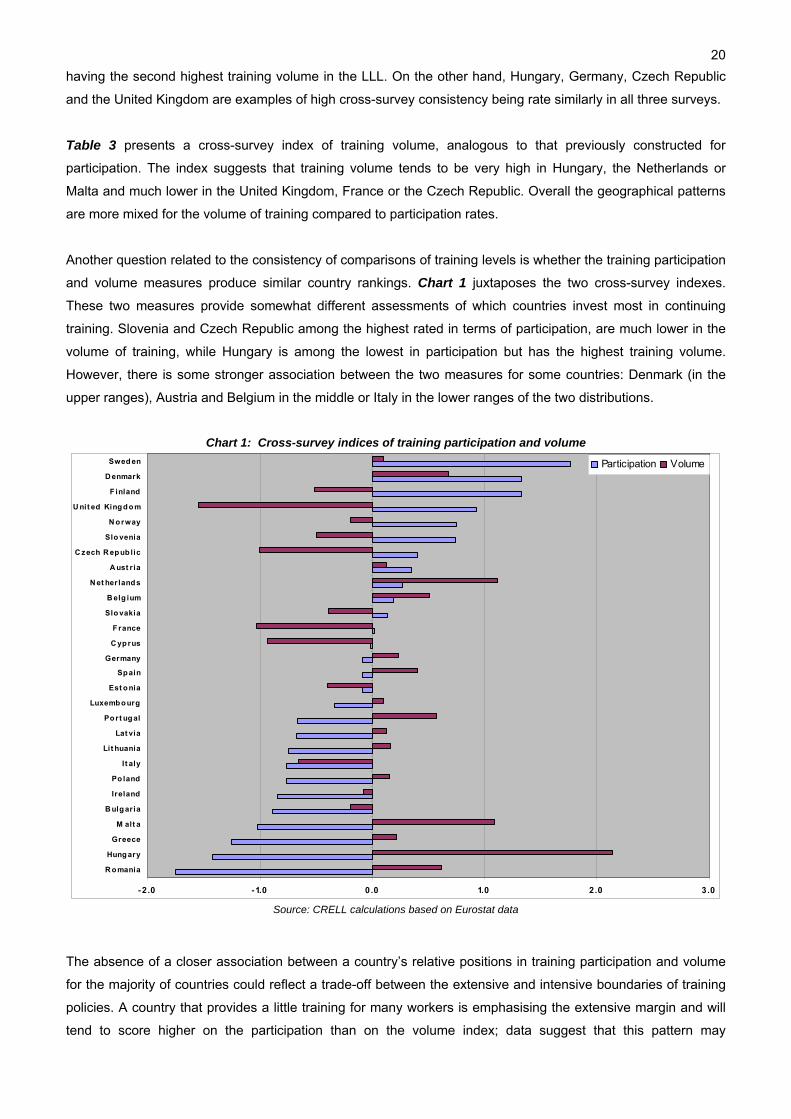
Another question related to the consistency of comparisons of training levels is whether the training participation
and volume measures produce similar country rankings. Chart 1 juxtaposes the two cross-survey indexes.
These two measures provide somewhat different assessments of which countries invest most in continuing
training. Slovenia and Czech Republic among the highest rated in terms of participation, are much lower in the
volume of training, while Hungary is among the lowest in participation but has the highest training volume.
However, there is some stronger association between the two measures for some countries: Denmark (in the
upper ranges), Austria and Belgium in the middle or Italy in the lower ranges of the two distributions.
Chart 1: Cross-survey indices of training participation and volume
-2 .0 -1.0 0.0 1.0 2.0 3.0
R o mania
Hung ary
Greece
M alt a
B ulg aria
Ireland
Po land
It aly
Lit huania
Lat via
Po rt ug al
Luxemb o urg
Est o nia
Sp ain
Germany
C yp rus
F rance
Slo vakia
B elg ium
N et her land s
A ust r ia
C zech R ep ub lic
Slo venia
N o rway
U nit ed King d o m
F inland
D enmark
Swed en Participation Volume
Source: CRELL calculations based on Eurostat data
The absence of a closer association between a country’s relative positions in training participation and volume
for the majority of countries could reflect a trade-off between the extensive and intensive boundaries of training
policies. A country that provides a little training for many workers is emphasising the extensive margin and will
tend to score higher on the participation than on the volume index; data suggest that this pattern may
21
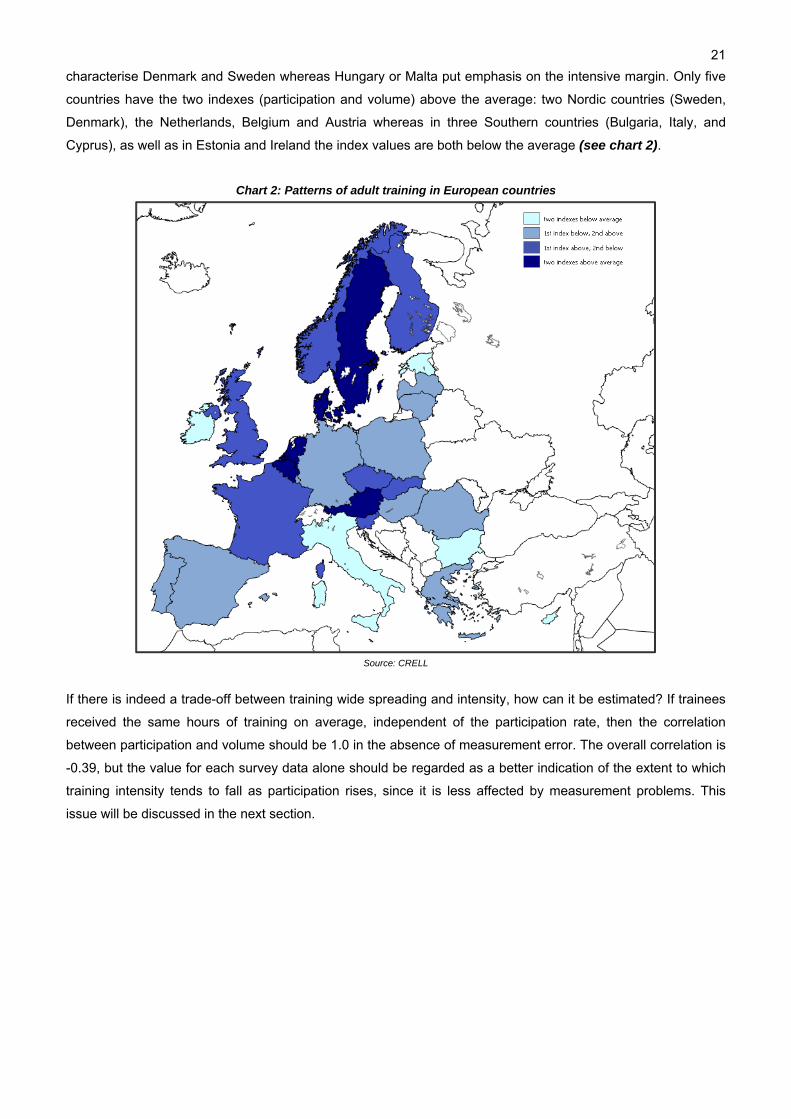
characterise Denmark and Sweden whereas Hungary or Malta put emphasis on the intensive margin. Only five
countries have the two indexes (participation and volume) above the average: two Nordic countries (Sweden,
Denmark), the Netherlands, Belgium and Austria whereas in three Southern countries (Bulgaria, Italy, and
Cyprus), as well as in Estonia and Ireland the index values are both below the average (see chart 2).
Chart 2: Patterns of adult training in European countries
Source: CRELL
If there is indeed a trade-off between training wide spreading and intensity, how can it be estimated? If trainees
received the same hours of training on average, independent of the participation rate, then the correlation
between participation and volume should be 1.0 in the absence of measurement error. The overall correlation is
-0.39, but the value for each survey data alone should be regarded as a better indication of the extent to which
training intensity tends to fall as participation rises, since it is less affected by measurement problems. This
issue will be discussed in the next section.
22
3. Correlation analysis
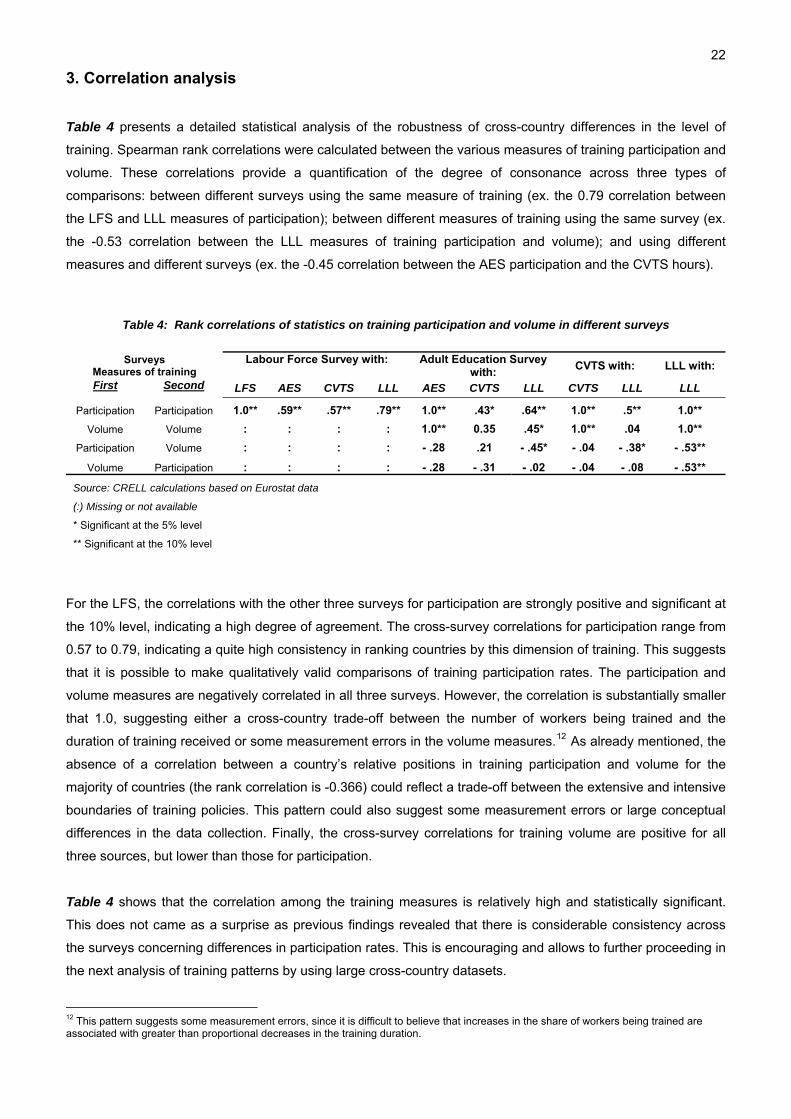
Table 4 presents a detailed statistical analysis of the robustness of cross-country differences in the level of
training. Spearman rank correlations were calculated between the various measures of training participation and
volume. These correlations provide a quantification of the degree of consonance across three types of
comparisons: between different surveys using the same measure of training (ex. the 0.79 correlation between
the LFS and LLL measures of participation); between different measures of training using the same survey (ex.
the -0.53 correlation between the LLL measures of training participation and volume); and using different
measures and different surveys (ex. the -0.45 correlation between the AES participation and the CVTS hours).
Table 4: Rank correlations of statistics on training participation and volume in different surveys
Surveys
Measures of training Labour Force Survey with: Adult Education Survey
with: CVTS with: LLL with: UFirstU USecondU LFS AES CVTS LLL AES CVTS LLL CVTS LLL LLL
Participation Participation 1.0** .59** .57** .79** 1.0** .43* .64** 1.0** .5** 1.0** Volume Volume : : : : 1.0** 0.35 .45* 1.0** .04 1.0**
Participation Volume : : : : - .28 .21 - .45* - .04 - .38* - .53**
Volume Participation : : : : - .28 - .31 - .02 - .04 - .08 - .53**
Source: CRELL calculations based on Eurostat data (:) Missing or not available * Significant at the 5% level ** Significant at the 10% level
For the LFS, the correlations with the other three surveys for participation are strongly positive and significant at
the 10% level, indicating a high degree of agreement. The cross-survey correlations for participation range from
0.57 to 0.79, indicating a quite high consistency in ranking countries by this dimension of training. This suggests
that it is possible to make qualitatively valid comparisons of training participation rates. The participation and
volume measures are negatively correlated in all three surveys. However, the correlation is substantially smaller
that 1.0, suggesting either a cross-country trade-off between the number of workers being trained and the
duration of training received or some measurement errors in the volume measures.TPF
12FPT As already mentioned, the
absence of a correlation between a country’s relative positions in training participation and volume for the
majority of countries (the rank correlation is -0.366) could reflect a trade-off between the extensive and intensive
boundaries of training policies. This pattern could also suggest some measurement errors or large conceptual
differences in the data collection. Finally, the cross-survey correlations for training volume are positive for all
three sources, but lower than those for participation.
Table 4 shows that the correlation among the training measures is relatively high and statistically significant.
This does not came as a surprise as previous findings revealed that there is considerable consistency across
the surveys concerning differences in participation rates. This is encouraging and allows to further proceeding in
the next analysis of training patterns by using large cross-country datasets.
TP
12PT This pattern suggests some measurement errors, since it is difficult to believe that increases in the share of workers being trained are
associated with greater than proportional decreases in the training duration.

23
4. Conclusions
1. The value of adult learning to employability is widely acknowledged across the EU. The European
Commission adopted a Communication on Adult LearningTPF
13FPT in October 2006, followed up by an Action Plan that
was endorsed in May 2008 by national education ministers.TPF
14FPT One of the five urgent issues identified in these
policy documents was to increase participation in lifelong learning, particularly to address the decrease in
participation over the age of 34. The work on these priorities should be done by improving the monitoring of the
adult learning sector and a Tnalysing the effects of reforms in other educational sectors on adult learning.
2. Adult participation in lifelong learning varies greatly and is unsatisfactory in many EU countries. The
European Union set a target for average participation in lifelong learning throughout the EU to at least 15% by
2020 for adults aged 25-64; in 2009, the average participation was 9.3%. Surveys show that the Nordic
countries are near the top of most comparisons of participation in adult training. Overall, the Scandinavian
countries and the United Kingdom together with the Czech Republic and Slovenia show higher levels of
participation compared to Romania, Hungary and some other countries in the southern Europe (Greece, Malta
and Bulgaria).
T3. Comparing national participation rates in adult learning as a whole is problematic because different
surveys use different methodologies, time reference periods, and range of relevant learning experiences.
Drawing on primarily European data in 28 countries, country rankings give broadly similar results across
different surveys. TSweden, Denmark and Finland, show systematically very high participation, whereas
Romania, Hungary and Greece have comparatively lower rates.T
4. There also appears to be some trade-off between the extensive and intensive margins of training. A
country that provides a little training for many workers is emphasising the extensive margin and will tend to
score higher on the participation than on the volume measures. Data suggest that this pattern may characterise
Sweden, Denmark and Finland whereas Hungary, the Netherlands and Malta put emphasis on the intensive
margin and, consequently, score higher on measures of hours of training.
5. Several European initiatives coordinated by Eurostat in the last decade have been implemented to
collect harmonised data on the continuing training of the adult workforce. However, further harmonisation of
training statistics is needed. Nonetheless, it is possible to draw several tentative conclusions with the data
currently available. There is considerable consistency across the surveys concerning differences in participation
rates and less among the training volume. This is encouraging and allows to further proceeding in the next
analysis of training patterns by using large cross-country datasets.
TP
13PT Adult learning: It is never too late to learn, Communication from the Commission, COM(2006) 614 final, Brussels
TP
14PT Council conclusions of 22 May 2008 on adult learning (2008/C 140/09)

24

Annex
Table 1: Overview of European surveys providing data on continuing training Name
Year(s) Countries covered
Type of survey Definitions Reference period
Observations
Labour Force
Survey (EU LFS)
1983-2009
33 countries All European
Union member states, plus
Croatia, Iceland, former Yugoslav
Republic of Macedonia,
Turkey, Norway, Switzerland
EU-LFS is a quarterly large sample survey covering the population in private households. From 1998 it has progressively become a continuous quarterly survey; this transition was completed in 2005. The sample size amounts approximately to 1.5 mill. individuals in each quarter. The quarterly sampling rates vary between 0.2% and 3.3% in each country. The national statistical institutes are responsible for selecting the sample, preparing the questionnaires, conducting the direct interviews among households, and forwarding the results to Eurostat in accordance with the common coding scheme.
Participation: TLifelong learning refers to persons aged 25 to 64 who stated that they received education or training in the four weeks preceding the survey. D Tata collected refer to all education or vocational training whether or not relevant to the respondent’s current or future employment. They include initial education, additional education, continuing or additional training, training in enterprises, apprenticeships, on-the-job training, seminars and workshops, distance education, evening classes, self-learning, etc. They also include courses followed out of personal interest in subjects such as languages, computers, art, etc. Volume of training: No data available
4 weeks
From 2003 onwards, the definition has been restricted to regular education or other taught activities. Due to the transition to harmonised concepts, breaks in series are reported for several countries.
Adult
Education Survey (AES)
2007
29 countries All European
Union member states except Ireland and
Luxembourg, plus Croatia,
Turkey, Norway, Switzerland
AES is part of the EU Statistics on lifelong learning. The survey has used for the first time a common EU framework including a standard questionnaire, tools and quality reporting. The survey covers participation in education and lifelong learning activities (formal, non-formal and informal learning) including job-related activities, characteristics of learning activities, self-reported skills as well as modules on social and cultural participation, foreign language skills, IT skills and background variables related to main characteristics of the respondents. Relatively small sample size, between 2200 and 27000 individuals in each country (sampling rates vary between 0.01% and 1.14%).
Participation: All learning activities undertaken throughout life, with the aim of improving knowledge, skills and competences, within a personal, civic, social, and employment related perspectives. Learning is defined as any activity of an individual organised with the intention to improve knowledge, skills and competences. Intentional learning (as opposed to random learning) is defined as a deliberate search for knowledge, skills, competences, or attitudes of lasting value. Organised learning is defined as learning planned in a pattern or sequence with the explicit or implicit aims. Volume of training: Mean instruction hours spent by participant on formal/non-formal education and training.
12 months
The Classification of Learning Activities is used. It is designed to be applied to surveys to collect information on different aspects of participation in learning, covering all intentional and organised activities (formal, non-formal or informal) all types of learning opportunities and education and learning pathways
Continuing Vocational
Training Survey (CVTS)
1993,
1999, 2005
28 countries
(2005) All European
Union member states plus
Norway
CVTS is an employer survey of enterprises with 10 or more persons employed belonging to certain NACE categories. CVTS3 provides comparable statistics on training enterprises such as: participation in training, the volume of CVT courses and its costs, and some information on Initial vocational training (IVT) courses. The survey is based on common specifications with large sample sizes (50000 enterprises.
Participation: Continuing Vocational Training (CVT) is defined as training measures and activities, which the enterprise finances, partially or entirely, for their employees who have a working contract. A participant in courses is a person who attended one or more CVT courses, at any time during the reference year; participants are counted only once, irrespective of the number of times they attended courses. The courses are events designed solely for the purpose of providing training or vocational education which should take place in a training centre located away from the workplace where participants receive instruction from teachers or tutors for a period of time specified in advance. Volume of training: Hours in CVT courses per participant. The number of hours includes only the actual training time, excluding any periods of normal work in between training or the travelling time.
12 months
CVTS excludes enterprises with fewer than 10 employees or in NACE Rev 1.1 sectors (A, B, L, M, N, P, Q)
Source: Eurostat
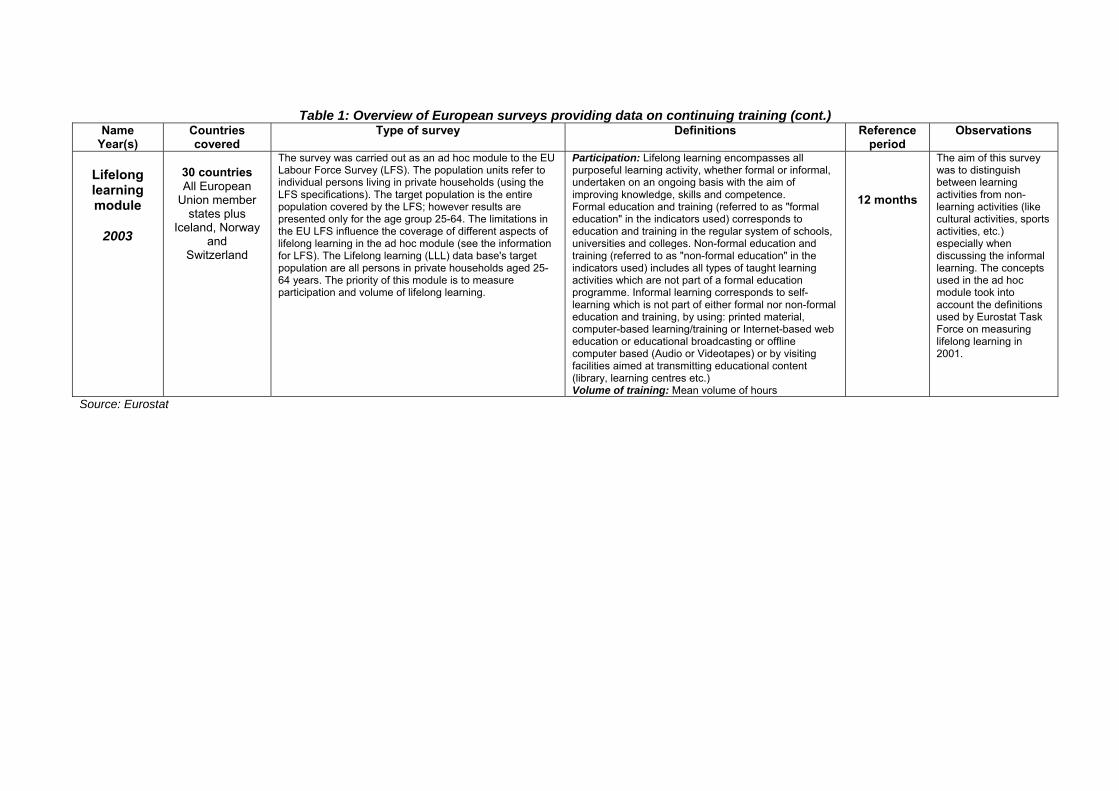
Table 1: Overview of European surveys providing data on continuing training (cont.) Name
Year(s) Countries covered
Type of survey Definitions Reference period
Observations
Lifelong learning module
2003
30 countries All European
Union member states plus
Iceland, Norway and
Switzerland
The survey was carried out as an ad hoc module to the EU Labour Force Survey (LFS). The population units refer to individual persons living in private households (using the LFS specifications). The target population is the entire population covered by the LFS; however results are presented only for the age group 25-64. The limitations in the EU LFS influence the coverage of different aspects of lifelong learning in the ad hoc module (see the information for LFS). The Lifelong learning (LLL) data base's target population are all persons in private households aged 25-64 years. The priority of this module is to measure participation and volume of lifelong learning.
Participation: Lifelong learning encompasses all purposeful learning activity, whether formal or informal, undertaken on an ongoing basis with the aim of improving knowledge, skills and competence. Formal education and training (referred to as "formal education" in the indicators used) corresponds to education and training in the regular system of schools, universities and colleges. Non-formal education and training (referred to as "non-formal education" in the indicators used) includes all types of taught learning activities which are not part of a formal education programme. Informal learning corresponds to self-learning which is not part of either formal nor non-formal education and training, by using: printed material, computer-based learning/training or Internet-based web education or educational broadcasting or offline computer based (Audio or Videotapes) or by visiting facilities aimed at transmitting educational content (library, learning centres etc.) Volume of training: Mean volume of hours
12 months
The aim of this survey was to distinguish between learning activities from non-learning activities (like cultural activities, sports activities, etc.) especially when discussing the informal learning. The concepts used in the ad hoc module took into account the definitions used by Eurostat Task Force on measuring lifelong learning in 2001.
Source: Eurostat
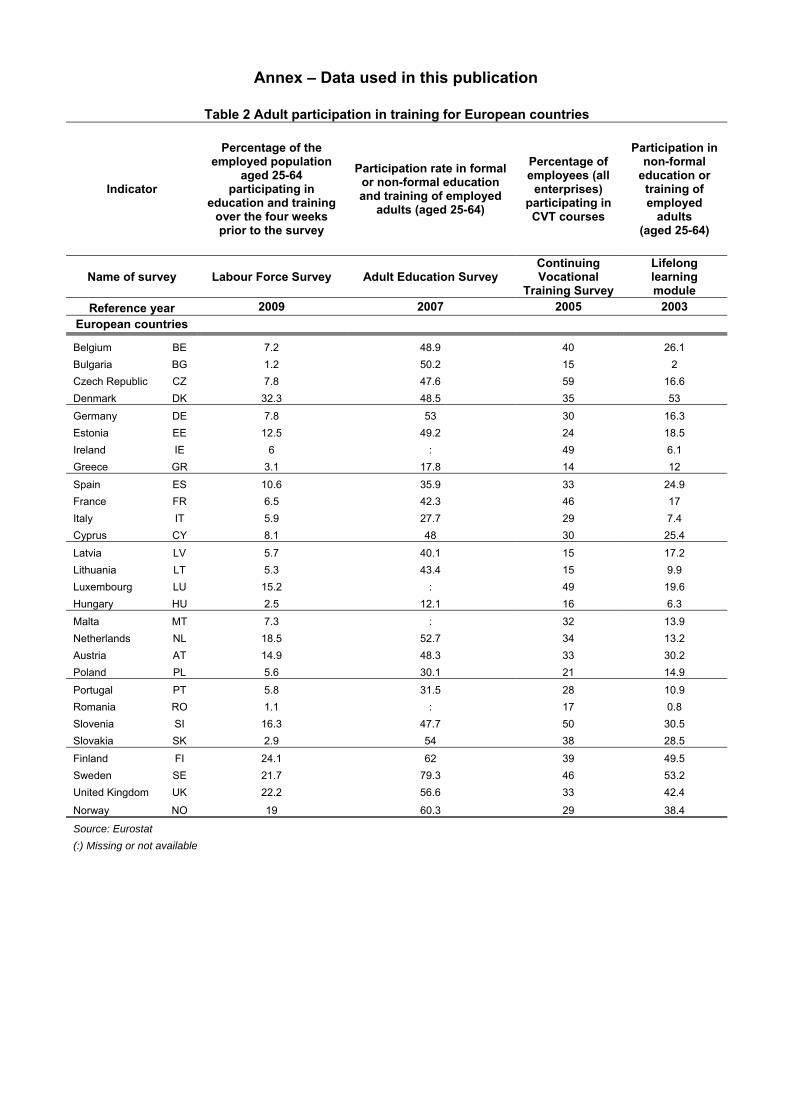
Annex – Data used in this publication
Table 2 Adult participation in training for European countries
Indicator
Percentage of the employed population
aged 25-64 participating in
education and training over the four weeks prior to the survey
Participation rate in formal or non-formal education and training of employed
adults (aged 25-64)
Percentage of employees (all
enterprises) participating in CVT courses
Participation in non-formal
education or training of employed
adults (aged 25-64)
Name of survey Labour Force Survey Adult Education Survey Continuing Vocational
Training Survey
Lifelong learning module
Reference year 2009 2007 2005 2003 European countries
Belgium BE 7.2 48.9 40 26.1 Bulgaria BG 1.2 50.2 15 2 Czech Republic CZ 7.8 47.6 59 16.6 Denmark DK 32.3 48.5 35 53 Germany DE 7.8 53 30 16.3 Estonia EE 12.5 49.2 24 18.5 Ireland IE 6 : 49 6.1 Greece GR 3.1 17.8 14 12
Spain ES 10.6 35.9 33 24.9 France FR 6.5 42.3 46 17 Italy IT 5.9 27.7 29 7.4 Cyprus CY 8.1 48 30 25.4
Latvia LV 5.7 40.1 15 17.2 Lithuania LT 5.3 43.4 15 9.9 Luxembourg LU 15.2 : 49 19.6 Hungary HU 2.5 12.1 16 6.3 Malta MT 7.3 : 32 13.9 Netherlands NL 18.5 52.7 34 13.2 Austria AT 14.9 48.3 33 30.2 Poland PL 5.6 30.1 21 14.9
Portugal PT 5.8 31.5 28 10.9 Romania RO 1.1 : 17 0.8 Slovenia SI 16.3 47.7 50 30.5 Slovakia SK 2.9 54 38 28.5
Finland FI 24.1 62 39 49.5 Sweden SE 21.7 79.3 46 53.2 United Kingdom UK 22.2 56.6 33 42.4
Norway NO 19 60.3 29 38.4
Source: Eurostat (:) Missing or not available

Table 3 Volume of adult training in European countries
Indicator Mean instruction hours spent by
employed participant on formal/non-formal education and
training
Hours in CVT courses per participant
Mean volume of hours per employed
participant in non formal learning
Name of survey Adult Education Survey Continuing Vocational
Training Survey Lifelong learning
module
Reference year 2007 2005 2003 European countries
Belgium BE 140 31 69 Bulgaria BG 70 30 68 Czech Republic CZ 75 23 47 Denmark DK 188 30 57
Germany DE 108 30 74 Estonia EE 93 27 56 Ireland IE : 25 80 Greece GR 104 25 102
Spain ES 146 26 85 France FR 44 28 37 Italy IT 79 25 58 Cyprus CY 82 22 53 Latvia LV 159 26 58 Lithuania LT 120 32 52 Luxembourg LU : 33 46 Hungary HU 177 37 126
Malta MT : 35 80 Netherlands NL : 36 76 Austria AT 105 27 85 Poland PL 157 30 40
Portugal PT 147 26 96 Romania RO : 31 80 Slovenia SI 85 29 44 Slovakia SK 85 32 35 Finland FI 112 25 48 Sweden SE 99 34 50 United Kingdom UK 60 20 35
Norway NO 106 32 36
Source: Eurostat (:) Missing or not available

References Arulampalam, W., Booth, A. and Bryan, M. (2004), Training in Europe, Journal of the European Economic Association, 2 (2-3), pp. 346-360
Bassanini, A. (2004), Improving Skills for More and Better Jobs? The Quest for Efficient Policies to Promote Adult Education and Training, presented at the Conference on Quality and Efficiency in Education, Brussels
Bassanini, A. et al. (2005), Workplace training in Europe, IZA Discussion paper, No. 1640
Bishop, J. (1997), What We Know about Employer-Provided Training: A Review of the Literature, in Polachek, e Solomon, W., eds., Research in Labor Economics, London, JAI Press, pp. 19-87
Brunello, G., Garibaldi, P., Wasmer, E., eds. (2009), Education and Training in Europe, Oxford University Press
Brunello, G. (2003), On the Complementarity between Education and Training in Europe, in Checchi and Lucifora, (eds.), Education, Training and Labour Market Outcomes in Europe, Palgrave, McMillan
Brunello, G. and Medio, A. (2001), An Explanation of International Differences in Education and Workplace Training, European Economic Review, vol.1, pp. 307-322
Cedefop (2010), Employer-provided vocational training in Europe Evaluation and interpretation of the third continuing vocational training survey, Luxembourg
Cedefop (2008), Evaluation of Eurostat education, training and skills data sources, Luxembourg
CRELL (2010), Returns to education in European countries: Evidence from the European Community Statistics on Income and Living Conditions (EU-SILC), European Commission-JRC, (forthcoming)
CRELL (2008), Improving the scope of indicators for monitoring developments in vocational education and training in Europe, European Commission-JRC, EUR 23512 EN
CRELL (2007), Measuring the outputs and outcomes of vocational training-towards a coherent framework for indicators, European Commission-JRC, EUR 22305 EN
Eurostat (2009), Potential use of existing international surveys: Continuous Vocational Training Survey, ‘Employers’ surveys on skill needs: feasibility work’ (workshop, Milan, 7-9 May 2009)
Eurostat (2006), The 3P
rdP Continuing Vocational Training Survey (CVTS3): European Union Manual, Eurostat
Population and Social Conditions Working Paper 3/2006/F/N°32, Luxembourg
Eurostat (2005), Classification of Learning Activities - Manual, Luxembourg
Eurostat (2002), Continuing Vocational Training Survey (CVTS2), Luxembourg
European Commission (2009), Progress Towards the Lisbon Objectives in Education and Training - Indicators and Benchmarks, Commission Staff Working Document, SEC(2009) 1616, Brussels
Loewenstein, M. and Spletzer, J. (1994), ’Informal Training: A Review of Existing Data and Some New Evidence’, US Bureau of Labor Statistics, mimeo, June
OECD (2009), Education today. The OECD perspective, Paris
OECD and JRC (2008), Handbook on constructing composite indicators. Methodology and User Guide, Paris
OECD (2004), Improving Skills for More and Better Jobs: Does Training Make a Difference?, in OECD Employment Outlook, Paris
OECD (1999), Training of adult workers in OECD countries: Measurement and analysis, in OECD Employment Outlook, Paris
*** Adult learning in comparative perspective - understanding differences across countries, Discussion paper, AES International workshop, Berlin, 9-10 December 2010

European Commission EUR 24563 EN – Joint Research Centre – Institute for the Protection and Security of the Citizen Title: Participation in training of adult workers in European countries. Evidences from recent surveys. Author(s): Mircea Bădescu and Massimo Loi Luxembourg: Publications Office of the European Union 2010 – 33 pp. – 21 x 29.7 cm EUR – Scientific and Technical Research series – ISSN 1018-5593 ISBN 978-92-79-17202-1 doi:10.2788/3263 Abstract The importance of a highly skilled workforce has become increasingly relevant in the context of the European Union new strategy for smart, sustainable and inclusive growth - ‘Europe 2020’. At the individual level, a good education is increasingly decisive for employment prospects and earnings levels. The skills and competences of the workforce are the product of a large variety of learning activities that take place in diverse institutional contexts. While good initial education provides an essential foundation, learning continues through the working years. Policies encouraging wide participation in continuing training are therefore an important component of lifelong learning strategies. Very little is known concerning differences in continuing training or their causes and consequences. Such information would be useful for assessing policy choices related to training, such as whether to encourage an overall increase in training levels or to attempt to redirect training investments toward groups currently receiving little training. This publication deal with some of these issues. First, some aggregate measures using harmonised data from European surveys on training are constructed and analysed. Next, a set of stylised facts concerning differences in the level of training across European countries are discussed. A more formal analysis of the robustness of cross-country differences in the level of training is included; cross-country rank correlations are calculated between the various measures of training. A concluding section considers some policy implications for this area.

How to obtain EU publications Our priced publications are available from EU Bookshop (http://bookshop.europa.eu), where you can place an order with the sales agent of your choice. The Publications Office has a worldwide network of sales agents. You can obtain their contact details by sending a fax to (352) 29 29-42758.


The mission of the JRC is to provide customer-driven scientific and technical support for the conception, development, implementation and monitoring of EU policies. As a service of the European Commission, the JRC functions as a reference centre of science and technology for the Union. Close to the policy-making process, it serves the common interest of the Member States, while being independent of special interests, whether private or national.
LB
- NA
- 24563- EN- C